MODELS TO PREDICT RUMINAL CARBOHYDRATE AND NITROGEN SUPPLY AND NITROGEN EXCRETION IN CATTLE A Dissertation Presented to the Faculty of the Graduate School of Cornell University In Partial Fulfillment of the Requirements for the Degree of Doctor of Philosophy by Cristina Lanzas January 2007

Welcome message from author
This document is posted to help you gain knowledge. Please leave a comment to let me know what you think about it! Share it to your friends and learn new things together.
Transcript
MODELS TO PREDICT RUMINAL CARBOHYDRATE AND NITROGEN
SUPPLY AND NITROGEN EXCRETION IN CATTLE
A Dissertation
Presented to the Faculty of the Graduate School
of Cornell University
In Partial Fulfillment of the Requirements for the Degree of
Doctor of Philosophy
by
Cristina Lanzas
January 2007
© 2007 Cristina Lanzas

MODELS TO PREDICT RUMINAL CARBOHYDRATE AND NITROGEN
SUPPLY AND NITROGEN EXCRETION IN CATTLE
Cristina Lanzas, Ph. D.
Cornell University 2007
To mitigate the negative environmental impact of farming, it is important that
diets are formulated to accurately match requirements. For that, an adequate
characterization of feed composition and its variability is crucial. The original Cornell
Net Carbohydrate and Protein (CNCPS) feed carbohydrate and protein fractionation
schemes were evaluated and modified to improve predictions of the rumen degradable
protein (RDP), rumen undegradable protein (RUP) and microbial protein supply. For
carbohydrates, a new expanded scheme was developed; the CA1 is volatile fatty acids
(VFA), CA2 is lactic acid, CA3 is other organic acids, CA4 is sugars, CB1 is starch,
CB2 is soluble fiber, CB3 is available neutral detergent fiber (NDF), and CC is
unavailable NDF. The expanded scheme accounted for more variation in changes in
silage quality and non-fiber carbohydrate composition.
The CNCPS and National Research Council (NRC) protein schemes were
evaluated using Monte Carlo techniques. Both schemes shared similar limitations
including (1) the range of RDP and RUP was over-predicted; (2) the methods used to
estimate degradation rates had low accuracy and repeatability, and (3) the assumptions
underlying the kinetic models were too restrictive to mimic ruminal digestion. The
CNCPS protein scheme was revised and alternative schemes were developed.
Predictions of RDP and RUP were improved by assigning rates obtained with the
inhibitory in vitro system to a combined insoluble protein B fraction, or by redefining
A and B1 fractions as the non amino-N and amino-N in the soluble fraction,
respectively.
Urea recycled to the rumen may represent an important source of N for
microbes. A dynamic mechanistic model was developed to be used as a component of
ration formulation models to predict N recycling to the GIT and urinary urea N.
Recycling processes were modeled as positive feedbacks, while renal excretion was
modeled as a negative feedback. Both processes were assumed to be regulated by N
intake. Model simulations suggested that accurately accounting for urea recycled to
the rumen reduces degradable nitrogen needed in the diet, and the use of the NRC
1985 empirical equation to predict urea recycling to the rumen may greatly
underestimate recycling in lactating dairy cows.
iii
BIOGRAPHICAL SKETCH
Cristina Lanzas was born on December 31, 1977 at Barcelona, Spain. After
completing secondary school studies in Vic, in 1995, she enrolled in the Veterinary
College of the Universitat Autònoma de Barcelona. In 2000, she completed the degree
of Veterinary Medicine with Highest Honors. During 2001 to 2003, she completed a
Master’s degree program in Animal Science under the guidance of Dr. Alice Pell, at
Cornell University. During her Master’s program, she became interested in nutritional
modeling, which led her to enrolled in a Ph.D degree program in 2003 under the
supervision of Dr. Danny Fox with a major in Animal Science and minors in Animal
Nutrition and Environmental Engineering . After completion of her Ph.D program, she
will undertake a postdoctoral position involving modeling infectious and production
diseases in the Department of Population Medicine and Diagnostic Sciences at the
College of Veterinary Medicine, Cornell University.

iv
To my grandfather Pedro,
with whom this journey began
and will not see the wonderful
outcomes

v
ACKNOWLEDGMENTS
I would like to express my gratitude to my committee chairman; Danny Fox. It
has been an honor to have Danny as my chairman. His enthusiasm, leadership, and
optimism have made the experience of working with him a very inspiring one. During
these years, he has shaped many of my personal and professional views. He is a true
mentor.
I would like to acknowledge my minor committee members Douglas Haith,
Alice Pell, and Mike Van Amburgh for their support and insights, and my external
committee member, Glen Broderick, for his help and diligence answering my
questions. I very much enjoyed my visit to Madison!. Special thanks for Luis Tedeschi
for his help and friendship and Charlie Sniffen for the collaboration in the second
chapter.
I would like to express my gratitude to those who reviewed earlier versions of
the chapters and models, Michael de Veth, Javier Gamarra, Marc Moragues and
Chuck Nicholson. Thanks for your time, comments and bug chasing! Many thanks to
the faculty, staff and fellow students of Animal Science; they made my time at the
Department very enjoyable.
I have been very lucky to share my life in Ithaca with a wonderful group of
people, who have enriched my life and made my time in Ithaca unforgottable. Special
thanks to Terry (now Dr. Seo) for being the best officemate ever and a great friend!
Thanks for all the chats, scientific discussions, and advice. He is one of the few people
whom I listen to and take advice from!. Special thanks to Alfredo for all the parties,
after parties, hard working nights, trips, for all the serious and crazy moments, and for
being you… Ithaca would not have been the same without you! Special thanks to Javi
for sharing so many good times with me and being always a supportive friend. Special

vi
thanks to the Spanish, Italian and Greek gangs with whom I have shared so many
enjoyable moments. They truly brought a piece of the Mediterranean to Ithaca. Special
thanks to Gabi, our Venezuelan queen, and the family Soto for organizing always
wonderful gatherings, and my roommate, Sue, and my canine roommates, Alex and
Kay for bringing joy and laughs every day. Thanks to Michael to make me look
forward to so many great things. And finally, thanks to my Vet clan, despite the
distance and our spread around the World, your friendship is always a lighthouse for
me.
Thanks to my family; their support, love and encouragement have been always
with me. Special thanks to my parents; they always encouraged me in their own
unique ways. I hope they like the results…

vii
TABLE OF CONTENTS
INTRODUCTION …………………………………………………………………….1
1. CHAPTER ONE-LITERATURE REVIEW: FEED CARBOHYDRATE AND
PROTEIN SYSTEMS AND NITROGEN RECYCLING IN
RUMINANTS………………………………………………………………………….3
1.1. Feed carbohydrate and protein fractionation systems……………………..3
1.1.1. Feed carbohydrates……………………………………………...3
1.1.2. Feed proteins ……………………………………………………9
1.1.2.1. In situ based fractionation……………………………10
1.1.2.1. Solubility based fractionation………………………..11
1.2. Rumen protein digestion ………………………………………………...16
1.2.1. In vitro methodology…………………………………………...18
1.2.1.1. In vitro system with inhibitors……………………….18
1.2.1.2. Corrections for microbial contamination…………….19
1.2.1.3. Cell-free enzymes……………………………………20
1.2.2. Kinetics of protein digestion…………………………………..20
1.3. Dynamics of nitrogen cycling……………………………………………23
1.3.1. Principles of control and regulation …………………………...23
1.3.2. Nitrogen recycling……………………………………………..26
1.3.3. Renal urea excretion …………………………………………..30
1.3.4. Gastrointestinal urea recycling ………………………………..33
1.3.5. Efficiency of use of recycled nitrogen ………………………..37
1.3.6. Amino acids as a source of urea ………………………………38
viii
2. CHAPTER TWO- A REVISED CNCPS FEED CARBOHYDRATE
FRACTIONATION SCHEME FOR FORMULATING RATIONS FOR
RUMINANTS ……………………………………………………………………….40
2.1. Abstract …………………………………………………………………40
2.2. Introduction ……………………………………………………………..41
2.3. Materials and methods ………………………………….………………43
2.3.1. Feed carbohydrate fractionation schemes ……………………..43
2.3.1.1. Original carbohydrate fractionation scheme ………...43
2.3.1.2. New expanded carbohydrate fractionation scheme ….45
2.3.2. Variability of feed carbohydrate fractions and sensitivity analysis
…………………………………………………………………………47
2.4. Results and discussion …………………………………………………..63
2.4.1. Feed carbohydrate fractionation schemes and analytical
methods……………………………………………………………….63
2.4.2. Ruminal degradation rates and microbial yield ……………….67
2.4.3. Variability of feed carbohydrate fractions …………………….69
2.4.4. Model behavior and sensitivity analysis ………………………70
2.4.5. Applications of the expanded carbohydrate scheme ………….76
2.4.5.1. Supplementing silages ………………………………76
2.4.5.2. Balancing for NFC …………………………………..79
2.5. Conclusions………………………………………………………………83
3. CHAPTER THREE- EVALUATION OF PROTEIN FRACTIONATION
SYSTEMS USED IN FORMULATING RATIONS FOR DAIRY CATTLE ………84
3.1. Abstract ………………………………………………………………….84
3.2. Introduction ……………………………………………………………...85
3.3. Materials and methods …………………………………………………..87

ix
3.3.1. Protein fractionation …………………………………………...87
3.3.2. Sensitivity analyses ……………………………………………88
3.3.2.1. Animals and diets ……………………………………88
3.3.2.2. Simulation procedures ……………………………….89
3.3.2.3. Uncertainty and sensitivity measures ………………..90
3.4. Results and discussion …………………………………………………..93
3.4.1. Sensitivity analysis 1: Influence of feed composition variation on
model predictions ……………………………………………………93
3.4.1.1. Input variability ……………………………………..93
3.4.1.2. Microbial crude protein predictions ………………...99
3.4.1.3. Metabolizable protein from RUP …………………..103
3.4.1.4. Absorbed methionine and lysine flows …………….107
3.4.1.5. Amino acid supply ………………………………....112
3.4.2. Sensitivity analysis 2: Impact of the assumptions underlying the
CNCPS protein fractionation scheme …………………………..…..115
3.4.2.1. Soluble protein degradation …………………..……115
3.4.2.2. Degradation rates for the insoluble protein …..…….118
3.4.2.3. Partial intestinal digestibility of ADICP ………..….118
3.5. Conclusions ………………………………………………………….…119
4. CHAPTER FOUR- IMPROVED PROTEIN FRACTIONATION SCHEMES FOR
FORMULATING RATIONS WITH THE CORNELL CARBOHYDRATE AND
PROTEIN SYSTEM……………………………... ……..………………………….120
4.1. Abstract ………………………………………………………………...120
4.2. Introduction …………………………………………………………….121
4.3. Materials and methods …………………………………………………122
4.3.1. Feed protein fractionation schemes…………………………...122

x
4.3.1.1. Original CNCPS protein fractionation scheme……..122
4.3.1.2. Modifications of the original feed fractionation
system……………………………………………………….124
4.3.2. Evaluation of the feed protein fractionation schemes………..126
4.3.2.1. Data base description ………………………………126
4.3.2.2. Simulations and evaluation ………………………...127
4.4. Results …………………………………………………………………130
4.5. Discussion ……………………………………………………………...139
4.6. Implementation ………………………………………………………...141
4.7. Conclusions ……………………………………………………………142
5. CHAPTER FIVE- A MODEL TO DESCRIBE THE DYNAMICS OF UREA
RECYCLING AND EXCRETION IN DAIRY CATTLE …………………………143
5.1. Abstract ………………………………………………………………...143
5.2. Introduction …………………………………………………………….143
5.3. Materials and methods …………………………………………………145
5.3.1. Identifying variables related to urea partition ………………..145
5.3.2. Dynamic model ………………………………………………148
5.3.2.1. Conceptual model ………………………………….148
5.3.2.2. Model description ………………………………….149
5.3.2.3. Model sensitivity and evaluation …………………..163
5.4. Results and discussion …………………………………………………164
5.4.1. Identifying variables related to urea partition ………………..164
5.4.2. Dynamic model ………………………………………………167
5.4.2.1. Feedback loop analysis and sensitivity analysis …...167
5.4.2.2. Validation of model predictions of renal excretion and
recycling …………………………………………………….171

xi
5.4.2.3. Model applications …………………………………172
5.5. Conclusions……………………………………………………………..176
6. CHAPTER SIX- SUMMARY AND FURTHER RESEARCH …………………178
7. REFERENCES …………………………………………………………………...182

xii
LIST OF FIGURES
Figure 1.1. Nitrogen containing components in feeds……………………………….10
Figure 1.2. Ruminal nitrogen metabolism pathways, adapted from Russell et al.
(1989)…………………………………………………………………………16
Figure 1.3. Decay curve (Panel A), phase plot (Panel B) and the log transformed plot
(Panel C) for first-order kinetics……………………………………………...21
Figure 1.4. Michaelis-Menten plot ………………………………………………….22
Figure 1.5. Model behaviors when the eigenvalues are (a) real negative, (b) real
positive (c) complex conjugate pair with zero real parts, (d) complex conjugate
with negative real parts, and (e) complex conjugate with positive real
parts…………………………………………………………………………...25
Figure 1.6. Percentage of urea synthesized that reenters the gastrointestinal tract (GIT)
in relation to N intake for sheep (▼) and growing cattle (*). Data from Allen
and Miller (1976), Bunting et al (1989), Hettiarachchi (1999), Kennedy
(1980), Kennedy et al (1981), Marini and Van Amburgh (2003), Marini et al
(2004a), Nolan and Leng (1972), Nolan and Stachiw (1979), Norton et al
(1982), Obara et al (1993, 1994)……………………………………………..27
Figure 1.7. Schematic representation of the main feedbacks included in urea (NPN)
metabolism. Arrows represent causal links between variables. The positive
sign at the arrowheads indicates that both variables have the same
directionality, while the negative sign indicates that as one of the variable
increases, the dependent variable decreases or vice versa. Positive and negative
feedback loops are represented by positive and negative signs within the semi-
circle arrow………………………………………………………….…..……28

xiii
Figure 1.8. Relationship between N intake and the ratio of urea:creatinine clearance
for growing animals (N= 22). Data from Boldizarova et al. (1999), Marini and
Van Amburgh (2003), Marini et al., (2004a), and Thornton
(1970)…………………………………………………………………...…….32
Figure 1.9. Relationships between rumen wall urea clearance and N intake, OM
intake, rumen ammonia, and blood urea concentrations for growing ruminants
(Hettiarachchi, et al., 1999, Kennedy, 1980, Kennedy, et al., 1981, Norton, et
al., 1982, Obara, et al., 1994)…………………………………………………33
Figure 1.10. Some of the possible pathways through which fermentable organic matter
can increase urea transfer. Arrows represent causal links between variables.
The positive sign at the arrowheads indicates that both variables have the same
directionality in response, while the negative sign indicates that as one of the
variables increases, the dependent variable decreases or vice
versa……………………………………………………………….…………35
Figure 2.1. Relationship between total volatile fatty acids and dry matter of corn silage
(N = 440), grass silage (N=34), and legume silage (N= 131)………………...62
Figure 2.2. Standard regression coefficients (SRC) for the inputs ranked as the most
influential in predicting microbial growth with the original carbohydrate
scheme (Panel A) and expanded scheme (Panel B)……………...…………...73
Figure 3.1. Box plots for the variability in predicted metabolizable protein from
microbial protein (Panel A: low protein diet, Panel B: high protein diet) and
from rumen undegradable protein (Panel C: low protein diet, Panel D: high
protein diet) due to feed protein variation for the following simulations: 1)
CNCPS, CP, 2) CNCPS, protein fractions, 3) CNCPS, CP and protein
fractions, 4) NRC, CP, 5) NRC, protein fractions, and 6) NRC, CP and protein
fractions. The middle line in the box represents the median, and upper and

xiv
lower areas of the center box indicate the 75th and 25th percentiles (50% of the
values are included; The inter-quartile range (H) is the difference between the
two percentiles). The whiskers on the lines are extreme values, and indicate
values that fall within 1.5H. For comparative purposes, H is expressed in MP
allowable milk (assuming an efficiency of 0.65). Predictions within a panel
with different variance have different letters (P < 0.05).…………………….96
Figure 3. 2. Standard regression coefficients (SRC) (P < 0.05) for the protein inputs
ranked as the most influential in predicting metabolizable protein from rumen
undegradable protein in the CNCPS (Panels A and C) and NRC (Panels B and
D) models.…..……………………………………………………………….100
Figure 3.3. Box plots for the variability in absorbed Lysine (Panel A: low protein diet,
Panel B: silage diet) and Methionine (Panel C: low protein diet, Panel D: silage
diet) predictions due to feed protein variation for the following simulations: 1)
CNCPS, CP, 2) CNCPS, protein fractions, 3) CNCPS, CP and protein
fractions, 4) NRC, CP, 5) NRC, protein fractions, and 6) NRC, CP and protein
fractions. The middle line in the box represents the median, and upper and
lower areas of the center box indicate the 75th and 25th percentiles (50 % of the
values are included; the inter-quartile range (H) is the difference between the
two percentiles). The whiskers on the lines are extreme values, and indicate
values that fall within 1.5H. For comparative purposes, H is expressed in Lys
or Met allowable milk (assuming an efficiency of utilization of 0.82 for Lys
and 1 for Met). Predictions within panel with different variance have different
letters (P < 0.05)…………………………………………………………….104
Figure 3.4. Standard regression coefficients (SRC) (P < 0.05) for the protein inputs
ranked as the most influential in predicting absorbed lysine and methinone in
the CNCPS (panels A, C, E, and G) and the NRC (panels B, D, F, and H)
xv
models for low (Panel A, B, E, and F) and high protein (Panel C, D, G, and H)
diets……………………………………………………………………..…..106
Figure 4.1. Predictions of the rumen degradable protein (RDP) supply and rumen
undegradable protein (RUP) flow using the original CNCPS protein scheme
for the following studies Reynal et al (2003) (●), Reynal and Broderick (2005)
(■), Colmerero and Broderick (2006c) (♦), Brito and Broderick (2004b) (*),
and Brito et al (2006) (▼).............................................................................. 127
Figure 5.1. Schematic representation of the positive and negative loops affecting the
dynamics of urea metabolism included in the model. Arrows represent causal
links between variables. The positive sign at the arrowheads indicates that both
variables have the same directionality, while the negative sign indicates that as
one of the variables increase, the dependent variable decreases or vice versa.
Positive and negative feedback loops are represented by positive and negative
signs within the semi-circle arrow. Variables within a box are state
variables……………………………………………………………..………144
Figure 5.2. Representation of the inflows and outflows of the non-protein nitrogen
compartments………………………………………………………..………151
Figure 5.3. Open loop gain for the feedback loops of renal urea excretion1, hindgut
wall recycling2, rumen wall recycling3, and saliva recycling4 at different N
intakes………………………………………………………………………162
Figure 5.4. Rank correlations between the parameters ranked as the most influential in
predicting ruminal NH3 derived from recycled urea, ruminal non-protein N
(NPN) net entry (calculated as rumen urea entry minus ammonia absorption),
and urinary urea N…………………………………………………………..164
Figure 5.5. Rumen urea entry (g N/d) and net urea entry (calculated as rumen recycled
urea entry – ammonia absorption + passage) (g N/d) as recycled N for diets

xvi
varying in percentage of CP (7.2 to 21. 6 % CP) and milk production supported
(12 to 40 kg/d) using the NRC (1985) equation (●) and the dynamic model
(▼)…………………………………………………………………………..170
xvii
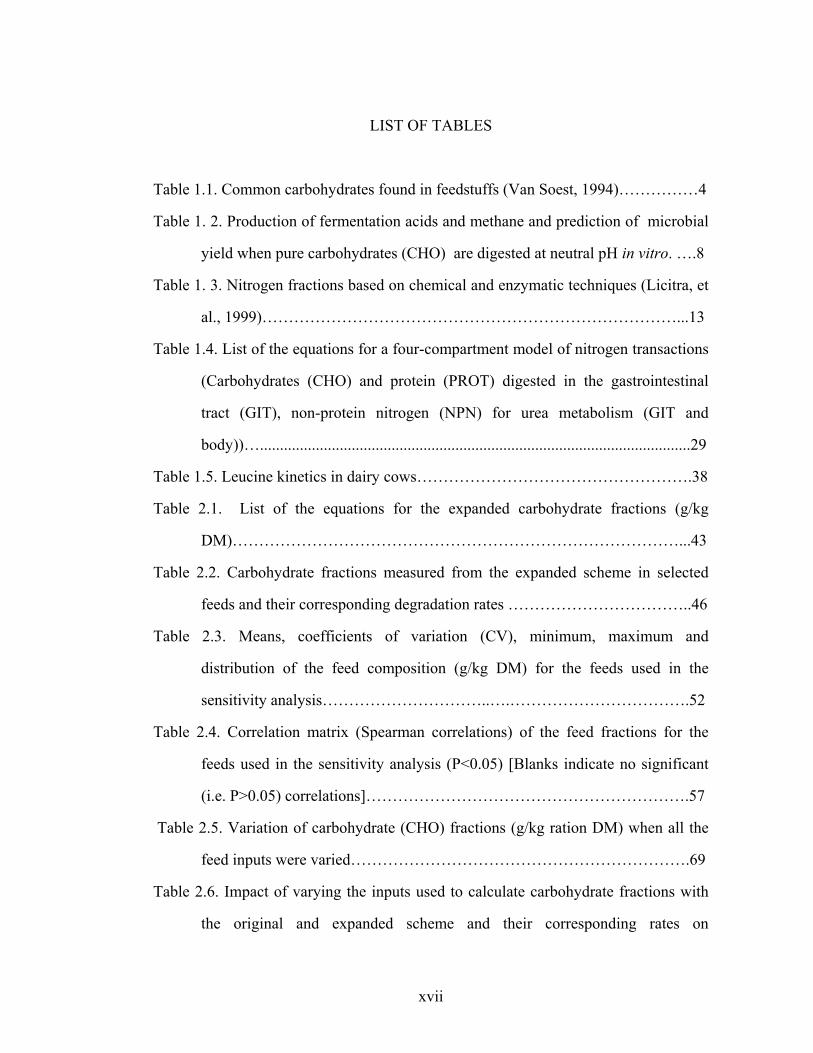
LIST OF TABLES
Table 1.1. Common carbohydrates found in feedstuffs (Van Soest, 1994)……………4
Table 1. 2. Production of fermentation acids and methane and prediction of microbial
yield when pure carbohydrates (CHO) are digested at neutral pH in vitro. ….8
Table 1. 3. Nitrogen fractions based on chemical and enzymatic techniques (Licitra, et
al., 1999)……………………………………………………………………...13
Table 1.4. List of the equations for a four-compartment model of nitrogen transactions
(Carbohydrates (CHO) and protein (PROT) digested in the gastrointestinal
tract (GIT), non-protein nitrogen (NPN) for urea metabolism (GIT and
body))…............................................................................................................29
Table 1.5. Leucine kinetics in dairy cows…………………………………………….38
Table 2.1. List of the equations for the expanded carbohydrate fractions (g/kg
DM)…………………………………………………………………………...43
Table 2.2. Carbohydrate fractions measured from the expanded scheme in selected
feeds and their corresponding degradation rates ……………………………..46
Table 2.3. Means, coefficients of variation (CV), minimum, maximum and
distribution of the feed composition (g/kg DM) for the feeds used in the
sensitivity analysis…………………………..….…………………………….52
Table 2.4. Correlation matrix (Spearman correlations) of the feed fractions for the
feeds used in the sensitivity analysis (P<0.05) [Blanks indicate no significant
(i.e. P>0.05) correlations]…………………………………………………….57
Table 2.5. Variation of carbohydrate (CHO) fractions (g/kg ration DM) when all the
feed inputs were varied……………………………………………………….69
Table 2.6. Impact of varying the inputs used to calculate carbohydrate fractions with
the original and expanded scheme and their corresponding rates on

xviii
metabolizable protein (MP) from bacteria, and ruminal non-fiber carbohydrates
(NFC) digestibility. Means or standard deviation (SD) with different
superscripts within a column (for each scheme)……...………………………72
Table 2.7. CNCPS predictions with the expanded carbohydrate scheme for un-treated
grass silage or inoculated with lactic acid bacteria with supplements
(formulated for a lactating dairy cow 650 kg BW, intake: 24.9
kg)…………………………………………………………………………….75
Table 2.8. Effect of replacing high moisture corn grain (HMCG) with beet pulp (BP)
in dietary carbohydrate composition on CNCPS predictions with the expanded
carbohydrate scheme………………………………………………………….77
Table 3.1. Diets used in the simulations……………………………………………...85
Table 3.2. Mean, SD and distributions for the feeds used in the simulations ………..91
Table 3.3. Essential amino acids composition (% CP) of the feeds used in the
simulations (mean ± SD)……………………………………………………108
Table 3.4. Variation in absorbed essential amino acids (EAA) due to variability in
EAA composition of the feeds…………………………….………………..109
Table 3.5. Variations in digestion rates and intestinal digestibilities used to evaluate
assumptions underlying the CNCPS protein fractionation scheme…………111
Table 3.6. Impact of varying the assumptions underlying the CNCPS protein
fractionation scheme on model predictions. The change in the model
predictions (prediction with the modified assumption – base prediction) are
expressed as g/day and allowable milk……………..……………………….112
Table 4.1. List of alternative protein fractionation schemes ………………………..120
Table 4.2. Descriptive statistics for the studies used to evaluate the ability of the
protein fractionation schemes to predict rumen degradable protein supply and
rumen undegradable protein flow…………………………………………...123

xix
Table 4.3. Feed protein fractions in the feeds included in the evaluation …………..125
Table 4.4. Degradation rates for the protein fractions of the feeds used in the
evaluation……………………………………………………………………126
Table 4.5. Evaluation of the predictions of the neutral detergent crude protein escaping
rumen for the original protein fractionation scheme with the default feed
library B3 rates and with adjusted B3 rates based on published data (N =
17)…...............................................................................................................129
Table 4.6. Evaluation of the ability of alternative protein fractionation schemes to
predict rumen degradable protein (RDP) supply and rumen undegradable
protein flow (RUP) (N= 22)…………………………………………………130
Table 4. 7. Ranking of the protein fractionation schemes based on their ability to
predict rumen degradable protein (RDP) supply, and rumen undegradable
protein (RUP) flow as assessed by their root mean square prediction error
(RMSPE)…………………………………………………………………….132
Table 5.1. Descriptive statistics for the studies used to describe renal urea clearance
for dairy cows……………………………………………………………….140
Table 5.2. Descriptive statistics for the studies used to describe gastrointestinal (GIT)
urea clearance for dairy cows………………………………………………..142
Table 5.3. List of the equations for the gastrointestinal carbohydrates
compartments………………………………………………………………..147
Table 5.4. List of the equations for the gastrointestinal athey mino-N
compartments………………………………………………………………..148
Table 5.5. List of the equations for the gastrointestinal microbial compartments…..150
Table 5.6. List of the equations for the non protein nitrogen compartments………..153
Table 5.7. List of the equations for the body amino acids compartments…………..155
Table 5.8. Definition and numerical value of parameters…………………………...156
xx
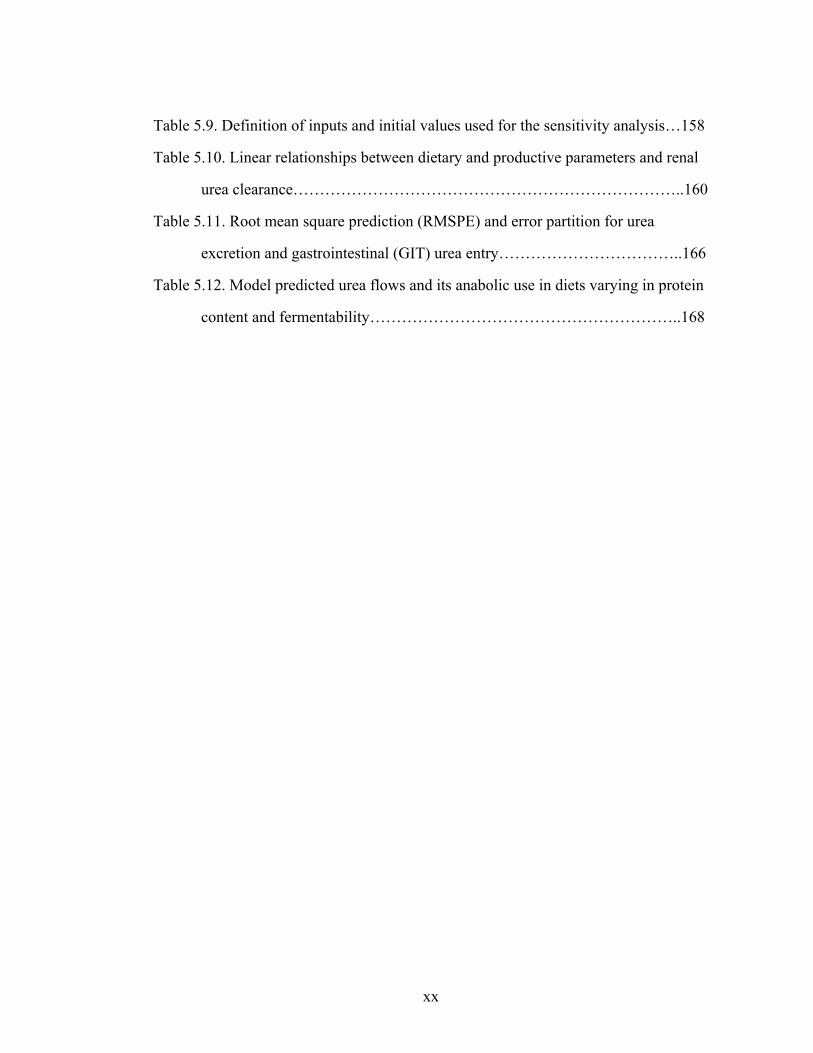
Table 5.9. Definition of inputs and initial values used for the sensitivity analysis…158
Table 5.10. Linear relationships between dietary and productive parameters and renal
urea clearance………………………………………………………………..160
Table 5.11. Root mean square prediction (RMSPE) and error partition for urea
excretion and gastrointestinal (GIT) urea entry……………………………..166
Table 5.12. Model predicted urea flows and its anabolic use in diets varying in protein
content and fermentability…………………………………………………..168
xxi
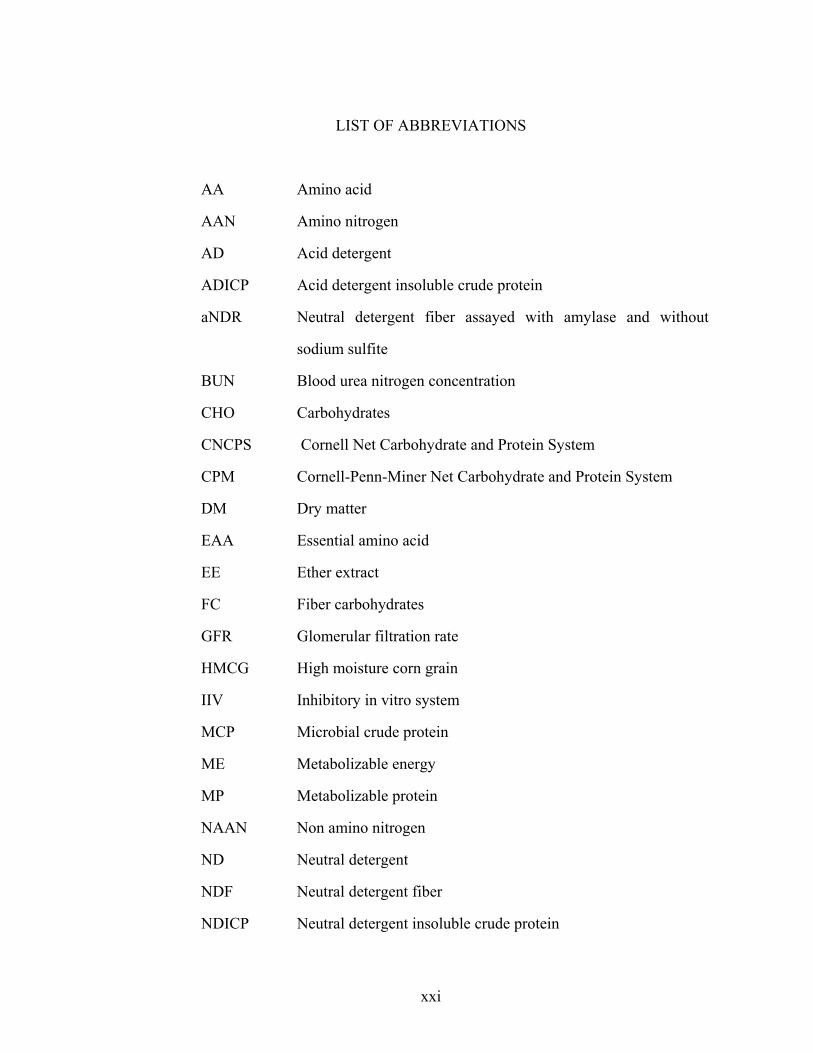
LIST OF ABBREVIATIONS
AA Amino acid
AAN Amino nitrogen
AD Acid detergent
ADICP Acid detergent insoluble crude protein
aNDR Neutral detergent fiber assayed with amylase and without
sodium sulfite
BUN Blood urea nitrogen concentration
CHO Carbohydrates
CNCPS Cornell Net Carbohydrate and Protein System
CPM Cornell-Penn-Miner Net Carbohydrate and Protein System
DM Dry matter
EAA Essential amino acid
EE Ether extract
FC Fiber carbohydrates
GFR Glomerular filtration rate
HMCG High moisture corn grain
IIV Inhibitory in vitro system
MCP Microbial crude protein
ME Metabolizable energy
MP Metabolizable protein
NAAN Non amino nitrogen
ND Neutral detergent
NDF Neutral detergent fiber
NDICP Neutral detergent insoluble crude protein
xxii
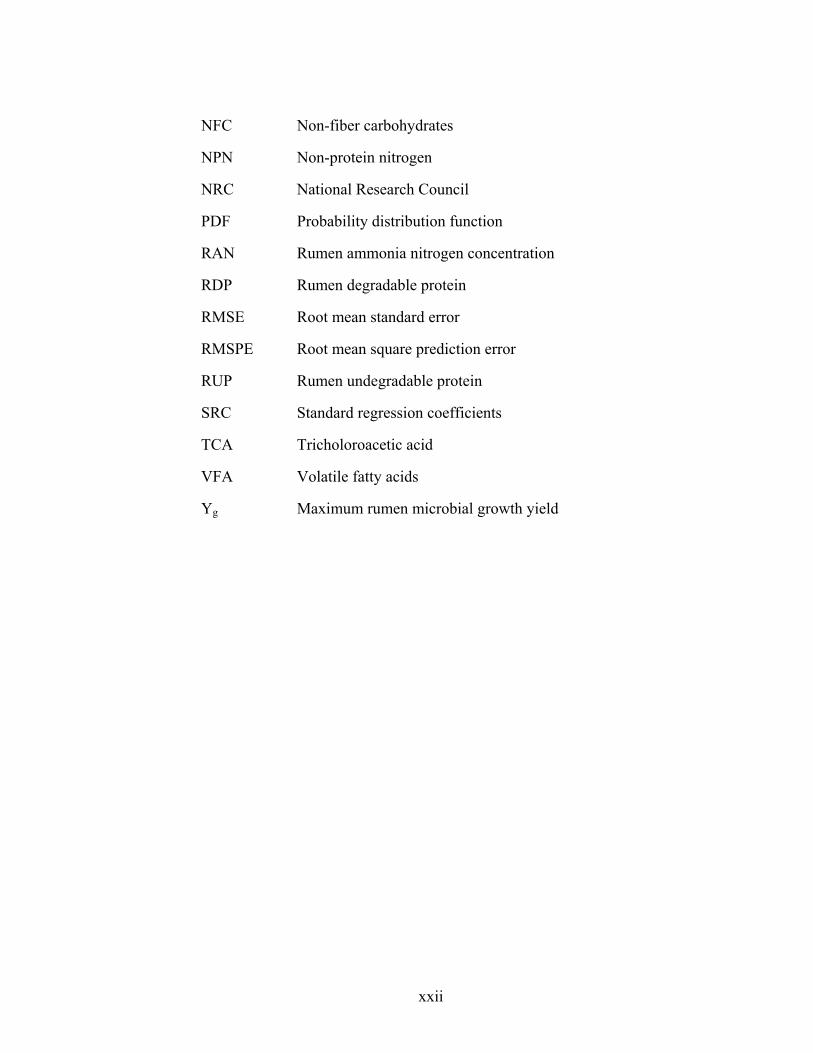
NFC Non-fiber carbohydrates
NPN Non-protein nitrogen
NRC National Research Council
PDF Probability distribution function
RAN Rumen ammonia nitrogen concentration
RDP Rumen degradable protein
RMSE Root mean standard error
RMSPE Root mean square prediction error
RUP Rumen undegradable protein
SRC Standard regression coefficients
TCA Tricholoroacetic acid
VFA Volatile fatty acids
Yg Maximum rumen microbial growth yield

1
INTRODUCTION
Over the last decade, public concern about issues related to the impact of
animal agriculture on the environment has grown. Currently, the agenda for
agriculture policies in developed countries incorporates a variety of issues including
the role of agriculture in environmental pollution, food safety, excretion of hormonal
and antibiotic residues and pathogens to the environment, and animal welfare (Powers,
2003). For the years to come, assuring more efficient production and a safe and
nutritious food supply while maintaining profitability will remain a great challenge.
More systematic quantitative approaches are needed to cope with the increasing
complexity that naturally arises as the number of factors involved in decision making
increases.
The Latin verb simulare means to mimic. The purpose of a simulation model is
to mimic real systems so that their behavior can be studied. Models are valuables tools
in both research and field applications. They integrate knowledge in a readily usable
way, providing predictions and guidance. In research, a hypothesis, which is nothing
but a mental model, can be expressed in mathematical and formal terms to provide a
quantitative description and mechanistic understanding of a biological system
(Thornley, 2000). When creating models, areas where knowledge is lacking can be
highlighted, and ad hoc experimentation can be reduced (Thornley, 2000).
Nutritional models help on farm decision-making by predicting animal
performance and nutrient excretion and assessing diet adequacy under a wide range of
management and feeding situations. Because beef and dairy farming are significant
contributors to environmental nitrogen (N) pollution in the developed world,
environmental legislation requires farms to quantify and adjust N budgets (NRC,
2
2003). Thus to mitigate the negative environmental impact, it is important that diets
are formulated that meet, but do not exceed N requirements of rumen microbes and
amino acids (AA) requirements of the animals. At present, some aspects of current
nutritional models require further improvements, in particular predictions of (i) dietary
supply of rumen degradable protein (RDP) and rumen undegradable protein (RUP),
(ii) extent of ruminal N recycling, (iii) N requirements of rumen microorganisms, and
(iv) microbial protein supply (Schwab, et al., 2005).
The objectives of this Ph.D. thesis were (i) to develop and evaluate feed
carbohydrate and protein fractionation schemes to improve predictions of dietary
supply of RDP and RUP and microbial protein supply, and (ii) conceptualize and
develop a dynamic model of N fluxes in dairy cows that characterizes the role of N
excretion and recycling on N efficiency. The overall objective was to improve the
usefulness of nutritional models to accurately balance diets for N. The literature
review covers aspects of feed chemistry, N metabolism, and dynamic systems theory
that are the basis for the principles and assumptions of the subsequent chapters.
3
CHAPTER 1
LITERATURE REVIEW: FEED CARBOHYDRATE AND PROTEIN SYSTEMS
AND NITROGEN RECYCLING IN RUMINANTS
1.1. Feed carbohydrate and protein fractionation systems
A key aspect of nutritional models is the description and characterization of
feed composition and its variability. The level of aggregation in describing feeds is the
result of a compromise among quality and availability of inputs, sensitivity and risk of
use of the model, and model objectives.
1. 1. 1. Feed carbohydrates
Carbohydrates (CHO) consist of monosaccharide sugars in chains of varying
lengths and have the general chemical formula Cn(H2O)n . They represent the largest
component of rations for ruminants. The biochemical description of the CHO most
commonly found in feedstuffs is presented in Table 1.1. Starch, fructans, and
galactans are storage reserve compounds. Sucrose can be stored in feeds such as sugar
beets, but its main function in plants is transport (Van Soest, 1994). Starch is the
predominant reserve CHO and is stored in seeds, as well as in leaves and stems of
tropical grasses and legumes (Van Soest, 1994). Fructosans are stored in leaves and
stems of temperate grasses, and galactans are found in legume seeds (Van Soest,
1994). Pectin, hemicellulose and cellulose are components of the plant cell wall.
4
Table 1.1. Common carbohydrates found in feedstuffs (Van Soest, 1994).
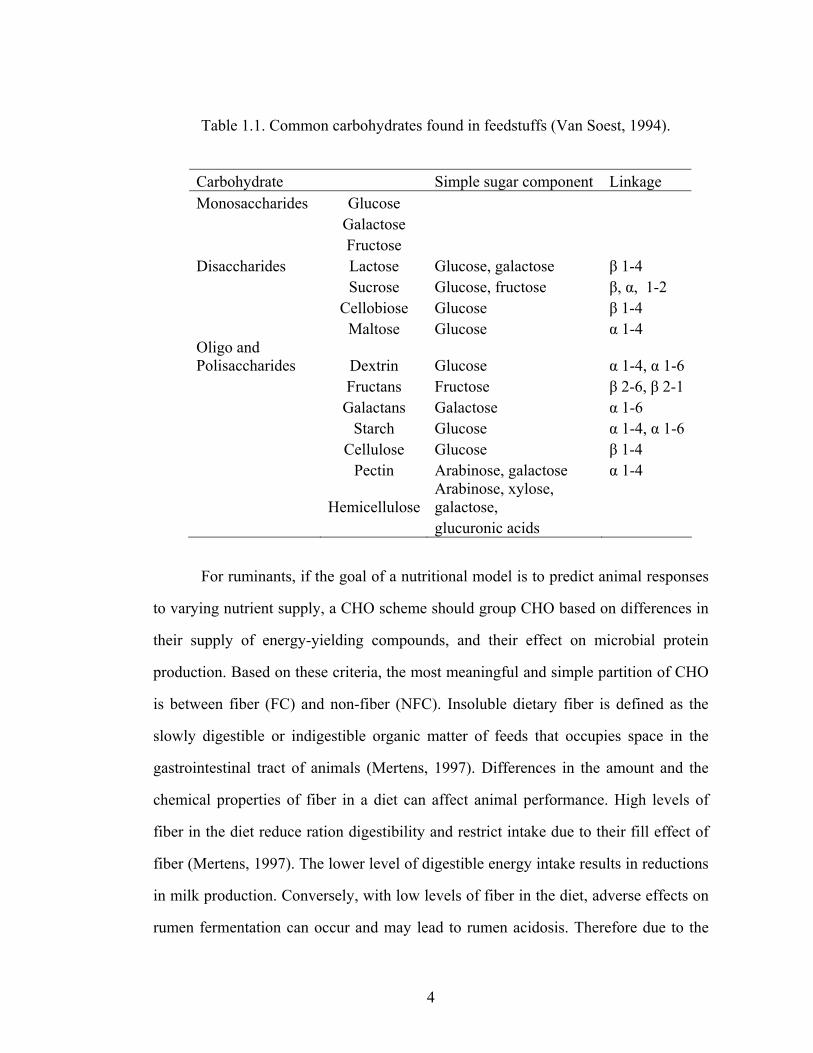
Carbohydrate Simple sugar component Linkage Monosaccharides Glucose Galactose Fructose Disaccharides Lactose Glucose, galactose β 1-4 Sucrose Glucose, fructose β, α, 1-2 Cellobiose Glucose β 1-4 Maltose Glucose α 1-4 Oligo and Polisaccharides Dextrin Glucose α 1-4, α 1-6 Fructans Fructose β 2-6, β 2-1 Galactans Galactose α 1-6 Starch Glucose α 1-4, α 1-6 Cellulose Glucose β 1-4 Pectin Arabinose, galactose α 1-4
HemicelluloseArabinose, xylose, galactose,
glucuronic acids
For ruminants, if the goal of a nutritional model is to predict animal responses
to varying nutrient supply, a CHO scheme should group CHO based on differences in
their supply of energy-yielding compounds, and their effect on microbial protein
production. Based on these criteria, the most meaningful and simple partition of CHO
is between fiber (FC) and non-fiber (NFC). Insoluble dietary fiber is defined as the
slowly digestible or indigestible organic matter of feeds that occupies space in the
gastrointestinal tract of animals (Mertens, 1997). Differences in the amount and the
chemical properties of fiber in a diet can affect animal performance. High levels of
fiber in the diet reduce ration digestibility and restrict intake due to their fill effect of
fiber (Mertens, 1997). The lower level of digestible energy intake results in reductions
in milk production. Conversely, with low levels of fiber in the diet, adverse effects on
rumen fermentation can occur and may lead to rumen acidosis. Therefore due to the

5
importance of balancing diets for fiber content, laboratory methods have been
developed that allow determination of fiber in feeds.
The neutral detergent fiber procedure (NDF) is the most widely accepted
method for determining fiber content in feedstuffs. Van Soest and Wine (1967)
observed that feeds could be divided into a readily available soluble fraction and a
fibrous residue that was incompletely digested. They developed the NDF method to
match the nutritional definition of fiber (Van Soest and Wine, 1967). A large number
of modifications of the method exists. The NDF method approved by the Association
of Official Analytical Chemists International (Mertens, 2002) uses sodium sulfite to
remove proteinaceous material from the insoluble fiber and amylase to reduce starch
contamination,. The NDF method isolates components other than the fibrous CHO
(hemicelluloses and celluloses). It also recovers tannin-protein complexes, protein,
ash, silica and lignin (Van Soest, et al., 1991). Therefore, NDF assayed with amylase
and sodium sulfite and corrected for residual nitrogen (NDICP) and ash is the most
accurate way to estimate FC in commercial laboratories.
The NDF values in model feed libraries represent averages determined over a
span of many years. A current problem with these values is the lack of consistency in
the methods and corrections used to determine them. Particularly in models where
NFC is calculated by difference, methods of feed analysis and subsequent corrections
affect estimates of both the FC and NFC fractions, and therefore the impact of a given
feed on model predictions of digestibility and animal performance.
Rate and extent of degradation of plant cell wall varies with forage species, and
maturity (Van Soest, 1994). Lignin, waxes, and the cuticle of the epidermis interfere
with microbial degradation of fiber polysacarids by acting as a physical barrier
(Wilson and Mertens, 1995). In addition, plant anatomy and cell type influences fiber
digestibility (Akin, 1989).
6
Until recently, the NFC fraction has been treated as a fairly homogenous,
highly digestible fraction. In the most recent Nutrient Requirements of Dairy Cattle
(NRC, 2001), NFC is assumed to be 98 % truly digestible, and is modified by an
adjustment factor based on processing of feed. However, studies indicate that
manipulating dietary NFC influences ruminal fermentation, total tract digestion,
animal performance, milk composition, and animal health (Hall, 2002). Although the
Dairy NRC (2001) only provided recommendations for a maximum concentration of
NFC in the diet (~ 32 to 42 % of the diet DM), it acknowledged that the optimal
concentration of NFC depends on several factors including type of NFC components,
interactions between NFC and both the fiber and protein fractions, processing effects,
dry matter intake, and the physiological state of the animal. The interaction of these
factors was well illustrated in a study by Heldt et al (1999), which determined the
effect of the interaction between different NFC sources and the RDP level in the diet
on rumen fermentation in steers. At low RDP levels (0.031 % BW/d), all types of
supplemented NFC (starch, glucose, fructose and sucrose) depressed NDF
digestibility. At high RDP levels (0.122 % BW/d), supplemented NFC enhanced NDF
digestibility compared to the control (unsupplemented). Sugars had a greater effect
than starch, and within sugars, monosaccharides had a greater effect than
disaccharides. At low levels of RDP, N is the first limiting nutrient, and thus the
competition for N between microbes that utilize NFC and FC may become the
dominant interaction. As ruminal N level increases, the competition may be overcome
and the enhancement of microbial growth through the provision of growth factors such
as branched chain volatile fatty acids from microbial turnover may become more
evident. Non-fiber CHO and FC interact through different mechanisms. Khaili and
Huhtanen (1991) reported a depression of NDF digestibility when sucrose was
supplemented at 16 % of the ration (1 kg sucrose). The depression was reversed by

7
adding buffers (0.25 kg/d of sodium bicarbonate) to the diet. The rates of NDF
digestion were decreased by sucrose supplementation, but rates of passage were not
affected by neither sucrose or buffer supplementations (Huhtanen and Khalili, 1991).
In addition, some ruminal bacteria produced bacteriocins, which may also play a role
in depressing fiber fermentation at neutral pH (Piwonka and Firkins, 1996, Rychlik
and Russell, 2002).
Carbohydrates also differ in their ability to support microbial growth (Hall and
Herejk, 2001, Strobel and Russell, 1986) because of differences in rates of
fermentation, predominant fermentative pathways, and allocation of energy between
reserves and growth, among other factors. Based on the fermentation products
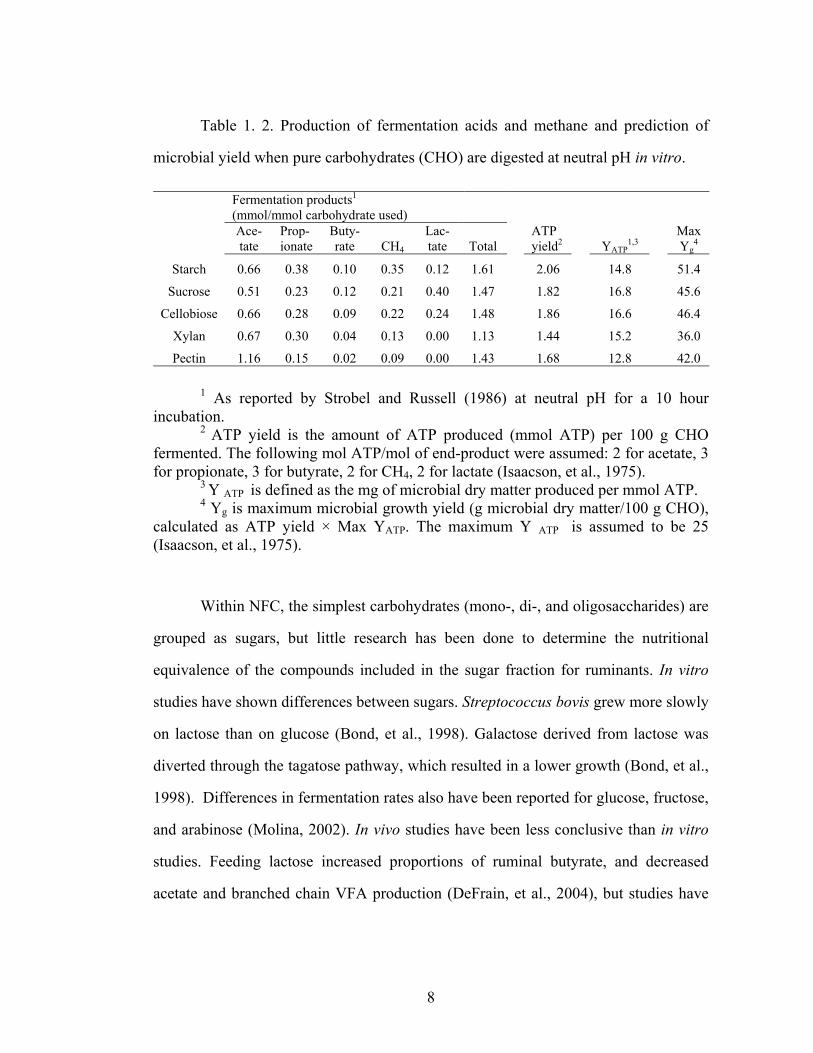
reported by Strobel and Russell (1986) and assuming a maximum yield of microbial
mass of 25 g per mmol of ATP, starch is the NFC that is calculated to support the
highest level of microbial growth yield, while xylan and pectin supported the lowest
yield (Table 1. 2). Overall, pentoses support less microbial growth than hexoses. At
pH below 6, microbial protein synthesis was depressed for all the tested soluble CHO
(Strobel and Russell, 1986); but , fermentation was depressed only for cellobiose and
pectin. Several factors contribute to reduce protein synthesis at low pH, including
depression of CHO utilization, switch to low energy lactate-yielding pathways, and
energy spilling (Russell, 1998, Van Kessel and Russell, 1996).
8
Table 1. 2. Production of fermentation acids and methane and prediction of
microbial yield when pure carbohydrates (CHO) are digested at neutral pH in vitro.
Fermentation products1 (mmol/mmol carbohydrate used)
Ace-tate
Prop-ionate
Buty-rate CH4
Lac- tate Total
ATP yield2
YATP
1,3 Max Yg
4
Starch 0.66 0.38 0.10 0.35 0.12 1.61 2.06 14.8 51.4
Sucrose 0.51 0.23 0.12 0.21 0.40 1.47 1.82 16.8 45.6
Cellobiose 0.66 0.28 0.09 0.22 0.24 1.48 1.86 16.6 46.4
Xylan 0.67 0.30 0.04 0.13 0.00 1.13 1.44 15.2 36.0
Pectin 1.16 0.15 0.02 0.09 0.00 1.43 1.68 12.8 42.0
1 As reported by Strobel and Russell (1986) at neutral pH for a 10 hour
incubation. 2 ATP yield is the amount of ATP produced (mmol ATP) per 100 g CHO
fermented. The following mol ATP/mol of end-product were assumed: 2 for acetate, 3 for propionate, 3 for butyrate, 2 for CH4, 2 for lactate (Isaacson, et al., 1975).
3 Y ATP is defined as the mg of microbial dry matter produced per mmol ATP. 4 Yg is maximum microbial growth yield (g microbial dry matter/100 g CHO),
calculated as ATP yield × Max YATP. The maximum Y ATP is assumed to be 25 (Isaacson, et al., 1975).
Within NFC, the simplest carbohydrates (mono-, di-, and oligosaccharides) are
grouped as sugars, but little research has been done to determine the nutritional
equivalence of the compounds included in the sugar fraction for ruminants. In vitro
studies have shown differences between sugars. Streptococcus bovis grew more slowly
on lactose than on glucose (Bond, et al., 1998). Galactose derived from lactose was
diverted through the tagatose pathway, which resulted in a lower growth (Bond, et al.,
1998). Differences in fermentation rates also have been reported for glucose, fructose,
and arabinose (Molina, 2002). In vivo studies have been less conclusive than in vitro
studies. Feeding lactose increased proportions of ruminal butyrate, and decreased
acetate and branched chain VFA production (DeFrain, et al., 2004), but studies have
9
failed to show differences in performance between animals receiving supplemental
lactose or other sugars such as sucrose (Maiga, et al., 1995).
Non-fiber CHO compounds that are not digested by mammalian enzymes are
included in the soluble fiber fraction. These compounds are pectic substances, β-
glucans, fructans, and gums (Van Soest, 1994). Despite being classified together, they
have different fermentation characteristics. Overall, they are readily digested by
microbes (Biggs and Hancock, 1998, Engstrom, et al., 1992, Hatfield and Weimer,
1995). The main product of pectin fermentation is acetate (Table 2), and pectin
utilization is depressed at low pH (Strobel and Russell, 1986). Fructans have a VFA
profile similar to sugars and can yield lactic acid (Marounek, et al., 1988).
1.1.2. Feed proteins
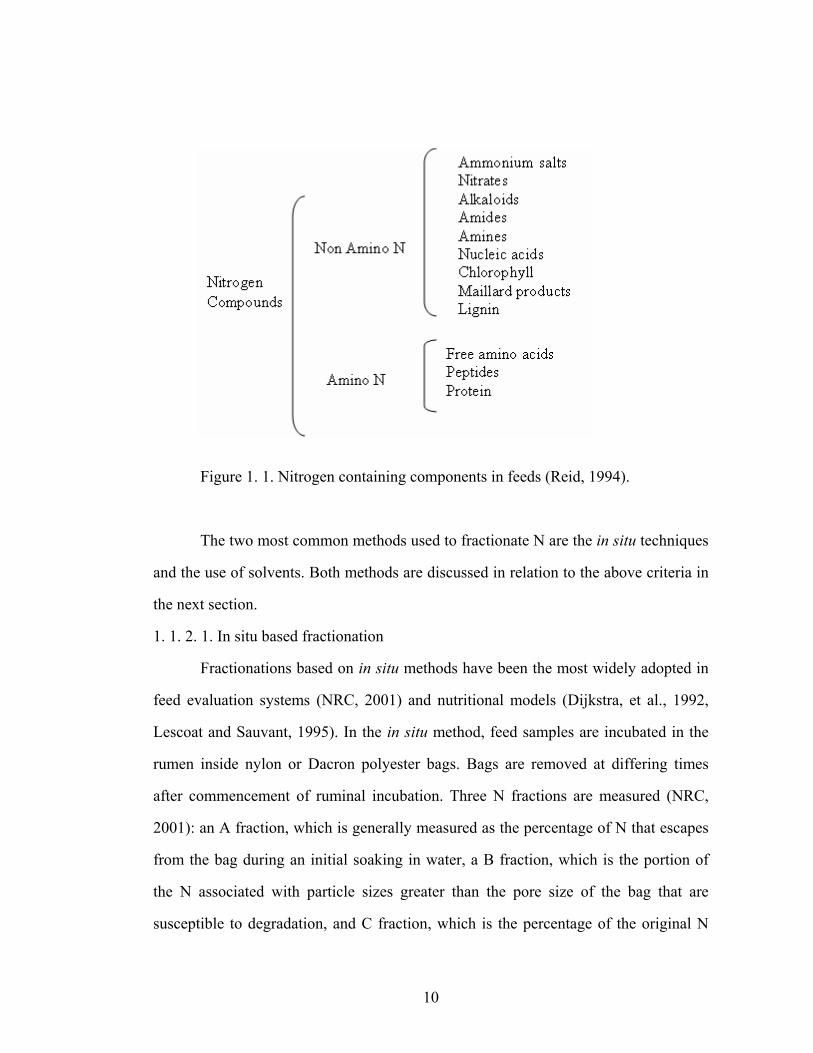
Feeds contain a wide array of both non amino and amino N-containing
components (Figure 1.1). An appropriate criterion for classifying N containing
compounds is their ability to supply both microbial and animal N requirements. The N
requirements of rumen microorganisms are met by ammonia, amino acids, and
peptides. The N requirements of the animal are met with amino acids, and therefore
the quantity and quality (profile) of dietary amino acids are important variables to
consider. The best way to describe the nutritive value of N compounds in relation to
the previous criterion is to describe them according to their ruminal degradation
characteristics (NRC, 2001).
10
Figure 1. 1. Nitrogen containing components in feeds (Reid, 1994).
The two most common methods used to fractionate N are the in situ techniques
and the use of solvents. Both methods are discussed in relation to the above criteria in
the next section.
1. 1. 2. 1. In situ based fractionation
Fractionations based on in situ methods have been the most widely adopted in
feed evaluation systems (NRC, 2001) and nutritional models (Dijkstra, et al., 1992,
Lescoat and Sauvant, 1995). In the in situ method, feed samples are incubated in the
rumen inside nylon or Dacron polyester bags. Bags are removed at differing times
after commencement of ruminal incubation. Three N fractions are measured (NRC,
2001): an A fraction, which is generally measured as the percentage of N that escapes
from the bag during an initial soaking in water, a B fraction, which is the portion of
the N associated with particle sizes greater than the pore size of the bag that are
susceptible to degradation, and C fraction, which is the percentage of the original N

11
remaining in the bag at a defined endpoint of incubation. Limitations of the in situ
method have led researchers to question its usefulness in describing N inputs for
balancing N supply with microbial and animal requirements (Schwab, et al., 2005).
These limitations include:
(1) The A fraction is assumed to be completely degraded in the rumen (i.e., all
RDP), implying that no soluble protein can escape from the rumen, and making no
distinction in the N composition of the fraction. However, recent in vivo studies
showed that some soluble N escapes the rumen as non-ammonia non-microbial N (63-
85 g/kg) (Choi, et al., 2002a, Volden, et al., 2002). The A fraction contains variable
amounts of NPN, rapidly solubilized protein, and protein in small particles that
migrate from nylon bags depending on the feed. The rate of degradation for the small
particle fraction may not differ from the rate for the B fraction (Gierus, et al., 2005).
(2) Microbial contamination of the residues results in under prediction of the
rates of degradation of the B fraction, especially for high-fiber low-protein feeds
(Noziere and Michalet-Doreau, 2000). For high-fiber low-protein feeds, N
degradability can be under estimated up to 30 % (Noziere and Michalet-Doreau,
2000). None of the decontamination techniques (i.e. washing, stomaching) removes
microbial contamination completely (Noziere and Michalet-Doreau, 2000).
(3) Another issue that arises is that CP degradation may not be equivalent to
amino acid degradation. Crude protein degradability tended to be higher compared
with total amino acid degradability because the A fraction contains both non amino N
as well as amino N (Susmel, et al., 1989, Weisbjerg, et al., 1996). Furthermore,
degradabilities differ among individual amino acids; For concentrates, arginine,
cysteine, and glutamic acid had a higher effective degradability, and valine, isoleucine,
and threonine had a lower effective degradability than average degradability for total
amino acids (Hvelplund, et al., 1992). For some feeds, effective degradabilities of

12
methionine were also lower than the total amino acid treatment (Hvelplund, et al.,
1992).
1. 1.2. 2. Solubility based fractionation
The N scheme used in the Cornell Net Carbohydrate and Protein System
(CNCPS) fractionates N into five fractions based on solubility; the A fraction is NPN
and is analyzed using a protein precipitating agent, the B fraction is true protein and C
is unavailable protein (Van Soest, et al., 1981b). The B fraction is further sub-divided
into three fractions with different digestion rates (B1, B2, and B3). The B1 fraction is
the true protein soluble in borate phosphate buffer, and it is assumed to have very
rapid digestion rates (1-4/h). The B3 fraction is insoluble in neutral detergent but is
soluble in acid detergent, and it is assumed to represent slowly digestible protein
(0.0006-0.0055/h). The C fraction is insoluble in acid detergent solution. The B2
fraction is calculated by difference and is assumed to have rates close to passage rates
(0.03-0.16/h). This system of protein fractionation for the CNCPS was first described
25 years ago (Van Soest, et al., 1981b). Some limititations of the system have become
apparent through research and field use of the CNCPS.
One of the main problems identified is that there are several disconnects
present in the development of the scheme. The assigned digestion rates for the CNCPS
protein B fractions in the CNCPS were based on the number of pools and rates
identified by a curve-peeling technique using data based on protein in vitro solubility
when incubated with a protease from Streptomyces griseus (Pichard, 1977). Pichard
(1977) found that NDICP was highly correlated with the slowly solubilized fraction
obtained with the enzyme technique. Subsequently, the rate for the slowly solubilized
fraction was assigned to the NDICP (corrected for ADICP) fraction. However, the
pool size of the fractions obtained by curve peeling of the enzymatic data do not

13
always match the pool size of the chemical fractions (Table 1.3), and therefore rates
for chemical and enzymatic fractions are not equivalent.
Table 1. 3. Nitrogen fractions based on chemical and enzymatic techniques
(Licitra, et al., 1999).
Chemical data Enzymatic data5
Pool size
(% N) Pool size
(% N) Rates (/h)
Alfalfa hay A + B11 40.1 48.5 -- B22 57.5 28.9 0.19 B33 1.5 21.7 0.02 C4 0.9 0.9 0 Blood meal A + B11 4 1.8 -- B22 53.9 38.8 0.12 B33 42.1 63 0.02 C4 0 0 0 Corn gluten meal A + B11 3.5 2.8 -- B22 94.5 30.9 0.07 B33 0.7 65 0.01 C4 1.3 1.3 0 Soybean meal A + B11 15.5 23.9 -- B22 75.1 63.4 0.17 B33 4.5 10.3 0.001 C4 4.9 2.8 0
1 Chemical fraction is N soluble in buffer solution 2 Chemical fraction is the N insoluble in buffer solution minus N insoluble in
neutral detergent solution (NDIN) 3 Chemical fraction is NDIN minus N insoluble in acid detergent solution
(ADIN) 4 Chemical fraction is ADIN 5 The proteolytic enzyme was a protease from Streptomyces griseus with a
concentration of 0.33 units/mL

14
In addition, recent studies in which the kinetics of NDICP disappearance has
been determined indicated that the digestion rates for the NDICP are considerably
higher than are the rates found for the most slowly degraded enzymatic fraction
(Coblentz, et al., 1999, Juarez, 1998, McBeth, et al., 2003, Rossi, et al., 1997). With
the curve peeling approach, the bias in estimating the slow components is propagated
into the estimation of the faster components (Jacquez, 1985), and thus uncertainty in
the estimates of the slowest pool transfer to the other identified rates and pool sizes.
Inflections in the curves of the natural log of the solubilized N were assumed to be
indicative of different first-order pools (Shipley and Clark, 1972). However,
inflections in the solubilization curve may also be attributed to other reasons, such as
presence of second order kinetics, in which the rate of solubilization is not only a
function of the characteristics of the substrate, but also of the enzymatic concentration.
End-product accumulation and the decline of the enzymatic activity over time as the
proteolytic enzymes degrade themselves results in deviations of the first-order
(Krishnamoorthy, et al., 1983). Under these conditions, the pools and rates may be
methodological artifacts representative, rather than reflecting intrinsic characteristics
of the feed (Mertens, 1993).
The assumption behind the use of N solubility in detergent solutions to
fractionate N is that the N associated with NDF is cell wall-bound protein, mostly
extensins covalently linked to hemicelluloses. The N insoluble in ADICP is N
associated with lignin and Maillard reactions. Sodium sulfite is omitted when
analyzing for the NDICP fraction since it is considered that the cleavage of the
disulfide bonds by the sodium sulfite is not biologically possible. However, when
Pichard (1977) determined the amount of N bound to the cell wall in silages, the
differences between the determination with and without Na2SO3 were smaller among
15
silages than hays. Most of the N removed by Na2SO3 had been removed during the
fermentation process (Pichard, 1977).
There are two types of unavailable N: in forages (lignin-bound N and tannin-
protein complexes) and that which is induced by heating and drying. The CNCPS
assumes ADICP is indigestible protein completely indigestible, based on the
observation that there was a good relationship between ADICP and indigestible N for
heat-damaged silages, hays, and dehydrated alfalfa (Goering, et al., 1972). However,
additional ADICP produced by heating was partially digested in steamed treated
alfalfa (Broderick, et al., 1993), distiller’s grains (Nakamura, et al., 1994, Van Soest,
1989), and plant proteins (Hussein, et al., 1995, Nakamura, et al., 1994, Schroeder, et
al., 1995), while feeds with a high content of tannins had negative ADICP
digestibilites, as the components in the ADICP were binding protein (Waters, et al.,
1992). These disparities in behavior reflect the lack of uniformity of the ADICP
fraction.
Because peptides and amino acids (AA) may stimulate microbial growth on
NFC more than ammonia (VanKessel and Russell, 1996), the distinction between the
fraction containing non-amino N and amino-N is important. The CNCPS uses
precipitant agents (i.e. trichloroacetic acid, tungstic acid) to partition A and B1
fractions (Sniffen et al., 1992). However, methods based on protein precipitation are
not widely available commercially and the factors affecting peptide recoveries have
not been fully investigated. It seems that factors other than peptide length affect their
precipitation (Hedqvist, 2004).
1.2. Rumen protein digestion
Ruminal N metabolism is a highly complex process that includes multiple
steps, including protein hydrolysis, peptide degradation, amino acid deamination, and
various pathways of carbon metabolism. Overall microbial N metabolism is highly
16
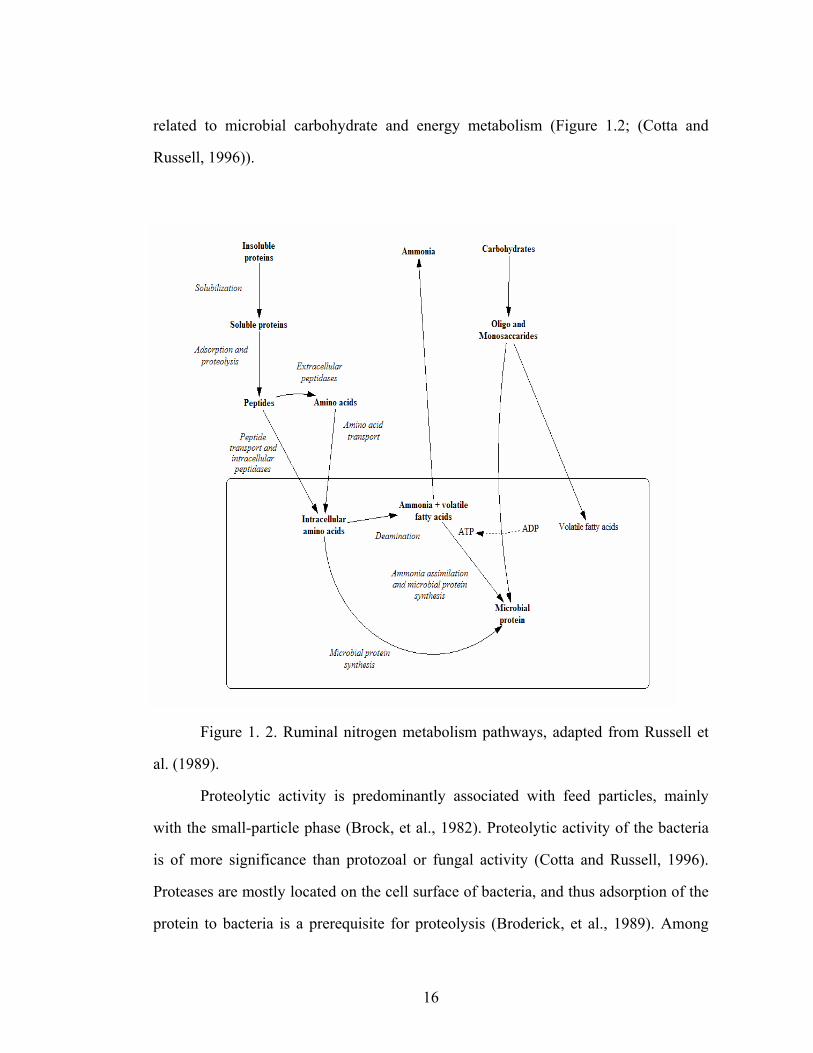
related to microbial carbohydrate and energy metabolism (Figure 1.2; (Cotta and
Russell, 1996)).
Figure 1. 2. Ruminal nitrogen metabolism pathways, adapted from Russell et
al. (1989).
Proteolytic activity is predominantly associated with feed particles, mainly
with the small-particle phase (Brock, et al., 1982). Proteolytic activity of the bacteria
is of more significance than protozoal or fungal activity (Cotta and Russell, 1996).
Proteases are mostly located on the cell surface of bacteria, and thus adsorption of the
protein to bacteria is a prerequisite for proteolysis (Broderick, et al., 1989). Among

17
bacteria, amylolytic bacteria are considered the predominant proteolytic bacteria;
Prevotella spp., Butyrivibrio fibrisolvens, and Streptococcus bovis are the major
organisms involved in protein breakdown because of the high number in the rumen
(Cotta and Russell, 1996).
Mixed ruminal protozoa have greater capacity to degrade insoluble, particulate
protein than soluble proteins; they engulf and digest chloroplasts (Cotta and Russell,
1996).
The level and type of proteolytic activity in the rumen is highly variable
(Falconer and Wallace, 1998). In addition, diet influences rate of proteolytic activity.
Feeding highly fermentable diets is associated with an increase in proteolytic activity
due to an elevation in the total microbial population (Siddons and Paradine, 1981).
High levels of proteolytic activities associated with fresh forage diets have been
attributed to an increase in proteolytic activity (Cotta and Russell, 1996). Despite
variability in proteolytic activity, no relationships between proteolytic activity and in
situ rates of protein degradation has been reported (Siddons and Paradine, 1981).
Possible reasons for this are, (1) enzymes others than proteases may limit the rate of
degradation when the protein is embedded in a matrix, (2) proteolytic activity is in
excess, and (3) lack of sensitivity of the in situ technique. Chemical and physical
characteristics of feeds largely determine rate and extent of protein degradation (Stern,
et al., 1994). The effect of protein structure is more evident for soluble proteins.
Degradation rates were roughly in proportion to the number of disulfide bonds
(Broderick, et al., 1989). Heat treatment, which decreases rumen protein degradability,
resulted in a decrease in the percentage of α-helixes and an increase in the percentage
of β-sheets (Yu, 2005).
Proteolysis has been proposed to be the main rate-limiting step in ruminal
protein degradation (Broderick, et al., 1989). However, in vivo experiments showed
18
(Chen, et al., 1987) that with some diets, accumulation of peptides took place after
feeding. Peptidases are cell associated, therefore, so peptide transport and extracellular
peptidase activity is not easy to differentiate (Russell, et al., 1989). Following
bacterial uptake of small peptides and free AA, there are five distinct intracellular
events: (1) cleavage of peptides to free AA, (2) utilization of free AA for protein
synthesis, (3) catabolism of free AA to ammonia and carbon skeletons (deamination),
(4) utilization of ammonia for re-synthesis of AA, and (5) diffusion of ammonia out of
the cell (Figure 1. 2) (NRC, 2001).
1.2.1 In vitro methodology
In vitro methods have been extensively used to mimic ruminal digestion and to
estimate digestion rates of both feed carbohydrates and proteins. Determining in vitro
protein digestion presents both methodological challenges. Measuring disappearance
of feed proteins is complicated by microbial contamination, while ammonia release is
under estimated due to the simultaneous uptake of ammonia for microbial growth.
Approaches used to circumvent these problems include (1) the use of inhibitors of
microbial protein metabolism, (2) corrections for microbial contamination, and (3) and
the use of cell-free enzymes.
1.2.1.1. In vitro system with inhibitors
Broderick (1987) used chloramphenicol and hydrazine sulfate to fully recover
the products of proteolysis. Chloramphenicol inhibits protein synthesis by blocking
formation of amino acyl-tRNA, while hydrazine sulfate inhibits amino acid
deamination and NH3 incorporation (Broderick, 1987). The use of inhibitors did not
depress proteolytic activity in short-term incubations (< 4 hours) as judged by the
estimates of protein degradation rates obtained (Broderick, 1987), but microbial
growth was affected in longer incubations (24 hours) (Siddons, et al., 1982). Although
it is possible that the use of short term incubations biases the protein degradation rates
19
towards the more rapidly degradable protein, the method has proved to be sensitive
enough to predict genetic variation for protein degradability in forages (Broderick, et
al., 2004a). However, the system may be subject to end-product inhibition,
particularly for rapidly degraded proteins. Additionally, the accuracy is reduced for
either feeds such as silages, with high levels of ammonia and free amino acids, and for
those containing very slowly degraded proteins (Broderick and Cochran, 2000).
1.2.1.2. Corrections for microbial contamination
Ruminal inoculum combined with labeled ammonia (15N) or amino acids (14C)
can be used to quantify microbial uptake of protein breakdown products (Atasoglu, et
al., 2004, Atasoglu, et al., 2001, Hristov and Broderick, 1994). An indirected way to
correct for microbial metabolism was developed by Raab et al. (1983). They
determined simultaneously gas production and ammonia release and developed linear
regressions between the gas produced and ammonia released. They extrapolated the
amount of ammonia which would be released when no fermentable CHO were
available. Deviations from linearity were found when a large amount of starch was
added to high protein feeds or very low protein content feeds. With high protein feeds,
a variable amount of peptides and amino acids were incorporated directly into
microbial protein without undergoing deamination, while with low protein content
feeds and energy excess conditions, energy spilling occurs, and gas production is
disconnected from microbial growth. A different approach was taken by Klopfenstein
and colleagues (Haugen, et al., 2006, Mass, et al., 1999). They assumed that treatment
with neutral detergent removed microbial contamination and all N removed by the
neutral detergent solution was of microbial origin, and therefore the primary fraction
of rumen escapable protein was the neutral detergent insoluble crude protein (NDICP)
(Mass, et al., 1999). For the forages tested, the assumption seemed reasonable, since
estimates calculated using total N corrected for microbial contamination did not differ

20
from those calculated using NDICP (Mass, et al., 1999). However, the method is not
suitable for protein concentrates because in most cases the NDICP represents a small
percentage of the total N, and N other than NDICP escapes from the rumen.
1. 3. 1. 3. Cell-free enzymes
Another way of avoiding the problem of microbial contamination is the use of
cell-free enzymes. Techniques based on commercial proteases have been extensively
studied because there is no need for cannulated animals and they are easier to
standardize. However, given the complexity of ruminal protein metabolism and the
factors that influence it, it seems unlikely that a single commercial protease would be
able to mimic ruminal digestion of protein by microbes. Theoretically, a complex
mixture of commercial proteases with activities similar to those found in the rumen/ or
microbial-cell preparations could be adequate to mimic rumen proteolysis (Kohn and
Allen, 1995, Luchini, et al., 1996). Luchini et al. (1996) tested a mixture of
commercial enzymes (trypsin, carbohypeptidase B, chymotrypsin, and
carboxypeptidase A). The mixture could not detect differences in digestion rates
because of heat damage and did not mimic the digestion rates obtained with strained
ruminal fluid.
1. 2. 2. Kinetics of protein digestion
Concepts of classic enzymatic kinetics have been widely applied in modeling
digestion in the ruminant. Despite the occurrence of complicated reaction pathways,
kinetics of protein digestion generally show simple decay curves with apparent first-
order behavior. In a first order rate reaction, at any given moment, a constant fraction
(k) of the substrate (S) present undergoes conversion to product over time (t);
kSdtdS
−= [1.1]

21
Graphical procedures can be used to determine the order of a reaction from
experimental data (Segel, 1976). The most widely used approach involves plotting
transformed time series data and examining the plot for linearity. Another useful plot
is called the “phase plot”. In a phase plot, the net rate of change of a state variable (i.e.
velocity of substrate depletion) is plotted against the state variable itself (i.e. substrate)
(Edelstein-Keshet, 1988). Figure 1.3 shows the typical decay curve for a first-order
behavior (Panel A). For a first-order reaction, the phase plot (Panel B) and the log
transformed plot (Panel C) are linear.
Figure 1.3. Decay curve (Panel A), phase plot (Panel B) and the log
transformed plot (Panel C) for first-order kinetics.
0 10 20 30 40 500
50
100
time
S(t)
0 20 40 60 80 1000
2
4
S(t)
Net
flow
0 10 20 30 40 5010
0
101
102
time
log
(S(t)
)
A
B
C
22
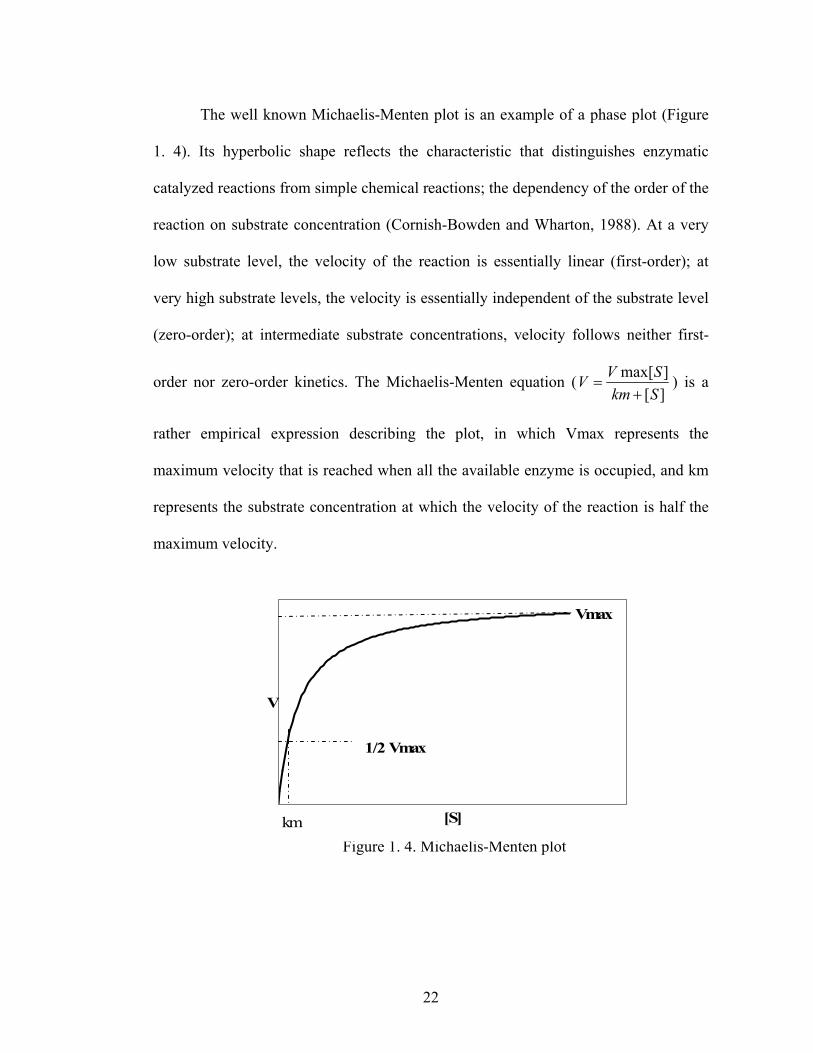
The well known Michaelis-Menten plot is an example of a phase plot (Figure
1. 4). Its hyperbolic shape reflects the characteristic that distinguishes enzymatic
catalyzed reactions from simple chemical reactions; the dependency of the order of the
reaction on substrate concentration (Cornish-Bowden and Wharton, 1988). At a very
low substrate level, the velocity of the reaction is essentially linear (first-order); at
very high substrate levels, the velocity is essentially independent of the substrate level
(zero-order); at intermediate substrate concentrations, velocity follows neither first-
order nor zero-order kinetics. The Michaelis-Menten equation (][]max[
SkmSVV
+= ) is a
rather empirical expression describing the plot, in which Vmax represents the
maximum velocity that is reached when all the available enzyme is occupied, and km
represents the substrate concentration at which the velocity of the reaction is half the
maximum velocity.
Figure 1. 4. Michaelis-Menten plot
[S]
V
Vmax
km
1/2 Vmax
23
In describing protein digestion as a first-order process, it is assumed that the
reaction is substrate limiting, and therefore enzymes/microbes are in excess and that
the overall rate of the reaction reflects the rate-limiting step, generally that of
proteolysis. In addition, it is assumed that the rate limiting step of the reaction is
linked to intrinsic characteristics of feeds and thus the fractional rate is treated as a
property of feeds (Mertens, 1993). Nevertheless, it has been shown that more complex
reaction mechanisms can give rise to simple decay curves, and thus the interpretation
of a simple exponential behavior is more complicated (Srividhya and Schnell, 2006).
Bandstra and Tratnyek (2005) demonstrated that the aggregate behavior of multiple
reactions of different orders produced a behavior indistinguishable from first-order
kinetics. Therefore, in choosing the appropriate kinetic model, emphasis should be
placed not only in the empirical modeling of the data, but in theoretical considerations.
1.3. Dynamics of nitrogen cycling
1.3.1 Principles of control and regulation
Animals are biological systems characterized by high complexity and high
control. Most biological systems are more than the sums of their parts1; they function
by virtue of controlled interactions or regulations between their parts (Kalmus, 1966).
Two levels of regulation, homeostatic and homeorhetic, take place in animals.
Homeostatic regulations smooth nutrient and metabolic flows to maintain a constant
internal environment, while homeorhetic regulations controls metabolism in support of
the predominant physiological process (Bauman and Currie, 1980). Both homeostatic
and homeorhetic regulations involve feedback mechanisms whereby some function of
the output of a system is passed to the input. Two types of feedbacks exist; positive
and negative feedbacks. Negative feedbacks cause the influence of a disturbance to a
1 Because biological systems are nonlinear systems. In contrast, the behavior of a linear system is the sum, or superposition, of its components.

24
regulator to be minimized, so that the system maintains, within limits, a constant
output (Milhorn, 1966). Positive feedback leads to continually increasing output after
an initial disturbance, and gives the system the ability to access new equilibria
(Milhorn, 1966). Positive feedbacks play a key role in regulation of growth and
morphogenesis, and reproduction (i.e. onset of puberty or ovulation), while most of
the regulation of the endocrine system is mediated through negative feedbacks (e.g.
glucose metabolism). Components of the feedback loop are related by causal links (i.e.
insulin increases glucose uptake) and each causal link has a polarity. If the dependent
variable has the same directionality as the independent variable, the polarity is
positive. When the independent variable increases, the dependent variable decreases or
vice versa, the polarity is negative. The polarity of the complete loop is the product of
the polarities of the causal links of the loop. Formally, the loop polarity is defined as
the sign of the open loop gain of the feedback (Eq. 1. 3) (Richardson, 1995). The gain
of a feedback refers to the strength of the signal return by the loop. The open loop gain
is the partial derivative or the feedback effect of a small change in a variable as it
returns to itself. The open loop gain is calculated by the chain rule from the gains of
the individual links of a loop (Richardson, 1995).
Open loop gain = I
O
xx
1
1
∂∂ = )(...)()(
1
2
1
1I
n
n
n
O
xx
xx
xx
∂∂
××∂∂
×∂∂
−
[1.2]
Loop polarity = )(1
1I
O
xxSGN∂∂ = [ ])(...)()(
1
2
1
1I
n
n
n
O
xx
xx
xxSGN
∂∂
××∂∂
×∂∂
−
[1.3]
,where SGN is a sign function, returning +1 if its argument is positive
and -1 if the argument is negative.
25
Compartmental models are described by a system of differential equations, in
which each compartment is represented by a single differential equation, as
demonstrated below.
byaxdtdx
+=
dycxdtdy
+=
can be written in matrix format as, Axx =& , where
=
dcba
A and
=
yx
x .
The eigenvalues (λ ) of the matrix A indicate the qualitative behaviors the
system is capable of (Figure 1. 5). Eigenvalue analyses have been widely used to
analyze model behavior and provide qualitative solutions in linear models (Edelstein-
Keshet, 1988), and more recently in nonlinear models (Edelstein-Keshet, 1988) and
loop dominance analysis (Kampmann and Oliva, 2006, Oliva, 2004).
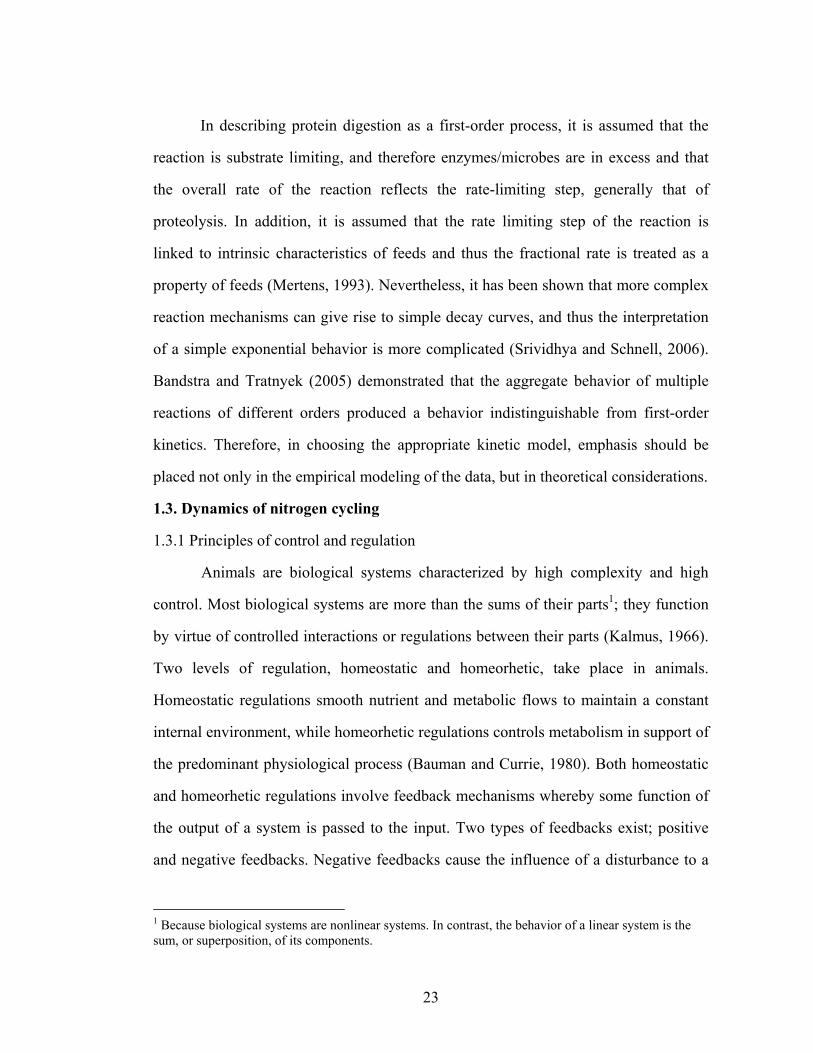
Figure 1. 5. Model behaviors when the eigenvalues are (a) real negative, (b)
real positive (c) complex conjugate pair with zero real parts, (d) complex conjugate
with negative real parts, and (e) complex conjugate with positive real parts.
Most complex behaviors evolve from the interactions between various
feedback loops in the system (Sterman, 2000). The most influential structure in
determining some segments of the dynamics of a system is called loop dominance

26
(Richardson, 1995). For analyzing loop dominance, the eigenvalues of the gain matrix
are calculated. The gain matrix (G) is the matrix containing the slopes of the
relationship between the net rate of the state variables and the state variables
themselves (Kampmann and Oliva, 2006).
∂∂
∂∂
∂∂
∂∂
=
n
nn
n
xx
xx
xx
xx
G&&
&&
....
.
1
11
1.3. 2. Nitrogen recycling
The need to decrease the N content of diets has renewed interest in the
mechanisms of N recycling in ruminants and the potential for manipulating N
recycling in order to improve its transformation into anabolic products. Recycling of
N takes place at different levels and scales (Egan, et al., 1986). At the body level,
continual synthesis and breakdown of body protein takes place. At the rumen level, as
much as 50 % of the microbial mass is turned over before N passes to the lower gut
(Wells and Russell, 1996). Part of the urea in the body is transferred back to the
gastrointestinal tract in order to provide N substrate for microbial synthesis. Both
protein turnover and intra-ruminal recycling are mostly perceived as sources of
inefficiency because they decrease the amount of dietary N transformed into anabolic
form. Nevertheless, these recycling mechanisms are beneficial to they animal system
by providing plasticity and flexibility, and thus the ability to adapt and respond to a
number of physiological and environmental challenges (Lobley, 2003, Stone, et al.,
1996).
While metabolites such as glucose are tightly controlled, dynamics of other
metabolites, such as urea, are mostly dominated by the presence of different
27
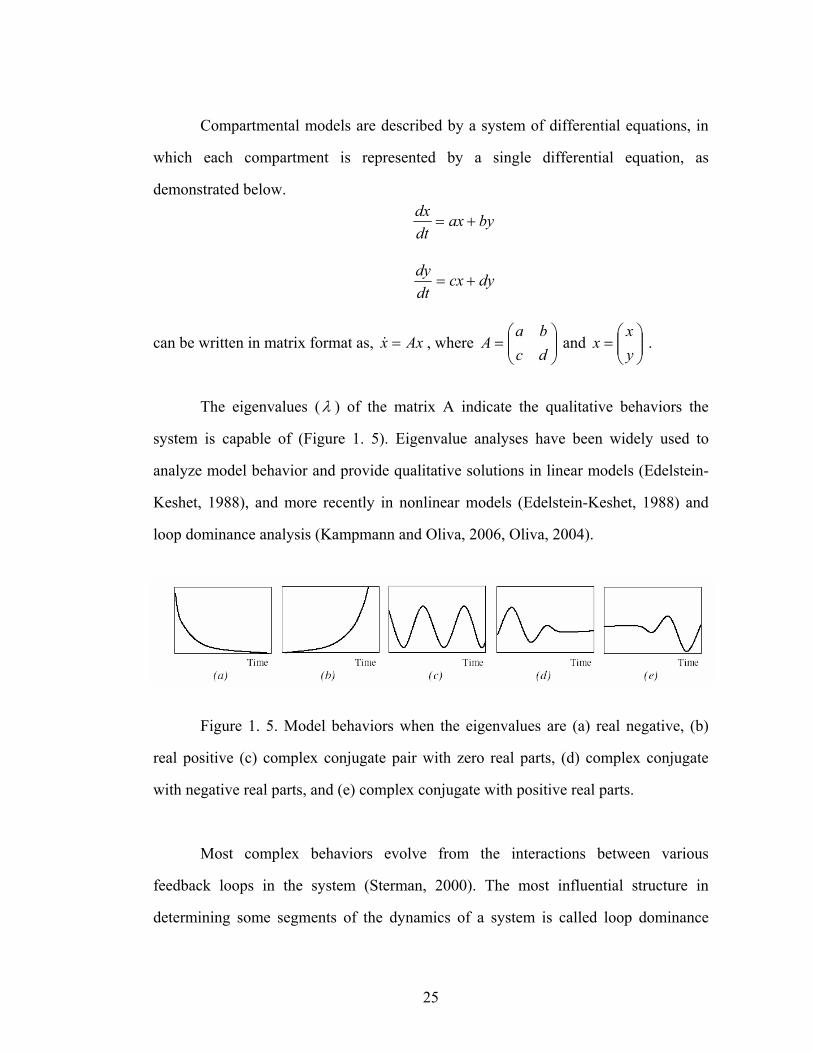
compartments with different turnover and transfer rates, and the presence of time
delays (Sauvant, 1994). Despite this, a remarkable level of regulation of urea
metabolism is achieved when low protein diets are fed to ruminants which allows the
animal to salvage needed N. As a general trend, the amount of urea recycled back to
the gastrointestinal tract (GIT) increases with higher N intakes, but the percentage of
synthesized urea that re-enters the gastrointestinal tract decreases as the amount of N
fed increases (Figure 1.6).
Figure 1.6. Percentage of urea synthesized that reenters the gastrointestinal
tract (GIT) in relation to N intake for sheep (▼) and growing cattle (*). Data from
Allen and Miller (1976), Bunting et al (1989), Hettiarachchi (1999), Kennedy (1980),
Kennedy et al (1981), Marini and Van Amburgh (2003), Marini et al (2004a), Nolan
and Leng (1972), Nolan and Stachiw (1979), Norton et al (1982), Obara et al (1993,
1994).
0 0.5 1 1.5 2 2.5 3 3.50.1
0.2
0.3
0.4
0.5
0.6
0.7
0.8
0.9
1
N intake (g N/ kg BW 0.75)
% sy
nthe
size
d ur
ea r
eent
erin
g G
IT

28
From a feedback perspective, urea metabolism can be represented by the
interaction of two main feedbacks (Figure 1.7). Recycling mechanisms are positive
feedbacks. In essence, an increase in urea pool size increases the amount of N that is
recycled back to the GIT, which in turn increases the N returned to the body urea pool
size. Renal excretion is the main negative feedback that counterbalances the “build-
up” of N. When the urea pool increases, excretion increases, decreasing the urea pool.
Figure 1.7. Schematic representation of the main feedbacks included in urea
(NPN) metabolism. Arrows represent causal links between variables. The positive sign
at the arrowheads indicates that both variables have the same directionality, while the
negative sign indicates that as one of the variable increases, the dependent variable
decreases or vice versa. Positive and negative feedback loops are represented by
positive and negative signs within the semi-circle arrow.
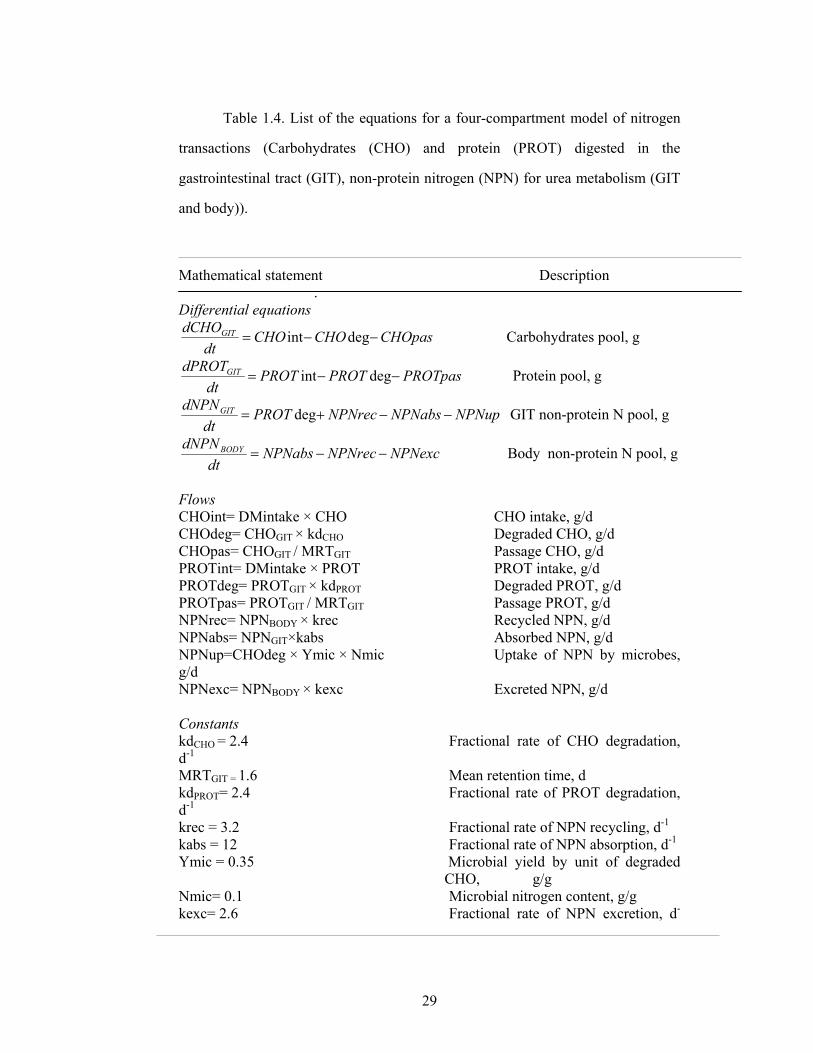
Table 1.4 summarizes the equations of a simple N compartmental model that
includes the feedbacks represented in Figure 1.7. Degraded CHO are used by microbes
with an efficiency Y. Protein degrades to ammonia, which is taken up by the microbes
or absorbed through the rumen wall.
Body NPN
Renal excretion
GastrointestinalNPN
-
+
- excretion
+
+
+ recycling
29
Table 1.4. List of the equations for a four-compartment model of nitrogen
transactions (Carbohydrates (CHO) and protein (PROT) digested in the
gastrointestinal tract (GIT), non-protein nitrogen (NPN) for urea metabolism (GIT
and body)).
Mathematical statement Description . Differential equations
CHOpasCHOCHOdt
dCHOGIT −−= degint Carbohydrates pool, g
PROTpasPROTPROTdt
dPROTGIT −−= degint Protein pool, g
NPNupNPNabsNPNrecPROTdt
dNPNGIT −−+= deg GIT non-protein N pool, g
NPNexcNPNrecNPNabsdt
dNPNBODY −−= Body non-protein N pool, g
Flows CHOint= DMintake × CHO CHO intake, g/d CHOdeg= CHOGIT × kdCHO Degraded CHO, g/d CHOpas= CHOGIT / MRTGIT Passage CHO, g/d PROTint= DMintake × PROT PROT intake, g/d PROTdeg= PROTGIT × kdPROT Degraded PROT, g/d PROTpas= PROTGIT / MRTGIT Passage PROT, g/d NPNrec= NPNBODY × krec Recycled NPN, g/d NPNabs= NPNGIT×kabs Absorbed NPN, g/d NPNup=CHOdeg × Ymic × Nmic Uptake of NPN by microbes, g/d NPNexc= NPNBODY × kexc Excreted NPN, g/d Constants kdCHO = 2.4 Fractional rate of CHO degradation, d-1 MRTGIT = 1.6 Mean retention time, d kdPROT= 2.4 Fractional rate of PROT degradation, d-1 krec = 3.2 Fractional rate of NPN recycling, d-1 kabs = 12 Fractional rate of NPN absorption, d-1 Ymic = 0.35 Microbial yield by unit of degraded
CHO, g/g Nmic= 0.1 Microbial nitrogen content, g/g kexc= 2.6 Fractional rate of NPN excretion, d-
30
The model in Table 1.4 assumes that gastrointestinal NPN pool size determines
the amount of NPN excreted or recycled. Therefore, the NPN flows are represented as
linear functions of body NPN pool size with constant transfer rates (Table 1.4.). For a
model with this structure, the resultant open-loop gains are the same independently of
the initial values used to determine the gain (Milhorn, 1966). Opening the recycling
feedback in the NPNGIT pool (NPNGIT : NPNabs: NPNBODY:NPNrec:NPN GIT), the
open gain of the recycling loop is 38.4. For the renal excretion feedback, the open gain
is -2.6. The strength of the loops remains constant, and thus a re-partition of the flows
between GIT and kidney as displayed in Figure 1.6 can not occur, which suggests that
factors other than urea pool size mediate the process.
Mazanov and Nolan (1976) developed first-order linear models of N
metabolism for sheep. They concluded that dynamics of N metabolism in sheep were
adequately described by constant first-order kinetics. However, the body N pool and
flows such as N body losses and recycling were not well represented, and the data
were limited to mature sheep fed forage diets. The authors did acknowledge that
variable-coefficient models would be more appropriate in representing N transactions.
1. 3. 3. Renal urea excretion
Clearance of a substance from the body is defined as the volume of distribution
that is completely cleared per unit of time (Koeppen and Stanton, 1997). The volume
of distribution of the urea is the total body water since urea is rapidly distributed
throughout this water pool (Visek, 1968). Urea is freely filtered at the glomerulus and
partly reabsorbed at the collective tube and renal pelvis (Cirio and Boivin, 1990).
Therefore, renal urea clearance can be described as a function of the glomerular
filtration rate (GFR, L/d) and its partial reabsorption at the tubular level (cr, coefficient
of reabsorption) (Koeppen and Stanton, 1997), with the following equation,

31
Renal clearance (L/d) = (1- cr) × GFR [1.4]
The renal urea excretion (g/d) then can be then calculated as renal urea
clearance (L/d) times blood urea concentration (g/L).
The first step in the formation of urine is the production of an ultrafiltrate in
the plasma by the glomerulus. The concentrations of non-protein solutes are similar in
the plasma and in the ultrafiltrate (Koeppen and Stanton, 1997). Glomerular filtration
rate can be determined by the clearances of inulin or creatinine, because these
compounds are not subject to reabsorption or active excretion after their filtration
(Koeppen and Stanton, 1997). The renal responses that have been described with the
feeding of low protein diets include decreased renal plasma flow and GFR (Cirio and
Boivin, 1990, Tebot, et al., 2002). However, over a wider range of N intakes, GFR
was not significantly related to N intakes (Delaquis and Block, 1995a, Delaquis and
Block, 1995b, Maltz and Silanikove, 1996, Marini, et al., 2004a, Marini and Van
Amburgh, 2003, Thornton, 1970, Valadares, et al., 1999). Glomerular filtration rate
and renal plasma flow are normally held within a narrow range by a process called
autoregulation (Koeppen and Stanton, 1997). Two mechanisms are responsible for this
autoregulation: one that responds to changes in arterial pressure (myogenic
mechanism), and one that responds to changes in the flow rate of tubular fluid
(tubuloglomerular feedback) (Koeppen and Stanton, 1997).
Urea reabsorption is mediated through facilitated and active transporters
(Sands, 2003). For growing animals, the coefficient of reabsorption (estimated from
the ratio between creatinine and urea clearance) had a negative linear relationship with
N intake (expressed as percentage of BW0.75) (Figure 1.8). Regulated expression of
urea transporters is important to deal with varying protein intake (Bagnasco, 2005).
Responses to low protein diets include upregulation and increased expression of urea
transporters (Bagnasco, 2005).

32
Figure 1.8. Relationship between N intake and the ratio of urea:creatinine
clearance for growing animals (N= 22). Data from Boldizarova et al. (1999), Marini
and Van Amburgh (2003), Marini et al., (2004a), and Thornton (1970).
1.3.4. Gastrointestinal urea recycling.
Urea is recycled back to the GIT through all sections of the gut wall and saliva
(Lapierre and Lobley, 2001). Saliva and gut wall entry are controlled by different
mechanisms. The saliva urea entry depends on the saliva flow, which in turns depends
on the chewing activity of the animal (Beauchemin, 1991).
Urea entry through the GIT wall is not a simple function of body urea pool size
(Egan, et al., 1986). Earlier studies in which urea was infused intravenously and then
changes in rumen ammonia concentration (RAN) were measured, found that RAN
0 0.5 1 1.5 2 2.5 3 3.50
0.2
0.4
0.6
0.8
1
N intake (g/d kg0.75)
Rat
io u
rea:
crea
tinin
e cl
eara
nce
y= -0.2118x -0.7613R2= 0.80RMSE= 0.1002
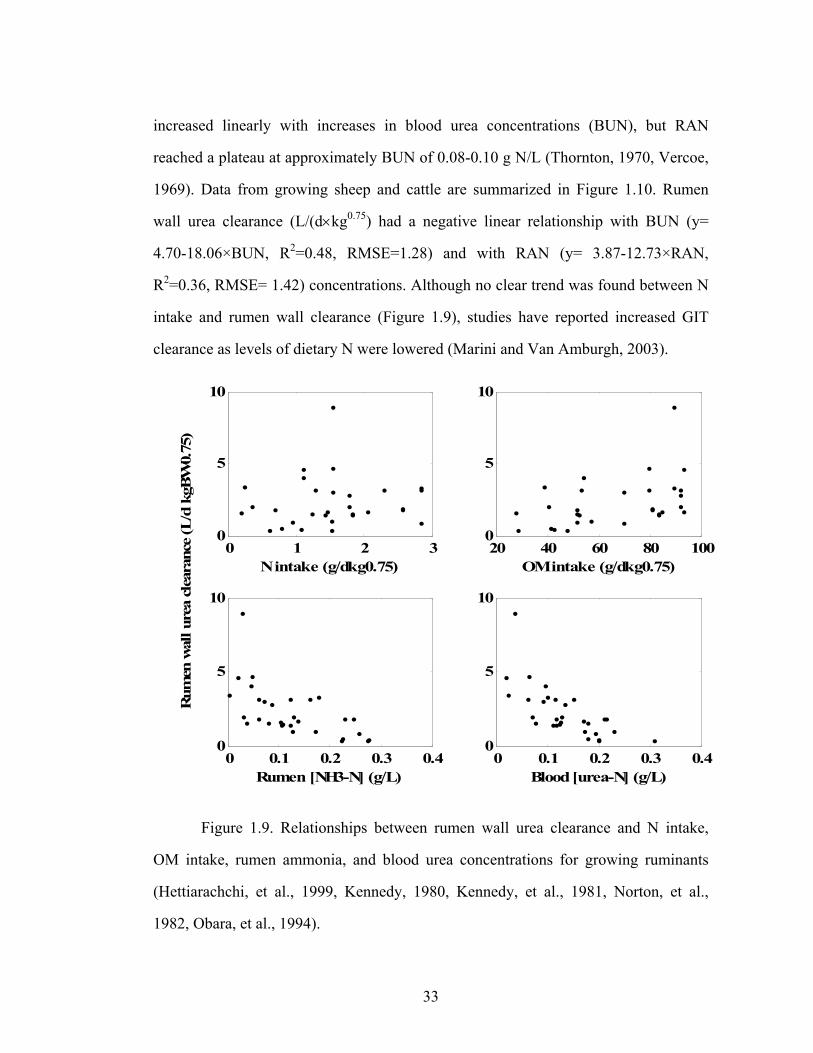
33
increased linearly with increases in blood urea concentrations (BUN), but RAN
reached a plateau at approximately BUN of 0.08-0.10 g N/L (Thornton, 1970, Vercoe,
1969). Data from growing sheep and cattle are summarized in Figure 1.10. Rumen
wall urea clearance (L/(d×kg0.75) had a negative linear relationship with BUN (y=
4.70-18.06×BUN, R2=0.48, RMSE=1.28) and with RAN (y= 3.87-12.73×RAN,
R2=0.36, RMSE= 1.42) concentrations. Although no clear trend was found between N
intake and rumen wall clearance (Figure 1.9), studies have reported increased GIT
clearance as levels of dietary N were lowered (Marini and Van Amburgh, 2003).
Figure 1.9. Relationships between rumen wall urea clearance and N intake,
OM intake, rumen ammonia, and blood urea concentrations for growing ruminants
(Hettiarachchi, et al., 1999, Kennedy, 1980, Kennedy, et al., 1981, Norton, et al.,
1982, Obara, et al., 1994).
0 1 2 30
5
10
N intake (g/dkg0.75)
Rum
en w
all u
rea
clea
ranc
e (L
/d k
gBW
0.75
)
20 40 60 80 1000
5
10
OM intake (g/dkg0.75)
0 0.1 0.2 0.3 0.40
5
10
Rumen [NH3-N] (g/L)0 0.1 0.2 0.3 0.4
0
5
10
Blood [urea-N] (g/L)

34
Organic matter intake also had a positive linear relationship with rumen wall
urea clearance (Figure 1.9, y= 0.035 × OM intake, R2= 0.19, RMSE= 1.6). Organic
matter fermentability may increase rumen urea transfer through multiple mechanisms
(Figure 1.10). The volatile fatty acids produced during fermentation may have a direct
effect on the permeability of the rumen wall to urea. Feeding highly fermentable diets
is related to increased number and size of rumen wall papillae, and therefore, greater
surface area, and to an increase in the surface area of the epithelial capillary network
(Remond, et al., 1996). Highly fermentable diets may affect rumen wall clearance
indirectly by decreasing RAN; Volatile fatty acids also facilitate ammonia absorption
(Bodeker, et al., 1992), because ammonia assimilation is facilitated as the high affinity
ammonia assimilation system, which permits ammonia uptake at very low RAN
concentrations, and requires ATP (Nolan, 1993).
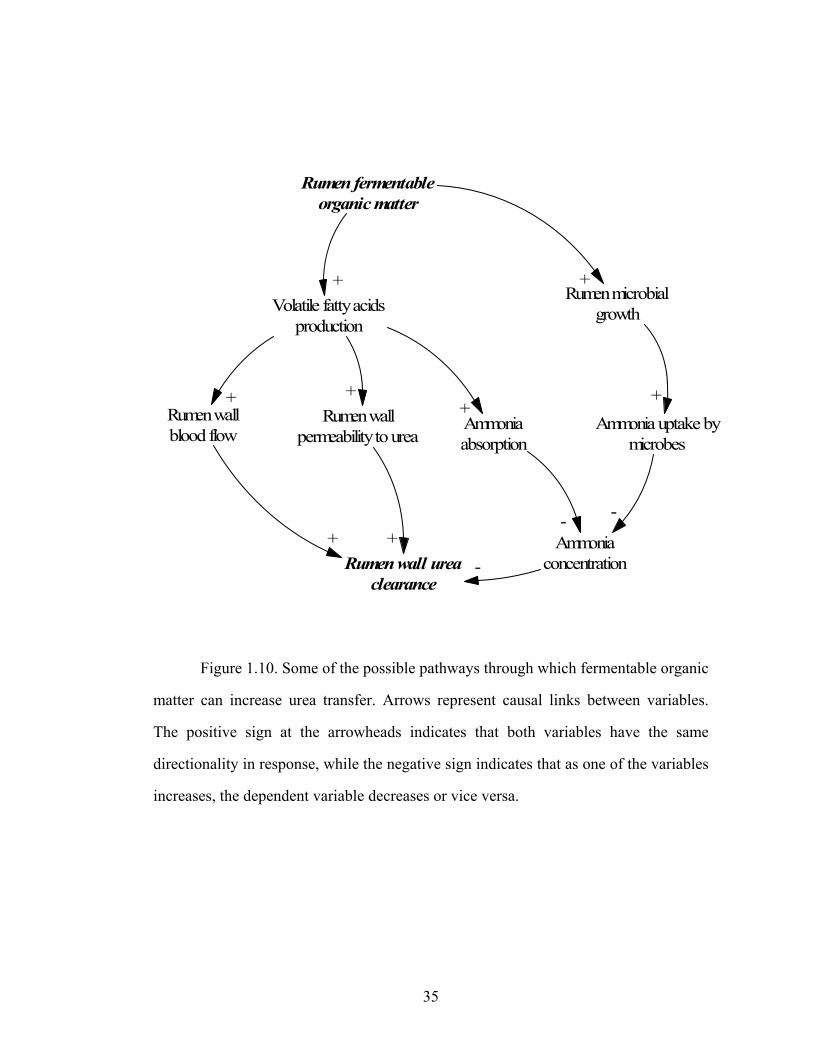
35
Figure 1.10. Some of the possible pathways through which fermentable organic
matter can increase urea transfer. Arrows represent causal links between variables.
The positive sign at the arrowheads indicates that both variables have the same
directionality in response, while the negative sign indicates that as one of the variables
increases, the dependent variable decreases or vice versa.
Rumen fermentableorganic matter
Rumen microbialgrowth
Ammonia uptake bymicrobes
Volatile fatty acidsproduction
Rumen wallblood flow
Rumen wallpermeability to urea
Rumen wall ureaclearance
Ammoniaabsorption
Ammoniaconcentration
+
+ ++
+ +-
-
+
+
-
36
1. 3. 5. Efficiency of use of recycled nitrogen
In lactating dairy cows, endogenous urea contributed 37.5 % to the bacterial N
reaching the duodenum when fed a high-grain diet, and 12.7 % when fed a high-forage
diet (Al-Dehneh, et al., 1997). Efficiency of N cycling depends on several factors
including:
(1) The residence time of N in the system; urea-N molecules can be recycled
to the gut multiple times, and therefore increasing the probability of microbial capture
(Lapierre and Lobley, 2001).
(2) The amount and availability of required microbial nutrients nutritional
other than ammonia, including amino-N. Although mixed ruminal bacteria have no
absolute amino acid requirements (Virtanen, 1966), it is well established that
providing amino-N can stimulate microbial growth (Russell, et al., 1989). In vitro
batch fermentations have shown that the uptake and incorporation of amino-N to
microbial cells was linearly related to the relative availability of amino-N (Atasoglu, et
al., 1999) . Supplementation of true protein as RDP has either increased (Hume, 1970)
or not changed microbial yields (Rooke, et al., 1987). Van Kessel and Russell (1996)
demonstrated that peptides and amino acids had little impact on the yield of CHO
limited, ammonia-excess cultures, but they improved the growth rate and yield under
excess-energy conditions. Amino-N helps to match anabolic and catabolic rates,
decreasing the loss of ATP in energy-spilling reactions (Russell, 1993, VanKessel and
Russell, 1996). While the incorporation of amino-N is linearly related to its
availability, the amount and the type of the responses to supplemented amino-N are
not well defined.
(3) The proportion of N attributed to cycling.
37
(4) Spatial compartmentalization of the rumen. While the urea recycled
through saliva may be well mixed at the rumen level, urea transfer through rumen wall
may be preferentially used by bacteria attached to the wall (Egan, et al., 1986).
1. 3. 6. Amino acids as a source of urea
Amino acids that are not used for protein synthesis are available as substrates
for urea synthesis. Amino acid catabolism includes the catabolism of AA for synthesis
of non-protein compounds (e.g. transmethylation reactions, glucose synthesis) and the
removal of AA in excess of the animal needs (Bequette, 2003). With the exception of
branched chain amino acids, the liver is the main site of amino acid catabolism. A
large proportion of the AA presented to the liver are re-circulated AA, and thus the
liver catabolizes non-utilized AA, maintaining the blood AA concentrations within
certain finites (Lobley, 2003). Estimates of whole body amino acid oxidation for dairy
cows have been obtained by using infusions of L[1-13C]leucine (Lapierre, et al., 2002,
Lapierre, et al., 2005) (Table 1. 5). Leucine oxidation was found to have a negative
linear relationship to leucine used in synthesis for milk protein, while the use for non-
milk protein synthesis was fairly constant (55.7 ± 4.05).
38
Table 1.5. Whole body leucine kinetics determined using constant infusions of
L[1-13C] leucine for lactating dairy cows (Lapierre, et al., 2002, Lapierre, et al.,
2005).
Lapierre et al. 2005 Lapierre et al. 2002
6 weeks lactation
25 weeks lactation
High MP2
Low MP
Production and nutrient
supply DMI intake, kg/d 25.4 25 17.8 18.1
N intake g/d 670 671 465 472 Milk kg/d 45.5 35.4 NR NR
Milk protein yield, kg/d 1.43 1.22 NR NR
Leucine kinetics, mmol/h Whole body ILR1 114.5 112.9 105.3 84.9
Oxidation 15.9 17.7 22.6 18.7 Synthesis 98.6 95.2 82.7 71.2
Milk protein output 44.3 38 22.3 20.3 Non-milk protein synthesis 54.3 57.2 60.4 50.9
1 IRL: Irreversible loss rate, 2 MP: Metabolizable protein, NR: not reported.
This literature review indicates much information is available that can be
incorporated into nutritional models to improve accuracy of formulating diets for
ruminants. Therefore the objectives of this Ph.D. thesis were to utilize published data
to: (1) develop and evaluate feed carbohydrate and protein fractionation schemes to
improve predictions of dietary supply of RDP and RUP and microbial protein supply,
and (2) conceptualize and develop a dynamic model of N fluxes in dairy cows that
characterizes the role of N excretion and recycling on N efficiency. The overall
objective was to improve the usefulness of nutritional models to accurately balance
diets for N.
39
CHAPTER 2
A REVISED CNCPS FEED CARBOHYDRATE FRACTIONATION SCHEME FOR
FORMULATING RATIONS FOR RUMINANTS2
2. 1. Abstract
Balancing ruminant diets for appropriate levels and types of dietary
carbohydrates (CHO) is necessary to maximize production while assuring the health of
the animals. Several feed fractions (i,e, volatile fatty acids (VFA), lactate, sugars,
starch) are now being measured in some commercial feed laboratories and this
information may assist in better formulating diets. A CHO fractionation scheme based
on ruminal degradation characteristics needed for nutritional models is described and
its impact on predictions with the Cornell Net Carbohydrate and Protein System
(CNCPS) is assessed. Dietary CHO are divided into eight fractions; the CA1 is
volatile fatty acids (VFA), CA2 is lactic acid, CA3 is other organic acids, CA4 is
sugars, CB1 is starch, CB2 is soluble fiber, CB3 is available neutral detergent fiber
(NDF), and CC is unavailable NDF. A Monte Carlo analysis was conducted with an
example lactating dairy cow ration to compare the original CNCPS CHO scheme (CA
= sugars and organic acids, CB1 = starch and soluble fiber, CB2 = available NDF, CC
= unavailable NDF) with the developed CHO scheme. A database was used to obtain
distributions and correlations of the feed inputs used in the schemes for the ingredients
of the ration (corn and grass silages, high moisture corn, soybean meal, and distillers’
grains). The CHO fractions varied in a decreasing order as VFAs, soluble fiber, lactic
2 Lanzas, C., C. J. Sniffen, S. Seo, L. O. Tedeschi, and D. G. Fox. 2006. A revised CNCPS feed carbohydrate fractionation scheme for formulating rations for ruminants. Anim. Feed Sci. Technol. In Press.

40
acid, sugar, NDF, starch, and total non-fiber carbohydrates (NFC). Use of the
expanded scheme in the CNCPS decreased the microbial CP production, which was
sensitive (standard regression coefficient in parenthesis) to corn silage starch (0.55),
grass silage NDF rate (0.46), high moisture corn grain starch rate (0.44), and corn
silage NDF rate (0.33). Predicted ruminal NFC digestibility remained similar. The
expanded CHO scheme provides a more appropriate feed description to account for
variation in changes in silage quality and diet NFC composition. However, to fully
account for differences in feed CHO utilization, further improvements in the
methodology used to estimate the fractions and their corresponding degradation rates,
inclusion of dietary factors in dry matter intake predictions, and prediction of ruminal
VFA production and pH are necessary.
2. 2. Introduction
Carbohydrates (CHO) are the largest component of rations for lactating dairy
cows, and can be partitioned into fiber (FC) and non-fiber carbohydrates (NFC). Fiber
CHO (i.e., hemicelluloses and celluloses) is the slowly digestible fraction of feeds that
occupies space in the gastrointestinal tract and fiber CHO associated with lignin resists
digestion and therefore does not contribute energy to the animal (Mertens, 1997).
Carbohydrates soluble in neutral detergent (ND) solution include organic acids,
monosaccharides, oligosaccharides, fructans, pectic substances, β-glucans and starch
(Hall, 2003). Balancing for an appropriate level and type of NFC is a major challenge
in ruminant ration formulation. Feeds vary widely in their amount and composition of
NFC, and CHO fractions in NFC differ in rate and extent of fermentation, products of
fermentation, and contribution to microbial CP production (Hall and Herejk, 2001,
Nocek and Tamminga, 1991), and therefore to animal performance. For example,
lactating dairy cows fed diets with by-product feeds high in soluble fiber and sugars
had decreased milk protein and increased milk fat yields (Leiva, et al., 2000,
41
Mansfield, et al., 1994) and lower N efficiency for milk production (Broderick and
Radloff, 2004) than those fed high starch diets. Ruminants fed high starch diets that
have increased metabolizable energy (ME) tend to have increased microbial amino
acid (AA) supply (Oba and Allen, 2003), but are more predisposed to suffer from
ruminal acidosis.
The Cornell Net Carbohydrate and Protein System (CNCPS) (Fox, et al., 2004)
accounts for effects of variation in feed CHO fractions in predicted feed ME supply,
rumen N, and AA balances when developing diets to meet cattle nutrient
requirements. Its current feed CHO fractionation scheme divides NFC into two
aggregated fractions; an A fraction, which includes organic acids and sugars and a B1
fraction, which includes soluble fiber and starch (Sniffen, et al., 1992). Several
limitations of this scheme have become apparent because these fractions are not
precisely defined or analyzed (Alderman, 2001, Offner and Sauvant, 2004, Pitt, et al.,
1996). It does not account for all of the variability observed in NFC digestibility when
various processing treatments are applied (Offner and Sauvant, 2004) . In addition, the
description and ruminal digestibility of the fraction containing starch and soluble fiber
were highlighted as an area that needed further improvement to accurately predict
ruminal VFA production and pH (Pitt, et al., 1996).
Our objectives are to describe a feed CHO fractionation scheme that classifies
CHO based on ruminal degradation characteristics and available analytical methods, to
evaluate its impact on CNCPS model behavior and sensitivity, and to discuss its
application in ruminant ration formulation.
2. 3. Material and methods
2.3.1 Feed carbohydrate fractionation schemes
2. 3. 1. 1. Original carbohydrate fractionation scheme
42
In the original CNCPS CHO fractionation scheme (Sniffen, et al., 1992), total
carbohydrate content in the jth feedstuff is estimated by difference;
CHOj = 1000- CPj – EEj – Ashj (g/kg DM) [2.1]
Where: Ashj is the mineral content of the jth feed, g/kg DM; CPj is the crude
protein content of the jth feed, g/kg DM ; and EEj is the ether extract content of the jth
feed, g/kg DM .
Carbohydrates are divided into FC and NFC, with FC defined as NDF. Within
FC, the indigestible fiber fraction (CC) is computed as;
CCj = (NDFj × Ligninj × 2.4) / 1000 (g/kg DM) [2.2]
Where: Ligninj is the lignin(sa) content of the jth feed, g/kg NDF; NDFj is the
NDF assayed with amylase and without sodium sulfite (aNDR) content of the jth feed,
g/kg DM;
The available FC (CB2) is computed as;
CB2j = NDFj – (NDICPj × CPj)/1000 - CCj (g/kg DM) [2.3]
Where: CCj is the indigestible carbohydrate content of the jth feed, g/kg DM;
CPj is the CP content of the jth feed, g/kg DM; NDFj is the aNDR content of the jth
feed, g/kg DM; and NDICPj is the ND insoluble CP content of the jth feed, g/kg CP.
Non-fiber carbohydrates are calculated by difference;
NFCj= CHOj – CB2j – CCj (g/kg DM) [2.4]
The NFC is divided into fractions CB1 and CA. The CB1 fraction represents
soluble fiber and starch, with its degradation rates ranging from 0.05 to 0.50/h.
Tabular values were provided for the soluble fiber (Sniffen, et al., 1992). The CA
fraction represents the rapidly fermented (1-3/h) water soluble CHO fraction, and is
calculated by difference;
CB1j=CB1NFCj × NFCj × 1000 (g/kg DM) [2.5]
CAj= NFCj-CB1j (g/kg DM) [2.6]
43
Where: CAj is the sugar content of the jth feed, g/kg DM; CB1j is the starch
and soluble fiber content of the jth feed, g/kg DM; CB1NFCj is the starch and soluble
fiber content of the jth feed, g/kg NFC, and NFCj is the non-fiber carbohydrate content
of the jth feed, g/kg DM.
The Cornell-Penn-Miner (CPM) dairy implementation of the CNCPS model
(Boston, et al., 2000) divided the NFC CA and CB1 fractions. The CA fraction was
separated into a silage acids fraction (CPM CA1, containing VFA and lactic acid) with
degradation rates of 0/h and a sugar fraction (CPM CA2) with degradation rates of 1-
3/h. The CB1 fraction was divided into starch (CPM CB1) and soluble fiber fractions
(CPM CB2, containing soluble fiber and organic acids). The CPM CB1 and CPM CB2
have identical degradation rates (0.05 to 0.50/ h).
2.3.1.2. New expanded carbohydrate fractionation scheme
Based on ruminal degradation characteristics and available analytical methods,
a new scheme, which further disaggregates the original CNCPS and CPM schemes,
was developed. Table 1 lists the equations of the new expanded carbohydrate scheme.
Table 2.1. List of the equations for the expanded carbohydrate fractions (g/kg
DM)
Fraction Description Equation CHO Total carbohydrates 1000- CPj- EEj- Ashj CC Indigestible fiber (NDFj × Ligninj × 2.4)/1000 CB3 Digestible fiber NDFj – (NDICPj × CPj)/1000 - CCj NFC Non fiber carbohydrates CHOj- CB3j-CCj CA1 Volatile fatty acids Aceticj + Propionicj + Butyricj + Isobutyricj CA2 Lactic acid Lacticj CA3 Organic acids Organicsj CA4 Sugars Sugarj CB1 Starch Starchj CB2 Soluble fiber NFCj – CA1j – CA2j- CA3j- CA4j- CB1j
44
In the expanded CHO fractionation scheme, CHO and CC fractions are
calculated as described in equations 2.1 and 2.2. The available FC (CB2, eq. 2.3) was
renamed from CB2 to CB3, since the CB1 (eq. 2.5) is divided into starch (CB1) and
soluble fiber (CB2). Similar to equations 2.3 and 2.4, available NDF and NFC are
computed as;
CB3j = NDFj – (NDICPj × CPj)/1000 - CCj (g/kg DM) [2.7]
NFCj= CHOj – CB3j – CCj (g/kg DM) [2.8]
The CA (eq. 2.6) is divided into 4 fractions; volatile fatty acids (VFA) (CA1),
lactic acid (CA2), other organic acids (CA3), and sugars (CA4). Although organic
acids (CA1, CA2, and CA3) are not carbohydrates, they are included in the
carbohydrate fractions because they are judged to be more closely related to
carbohydrates than to fat or protein. Fraction CA1 represents VFA;
CA1j= Aceticj + Propionicj + Butyricj + Isobutyricj (g/kg DM) [2.9]
Where: Aceticj is the acetic acid content of the jth feed, g/kg DM ; Propionicj is
the propionic content of the jth feed, g/kg DM ; Butyricj is the butyric acid content of
the jth feed, g/kg DM; Isobutyricj is the isobutyric acid content of the jth feed, g/kg
DM.
The VFA can represent up to 60 g/kg of DM of the silages (McDonald, et al.,
1991). Volatile fatty acids, which are end-products of fermentation, are not sources of
energy for rumen microorganisms. Therefore, their ruminal degradation rates and
maximum rumen microbial growth yield (Yg) are 0.
The fraction CA2 represents lactic acid;
CA2j = Lacticj (g/kg DM) [2.10]
In fermented feeds, lactic acid is the predominant organic acid, which can be
present at 50-150 g/kg DM (McDonald, et al., 1991). In addition to ensiled feeds,
lactic acid may be also present in molasses (Table 2. 2) from degradation of invert
45
sugar, but also includes malic, citric, fumaric and oxalic acids (Amin, 1980). Lactic
acid is mainly converted to acetate and propionate in the rumen, with no direct
contribution to glucose flux in the animal (Gill, et al., 1986). Based on gas production
measurements, the ruminal degradation rate of lactic acid was measured to be 0.07 /h
(Molina, 2002). The CNCPS uses a theoretical Yg of 50 g of microbial cells for 100 g
of CHO fermented, or 0.55 mole of hexose fermented (Isaacson, et al., 1975), which
assumes approximately 3.63 moles of ATP per mole of hexose, and an ATP yield of
25 g of cells per mole. However, lactic acid supplies less ATP per mole than CHO.
For lactic acid, the Yg was set to 10.8 g cells for 100 g of lactic acid because it was
assumed that, on average, 0.65 mole/mole of lactic acid is fermented via the acrylate
pathway, which provides 0.33 mole of ATP per mole of lactate and the remaining is
fermented mainly through the succinate-propionate pathway, which yields 0.5 mole of
ATP per mole of lactate (Counotte, et al., 1981). The Yg is then decreased by 20 % to
account for protozoa predation (Russell, et al., 1992).
The fraction CA3 represents organic acids other than lactic acid;
CA3j = Other Organicsj (g/kg DM) [2.11]
Organic acids other than lactic and VFA are almost undetectable in silages
(McDonald, et al., 1991), but in fresh forages, citric, malic, and aconitic acids can
comprise more than 100 g/kg of the forage DM (Dijkshoorn, 1973). Acetate is the
primary fermentation product from organic acids (Russell and Van Soest, 1984).
Based on gas production measurements, the ruminal degradation rate for organic acids
was set to 0.05 /h (Molina, 2002), less ATP per mole than CHO and lactic acid. For
the CA3 fraction, the Yg was set to 3.5 g cells for 100 g of organic acids based on the
average yields for malic acid (Dimroth and Schink, 1998) and citric acid (Gottschalk,
1986).
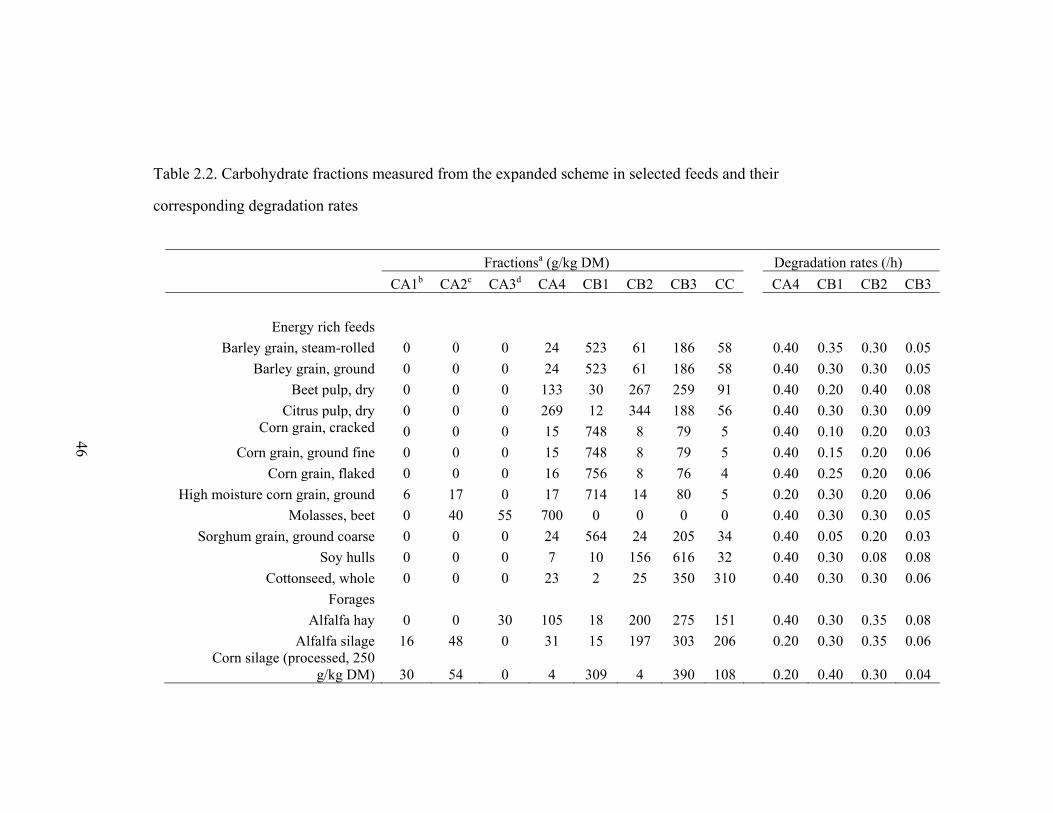
Table 2.2. Carbohydrate fractions measured from the expanded scheme in selected feeds and their
corresponding degradation rates
Fractionsa (g/kg DM) Degradation rates (/h) CA1b CA2c CA3d CA4 CB1 CB2 CB3 CC CA4 CB1 CB2 CB3
Energy rich feeds Barley grain, steam-rolled 0 0 0 24 523 61 186 58 0.40 0.35 0.30 0.05
Barley grain, ground 0 0 0 24 523 61 186 58 0.40 0.30 0.30 0.05 Beet pulp, dry 0 0 0 133 30 267 259 91 0.40 0.20 0.40 0.08
Citrus pulp, dry 0 0 0 269 12 344 188 56 0.40 0.30 0.30 0.09 Corn grain, cracked 0 0 0 15 748 8 79 5 0.40 0.10 0.20 0.03
Corn grain, ground fine 0 0 0 15 748 8 79 5 0.40 0.15 0.20 0.06 Corn grain, flaked 0 0 0 16 756 8 76 4 0.40 0.25 0.20 0.06
High moisture corn grain, ground 6 17 0 17 714 14 80 5 0.20 0.30 0.20 0.06 Molasses, beet 0 40 55 700 0 0 0 0 0.40 0.30 0.30 0.05
Sorghum grain, ground coarse 0 0 0 24 564 24 205 34 0.40 0.05 0.20 0.03 Soy hulls 0 0 0 7 10 156 616 32 0.40 0.30 0.08 0.08
Cottonseed, whole 0 0 0 23 2 25 350 310 0.40 0.30 0.30 0.06 Forages
Alfalfa hay 0 0 30 105 18 200 275 151 0.40 0.30 0.35 0.08 Alfalfa silage 16 48 0 31 15 197 303 206 0.20 0.30 0.35 0.06
Corn silage (processed, 250 g/kg DM) 30 54 0 4 309 4 390 108 0.20 0.40 0.30 0.04
46
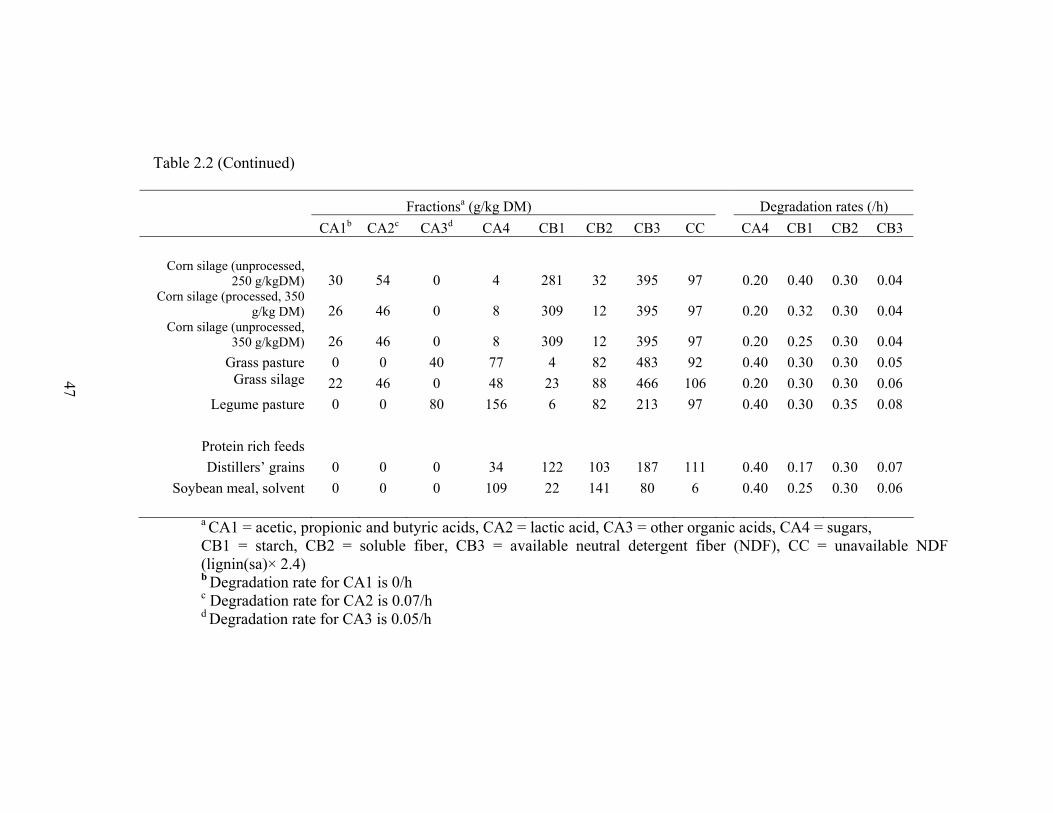
Table 2.2 (Continued)
Fractionsa (g/kg DM) Degradation rates (/h) CA1b CA2c CA3d CA4 CB1 CB2 CB3 CC CA4 CB1 CB2 CB3
Corn silage (unprocessed, 250 g/kgDM) 30 54 0 4 281 32 395 97 0.20 0.40 0.30 0.04
Corn silage (processed, 350 g/kg DM) 26 46 0 8 309 12 395 97 0.20 0.32 0.30 0.04
Corn silage (unprocessed, 350 g/kgDM) 26 46 0 8 309 12 395 97 0.20 0.25 0.30 0.04
Grass pasture 0 0 40 77 4 82 483 92 0.40 0.30 0.30 0.05 Grass silage 22 46 0 48 23 88 466 106 0.20 0.30 0.30 0.06
Legume pasture 0 0 80 156 6 82 213 97 0.40 0.30 0.35 0.08
Protein rich feeds Distillers’ grains 0 0 0 34 122 103 187 111 0.40 0.17 0.30 0.07
Soybean meal, solvent 0 0 0 109 22 141 80 6 0.40 0.25 0.30 0.06
a CA1 = acetic, propionic and butyric acids, CA2 = lactic acid, CA3 = other organic acids, CA4 = sugars, CB1 = starch, CB2 = soluble fiber, CB3 = available neutral detergent fiber (NDF), CC = unavailable NDF (lignin(sa)× 2.4) b Degradation rate for CA1 is 0/h c Degradation rate for CA2 is 0.07/h
d Degradation rate for CA3 is 0.05/h
47

48
The fraction CA4 includes monosaccharides, disaccharides, and
oligosaccharides;
CA4j= Sugarsj (g/kg DM) [2.12]
The predominant sugars in feeds are glucose, fructose and sucrose (Knudsen,
1997, Van Soest, 1994). Sucrose is the most common sugar, is the principal means of
transport in plants and can be stored as a reserve in feeds such as sugar beets (Van
Soest, 1994). In legume seeds, raffinose and stachyose represent an important
proportion of sugars (Knudsen, 1997). Sugars produce similar amounts of propionate
and higher levels of butyrate than starch and, at low pH, produce more lactate than
starch (Strobel and Russell, 1986). Using gas production measurements, Molina
(2002) reported fermentation rates of 0.40/h for glucose and 0.16/h for arabinose when
fermented with a fiber source. As five carbon sugars support less microbial growth
than hexoses (Strobel and Russell, 1986), and based on the composition of the sugar
fraction in feeds and their ability to support microbial growth, degradation rates for
feeds containing mainly sucrose were set at 0.40/h for the sugar fraction (Molina,
2002), but for milk derived products the assigned degradation rate for sugars is 0.30/h
as lactose support less microbial growth than sucrose (Bond, et al., 1998, McCormick,
et al., 2001). For silages, with the exception of immature corn silages, the sugar
fraction does not contain unfermented sugars, in favor of arabinose and other simple
sugars derived from the hydrolysis of the side chains of pectin and hemicelluloses
(Dewar, et al., 1963, Jones, et al., 1992). Thus, a rate of 0.20/h, closer to the arabinose
fermentation rate was assigned to the sugar fraction of silages.
The fraction CB1 represents starch;
CB1j= Starchj (g/kg DM) [2.13]
Starch degradability varies depending on the particle size, grain type,
processing effect and preservation method (Offner, et al., 2003). Ruminal degradation
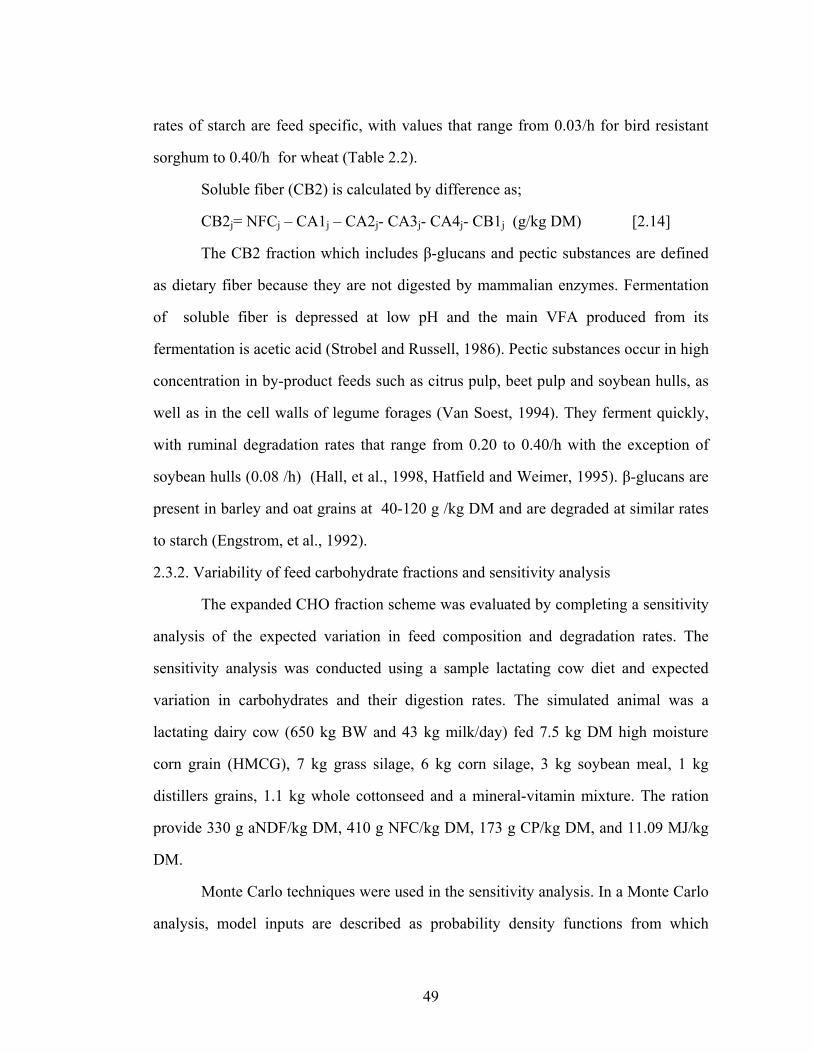
49
rates of starch are feed specific, with values that range from 0.03/h for bird resistant
sorghum to 0.40/h for wheat (Table 2.2).
Soluble fiber (CB2) is calculated by difference as;
CB2j= NFCj – CA1j – CA2j- CA3j- CA4j- CB1j (g/kg DM) [2.14]
The CB2 fraction which includes β-glucans and pectic substances are defined
as dietary fiber because they are not digested by mammalian enzymes. Fermentation
of soluble fiber is depressed at low pH and the main VFA produced from its
fermentation is acetic acid (Strobel and Russell, 1986). Pectic substances occur in high
concentration in by-product feeds such as citrus pulp, beet pulp and soybean hulls, as
well as in the cell walls of legume forages (Van Soest, 1994). They ferment quickly,
with ruminal degradation rates that range from 0.20 to 0.40/h with the exception of
soybean hulls (0.08 /h) (Hall, et al., 1998, Hatfield and Weimer, 1995). β-glucans are
present in barley and oat grains at 40-120 g /kg DM and are degraded at similar rates
to starch (Engstrom, et al., 1992).
2.3.2. Variability of feed carbohydrate fractions and sensitivity analysis
The expanded CHO fraction scheme was evaluated by completing a sensitivity
analysis of the expected variation in feed composition and degradation rates. The
sensitivity analysis was conducted using a sample lactating cow diet and expected
variation in carbohydrates and their digestion rates. The simulated animal was a
lactating dairy cow (650 kg BW and 43 kg milk/day) fed 7.5 kg DM high moisture
corn grain (HMCG), 7 kg grass silage, 6 kg corn silage, 3 kg soybean meal, 1 kg
distillers grains, 1.1 kg whole cottonseed and a mineral-vitamin mixture. The ration
provide 330 g aNDF/kg DM, 410 g NFC/kg DM, 173 g CP/kg DM, and 11.09 MJ/kg
DM.
Monte Carlo techniques were used in the sensitivity analysis. In a Monte Carlo
analysis, model inputs are described as probability density functions from which

50
samples are drawn to drive the model and derive probabilities of possible model
solutions (Law and Kelton, 2000). The Monte Carlo analysis was done with @Risk
version 4.5 (Palisade Corp., Newfield, NY, USA) in a spreadsheet version of the
CNCPS (Fox, et al., 2004). In order to describe feed composition as distributions, a
database provided by a commercial laboratory (Dairy One, Ithaca, NY, USA) was
used. All feeds were analyzed by ‘wet’ chemistry. For starch analysis, a pre-extraction
for sugar was completed and a glucose oxidase-peroxidase assay combined with a
peroxide-detecting probe (YSI Incorporated, Yellow Springs, OH, USA) was used.
For sugars, a water extraction method was used (Hall, et al., 1999). Feed composition
data were fit to a normal distribution. When feed inputs were not statistically normal,
the distribution with the best fit to the data was assigned (Table 2.3). Goodness of fit
was assessed with several statistics (Chi-squared, Kolmogorov-Smirnov and
Anderson-Darling statistical tests) and graphical methods (distribution function
differences plots and probability plots) (Law and Kelton, 2000). Minimum and
maximum values in the database were used to truncate distributions and a correlation
matrix was incorporated to account for correlation among inputs within feeds when
sampling (Table 2. 4). For degradation rates, a normal distribution with a SD
proportional to their mean was used to account for variability in the rates estimates
increases as the mean value increases (Weiss, 1994).
Several sampling techniques that are suitable for Monte Carlo simulation are
available (McKay, et al., 1979). The sampling technique chosen for drawing samples
from the distribution was the Latin Hypercube, in which the probability density
function is divided into intervals of equal probability and from each interval a sample
is randomly taken (McKay, et al., 1979). Sampling is forced to represent values at
each interval. Ten thousand samples for simulation were completed. For each

51
sampling, the same random numbers were used to simulate the model with the original
and expanded CHO schemes.
The sensitivity analyses are in table 2.6. Model predictions for metabolizable
protein (MP) from bacteria, and ruminal NFC digestibility were assessed using the
original and expanded CHO fractionation schemes. To assess the impact of feed
variability on the model outputs with the two schemes, Bonferroni confidence
intervals were computed for the mean and SD of the simulated outputs (Banks, et al.,
2004). In addition, a stepwise regression analysis was used to assess the strength of the
relationship between specific inputs and outputs. Standard regression coefficients
(SRC) were used to rank the inputs and provide a measure of importance based on the
effect of moving each variable away from its expected value by a fixed fraction of its
SD while retaining all other variables at their expected values (Helton and Davis,
2002).

Table 2.3. Means, coefficients of variation (CV), minimum, maximum and distribution of the feed composition (g/kg DM)
for the feeds used in the sensitivity analysis.
N Mean CV Minimum Maximum Distribution 1 Corn silage Ash 6292 44 25.8 12 196 Normal (44, 11) CP 8908 85 12.4 43 192 Loglogistic (21, 62, 11.3) NDICP 6018 14 23.9 5 58 Loglogistic (3, 11, 6.1) EE 6189 33 12.4 13 53 Normal (33, 4) aNDF 9678 441 13.4 281 743 Normal (441, 59) Lignin(sa) 6257 35 18.4 9 97 Loglogistic (3, 32, 9.3) Starch 6353 308 25.4 3 499 Weibull (8.9, 613) Sugar 6045 41 46.3 1 191 PearsonV (13.6, 747) Acetic acid 440 23 63.1 0 78 Beta general (1.7, 5.2) Propionic acid 440 4 130.0 0 31 Beta general (0.4, 4.4) Butyric acid 440 1 254.7 0 19 Exponential (0.7) Isobutyric acid 440 6 111.0 1 7 Lognormal (0.6, 0.6) Lactic acid 440 50 41.3 0 101 Normal (50, 21)
52

Table 2.3 (Continued)
N Mean CV Minimum Maximum Distribution1
Grass silage Ash 895 96 27.7 36 226 Loglogistic ( 14, 77, 5.7) CP 1385 144 26.7 24 292 Beta general (7.7, 11.7) NDICP 680 33 27.0 12 78 Lognormal (35, 9) EE 726 37 25.7 9 103 Normal ( 37, 10) aNDF 1384 584 11.9 397 818 Normal (584, 69) Lignin(sa) 728 69 24.5 19 174 Logistic (68, 9) Starch 681 24 62.9 1 104 Weibull (1.6, 28) Sugar 689 28 39.4 8 192 Lognormal (105, 28) Acetic acid 34 22 74.9 0 63 Loglogistic (-5, 22, 2.6) Propionic acid 34 2 128.5 0 8 Exponential (2) Butyric acid 34 4 132.1 0 19 Exponential (4) Isobutyric acid 34 1 112.0 0 5 Exponential (1) Lactic acid 34 47 56.8 1 111 Loglogistic (-131, 176, 11.6) High moisture corn grain Ash 1613 17 12.9 11 32 Loglogistic (5, 11, 9.8) CP 2166 97 10.7 67 149 PearsonV (53.5, 3874) NDICP 1575 8 23.4 2 19 Logistic (8, 1)
53
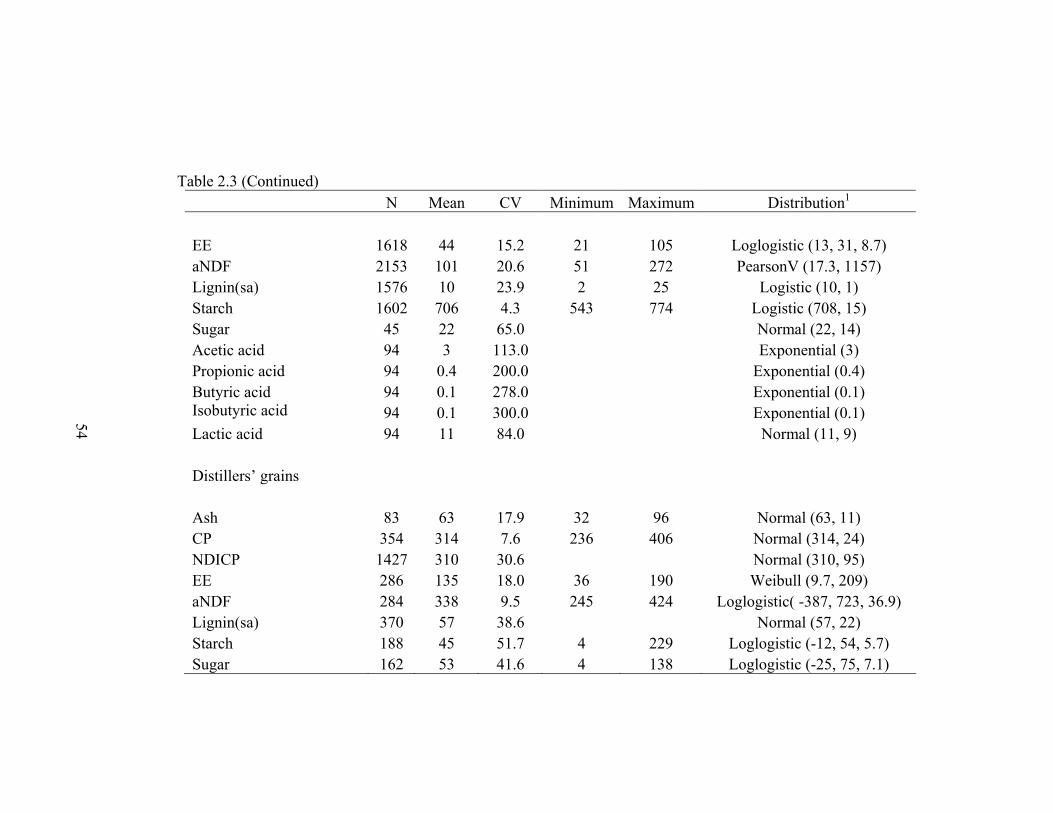
Table 2.3 (Continued)
N Mean CV Minimum Maximum Distribution1 EE 1618 44 15.2 21 105 Loglogistic (13, 31, 8.7) aNDF 2153 101 20.6 51 272 PearsonV (17.3, 1157) Lignin(sa) 1576 10 23.9 2 25 Logistic (10, 1) Starch 1602 706 4.3 543 774 Logistic (708, 15) Sugar 45 22 65.0 Normal (22, 14) Acetic acid 94 3 113.0 Exponential (3) Propionic acid 94 0.4 200.0 Exponential (0.4) Butyric acid 94 0.1 278.0 Exponential (0.1) Isobutyric acid 94 0.1 300.0 Exponential (0.1) Lactic acid 94 11 84.0 Normal (11, 9) Distillers’ grains Ash 83 63 17.9 32 96 Normal (63, 11) CP 354 314 7.6 236 406 Normal (314, 24) NDICP 1427 310 30.6 Normal (310, 95) EE 286 135 18.0 36 190 Weibull (9.7, 209) aNDF 284 338 9.5 245 424 Loglogistic( -387, 723, 36.9) Lignin(sa) 370 57 38.6 Normal (57, 22) Starch 188 45 51.7 4 229 Loglogistic (-12, 54, 5.7) Sugar 162 53 41.6 4 138 Loglogistic (-25, 75, 7.1)
54
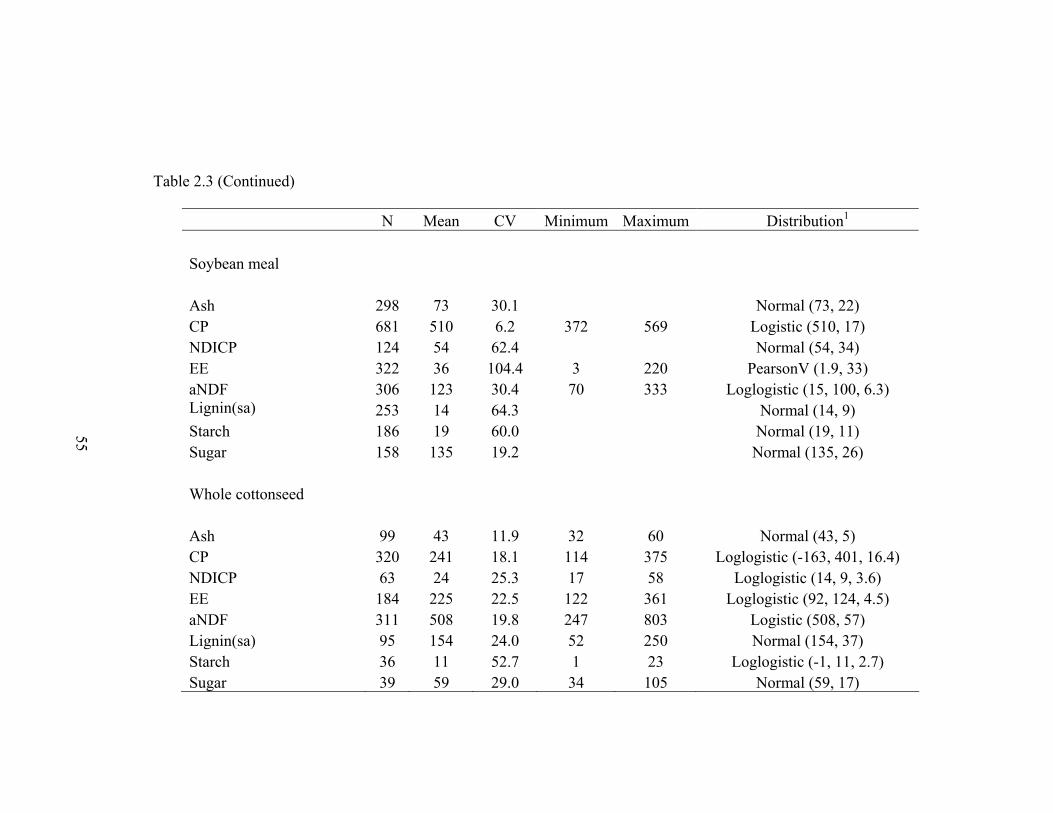
Table 2.3 (Continued)
N Mean CV Minimum Maximum Distribution1 Soybean meal Ash 298 73 30.1 Normal (73, 22) CP 681 510 6.2 372 569 Logistic (510, 17) NDICP 124 54 62.4 Normal (54, 34) EE 322 36 104.4 3 220 PearsonV (1.9, 33) aNDF 306 123 30.4 70 333 Loglogistic (15, 100, 6.3) Lignin(sa) 253 14 64.3 Normal (14, 9) Starch 186 19 60.0 Normal (19, 11) Sugar 158 135 19.2 Normal (135, 26) Whole cottonseed Ash 99 43 11.9 32 60 Normal (43, 5) CP 320 241 18.1 114 375 Loglogistic (-163, 401, 16.4) NDICP 63 24 25.3 17 58 Loglogistic (14, 9, 3.6) EE 184 225 22.5 122 361 Loglogistic (92, 124, 4.5) aNDF 311 508 19.8 247 803 Logistic (508, 57) Lignin(sa) 95 154 24.0 52 250 Normal (154, 37) Starch 36 11 52.7 1 23 Loglogistic (-1, 11, 2.7) Sugar 39 59 29.0 34 105 Normal (59, 17)
55
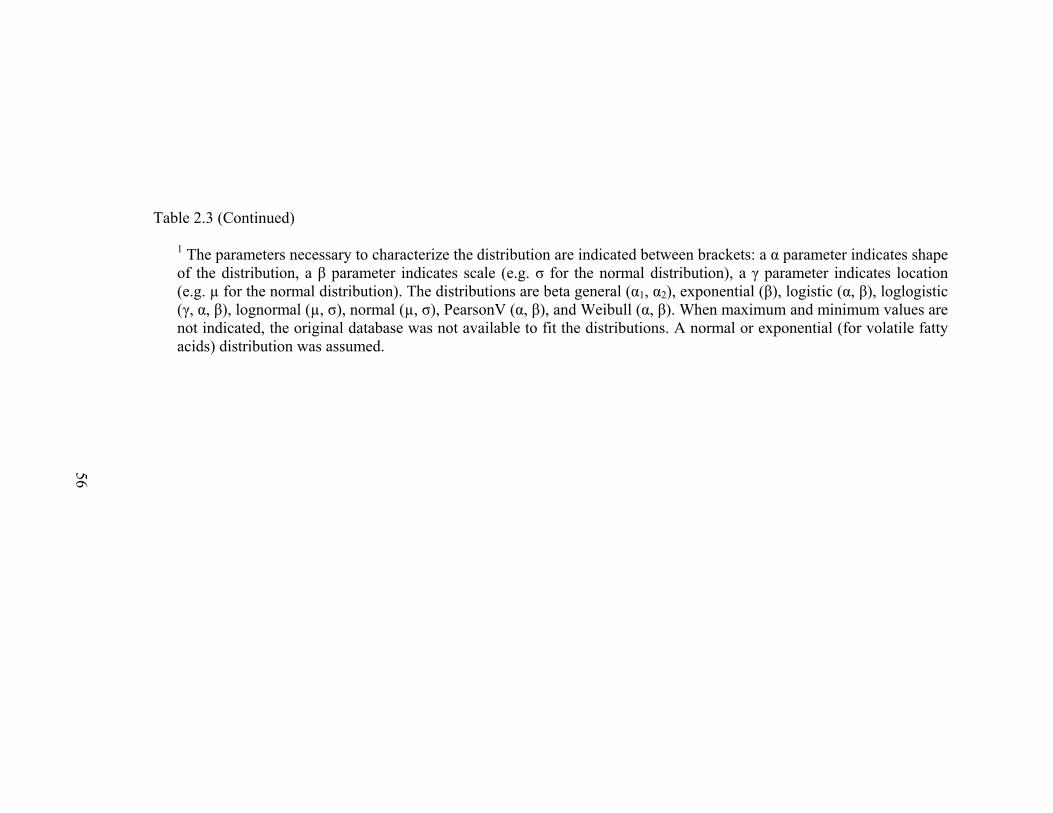
Table 2.3 (Continued)
1 The parameters necessary to characterize the distribution are indicated between brackets: a α parameter indicates shape of the distribution, a β parameter indicates scale (e.g. σ for the normal distribution), a γ parameter indicates location (e.g. µ for the normal distribution). The distributions are beta general (α1, α2), exponential (β), logistic (α, β), loglogistic (γ, α, β), lognormal (µ, σ), normal (µ, σ), PearsonV (α, β), and Weibull (α, β). When maximum and minimum values are not indicated, the original database was not available to fit the distributions. A normal or exponential (for volatile fatty acids) distribution was assumed.
56

Table 2.4. Correlation matrix (Spearman correlations) of the feed fractions for the feeds used in the sensitivity
analysis (P<0.05) [Blanks indicate no significant (i.e. P>0.05) correlations].
Corn silage
Ash CP NDICP EE aNDF Lignin(sa) Starch Sugar Acetic Propionic Butyric Iso
butyric Lactic Ash 1 0.38 0.38 -0.21 0.50 0.47 -0.61 0.14 0.29 0.24 0.24 CP 1 0.45 0.22 0.21 -0.40 0.16 0.21 NDICP 1 0.47 0.49 -0.49 0.24 0.27 -0.18 EE 1 -0.36 -0.22 0.31 -0.38 0.30 0.27 aNDF 1 0.64 -0.92 0.15 0.17 0.12 Lignin(sa) 1 -0.66 0.16 Starch 1 -0.27 -0.24 -0.25 Sugar 1 -0.39 -0.28 Acetic 1 0.65 0.10 Propionic 1 -0.21 Butyric 1 Isobutyric 1 -0.28 Lactic 1
57

Table 2.4. (Continued)
Grass silage Ash CP NDICP EE aNDF Lignin(sa) Starch Sugar Acetic Propionic Butyric Isobutyric Lactic Ash 1 0.59 0.25 0.36 -0.37 -0.28 -0.55 -0.27 0.49 0.49 0.42 0.45 CP 1 0.41 0.75 -0.8 -0.44 -0.19 0.48 NDICP 1 -0.21 0.15 EE 1 -0.67 -0.58 -0.10 0.48 0.79 aNDF 1 0.44 -0.20 -0.32 Lignin(sa) 1 -0.32 -0.58 Starch 1 0.43 -0.68 -0.59 Sugar 1 -0.49 -0.52 Acetic 1 0.60 Propionic 1 Butyric 1 0.74 Isobutyric 1 Lactic 1
58

Table 2.4. (Continued)
High moisture corn grain Ash CP NDICP EE aNDF Lignin(sa) Starch Sugar Ash 1 0.35 0.24 0.31 0.27 -0.10 -0.57 CP 1 0.24 0.52 0.10 -0.21 -0.32 NDICP 1 0.27 0.30 0.33 -0.13 EE 1 0.16 -0.29 -0.44 aNDF 1 0.21 -0.46 Lignin(sa) 1 Starch 1 Sugar 1 Distillers’ Grains
Ash CP NDICP EE aNDF Lignin(sa) Starch Sugar Ash 1 0.30 0.23 CP 1 0.26 -0.43 -0.16 NDICP 1 EE 1 0.13 -0.14 aNDF 1 -0.14 Lignin(sa) 1 Starch 1 Sugar 1
59
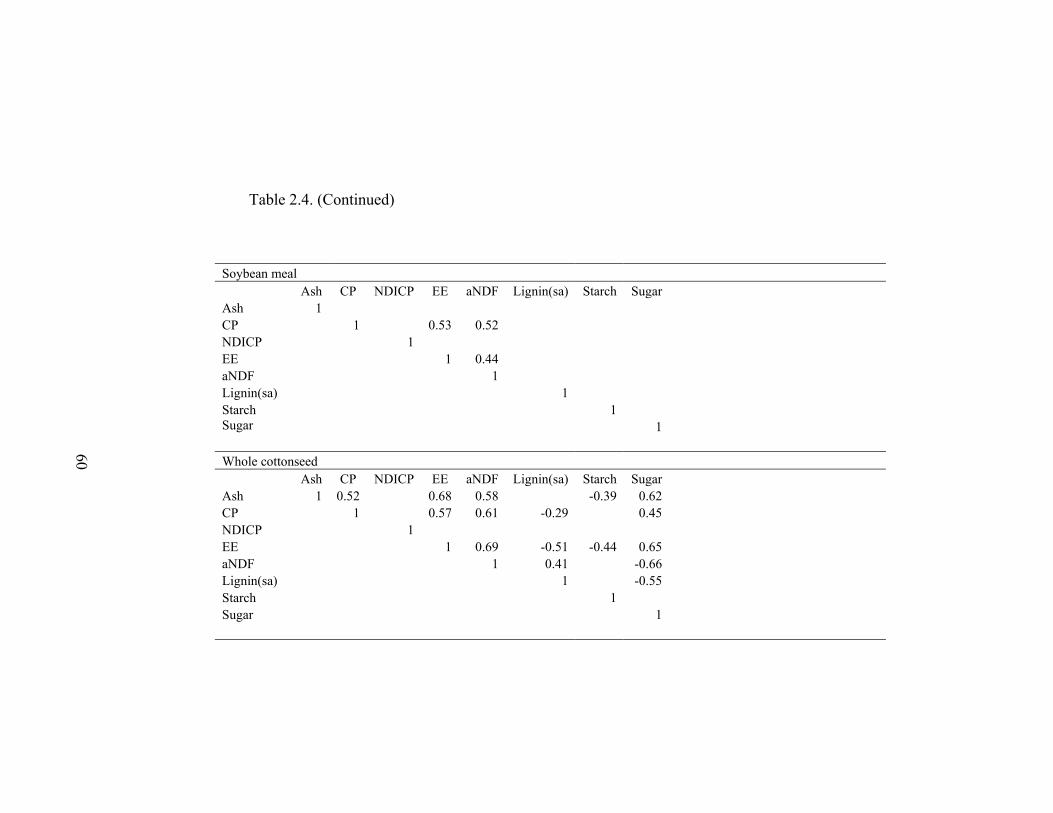
Table 2.4. (Continued)
Soybean meal Ash CP NDICP EE aNDF Lignin(sa) Starch Sugar Ash 1 CP 1 0.53 0.52 NDICP 1 EE 1 0.44 aNDF 1 Lignin(sa) 1 Starch 1 Sugar 1 Whole cottonseed Ash CP NDICP EE aNDF Lignin(sa) Starch Sugar Ash 1 0.52 0.68 0.58 -0.39 0.62 CP 1 0.57 0.61 -0.29 0.45 NDICP 1 EE 1 0.69 -0.51 -0.44 0.65 aNDF 1 0.41 -0.66 Lignin(sa) 1 -0.55 Starch 1 Sugar 1
60
61
2. 4. Results and discussion
2.4.1. Feed carbohydrate fractionation schemes and analytical methods
Table 2. 2 lists average CHO fractions for common feedstuffs. Volatile fatty
acids and lactic acid values for silages are currently available from fermentation
profiles offered by commercial laboratories. Dry matter content of the silages was a
poor predictor of total VFA content (Figure 2.1). The amount of DM in silage was
negatively, and exponentially, related to the amount of fermentation end products
during ensiling (Figure 2.1). Lactic acid content was positively, and linearly, related to
the amount of EE of grass silages (Lactic (g/kg DM) = 18.9 EE (g/kg DM) – 66.1, R2=
0.58, RMSE= 18.2) and legume silages (Lactic (g/kg DM) = 28.1 EE (g/kg DM) –
30.2, R2= 0.46, RMSE= 20.2). Both EE and lactic acid increased with the extent of
fermentation. For corn silages, both VFA’s and lactic acid were poorly related with
other feed fractions (Table 2.4) and DM (Figure 2.1).
Overall, the correlations among feed inputs were low or moderate (i.e., r <
0.70), (Table 2. 4), which prevents use of more common feed analyses, such as NDF
assays to predict fractions that are less commonly assayed, such as sugar contents. The
components with the highest correlation were the starch and aNDF contents of corn
silage, which were strongly linearly related (Starch (g/kg DM) = 845.4 – 12.1 NDF
(g/kg DM), R2= 0.84, RMSE= 31.1) due to the increase of grain content with plant
maturity.

62
150 200 250 300 350 400 450 500 550 600 6500
50
100
150
150 200 250 300 350 400 450 500 550 600 6500
50
100
150
Tota
l VFA
(g/1
000
g D
M)
150 200 250 300 350 400 450 500 550 600 6500
50
100
150
DM (g)
Corn silageVFA = 148.7exp(-0.0056DM)R2 = 0.16 RMSE= 16.7 g/1000 g DM
Grass silageVFA = 292.2exp(-0.0074DM)R2 = 0.50 RMSE= 14.0 g/1000 g DM
Legume silageVFA = 177.3exp(-0.0055DM)R2 = 0.34 RMSE= 16.5 g/1000 g DM
Figure 2.1. Relationship between total volatile fatty acids and dry matter of
corn silage (N = 440), grass silage (N=34), and legume silage (N= 131).

63
Organic acids are generally analyzed by gas or high-pressure liquid chromatography
(Amin, 1980, Russell and Van Soest, 1984) or can be estimated indirectly as NFC
minus ethanol insoluble residue (adjusted for CP) and sugar content (Hall, et al.,
1999). Because of difficulties in measuring organic acids as a group, model users will
have to rely on feed library values for the CA3 fraction more than for other fractions.
In the CPM dairy model, non-silage acids were included within the soluble fiber
fraction (CPM CB2), while we included the other organic acids as a separate fraction
to account for their fermentation characteristics. Although they provide some
fermentable energy, it is considerably less than the other components that were
included in the CPM soluble fiber fraction. Dicarboxylic acids (i.e., aspartate,
fumarate, and malate) stimulate lactate utilization by the predominant ruminal
bacteria, Selenomonas ruminantium (Evans and Martin, 1997, Martin and Streeter,
1995). In the feed library, the highest organic acid concentrations were allocated in
pastures and fresh forages (Table 2. 2); (Callaway, et al., 1997, Martin, 1970,
Mayland, et al., 2000). In forages, organic acids decline with maturity and age
(Martin, 1970). In silages, other organic acids were assumed to be degraded during
fermentation during ensiling (McDonald, et al., 1991), and therefore were assigned a
value of 0 (Table 2. 2).
The sugar fraction represents a heterogeneous fraction and most sugar
measurements in commercial laboratories are based on ethanol/water extractions
(Hall, 2003), which may extract different components depending on the proportion of
ethanol (Hall, et al., 1999, Smith and Grotelueschen, 1966), the standard used (e.g.,
glucose, fructose or sucrose) and the feedstuff matrix. Some of the differences in the
sugar composition have been accounted for by using different ruminal degradation
rates (Table 2). The proportion of ethanol used in the extraction may affect partition of
components between sugar and soluble fiber. For example, in temperate cool season
64
grasses, variable amounts of fructans are extracted depending on the ethanol
concentration (Smith and Grotelueschen, 1966). Fructans are classified as dietary fiber
since they are not digested by mammalian enzymes (Nilsson, et al., 1988). Even so,
the VFA profile of fructans is similar to sugars because sucrose is the precursor for
fructan synthesis (Marounek, et al., 1988, Pollock, 1986) and their release from the
plant cells is similar to that of free sugars (Boudon, et al., 2002). Therefore, in
predicting nutrient availability for ruminants, it may be more appropriate to associate
fructans with sugars rather than with soluble fiber.
In the expanded scheme, the soluble fiber fraction is calculated by difference.
Thus, it contains errors from other component assays. Knudsen (1997) measured β-
glucans, and other soluble polysaccharides, for selected energy and protein-rich
concentrate feeds. For cereal grains, values for soluble fiber calculated by difference
were similar to measured soluble fiber as the sum of β-glucans and other soluble
polysaccharides. For example, calculated and measured values for corn grain, barley
grain and wheat middlings were 8 vs 10, 73 vs 98, and 98 vs 97 g/kg DM,
respectively. For protein-rich feeds, calculated values were not consistently related to
measured values (e.g., soybean meal, 63 vs 141; cottonseed meal, 24 vs 18; linseed
meal, 521 vs 138; white lupins, 131 vs 134 g/kg DM, respectively). Several factors
may contribute to underprediction of the soluble fiber fraction (Eq. 14) for some feeds.
While VFA’s (CA1) are expressed on a DM basis, they are typically measured in
‘wet’ feeds because they are partly volatilized during oven drying. For acetic acid,
drying losses can be as high as 53 % for grass silages, and 83 % for corn silages
(Sorensen, 2004). This may especially contribute to the underprediction of CB2 in
legume silages because both CA1 and CB2 fractions can be a substantive proportion
of the CHO. Based on the assumption that protein contains 16 % N, the conversion
factor of 6.25 is used as an average to convert N into CP for all the feeds. However,

65
when non-protein compounds and variations in their AA composition are considered,
the conversion factor for most common feeds are consistently lower than 6.25
(e.g.,soybean meal, 5.49; barley, 5.17; fish meal, 4.75) (Boisen, et al., 1987). Ash
contamination may result in insoluble ash being recovered in aNDF, overpredicting
available FC. In contrast, over-estimation may result from correcting NDF assayed
with sodium sulfite in the ND for NDICP assayed without sodium sulfite in the ND.
The NDF method approved by the Association of Official Analytical Chemists
International (Mertens, 2002) uses sodium sulfite, which removes most N the
insoluble fiber. For most feeds, the difference in NDICP with and without sodium
sulfite is less than 10 g/kg DM, but, for protein-rich feeds, the difference can be as
high as 90 g/kg DM (Hintz, et al., 1996). The CB2 pool size was very sensitive to
NDICP adjustment for canola and sunflower meals, distillers’ grains and whole
soybean (results not shown). Correcting aNDF for NDICP and ash is the most
accurate way to estimate FC and NFC. However, because of the inconsistency of
method used to measure NDF among feed analysis laboratories, we assumed that the
NDICP fraction is in the NDF fraction.
2.4.2. Ruminal degradation rates and microbial yield
Although in vitro gravimetric and gas measurements have been extensively used
to measure degradation rates, no in vitro method has been proven to be appropriate to
measure rates in all CHO fractions. The rates used are a mixture of rates for
fermentation and hydrolysis. Rates for the CA2, CA3, and CA4 fractions have been
updated from data based on gas production measurements (Doane, et al., 1998,
Molina, 2002). Gas production systems can be used to determine rates of ruminal
fermentation. Sugars are the most rapidly degraded CHO, with rates of hydrolysis as
high as 10/h (Weisbjerg, et al., 1998). Despite their high rates of hydrolysis,
fermentation rates for sugars are several magnitudes lower (Van Kessel and Russell,

66
1997). Part of the discrepancy between hydrolysis and fermentation rates is because
sugars can be partially stored as microbial glycogen and used later for endogenous
metabolism (Van Kessel and Russell, 1997). Thus the rates for these fractions are
lower than the values for the A fraction in the original CNCPS scheme (Sniffen, et al.,
1992), which overpredicted fluctuations in ruminal pH (Pitt and Pell, 1997) and
microbial yield for the A fraction (Alderman, 2001).
Some of the starch degradation rates for the new scheme have also been
updated based on in vivo and in vitro data (Lanzas, 2003, Monteils, et al., 2002,
Remond, et al., 2004, Richards, et al., 1995, Tothi, et al., 2003, Yang, et al., 2000). In
contrast, in situ rates have not been used for the starch fraction because the in situ
method divides starch into a soluble fraction which is considered to be degraded
instantaneously and completely, and an insoluble fraction which is degraded
exponentially. As in situ results measure the digestion rate for the slowly degradable
pool, while starch in our fractionation scheme is treated as single fraction with a rate
for the entire degradable pool, values for the starch degradation rates (Table 2. 2) are
generally higher than those derived from in situ (Offner, et al., 2003). Because of
variability in starch degradation rates in feeds due to processing and starch sources,
starch degradation rates are feed specific and a method to estimate them routinely is
needed.
2. 4. 3. Variability of feed carbohydrate fractions
Table 2.3 lists the expected variation and probability density functions used to
describe the feeds used in the simulations. They represent variability within the
population of the feedstuff since they were derived from an extensive database, and
distributions for a large proportion of the feeds were not normal (Table 2.3).
In silages, sugars and VFAs were the fractions that varied the most as indicated
by their high coefficients of variations (Table 2.3). Distributions for corn silage sugars
67
and grass and corn silage VFA were not symmetrical in that some VFA had an
exponential distribution, in which the probability of a given value decreased as values
departed from 0, with a negative rate (Evans, et al., 2000). Ensiling adds variability to
the forage composition because it adds a wide range of factors, including forage
quality, silo type, particle size, packing and covering (McDonald, et al., 1991). In
addition, pre-harvest and weather conditions can affect forage quality. Although corn
silage starch and aNDF had symmetrical distributions (Table 2.3), both components
had long tails and a subpopulation of corn silages had low starch (< 150 g/kg) and
high fiber (>580 g/kg) contents. Drought conditions, or high plant densities, decreases
grain content to less than 270 g/kg of DM (Woody, 1978). High moisture corn grain
had the lowest nutrient variation of all the feeds. In by-product feeds and soybean
meal, the inputs with the largest variability are the nutrients influenced by processing.
For soybean meal, EE had the largest variation because of differences in oil extraction
(Table 2.3). For distillers’ grains, lignin(sa), sugar and NDICP were the fractions with
the largest variation due to differences in heat damage and content of solubles among
samples (Table 2.3).
When variability in feed inputs was considered in the simulated diet, the CHO
fractions varied in a decreasing order as: VFA’s, soluble fiber, lactic acid, sugar,
aNDF, starch, and total NFC (Table 2.5). Volatile fatty acids, soluble fiber and lactic
acids are small proportions of the total CHO. Variation in calculated NFC, CA and
CB1 fractions causes variation in the soluble fiber fraction. Feeds in the simulated diet
were generally low in soluble fiber, and it was sensitive to aNDF and CP content of
grass silage, since grass silage provided the greatest amount of CB2 of all the feeds in
the simulated diet. Variability in the sugar fraction was due mainly to variation in
sugar content of the silages (Table 2.5) and it may be a highly variable fraction among
dairy cattle diets. In fresh forages, the sugar fraction is a highly labile pool, which
68
accumulates and depletes through out the day (Pollock, 1986). In silages, sugar
fractions vary with the ensiling process (Table 2.6). Analytical variability may occur
due to differences in extraction conditions and methods used to analyze sugars (Hall,
2003). Although NFC is calculated by difference (Eq. 8), variation in the inputs used
to calculate NFC offset each other to some extent, thereby decreasing the uncertainty
range of the NFC fraction. The moderate correlations among the grass silage aNDF,
the most influencing input (Table 5) and other inputs used to calculate NFC (i.e., grass
silage CP and EE), may contribute to decreasing the NFC variation (Table 2. 4).
2. 4. 4. Model behavior and sensitivity analysis
Model predictions for MP from bacteria and ruminal NFC digestibility were
assessed with the original and expanded schemes (Table 2.6). The expanded CHO
scheme decreases mean predicted microbial CP with 43 g difference in MP between
the schemes. Assuming an efficiency of MP utilization of 0.65 for milk production
and 30 g true protein per kg of milk, the difference would represent approximately 1
kg in predicted MP allowable milk (MP milk = 43×0.65/30) (Table 2.6). The decrease
in MP from bacteria is due mainly to a decrease in the microbial yield supported by
the CA fraction; the rates for the A fractions have been reduced compared to the rates
for the original scheme. In the original scheme, the CA rate for the entire pool in
silages was set at an intermediate rate (e.g., 0.10/h) to account indirectly for the
presence of organic acids. The expanded scheme may not always result in lower
rumen microbial growth than the original scheme for a silage-based diet. For immature
corn silages with high water soluble CHO and low VFA content, the expanded scheme
predicts greater MP from bacteria than the original scheme (results not shown).

Table 2.5. Variation of carbohydrate (CHO) fractions (g/kg ration DM) when all the feed inputs were varied.
CHO fraction Mean SD Minimum Maximum NDF 1 307 23.4 234 388 NFC 2 403 27.4 303 403 Lactic acid 3 28 8.1 4 60 Starch 4 284 19.8 192 339 Sugar 5 57 9.8 30 99 Soluble fiber 6 40 13.9 4 114 VFAs 7 14 5.3 2 40
1 The inputs that had the most influence (regression coefficient in brackets) were grass silage aNDF (0.77) and corn silage aNDF (0.58). 2 The inputs that had the most influence (regression coefficient in brackets) were grass silage aNDF (-0.64) and corn silage aNDF (-0.5). 3 The inputs that had the most influence (regression coefficient in brackets) were grass silage acetic (0.67) and corn silage acetic (0.64). 4The inputs that had the most influence (regression coefficient in brackets) were corn silage starch (0.89) and HMCG starch (0.37). 5 The inputs that had the most influence (regression coefficient in brackets) were grass silage sugar (0.75) and corn silage sugar (0.41). 6 The inputs that had the most influence (regression coefficient in brackets) were grass silage aNDF (-0.70) and grass silage CP (-0.43). 7 The inputs that had the most influence (regression coefficient in brackets) were grass silage lactic (0.78) and corn silage lactic (0.55).
69

70
Predicted ruminal NFC digestibility is similar between the two schemes (Table
2. 6). The prediction of site of digestion is less sensitive to CHO degradation rates
than microbial CP production. With the first-order approach used to predict site of
digestion, the model is sensitive to degradation rates that are closer to its ruminal
passage rate.
The expanded fractionation scheme also repartitions impact of the different
inputs on model predictions (Table 2.6). Predictions with the original scheme are more
sensitive to NFC rates and inputs used to calculate CHO than predictions with the
expanded scheme, which were more sensitive to NFC fractions and their
corresponding rates (Table 2.6). For MP from bacteria, for both schemes, the
fractional degradation rates for fiber had the biggest effect (Table 6).The use of the
expanded CHO scheme increases the number of inputs, as listed in Table 2.6, and thus
the risk of use of the model may increase if the inputs to the model are sensitive and
have not been measured. The SD for model predictions when all inputs were varied
was greater for the expanded scheme (Table 2.6). Despite this, the individual feed
inputs that contributed most to variability in MP from bacteria were similar for both
schemes (Figure 2.2). The same four variables had the highest regression coefficients
in both schemes (i.e., corn silage starch, grass silage NDF rate, high moisture corn
grain starch rate, and corn silage NDF rate). The only important change in the
regression coefficient was a much higher value for variation in the corn silage starch
pool in the expanded CHO scheme. This is likely due to removing soluble fiber from
this pool. The grass and corn silage CA rates (0.10/h) were sensitive in the original
scheme but none of the CA fraction rates were sensitive in the expanded scheme. In
the expanded scheme, the CA1, CA2, and CA3 had low microbial yields and CA4 had
high degradation rates, which makes the model more sensitive to their pool size, rather
than their degradation rates. Although the sugar fraction was highly variable (Table

71
2.5), the sensitivity of the model to sugar content of silages was moderate (Figure 2.2).
The uncertainty due to feed composition may be important in predictions of the
nutritional model used for formulating rations. Feed inputs that vary the most within a
feed may not necessarily be the ones that the model is most sensitive to.
The feed inputs with moderate or large variability and those that the model is
sensitive to should be analyzed most frequently. Both accuracy and precision should
be considered when problems associated with undertainty of feed composition are
addressed. Low accuracy occurs when values reported from a laboratory differ from
known reference values and may result in systematic bias in the model predictions.
Low precision results from random variation and can be overcome by increasing
analysis frequency.
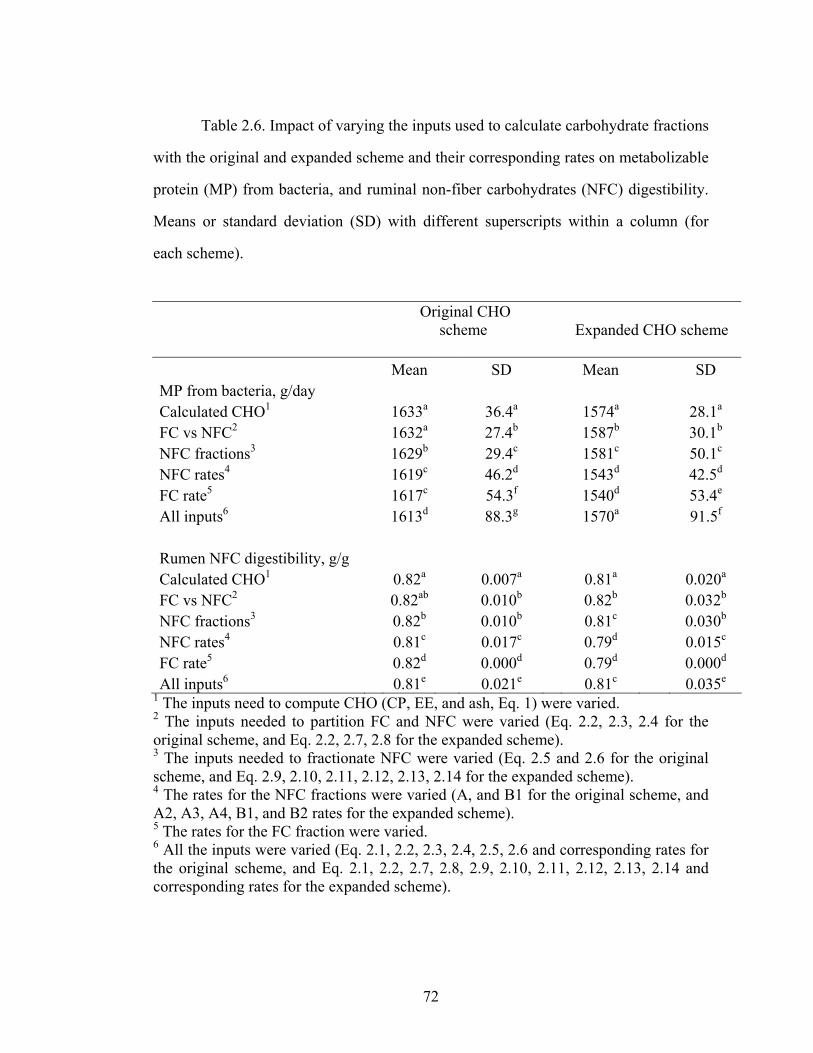
72
Table 2.6. Impact of varying the inputs used to calculate carbohydrate fractions
with the original and expanded scheme and their corresponding rates on metabolizable
protein (MP) from bacteria, and ruminal non-fiber carbohydrates (NFC) digestibility.
Means or standard deviation (SD) with different superscripts within a column (for
each scheme).
Original CHO scheme
Expanded CHO scheme
Mean SD Mean SD MP from bacteria, g/day Calculated CHO1 1633a 36.4a 1574a 28.1a FC vs NFC2 1632a 27.4b 1587b 30.1b NFC fractions3 1629b 29.4c 1581c 50.1c NFC rates4 1619c 46.2d 1543d 42.5d FC rate5 1617c 54.3f 1540d 53.4e All inputs6 1613d 88.3g 1570a 91.5f Rumen NFC digestibility, g/g Calculated CHO1 0.82a 0.007a 0.81a 0.020a FC vs NFC2 0.82ab 0.010b 0.82b 0.032b NFC fractions3 0.82b 0.010b 0.81c 0.030b NFC rates4 0.81c 0.017c 0.79d 0.015c FC rate5 0.82d 0.000d 0.79d 0.000d All inputs6 0.81e 0.021e 0.81c 0.035e
1 The inputs need to compute CHO (CP, EE, and ash, Eq. 1) were varied. 2 The inputs needed to partition FC and NFC were varied (Eq. 2.2, 2.3, 2.4 for the original scheme, and Eq. 2.2, 2.7, 2.8 for the expanded scheme). 3 The inputs needed to fractionate NFC were varied (Eq. 2.5 and 2.6 for the original scheme, and Eq. 2.9, 2.10, 2.11, 2.12, 2.13, 2.14 for the expanded scheme). 4 The rates for the NFC fractions were varied (A, and B1 for the original scheme, and A2, A3, A4, B1, and B2 rates for the expanded scheme). 5 The rates for the FC fraction were varied. 6 All the inputs were varied (Eq. 2.1, 2.2, 2.3, 2.4, 2.5, 2.6 and corresponding rates for the original scheme, and Eq. 2.1, 2.2, 2.7, 2.8, 2.9, 2.10, 2.11, 2.12, 2.13, 2.14 and corresponding rates for the expanded scheme).

73
-0.2 0 0.2 0.4 0.6
Corn sil, B1 rate
HMCG, CP
Grass sil, ash
Corn sil, A rate
SBM, ash
SBM, CP
Grass sil, lignin(sa)
SBM, EE
HMCG, aNDF
Grass sil, A rate
Grass sil, CP
Corn sil, starch
Corn sil, B2 rate
HMCG, B1 rate
Grass sil, B2 rate
SRC-0.2 -0.1 0 0.1 0.2 0.3 0.4 0.5 0.6
SBM, ash
Corn sil, sugar
Grass sil, sugar
Grass sil, starch
Grass sil, CP
Grass sil, EE
SBM, EE
Grass sil, ash
HMCG, starch
Corn sil, aNDF
Grass sil, lignin(sa)
Corn sil, B3 rate
HMCG, B1 rate
Grass sil, B3 rate
Corn sil, starch
SRC
0.47
0.44
0.34
0.33
-0.19
0.19
-0.17
-0.17
-0.15
-0.13
-0.12
0.12
-0.12
-0.12
0.12
0.55
0.46
0.44
0.33
-0.17
0.16
0.16
-0.12
-0.12
-0.11
-0.11
0.10
0.10
0.10
-0.09
ORIGINAL SCHEME EXPANDED SCHEME
Figure 2.2. Standard regression coefficients (SRC) for the inputs ranked as the most
influential in predicting microbial growth with the original carbohydrate scheme
(Panel A) and expanded scheme (Panel B).
[CP=crude protein; EE= ether extract; HMCG= High moisture corn grain; NDF=
neutral detergent fiber; SBM= soybean meal.]
74
2. 4. 5. Applications of the expanded carbohydrate scheme
The expanded CHO scheme increases the ability of the CNCPS model to
account for variation in animal production due to differences in feed composition,
including accounting for silage quality, assessing production responses to changes in
diet NFC composition and sugar supplementation.
2. 4. 5. 1. Supplementing silages
Extent of silage fermentation is highly variable (Table 2.3), and it can be
stimulated by adding inoculants such as lactic acid bacteria, enzymes and added
fermentable CHO, while wilting or formic acid addition reduces the extent of silage
fermentation (Huhtanen, 1998). The expanded scheme accounts for more variation in
silage fermentation and table 6 summarizes CNCPS model predictions with the
expanded CHO scheme for grass silages derived from the same crop, but with
different fermentations (i.e., inoculated vs restricted fermentation). When silages are
fed alone, the model predicts protein to be first limiting for both silages, with lower
MP allowable milk for cows fed the inoculated silage. The model with the expanded
CHO scheme predicted milk responses to increased MP supply for both silages with
predicted responses for both fermentable CHO and CP supplementation larger for the
inoculated silage (Table 2.7). Histidine was predicted to be the first limiting AA, in
agreement with previous reports (Korhonen, et al., 2000). The content of some AA
(i.e., histidine and leucine) in microbial CP is lower than in milk protein, which may
attenuate the responses to sources of fermentable CHO to the diet when one of these
AA is first limiting in the ration. The model with the original CHO scheme did not
predict differences due to extent of silage fermentation (results not shown).
Table 2.7. CNCPS predictions with the expanded carbohydrate scheme for un-treated grass silage or inoculated with
lactic acid bacteria with supplements (formulated for a lactating dairy cow 650 kg BW, intake: 24.9 kg).
MP allowable
milk
ME allowable
milk First limiting
AA Untreated Grass silage alone1 22.3 35.9 Histidine Grass silage (500 g/kg diet DM) and cracked corn (500g/kg diet DM) 30 45.9 Isoleucine Grass silage (840 g/kg diet DM) and extruded SBM (160 g/kg diet DM) 46.3 36.7 Leucine Inoculated grass silage alone2 15.6 30.2 Histidine Inoculated silage (500 g/kg diet DM) and cracked corn (500 g/kg diet DM) 26.6 43.3 Valine Inoculated silage (840 g/kg diet DM) and extruded SBM (160 g/kg diet DM) 40.7 32.1 Leucine
1 Grass silage composition (g/kg): sugar 160, lactic acid 35, volatile fatty acids 14 2Grass silage inoculated with lactic acid bacteria composition (g/kg): sugar 61, lactic acid 132, volatile fatty acids 5.
75

76
2. 4. 5. 2. Balancing for NFC
While the NRC (2001) provides few guidelines for balancing total diet NFC,
altering the proportions of the types of NFC can alter recommendations for total NFC,
and other components, of the ration since interactions among NFC components and
fiber and protein fractions have been described (Hall, 2002). Table 2.8 shows changes
in CHO fractions and model predictions using the expanded scheme replacing HMCG,
a high starch concentrate, with the high soluble fiber by-product beet pulp in a ration.
Replacing HMCG with beet pulp causes an increase in the content of sugar, soluble
fiber and NDF of the ration and a decrease in the starch content. With increasing
levels of beet pulp, the model predicts a reduction in both ME and MP allowable milk.
The ME allowable milk decreases more sharply than MP allowable milk because of
the higher content of NDF of the beet pulp, which reduces the total digestible nutrients
derived from the ration. Metabolizable protein allowable milk also decreases due
mainly to a decrease in the microbial CP supply (Table 2.8). A small repartitioning of
N excretion was also predicted. Beet pulp changed some of the N excretion from urine
to feces. With beet pulp, indigestible DM intake increases, which in turn increases
predicted metabolic fecal N. Van Vuuren (1993) observed a similar trend in N
partition when replacing a corn grain based diet with a beet pulp based diet. The
original model also predicted a decrease in ME allowable milk when beet pulp content
was increased because this effect was caused by an increase in diet FC; however
predicted microbial MP and MP allowable milk were rather insensitive to changes in
the percentage inclusions of beet pulp (results not shown).
Table 2.8. Effect of replacing high moisture corn grain (HMCG) with beet pulp (BP) in dietary carbohydrate
composition on CNCPS predictions with the expanded carbohydrate scheme.
100 HMCG:
0 BP1,2 75 HMCG:
25 BP2 50 HMCG:
50 BP2 25 HMCG:
75 BP2 0 HMCG: 100 BP2
Diet composition, g/kg
Sugar 38 49 59 70 80 Starch 333 273 213 153 93
Soluble fiber 71 95 119 143 167 NDF 237 264 290 317 344
CNCPS predictions Pred DMI, kg/day3 23.2 23.2 23.2 23.2 23.2 Pred DMI, kg/day4 25.5 25.5 25.5 25.5 25.5 ME allowable milk,
kg/day 44.7 42.4 40.1 37.9 35.6 MP allowable milk,
kg/day 44.6 44.1 43.3 42.0 40.7 Microbial MP, g/day 1491 1492 1478 1441 1361
Fecal N, g/day 244 253 261 267 273 Urinary N, g/day 406 399 394 390 386
77
Table 2.8 (Continued) 1 Diet formulated for a lactating dairy cow 650 kg BW consuming 24.8 kg DM. Diet composition (g/kg): 360
HMCG, 200 corn silage, 200 alfalfa silage, 150 solvent soybean meal, 40 corn distillers’ grains with solubles, 10
blood meal, and 40 mineral vitamin mixture. 2 Beet pulp substituted for HMCG as 0, 25, 50, 75 g/100 g of the HMCG of the ration. All diets were 188 g CP/kg
DM 3 Fox et al. (2004) 4 NRC (2001)
78
79
Some differences in animal responses when they are fed different sources of
CHO are mediated through changes in DM intake. Voelker and Allen (2003) reported
a decrease in DM intake when beet pulp constituted 240 g /kg of the ration DM, which
they attributed this to a physical fill effect. Changes in DM intake have also been
observed when HMCG is replaced with dried molasses (Broderick and Radloff, 2004).
Predictions of DM intake (NRC, 2001, Roseler, et al., 1997) were insensitive to
changes in the NFC composition of the ration (Table 2.8). Empirical equations used to
predict DM intake account for body weight, fat-corrected milk, ambient temperature,
mud depth and early lactation lag in intake (Fox, et al., 2004, NRC, 2001), but dietary
factors are not considered. Mechanistic predictions of changes in DM intake due to
changes in dietary factors are an important addition to nutritional models needed to
account for difference in CHO utilization.
Prediction of the amount and profile of VFA in the rumen due to variation in
CHO fractions is important in relating feed composition to milk production and
composition, as well as to changes in body composition (Dijkstra, 1994, Pitt, et al.,
1996). While total VFA production is acceptably predicted by many models,
proportions of the VFA have been poorly predicted (Dijkstra, et al., 1992, Pitt, et al.,
1996). Description of the nutrient profile of the diet and substrate availability affects
the profile of VFA produced in the rumen. While the original CNCPS scheme divided
CHO based on the rate of degradation, it combines CHO fractions that differ in their
ruminal VFA profile (e.g. pectin and starch). Therefore, the expanded scheme would
be more suitable to provide dietary inputs for a VFA production pH rumen submodel
(Fox, et al., 2004).

80
2. 5. Conclusions
The expanded CHO scheme for the CNCPS model that is outlined in this paper
divides feed CHO in fractions that more accurately relate to ruminal fermentation
characteristics. It is practical to use this scheme for quantifying CHO fractions in feeds
because most of the fractions are now being provided by some commercial
laboratories. Shortcomings in the current analytical methodology to measure some of
the fractions (e.g. sugars) and their corresponding ruminal degradation rates
complicate full characterization of feed CHO. Nevertheless, the proposed
fractionation provides a framework for applying this information, and may stimulate
research to develop appropriate laboratory methods to measure them.
81
CHAPTER 3
EVALUATION OF PROTEIN FRACTIONATION SYSTEMS USED IN
FORMULATING RATIONS FOR DAIRY CATTLE3
3.1. Abstract
Production efficiency decreases when diets are not properly balanced for protein.
Sensitivity analyses of the protein fractionation schemes used by the National
Research Council Nutrient Requirement of Dairy Cattle (NRC) and the Cornell Net
Carbohydrate and Protein System (CNCPS) were conducted to assess the influence of
the uncertainty in feed inputs and the assumptions underlying the CNCPS scheme on
metabolizable protein (MP) and amino acids (AA) predictions. Monte Carlo
techniques were used. Two lactating dairy cow diets with low and high protein content
were developed for the analysis. A feed database provided by a commercial laboratory
and published sources were used to obtain the distributions and correlations of the
input variables. Both models behaved similarly when variation in protein fractionation
was taken into account. The maximal impact of variation on MP from RUP was 2.5
(CNCPS), 3.0 (NRC) kg/d of allowable milk for the low protein diet, and 3.5
(CNCPS), and 3.9 (NRC) kg/d allowable milk for the high protein diet. The RUP
flows were sensitive to ruminal degradation rates of the B protein fraction in NRC and
of the B2 protein fraction in the CNCPS for protein supplements, energy concentrates
and forages. Absorbed Met and Lys flows were also sensitive to intestinal digestibility
of RUP, and the CNCPS model was sensitive to the acid detergent insoluble crude
protein (ADICP) and its assumption of complete unavailability. Neither the intestinal
digestibility of the RUP fraction nor the protein degradation rates are measured
3 Lanzas, C., L. O. Tedeschi, S. Seo, and D. G. Fox. 2006. Evaluation of protein fractionation systems used in formulating rations for dairy cattle. J. Dairy Sci. Accepted.

82
routinely. Approaches need to be developed to account for their variability. Research
is needed to provide better methods for measuring pool sizes and ruminal digestion
rates for protein fractionation systems.
3.2. Introduction
Livestock enterprises in developed countries are significant contributors to
non-point sources of environmental N pollution because of their contributions to
ammonia emissions and nitrate contamination of surface and ground water (NRC,
1993, NRC, 2003). Purchased feed, especially protein supplements, is a major source
of imported nutrients and farm expenses on dairy farms (Klausner, et al., 1998). Under
these economic and environmental constraints, improving the efficiency of N
utilization and reducing N excreted are very important to maintain the sustainability of
dairy farms, and nutrition models have become an effective farm management tool to
accomplish these tasks (Dinn, et al., 1998, Wattiaux and Karg, 2004b).
Feedstuffs vary widely in non-protein nitrogen (NPN), the rate and extent of
ruminal protein degradation, intestinal digestibility and essential amino acid (EAA)
supply (Broderick, et al., 1989, NRC, 2001). Milk production will be reduced when
protein supplied by the diet is below the energy allowable milk production, which is
affected by protein degradation rates (Fox et al., 2004). Feed protein fractionation
systems have been integrated into nutrition models to account for differences in
protein availability and utilization. In situ techniques and schemes based on solubility
in buffers, and detergent solutions have been adopted by the NRC (2001) and the
Cornell Net Carbohydrate and Protein System (CNCPS, Fox et al., 2004) to measure
protein fractions in feeds.
Sensitivity analysis identifies key sources of variability and uncertainty and
quantifies their contribution to the variance of model outputs (Saltelli, 2000), helping
to establish research and data collection priorities for further improvement of nutrition

83
models. Evaluations of the ability of nutrition models to predict duodenal flow of N
and animal performance have been conducted (Bateman, et al., 2001a, Bateman, et al.,
2001b, Fox, et al., 2004, Kohn, et al., 1998, NRC, 2001, Offner and Sauvant, 2004).
However, few evaluations based on sensitivity analysis have been conducted. Fox et al
(1995) assessed the impact of feed carbohydrate and protein fractions and microbial
composition on animal performance predictions. Tylutki (2002) determined the inputs
that routinely need to be analyzed to reduce risk of use of the CNCPS model in field
conditions. However, the impact of feed protein variability and model assumptions on
metabolizable protein (MP) and AA predicted flows have not been assessed. Reliable
predictions of nutrient supply are critical for mathematical models to predict the
effects of nutrients absorbed on milk composition and N efficiency, since any
intermediary metabolism model would rely on rumen models for their substrates (Fox,
et al., 2004, Offner and Sauvant, 2004). The objective of this study was to conduct a
series of sensitivity analysis of the protein fractionation schemes of the NRC (2001)
and CNCPS (Fox, et al., 2004) to assess their impact on variation in MP and absorbed
AA predictions due to feed composition variability. A second objective was to assess
the impact of assumptions underlying the CNCPS feed protein fractionation scheme.
The overall objective of both analyses is to establish research priorities for increasing
the robustness of the models.
3.3. Materials and Methods
3.3.1. Protein fractionation
The NRC (2001) and the CNCPS (Fox, et al., 2004) differ in the schemes used
to predict MP and AA supply and requirements. The NRC (2001) adopted the in situ
method to partition feed N fractions into rumen degradable protein (RDP) and rumen
undegradable protein (RUP). The in situ-A fraction includes NPN, solubilized protein,
and protein in particles sufficiently small to pass from the nylon bag. The in situ-B

84
fraction is potentially degradable in the rumen, depending on the competition between
digestion and passage, and the in situ-C fraction is the unavailable protein, which is
estimated as the remaining nitrogen after incubation for a predetermined time.
Intestinal digestibilities of RUP are based on the mobile bag technique (Hvelplund, et
al., 1992) and in vitro estimates (Calsamiglia and Stern, 1995). A regression approach
is used to determine essential amino acid (EAA) composition of duodenal protein.
The CNCPS fractionates N into five fractions based on solubility; the A
fraction is NPN, the B fraction is true protein and C is unavailable protein (Van Soest,
et al., 1981b). The B fraction is further sub-divided into three fractions with different
digestion rates (B1, B2, and B3). The B1 fraction is both soluble in borate phosphate
buffer, precipitated by tricholoracetic acid. The B3 fraction is insoluble in neutral
detergent but is soluble in acid detergent. The C fraction is insoluble in acid detergent
solution. The B2 fraction is calculated by difference. The extent of degradation of the
B fractions are based on the competition between fractional rates of degradation and
passage. The A fraction is assumed to be completely degraded, while the C fraction is
assumed completely undegraded. Intestinal digestibility is assumed to be 100 % for
B1, and B2, 80% for B3, and 0% for C. A factorial approach is used to estimate EAA
supply (O'Connor, et al., 1993)
3.3.2. Sensitivity analyses
3.3.2.1. Animals and diets.
Two different scenarios were chosen to test the sensitivity of the models. A
low CP protein diet (12-14 % CP, 43 % NDF) with grass hay and corn silage as forage
sources (named low protein diet) was formulated with each model to meet
requirements for 20 kg milk per day. A second diet (18 % CP, 30 % NDF) with alfalfa
and corn silage as forage sources was formulated with each model to meet
requirements for 38 kg milk per day (named high protein diet). Both scenarios were
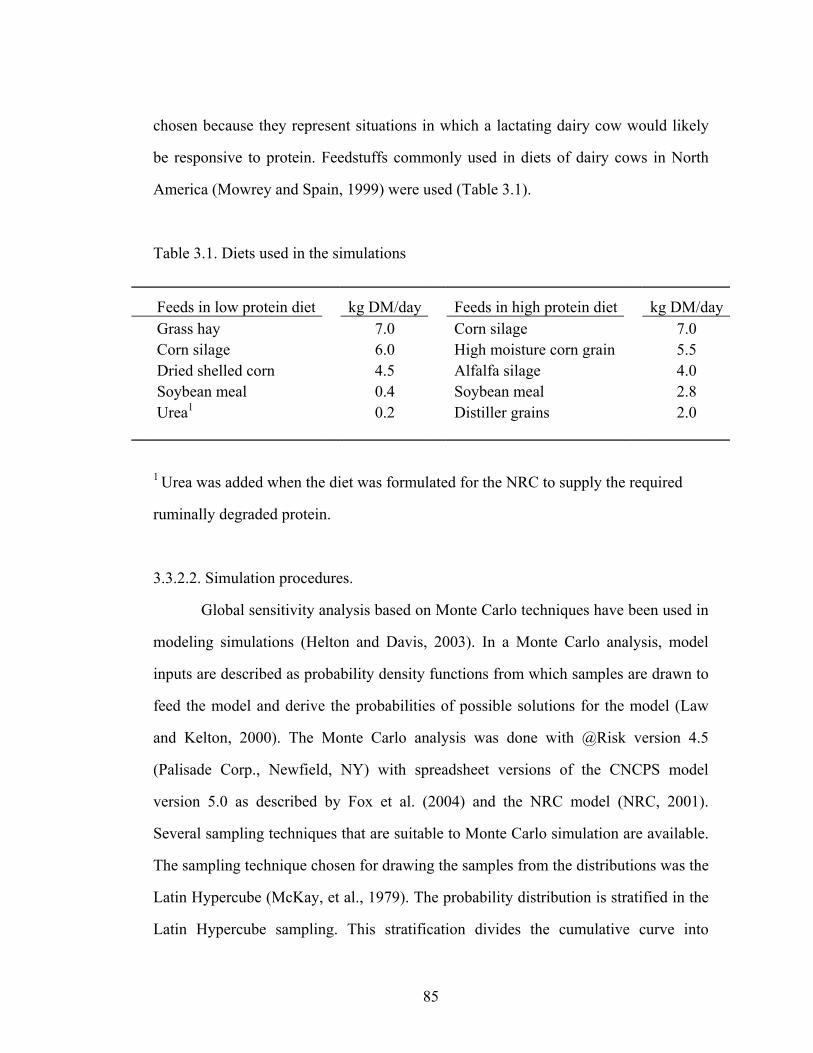
85
chosen because they represent situations in which a lactating dairy cow would likely
be responsive to protein. Feedstuffs commonly used in diets of dairy cows in North
America (Mowrey and Spain, 1999) were used (Table 3.1).
Table 3.1. Diets used in the simulations
Feeds in low protein diet kg DM/day Feeds in high protein diet kg DM/day Grass hay 7.0 Corn silage 7.0 Corn silage 6.0 High moisture corn grain 5.5 Dried shelled corn 4.5 Alfalfa silage 4.0 Soybean meal 0.4 Soybean meal 2.8 Urea1 0.2 Distiller grains 2.0
1 Urea was added when the diet was formulated for the NRC to supply the required
ruminally degraded protein.
3.3.2.2. Simulation procedures.
Global sensitivity analysis based on Monte Carlo techniques have been used in
modeling simulations (Helton and Davis, 2003). In a Monte Carlo analysis, model
inputs are described as probability density functions from which samples are drawn to
feed the model and derive the probabilities of possible solutions for the model (Law
and Kelton, 2000). The Monte Carlo analysis was done with @Risk version 4.5
(Palisade Corp., Newfield, NY) with spreadsheet versions of the CNCPS model
version 5.0 as described by Fox et al. (2004) and the NRC model (NRC, 2001).
Several sampling techniques that are suitable to Monte Carlo simulation are available.
The sampling technique chosen for drawing the samples from the distributions was the
Latin Hypercube (McKay, et al., 1979). The probability distribution is stratified in the
Latin Hypercube sampling. This stratification divides the cumulative curve into
86
intervals of equal probability; from each interval, a sample is randomly taken.
Sampling is forced to represent values at each interval. Because of the stratification,
the Latin Hypercube is more efficient and provides more stable analysis of the model
outcomes than random sampling (Helton and Davis, 2003). Ten thousand samplings
for simulation were carried out. Convergence was set to be less than 1.5% of change in
output statistics; it was achieved in all simulations.
3.3.2.3. Uncertainty and sensitivity measures
The model outputs generated by the simulations are presented as box plots. In
a box plot, the box contains the middle 50 % of the data. The middle line in the box
represents the median, and the upper edge of the box indicates the 75th percentile, and
the lower edge indicates the 25th percentile. The range between the 75th and the 25th is
the inter-quartile range. The vertical lines extend to a maximum of 1.5 times the inter-
quartile range; the points outside the ends of the vertical lines are outliers. For
comparative purposes, the inter-quartile range was expressed as MP or essential EAA
allowable milk, using the efficiency coefficients of MP and EAA utilization of the
CNCPS model (Fox, et al., 2004).
In order to relate the variation in the model outputs to the different sources of
inputs, a stepwise regression analysis was used. The standard regression coefficients
(SRC) were used to rank the inputs. They provide a measure of importance based on
the effect of moving each input away from its mean value by a fixed fraction of its SD
while retaining all other inputs at their mean values (Helton and Davis, 2002).
To assess differences in precision of the models, Bonferroni confidence
intervals were computed for the SD of the simulated outputs (Ott and Longnecker,
2001).
Sensitivity analysis 1: Assessment of the impact of feed protein and EAA composition
variability
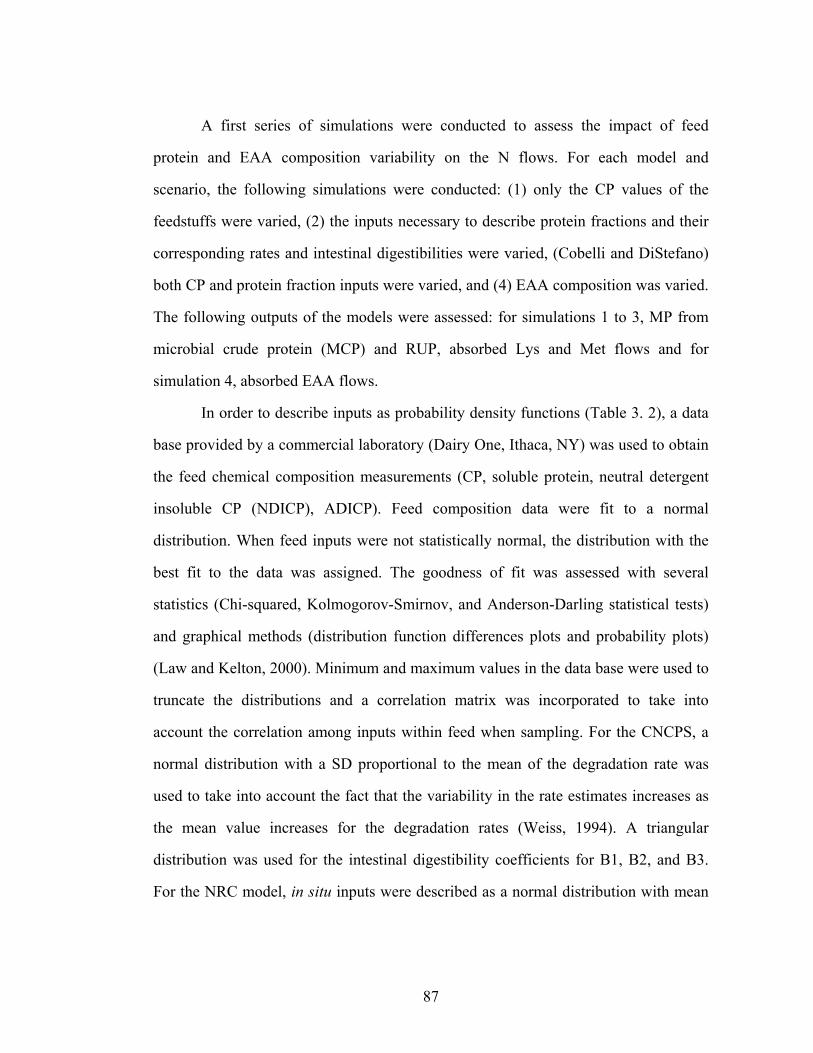
87
A first series of simulations were conducted to assess the impact of feed
protein and EAA composition variability on the N flows. For each model and
scenario, the following simulations were conducted: (1) only the CP values of the
feedstuffs were varied, (2) the inputs necessary to describe protein fractions and their
corresponding rates and intestinal digestibilities were varied, (Cobelli and DiStefano)
both CP and protein fraction inputs were varied, and (4) EAA composition was varied.
The following outputs of the models were assessed: for simulations 1 to 3, MP from
microbial crude protein (MCP) and RUP, absorbed Lys and Met flows and for
simulation 4, absorbed EAA flows.
In order to describe inputs as probability density functions (Table 3. 2), a data
base provided by a commercial laboratory (Dairy One, Ithaca, NY) was used to obtain
the feed chemical composition measurements (CP, soluble protein, neutral detergent
insoluble CP (NDICP), ADICP). Feed composition data were fit to a normal
distribution. When feed inputs were not statistically normal, the distribution with the
best fit to the data was assigned. The goodness of fit was assessed with several
statistics (Chi-squared, Kolmogorov-Smirnov, and Anderson-Darling statistical tests)
and graphical methods (distribution function differences plots and probability plots)
(Law and Kelton, 2000). Minimum and maximum values in the data base were used to
truncate the distributions and a correlation matrix was incorporated to take into
account the correlation among inputs within feed when sampling. For the CNCPS, a
normal distribution with a SD proportional to the mean of the degradation rate was
used to take into account the fact that the variability in the rate estimates increases as
the mean value increases for the degradation rates (Weiss, 1994). A triangular
distribution was used for the intestinal digestibility coefficients for B1, B2, and B3.
For the NRC model, in situ inputs were described as a normal distribution with mean

88
and SD as reported in the NRC (2001). Similarly, the NRC (2001) intestinal RUP
digestibilities were also described by triangular distributions.
For the feed EAA composition (Table 3. 3), a normal distribution with mean
and SD as reported in the NRC (2001) was used. For the grass hay and alfalfa silage,
the NRC data were supplemented with other published sources (Givens and Rulquin,
2004, Muscato, et al., 1983, Ross, 2004, Tedeschi, et al., 2001) because the NRC
database contains single observations. The CNCPS model uses EAA as a percentage
of buffer insoluble protein. Muscato et al (1983) and Tedeschi et al (2001) concluded
that the EAA profile of the original forage could be used to predict the EAA profile of
the undegraded intake protein instead of using the buffer insoluble protein profile.
Therefore, the EAA profile from the original feedstuff was also used for the CNCPS.
Sensitivity analysis 2: Assessment of the impact of the assumptions underlying
the solubility based protein fractionation scheme in the CNCPS (Fox et al., 2004)
A second series of simulations was conducted to test the sensitivity of the
model to the assumptions about N utilization underlying the solubility based protein
fractionation scheme used in the CNCPS as described above. The following
assumptions were tested: (1) the true soluble protein (B1 fraction) is nearly completely
degraded in the rumen, (2) the buffer insoluble CP is composed of two kinetically
distinct fractions (the NDICP corrected for ADICP (B3 fraction), which represents a
slowly degradable fraction across feeds, and the B2 fraction that represents an
intermediate degradable fraction), and (3) ADICP is assumed to be undegradable in
the rumen and indigestible in the small intestine. For testing the assumptions, the
following modifications were incorporated into the model spreadsheet and simulations
in which CP and protein composition were varied were carried out:
(1) The degradation rates for B1 fraction were adjusted to available published
data, and the fraction was linked to the liquid passage rate. Current feed library values

89
for the degradation rates for the B1 fraction exceed most of the published values for
soluble proteins (Broderick, et al., 1989, Hedqvist and Udén, 2006, Mahadevan, et al.,
1980, Peltekova and Broderick, 1996) (Table 3. 5).
(2) The impact of assuming two potentially degradable fractions within the
insoluble protein was tested by collapsing both fractions into a single fraction, with a
weighted average degradation rate (Table 3. 5).
(3) The effect of partial intestinal digestibility of ADICP of protein
supplements on model predictions was assessed by assigning partial digestibilities
based on published data (Table 3. 5). For unheated forages, ADICP coefficients of
digestion are assumed to be zero (Goering, et al., 1972). However, additional ADICP
produced by heating was partially digested in steamed treated alfalfa (Broderick, et al.,
1993), distiller’s grains (Nakamura, et al., 1994, Van Soest, 1989), and plant proteins
(Hussein, et al., 1995, Nakamura, et al., 1994, Schroeder, et al., 1995).
3. 4. Results and discussion
3. 4. 1. Sensitivity Analysis 1: Influence of Feed Composition Variation on Model
Predictions
3. 4. 1. 1. Input variability
The observed variability of each feedstuff is based on a broad population of the
feeds with observations from extensive databases. The range in values for the CP and
protein inputs (Table 3. 2) were similar to those previously reported for other data
bases (Cromwell, et al., 1999, Kertz, 1998). Table 2 shows the distributions used to
describe the feed protein composition. Although the normal distribution was the first
choice and the number of samples available to fit the distributions were in all cases
large (100 < N < 1300), not all the inputs were normally distributed. Some feed
components (e.g. ADICP of grass hay and HMCG) had distributions skewed to the
right (e.g. Pearson and gamma). These skewed distributions have zero as a limit of the

90
function and few observations with high values (Law and Kelton, 2000). Some other
inputs (e.g. CP of soybean meal) were narrower around the mean than the normal
distribution; thus they were better represented by log and logistic distributions (Law
and Kelton, 2000). This is in agreement with the findings of Kertz (1998), who
reported low coefficients of variation (< 2%) for CP in soybean meal. A consequence
of the non-normality of the feed composition is that the mean and SD are less
appropriate as measures of centrality and dispersion of the population (Law and
Kelton, 2000). For skewed distributions, the mean overestimates the measure of
centrality. Both models are deterministic, and in a deterministic model, the solutions
of the model represent an average (Baldwin, 1995). However, when variability is
taken into account, the mean value of the solutions are not necessarily coincident with
the deterministic solution (Matis and Tolley, 1980). As the need for reducing safety
factors for nutrients increases, accounting for feed composition variability may
become more critical.
91
Table 3.2. Mean, SD and distributions for the feeds used in the simulations
Grass hay
Mean SD Distribution 1 CP, % DM 10.7 3.62 Gamma (5.0, 1.6) Soluble CP, %DM 3 1.29 Gamma (4.2, 0.6) NPN, % Soluble CP2 95 3.00 Normal (95.0, 3.0) NDICP, %DM2 3.5 1.20 BetaGeneral (7.0, 14.6) ADICP, %DM2 0.9 0.37 PearsonV (47.8, 117.8) In situ A, %CP 28.4 13.9 Normal (28.4, 13.9) In situ C, %CP 18.7 12.00 Normal (18.7, 12.0) Rate of in situ B, h-1 5 3.30 Normal (5.0, 3.3) RUP digestibility,% 50 Triangular (40,60) Rate of CNCPS B1, h-1 135 20.00 Normal (135.0, 20.0) Rate of CNCPS B2,h-1 11 4.00 Normal (11.0, 4.0) Rate of CNCPS B3,h-1 1.2 1.00 Normal (1.2, 1.0) ID of CNCPS B1, %2 100 Triangular (90,100) ID of CNCPS B2,%2 100 Triangular (90,100)
ID of CNCPS B3,%2 80 Triangular (70,90) Corn silage
Mean SD Distribution 1 CP, % DM 8.5 1.06 Loglogistic (2.1, 6.2, 11.3) Soluble CP, %DM 4.2 1.05 Weibull (3.8, 4.0)
NPN, % Soluble CP2 95 3.00 Normal(95.0, 3.0) NDICP, %DM2 1.4 0.33 Loglogistic (0.3, 1.1, 6.1)
ADICP, %DM2 0.7 0.16 Loglogistic (0.05, 0.61, 7.6) In situ A, %CP 51.3 16.9 Normal (51.3, 16.9) In situ C, %CP 18.5 5.30 Normal (18.5, 5.3) Rate of in situ B, h-1 4.4 1.50 Normal (4.4, 1.5) RUP digestibility,% 55 Triangular (45, 65) Rate of CNCPS B1, h-1 150 20.00 Normal (150.0, 20.0) Rate of CNCPS B2,h-1 15 4.00 Normal (15.0, 4.0) Rate of CNCPS B3,h-1 0.2 1.00 Normal (0.2, 1.0) ID of CNCPS B1, %2 100 Triangular (90,100) ID of CNCPS B2,%2 100 Triangular (90, 100) ID of CNCPS B3,%2 80 Triangular (70,90)
92
Table 3.2. (Continued) Alfalfa silage
Mean SD Distribution1
CP, % DM 21 2.91 Normal (21.0, 2.9)
Soluble CP, %DM 12.4 2.75 Logistic (12.4, 1.6) NPN, % Soluble CP2 67 3.00 Normal(67.0, 3.0) NDICP, %DM2 3.1 0.95 Loglogistic (-0.05, 3.0, 6.0) ADICP, %DM2 1.5 0.55 Loglogistic (0.4, 1.0, 4.9) In situ A, %CP 57.3 10.20 Normal(57.3, 10.2) In situ C, %CP 7.4 2.30 Normal (7.4, 2.3) Rate of in situ B, h-1 12.2 7.10 Normal (12.2, 7.1) RUP digestibility,% 65 -- Triangular (55, 75) Rate of CNCPS B1, h-1 150 20.00 Normal (150,20) Rate of CNCPS B2,h-1 15 4.00 Normal (15,4) Rate of CNCPS B3,h-1 1.8 1.00 Normal (1.8,1) ID of CNCPS B1, %2 100 -- Triangular( 90,100) ID of CNCPS B2,%2 100 -- Triangular (90, 100) ID of CNCPS B3,%2 80 -- Triangular (90, 100) Dried shelled corn
Mean SD Distribution 1 CP, % DM 9.5 1.31 Normal (9.5, 1.3) Soluble CP, %DM 1.9 0.59 Normal (20.1, 6.2) NPN, % Soluble CP2 73 3.00 Normal (73.0, 3.0) NDICP, %DM2 1 0.36 Normal (10.1, 3.8) ADICP, %DM2 0.9 0.20 Normal (9.7, 2.1) In situ A, %CP 23.9 12.50 Normal (23.9, 12.5) In situ C, %CP 3.6 8.30 Normal (3.6, 8.3) Rate of in situ B, h-1 4.9 2.00 Normal (4.9, 2.0) RUP digestibility,% 75 -- Triangular (75, 95) Rate of CNCPS B1, h-1 150 20.00 Normal (150,20) Rate of CNCPS B2,h-1 6 3.00 Normal (6.0, 3.0) Rate of CNCPS B3,h-1 0.1 1.00 Normal (0.1, 1.0) ID of CNCPS B1, %2 100 -- Triangular (90,100) ID of CNCPS B2,%2 100 -- Triangular (90,100) ID of CNCPS B3,%2 80 -- Triangular(70,90)

93
Table 3.2. (Continued) High moisture corn Mean SD Distribution1 CP, % DM 9.7 1.03 Pearson(53.5,387.4) Soluble CP, %DM 2.8 1.06 Extreme value (2.3,0.7) NPN, % Soluble CP2 95 3.00 Normal (95.0, 3.0) NDICP, %DM2 0.8 0.19 Logistic (0.8, 0.1) ADICP, %DM2 0.4 0.10 Gamma (53.8, 0.01) In situ A, %CP 27.9 2.90 Normal (27.9, 2.9) In situ C, %CP 0.7 0.90 Normal (0.7, 0.9) Rate of in situ B, h-1 5.1 2.50 Normal (5.1, 2.5) RUP digestibility,% 90 -- Triangular (80,100) Rate of CNCPS B1, h-1 150 20.00 Normal (150.0, 20.0) Rate of CNCPS B2,h-1 15 4.00 Normal(15.0, 4.0) Rate of CNCPS B3,h-1 1.8 1.00 Normal (1.8, 1.0) ID of CNCPS B1, %2 100 -- Triangular (90,100) ID of CNCPS B2,%2 100 -- Triangular( 90,100) ID of CNCPS B3,%2 80 -- Triangular (70,90) Solvent soybean meal
Mean SD Distribution1 CP, % DM 51 3.19 Logistic (51.4, 1.7) Soluble CP, %DM 10.1 3.98 BetaGeneral (1.9, 2.6) NPN, % Soluble CP2 55 3.00 Normal (55.0, 3.0) NDICP, %DM2 5.5 3.38 Normal (10.7, 6.6) ADICP, %DM2 1.6 1.34 Normal (3.2, 2.6) In situ A, %CP 15 6.20 Normal (15.0, 6.2) In situ C, %CP 0.6 1.90 Normal (0.6, 1.9) Rate of in situ B, h-1 4.4 1.50 Normal (4.4, 1.5) RUP digestibility,% 80 -- Triangular (70, 90) Rate of CNCPS B1, h-1 230 30.00 Normal (230.0, 30.0) Rate of CNCPS B2,h-1 11 4.00 Normal (11.0, 4.0) Rate of CNCPS B3,h-1 0.2 1.00 Normal (0.2, 1.0) ID of CNCPS B1, %2 100 -- Triangular (90,100) ID of CNCPS B2,%2 100 -- Triangular (90,100) ID of CNCPS B3,%2 80 -- Triangular (90,100)

94
Table 3.2. (Continued) Distillers Grains
Mean SD Distribution 1 CP, % DM 31.4 2.40 Normal (31.4, 2.4) Soluble CP, %DM 14.7 8.76 Loglogistic (-0.4, 4.6, 5.3) NPN, % Soluble CP2 67 3.00 Normal (67.0, 3.0) NDICP, %DM2 31 9.46 Normal (31.0, 9.5) ADICP, %DM2 17.5 5.50 Logistic (5.5, 0.9) In situ A, %CP 18.3 7.90 Normal (18.3, 7.9) In situ C, %CP 17.1 10.30 Normal (17.1, 10.3) Rate of in situ B, h-1 4.7 1.40 Normal (4.7, 1.4) Rate of CNCPS B1, h-1 150 20.00 Normal (150, 20) Rate of CNCPS B2,h-1 8 3.00 Normal (8.0, 3.0) Rate of CNCPS B3,h-1 0.5 1.00 Normal (0.5, 1.0) ID of CNCPS B1, %2 100 -- Triangular (90, 100) ID of CNCPS B2,%2 100 -- Triangular (90, 100)
ID of CNCPS B3,%2 80 -- Triangular (70, 90)
1 The parameters needed to characterize the distribution are indicated between brackets. An α parameter indicates shape of the distribution, a β parameter indicates scale (e.g. σ for the normal distribution), and a γ parameter indicates location (i.e. µ for the normal distribution). The distributions are beta general (α1, α2), extreme value (γ, β), gamma (α, β), logistic (α, β), loglogistic (γ, α, β), normal (µ, σ), PearsonV (α, β), and Weibull (α, β). The triangular distribution (a, b) was used in absence of data; a is the minimum value and b is the maximum value.
2 ADICP= Acid detergent insoluble crude protein, ID= Intestinal digestibility, NDICP= Neutral detergent insoluble crude protein, NPN= Non-protein nitrogen.
95
3.4.1.2 Microbial crude protein predictions.
The impact of the protein inputs on MP predictions is shown in Figure 3.1.
Although each diet was formulated for the same MP allowable milk, the models
differed in the amounts and proportions that MCP and RUP contributed to MP supply
(Figure 3.1). For comparative purposes, the variation in MP and AA flows was
expressed in milk responses using a constant efficiency; it is plausible that this
approach over predicts responses to protein since marginal conversion decreases as
supply approaches the requirements (Doepel, et al., 2004). Predictions for MCP had
different distributions between diets (Figure 3. 1, Panels A and B). The MCP
distributions of the low protein diet were strongly skewed to the left (Figure 3.1,
Panel A). For the NRC predictions, the upper bound corresponded to the maximum
RDP requirement. These skewed distributions for both models are due to the
discontinuity of the equations used to estimate microbial growth. In both models,
predictions of microbial growth are based on the assumption that the most limiting
nutrient restricts growth by calculating both energy and N-allowable growth and using
the lower of the two values (NRC, 2001, Tedeschi, et al., 2000). A consequence of this
discontinuity in the calculation may be an increased risk of use of the models when
safety factors are reduced for RDP. The accuracy of MCP predictions relies on those
inputs that provide fermentable organic matter when energy is first limiting and
degradable protein when N is first limiting (Ruiz, et al., 2002). Equations with smooth
or continuous transitions from situations in which N or energy limits growth would
make the models more robust and biologically correct. The estimation of N
requirements for microbes is an area that needs further refinements in
96
Figure 3.1. Box plots for the variability in predicted metabolizable protein
from microbial protein (Panel A: low protein diet, Panel B: high protein diet)
and from rumen undegradable protein (Panel C: low protein diet, Panel D: high
protein diet) due to feed protein variation for the following simulations: 1)
CNCPS, CP, 2) CNCPS, protein fractions, 3) CNCPS, CP and protein
fractions, 4) NRC, CP, 5) NRC, protein fractions, and 6) NRC, CP and protein
fractions. The middle line in the box represents the median, and upper and
lower areas of the center box indicate the 75th and 25th percentiles (50% of the
values are included; The inter-quartile range (H) is the difference between the
two percentiles). The whiskers on the lines are extreme values, and indicate
values that fall within 1.5H. For comparative purposes, H is expressed in MP
allowable milk (assuming an efficiency of 0.65). Predictions within a panel
with different variance have different letters (P < 0.05).
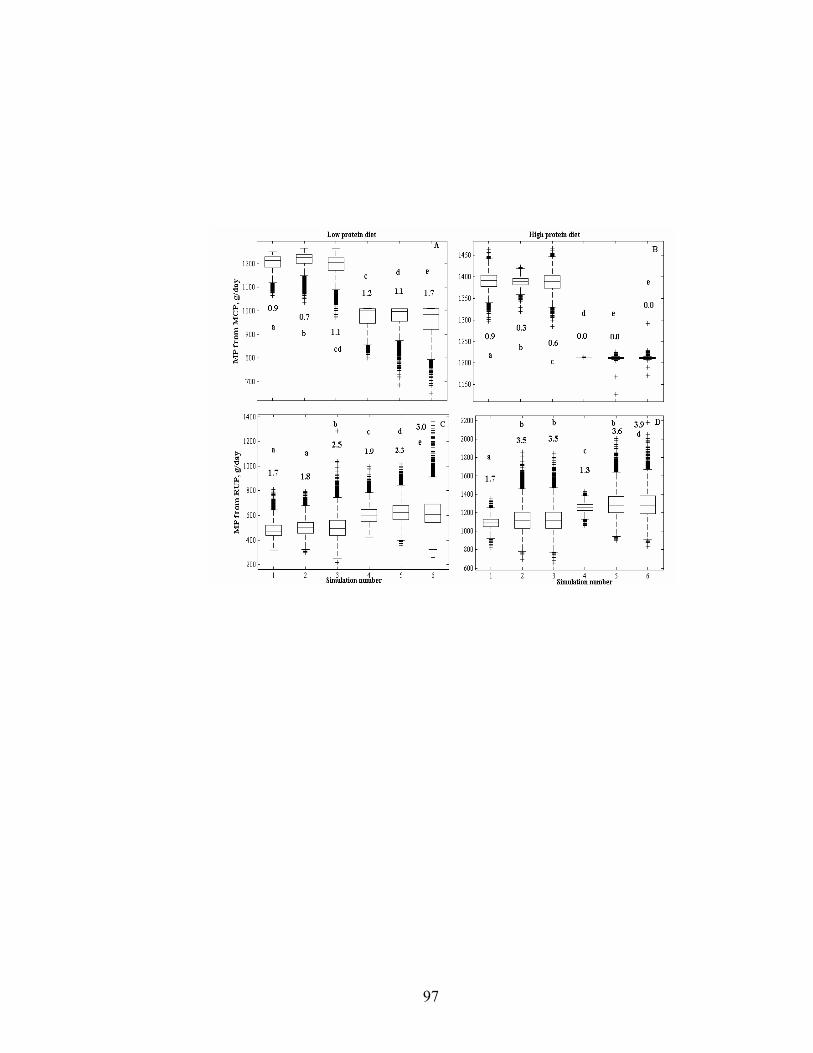
97

98
both the NRC and CNCPS models. The inaccuracy in prediction of microbial N
requirements is well illustrated by Schwab et al (2005); milk protein yields were
predicted better when MP supply was predicted from available energy only, rather
than from both available energy and nitrogen. Biases in predicting microbial growth
when N is first limiting may result from not adequately accounting for N supplied by
recycling (both intraruminal and urea recycling), inaccurate predictions of RDP
supply, and/or efficiency of microbial use of RDP. If RDP requirements are over
predicted, the risk of overfeeding RDP and increasing N excretion increases. If RDP
requirements are under predicted, the risk of not maximizing microbial growth
increases, and MP supply decreases. For the high protein diet, the impact of protein
variability on MCP predictions of the NRC model was negligible with no predicted
milk responses (Figure 3. 1, Panel B). At high protein levels, the CNCPS microbial
growth predictions were more sensitive to protein (Figure 3.1, Panel B). This is due to
the peptide stimulation adjustment factor and the indirect impact that varying protein
has on prediction of the size of the non-fiber carbohydrates pool (Fox, et al., 2004).
Non-fiber carbohydrates are calculated by difference and the amount of carbohydrate
fermented in the rumen dictates microbial growth (Fox, et al., 2004). The CNCPS
adjusts the yield of the bacteria that ferment nonstructural carbohydrates with an
empirical function of amino N stimulation that enhances microbial yield up to 18 % at
any given carbohydrate fermentation rate. Although in vivo responses to amino N has
been variable, improvements in microbial growth and efficiency greater than 18 %
have been reported (Chikunya, et al., 1996, Hume, 1970). Van Kessel and Russell
(1996) demonstrated that peptides and amino acids had little impact on the yield of
carbohydrate limited, ammonia-excess cultures, but they improved the growth rate and
yield in excess-energy conditions. Amino-N helps to match anabolic and catabolic
rates, decreasing the waste of energy in spilling reactions (Russell, 1993, VanKessel
99
and Russell, 1996). Therefore the sensitivity of microbial growth to protein supply
may be over predicted when the rate of carbohydrate fermentation is low, but may be
under predicted at high fermentation rates (VanKessel and Russell, 1996).
3.4.1.3.Metabolizable protein from RUP.
Overall, both models predicted wide ranges in amounts of RUP (Figure 3. 1,
Panels C and D). The SD for predicted RUP within the high protein diet was
approximately 200 g/d for both models when CP and protein fractions were varied.
Ipharraguerre and Clark (2005) summarized intestinal flow data from 57 studies. In
their database, a variety of protein sources were represented; DMI ranged from 10.8 to
26.8 kg/d and dietary CP ranged from 11.3 to 23.1 %. Despite their extensive
database, they reported a SD for the nonammonia, nonmicrobial N intestinal flow of
87.1 g (544 g CP) which was only 2.7 fold greater than models predicted for a single
diet. Similarly, in an evaluation of the NRC model, the range in RUP supply was
overestimated (Huhtanen, 2005).
The protein inputs that contributed most to the MP from RUP variability are
presented in Figure 3. 2. Ruminal degradation rates were highly ranked among the
inputs in all the simulations (NRC B rate and CNCPS B2 rate). In the high protein
diet, RUP flow was very sensitive to digestion rates of soybean meal. In addition, the
models were sensitive to protein B fraction degradation rates for energy concentrates
(dried corn and HMCG) and forages (grass hay and alfalfa silage) (Figure 3. 2). Grains
provide a substantial amount of protein since their inclusion rate is high in most mixed
dairy rations (Mowrey and Spain, 1999). Protein has been described as a first limiting
nutrient for rations based on alfalfa silage (Cadorniga and Satter, 1993; Dhiman and
Satter, 1993), and grass silage (Aston et al., 1994). If heated appropriately, RUP
content of forages can be increased (Broderick, 1995). Heat treatment at harvest
decreased rumen protein degradation and increased the N of dietary origin flowing to

100
the intestines (Charmley and Veira, 1990). In situ data on protein degradation for
grains is limited and in vivo or in vitro data is practically non-existent (Herrera-
Saldana, et al., 1990, Lykos and Varga, 1995).
Figure 3. 2. Standard regression coefficients (SRC) (P < 0.05) for the protein inputs
ranked as the most influential in predicting metabolizable protein from rumen
undegradable protein in the CNCPS (Panels A and C) and NRC (Panels B and D)
models.
[ADICP= Acid detergent insoluble crude protein, NDICP= Neutral detergent insoluble
crude protein, SOL PROT= Soluble protein]
-1 -0.5 0 0.5 1
Corn silage, Sol PROT
Grass hay, B2 rate
Grass hay, B3 rate
Grass hay, Sol PROT
Grass hay, NDICP
Dried corn, B2 rate
Low
pro
tein
die
t
-1 -0.5 0 0.5 1
Dried corn, A
Dried corn, B rate
Grass hay, C
Grass hay, A
Corn silage, A
Grass hay, B rate
-1 -0.5 0 0.5 1
Distillers, ADICP
Distillers, B2 rate
Alfalfa silage, Sol PROT
HMCG, B2 rate
Soybean meal, Sol PROT
Soybean meal, B2 rate
Standard regression coefficients
Hig
h pr
otei
n di
et
-1 -0.5 0 0.5 1
Soybean meal, RUP dig
Distillers, B rate
Soybean meal, A
Corn silage, A
HMCG, B rate
Soybean meal, B rate
Standard regression coefficients
A B
C D
-0.51
0.38
-0.34
-0.33
-0.28
-0.22
-0.44
-0.39
-0.33
0.32
-0.31
-0.31
-0.67
-0.34
-0.25
-0.23
-0.20
-0.18
-0.68
-0.30
-0.28
-0.27
-0.19
0.18
CNCPS model NRC model
101
The imprecision of the RUP flows may result from the sensitivity of the models to the
degradation rates used in the models. With the first-order approach used for both
models, the closer the degradation rate is to the passage rate, the larger the changes in
the model predictions are with small deviations in the rates. Most of the rates for the in
situ B and CNCPS B2 fractions are close to the passage rate predicted by these models
(Fox, et al., 2003, NRC, 2001). However, Reynal and Broderick (2003b) found that
the in vivo rates were consistently higher than in vitro and in situ estimates (e.g. for
expeller soybean meal, the in vivo rate was 17.9 %/h while the in vitro rate was 4
%/h). Thus in vivo protein degradation rates may be several-fold greater than the
passage rate, which may make the RUP flows less sensitive to degradation rates than
predicted by the models. Another contributing factor to the imprecision of predicting
the RUP flows may be a lack of accuracy of predicted passage rates. Empirical
equations used to predict passage rates explained at most 40 % of the variability when
evaluated against an independent database (Seo, et al., 2006b). Methodological factors
such as choice of marker and kinetic model may bias the estimates of passage rates.
None of the markers are uniformly distributed across digesta phases. Ahvenjärvi et al.
(2003) found that N flowing in the omasal canal was concentrated in small particulate
matter. Ytterbium infused in the rumen had greater affinity for small particles
(Siddons, et al., 1985), and thus the accuracy of measurements of N flows was linked
to the accuracy of ytterbium as a marker (Ahvenjärvi, et al., 2003). Reynal and
Broderick (2003b) obtained rates of passage with ytterbium infused in the rumen of
the range of 12 to 14 %/h, while rates with ytterbium adsorbed in feed particles were
between 2.5 and 6 %/h (Ellis, et al., 2002, Hristov and Broderick, 1996).
The low accuracy and repeatability of the methods used to estimate
degradation rates compromise the robustness of the models. The intrinsic limitations
of the in situ technique results in inconsistent underestimation of degradation rates.

102
The loss of particles from the bag causes an underestimation of the rate parameter,
since the lost particles, which have different chemical composition and surface area
than those in the bag, generally have faster digestion rates (Noziere and Michalet-
Doreau, 2000). In addition, the N of microbial origin can make up 60 % of the N in the
residue (Beckers, et al., 1995), and removing attached microbes is difficult. Similarly,
in vitro methods tended to underpredict protein digestion rates (Reynal and Broderick,
2003b). Advances in this area will rely upon a better understanding of the sources of
variation in the techniques (Broderick, et al., 2004c), and greater efforts in modeling
and understanding of in vitro digestion. Although proteolysis is assumed to be a first-
order process, in vitro methods deviate from first-order kinetics for several reasons:
(1) substrate-limiting conditions are difficult to maintain through the incubation, (2)
when proteolytic enzymes are used, the enzymatic activity may decline over time, and
may be subject to end-product inhibition (Broderick and Clayton, 1992, Kohn and
Allen, 1995), and (3) microbial growth in a batch follows well-defined phases,
namely, lag, exponential growth, and stationary phase, not observed in vivo.
Along with the problems encountered in estimating digestion and passage
rates, the kinetic models used to integrate both passage and digestion (Orskov and
McDonald, 1979, Waldo, et al., 1972) may be too simplistic to appropriately mimic
rumen digestion. For example, the assumption that the rumen is a single compartment
in which materials are instantaneously and completely mixed is biologically incorrect
and leads to incorrect model predictions.
The RUP flows were also sensitive to in situ A and soluble protein fractions
(Figure 3. 2). They were negatively linked to RUP supply because both are assumed to
be completely degraded in the rumen. High correlations have been found for in situ A
(soluble in water) and soluble protein measurement (soluble in borate phosphate
buffer, fractions A and B1 in CNCPS) (r = 0.90) since they measure essentially the
103
same protein fraction (Hoffman, et al., 1999). For the low protein diet, the RUP flows
were also positively related to grass silage NDICP (SRC= 0.38) and grass silage in
situ C (SRC= 0.32) (Figure 2). For the high protein diet, RUP flows were sensitive to
distillers ADICP (SRC= -0.18) and soybean meal RUP intestinal digestibility (SRC=
0.18).
3.4.1.4. Absorbed methionine and lysine flows.
Lysine and Met are most frequently first limiting EAA for milk production in
lactating dairy cows fed corn-based rations (Schwab, et al., 1992), and the impact of
variability in protein fractionation on their flows is presented in Figures 3.3 and 3.4.
For the low protein diet, the NRC predicted flows of Lys and Met were more
sensitive to feed variability than were CNCPS predictions because the main
contributor was the MCP, which was more variable in the NRC model predictions
(Figure 3.3, Panels A and C). The sensitivity in the low protein diet was distributed
among several inputs similarly ranked (Figure 3. 4, Panels A, B, E and F). The NRC
model was sensitive to those inputs that increase the amount of RDP. Because of the
regression approach used in the NRC to predict amino acid rumen outflows from
feeds, those inputs that increased the main source of MP, MCP for the low protein
diet, were positively related to AA flows. An exception was the in situ C fraction for
grass hay. The in situ C fraction was negatively related with AA flows (SRC= -0.22),
but it was positively related with MP supply (SRC= 0.32), which suggests a
disconnection between the AA and MP predictions. With the factorial approach used
in the CNCPS, AA predictions were sensitive to inputs that increase RUP flow or
RDP supply when the diet was deficient in RDP, depending on the AA profile of the
feeds.

104
Figure 3.3. Box plots for the variability in absorbed Lysine (Panel A: low protein diet,
Panel B: silage diet) and methionine (Panel C: low protein diet, Panel D: silage diet)
predictions due to feed protein variation for the following simulations: 1) CNCPS, CP,
2) CNCPS, protein fractions, 3) CNCPS, CP and protein fractions, 4) NRC, CP, 5)
NRC, protein fractions, and 6) NRC, CP and protein fractions. The middle line in the
box represents the median, and upper and lower areas of the center box indicate the
75th and 25th percentiles (50 % of the values are included; the inter-quartile range (H)
is the difference between the two percentiles). The whiskers on the lines are extreme
values, and indicate values that fall within 1.5H. For comparative purposes, H is
expressed in Lys or Met allowable milk (assuming an efficiency of utilization of 0.82
for Lys and 1 for Met). Predictions within panel with different variance have different
letters (P < 0.05).

105
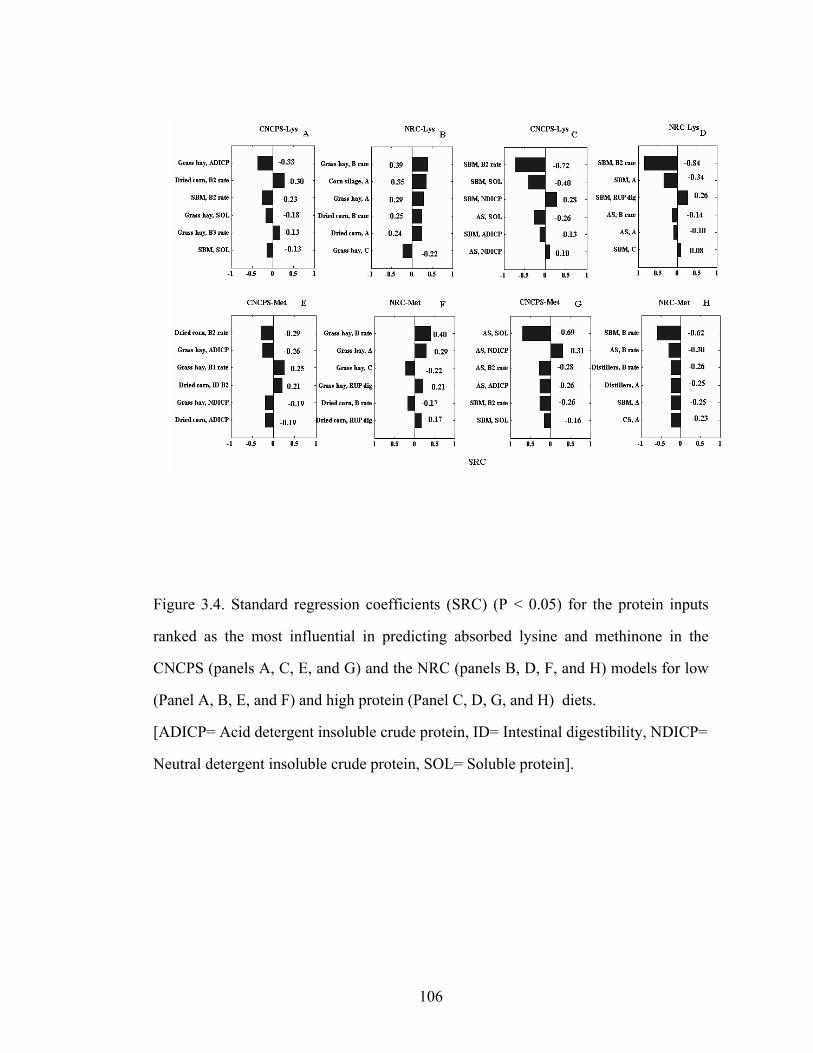
106
Figure 3.4. Standard regression coefficients (SRC) (P < 0.05) for the protein inputs
ranked as the most influential in predicting absorbed lysine and methinone in the
CNCPS (panels A, C, E, and G) and the NRC (panels B, D, F, and H) models for low
(Panel A, B, E, and F) and high protein (Panel C, D, G, and H) diets.
[ADICP= Acid detergent insoluble crude protein, ID= Intestinal digestibility, NDICP=
Neutral detergent insoluble crude protein, SOL= Soluble protein].
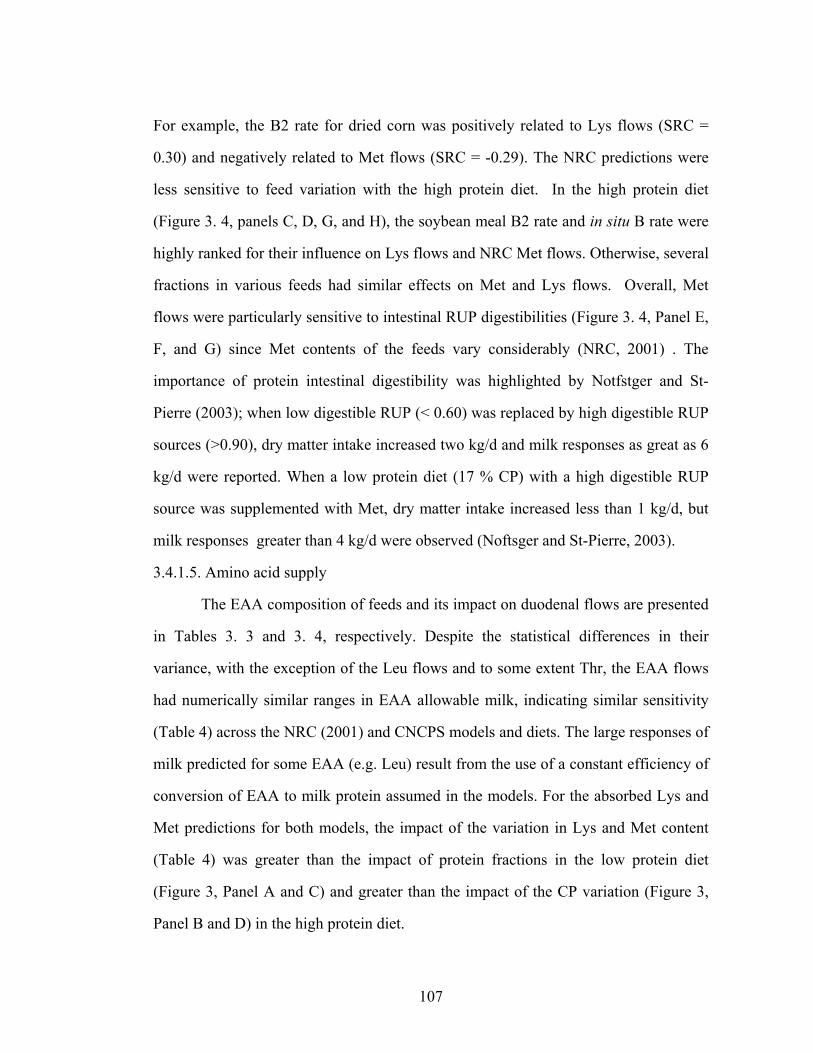
107
For example, the B2 rate for dried corn was positively related to Lys flows (SRC =
0.30) and negatively related to Met flows (SRC = -0.29). The NRC predictions were
less sensitive to feed variation with the high protein diet. In the high protein diet
(Figure 3. 4, panels C, D, G, and H), the soybean meal B2 rate and in situ B rate were
highly ranked for their influence on Lys flows and NRC Met flows. Otherwise, several
fractions in various feeds had similar effects on Met and Lys flows. Overall, Met
flows were particularly sensitive to intestinal RUP digestibilities (Figure 3. 4, Panel E,
F, and G) since Met contents of the feeds vary considerably (NRC, 2001) . The
importance of protein intestinal digestibility was highlighted by Notfstger and St-
Pierre (2003); when low digestible RUP (< 0.60) was replaced by high digestible RUP
sources (>0.90), dry matter intake increased two kg/d and milk responses as great as 6
kg/d were reported. When a low protein diet (17 % CP) with a high digestible RUP
source was supplemented with Met, dry matter intake increased less than 1 kg/d, but
milk responses greater than 4 kg/d were observed (Noftsger and St-Pierre, 2003).
3.4.1.5. Amino acid supply
The EAA composition of feeds and its impact on duodenal flows are presented
in Tables 3. 3 and 3. 4, respectively. Despite the statistical differences in their
variance, with the exception of the Leu flows and to some extent Thr, the EAA flows
had numerically similar ranges in EAA allowable milk, indicating similar sensitivity
(Table 4) across the NRC (2001) and CNCPS models and diets. The large responses of
milk predicted for some EAA (e.g. Leu) result from the use of a constant efficiency of
conversion of EAA to milk protein assumed in the models. For the absorbed Lys and
Met predictions for both models, the impact of the variation in Lys and Met content
(Table 4) was greater than the impact of protein fractions in the low protein diet
(Figure 3, Panel A and C) and greater than the impact of the CP variation (Figure 3,
Panel B and D) in the high protein diet.
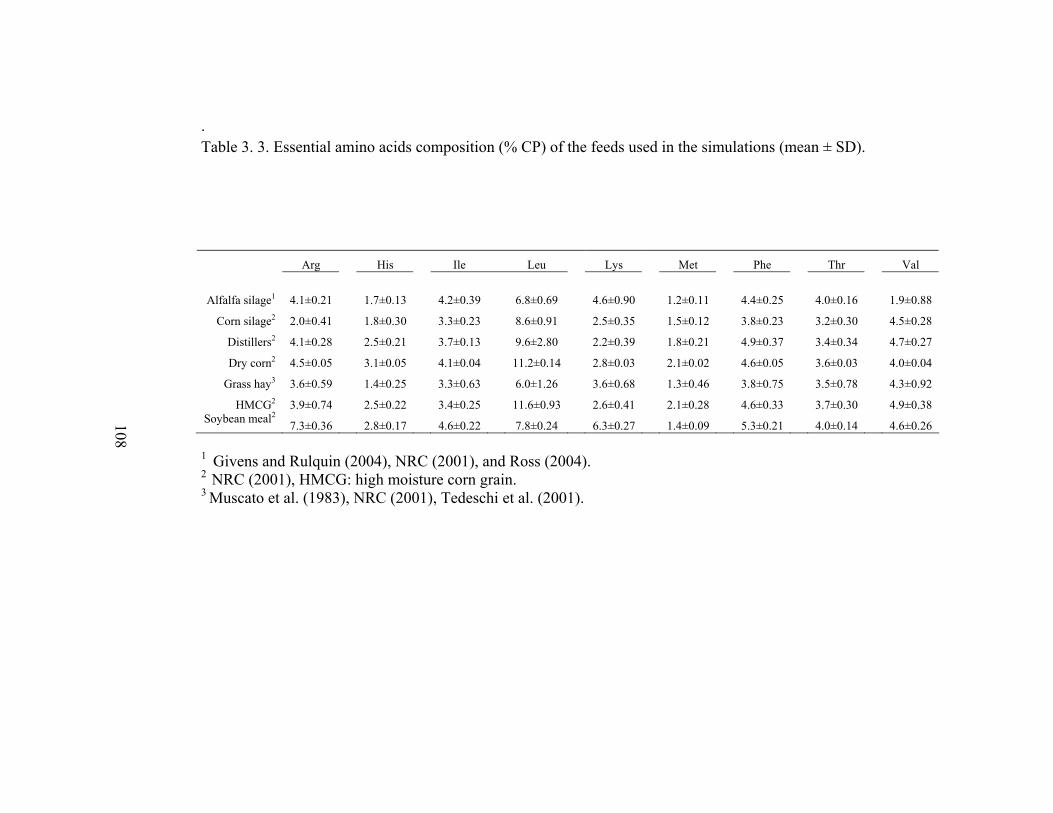
. Table 3. 3. Essential amino acids composition (% CP) of the feeds used in the simulations (mean ± SD).
Arg His Ile Leu Lys Met Phe Thr Val
Alfalfa silage1 4.1±0.21 1.7±0.13 4.2±0.39 6.8±0.69 4.6±0.90 1.2±0.11 4.4±0.25 4.0±0.16 1.9±0.88
Corn silage2 2.0±0.41 1.8±0.30 3.3±0.23 8.6±0.91 2.5±0.35 1.5±0.12 3.8±0.23 3.2±0.30 4.5±0.28
Distillers2 4.1±0.28 2.5±0.21 3.7±0.13 9.6±2.80 2.2±0.39 1.8±0.21 4.9±0.37 3.4±0.34 4.7±0.27
Dry corn2 4.5±0.05 3.1±0.05 4.1±0.04 11.2±0.14 2.8±0.03 2.1±0.02 4.6±0.05 3.6±0.03 4.0±0.04
Grass hay3 3.6±0.59 1.4±0.25 3.3±0.63 6.0±1.26 3.6±0.68 1.3±0.46 3.8±0.75 3.5±0.78 4.3±0.92
HMCG2 3.9±0.74 2.5±0.22 3.4±0.25 11.6±0.93 2.6±0.41 2.1±0.28 4.6±0.33 3.7±0.30 4.9±0.38 Soybean meal2 7.3±0.36 2.8±0.17 4.6±0.22 7.8±0.24 6.3±0.27 1.4±0.09 5.3±0.21 4.0±0.14 4.6±0.26
1 Givens and Rulquin (2004), NRC (2001), and Ross (2004). 2 NRC (2001), HMCG: high moisture corn grain. 3 Muscato et al. (1983), NRC (2001), Tedeschi et al. (2001).
108

Table 3. 4. Variation in absorbed essential amino acids (EAA) due to variability in EAA composition of the feeds1.
Low protein, CNCPS Low protein, NRC High protein, CNCPS High protein , NRC
Mean (g/day)
EAA allowed (kg milk/day)
Mean (g/day)
EAA allowed (kg milk/day) Mean
EAA allowed (kg milk/day)
Mean (g/day)
EAA allowed (kg milk/day)
Arg 106 1.0b 79 0.9c 155 1.2a 115 0.8d
His 44 0.8d 36 1.3c 65 1.6a 54 1.6b
Ile 91 1.3b 86 1.8a 126 1.3c 119 1.3d
Leu 133 2.7d 153 4.1c 200 8.2b 215 8.9a
Lys 122 1.7d 122 2.1c 160 2.3a 154 2.2b
Met 44 1.4c 33 2.0a 60 1.9b 44 1.2d Phe 85 2.2b 84 1.9c 125 2.3a 125 1.6d
Thr 86 1.8b 86 3.1a 119 1.5d 117 1.7c
Val 97 1.7b 95 1.9a 136 1.9a 134 1.3c
1Difference between the 75th and 25th percentiles are expressed in essential amino acid (EAA) allowable milk. Predictions with different variance within row have different superscripts (P < 0.05).
109
110
3. 4. 2. Sensitivity analysis 2: Impact of assumptions underlying the CNCPS protein
fractionation scheme
Tables 3.5 and 3.6 summarize the changes and results of the evaluations of
CNCPS protein digestion rates and ADICP digestibility. The MP supply was rather
insensitive to changes in the assumptions underlying the fractionation scheme. The
changes on predicted allowable milk were less than 0.5 kg milk/day. The Met and Lys
flows were more sensitive to changes in the assumptions.
3. 4. 2. 1. Soluble protein degradation.
Degradation rates for the B1 fraction were reduced to reflect available
published data (Table 3.5) and integrated with liquid rather than particle passage rate
as assumed in the CNCPS. The MP supply for both diets was insensitive to these
changes, because the B1 fraction represented a small proportion of the total protein
supply (< 8 % of the total CP). Although the rates were lowered, they were still much
greater than the predicted liquid passage rates by the CNCPS passage rate equations
(9.8 %h-1 for the low protein diet, and 11.8 %h-1 for the high protein diet), which
resulted only in small changes in extent of B1 degradation. In vivo studies have shown
similar effects. When Choi et al. (2002b) supplemented a grass silage-based diet with
protein concentrates with high and low in situ-A fractions, soluble non-amino N
omasal flow was not significantly different among treatments. However, these
modifications resulted in an increase in the Lys and Met flows, especially for the high
protein diet (Table 3.6), because Lys and Met flows were more sensitive to the
variation in B1 fraction than total RUP flows (Figure 3.2, Panel C and Figure 4, Panels
C and G). Assuming constant efficiencies, the increase in Lys and Met were predicted
to increase milk production (Table 3.6).

Table 3.5. Variations in digestion rates and intestinal digestibilities used to evaluate assumptions underlying the
CNCPS protein fractionation scheme.
kd of CNCPS B11,
% h-1
kd of CNCPS B2+B32,
% h-1
Id of CNCPS C3,
% Mean SD Mean SD Mean Min Max
Alfalfa silage 28 5 10.1 4 -- -- -- Corn silage 28 5 9.9 3 -- -- --
Distillers grains 50 7 4.7 2 30 0 60 Dried shelled corn 50 7 5.7 3 -- -- --
Grass hay 49 6 4.9 2 -- -- -- High moisture corn 50 7 8.9 3 -- -- --
Soybean meal 46 6 9.1 3 40 0 80 1 B1 rates are based on several published sources (Broderick, et al., 1989, Hedqvist and Udén, 2006, Peltekova and Broderick, 1996). 2 B2 and B3 rate were collapsed into a single fraction, by assigning the same rate, using a weighted average of the original degradation rates. 3 The intestinal digestibility coefficients (Id) for the C fraction of protein supplements (triangular distributions) are based on Hussein et al (1995), Nakamura et al (1994), Schroeder (1995) and Van Soest (1989).
111
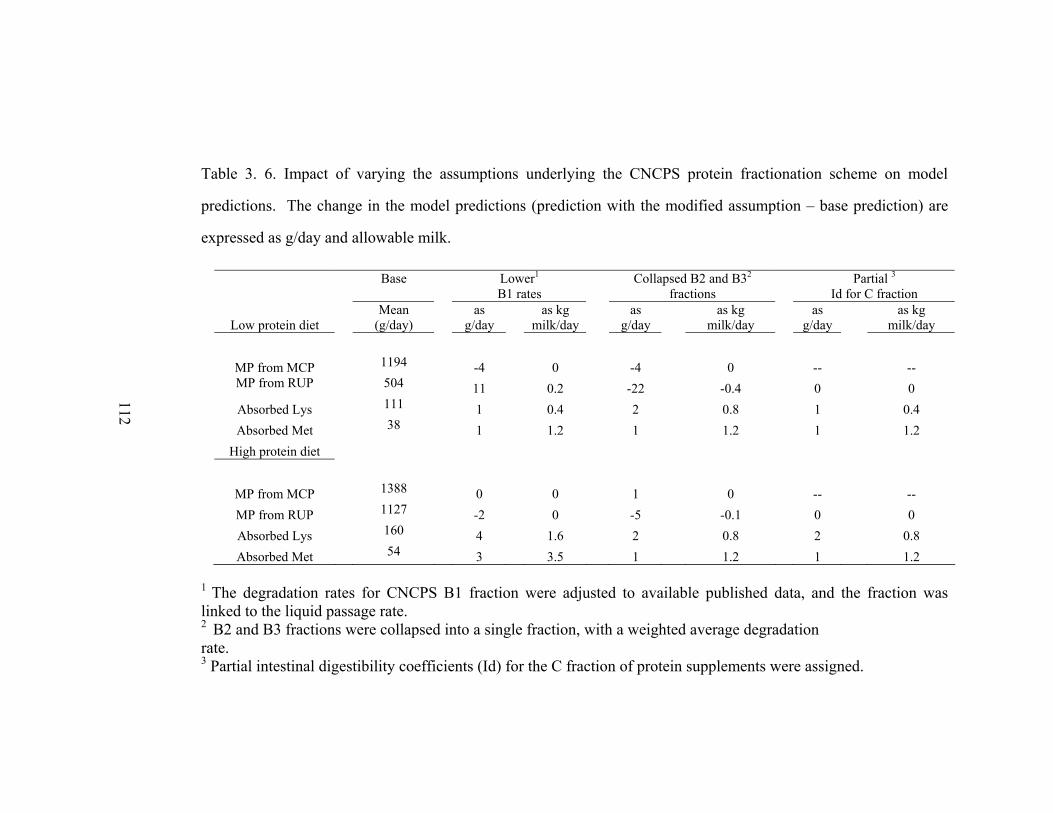
Table 3. 6. Impact of varying the assumptions underlying the CNCPS protein fractionation scheme on model
predictions. The change in the model predictions (prediction with the modified assumption – base prediction) are
expressed as g/day and allowable milk.
Base
Lower1 B1 rates
Collapsed B2 and B32 fractions
Partial 3 Id for C fraction
Low protein diet Mean
(g/day) as
g/day as kg
milk/day as
g/day as kg
milk/day as
g/day as kg
milk/day
MP from MCP 1194 -4 0 -4 0 -- -- MP from RUP 504 11 0.2 -22 -0.4 0 0 Absorbed Lys 111 1 0.4 2 0.8 1 0.4 Absorbed Met 38 1 1.2 1 1.2 1 1.2
High protein diet
MP from MCP 1388 0 0 1 0 -- -- MP from RUP 1127 -2 0 -5 -0.1 0 0 Absorbed Lys 160 4 1.6 2 0.8 2 0.8 Absorbed Met 54 3 3.5 1 1.2 1 1.2
1 The degradation rates for CNCPS B1 fraction were adjusted to available published data, and the fraction was linked to the liquid passage rate. 2 B2 and B3 fractions were collapsed into a single fraction, with a weighted average degradation rate. 3 Partial intestinal digestibility coefficients (Id) for the C fraction of protein supplements were assigned.
112

113
3. 4. 2. 2. Degradation rates for the insoluble protein.
Collapsing B2 and B3 fractions had a greater effect on the RUP flows for the
low protein diet, since the B3 fraction represents a greater proportion of the total
protein. The assigned degradation rates for the B fraction were based on the number
of pools and rates identified by the curve peeling technique described by Jacquez
(1985), using data from in vitro incubations with protease from Streptomyces griseus
(Pichard, 1977). The low rates for the protein B3 fraction are not always supported by
data (Coblentz, et al., 1999, Lagunes, et al., 1999). Because the curve peeling
approach causes the errors to propagate from the slow component into the faster
components (Jacquez, 1985), protein B2 rates may have also been inaccurately
estimated. The partition of the insoluble protein into two distinguishable fractions may
not be necessary.
3. 4. 2. 3. Partial intestinal digestibility of ADICP.
Assuming partial intestinal digestibility of the ADICP fraction in protein
supplements (distillers’ grains and soybean meal) had a similar impact on Lys and Met
flows than the previous tested assumptions. These results are consistent with the
observation that Lys and Met flows were very sensitive to intestinal digestibilities.
Because no data were available on ruminal digestion rates of ADICP, the impact of
partial ruminal digestion of ADICP could not be assessed. However, Hussein et al.,
(1995) found that ADICP from roasted soybean meals were partially digested in both
rumen and small intestine. Some of the components recovered in the ADICP fraction
may be Maillard products from the early stages of the reaction that are available.
3.5. Conclusions
Sensitivity analysis can be used to prioritize which protein fractions require
frequent analysis and to identify research priorities to improve nutritional models for
accurately predicting MP and AA supply. Despite the differences in the protein
114
schemes, both NRC and CNCPS predictions of MP supply were similar in sensitivity
to variation in protein fractions and their degradation rates because both models are
based on common principles, such as the competition between digestion and passage
to predict site of digestion and using the first limiting nutrient to estimate microbial
growth. Metabolizable protein and AA flows were sensitive to the degradation rates of
the B protein fraction in the NRC and the B2 fraction in the CNCPS and intestinal
digestibilities. Neither the degradation rates nor the intestinal digestibilities are
routinely measured. In addition, the low accuracy of in vitro and in situ degradation
rates may cause an overprediction of the ranges in RDP-RUP flows. Both laboratory
methods and a better approach to integrate protein degradation rates are necessary.
While predicted flows for diets with supplemented protein were very sensitive to the
feed inputs of the supplements, decreasing the supplemented protein resulted in an
increase of the number of inputs that needed to be measured. For accurate predictions
of low protein diets, more data is needed on protein fractionation and their digestion
rates for both forages and energy supplements, since forages and energy supplements
represent the largest proportion of MP derived from the diet.

115
CHAPTER 4
IMPROVED FEED PROTEIN FRACTIONATION SCHEMES FOR
FORMULATING RATIONS WITH THE CORNELL NET CARBOHYDRATE
AND PROTEIN SYSTEM
4.1. Abstract
Accurate predictions of rumen degradable protein (RDP) and rumen
undegradable protein (RUP) supplies are necessary for precision feeding to minimize
excess N losses from ruminants while optimizing performance. The objectives of this
study were to revise and evaluate the original Cornell Net Carbohydrate Protein
System (CNCPS) protein fractionation scheme and alternatives designed to improve
its accuracy in predicting RDP and RUP. Model predictions were evaluated with
studies with N flow data from the omasum. The N fractionation scheme in version 5 of
the CNCPS explained 78 % of the variation in RDP with a root mean square
prediction error (RMSPE) of 275 g/d, and 51 % of the RUP variation with RMSPE of
248 g/d. Neutral detergent insoluble CP (NDICP) flows were overpredicted with a
mean bias of 128 g/d (40 % of the observed mean). The greatest improvements in the
accuracy of RDP and RUP predictions were obtained with the following alternative
schemes: (1) A= non-protein N (NPN), B1= true soluble protein, B2= insoluble
protein, C= unavailable (RDP, R2= 0.84, RMSPE= 167 g/d, RUP, RUP, R2 = 0.61,
RMSPE= 209 g/d) and the use of the inhibitory in vitro (IIV) system for the B2
fraction and (2) the A and B1 fractions were redefined as the non amino-N and amino-
N in the soluble fraction respectively (RDP R2 = 0.79 with RMSPE= 195 g/d and RUP
R2 = 0.54 with RMSPE= 225 g/d).
4.2. Introduction

116
Systems to fractionate feed N have been integrated into nutrition models to
predict the amount of RDP and RUP supplied by the diet. In situ techniques and
schemes based on solubility in buffers, and detergent solutions have been adopted by
the NRC (2001) and the CNCPS (Fox et al., 2004). Despite the differences in
methodology used to fractionate protein, both schemes shared similar limitations in
predicting RPD and RUP (Lanzas, et al., 2006b, Schwab, et al., 2005); including the
following: (1) the range of RDP and RUP was over predicted, (2) the assumptions
underlying the kinetic models were too restrictive to appropriately mimic rumen
digestion, (3) the methods used to estimate some of the inputs, such as degradation
rates, had low accuracy and repeatability. The assumptions that the N insoluble in
neutral detergent and acid detergent represent slowly degradable and undegradable
protein respectively does not hold for all feeds (Coblentz, et al., 1999, Nakamura, et
al., 1994, Waters, et al., 1992). In addition, the assumption that the NPN fraction
enters the ammonia pool directly and does not provide amino N that can stimulate
microbial growth or escape rumen digestion caused under prediction of microbial
protein (Aquino, et al., 2003) and ignores the fact that free amino acid (AA) and
peptides contribute to the RUP flows (Choi, et al., 2002a, Volden, et al., 2002).
The objective of this study is to use existing literature and currently available
methodology to evaluate and revise the original CNCPS protein fractionation system
to improve its ability to predict RDP and RUP accurately. Alternative schemes to
predict in vivo RDP and RUP were assessed.
4. 3. Materials and methods
4.3.1. Feed protein fractionation schemes
4.3.1.1. Original CNCPS protein fractionation scheme
The original CNCPS protein fractionation divides feed protein into five
fractions (Sniffen, et al., 1992). The A fraction represents the soluble non-protein N

117
times 6.25 and contains peptides, free amino acids, ammonia, amides, ureides,
nucleotides and nitrates (Reid, 1994). It is determined as the N soluble in buffer and
non-precipitated by protein precipitating agents, such as tricholoracetic acid (TCA);
PAj = NPNj × (SolCPj /1000) × (CPj/1000) (g / kg DM) [4.1]
Where: CPj is the crude protein content of the jth feed, g/kg DM; NPNj is the
non-protein content of the jth feed, g/kg SolCP; PAj is the protein A fraction content of
the jth feed, g/kg DM; and SolCPj is the buffer soluble CP content, g/kg CP.
The fraction B1 is the soluble true protein, which is assumed to be very rapidly
degraded in the rumen with degradation rates greater than 1.0/h. It is measured as the
buffer soluble protein that is precipitated by protein precipitating agents;
PB1j = (SolCPj /1000) ×(CPj/1000) - PAj (g / kg DM) [4.2]
Where: CPj is the crude protein content of the jth feed, g/kg DM; PAj is the
protein A fraction content of the jth feed, g/kg DM; PB1j is the protein B1 fraction
content of the jth feed, g/kg DM; and SolCPj is the buffer soluble CP content, g/kg CP.
The fraction C is the unavailable N, which when multiplied by 6.25, is
assumed to be the protein associated with lignin, tannin-protein complexes, and
Maillard products because they are highly resistant to degradation, and are insoluble in
acid detergent (AD) solution times 6.25. Ruminal degradation rates and intestinal
digestibility for the C fraction are 0;
PCj = ADICPj ×(CPj/1000) (g / kg DM) [4.3]
Where: ADICPj is the acid detergent insoluble crude protein content of the jth
feed, g/kg CP; CPj is the crude protein content of the jth feed, g/kg DM; and PCj is the
protein C fraction content of the jth feed, g/kg DM.
The B3 fraction is the CP insoluble in neutral detergent (ND) solution, but
soluble in AD;
PB3j = (NDICP- ADICPj) ×(CPj/1000) (g / kg DM) [4.4]

118
Where: ADICPj is the crude protein insoluble in AD solution content of the jth
feed, g/kg CP; CPj is the crude protein content of the jth feed, g/kg DM; NDICP is the
neutral detergent insoluble crude protein content of the jth feed, g/kg CP; and PB3j is
the protein B3 fraction content of the jth feed, g/kg DM.
It is assumed that the protein associated with the cell wall is very slowly
degraded (< 0.02/h) and thus a high percentage escapes degradation in the rumen.
The B2 fraction represents the intermediate degradable protein with rates of
degradation within the range 0.03- 0.16/h, and it is calculated by difference;
PB2j = CPj - PAj – PB1j - PB3j - PCj (g / kg DM) [4.5]
4.3.1.2. Modifications of the original feed protein fractionation system.
Both the original and alternative schemes tested in this study are listed in
Table 4.1. These alternatives contain combinations of modifications of the original
scheme described below.
1. Accounting for amino N in the soluble protein fraction.
The NPN fraction contains both amino N (AAN) and non-amino N (NAAN).
Recent studies showed that peptides and free AA contributed to the RUP flows (Choi,
et al., 2002a, Volden, et al., 2002). For corn- and alfalfa-silage based diets, the amount
of N flowing as free AA out of the rumen exceed the outflow of N insoluble in ND
(Olmos Colmenero and Broderick, 2006c). In addition, peptides and amino acids (AA)
may stimulate microbial growth more than ammonia (VanKessel and Russell, 1996).
Therefore, the distinction between the fraction containing non-amino N and amino-N
(soluble true protein, peptides and free AA) is important in predicting both RUP and
microbial protein flows. The A and B1 fractions were redefined as the non amino-N
and amino-N in the soluble fraction.
PAj = (1000- AANj) × (SolCPj /1000) × (CPj/1000) (g / kg DM) [4.6]
119
Where: CPj is the crude protein content of the jth feed, g/kg DM; AANj is the
amino N content of the jth feed, g/kg SolCP; PAj is the protein A fraction content of the
jth feed, g/kg DM; and SolCPj is the buffer soluble CP content, g/kg CP.
Because the ranges of reported fractional degradation rates of soluble protein
and peptides degradation are similar (Volden, et al., 2002), and factors affecting
peptide recoveries with precipitating agents used to separate true protein have not been
fully investigated (Hedqvist, 2004), the aggregation of soluble true protein, peptides,
and free AA in one fraction seems justified. In addition, the B1 fraction was assumed
to pass at the same rate as liquid leaving the rumen. In vivo studies using the pulse
dose technique reported degradation rates similar to the original B1 rates (Mangan,
1972, Volden, et al., 2002). However degradation rates of the B1 fraction in the
CNCPS feed library rates exceed most of the published values for in vitro soluble
proteins (Broderick, et al., 1989, Hedqvist and Udén, 2006, Mahadevan, et al., 1980,
Peltekova and Broderick, 1996). The effects of adjusting the B1 rates to reflect those
observed in vitro rates was also investigated (Table 4.1).
2. Insoluble protein fractions
Degradation rates for the neutral detergent insoluble crude protein. Recent
studies of the kinetics of NDICP disappearance has been determined indicated that the
digestion rates for the NDICP are considerably higher than the rates found in the
CNCPS feed library for the B3 fraction (Coblentz, et al., 1999, Juarez, 1998, McBeth,
et al., 2003, Rossi, et al., 1997). Values reported for NDICP degradation rates were
similar or slightly higher than NDF degradation rates (Pichard, 1977). The impact of
adjusting the B3 rates was assessed (Table 4.1).
Aggregation of the insoluble protein B2 and B3 fractions. From the results of
the sensitivity analysis, we know that unless the rates for fractions within the insoluble
protein differed by several magnitudes, the model predictions were insensitive to the

120
presence of different pools (see Chapter 3). Therefore, the aggregation of the B2 and
B3 pools was assessed. In this scheme, the B2 fraction becomes,
PB2j = CPj - PAj – PB1j - PCj (g / kg DM) [4.7]
Rates for the combined fraction were obtained using the inhibitory in vitro
(IIV) method. In the IIV, developed by Broderick (1987), proteins are incubated with
ruminal inoculum containing metabolic inhibitors to obtain quantitative recovery of
the end-products of protein degradation. The IIV is one of the most studied and
evaluated method to estimate protein degradation (Broderick, 1987, Broderick and
Clayton, 1992, Broderick, et al., 2004b, Broderick, et al., 2004c).
Table 4.1. List of alternative protein fractionation schemes
Scheme Modifications
1 Original scheme 2 Original scheme with adjusted B3 rates 3 A fraction as NAAN1 4 A fraction as NAAN1 and adjusted B1 rates 5 A fraction as NAAN1 and adjusted B3 rates 6 A fraction as NAAN1 and adjusted B1 and B3 rates 7 Aggregated insoluble fraction3, A fraction as NPN2 8 Aggregated insoluble fraction3, A fraction as NAAN1 9 Aggregated insoluble fraction3, A fraction as NPN2, adjusted B1 10 Aggregated insoluble fraction3, A fraction as NAAN1, adjusted B1
1 NAAN= Non amino nitrogen, A fraction computed as indicated in Eq. 4.6 2 NPN= Non protein nitrogen, A fraction computed as indicated in Eq. 4.1 3 B2 fraction computed as indicated in Eq. 4.7

121
4.3.2. Evaluation of the feed protein fractionation schemes
4.3.2.1. Data base description
Five studies designed to test the effect of dietary protein content and
supplementation on N metabolism and animal performance in lactating dairy cows in
which omasal flows were determined were used to evaluate the ability of the protein
fractionation schemes to predict RDP supply and RUP flows (Brito and Broderick,
2004a, Brito and Broderick, 2004b, Brito and Broderick, 2006, Brito, et al., 2006,
Olmos Colmenero and Broderick, 2006b, Olmos Colmenero and Broderick, 2006c,
Reynal and Broderick, 2003a, Reynal and Broderick, 2005, Reynal, et al., 2003,
Reynal, et al., 2005) (Table 4.2). The advantages of using omasal data for estimating
N fractions include (Ahvenjarvi, et al., 2000): (1) there is substantially less
endogenous N secreted into the rumen than into the duodenum, and (2) rumen
microbes are measured before they reach the abomasum, and therefore they are not
digested, which allow the digesta N to be separated into particle- and liquid-
associated bacteria, protozoa and soluble and insoluble dietary N fractions.
4.3.2.2. Simulations and evaluation
A spreadsheet version of the rumen submodel of the CNCPS as described by
Fox et al (2004) that incorporates new passage rates equations developed by Seo et al.
(2006b) and a revised feed carbohydrate fractionation scheme (Lanzas, et al., 2006a)
(Chapter 2) was used for the simulations. The following predicted outputs were
evaluated against the in vivo data;
1. Total CP flows out of the rumen substracting NH3 outflow (g/d),
Observed CP flows = NAN × 6.25
Predicted CP flows =
jjjjjjj REBNAREBCWREBTPREPCREPBREPBREPB ++++++∑ 321
2. RUP flows (g/d)

122
Observed RUP flows = Total CP flows – Microbial NAN × 6.25
Predicted RUP flows = jjjj REPCREPBREPBREPB +++∑ 321
3. RDP supply (CP intake – RUP flows) (g/d)
Observed RDP supply = Total CP intake – RUP flow
Predicted RDP flows = jjjj RDPBRDPBRDPBRDPA 321 +++∑
4. NDICP flows (g/d)
Observed NDICP flow= NDIN flow × 6.25
Predicted NDICP flow = jj REPCREPB +∑ 3
Where NAN is non ammonia nitrogen, NDIN is the neutral detergent insoluble
nitrogen, RDPAj is ruminally degraded protein A fraction of the jth feedstuff , the
RDPBij is the ruminally degraded protein Bi fraction of the jth feedstuff, REBCWj is
the ruminally escaped bacterial cell wall protein of the jth feedstuff, REBNAj is the
ruminally escaped bacterial nucleic acids of the jth feedstuff, REBTPj is the ruminally
escaped bacterial true protein of the jth feedstuff, REPBij is the ruminally escaped
protein Bi fraction of the jth feedstuff, REPCj is the ruminally escaped protein C
fraction of the jth feedstuff.
To assess the model predictions, the following statistical tests were used. For
assessing accuracy and precision, regression coefficients of determination (R2), mean
square error (MSE), mean square prediction error (MSPE) and its partition into three
independent and additive components (Theil, 1961), mean bias ( MU ), slope bias
( RU ), and random unexplained errors ( DU ) , and linear regression were performed.

123
Table 4.2. Descriptive statistics for the studies used to evaluate the ability of
the protein fractionation schemes to predict rumen degradable protein supply and flow
of rumen undegradable protein Descriptive statistics
N Mean SD Min Max
Diet composition and intake DM intake, kg/d 22 23.9 1.55 21.4 26.8 NDF, g/kg DM 22 250 2.4 22.4 30 N, g/kg DM 22 27.8 2.63 21.6 32.5 NEl, MJ/kg DM 22 6.28 0.251 5.94 6.90 Production and N excretion BW, kg 22 602 27.5 561 634 DIM, d 22 91 19 72 120 Milk, kg/d 22 39 2.9 32.9 42.8 Fat yield, kg/d 22 1.3 0.12 1 1.6 True protein yield, kg/d 22 1.2 0.11 0.9 1.3 Urine N, g/d 17 154 48.7 63 240 Fecal N, g/d 17 211 28.7 154 275 Omasal N flows Total N, g/d 22 562 163.7 233 709 Free AAN, g/d 18 42.1 19 16 70 Total NAN, g/d 22 551 161.8 226 695 Dietary NAN, g/d 22 236 80.8 74 403 Bacterial NAN, g/d 22 397 87.2 238 480 NDIN, g/d 17 25 7.7 14 45 ADIN, g/d 18 20 23.6 3 66
AAN= Amino acid nitrogen, ADIN= Acid detergent insoluble nitrogen, DIM= Days in milk, NAN= Non ammonia nitrogen, NDIN= Neutral detergent insoluble nitrogen.
124
4.4. Results
Table 4.3 presents the average values for the protein feed fractions of the feeds
included in the evaluation. The NPN fraction was assayed with TCA. For the protein
concentrates, the NPN fraction represented approximately 500 g/ kg of the soluble CP.
When the soluble protein was corrected for its amino N content, the average amino N
content was greater than 800 g/kg of soluble CP. Table 4.4 lists the current feed
library rates and the adjusted rates for the B1 and B3 fractions. In vitro estimates for
the soluble protein fraction are approximately 30 % of the rates of the original scheme.
While the B3 rates of the CNCPS feed library were close to 0/h, the adjusted rates
based on published data were between 0.01 to 0.14/h (Table 4.4). The IIV rates were
within the range of 0.01 (blood meal) to 0.17/h (soybean meal) and did not necessarily
rank the feeds in the same order as the feed library rates.
125
Table 4.3. Feed protein fractions in the feeds included in the evaluation CP Soluble CP NPN True protein (g/kg DM) (g/ kg CP) (g/kg Sol CP) (g/kg Sol CP)
Alfalfa silage 224.8 496.2 829.5 170.5 Blood meal 1000.0 50.0 60.0 940.0 Canola meal 427.0 323.2 652.2 347.8
Corn gluten meal 651.9 41.4 740.7 259.3 Corn silage 72.7 565.3 889.4 110.6
Cottonseed meal 484.0 200.4 402.1 597.9 Expeller SBM 489.4 61.3 533.3 466.7 Lignosulfonate
SBM 496.6 48.3 500.0 500.0 Roasted soybeans 400.0 57.5 1000.0 0.0
Rolled HMSC 86.4 321.9 935.4 64.6 Solvent SBM 530.8 199.7 537.8 462.2
NAAN AAN NDICP ADICP
(g/kg Sol
CP) (g/kg Sol
CP) (g/ kg CP) (g/ kg CP) Alfalfa silage 136.4 863.6 92.2 28.9 Blood meal 10.0 990.0 64.0 12.0 Canola meal 170.0 830.0 71.7 40.3
Corn gluten meal 10.0 990.0 81.0 64.0 Corn silage 199.2 800.8 74.3 13.5
Cottonseed meal 180.0 820.0 27.3 19.5 Expeller SBM 10.0 990.0 107.0 23.0 Lignosulfonate
SBM 20.0 980.0 323.6 74.6 Roasted soybeans 20.0 980.0 82.5 34.4
Rolled HMSC 103.5 896.5 34.7 6.1 Solvent SBM 20.0 980.0 15.2 5.2
AAN= Amino acid nitrogen, ADICP= Acid detergent insoluble crude protein, HMSC= High moisture shelled corn, NAAN= Non amino acid nitrogen, NDICP= Neutral detergent insoluble crude protein, NPN= Non-protein nitrogen, SBM= Soybean meal.
126
Table 4.4. Degradation rates for the protein fractions of the feeds used in the
evaluation.
CNCPS CNCPS B1 rates AdjB1 rates1 B3 rates AdjB3 rates2 IIV rates3
/h /h /h /h /h Alfalfa silage 1.5 0.28 0.0180 0.14 0.04 Blood meal 1.35 0.2 0.0009 0.01 0.01 Canola meal 2.3 0.46 0.0002 0.05 0.12
Corn gluten meal 1.5 0.2 0.0050 0.02 0.02 Corn silage 1.5 0.28 0.0180 0.03 0.04
Cottonseed meal 1.75 0.46 0.0175 0.04 0.10 Expeller SBM4 2.3 0.46 0.0020 0.05 0.04 Lignosulfonate
SBM 2.3 0.46 0.0020 0.04 0.04 Roasted soybeans 2.3 0.46 0.0020 0.04 0.05
Rolled HMSC4 1.5 0.5 0.0200 0.02 0.02 Solvent SBM 2.3 0.46 0.0100 0.06 0.17 1 AdjB1 rates were based on several published sources (Broderick, et al., 1989, Hedqvist and Udén, 2006, Peltekova and Broderick, 1996). 2 AdjB3 rates were based on several published sources (Coblentz, et al., 1999, Juarez, 1998, McBeth, et al., 2003, Ogden, et al., 2006, Pichard, et al., 2005, Rossi, et al., 1997). 3 Corn silage, rolled HMSC and canola meal rates were assigned based on relative ranking compared to the other feeds. 4 HMSC= High moisture shelled corn, SBM= Soybean meal.
Figure 4.1 summarizes the evaluation of RDP and RUP for the original
scheme. The original scheme over predicted RDP, with a mean bias of 150 g/d (5 % of
the predicted mean). The regressed residuals (observed – predicted) against predicted
RDP had significant intercept and slope (Y= -148.7 – 0.28(X-3050.8); indicating the
presence of significant slope and mean bias and 86 % of the observations were over
predicted. The original scheme explained more variation in the RDP supply (R2 =
0.78) than for the RUP flows (R2= 0.51) (Table 4.5). It underpredicted RUP flow, with
a mean bias of 152 g/d (12 % of the predicted mean). The regressed residuals against
predicted RUP flow had significant intercept and slope (Y=151.8 – 0.39 (X-1086.7)).
127
2000 2500 3000 3500 40002000
2500
3000
3500
4000
Predicted RDP, g/d
Obs
erve
d R
DP,
g/d
500 1000 1500 2000
500
1000
1500
2000
Predicted RUP, g/d
Obs
erve
d R
UP,
g/d
- - - - Y=X____ y= 0.7211x + 702.1
- - - - Y=X____ y= 0.6129x + 572.1
Figure 4.1. Predictions of the rumen degradable protein (RDP) supply and
rumen undegradable protein (RUP) flow using the original CNCPS protein scheme for
the following studies Reynal et al (2003) (●), Reynal and Broderick (2005) (■),
Colmerero and Broderick (2006c) (♦), Brito and Broderick (2004b) (*), and Brito et al
(2006) (▼).

128
Four studies also measured NDICP flows (Brito and Broderick, 2004b, Brito,
et al., 2006, Olmos Colmenero and Broderick, 2006c, Reynal and Broderick, 2005).
The original scheme over predicted the flow of NDICP out of the rumen (Table 4.5),
with a mean bias of 62.3 g/d, which represented 28.5 % of the predicted mean and 40
% of the observed mean. For the study with the greatest proportion of protein as B3
and C fraction (Reynal and Broderick, 2005), the averaged mean bias for the study
was as great as 204 g/d, representing 40 % of the predicted mean and 97 % of the
observed mean. Adjusting the B3 rates to reflect available data (scheme 2) resulted in
a decrease in the RMSPE and lower mean bias (21 g/d) (Table 4.5). However, the
NDICP flows were still overpredicted when the adjusted rates were used. Overall, the
predicted contribution of the NDICP to the RUP flows was greater than observed
because the NDICP fraction was more extensively degraded in the rumen (Table 4.2).
Statistical measures for the evaluation of the protein fractionation schemes as
listed in Table 4.1 are summarized in Table 4.6. As a general trend, after adjusting for
the AAN in the soluble protein (schemes 3 and 5) (Eq. 4.6), RDP supply was still over
predicted as in the original scheme, but scheme 3 resulted in the lowest mean bias.
Aggregating B2 and B3 pools (schemes 7 to 10) resulted in an under prediction of the
RDP supply and over prediction of RUP flows.
Schemes 3 (A fraction as NAAN), 7 (aggregated insoluble fraction and A
fraction as NPN), and 9 (aggregated insoluble fraction, A fraction as NPN, and
adjusted B1 rates) were the schemes that resulted in an overall improvement in the
accuracy of both RDP supply and RUP flows predictions. The scheme that performed
the worst was scheme 10, in which A fraction and B1 rates were adjusted, and the
insoluble fraction was aggregated. It over predicted the amount of escaping soluble
and insoluble protein fractions.
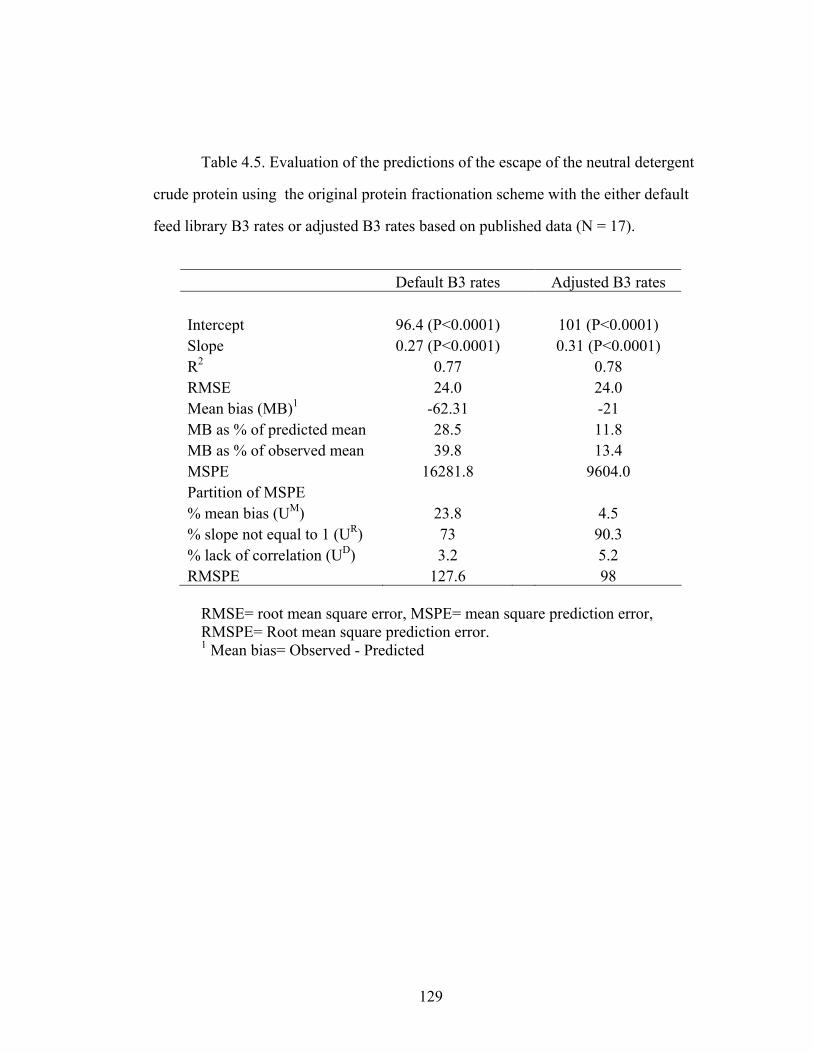
129
Table 4.5. Evaluation of the predictions of the escape of the neutral detergent
crude protein using the original protein fractionation scheme with the either default
feed library B3 rates or adjusted B3 rates based on published data (N = 17).
Default B3 rates Adjusted B3 rates Intercept 96.4 (P<0.0001) 101 (P<0.0001) Slope 0.27 (P<0.0001) 0.31 (P<0.0001) R2 0.77 0.78 RMSE 24.0 24.0 Mean bias (MB)1 -62.31 -21 MB as % of predicted mean 28.5 11.8 MB as % of observed mean 39.8 13.4 MSPE 16281.8 9604.0 Partition of MSPE % mean bias (UM) 23.8 4.5 % slope not equal to 1 (UR) 73 90.3 % lack of correlation (UD) 3.2 5.2 RMSPE 127.6 98
RMSE= root mean square error, MSPE= mean square prediction error, RMSPE= Root mean square prediction error.
1 Mean bias= Observed - Predicted

Table 4.6. Evaluation of the ability of alternative protein fractionation schemes to predict rumen degradable protein (RDP)
supply and rumen undegradable protein flow (RUP) (N= 22). Schemes1 RDP 1 2 3 4 5 6 7 8 9 10 Intercept 702.1 723.0 771.4 957.7 1061.0 742.0 447.5 488.3 422.0 675.5Slope 0.72 0.70 0.73 0.72 0.63 0.78 0.87 0.90 0.89 0.89R2 0.78 0.79 0.79 0.78 0.70 0.85 0.84 0.88 0.86 0.77RMSE2 167.7 163.7 164.7 170.6 197.7 139.9 144.8 123.7 134.4 174.2Mean bias (MB)3 -148.7 -198.7 -59.6 210.1 -28.4 123.0 80.4 210.0 125.0 411.7MB as % of predicted mean 5 7 1 8 1 5 3 8 4 17MB as % of observed mean 5 6 1 8 1 5 3 7 4 14MSPE2 61653 80769 38103 44142 65536 41209 27761 59363 33599 198292Partition of MSPE % mean bias (UM) 35.8 48.9 1.1 52.3 1.2 37.1 23.3 74.2 46.7 85.4% slope not equal to 1 (UR) 22.6 21.0 34.1 16.2 44.6 20.0 8.0 2.0 4.4 0.1% lack of correlation (UD) 41.6 30.1 64.8 31.5 54.2 42.9 68.7 23.8 48.9 14.5RMSPE2 248.3 284.2 195.2 210.1 256.0 203.0 166.6 243.6 183.3 445.3
130
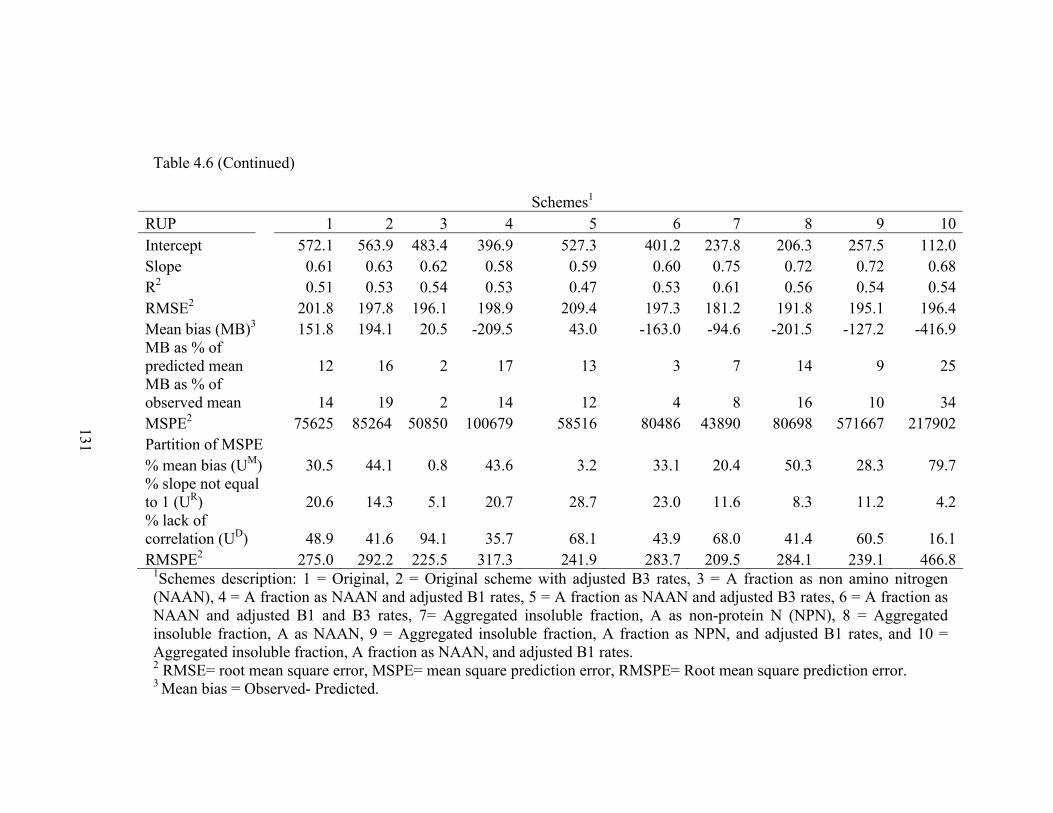
Table 4.6 (Continued)
Schemes1 RUP 1 2 3 4 5 6 7 8 9 10Intercept 572.1 563.9 483.4 396.9 527.3 401.2 237.8 206.3 257.5 112.0Slope 0.61 0.63 0.62 0.58 0.59 0.60 0.75 0.72 0.72 0.68R2 0.51 0.53 0.54 0.53 0.47 0.53 0.61 0.56 0.54 0.54RMSE2 201.8 197.8 196.1 198.9 209.4 197.3 181.2 191.8 195.1 196.4Mean bias (MB)3 151.8 194.1 20.5 -209.5 43.0 -163.0 -94.6 -201.5 -127.2 -416.9MB as % of predicted mean 12 16 2 17 13 3 7 14 9 25MB as % of observed mean 14 19 2 14 12 4 8 16 10 34MSPE2 75625 85264 50850 100679 58516 80486 43890 80698 571667 217902Partition of MSPE % mean bias (UM) 30.5 44.1 0.8 43.6 3.2 33.1 20.4 50.3 28.3 79.7% slope not equal to 1 (UR) 20.6 14.3 5.1 20.7 28.7 23.0 11.6 8.3 11.2 4.2% lack of correlation (UD) 48.9 41.6 94.1 35.7 68.1 43.9 68.0 41.4 60.5 16.1RMSPE2 275.0 292.2 225.5 317.3 241.9 283.7 209.5 284.1 239.1 466.8
1Schemes description: 1 = Original, 2 = Original scheme with adjusted B3 rates, 3 = A fraction as non amino nitrogen (NAAN), 4 = A fraction as NAAN and adjusted B1 rates, 5 = A fraction as NAAN and adjusted B3 rates, 6 = A fraction as NAAN and adjusted B1 and B3 rates, 7= Aggregated insoluble fraction, A as non-protein N (NPN), 8 = Aggregated insoluble fraction, A as NAAN, 9 = Aggregated insoluble fraction, A fraction as NPN, and adjusted B1 rates, and 10 = Aggregated insoluble fraction, A fraction as NAAN, and adjusted B1 rates. 2 RMSE= root mean square error, MSPE= mean square prediction error, RMSPE= Root mean square prediction error. 3 Mean bias = Observed- Predicted.
131
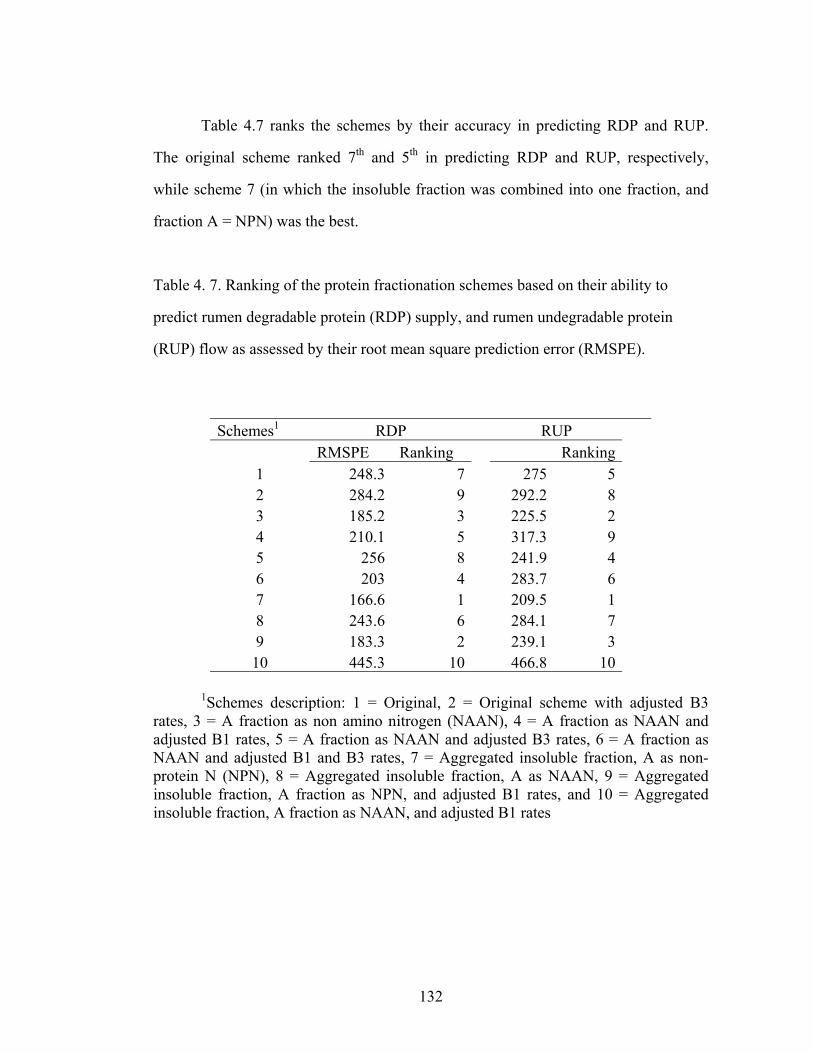
132
Table 4.7 ranks the schemes by their accuracy in predicting RDP and RUP.
The original scheme ranked 7th and 5th in predicting RDP and RUP, respectively,
while scheme 7 (in which the insoluble fraction was combined into one fraction, and
fraction A = NPN) was the best.
Table 4. 7. Ranking of the protein fractionation schemes based on their ability to
predict rumen degradable protein (RDP) supply, and rumen undegradable protein
(RUP) flow as assessed by their root mean square prediction error (RMSPE).
Schemes1 RDP RUP RMSPE Ranking Ranking
1 248.3 7 275 5 2 284.2 9 292.2 8 3 185.2 3 225.5 2 4 210.1 5 317.3 9 5 256 8 241.9 4 6 203 4 283.7 6 7 166.6 1 209.5 1 8 243.6 6 284.1 7 9 183.3 2 239.1 3 10 445.3 10 466.8 10
1Schemes description: 1 = Original, 2 = Original scheme with adjusted B3 rates, 3 = A fraction as non amino nitrogen (NAAN), 4 = A fraction as NAAN and adjusted B1 rates, 5 = A fraction as NAAN and adjusted B3 rates, 6 = A fraction as NAAN and adjusted B1 and B3 rates, 7 = Aggregated insoluble fraction, A as non-protein N (NPN), 8 = Aggregated insoluble fraction, A as NAAN, 9 = Aggregated insoluble fraction, A fraction as NPN, and adjusted B1 rates, and 10 = Aggregated insoluble fraction, A fraction as NAAN, and adjusted B1 rates

133
4.5. Discussion
The original scheme over predicted RDP supply and under predicted RUP
flows when compared against omasal flow data. Evaluations using previous versions
of the CNCPS model reported the same directionality for biases (Bateman, et al.,
2001b, Kohn, et al., 1998), but the RMSPE in this study are considerable lower than
previously reported (Bateman, et al., 2001a, Kohn, et al., 1998). Greater accuracy is
probably the result of a more homogenous data base and the use of feed analyses when
available rather than reliance on the feed library. Likely contributing factors to the
over prediction of RDP supply in the original scheme are the predicted high
degradability of the B2 fraction, and the almost complete degradation of the soluble
protein (B1+A). For most feeds, the B2 fraction represents the largest protein pool size
(Sniffen, et al., 1992) and the default degradation rates for the B2 fraction are greater
than most of the in situ and in vitro estimates (NRC, 2001). In addition, for most
feeds, the B1 fraction represents a small percentage of the total soluble protein (Table
4.3), and most of the soluble protein is allocated into the A fraction, which is assumed
to be immediately converted to ammonia. As a result, and similar to results with the in
situ method, almost no soluble protein is predicted to be in the RUP. On average, the
predicted RUP contained mostly B2 protein (~ 75 %), B3 + C fractions (~ 20 %), and
small amounts of B1 (~ 5 %). However, for the studies included in the evaluation, the
free AA-N was represented in the RUP in a proportion similar to the NDIN (Table
4.2). In other studies, the peptide-N was identified to be the most important amino N
flowing out from the rumen in the liquid phase (Choi, et al., 2002a). Within the
insoluble fraction, the contribution of the B3 and C fractions were also over estimated.
The original scheme over predicted NDICP flow out of the rumen (Table 4.5). The
CNCPS feed library values for the degradation rates of the B3 fraction are virtually 0,
and therefore it almost completely escapes. When values for the degradation rates for

134
the B3 fraction were reassessed and adjusted (Table 4.4), the predictions of NDICP
were improved (Table 4.5). However, adjusting rates for the B3 fraction with no other
changes in the fractionation (scheme 2) increased the bias in RDP and RUP
predictions. The CNCPS model was only sensitive to NDICP measurements for feeds
that contain a high proportion of protein as NDICP (Chapter 3), but it is for those
feeds (i.e. tropical forages) that rates consistently higher than CNCPS B3 feed library
values have been reported (Coblentz, et al., 1999, Juarez, 1998, Ogden, et al., 2006).
Changes in the fractionation scheme were proposed to address some of the
issues indicated previously. The contribution of the soluble N fractions to the RUP
flows was improved by accounting for all the AAN pool in the soluble protein and
adjusting B1 rates. Adjusting the B1 fraction to represent the AAN pool (scheme 3)
resulted in the lowest bias in RDP and RUP of all the schemes. From a nutritional
point of view, the AAN fraction represents a more homogenous fraction than the NPN
fraction. In addition, AAN may be a less variable than the current B1 fraction, and
therefore it may be more robust for use as default feed library values. Silages are the
feeds with the greatest variation in the composition of the soluble protein fraction
(McDonald, et al., 1991). In well fermented silages, with predominantly lactic acid
fermentation, free AAN is the main fraction within the NPN since lactic acid bacteria
have limited ability to ferment AA, with the exception of serine and arginine (Givens
and Rulquin, 2004). Although differences in in vivo degradation rates of long peptides,
short peptides, and free amino acids have been reported (Volden, et al., 2002), all
reported values were greater than >1.5/h, and the original CNCPS protein
fractionation scheme is rather insensitive to differences in such high rates (see
Chapter 3).
Aggregating the insoluble fractions and using the IIV rates for the combined
fraction (scheme 7) resulted in the scheme with the greatest accuracy for both RDP
135
and RUP (Table 4.7). It also resulted in a change of the sign of the bias (over
predicting RUP, and under predicting RDP), but did not address the under
representation of the soluble N fractions in the RUP flows. Predicted RDP, RUP and
amino acids flows were very sensitive to protein B2 degradation rates (Chapter 3).
Combining both insoluble fractions (B2 + B3) makes the currently infeasible task of
measuring degradation rates much easier. An implicit assumption in using the IIV
rates for the insoluble fraction is that the rate for the insoluble fraction is directly
proportional to the overall rate. For most feed, the true soluble protein B1 represents a
small percentage of the total protein. An approach not tested but that would likely
increase the contribution of the soluble protein and reduce the over prediction of the
RUP flow is defining the A fraction as NAAN, and the using of the Michaelis-Menten
variant of the IIV method (Broderick and Clayton, 1992) to obtain rates for the
combined insoluble fraction.
4.6. Implementation
In order to implement the best ranked scheme (7, Aggregated insoluble
fraction, A as non-protein N (NPN)), the following aspects should be considered:
(1) To implement the scheme within the current feed library, the new insoluble
rate should be applied to both the B2 and B3 fractions, which would in practice
collapse the two fractions into one fraction in the current versions of CNCPS versions
5 and 6.
(2) The IIV method can be simplified by determining total N of the TCA-
supernatants with either the combustion assay or Kjeldahl (Broderick, et al., 2004c).
(3) For some groups of feeds the method may be less accurate, and
modifications or alternative methods should be considered. Degradation rates for feeds
containing high levels of ammonia and free amino acids (e.g. grass and legume
silages) are less accurate (Broderick, 1994). For those feeds, incubation of the
136
insoluble residue in buffer could reduce the background levels of the ammonia and
free amino acids background levels. The method also is not very accurate for tannin-
containing forages, and for those forages the Michaelis-Menten variant of the IIV
method may be the more feasible method (Broderick, 1994).
4.7. Conclusions
Improvements in the accuracy of RDP and RUP predictions of the original
CNCPS protein fractionation scheme were obtained when the insoluble fractions B2
and B3 were combined resulting in a single pool and degradation rate, which can be
measured with the IIV method. Evaluations of the NDICP flows indicated that the
escape of the NDICP was over predicted, and thus the concept that the N insoluble in
ND represents the slow degradable protein needs further revision. Improvements in
the accuracy of the predictions also were achieved when AA-N was accounted for in
the soluble fraction.

137
CHAPTER 5
A MODEL TO DESCRIBE THE DYNAMICS OF UREA RECYCLING AND
EXCRETION IN DAIRY CATTLE
5.1. Abstract
Reducing protein in the diet by formulating diets that more accurately meet
rumen nitrogen (N) and animal requirements is an important goal in cattle nutrition in
developed countries. Urea recycled to the rumen represents an N source for microbes,
while urinary urea N excretion must be accounted for in predicting ammonia losses
from a dairy herd. This chapter describes a dynamic mechanistic model developed to
be used as a component of ration formulation models to predict N recycling to the GIT
and urinary urea N. The model was developed with emphasis on the feedback
structure of the system. Recycling processes were modeled as positive feedbacks,
while renal excretion was modeled as a negative feedback. Both processes were
assumed to be regulated primary by N intake. Model simulations suggested that the
CNCPS underestimated the amount of urea recycling to the rumen for lactating dairy
cows.
5.2. Introduction
Reducing protein in the diet by formulating diets that more accurately meet
rumen nitrogen and animal requirements is an important goal in cattle nutrition, since
dairy farming is an important contributor to non-point source of environmental
pollution (NRC, 2003). Recently, ammonia volatilization has become an important
environmental issue because of the impact of ammonia emissions on the soil and
surface water acidification and eutrophication (Bussink and Oenema, 1998). On a

138
global scale, animal farming systems represent about 50 % of the total NH3 emissions
from terrestrial systems (NRC, 2003).
Dairy waste is a major source of NH3 emissions, with urinary urea being the
compound with the highest NH3 volatilization potential (Bussink and Oenema, 1998).
Ruminal ammonia is the main substrate for liver ureagenesis (Lapierre and Lobley,
2001). When dietary protein is degraded faster than the rate at which ammonia can be
assimilated by microbes, ruminal ammonia concentration increases. Ammonia is
absorbed across all sections of the digestive tract and converted into urea in the liver.
Once released into blood, urea is excreted in urine or re-enters the digestive tract by
diffusion into saliva or directly across the gut wall. The partition of urea between
recycling into the gastrointestinal tract (GIT) and excretion is highly variable and
depends on physiological processes and diet conditions (Lapierre and Lobley, 2001).
How urea is partitioned and excreted has multiple practical implications. Dietary
changes that reduce urinary urea concentration are effective tools to decrease ammonia
volatilization (Monteny, et al., 2002). Increasing the anabolic use of recycled urea can
improve nitrogen efficiency.
The objective of this study was to use accumulated research knowledge to (1)
identify variables related to the partition of urea outflows between GIT and kidney,
and (2) conceptualize and develop a dynamic mechanistic model of nitrogen fluxes in
dairy cows that can be used to characterize and predict the partition between urea
recycling and excretion.
5. 3. Materials and methods
5. 3. 1. Identifying variables related to urea partition
The urea flows to the GIT and kidney (g/d) can be described as the function of
urea concentration (g/L) times the renal or GIT clearance (L/d) (CR and CGIT,
respectively). Clearance of a substance from the body is defined as the volume of
139
distribution that is completely cleared per unit of time (Koeppen and Stanton, 1997).
Urea clearance depends on changes in the permeability of the kidney and GIT to urea
(Koeppen and Stanton, 1997). Therefore, variables linked to clearance are candidates
to be involved in the regulation of urea metabolism. Both CR and CGIT were computed
from experimental studies as the rate of urea flow divided by urea concentration, and
expressed in metabolic weight (L/(d×kg 0.75)):
C = 75.0][ BWUreaureaflow
× [5.1]
Data from studies that were mostly designed to test the effect of protein
supplementation on nitrogen metabolism and animal performance were used to model
renal clearance of urea (Table 5.1) (Broderick, 2003, Broderick and Radloff, 2004,
Gonda, et al., 1996, Haig, et al., 2002, Maltz and Silanikove, 1996, Olmos Colmenero
and Broderick, 2006a, Olmos Colmenero and Broderick, 2006b, Reynal and
Broderick, 2005, Sannes, et al., 2002, Valadares Filho, et al., 2000, Wattiaux and
Karg, 2004a).
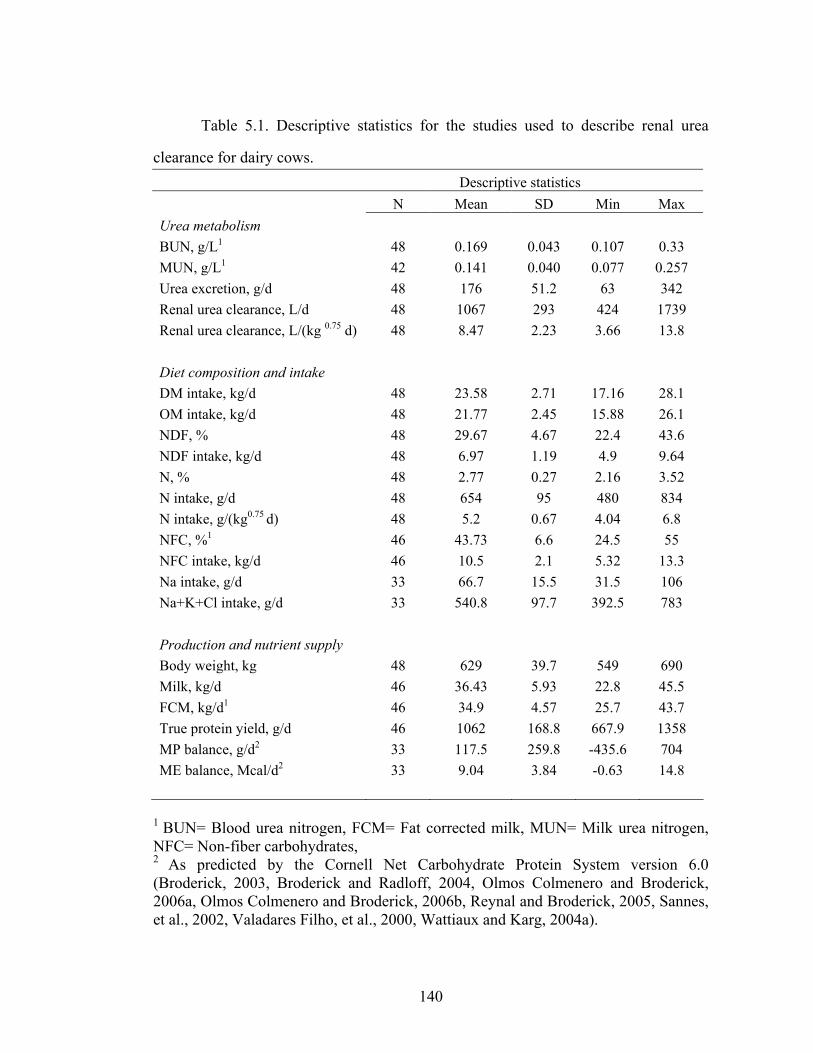
140
Table 5.1. Descriptive statistics for the studies used to describe renal urea
clearance for dairy cows. Descriptive statistics N Mean SD Min Max Urea metabolism BUN, g/L1 48 0.169 0.043 0.107 0.33 MUN, g/L1 42 0.141 0.040 0.077 0.257 Urea excretion, g/d 48 176 51.2 63 342 Renal urea clearance, L/d 48 1067 293 424 1739 Renal urea clearance, L/(kg 0.75 d) 48 8.47 2.23 3.66 13.8 Diet composition and intake DM intake, kg/d 48 23.58 2.71 17.16 28.1 OM intake, kg/d 48 21.77 2.45 15.88 26.1 NDF, % 48 29.67 4.67 22.4 43.6 NDF intake, kg/d 48 6.97 1.19 4.9 9.64 N, % 48 2.77 0.27 2.16 3.52 N intake, g/d 48 654 95 480 834 N intake, g/(kg0.75 d) 48 5.2 0.67 4.04 6.8 NFC, %1 46 43.73 6.6 24.5 55 NFC intake, kg/d 46 10.5 2.1 5.32 13.3 Na intake, g/d 33 66.7 15.5 31.5 106 Na+K+Cl intake, g/d 33 540.8 97.7 392.5 783 Production and nutrient supply Body weight, kg 48 629 39.7 549 690 Milk, kg/d 46 36.43 5.93 22.8 45.5 FCM, kg/d1 46 34.9 4.57 25.7 43.7 True protein yield, g/d 46 1062 168.8 667.9 1358 MP balance, g/d2 33 117.5 259.8 -435.6 704 ME balance, Mcal/d2 33 9.04 3.84 -0.63 14.8
1 BUN= Blood urea nitrogen, FCM= Fat corrected milk, MUN= Milk urea nitrogen, NFC= Non-fiber carbohydrates, 2 As predicted by the Cornell Net Carbohydrate Protein System version 6.0 (Broderick, 2003, Broderick and Radloff, 2004, Olmos Colmenero and Broderick, 2006a, Olmos Colmenero and Broderick, 2006b, Reynal and Broderick, 2005, Sannes, et al., 2002, Valadares Filho, et al., 2000, Wattiaux and Karg, 2004a).
141
Most of the information available on GIT urea entry for dairy has been derived
from net mass transfer estimates based on veno-arterial measurements across
splachnic tissues (Lapierre and Lobley, 2001). Studies reporting blood flow
measurements of the portal-drained viscera were used to model GIT urea entry
through the gut wall which does not consider salivary contributions because salivary
glands do not drain to the portal vein (Table 5. 2) (Bach, et al., 2000, Benson, et al.,
2002, Berthiaume, et al., 2006, Blouin, et al., 2002, Casse, et al., 1994, Delgado-
Elorduy, et al., 2002a, Delgado-Elorduy, et al., 2002b, Raggio, et al., 2004, Reynolds,
et al., 2003, Reynolds, et al., 1988).
Both linear and quadratic relationships among variables related to diet
composition, nutrient supply, and production and nutrient clearances were explored
(Table 5.1 and 5.2). The MIXED procedure of SAS (2002) was used (Littell, et al.,
1996). A random coefficients model was fitted with study as a random variable. No
pattern in the covariance (unstructured) was assumed. If interactions among variance
components were not significant, the simple variance component covariance was used
(Littell, et al., 1996). If study effect was not significant, the GLM procedure of SAS
(2002) was used.

142
Table 5.2. Descriptive statistics for the studies used to describe gastrointestinal
(GIT) urea clearance for dairy cows.
N Mean SD Min Max Body Weight, kg 28 598 78.1 434 684
Dry matter intake, kg/d 28 20 2.9 14.5 23.7 DIM, d1 28 83 53 11 210
Milk, kg/d 26 33.6 7.63 15.9 47.7 True protein yield, g/d 26 1047 237.8 668 1464
N intake, g/d 28 576 122.3 363 925 N intake, g/(kg0.75d) 28 4.9 1.4 2.8 9.3
OM intake, kg/d1 26 18.7 2.4 13.6 21.5 NDF intake, kg/d 24 6.5 1.20 4.8 8.9
BUN, g/L1 28 0.19 0.061 0.07 0.32 Net portal urea flow, g N/d 28 166 89.9 30 408 GIT urea clearance, L/d1 28 982 475.9 168 2204
GIT urea clearance, L/(kg 0.75 d) 28 8.1 3.7 1.3 17
1 BUN= Blood urea nitrogen, DIM= Days in milk, GIT= Gastrointestinal tract, OM= Organic matter
5. 3. 2. Dynamic model
5.3.2.1. Conceptual model
A dynamic mechanistic model was developed with emphasis on the underlying
feedback structure and the effect of the feedback loops on the behavior of the state
variables (Franklin, et al., 1991, Milhorn, 1966). Both homeostatic and homeorhetic
regulations involve multiple feedbacks. In a feedback process, some flow or
information of the output of a system is passed to the input with the objective of
smoothing and adjusting nutrient and metabolic flows (Milhorn, 1966). The behavior
of a system arises from the interaction between two types of feedbacks, positive and
negative. Negative feedbacks cause the influence of a disturbance to a regulator to be
minimized, so that the system maintains, within limits, a constant output (Milhorn,

143
1966). Positive feedback causes the output to increase or decrease continually due to
an initial disturbance, and gives the system the ability to reach new points of
equilibrium (Milhorn, 1966). Figure 5.1 identifies the main feedback mechanisms
included in the model. Similar feedbacks have been described for the hindgut (not
shown in figure 5.1). For the loops involved directly in the partition of urea, the open
loop gain was calculated. The gain of a feedback loop is the strength of the signal
return by the loop (Sterman, 2000). It was calculated by breaking the loops (renal urea
excretion, hindgut wall recycling, rumen wall recycling, and saliva recycling loops) at
the body urea pool and calculating the change in the size of body urea pool as it
returns to itself with the chain rule from the gains of the individual links of the loops
(Sterman, 2000):
Open loop gain = )(...)()(1
2
1
1I
n
n
n
O
xx
xx
xx
∂∂
××∂∂
×∂∂
−
[5.2]
5.3.2.2. Model description
To represent the feedback loops presented in Figure 5.1, three main
subcomponents were included in the model; (1) the flows of carbohydrates, protein,
and microbes within the rumen and hindgut as needed to describe the anabolic use of
urea, (2) the flows of non-protein N between rumen, hindgut, and body pools, and (3)
a simple representation of the body amino acids (AA) transactions to account for AA
oxidation.
Ruminal and hindgut carbohydrate, and protein flows and microbial growth
Dietary carbohydrates were divided into available fiber (FC), unavailable fiber
(UC), and non-fiber carbohydrates (NFC) (Table 5.3).

144
Figure 5.1. Schematic representation of the positive and negative loops
affecting the dynamics of urea metabolism included in the model. Arrows represent
causal links between variables. The positive sign at the arrowheads indicates that both
variables have the same directionality, while the negative sign indicates that as one of
the variables increase, the dependent variable decreases or vice versa. Positive and
negative feedback loops are represented by positive and negative signs within the
semi-circle arrow. Variables within a box are state variables.

Ruminal ammonia
Ruminal microbes
Plasma urea
Renal ureaexcretion
Microbial turnover+
-
+
+
Urea transfer acrossthe rumen wall
+
+
Urea transferthrough saliva
+
+
+
-
-Ammoniauptake
+ Wallrecycling+ Saliva
recycling
- Renalexcretion
+Intrarumenrecycling
Ammoniaabsorption
+
+Free Amino acids
Exceed targetaminoacidemia
Amino acidoxidation
+
+
+
+
-Aminoacidemia
downregulation
Body protein
Protein synthesis+
+
Proteinbreakdown
+
+
+Protein
turnover
Targetaminoacidemia
Under targetaminoacidemia
-+
-
+
-Aminoacidemiaup regulation
145
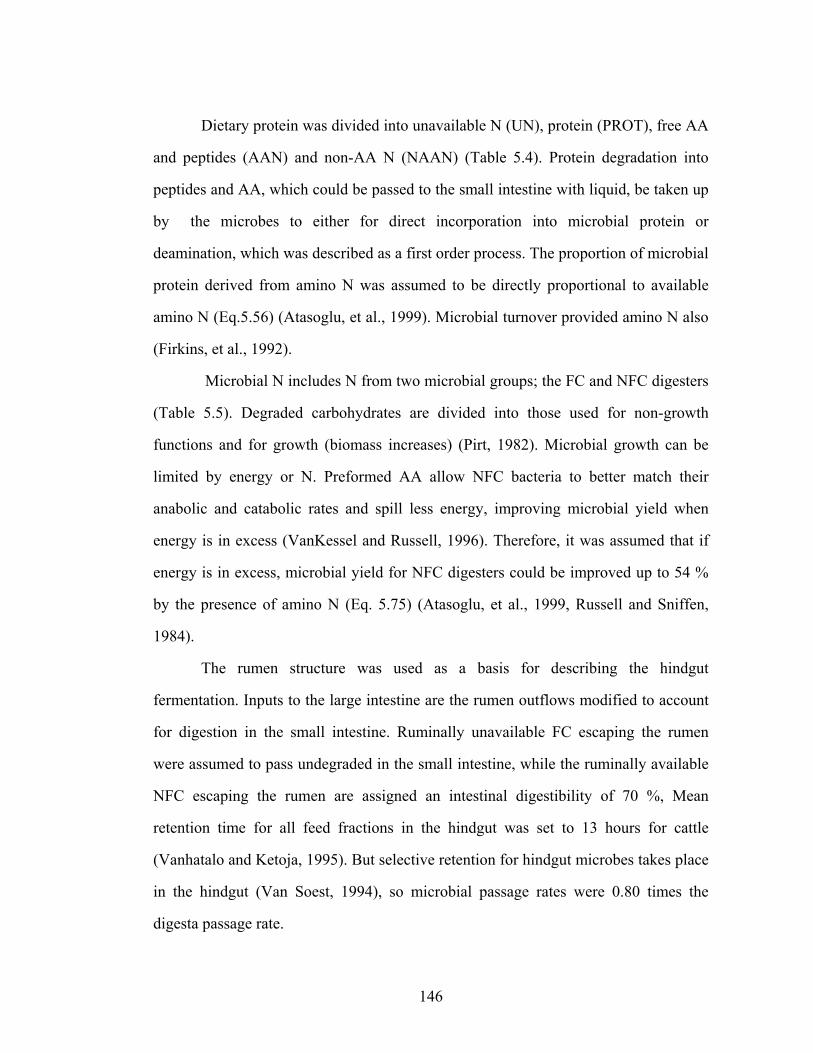
146
Dietary protein was divided into unavailable N (UN), protein (PROT), free AA
and peptides (AAN) and non-AA N (NAAN) (Table 5.4). Protein degradation into
peptides and AA, which could be passed to the small intestine with liquid, be taken up
by the microbes to either for direct incorporation into microbial protein or
deamination, which was described as a first order process. The proportion of microbial
protein derived from amino N was assumed to be directly proportional to available
amino N (Eq.5.56) (Atasoglu, et al., 1999). Microbial turnover provided amino N also
(Firkins, et al., 1992).
Microbial N includes N from two microbial groups; the FC and NFC digesters
(Table 5.5). Degraded carbohydrates are divided into those used for non-growth
functions and for growth (biomass increases) (Pirt, 1982). Microbial growth can be
limited by energy or N. Preformed AA allow NFC bacteria to better match their
anabolic and catabolic rates and spill less energy, improving microbial yield when
energy is in excess (VanKessel and Russell, 1996). Therefore, it was assumed that if
energy is in excess, microbial yield for NFC digesters could be improved up to 54 %
by the presence of amino N (Eq. 5.75) (Atasoglu, et al., 1999, Russell and Sniffen,
1984).
The rumen structure was used as a basis for describing the hindgut
fermentation. Inputs to the large intestine are the rumen outflows modified to account
for digestion in the small intestine. Ruminally unavailable FC escaping the rumen
were assumed to pass undegraded in the small intestine, while the ruminally available
NFC escaping the rumen are assigned an intestinal digestibility of 70 %, Mean
retention time for all feed fractions in the hindgut was set to 13 hours for cattle
(Vanhatalo and Ketoja, 1995). But selective retention for hindgut microbes takes place
in the hindgut (Van Soest, 1994), so microbial passage rates were 0.80 times the
digesta passage rate.
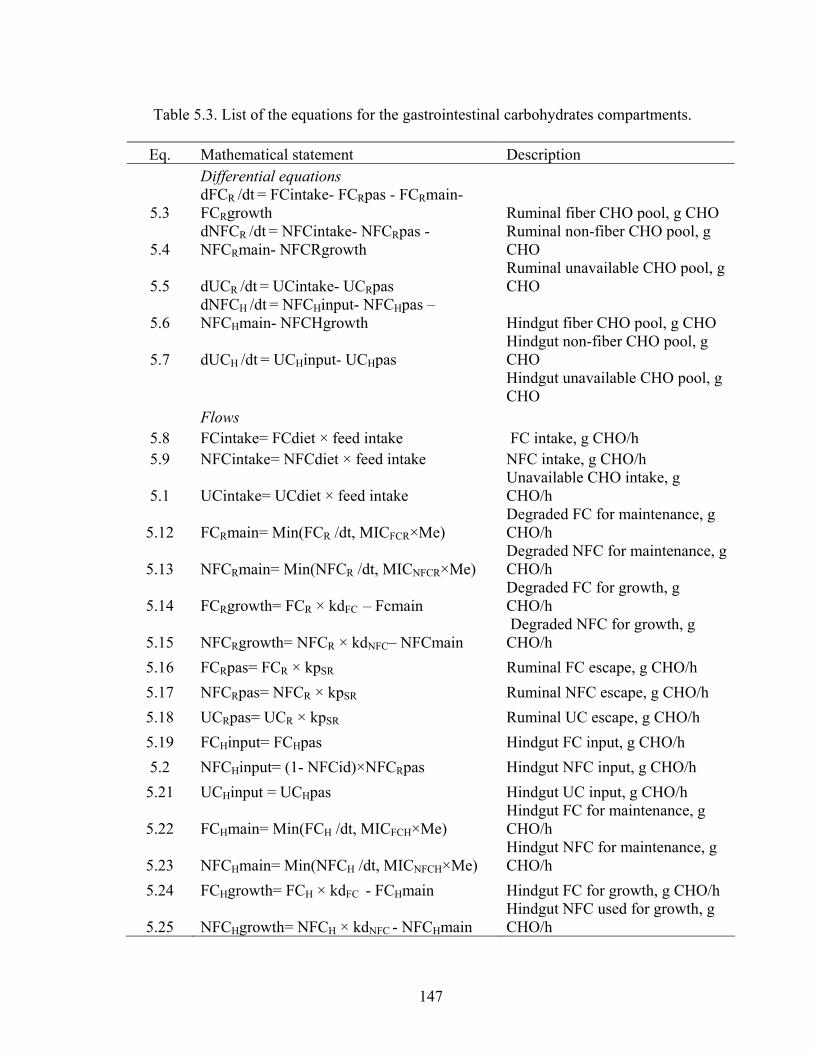
147
Table 5.3. List of the equations for the gastrointestinal carbohydrates compartments.
Eq. Mathematical statement Description Differential equations
5.3 dFCR /dt = FCintake- FCRpas - FCRmain- FCRgrowth Ruminal fiber CHO pool, g CHO
5.4 dNFCR /dt = NFCintake- NFCRpas - NFCRmain- NFCRgrowth
Ruminal non-fiber CHO pool, g CHO
5.5 dUCR /dt = UCintake- UCRpas Ruminal unavailable CHO pool, g CHO
5.6 dNFCH /dt = NFCHinput- NFCHpas – NFCHmain- NFCHgrowth Hindgut fiber CHO pool, g CHO
5.7 dUCH /dt = UCHinput- UCHpas Hindgut non-fiber CHO pool, g CHO
Hindgut unavailable CHO pool, g CHO
Flows 5.8 FCintake= FCdiet × feed intake FC intake, g CHO/h 5.9 NFCintake= NFCdiet × feed intake NFC intake, g CHO/h
5.1 UCintake= UCdiet × feed intake Unavailable CHO intake, g CHO/h
5.12 FCRmain= Min(FCR /dt, MICFCR×Me) Degraded FC for maintenance, g CHO/h
5.13 NFCRmain= Min(NFCR /dt, MICNFCR×Me) Degraded NFC for maintenance, g CHO/h
5.14 FCRgrowth= FCR × kdFC – Fcmain Degraded FC for growth, g CHO/h
5.15 NFCRgrowth= NFCR × kdNFC– NFCmain Degraded NFC for growth, g CHO/h
5.16 FCRpas= FCR × kpSR Ruminal FC escape, g CHO/h 5.17 NFCRpas= NFCR × kpSR Ruminal NFC escape, g CHO/h 5.18 UCRpas= UCR × kpSR Ruminal UC escape, g CHO/h 5.19 FCHinput= FCHpas Hindgut FC input, g CHO/h 5.2 NFCHinput= (1- NFCid)×NFCRpas Hindgut NFC input, g CHO/h 5.21 UCHinput = UCHpas Hindgut UC input, g CHO/h
5.22 FCHmain= Min(FCH /dt, MICFCH×Me) Hindgut FC for maintenance, g CHO/h
5.23 NFCHmain= Min(NFCH /dt, MICNFCH×Me) Hindgut NFC for maintenance, g CHO/h
5.24 FCHgrowth= FCH × kdFC - FCHmain Hindgut FC for growth, g CHO/h
5.25 NFCHgrowth= NFCH × kdNFC - NFCHmain Hindgut NFC used for growth, g CHO/h

148
Table 5.3. (Continued)
Eq. Mathematical statement Description
5.26 FCHpas= FCH × kpSH Hindgut FC escape, g CHO/h 5.27 NFCHpas= NFCH × kpSH Hindgut NFC escape, g CHO/h 5.28 UCHpas= UCH × kpSH Hindgut UC escape, g CHO/h
Auxiliary equations
5.29 Feed intake= dry matter intake × n meals Feed intake flow, kg DMI/h
Table 5.4. List of the equations for the gastrointestinal amino-N compartments.
Eq. Mathematical statement Description Differential equations
5.30 dPROTR /dt = PROTintake- PROTRpas - PROTRdeg Ruminal protein pool, g N
5.31
dAAR/dt= AAintake + PROTRdeg + TurnoverNFCR + TurnoverNNFCR - UptakeAAMICNFCR- AARdeam - AARpas
Ruminal Amino acid + peptides pool, g N
5.32 dUNR/dt= UNintake-UNRpas Ruminal unavailable N pool, g N
5.33 dPROTH /dt = PROTHinput- PROTHpas – PROTHdeg Hindgut protein pool, g N
5.34
dAAH/dt= PROTHdeg + TurnoverNFCH + TurnoverNNFCH –UptakeMICNFCH – AAHdeg – AAHpas
Hindgut amino acid + peptides pool, g N
5.35 dUNH/dt= UNRpas - UNHpas Hindgut unavailable N, g N Flows
5.36 PROTintake= (Dietary N-NAAN-UN) × Feed intake Available AAN intake, g N/h
5.37 PROTRpas= PROTR × kpRS Ruminal protein escape, g N/h 5.38 PROTRdegr = PROTR × kdPROT Ruminal protein degradation, g N/h
5.39 TurnoverNFCR= TurnoverFCR × Nmic N from turnover of FC microbes, g N/h
5.40 TurnoverNNFCR= TurnoverNFCR × Nmic N from turnover of NFC microbes, g N/h
149
Table 5.4. (Continued)
Eq. Mathematical statement Description
5.41 UptakeAAMICNFCR = NFCRgrowth × Nmic × cAAuptakeR
AAN uptake by NFC microbes, g N/h
5.42 Aaintake= AAN × Feed intake Free amino acids and peptides intake, g N/h
5.43 AARdeam= AAR × kdAA Amino acid N deamination, g N/h 5.44 AARpas = AAR × kpLR Amino acid N escape, g N/h 5.45 UNintake= UN×Feed intake Unavailable N intake, g N/h 5.46 UNRpas = UNR × kpRS Unavailable N escape, g N/h
5.47
PROTHinput= PROTid×(PROTRpas+ MICNFCRpas×Nmic + MICFCRpas×Nmic) Hindgut AAN input, g N/h
5.48 PROTHpas= PROTH × kpH Hindgut AAN escape, g N/h
5.49 PROTHdegr = PROTH × kdPROT Hindgut protein degradation, g N/h
5.5 TurnoverNFCH= TurnoverFCH × Nmic N from turnover of FC microbes, g N/h
5.51 TurnoverNNFCH= TurnoverNFCH × Nmic N from turnover of FC microbes, g N/h
5.52 UptakeMICNFCH = NFCHgrowth × Nmic × cAAuptakeH Uptake by NFC microbes, g N/h
5.53 AAHdeam= AAH × kdAA AAN degradation, g N/h 5.54 AAHpas = AAH × kpH AAN escape, g N/h 5.55 UNHpas = UNH× kpH Unavailable N escape, g N/h
Auxiliary equations
5.56 cAAuptakeRorH = 0.0119 + 0.6997 × ([AA]R or H/([AA]R or H + [NH3]R or H))
Proportion of N uptake as amino N, dmnl

150
Table 5.5. List of the equations for the gastrointestinal microbial compartments.
Eq. Mathematical statement Description
Differential equations
5.57 dMICFCR/dt = GrowthFCR - TurnoverFCR - PassageFCR Ruminal FC microbes, g MIC/h
5.58 dMICNFCR/dt = GrowthNFCR - TurnoverNFCR - PassageNFCR Ruminal NFC microbes, g MIC/h
5.59 dMICFCH/dt = GrowthFCH - TurnoverFCH - PassageFCH Hindgut FC microbes, g MIC/h
5.60 dMICNFCH/dt = GrowthNFCH - TurnoverNFCH - PassageNFCH Hindgut NFC microbes, g MIC/h
Flows
5.61 GrowthFCR = MIN(µFCRN,µFCRE) × MICFCR FC microbial growth, g MIC/h 5.62 TurnoverFCR = MICFCR × ktMIC FC microbial turnover, g MIC/h 5.63 PassageFCR = MICFCR × kpSR FC microbial escape, g MIC/h
5.64 GrowthNFCR = MIN(µNFCRN,µNFCRE) × MICNFCR × ImpAAR NFC microbial growth, g MIC/h
5.65 TurnoverNFCR = MICNFCR × ktMIC NFC microbial turnover, g MIC/h 5.66 PassageNFCR = MICNFCR × kpMICR NFC microbial escape, g MIC/h 5.67 GrowthFCH = MIN(µFCHN,µFCHE) × MICFCH FC microbial growth, g MIC/h 5.68 TurnoverFCH = MICFCH × ktMIC FC microbial turnover, g MIC/h 5.69 PassageFCH = MICFCH × kpH×selret FC microbial escape, g MIC/h
5.70 GrowthNFCH = MIN(µNFCHN,µNFCHE) × MICNFCH× ImpAAH NFC microbial growth, g MIC/h
Auxiliary equations
5.71 µFCRN = UptakeNH3MICFCR/Nmic/ MICFCR N limited specific growth FC microbes, h-1
5.72 µFCRE = Ymax× FCRgrowth / MICFCR E limited specific growth FC microbes, h-1
5.73 µNFCRN = (UptakeAAMICNFCR +UptakeNH3MICNFCR)/Nmic/ MICFCR
N limited specific growth NFC microbes, h-1
5.74 µNFCRE = Ymax × NFCRgrowth / MICNFCR E limited specific growth NFC microbes, h-1
5.75
ImpAAR= 1 + 0.49× (UptakeAAMICNFCR/(UptakeAAMICNFCR
+UptakeNH3MICNFCR))
For µNFCRE > µNFCRN , Yield improvement due to AA availability, dmnl

151
Non-protein nitrogen flows
Non protein N is described by three compartments; ruminal ammonia, hindgut
ammonia and body urea (Figure 5. 2).
Rumen ammonia, g N
Body urea, g N
Rumen Deamination
Saliva recyclingRumen wall
absorption + PassageRumen wallrecycling
Uptake by rumenmicrobes
Amino acidoxidation
Renal excretion
Hindgut ammonia, g N
Hindgut DeaminationUptake by hindgut
microbes
Hindgut wallrecycling
Hindgut wallabsorption
Excretion
Dietary non amino N intake
Figure 5.2. Representation of the inflows and outflows of the non-protein
nitrogen compartments.

152
With the exception of the salivary urea transfer, the remaining flows were
represented as first-order processes (Table 5.6). Saliva urea flow was saliva flow times
saliva urea concentration (Eq.5.81); EAT, RUM, and RES are Boolean variables that
have values of 0 or 1. A value of 1 indicates that the action (EAT=eating,
RUM=ruminating, RES=resting) took place during the current interval of time. The
saliva flow depends on the chewing activity of the animal (Beauchemin, 1991).
Rumination activity follows a circadian pattern, with the greatest proportion of
rumination occurring at night (Beauchemin, et al., 1990, Murphy, et al., 1983). In
order to account for differences in the rumination frequency during the day, a
sinusoidal function, derived from the spectral analysis of rumination data, was used to
describe the probability that the animal ruminates within a daily cycle (Eq. 5.96).
Fractional rates of urea excretion and GIT recycling were described as
functions of N intake. The fractional rate of urea excretion (Eq. 5.97) was described as
a linear function of N intake (g/d) using the database described in Table 5.1. A
segmented-linear model was used to describe the rate of urea entry to the GIT (kgit, h-1)
in relation to N intake (Eq.5.90 and 5.91). It was assumed that the amount of urea
returning to the GIT was partitioned between the rumen and hindgut in relation to the
amount of carbohydrate fermented in each site (Eq. 5.89).

153
Table 5.6. List of the equations for the non protein nitrogen compartments
Eq. Mathematical statement Description
Differential equations
5.76
dNH3R/dt = NAANintake + DeamAAR + RecWallR + RecSal – UptakeNH3MICFCR-UptakeMICNFCR – AbsorpNH3R
Rumen ammonia pool, N g
5.77
dNH3H/dt = DeamAAH + RecWallH - UptakeMICFCH-UptakeMICNFCH – AbsorpNH3H- PassageNH3H
Hindgut ammonia pool, N g
5.78 dUrea/dt= AbsorpNH3R + AbsorpNH3H + AAoxidation –RecWallR – RecSal - RecWallH – Renalexc Body urea pool, N g
Flows
5.79 NAANintake = NAAN × feed intake Non-amino N intake, N g/h
5.80 RecWallR= Site× kgit × Urea Urea recycling through rumen wall, N g/h
5.81
RecSal= EAT×SFchew × BW0.75× [urea]s + RES × SFres × BW0.75 [urea]s+ RUM × SFchew × BW0.75 × [urea]s
Urea recycling through saliva, g N/h
5.82 AbsorpNH3R = kabsNH3 × NH3R Ammonia absorption, g N/h
5.83 RecWallH= (1-Site)× kgit × Urea Urea recycling through hindgut wall, g N/h
5.84 UptakeMICFCH = GrowthFCH× Nmic Ammonia uptake by FC microbes, g N/h
5.85 UptakeMICNFCH =(1- cAAuptake)×GrowthNFCH× Nmic Ammonia uptake by NFC microbes, g N/h
5.86 PassageNH3H = NH3H × kpH Ammonia passage, g N/h
5.87 AAoxidation= ([AA]b×Vb – [AA]btarget×Vb)/AT for [AA]b > [AA]btarget
5.88 Renalexc= kexc × Urea Renal urea excretion, g N/ h

154
Table 5.6 (Continued)
Eq. Mathematical statement Description Auxiliary equations
5.89 Site = (FCR × kdFC + NFCR × kdNFC )/(FCR × kdFC + NFCR × kdNFC + FCH × kdFC + NFCH × kdNFC)
Site of urea entry, dmnl
5.90 kgit= 0.131
Rate of urea transfer to the GIT for Nint > 417 g N/d
5.91 kgit= 0.7983 – 0.0016 × Nint
Rate of urea transfer to the GIT for Nint < 417 g N/d
5.92 [urea]s= 0.53 × [urea]b Urea concentration in saliva, g N/L
5.93 Chew time= 2.86 + 0.281 × NDF Daily hours spend chewing, h
5.94 Rum time= chew time – eating time Daily ruminating time, h
5.95 Res time= 24 h – chew time Daily resting time, h
5.96 P(ruminating| no eating) =(Rum time / (Rum time + resting time))× A × cos ( wt + θ)
Probability of ruminating given that the animal is not eating
5.97 kexc = 0.0001874 × Nint (g N/d) Fractional rate of urea excretion, h-1
Body amino acids flows
An aggregate representation of the amino acid flows based on the concepts
described by Waterlow (1999, 1978) was developed (Table 5.7). Two AA pools were
included; the free AA pools and a body AA pool. The inflows to the free AA pools
were the dietary and microbial AA inputs and the AA from the turnover of body
protein. Flows from the free AA pool included the export of AA as milk, the synthesis
of body protein and AA oxidation. Aminoacidemia is maintained within a tide range.
A target average of 0.025 g N/L was assumed (Lobley, 2003, Waterlow, 1999). When
the free AA pool deviates from its target, two negative feedback mechanisms come

155
into play; if AA are in excess, oxidation activates. If AA are deficient, an increase in
the breakdown of body AA occurs. For dairy cows, protein synthesis required for
functions other than milk output was found to be fairly constant, and independent of
the stage of lactation (Lapierre, et al., 2002, Lapierre, et al., 2005), and therefore basal
rates of synthesis and breakdown are assumed to be constants.
Table 5.7. List of the equations for the body amino acids compartments
Eq. Mathematical statement Description Differential equations
5.98 dFreeAAb/dt= PROTsupply + BreakAAb- SyntAAb – Mamgland-AA oxidation Blood free AA pool, g N
5.99 dBodyAA/dt= SyntAAb – BreakAAb Body AA pool, g N Flows
5.100 PROTsupply= PROTid ×( PassageNFCR× Nmic+ PassageFCR×Nmic-Nnuc +PROTRpas +AARpas) AA nitrogen supply, g N/h
5.101 BreakAAb = kbreak × BodyAA + |([AA]b×Vb – [AA]btarget×Vb)|/AT
Breakdown body protein, g N/h, for [AA]b < [AA]btarget
5.102 SyntAAb = ksynt × BodyAA Synthesis body protein, g N/h
5.103 Mamgland= (Cmgsyn × Milk × Protmilk )/6.38 Mammary gland protein synthesis, g N/h

156
Table 5.8. Definition and numerical value of parameters
Parameter Description Parameter
value Reference
Θ Phase 1.89 h Beauchemin et al (1990)
[AA]btarget Target blood amino acids concentration 0.025 g N/L Lobley (2003)
A Amplitude 0.128 h Beauchemin et al (1990)
AT Adjustment time 0.1 h
Cmgsyn Ratio mammary gland protein synthesis-protein output 1.35 dmnl Bequette et al (1996)
kabsNH3 Fractional rate ammonia absorption 0.75 h-1 Oldick et al. (2000)
kbreak Basal fractional rate of protein breakdown 0.00151 h-1 Lobley et al. (1980)
kdAA Fractional rate of AA degradation 1.35 h-1 Oldick et al. (2000)
kdFC Fractional rate of FC degradation 0.05 h-1
kdNFC Fractional rate of NFC degradation 0.15 h-1
kdPROT Fractional rate of protein degradation 0.15 h-1
kpLR Fractional rate of liquid passage in the rumen 0.14 h-1
kpmicR Fractional rate of microbial passage in the rumen 0.08 h-1
kpSH Fractional rate of digesta passage in the hindgut 0.08 h-1
Vanhatalo and Ketoja (1995)
kpSR Fractional rate of solid passage in the rumen 0.05 h-1
ksynt Basal fractional rate of protein synthesis 0.0019 h-1 Lapierre et al. (2005)
ktMIC Fractional rate of microbial turnover 0.05 h-1
Me Microbial maintenance 0.05 g CHO/ Russell and Baldwin (g MIC×h) (1979)
NFCid Small intestinal digestibility of NFC 0.70 dmnl
Nmic Nitrogen content of microbes 0.10 g N/ g MIC Clark et al (1992)
Nnuc Nitrogen content of microbes as nucleic acids
0.01 g N/ g MIC Clark et al (1992)
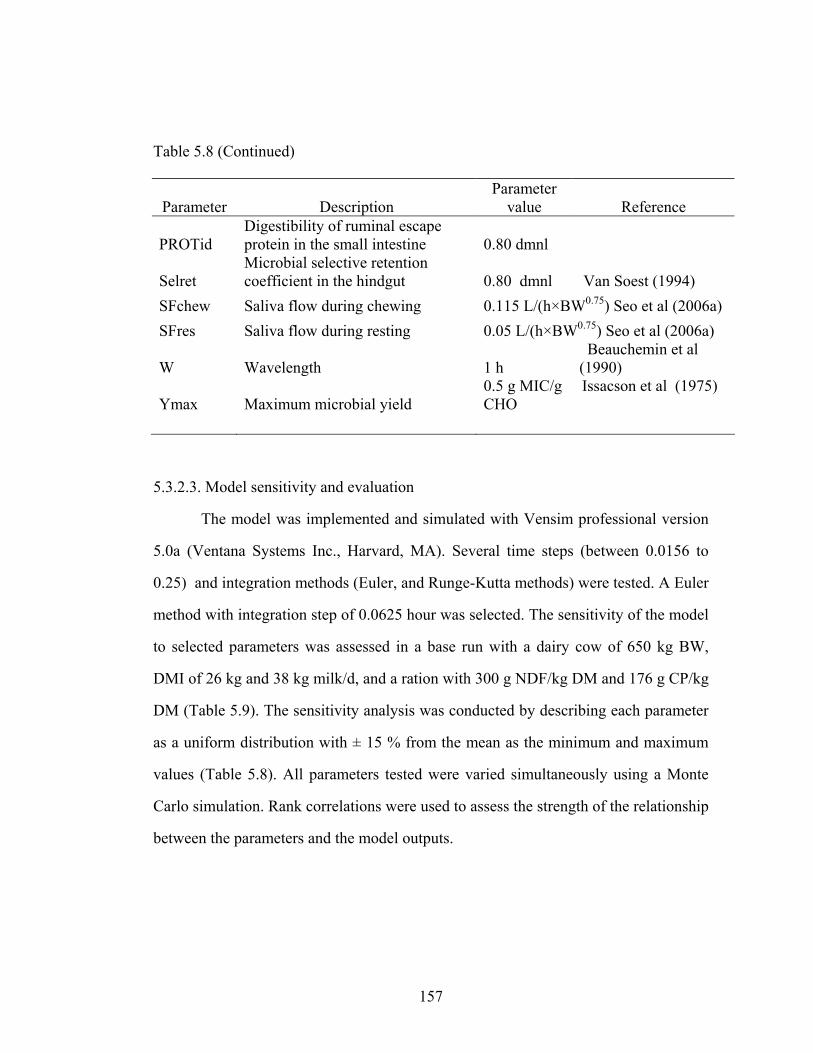
157
Table 5.8 (Continued)
Parameter Description Parameter
value Reference
PROTid Digestibility of ruminal escape protein in the small intestine 0.80 dmnl
Selret Microbial selective retention coefficient in the hindgut 0.80 dmnl Van Soest (1994)
SFchew Saliva flow during chewing 0.115 L/(h×BW0.75) Seo et al (2006a) SFres Saliva flow during resting 0.05 L/(h×BW0.75) Seo et al (2006a)
W Wavelength 1 h Beauchemin et al (1990)
Ymax Maximum microbial yield 0.5 g MIC/g Issacson et al (1975) CHO
5.3.2.3. Model sensitivity and evaluation
The model was implemented and simulated with Vensim professional version
5.0a (Ventana Systems Inc., Harvard, MA). Several time steps (between 0.0156 to
0.25) and integration methods (Euler, and Runge-Kutta methods) were tested. A Euler
method with integration step of 0.0625 hour was selected. The sensitivity of the model
to selected parameters was assessed in a base run with a dairy cow of 650 kg BW,
DMI of 26 kg and 38 kg milk/d, and a ration with 300 g NDF/kg DM and 176 g CP/kg
DM (Table 5.9). The sensitivity analysis was conducted by describing each parameter
as a uniform distribution with ± 15 % from the mean as the minimum and maximum
values (Table 5.8). All parameters tested were varied simultaneously using a Monte
Carlo simulation. Rank correlations were used to assess the strength of the relationship
between the parameters and the model outputs.

158
Table 5.9. Definition of inputs and initial values used for the sensitivity analysis Inputs Description Values AAN Dietary free amino acids and peptides, g N/kg DM 3 Dietary N Dietary nitrogen concentration, g N/ kg DM 28.2 DMI Dry matter intake, kg/d 26.4 Duration meal Duration of a meal, h 1 Eating time Daily time spending eating h 12 FCdiet Dietary fiber carbohydrate concentration, g CHO/kg DM 225 Milk Milk production, kg/d 38 NAAN Dietary non-amino nitrogen, g N/kg DM 9.2 NFCdiet Dietary non-fiber carbohydrate concentration, g CHO/kg DM 400 Nmeal Number of meals a day, meals/d 12 Protmilk Milk true protein content, g / kg milk 30.5
UC Dietary unavailable carbohydrate concentration, g CHO/kg DM 75
UN Dietary unavailable nitrogen, g N/kg DM 5
Model predictions for urea GIT entry and urea excretion at steady state were
compared to observations from studies of urea kinetics with double labeled urea
(Lapierre, et al., 2004, Ruiz, et al., 2002). Root mean square prediction error
(RMSPE) and coefficients of determination were estimated. Mean square deviations
were partitioned into three independent and additive components (Theil, 1961); mean
bias, slope bias, and random unexplained errors.
5. 4. Results and discussion
5.4.1. Identifying variables related to urea partition
Statistics describing the data and linear relationships between dietary and
productive variables and renal urea clearance are presented in Tables 5.1 and 5.3. Both

159
renal urea clearance and urea excretion varied considerably, and had similar
coefficients of variation (27 and 29 %, respectively). The average renal urea clearance
was 1067 L/d (8.47 L/(kg0.75 × d)) (Table 5.1). Several studies have estimated renal
urea clearance rates by regressing total urinary N against milk or plasma urea N
concentrations (Jonker, et al., 1998, Kauffman and St-Pierre, 2001, Kohn, et al.,
2002). Since they used total N excretion rather than urea excretion, they reported
greater renal clearances. For example, for a 500 kg dairy cow, total N renal clearance
ranged from 1254 to 1295 L/d (Jonker, et al., 1998, Kauffman and St-Pierre, 2001),
while renal urea clearance in our data base for a 500 kg dairy cow was 894 L/d (Table
5. 1). Urinary N contains urea, which accounts for 50-90 % of the total N excreted,
and other N-compounds, including creatinine, purine derivatives, and AA (Bristow, et
al., 1992); renal clearances of each of the N components differ depending on the
processes the component undergoes at the renal tubular level. For example, creatinine
has tubular secretion, and for that reason its renal clearance is close to or greater than
the glomerular filtration rate (Koeppen and Stanton, 1997). However, some purine
derivatives have partial reabsorption (Surra, et al., 1997). The slope of the equation
urinary N = β × MUN and its relationship to urea clearance may change with the
relative proportion of N components in the urine. Nitrogen intake and N content of the
ration were the only variables that were significantly related to clearance (Table 5.10).
Urea is freely filtered at the glomerulus and partly reabsorbed at the collective tube
and renal pelvis (Cirio and Boivin, 1990). Changes in the reabsorption of urea,
mediated by changes in the expression of urea transporters, take place in response to
variable N loads and salvage N needs (Bagnasco, 2005). Mineral intakes were not
significantly related to clearance. However, because urea and non-urea solutes
excretion are interdependent in ruminants (Schmidt-Nielsen, et al., 1961), under

160
situations of heat stress, or water deprivation, in which the maximum urine
concentration is reached, mineral intakes may affect renal urea clearance.
Table 5.10. Linear relationships between dietary and productive parameters
and renal urea clearance.
Relationship of renal urea clearance (L/dBW0.75) with diet and production variables a(S.E) b (S.E) P-value RMSE Diet composition and intakes DM intake, kg/d 6.21 (±2.43) 0.09 (±0.10) 0.35 2.11 OM intake, kg/d 5.59 (±0.13) 0.13 (±0.10) 0.21 2.17 NDF, % 7.32 (±1.35) 0.03 (±0.04) 0.33 2.16 NDF intake, kg/d 7.01 (±1.33) 0.20 (±0.16) 0.21 1.95 N, % 4.46 (±1.43) 1.40 (±0.42) < 0.001 2.14 N intake, g/d 4.76 (±1.26) 0.005 (±0.0016) < 0.001 1.94 N intake, g/(kg 0.75 d) 4.46 (±1.30) 0.76 (±0.207) < 0.001 1.99 NFC, % 10.95 (±1.31) -0.05 (±0.25) 0.06 2.05 NFC intake, kg/d 10.16 (±1.22) -0.13 (±0.09) 0.18 2.09 Na intake, g/d 9.57 (±1.25) -0.002 (±0.01) 0.8 2.27 Na+K+Cl intake, g/d 9.81 (±1.62) -0.0008 (±0.002) 0.74 2.32 Production and nutrient supply Milk, kg/d 8.38 (±1.62) 0.013 (±0.04) 0.74 1.97 FCM, kg/d 8.90 (±1.79) -0.001 (±0.04) 0.98 2.04 True protein yield, g/d 8.60 (±1.46) 0.0002 (±0.0001) 0.84 1.99 MP balance, g/d 9.45 (±1.03) -0.0006 (±0.0008) 0.49 2.32 ME balance, Mcal/d 9.87 (±1.08) -0.057 (±0.055) 0.31 1.92
The GIT clearance was derived from net transfers based on veno-arterial
measurements across splanchnic tissues (Table 5.2). The average GIT urea clearance
was 976 L/d (8.1 L/(kg0.75 × d)), with a coefficient of variation of 48 % (Table 5.2).
None of the variables presented in Table 5.2 were significantly related to urea
clearance through the GIT wall; study effect explained most of the variability
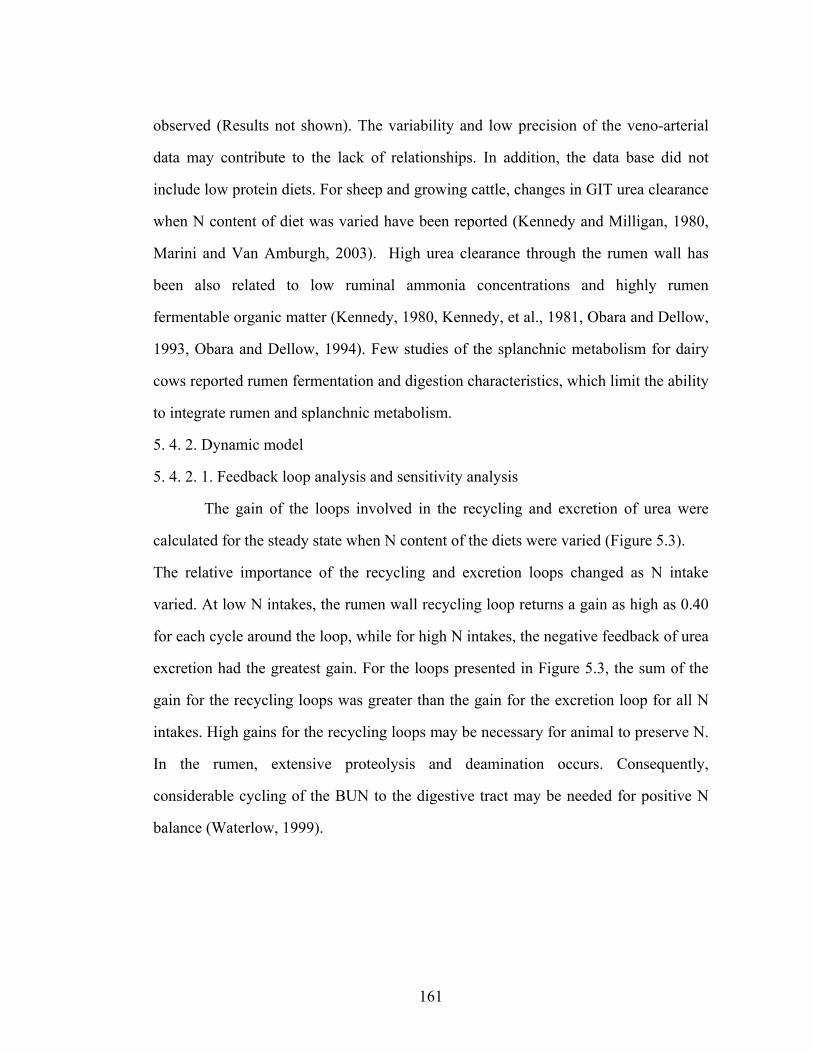
161
observed (Results not shown). The variability and low precision of the veno-arterial
data may contribute to the lack of relationships. In addition, the data base did not
include low protein diets. For sheep and growing cattle, changes in GIT urea clearance
when N content of diet was varied have been reported (Kennedy and Milligan, 1980,
Marini and Van Amburgh, 2003). High urea clearance through the rumen wall has
been also related to low ruminal ammonia concentrations and highly rumen
fermentable organic matter (Kennedy, 1980, Kennedy, et al., 1981, Obara and Dellow,
1993, Obara and Dellow, 1994). Few studies of the splanchnic metabolism for dairy
cows reported rumen fermentation and digestion characteristics, which limit the ability
to integrate rumen and splanchnic metabolism.
5. 4. 2. Dynamic model
5. 4. 2. 1. Feedback loop analysis and sensitivity analysis
The gain of the loops involved in the recycling and excretion of urea were
calculated for the steady state when N content of the diets were varied (Figure 5.3).
The relative importance of the recycling and excretion loops changed as N intake
varied. At low N intakes, the rumen wall recycling loop returns a gain as high as 0.40
for each cycle around the loop, while for high N intakes, the negative feedback of urea
excretion had the greatest gain. For the loops presented in Figure 5.3, the sum of the
gain for the recycling loops was greater than the gain for the excretion loop for all N
intakes. High gains for the recycling loops may be necessary for animal to preserve N.
In the rumen, extensive proteolysis and deamination occurs. Consequently,
considerable cycling of the BUN to the digestive tract may be needed for positive N
balance (Waterlow, 1999).

162
200 300 400 500 600 700 8000
0.05
0.1
0.15
0.2
0.25
0.3
0.35
0.4
N intake (g/d)
Ope
n lo
op g
ain
Renal excretionHindgut wallRumen wallSaliva
Figure 5.3. Open loop gain for the feedback loops of renal urea excretion1,
hindgut wall recycling2, rumen wall recycling3, and saliva recycling4 at different N
intakes.
1The sign of the gain for the renal urea excretion loop is negative. 1, 2, 3, 4 All the loops were open at the body urea pool.

163
As a result of the change in the strength of the feedback loops (Figure 5.3), the
model predicted a repartition of urea at different N intakes. If the fractional rates of
urea excretion and GIT entry were constant and the GIT urea entry and excretion were
only functions of the urea pool size, the strength of the feedback loops would have
been the same regardless of the N intake (Milhorn, 1966). This implies that although
the absolute flows would have varied with the N intake, the relative partitioning
between recycling and excretion would have remained constant, supporting the idea
that GIT entry and excretion are coordinated. Renal responses to varying dietary
protein included changes in renal plasma flow, glomerular filtration rate, and renal
pelvis and tubular urea reabsorption (Boldizarova, et al., 1999, Cirio and Boivin, 1990,
Tebot, et al., 2002). All these physiological changes represent changes in the strength
of the renal excretion feedback. The mechanisms by which the GIT entry is
coordinated and the actual regulators that act as intermediate between amino acid
availability and the physiological responses remain elusive (Marini, et al., 2004b).
The impact of varying the parameter values for the percentage of rumen
ammonia derived from urea recycling, rumen NPN net entry (calculated as urea entry-
ammonia absorption + passage), and urinary urea N is presented in Figure 5.4.
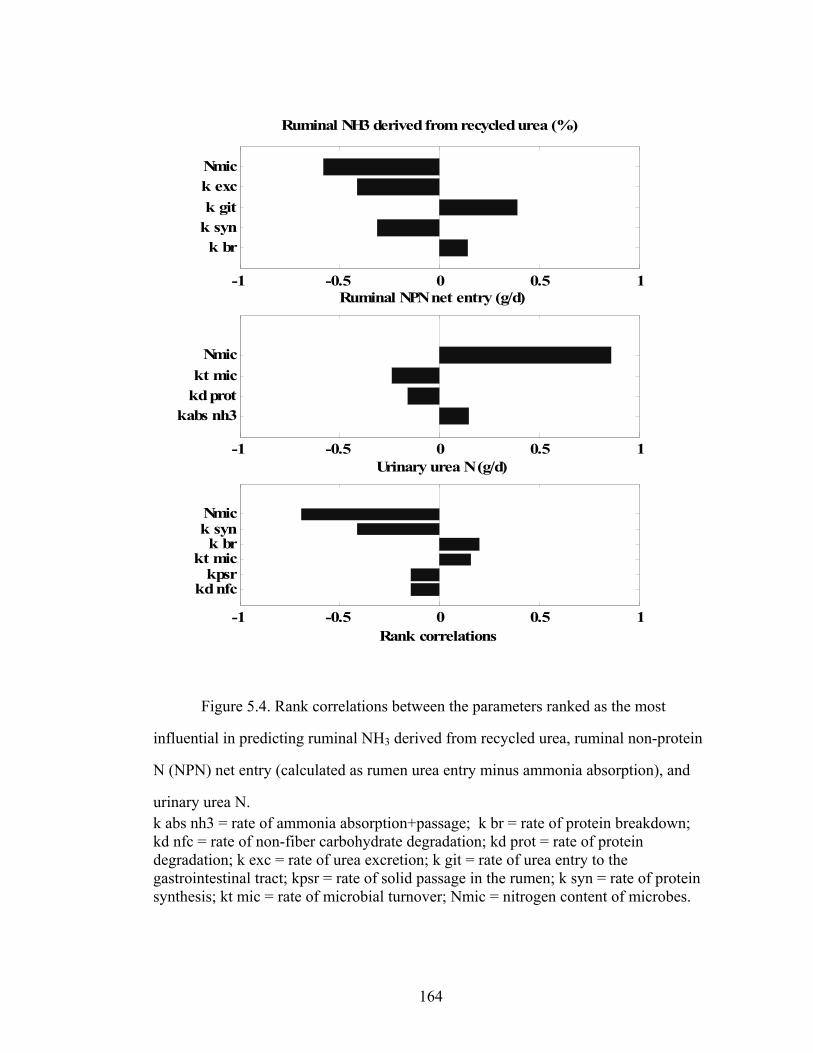
164
-1 -0.5 0 0.5 1
k brk synk gitk excNmic
-1 -0.5 0 0.5 1
kabs nh3kd protkt mic
Nmic
-1 -0.5 0 0.5 1
kd nfckpsr
kt mick br
k synNmic
Rank correlations
Ruminal NH3 derived from recycled urea (%)
Ruminal NPN net entry (g/d)
Urinary urea N (g/d)
Figure 5.4. Rank correlations between the parameters ranked as the most
influential in predicting ruminal NH3 derived from recycled urea, ruminal non-protein
N (NPN) net entry (calculated as rumen urea entry minus ammonia absorption), and
urinary urea N. k abs nh3 = rate of ammonia absorption+passage; k br = rate of protein breakdown; kd nfc = rate of non-fiber carbohydrate degradation; kd prot = rate of protein degradation; k exc = rate of urea excretion; k git = rate of urea entry to the gastrointestinal tract; kpsr = rate of solid passage in the rumen; k syn = rate of protein synthesis; kt mic = rate of microbial turnover; Nmic = nitrogen content of microbes.

165
The net entry was sensitive to parameters related to microbial efficiency (N
content of microbes, rate of microbial turnover) (Figure 5.4). Low fractional rates of
protein degradation also were related to positive net entry values. Faster NH3
absorption rates strengthened the wall recycling loop, increasing the net entry. Highly
fermentable diets have been associated with increased urea recycling (Kennedy, et al.,
1981). Volatile fatty acids facilitate ammonia absorption (Bodeker, et al., 1992), and
may enhance urea recycling by means of increasing ammonia absorption.
The percentage of NH3 derived from recycled urea was also very sensitive to
microbial N content: higher microbial N content resulted in greater N uptake and
microbial turnover and lower NH3 absorption. Therefore, as N microbial content
increased, the proportion of NH3 from intra-ruminal recycling and dietary protein
degradation increased. Fractional rates for synthesis and breakdown affected the
proportion of urea derived from amino acid catabolism. Increasing the urea derived
from sources other than rumen NH3 increased the percentage of rumen NH3 derived
from urea recycling. For urinary urea N, the two most influential variables were
related to the anabolic use of N (microbial N uptake, and body protein synthesis).
5. 4. 2. 2. Validation of model predictions of renal excretion and recycling
Studies in which both renal urea excretion and GIT entry are simultaneously
measured are scarce for dairy cows. For two studies using double labeled urea
(Lapierre, et al., 2004, Ruiz, et al., 2002), the variation accounted for by model
predictions were acceptable for GIT urea entry (R2 = 0.70) and renal urea excretion
(R2 = 0.95) (Table 5.11). The model overestimated urea excretion and underpredicted
GIT entrance, suggesting recycling loops are stronger than those represented in the
model.
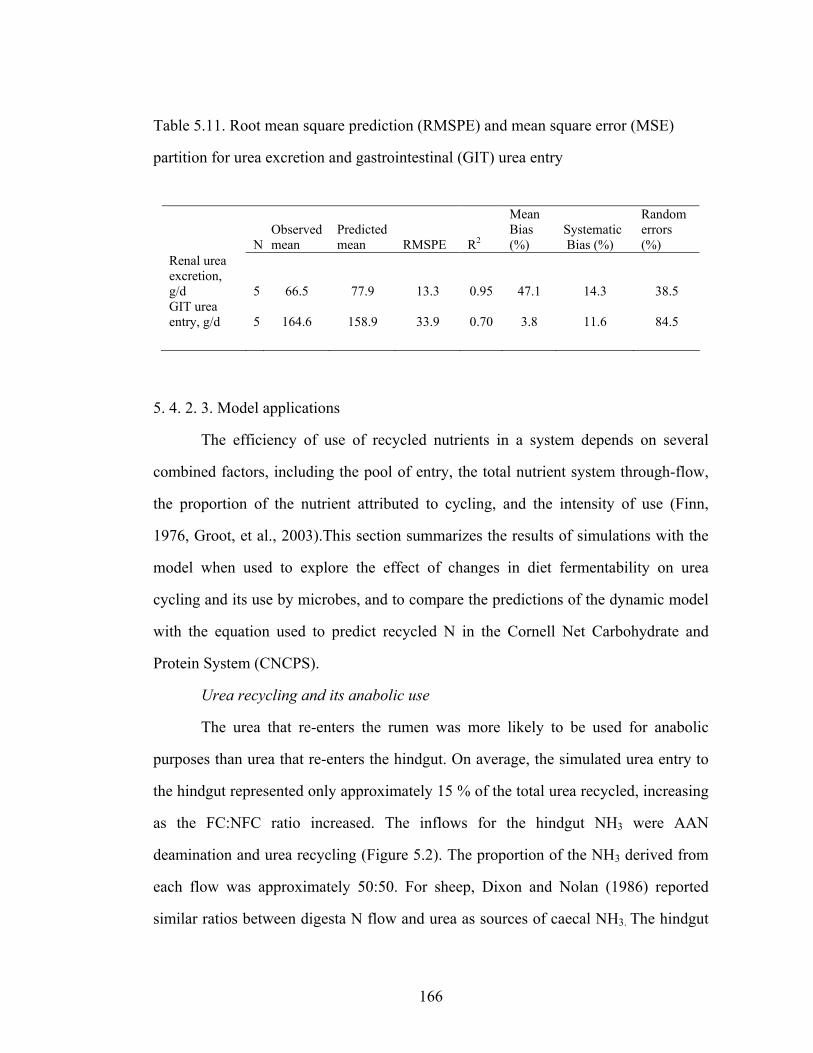
166
Table 5.11. Root mean square prediction (RMSPE) and mean square error (MSE)
partition for urea excretion and gastrointestinal (GIT) urea entry
N Observed mean
Predicted mean RMSPE R2
Mean Bias (%)
Systematic Bias (%)
Random errors (%)
Renal urea excretion, g/d 5 66.5
77.9 13.3 0.95 47.1 14.3 38.5 GIT urea entry, g/d 5 164.6
158.9 33.9 0.70 3.8 11.6 84.5
5. 4. 2. 3. Model applications
The efficiency of use of recycled nutrients in a system depends on several
combined factors, including the pool of entry, the total nutrient system through-flow,
the proportion of the nutrient attributed to cycling, and the intensity of use (Finn,
1976, Groot, et al., 2003).This section summarizes the results of simulations with the
model when used to explore the effect of changes in diet fermentability on urea
cycling and its use by microbes, and to compare the predictions of the dynamic model
with the equation used to predict recycled N in the Cornell Net Carbohydrate and
Protein System (CNCPS).
Urea recycling and its anabolic use
The urea that re-enters the rumen was more likely to be used for anabolic
purposes than urea that re-enters the hindgut. On average, the simulated urea entry to
the hindgut represented only approximately 15 % of the total urea recycled, increasing
as the FC:NFC ratio increased. The inflows for the hindgut NH3 were AAN
deamination and urea recycling (Figure 5.2). The proportion of the NH3 derived from
each flow was approximately 50:50. For sheep, Dixon and Nolan (1986) reported
similar ratios between digesta N flow and urea as sources of caecal NH3. The hindgut
167
urea net entry, calculated as hindgut urea entry minus hindgut ammonia absorption +
passage was positive for a wide range of simulated diet compositions. The net entry
increased as intestinal protein digestibility increased (r = 0.9) and as the rumen solid
passage rate increased (r= 0.23). Increasing ruminal passage rate increased the amount
of fermentable organic matter reaching the hindgut, and thus enhanced hindgut
microbial growth, and diverted N from urine into fecal excretion.
The overall total N flows and the anabolic use of N interacted to determine
total recycled urea flow and its efficiency of use (Table 5.12). The total amount of
urea recycled increased as the N intake increased. Higher diet fermentability resulted
in greater ruminal N efficiency. For the low protein diet, up to 87 % of the NH3 was
taken up by microbes and the uptake of both ammonia and amino N by microbes
increased (Table 5.12) and ammonia escape from the rumen decreased. Reducing
ruminal NH3 absorption resulted in a lower urea production and therefore the amount
of urea returning to the rumen was lower,. For the high protein diet, more ammonia
was absorbed, both as a percentage of the total NH3 produced (microbial growth was
limited by carbohydrate availability), and as absolute values, increasing urea flows.
The proportion of NH3 derived from recycled urea was 19 and 22 % of the NH3 for the
high and low fermentability diets (Table 5.12).
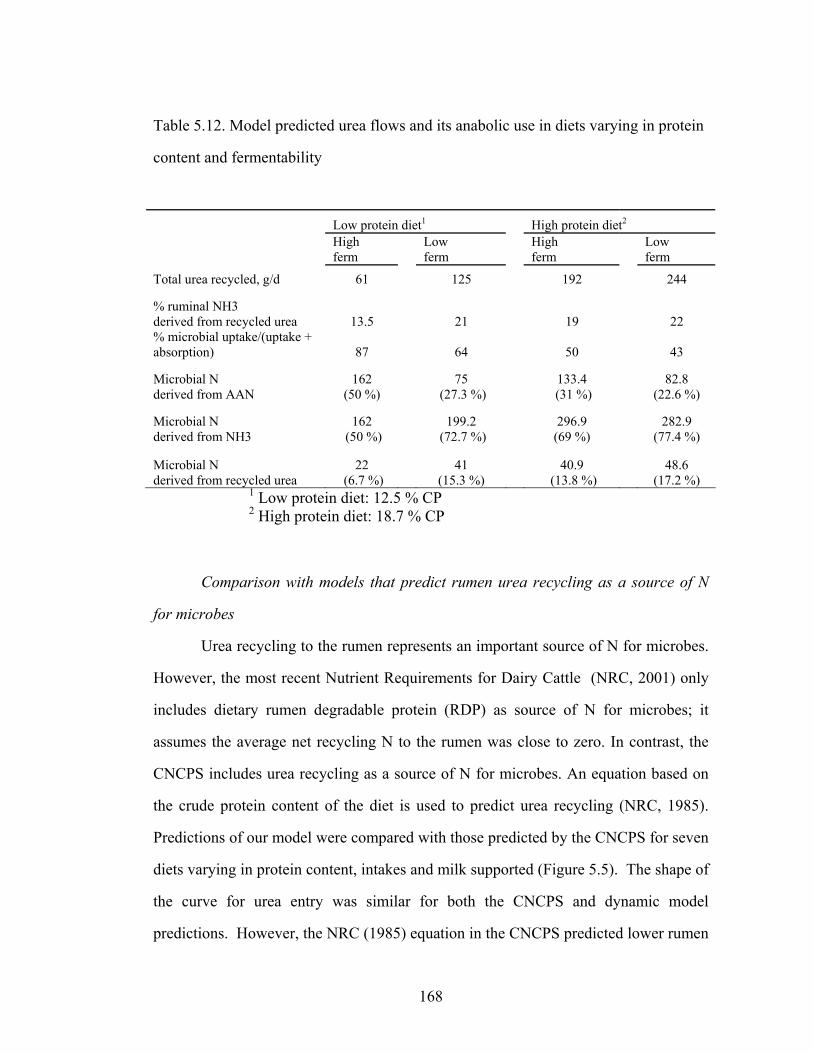
168
Table 5.12. Model predicted urea flows and its anabolic use in diets varying in protein
content and fermentability Low protein diet1 High protein diet2
High ferm
Low ferm
High ferm
Low ferm
Total urea recycled, g/d 61 125 192 244
% ruminal NH3 derived from recycled urea 13.5 21 19 22 % microbial uptake/(uptake + absorption) 87 64 50 43
Microbial N derived from AAN
162 (50 %)
75 (27.3 %)
133.4 (31 %)
82.8 (22.6 %)
Microbial N derived from NH3
162 (50 %)
199.2 (72.7 %)
296.9 (69 %)
282.9 (77.4 %)
Microbial N derived from recycled urea
22 (6.7 %)
41 (15.3 %)
40.9 (13.8 %)
48.6 (17.2 %)
1 Low protein diet: 12.5 % CP 2 High protein diet: 18.7 % CP
Comparison with models that predict rumen urea recycling as a source of N
for microbes
Urea recycling to the rumen represents an important source of N for microbes.
However, the most recent Nutrient Requirements for Dairy Cattle (NRC, 2001) only
includes dietary rumen degradable protein (RDP) as source of N for microbes; it
assumes the average net recycling N to the rumen was close to zero. In contrast, the
CNCPS includes urea recycling as a source of N for microbes. An equation based on
the crude protein content of the diet is used to predict urea recycling (NRC, 1985).
Predictions of our model were compared with those predicted by the CNCPS for seven
diets varying in protein content, intakes and milk supported (Figure 5.5). The shape of
the curve for urea entry was similar for both the CNCPS and dynamic model
predictions. However, the NRC (1985) equation in the CNCPS predicted lower rumen
169
urea entry than the dynamic model. The NRC (1985) equation was developed from the
sheep data of Kennedy and Milligan (1980), and therefore even with N intakes
adjusted to metabolic body weight, the overall flows and clearances for dairy cows
may be underpredicted when using equations based on sheep data. The CNCPS rumen
N balance is the difference between dietary RDP and urea recycling and microbial use
and do not include absorption and passage (Fox, et al., 2004). Failure to account for
both urea entry and ammonia loss from the rumen resulted into an overprediction of
rumen available N. At low N intakes, when the urea entry was expressed as the
difference between urea entry and ammonia absorption and passage, the urea entry
exceeded ammonia escaping. However at N intakes greater than 500 g/d the loss of
ammonia from the rumen was greater than urea entry (Figure 5.5).

170
200 400 600 800 100060
80
100
120
140
160
180
200
220
240
N intake, g/d
Rum
en u
rea
entr
y, g
N/d
200 400 600 800 1000-250
-200
-150
-100
-50
0
50
100
150
N intake, g/d
Rum
en n
et u
rea
entr
y, g
N/d
Figure 5.5. Rumen urea entry (g N/d) and net urea entry (calculated as rumen recycled
urea entry – ammonia absorption + passage) (g N/d) as recycled N for diets varying in
percentage of CP (7.2 to 21. 6 % CP) and milk production supported (12 to 40 kg/d)
using the NRC (1985) equation (●) and the dynamic model (▼).
5. 5. Conclusions
A model is presented that can be used as a component of ration formulation
models to predict N recycling to the GIT and urinary urea N. Reducing N excretion to
meet emerging ammonia emission regulations requires decreasing excess N in the
diets and accurate prediction of urinary N. Insuring rumen N requirements are met
requires accurate accounting for the recycling N mechanisms in ruminants and the

171
potential for their manipulation in order to improve its transformation into anabolic
products. At low protein intakes, urea recycling represents an important mechanism
for N conservation. At high protein intakes, urinary N excretion increases at an
increasing rate and must be accounted for in predicting ammonia losses from a dairy
herd.
172
CHAPTER 6
SUMMARY AND FURTHER RESEARCH
Since the first description of the Cornell Net Carbohydrate and Protein System
(CNCPS) carbohydrate (CHO) (Sniffen, et al., 1992) and protein (Van Soest, et al.,
1981a) fractionation schemes, methodology to measure feed fractions and knowledge
of ruminal nitrogen and CHO metabolism have advanced, making the revision of the
schemes timely. The main limitations of the CHO fractionation scheme described by
Sniffen et al (1992) were (1) fractions could not be precisely defined or assayed, and
(2) although CHO were fractionated based on the rate of degradation, it combined
CHO that differ in their ruminal volatile fatty acid (VFA) profile (e.g. pectin and
starch). The scheme outlined in Chapter 2 divides feed CHO into fractions that more
accurately relate to ruminal fermentation characteristics. However, improvements in
the analytical methodology to measure some of the fractions (e.g. sugars) and their
corresponding ruminal degradation rates are still necessary. Predictions of microbial
protein yield were especially sensitive to rates of fiber and starch degradation. Better
estimates of degradation rates are not only limited by the relative low accuracy and
precision of the current methods, but also by the structure of the model itself. The
CNCPS rumen submodel assumes that the growth rate of microorganisms is directly
proportional to the rate of CHO digestion (Russell, et al., 1992). However, degradation
rates and microbial growth rates do not always coincide. The maximum degradation of
the crystalline cellulose is approximately 0.08/h, but rates of fiber digestion of forages
by mixed ruminal bacteria rarely approach the maximum rate for crystalline cellulose
(Weimer, 1996). However, there are growth rates for cellulolytic bacteria exceeding
0.08/h (Lynd, et al., 2002). Rates necessary to reflect microbial growth rates can be
173
greater than degradation rates necessary to predict extent of digestion, and therefore
simultaneous accurate prediction of both extent of digestion and microbial protein
yield may be difficult. This issue has been demonstrated in model evaluations. Aquino
et al (2003) showed that in order to predict milk production of cows fed alfalfa silage
diets when protein was first limiting, rates of approximately 0.11/h for fiber digestion
were necessary. Pitt et al (1996) pointed out that degradation rates for starch lower
than the CNCPS feed library values were necessary to improve predictions of VFA
production and pH, but that would penalize accuracy in microbial protein yield
predictions. Rates for the CHO fractions in Chapter 2 were assigned to better account
for the differences in microbial protein yields. To fully account for differences in feed
CHO utilization, inclusion of dietary factors in dry matter intake predictions, and
prediction of ruminal VFA production and pH are necessary. A reassessment of CHO
degradation rates and microbial growth submodel may be a necessary first step before
integrating these other factors.
Evaluation of the protein fractionation schemes in Chapter 3 showed that
despite the differences in the methodology used to obtained protein fractions, both
NRC and CNCPS predictions of metabolizable protein supply had very similar
sensitivity to variation in protein fractions and degradation rates because these two
models rely on common principles, such as competition between digestion and
passage to predict site of digestion basing microbial growth estimates on the first
limiting nutrient (energy or protein) and almost complete rumen degradation of the
soluble N fractions. As indicated in Chapter 1, there are several disconnects present in
the CNCPS protein scheme that force us to question the validity of some of the
assumptions of the scheme, especially regarding the use of detergent solutions to
fractionate N. In Chapter 4, the ability of the original CNCPS protein scheme to
predict rumen undegradable protein (RUP) for corn and alfalfa silage based diets was

174
rather moderate and neutral detergent insoluble crude protein (NDICP) flows were
largely over predicted, suggesting the need to reexamine the appropriateness of using
detergent solutions to fractionate N. At the same time, the flows were very sensitive to
the rates for the B2 fraction. Dividing the available insoluble true protein (B fraction)
into two fractions (B2 and B3) complicates the development of methodology to
estimate rates. Predictions of rumen degradable protein and RUP were improved by
assigning rates obtained with the inhibitory in vitro system to a combined insoluble
protein B fraction. Advances in this area will rely upon a better understanding of the
sources of variation in the techniques (Broderick, et al., 2004c), and greater efforts in
modeling and understanding of in vitro digestion.
In Chapter 5, a dynamic mechanistic model was developed to integrate urea
recycling and excretion. The model was developed with emphasis on the feedback
structure of the system. Recycling processes were modeled as positive feedbacks,
while renal excretion was modeled as a negative feedback. Both recycling and
excretion were very sensitive to parameters related to microbial efficiency;
highlighting once more the importance of how microbial growth is represented in
rumen models. Model simulations suggested that the use of the NRC 1985 empirical
equation to predict urea recycling to the rumen may greatly underestimate urea
recycling in lactating dairy cows, and that the CNCPS prediction of ruminal N balance
needs further revision. Not taking into account simultaneously urea entry and
ammonia loss from the rumen may result into an overprediction of rumen available N.
In addition, it does not address the impact that N recycling within the rumen has on
ruminal N availability.
175
REFERENCES
Ahvenjarvi, S., A. Vanhatalo, P. Huhtanen, and T. Varvikko. 2000. Determination of
reticulo-rumen and whole-stomach digestion in lactating cows by omasal canal
or duodenal sampling. Br. J. Nutr. 83:67-77.
Ahvenjärvi, S., A. Vanhatalo, K. J. Shingfield, and P. Huhtanen. 2003. Determination
of digesta flow entering the omasal canal of dairy cows using different marker
systems. Br. J. Nutr. 90:41-52.
Akin, D. E. 1989. Histological and physical factors affecting digestibility of forages.
Agronomy Journal. 81:17-25.
Al-Dehneh, A., J. T. Huber, R. Wanderley, C. B. Theurer, M. Pessarakli, and D.
DeYoung. 1997. Incorporation of recycled urea--n into ruminal bacteria
flowing to the small intestine of dairy cows fed a high-grain or high-forage
diet. Anim. Feed Sci. Technol. 68:327-338.
Alderman, G. 2001. A critique of the cornell net carbohydrate and protein system with
emphasis on dairy cattle. 1. The rumen model. J. Anim. Feed Sci. 10:1-24.
Allen, S. A. and E. L. Miller. 1976. Determination of nitrogen requirement for
microbial-growth from effect of urea supplementation of a low n diet on
abomasal n flow and n recycling in wethers and lambs. Br. J. Nutr. 36:353-
368.
Amin, A. 1980. Gas-chromatographic separation and identification of organic-acids in
beet molasses and date syrup. Nahrung. 24:705-711.
Aquino, D. L., L. O. Tedeschi, C. Lanzas, S. S. Lee, and J. B. Russell. 2003.
Evaluation of cncps predictions of milk production of dairy cows fed alfalfa
silage. Cornell Nut. Conf. Feed Manuf., Syracuse, NY.
176
Atasoglu, C., A. Y. Guliye, and R. J. Wallace. 2004. Use of stable isotopes to measure
de novo synthesis and turnover of amino acid-c and -n in mixed micro-
organisms from the sheep rumen in vitro. Br. J. Nutr. 91:253-261.
Atasoglu, C., C. J. Newbold, and R. J. Wallace. 2001. Incorporation of [15n]ammonia
by the cellulolytic ruminal bacteria fibrobacter succinogenes bl2,
ruminococcus albus sy3, and ruminococcus flavefaciens 17. Appl. Environ.
Microbiol. 67:2819-2822.
Atasoglu, C., C. Valdes, C. J. Newbold, and R. J. Wallace. 1999. Influence of peptides
and amino acids on fermentation rate and de novo synthesis of amino acids by
mixed micro-organisms from the sheep rumen. Br. J. Nutr. 81:307-314.
Bach, A., G. B. Huntington, S. Calsamiglia, and M. D. Stern. 2000. Nitrogen
metabolism of early lactation cows fed diets with two different levels of
protein and different amino acid profiles. J. Dairy Sci. 83:2585-2595.
Bagnasco, S. M. 2005. Role and regulation of urea transporters. Pflugers Archiv.
450:217-226.
Baldwin, R. L. 1995. Modeling ruminant digestion and metabolism. Chapman & Hall,
London, United Kingdom.
Bandstra, J. Z. and P. G. Tratnyek. 2005. Central limit theorem for chemical kinetics
in complex systems. J. Math. Chem. 37:409-422.
Banks, J., J. S. Carson, B. L. Nelson, and D. M. Nicol. 2004. Discrete-event system
simulation. Pearson Education, Delhi, India.
Bateman, H. G., J. H. Clark, R. A. Patton, C. J. Peel, and C. G. Schwab. 2001a.
Prediction of crude protein and amino acid passage to the duodenum of
lactating cows by models compared with in vivo data. J. Dairy Sci. 84:665-
679.

177
Bateman, H. G., II, J. H. Clark, R. A. Patton, C. J. Peel, and C. G. Schwab. 2001b.
Accuracy and precision of computer models to predict passage of crude protein
and amino acids to the duodenum of lactating cows. J. Dairy Sci. 84:649-664.
Bauman, D. E. and W. B. Currie. 1980. Partitioning of nutrients during pregnancy and
lactation - a review of mechanisms involving homeostasis and homeorhesis. J.
Dairy Sci. 63:1514-1529.
Beauchemin, K. A. 1991. Ingestion and mastication of feed by dairy cattle. Veterinary
clinics of North America: Food Animal Practice. 7:439-463.
Beauchemin, K. A., R. G. Kachanoski, G. B. Schaalje, and J. G. Buchanansmith.
1990. Characterizing rumination patterns of dairy-cows using spectral-analysis.
J. Anim Sci. 68:3163-3170.
Beckers, Y., A. Thewis, B. Maudoux, and E. Francois. 1995. Studies on the in situ
nitrogen degradability corrected for bacterial contamination of concentrate
feeds in steers. J. Anim Sci. 73:220-227.
Benson, J. A., C. K. Reynolds, P. C. Aikman, B. Lupoli, and D. E. Beever. 2002.
Effects of abomasal vegetable oil infusion on splanchnic nutrient metabolism
in lactating dairy cows. J. Dairy Sci. 85:1804-1814.
Bequette, B. J. 2003. Amino acid metabolism in animals. Pages 87-101 in Amino
acids in animal nutrition. J. P. F. D' Mello, ed. CABI International,
Wallingford, UK.
Bequette, B. J., J. A. Metcalf, D. Wray-Cahen, F. R. C. Backwell, J. D. Sutton, M. A.
Lomax, J. C. MacRae, and G. E. Lobley. 1996. Leucine and protein
metabolism in the lactating dairy cow mammary gland: Responses to
supplemental dietary crude protein intake. J. Dairy Res. 63:209-222.
Berthiaume, R., M. C. Thivierge, R. A. Patton, P. Dubreuil, M. Stevenson, B. W.
McBride, and H. Lapierre. 2006. Effect of ruminally protected methionine on
178
splanchnic metabolism of amino acids in lactating dairy cows. J. Dairy Sci.
89:1621-1634.
Biggs, D. R. and K. R. Hancock. 1998. In vitro digestion of bacterial and plant
fructans and effects on ammonia accumulation in cow and sheep rumen fluids.
J Gen Appl Microbiol. 44:167-171.
Blouin, J. P., J. F. Bernier, C. K. Reynolds, G. E. Lobley, P. Dubreuil, and H.
Lapierre. 2002. Effect of supply of metabolizable protein on splanchnic fluxes
of nutrients and hormones in lactating dairy cows. J. Dairy Sci. 85:2618-2630.
Bodeker, D., Y. Shen, J. Kemkowski, and H. Holler. 1992. Influence of short-chain
fatty acids on ammonia absorption across the rumen wall in sheep. Exp.
Physiol. 77:369-376.
Boisen, S., S. Bech-Andersen, and B. Eggum. 1987. A critical view on the conversion
factor 6.25 from total nitrogen to protein. Acta Agric. Scand. Sect. A-Anim.
Sci. 37:299-304.
Boldizarova, K., S. Faix, and L. Leng. 1999. The kidney function in urea-loaded sheep
fed a high protein diet. Acta Veterinaria Brno. 68:185-190.
Bond, D. R., B. M. Tsai, and J. B. Russell. 1998. The diversion of lactose carbon
through the tagatose pathway reduces the intracellular fructose 1,6-
bisphosphate and growth rate of streptococcus bovis. Appl. Microbiol.
Biotechnol. 49:600-605.
Boston, R. C., D. G. Fox, C. J. Sniffen, E. Janczewski, R. Munson, and W. Chalupa.
2000. The conversion of a scientific model describing dairy cow nutrition and
production to an industry tool: The cpm dairy project. Pages 361-377 in
Modelling nutrient utilization in farm animals. J. P. McNamara, J. France, and
D. E. Beever, eds. CABI Publishing, Wallingford, UK.
179
Boudon, A., J.-L. Peyraud, and P. Faverdin. 2002. The release of cell contents of fresh
rye-grass (lolium perenne l.) during digestion in dairy cows: Effect of the
intracellular constituents, season and stage of maturity. Anim. Feed Sci.
Technol. 97:83-102.
Bristow, A. W., D. C. Whitehead, and J. E. Cockburn. 1992. Nitrogenous constituents
in the urine of cattle, sheep and goats. J. Sci. Food Agric. 59:387-394.
Brito, A. F. and G. A. Broderick. 2004a. Effects of different protein supplements on
nitrogen utilization of dairy cows. I. Animal production and ruminal
metabolism. J. Anim Sci. 82, Suppl.1:161.
Brito, A. F. and G. A. Broderick. 2004b. Effects of different protein supplements on
nitrogen utilization of dairy cows. Ii. Digesta flow and microbial protein
synthesis. J. Anim Sci. 82, Suppl.1:161.
Brito, A. F. and G. A. Broderick. 2006. Effect of varying dietary ratios of alfalfa silage
to corn silage on production and nitrogen utilization in lactating dairy cows. J.
Dairy Sci. 89:3924-3938.
Brito, A. F., G. A. Broderick, and S. M. Reynal. 2006. Effect of varying dietary ratios
of alfalfa silage to corn silage on omasal flow and microbial protein synthesis
in dairy cows. J. Dairy Sci. 89:3939-3953.
Brock, F. M., C. W. Forsberg, and J. G. Buchanan-Smith. 1982. Proteolytic activity of
rumen microorganisms and effects of proteinase inhibitors. Appl. Environ.
Microbiol. 44:561-569.
Broderick, G. A. 1987. Determination of protein-degradation rates using a rumen
invitro system containing inhibitors of microbial nitrogen- metabolism. Br. J.
Nutr. 58:463-475.
180
Broderick, G. A. 1994. Quantifying forage protein quality. Pages 200-228 in Forage
quality, evaluation, and utilization. G. Fahey, M. Collins, D. Mertens, and L.
E. Moser, eds. ASA, CSSA, and SSSA, Madison, WI.
Broderick, G. A. 1995. Desirable characteristics of forage legumes for improving
protein-utilization in ruminants. J. Anim Sci. 73:2760-2773.
Broderick, G. A. 2003. Effects of varying dietary protein and energy levels on the
production of lactating dairy cows. J. Dairy Sci. 86:1370-1381.
Broderick, G. A., K. A. Albrecht, V. N. Owens, and R. R. Smith. 2004a. Genetic
variation in red clover for rumen protein degradability. Anim. Feed Sci.
Technol. 113:157-167.
Broderick, G. A. and M. K. Clayton. 1992. Rumen protein-degradation rates estimated
by nonlinear- regression analysis of michaelis-menten invitro data. Br. J. Nutr.
67:27-42.
Broderick, G. A. and R. C. Cochran. 2000. In vitro and in situ methods for estimating
digestibility with reference to protein degradability. Pages 53-85 in Feeding
systems and feed evaluation models. M. K. Theodorou and J. France, eds.
CAB International, London.
Broderick, G. A., M. L. Murphy, and P. Uden. 2004b. Effect of inhibitor concentration
and end-product accumulation on estimates of ruminal in vitro protein
degradation. J. Dairy Sci. 87:1360-1371.
Broderick, G. A. and W. J. Radloff. 2004. Effect of molasses supplementation on the
production of lactating dairy cows fed diets based on alfalfa and corn silage. J.
Dairy Sci. 87:2997-3009.
Broderick, G. A., P. Uden, M. L. Murphy, and A. Lapins. 2004c. Sources of variation
in rates of in vitro ruminal protein degradation. J. Dairy Sci. 87:1345-1359.
181
Broderick, G. A., R. J. Wallace, and E. R. Orskov. 1989. Control of rate and extent of
protein degradation. Pages 541-592 in Physiological aspects of digestion and
metabolism in ruminants. T. Tsuda, Y. Sasaki, and R. Kawashima, eds.
Academic Press, Inc., San Diego, CA.
Broderick, G. A., J. H. Yang, and R. G. Koegel. 1993. Effect of steam heating alfalfa
hay on utilization by lactating dairy cows. J. Dairy Sci. 76:165-174.
Bunting, L. D., J. A. Boling, and C. T. Mackown. 1989. Effect of dietary-protein level
on nitrogen-metabolism in the growing bovine .1. Nitrogen recycling and
intestinal protein supply in calves. Journal of Animal Science. 67:810-819.
Bussink, D. W. and O. Oenema. 1998. Ammonia volatilization from dairy farming
systems in temperate areas: A review. Nutrient Cycling in Agroecosystems.
51:19-33.
Callaway, T. R., S. A. Martin, J. L. Wampler, N. S. Hill, and G. M. Hill. 1997. Malate
content of forage varieties commonly fed to cattle. J. Dairy Sci. 80:1651-1655.
Calsamiglia, S. and M. D. Stern. 1995. A 3-step in vitro procedure for estimating
intestinal digestion of protein in ruminants. J Anim Sci. 73:1459-1465.
Casse, E. A., H. Rulquin, and G. B. Huntington. 1994. Effect of mesenteric vein
infusion of propionate on splanchnic metabolism in primiparous holstein cows.
J. Dairy Sci. 77:3296-3303.
Charmley, E. and D. M. Veira. 1990. Inhibition of proteolysis at harvest using heat in
alfalfa silages: Effects on silage composition and digestion by sheep. J. Anim
Sci. 68:758-766.
Chen, G., C. J. Sniffen, and J. B. Russell. 1987. Concentration and estimated flow of
peptides from the rumen of dairy-cattle - effects of protein quantity, protein
solubility, and feeding frequency. J. Dairy Sci. 70:983-992.

182
Chikunya, S., C. J. Newbold, L. Rode, X. B. Chen, and R. J. Wallace. 1996. Influence
of dietary rumen-degradable protein on bacterial growth in the rumen of sheep
receiving different energy sources. Anim. Feed Sci. Technol. 63:333-340.
Choi, C. W., S. Ahvenjarvi, A. Vanhatalo, V. Toivonen, and P. Huhtanen. 2002a.
Quantitation of the flow of soluble non-ammonia nitrogen entering the omasal
canal of dairy cows fed grass silage based diets. Anim. Feed Sci. Technol.
96:203-220.
Choi, C. W., A. Vanhatalo, S. Ahvenjarvi, and P. Huhtanen. 2002b. Effects of several
protein supplements on flow of soluble non-ammonia nitrogen from the
forestomach and milk production in dairy cows. Anim. Feed Sci. Technol.
102:15-33.
Cirio, A. and R. Boivin. 1990. Urea recycling from the renal pelvis in sheep: A study
with [14c]urea. Am J Physiol Renal Physiol. 258:F1196-1202.
Clark, J. H., T. H. Klusmeyer, and M. R. Cameron. 1992. Microbial protein synthesis
and flows of nitrogen fractions to the duodenum of dairy cows. J. Dairy Sci.
75:2304-2323.
Cobelli, C. and J. J. DiStefano, 3rd. 1980. Parameter and structural identifiability
concepts and ambiguities: A critical review and analysis. Am J Physiol Regul
Integr Comp Physiol. 239:R7-24.
Coblentz, W. K., J. O. Fritz, W. H. Fick, R. C. Cochran, J. E. Shirley, and J. E. Turner.
1999. In situ disappearance of neutral detergent insoluble nitrogen from alfalfa
and eastern gamagrass at three maturities. J. Anim. Sci. 77:2803-2809.
Cornish-Bowden, A. and C. W. Wharton. 1988. Enzyme kinetics. IRL Press, Oxford,
UK.
Cotta, M. A. and J. B. Russell. 1996. Digestion of nitrogen in the rumen: A model for
metabolism of nitrogen compounds in gastrointestinal environments. in

183
Gastrointestinal microbiology. Vol. 1. R. I. Mackie and B. S. A. White, eds.
Chapman and Hall, New York, N.Y.
Counotte, G. H. M., R. A. Prins, R. H. A. M. Janssen, and M. J. A. DeBie. 1981. Role
of megasphaera elsdenii in the fermentation of dl-[2-13c]lactate in the rumen
of dairy cattle. Appl. Environ. Microbiol. 42:649-655.
Cromwell, G. L., C. C. Calvert, T. R. Cline, J. D. Crenshaw, T. D. Crenshaw, R. A.
Easter, R. C. Ewan, C. R. Hamilton, G. M. Hill, A. J. Lewis, D. C. Mahan, E.
R. Miller, J. L. Nelssen, J. E. Pettigrew, L. F. Tribble, T. L. Veum, and J. T.
Yen. 1999. Variability among sources and laboratories in nutrient analyses of
corn and soybean meal. J Anim Sci. 77:3262-3273.
DeFrain, J. M., A. R. Hippen, K. F. Kalscheur, and D. J. Schingoethe. 2004. Feeding
lactose increases ruminal butyrate and plasma {beta}-hydroxybutyrate in
lactating dairy cows. J. Dairy Sci. 87:2486-2494.
Delaquis, A. M. and E. Block. 1995a. Acid-base status, renal-function, water, and
macromineral metabolism of dry cows fed diets differing in cation-anion
difference. Journal of Dairy Science. 78:604-619.
Delaquis, A. M. and E. Block. 1995b. Dietary cation-anion difference, acid-base
status, mineral metabolism, renal function, and milk production of lactating
cows. J. Dairy Sci. 78:2259-2284.
Delgado-Elorduy, A., C. B. Theurer, J. T. Huber, A. Alio, O. Lozano, M. Sadik, P.
Cuneo, H. D. De Young, I. J. Simas, J. E. P. Santos, L. Nussio, C. Nussio, K.
E. Webb, Jr., and H. Tagari. 2002a. Splanchnic and mammary nitrogen
metabolism by dairy cows fed dry-rolled or steam-flaked sorghum grain. J.
Dairy Sci. 85:148-159.
Delgado-Elorduy, A., C. B. Theurer, J. T. Huber, A. Alio, O. Lozano, M. Sadik, P.
Cuneo, H. D. De Young, I. J. Simas, J. E. P. Santos, L. Nussio, C. Nussio, K.
184
E. Webb, Jr., and H. Tagari. 2002b. Splanchnic and mammary nitrogen
metabolism by dairy cows fed steam-rolled or steam-flaked corn. J. Dairy Sci.
85:160-168.
Dewar, W. A., R. Whittenbury, and P. McDonald. 1963. Hydrolysis of grass
hemicelluloses during ensilage. J. Sci. Food Agric. 14:411-417.
Dijkstra, J. 1994. Production and absorption of volatile fatty-acids in the rumen.
Livest. Prod. Sci. 39:61-69.
Dijkstra, J., H. Neal, D. E. Beever, and J. France. 1992. Simulation of nutrient
digestion, absorption and outflow in the rumen - model description. J. Nutr.
122:2239-2256.
Dinn, N. E., J. A. Shelford, and L. J. Fisher. 1998. Use of the cornell net carbohydrate
and protein system and rumen protected lysine and methionine to reduce
nitrogen excretion from lactating dairy cows. J. Dairy Sci. 81:229-237.
Dixon, R. M. and J. V. Nolan. 1986. Nitrogen and carbon flows between the cecum,
blood and rumen in sheep given chopped lucerne (medicago-sativa) hay. Br. J.
Nutr. 55:313-332.
Doane, P. H., A. N. Pell, and P. Schofield. 1998. Ensiling effects on the ethanol
fractionation of forages using gas production. J. Anim Sci. 76:888-895.
Doepel, L., D. Pacheco, J. J. Kennelly, M. D. Hanigan, I. F. Lopez, and H. Lapierre.
2004. Milk protein synthesis as a function of amino acid supply. J. Dairy Sci.
87:1279-1297.
Edelstein-Keshet, L. 1988. Mathematical models in biology. Random House, New
York.
Egan, A. R., K. Boda, and J. Varady. 1986. Regulation of nitrogen metabolism and
recycling. Pages 386-402 in Control of digestion and metabolism in ruminants.
185
L. P. Milligan, W. L. Grovum, and A. Dobson, eds. Prentice-Hall, Englewood
Cliffs, NJ.
Ellis, W. C., M. J. Wylie, and J. H. Matis. 2002. Validity of specifically applied rare
earth elements and compartmental models for estimating flux of undigested
plant tissue residues through the gastrointestinal tract of ruminants. J. Anim
Sci. 80:2753-2758.
Engstrom, D. F., G. W. Mathison, and L. A. Goonewardene. 1992. Effect of beta-
glucan, starch, and fiber content and steam vs dry rolling of barley-grain on its
degradability and utilization by steers. Anim. Feed Sci. Technol. 37:33-46.
Evans, J. D. and S. A. Martin. 1997. Factors affecting lactate and malate utilization by
selenomonas ruminantium. Appl. Environ. Microbiol. 63:4853-4858.
Evans, M., N. Hastings, and B. Peacock. 2000. Statistical distributions. John Wiley &
Sons, Inc., NY, USA.
Falconer, M. L. and R. J. Wallace. 1998. Variation in proteinase activities in the
rumen. J. Appl. Microbiol. 84:377-382.
Finn, J. T. 1976. Measures of ecosystem structure and function derived from analysis
of flows. Journal of Theoretical Biology. 56:363-380.
Firkins, J. L., W. P. Weiss, and E. J. Piwonka. 1992. Quantification of intraruminal
recycling of microbial nitrogen using nitrogen-15. J. Anim Sci. 70:3223-3233.
Fox, D. G., M. C. Barry, R. E. Pitt, D. K. Roseler, and W. C. Stone. 1995. Application
of the cornell net carbohydrate and protein model for cattle consuming forages.
J. Anim Sci. 73:267-277.
Fox, D. G., L. O. Tedeschi, T. P. Tylutki, J. B. Russell, M. E. Van Amburgh, L. E.
Chase, A. N. Pell, and T. R. Overton. 2004. The cornell net carbohydrate and
protein system model for evaluating herd nutrition and nutrient excretion.
Anim. Feed Sci. Technol. 112:29-78.
186
Fox, D. G., T. P. Tylutki, L. O. Tedeschi, M. E. Van Amburgh, L. E. Chase, A. N.
Pell, T. R. Overton, and J. B. Russell. 2003. The net carbohydrate and protein
system for evaluating herd nutrition and nutrient excretion: Model
documentation, mimeo no.213. Animal Science Dep., Cornell University,
Ithaca, NY.
Franklin, G. F., J. D. Powell, and A. Emami-Naeini. 1991. Feedback control of
dynamic systems. Addison-Wesley Publishing Company, Reading, MA.
Gierus, M., L. de Jonge, and G. A. L. Meijer. 2005. Physico-chemical characteristics
and degradation rate of soluble protein obtained from the washout fraction of
feeds. Livest. Prod. Sci. 97:219-229.
Gill, M., R. C. Siddons, and D. E. Beever. 1986. Metabolism of lactic acid isomers in
the rumen of silage-fed sheep. Br. J. Nutr. 55:399-407.
Givens, D. I. and H. Rulquin. 2004. Utilisation by ruminants of nitrogen compounds
in silage-based diets. Anim. Feed Sci. Technol. 114:1-18.
Goering, H. K., P. J. Vansoest, L. W. Smith, D. R. Waldo, C. H. Gordon, and R. W.
Hemken. 1972. Analytical estimates of nitrogen digestibility in heat damaged
forages. J. Dairy Sci. 55:1275-1280.
Gonda, H. L., M. Emanuelson, and M. Murphy. 1996. The effect of roughage to
concentrate ratio in the diet on nitrogen and purine metabolism in dairy cows.
Anim. Feed Sci. Technol. 64:27-42.
Groot, J. C. J., W. A. H. Rossing, E. A. Lantinga, and H. Van Keulen. 2003. Exploring
the potential for improved internal nutrient cycling in dairy farming systems,
using an eco-mathematical model. Njas-Wageningen Journal of Life Sciences.
51:165-194.
Haig, P. A., T. Mutsvangwa, R. Spratt, and B. W. McBride. 2002. Effects of dietary
protein solubility on nitrogen losses from lactating dairy cows and comparison

187
with predictions from the cornell net carbohydrate and protein system. J. Dairy
Sci. 85:1208-1217.
Hall, M. B. 2002. Working with non-ndf carbohydrates with manure evaluation and
environmental considerations. in Mid-south ruminant nutrition conference.
Arlington, TX, USA.
Hall, M. B. 2003. Challenges with nonfiber carbohydrate methods. J. Anim Sci.
81:3226-3232.
Hall, M. B. and C. Herejk. 2001. Differences in yields of microbial crude protein from
in vitro fermentation of carbohydrates. J. Dairy Sci. 84:2486-2493.
Hall, M. B., W. H. Hoover, J. P. Jennings, and T. K. M. Webster. 1999. A method for
partitioning neutral detergent-soluble carbohydrates. J. Sci. Food Agric.
79:2079-2086.
Hall, M. B., A. N. Pell, and L. E. Chase. 1998. Characteristics of neutral detergent-
soluble fiber fermentation by mixed ruminal microbes. Anim. Feed Sci.
Technol. 70:23-39.
Hatfield, R. D. and P. J. Weimer. 1995. Degradation characteristics of isolated and in
situ cell wall lucerne pectic polysaccharides by mixed ruminal microbes. J. Sci.
Food Agric. 69:185-196.
Haugen, H. L., M. J. Lamothe, T. J. Klopfenstein, D. C. Adams, and M. D. Ullerich.
2006. Estimation of undegradable intake protein in forages using neutral
detergent insoluble nitrogen at a single in situ incubation time point. J. Anim
Sci. 84:651-659.
Hedqvist, H. 2004. Metabolism of soluble proteins by rumen microorganisms and the
influence of condensed tannins on nitrogen solubility and degradation.
Swedish University of Agricultural Sciences, Uppsala, Sweden.
188
Hedqvist, H. and P. Udén. 2006. Measurement of soluble protein degradation in the
rumen. Anim. Feed Sci. Technol. 126:1-21.
Heldt, J. S., R. C. Cochran, G. L. Stokka, C. G. Farmer, C. P. Mathis, E. C.
Titgemeyer, and T. G. Nagaraja. 1999. Effects of different supplemental sugars
and starch fed in combination with degradable intake protein on low-quality
forage use by beef steers. J. Anim Sci. 77:2793-2802.
Helton, J. C. and F. J. Davis. 2002. Illustration of sampling-based methods for
uncertainty and sensitivity analysis. Risk Analysis. 22:591-622.
Helton, J. C. and F. J. Davis. 2003. Latin hypercube sampling and the propagation of
uncertainty in analyses of complex systems. Reliab Eng Syst Safe. 81:23-69.
Herrera-Saldana, R., J. T. Huber, and M. H. Poore. 1990. Dry matter, crude protein,
and starch degradability of five cereal grains. J. Dairy Sci. 73:2386-2393.
Hettiarachchi, M., R. M. Dixon, and J. V. Nolan. 1999. Effect of intra-ruminal urea
infusions and changing digestible organic matter intake on nitrogen kinetics in
sheep fed rice straw. J. Agric. Sci. 133:109-121.
Hintz, R. W., D. R. Mertens, and K. A. Albrecht. 1996. Effects of sodium sulfite on
recovery and composition of detergent fiber and lignin. J. Assoc. Off. Assoc.
Chem. Int. 79:16-22.
Hoffman, P. C., N. M. Brehm, L. M. Bauman, J. B. Peters, and D. J. Undersander.
1999. Prediction of laboratory and in situ protein fractions in legume and grass
silages using near-infrared reflectance spectroscopy. J. Dairy Sci. 82:764-770.
Hristov, A. and G. A. Broderick. 1994. In-vitro determination of ruminal protein
degradability using [n-15]ammonia to correct for microbial nitrogen uptake. J.
Anim Sci. 72:1344-1354.

189
Hristov, A. and G. A. Broderick. 1996. Synthesis of microbial protein in ruminally
cannulated cows fed alfalfa silage, alfalfa hay, or corn silage. J. Dairy Sci.
79:1627-1637.
Huhtanen, P. 1998. Supply of nutrients and productive responses in dairy cows given
diets based on restrictively fermented silage. Agr Food Sci Finland. 7:219-250.
Huhtanen, P. 2005. A review of the 2001 dairy cattle nrc protein and amino acid
model- a european perspective. J. Dairy Sci. 88, Suppl.1:88.
Huhtanen, P. and H. Khalili. 1991. Sucrose supplements in cattle given grass silage-
based diet. 3. Rumen pool size and digestion kinetics. Anim. Feed Sci.
Technol. 33:275-287.
Hume, I. D. 1970. Synthesis of microbial protein in the rumen. Iii. The effect of
dietary protein. Aust. J. Agric. Res. 21:305-314.
Hussein, H. S., B. Demjanec, N. R. Merchen, and C. G. Aldrich. 1995. Effect of
roasting on site and extent of digestion of soybean meal by sheep: Ii. Digestion
of artifacts of heating. J. Anim Sci. 73:835-842.
Hvelplund, T., M. R. Weisbjerg, and L. S. Andersen. 1992. Estimation of the true
digestibility of rumen undegraded dietary-protein in the small-intestine of
ruminants by the mobile bag technique. Acta Agric. Scand. Sect. A-Anim. Sci.
42:34-39.
Ipharraguerre, I. R. and J. H. Clark. 2005. Impacts of the source and amount of crude
protein on the intestinal supply of nitrogen fractions and performance of dairy
cows. J. Dairy Sci. 88:E22-37.
Isaacson, H. R., F. C. Hinds, M. P. Bryant, and F. N. Owens. 1975. Efficiency of
energy utilization by mixed rumen bacteria in continuous culture. J. Dairy Sci.
59:1645-1659.
190
Jacquez, J. A. 1985. The inverse problem: Parameter estimation. Pages 311-353 in
Compartmental analysis in biology and medicine. J. A. Jacquez, ed. The
University of Michigan Press, Ann Arbor, MI.
Jones, B. A., R. D. Hatfield, and R. E. Muck. 1992. Effect of fermentation and
bacterial inoculation on lucerne cell walls. J. Sci. Food Agric. 60:147-153.
Jonker, J. S., R. A. Kohn, and R. A. Erdman. 1998. Using milk urea nitrogen to
predict nitrogen excretion and utilization efficiency in lactating dairy cows. J.
Dairy Sci. 81:2681-2692.
Juarez, F. 1998. Evaluation of the nutritive value of four tropical grasses receiving two
levels of nitrogen fertilization. Ph.D. Dissertation, Cornell University, Ithaca,
NY.
Kalmus, H. 1966. Regulation and control in living systems. John Wiley & Sons,
London, UK.
Kampmann, C. R. and R. Oliva. 2006. Loop eigenvalue elasticity analysis: Three case
studies. System dynamics review. 22:141-162.
Kauffman, A. J. and N. R. St-Pierre. 2001. The relationship of milk urea nitrogen to
urine nitrogen excretion in holstein and jersey cows. J. Dairy Sci. 84:2284-
2294.
Kennedy, P. M. 1980. Effects of dietary sucrose and the concentrations of plasma urea
and rumen ammonia on the degradation of urea in the gastrointestinal-tract of
cattle. Br. J. Nutr. 43:125-140.
Kennedy, P. M., R. T. Clarke, and L. P. Milligan. 1981. Influences of dietary sucrose
and urea on transfer of endogenous urea to the rumen of sheep and number of
epithelial bacteria. Br. J. Nutr. 46:533-541.

191
Kennedy, P. M. and L. P. Milligan. 1980. The degradation and utilization of
endogenous urea in the gastrointestinal tract of ruminants: A review. Can. J.
Anim. Sci. 60:205-221.
Kertz, A. F. 1998. Variability in delivery of nutrients to lactating dairy cows. J. Dairy
Sci. 81:3075-3084.
Khalili, H. and P. Huhtanen. 1991. Sucrose supplements in cattle given grass silage
based diets. 2. Digestion of cell wall carbohydrates. Anim. Feed Sci. Technol.
33:263-273.
Klausner, S. D., D. G. Fox, C. N. Rasmussen, R. E. Pitt, T. P. Tylutki, P. E. Wright, L.
E. Chase, and W. C. Stone. 1998. Improving dairy farm sustainability i: An
approach to animal and crop nutrient management planning. J Prod Agric.
11:225-233.
Knudsen, K. E. B. 1997. Carbohydrate and lignin contents of plant materials used in
animal feeding. Anim. Feed Sci. Technol. 67:319-338.
Koeppen, B. M. and B. A. Stanton. 1997. Renal physiology. 2nd Ed. ed. Mosby, St.
Louis.
Kohn, R. A. and M. S. Allen. 1995. In-vitro protein-degradation of feeds using
concentrated enzymes extracted from rumen contents. Anim. Feed Sci.
Technol. 52:15-28.
Kohn, R. A., K. F. Kalscheur, and M. Hanigan. 1998. Evaluation of models for
balancing the protein requirements of dairy cows. J. Dairy Sci. 81:3402-3414.
Kohn, R. A., K. F. Kalscheur, and E. Russek-Cohen. 2002. Evaluation of models to
estimate urinary nitrogen and expected milk urea nitrogen. J. Dairy Sci.
85:227-233.

192
Korhonen, M., A. Vanhatalo, T. Varvikko, and P. Huhtanen. 2000. Responses to
graded postruminal doses of histidine in dairy cows fed grass silage diets. J.
Dairy Sci. 83:2596-2608.
Krishnamoorthy, U., C. J. Sniffen, M. D. Stern, and P. J. Van Soest. 1983. Evaluation
of a mathematical model of rumen digestion and an in vitro simulation of
rumen protelysis to estimate the rumen-undegraded nitrogen content of
feedstuffs. Br. J. Nutr. 50:555-568.
Lagunes, F. I. J., D. G. Fox, R. W. Blake, and A. N. Pell. 1999. Evaluation of tropical
grasses for milk production by dual- purpose cows in tropical mexico. J. Dairy
Sci. 82:2136-2145.
Lanzas, C. 2003. Prediction of digestion kinetics using near infrared reflectance
spectroscopy. Cornell University, Ithaca, NY, USA.
Lanzas, C., C. J. Sniffen, S. Seo, L. O. Tedeschi, and D. G. Fox. 2006a. A revised
cncps feed carbohydrate fractionation scheme for formulating rations for
ruminants. Anim. Feed Sci. Technol. doi:10.1016/j.anifeedsci.2006.08.025.
Lanzas, C., L. O. Tedeschi, S. Seo, and D. G. Fox. 2006b. Evaluation of protein
fractionation systems used in formulating rations for dairy cattle. J. Dairy Sci.
Accepted.
Lapierre, H., J. P. Blouin, J. F. Bernier, C. K. Reynolds, P. Dubreuil, and G. E.
Lobley. 2002. Effect of supply of metabolizable protein on whole body and
splanchnic leucine metabolism in lactating dairy cows. J. Dairy Sci. 85:2631-
2641.
Lapierre, H., C. Girard, J. J. Matte, and G. E. Lobley. 2005. Effects of stage of
lactation on protein metabolism in dairy cows. J. Anim. Feed Sci. 14:53-62.
Lapierre, H. and G. E. Lobley. 2001. Nitrogen recycling in the ruminant: A review. J.
Anim Sci. 84:E223-E236.
193
Lapierre, H., D. R. Ouellet, R. Berthiaume, C. Girard, P. Dubreuil, M. Babkine, and
G. E. Lobley. 2004. Effect of urea supplementation on urea kinetics and
splanchnic flux of amino acids in dairy cows. J. Anim. Feed Sci. 13:319-322.
Law, A. M. and W. D. Kelton. 2000. Simulation modeling and analysis. 3rd ed. Tata
McGraw-Hill Publishing company, New Delhi, India.
Leiva, E., M. B. Hall, and H. H. Van Horn. 2000. Performance of dairy cattle fed
citrus pulp or corn products as sources of neutral detergent-soluble
carbohydrates. J. Dairy Sci. 83:2866-2875.
Lescoat, P. and D. Sauvant. 1995. Development of a mechanistic model for rumen
digestion validated using the duodenal flux of amino acids. Reproduction,
Nutrition, and Development. 35:45-70.
Licitra, G., P. J. Van Soest, I. Schadt, S. Carpino, and C. J. Sniffen. 1999. Influence of
the concentration of the protease from streptomyces griseus relative to ruminal
protein degradability. Anim. Feed Sci. Technol. 77:99-113.
Littell, R. C., G. Milliken, W. W. Stroup, and R. D. Wolfinger. 1996. Sas system for
mixed models. SAS institute Inc., Cary, NC.
Lobley, G. E. 2003. Protein turnover - what does it mean for animal production? Can.
J. Anim. Sci. 83:327-340.
Lobley, G. E., V. Milne, J. M. Lovie, P. J. Reeds, and K. Pennie. 1980. Whole-body
and tissue protein-synthesis in cattle. Br. J. Nutr. 43:491-502.
Luchini, N. D., G. A. Broderick, and D. K. Combs. 1996. Characterization of the
proteolytic activity of commercial proteases and strained ruminal fluid. J.
Anim Sci. 74:685-692.
Lykos, T. and G. A. Varga. 1995. Effects of processing method on degradation
characteristics of protein and carbohydrate sources in situ. J. Dairy Sci.
78:1789-1801.
194
Lynd, L. R., P. J. Weimer, W. H. van Zyl, and I. S. Pretorius. 2002. Microbial
cellulose utilization: Fundamentals and biotechnology. Microbiol. Mol. Biol.
Rev. 66:506-577.
Mahadevan, S., J. D. Erfle, and F. D. Sauer. 1980. Degradation of soluble and
insoluble proteins by bacteroides amylophilus protease and by rumen
microorganisms. J. Anim. Sci. 50:723-728.
Maiga, H. A., D. J. Schingoethe, and F. C. Ludens. 1995. Evaluation of diets
containing supplemental fat with different sources of carbohydrates for
lactating dairy cows. J. Dairy Sci. 78:1122-1130.
Maltz, E. and N. Silanikove. 1996. Kidney function and nitrogen balance of high
yielding dairy cows at the onset of lactation. J. Dairy Sci. 79:1621-1626.
Mangan, J. L. 1972. Quantitative studies on nitrogen metabolism in the bovine rumen.
Br. J. Nutr. 27:261-283.
Mansfield, H. R., M. D. Stern, and D. E. Otterby. 1994. Effects of beet pulp and
animal by-products on milk yield and in vitro fermentation by rumen
microorganisms. J. Dairy Sci. 77:205-216.
Marini, J. C., J. D. Klein, J. M. Sands, and M. E. Van Amburgh. 2004a. Effect of
nitrogen intake on nitrogen recycling and urea transporter abundance in lambs.
J. Anim Sci. 82:1157-1164.
Marini, J. C., J. M. Sands, and M. E. Van Amburgh. 2004b. Urea transporters and urea
recycling in ruminants. in Ruminant physiology: Digestion, metabolism and
impact of nutrition on gene expression, immunology and stress. K. Sejrsen, T.
Hvelplund, and M. O. Nielsen, eds. Wageningen Academic Publishers,
Wageningen.
Marini, J. C. and M. E. Van Amburgh. 2003. Nitrogen metabolism and recycling in
holstein heifers. J. Anim Sci. 81:545-552.

195
Marounek, M., J. Simunek, and P. Brezina. 1988. Production of acids from inulin by a
mixed culture of rumen microorganisms. Arch Tierernahr. 38:175-181.
Martin, A. K. 1970. Effect of stage of maturity of perennial ryegrass on ots content of
some organic acids and phenolic compounds. J. Sci. Food Agric. 21:476-501.
Martin, S. A. and M. N. Streeter. 1995. Effect of malate on in vitro mixed ruminal
microorganism fermentation. J. Anim Sci. 73:2141-2145.
Mass, R. A., G. P. Lardy, R. J. Grant, and T. J. Klopfenstein. 1999. In situ neutral
detergent insoluble nitrogen as a method for measuring forage protein
degradability. J. Anim Sci. 77:1565-1571.
Matis, J. H. and H. D. Tolley. 1980. On the stochastic modeling of tracer kinetics. Fed.
Proc. 39:104-109.
Mayland, H. F., S. A. Martin, J. Lee, and G. E. Shewmaker. 2000. Malate, citrate, and
amino acids in tall fescue cultivars: Relationship to animal preference. Agron
J. 92:206-210.
Mazanov, A. and J. V. Nolan. 1976. Simulation of the dynamics of nitrogen
metabolism in sheep. Br. J. Nutr. 35:149-174.
McBeth, L. J., K. P. Coffey, W. K. Coblentz, D. H. Hellwig, J. E. Tumer, and D. A.
Scarbrough. 2003. Impact of level of spontaneous heating during storage of
bermudagrass hay on rumen in situ disappearance kinetics in steers. Anim.
Feed Sci. Technol. 108:147-158.
McCormick, M. E., D. D. Redfearn, J. D. Ward, and D. C. Blouin. 2001. Effect of
protein source and soluble carbohydrate addition on rumen fermentation and
lactation performance of holstein cows. J. Dairy Sci. 84:1686-1697.
McDonald, P., A. R. Henderson, and S. J. E. Heron. 1991. The biochemistry of silage.
Second ed. Cambrian Printers Ltd, Aberystwyth, UK.

196
McKay, M. D., R. J. Beckman, and W. J. Conover. 1979. A comparison of three
methods for selecting values of input variables in the analysis of output from a
computer code. Technometrics. 21:239-245.
Mertens, D. 1993. Rate and extent of digestion. Pages 13-50 in Quantitative aspects of
ruminant digestion and metabolism. J. M. Forbes and J. France, eds. CAB
International, Oxford, UK.
Mertens, D. 2002. Gravimetric determination of amylase-treated neutral detergent
fiber in feeds with refluxing in beakers or crucibles: Collaborative study. J.
Assoc. Off. Assoc. Chem. Int. 85:1217-1240.
Mertens, D. R. 1997. Creating a system for meeting the fiber requirements of dairy
cows. J. Dairy Sci. 80:1463-1481.
Milhorn, H. T. 1966. The application of control theory to physiological systems.
Saunders Company, Philadelphia.
Molina, D. O. 2002. Prediction of intake of lactating cows in the tropics and the
energy value of organic acids. Ph.D. Dissertation, Cornell University, Ithaca,
NY, USA.
Monteils, V., S. Jurjanz, O. Colin-Schoellen, G. Blanchart, and F. Laurent. 2002.
Kinetics of ruminal degradation of wheat and potato starches in total mixed
rations. J. Anim Sci. 80:235-241.
Monteny, G. J., M. C. J. Smits, G. van Duinkerken, H. Mollenhorst, and I. J. M. de
Boer. 2002. Prediction of ammonia emission from dairy barns using feed
characteristics part ii: Relation between urinary urea concentration and
ammonia emission. J. Dairy Sci. 85:3389-3394.
Mowrey, A. and J. N. Spain. 1999. Results of a nationwide survey to determine
feedstuffs fed to lactating dairy cows. J. Dairy Sci. 82:445-451.

197
Murphy, M. R., R. L. Baldwin, M. J. Ulyatt, and L. J. Koong. 1983. A quantitative-
analysis of rumination patterns. J. Anim Sci. 56:1236-1240.
Muscato, T. V., C. J. Sniffen, U. Krishnamoorthy, and P. J. Vansoest. 1983. Amino
acid content of noncell and cell wall fractions in feedstuffs. J. Dairy Sci.
66:2198-2207.
Nakamura, T., T. J. Klopfenstein, and R. A. Britton. 1994. Evaluation of acid
detergent insoluble nitrogen as an indicator of protein quality in nonforage
proteins. J. Anim Sci. 72:1043-1048.
Nilsson, U., R. Oste, M. Jagerstad, and D. Birkhed. 1988. Cereal fructans- in vitro and
in vivo studies on availability in rats and humans. J. Nutr. 118:1325-1330.
Nocek, J. E. and S. Tamminga. 1991. Site of digestion of starch in the gastrointestinal-
tract of dairy-cows and its effect on milk-yield and composition. J. Dairy Sci.
74:3598-3629.
Noftsger, S. and N. R. St-Pierre. 2003. Supplementation of methionine and selection
of highly digestible rumen undegradable protein to improve nitrogen efficiency
for milk production. J. Dairy Sci. 86:958-969.
Nolan, J. V. 1993. Nitrogen kinetics. Pages 123-143 in Quantitative aspectes of
ruminant digestion and metabolism. J. M. Forbes and J. France, eds. CAB
International, Oxford, UK.
Nolan, J. V. and R. A. Leng. 1972. Dynamic aspects of ammonia and urea metabolism
in sheep. Br. J. Nutr. 27:177-194.
Nolan, J. V. and S. Stachiw. 1979. Fermentation and nitrogen dynamics in merino
sheep given a low-quality roughage diet. Br. J. Nutr. 42:63-80.
Norton, B. W., J. B. Mackintosh, and D. G. Armstrong. 1982. Urea synthesis and
degradation in sheep given pelleted grass diets containing flaked barley. Br. J.
Nutr. 48:249-264.
198
Noziere, P. and Michalet-Doreau. 2000. In sacco methods. Pages 233-253 in Farm
animal metabolism and nutrition. J. P. F. D'Mello, ed. CAB International,
Wallingford, UK.
NRC. 1985. Ruminant nitrogen usage. National Academy Press, Washington, D.C.
NRC. 1993. Soil and water quality: An agenda for agriculture. National Academy
Press, Washington, DC.
NRC. 2001. Nutrient requirements for dairy cattle. National Academy Press
Washington, DC, USA.
NRC. 2003. Air emissions from animal feeding operations: Current knowledge, future
needs. National Academy Press, Washington, DC.
O'Connor, J. D., C. J. Sniffen, D. G. Fox, and W. Chalupa. 1993. A net carbohydrate
and protein system for evaluating cattle diets .4. Predicting amino-acid
adequacy. J. Anim. Sci. 71:1298-1311.
Oba, M. and M. S. Allen. 2003. Effects of corn grain conservation method on feeding
behavior and productivity of lactating dairy cows at two dietary starch
concentrations. J. Dairy Sci. 86:174-183.
Obara, Y. and D. W. Dellow. 1993. Effects of intraruminal infusions of urea, sucrose
or urea plus sucrose on plasma urea and glucose kinetics in sheep fed chopped
lucerne hay. J. Agric. Sci. 121:125-130.
Obara, Y. and D. W. Dellow. 1994. Influence of energy supplementation on nitrogen
kinetics in the rumen and urea metabolism. Jpn. Agric. Res. Q. 28:143-149.
Obara, Y., H. Fuse, F. Terada, M. Shibata, A. Kawabata, M. Sutoh, K. Hodate, and M.
Matsumoto. 1994. Influence of sucrose supplementation on nitrogen kinetics
and energy metabolism in sheep fed with lucerne hay cubes. J. Agric. Sci.
123:121-127.
199
Offner, A., A. Bach, and D. Sauvant. 2003. Quantitative review of in situ starch
degradation in the rumen. Anim. Feed Sci. Technol. 106:81-93.
Offner, A. and D. Sauvant. 2004. Comparative evaluation of the molly, cncps, and les
rumen models. Anim. Feed Sci. Technol. 112:107-130.
Ogden, R. K., W. K. Coblentz, K. P. Coffey, J. E. Turner, D. A. Scarbrough, J. A.
Jennings, and M. D. Richardson. 2006. Ruminal in situ disappearance kinetics
of nitrogen and neutral detergent insoluble nitrogen from common crabgrass
forages sampled on seven dates in northern arkansas. J. Anim Sci. 84:669-677.
Oldick, B. S., J. L. Firkins, and R. A. Kohn. 2000. Compartmental modeling with
nitrogen-15 to determine effects of degree of fat saturation on intraruminal n
recycling. J. Anim Sci. 78:2421-2430.
Oliva, R. 2004. Model structure analysis through graph theory: Partition heuristics and
feedback structure decomposition. System Dynamics Review. 20:313-336.
Olmos Colmenero, J. J. and G. A. Broderick. 2006a. Effect of amount and ruminal
degradability of soybean meal protein on performance of lactating dairy cows.
J. Dairy Sci. 89:1635-1643.
Olmos Colmenero, J. J. and G. A. Broderick. 2006b. Effect of dietary crude protein
concentration on milk production and nitrogen utilization in lactating dairy
cows. J. Dairy Sci. 89:1704-1712.
Olmos Colmenero, J. J. and G. A. Broderick. 2006c. Effect of dietary crude protein
concentration on ruminal nitrogen metabolism in lactating dairy cows. J. Dairy
Sci. 89:1694-1703.
Orskov, E. R. and I. McDonald. 1979. The estimate of protein degradability in the
rumen from incubation measurements weighted according to rate of passage. J.
Agric. Sci. (Camb.). 92:499-503.
200
Ott, R. L. and M. Longnecker. 2001. An introduction to statistical methods and data
analysis. 5th ed. Duxbury, Pacific Grove, CA.
Peltekova, V. D. and G. A. Broderick. 1996. In vitro ruminal degradation and
synthesis of protein on fractions extracted from alfalfa hay and silage. J. Dairy
Sci. 79:612-619.
Pichard, G. 1977. Forage nutritive value. Continuous and batch in vitro rumen
fermenations and nitrogen solubility. Ph.D. Diss., Cornell Univ., Ithaca.
Pichard, G., C. Tapia, and R. Larrain. 2005. Ruminal proteolysis in forages with
distinct endopeptidases activities. Proceedings of the XIVth International
Silage Conference, Belfast, Northen Ireland:273.
Pirt, S. J. 1982. Maintenance energy - a general-model for energy-limited and energy-
sufficient growth. Arch. Microbiol. 133:300-302.
Pitt, R. E. and A. N. Pell. 1997. Modeling ruminal ph fluctuations: Interactions
between meal frequency and digestion rate. J. Dairy Sci. 80:2429-2441.
Pitt, R. E., J. S. VanKessel, D. G. Fox, A. N. Pell, M. C. Barry, and P. J. VanSoest.
1996. Prediction of ruminal volatile fatty acids and ph within the net
carbohydrate and protein system. J. Anim. Sci. 74:226-244.
Piwonka, E. J. and J. L. Firkins. 1996. Effect of glucose fermentation on fiber
digestion by ruminal microorganisms in vitro. J. Dairy Sci. 79:2196-2206.
Pollock, C. J. 1986. Fructans and the metabolism of sucrose in vascular plants. New
Phytol. 104:1-24.
Powers, W. J. 2003. Keeping science in environmental regulations: The role of the
animal scientist. J. Dairy Sci. 86:1045-1051.
Raab, L., B. Cafantaris, T. Jilg, and K. H. Menke. 1983. Rumen protein-degradation
and biosynthesis .1. A new method for determination of protein-degradation in
rumen fluid invitro. Br. J. Nutr. 50:569-582.
201
Raggio, G., D. Pacheco, R. Berthiaume, G. E. Lobley, D. Pellerin, G. Allard, P.
Dubreuil, and H. Lapierre. 2004. Effect of level of metabolizable protein on
splanchnic flux of amino acids in lactating dairy cows. J. Dairy Sci. 87:3461-
3472.
Reid, R. L. 1994. Nitrogen components of forages and feedstuffs. Pages 43-70 in
Principles of protein nutrition of ruminants. J. M. Asplund, ed, Boca Raton,
FL.
Remond, D., J. I. Cabrera-Estrada, M. Champion, B. Chauveau, R. Coudure, and C.
Poncet. 2004. Effect of corn particle size on site and extent of starch digestion
in lactating dairy cows. J. Dairy Sci. 87:1389-1399.
Remond, D., F. Meschy, and R. Boivin. 1996. Metabolites, water and mineral
exchanges across the rumen wall: Mechanisms and regulation. Ann. Zootech.
(Paris). 45:97-119.
Reynal, S. M. and G. A. Broderick. 2003a. Effects of feeding dairy cows protein
supplements of varying ruminal degradability. Journal of Dairy Science
J. Dairy Sci. 86:835-843.
Reynal, S. M. and G. A. Broderick. 2003b. Effects of feeding dairy cows protein
supplements of varying ruminal degradability. J. Dairy Sci. 86:835-843.
Reynal, S. M. and G. A. Broderick. 2005. Effect of dietary level of rumen-degraded
protein on production and nitrogen metabolism in lactating dairy cows. J.
Dairy Sci. 88:4045-4064.
Reynal, S. M., G. A. Broderick, S. Ahvenjarvi, and P. Huhtanen. 2003. Effect of
feeding protein supplements of differing degradability on omasal flow of
microbial and undegraded protein. J. Dairy Sci. 86:1292-1305.
202
Reynal, S. M., G. A. Broderick, and C. Bearzi. 2005. Comparison of four markers for
quantifying microbial protein flow from the rumen of lactating dairy cows. J.
Dairy Sci. 88:4065-4082.
Reynolds, C. K., P. C. Aikman, B. Lupoli, D. J. Humphries, and D. E. Beever. 2003.
Splanchnic metabolism of dairy cows during the transition from late gestation
through early lactation. J. Dairy Sci. 86:1201-1217.
Reynolds, C. K., G. Huntington, H. F. Tyrrell, and P. J. Reynolds. 1988. Net portal-
drained visceral and hepatic metabolism of glucose, l-lactate, and nitrogenous
compounds in lactating holstein cows. J. Dairy Sci. 71:1803-1812.
Richards, C. J., J. F. Pedersen, R. A. Britton, R. A. Stock, and C. R. Krehbiel. 1995.
In-vitro starch disappearance procedure modifications. Anim. Feed Sci.
Technol. 55:35-45.
Richardson, G. 1995. Loop polarity, loop dominance, and the concept of dominant
polarity. System dynamics review. 11:67-88.
Rooke, J. A., N. H. Lee, and D. G. Amstrong. 1987. The effects of intraruminal
infusions of urea, casein, glucose syrup and a mixture of casein and glucose
syrup on nitrogen digestion in the rumen of cattle receiving grass-silage diets.
Br. J. Nutr. 57:89-98.
Roseler, D. K., D. G. Fox, L. E. Chase, A. N. Pell, and W. C. Stone. 1997.
Development and evaluation of equations for prediction of feed intake for
lactating holstein dairy cows. J. Dairy Sci. 80:878-893.
Ross, D. A. 2004. Amino acid composition of ruminant feeds and feed fractions and
evaluation of the methods used to obtain the insoluble and tru percipitable
protein fractions of feedstuffs. M.S. Thesis, Cornell Univ., Ithaca, USA.
Rossi, P., C. Boin, M. L. V. Bose, R. D. Wanderley, and A. G. da Silva. 1997.
Ruminal degradability of the neutral fiber and neutral detergent insoluble
203
nitrogen of the corn silage and soybean meal in the nelore cattle. Rev. Soc.
Bras. Zootec.-J. Bras. Soc. Anim. Sci. 26:608-615.
Ruiz, R., L. O. Tedeschi, J. C. Marini, D. G. Fox, A. N. Pell, G. Jarvis, and J. B.
Russell. 2002. The effect of a ruminal nitrogen (n) deficiency in dairy cows:
Evaluation of the cornell net carbohydrate and. Protein system ruminal n
deficiency adjustment. J. Dairy Sci. 85:2986-2999.
Russell, J. B. 1993. Effect of amino-acids on the heat-production and growth
efficiency of streptococcus-bovis - balance of anabolic and catabolic rates.
Appl. Environ. Microbiol. 59:1747-1751.
Russell, J. B. 1998. Strategies that ruminal bacteria use to handle excess carbohydrate.
J. Anim Sci. 76:1955-1963.
Russell, J. B. and R. L. Baldwin. 1979. Comparison of maintenance energy
expenditures and growth yields among several rumen bacteria grown on
continuous culture. Appl. Environ. Microbiol. 37:537-543.
Russell, J. B., J. D. Oconnor, D. G. Fox, P. J. Vansoest, and C. J. Sniffen. 1992. A net
carbohydrate and protein system for evaluating cattle diets .1. Ruminal
fermentation. J. Anim Sci. 70:3551-3561.
Russell, J. B., R. Onodera, and T. Hino. 1989. Ruminal protein fermentation: New
perspectives on previous contradictions. Physiological aspects of digestion and
metabolism in ruminants. Proceedings of the seventh international symposium
on ruminant physiology., Sendai, Japan:681-697.
Russell, J. B. and C. J. Sniffen. 1984. Effect of carbon-4 and carbon-5 volatile fatty
acids on growth of mixed rumen bacteria in vitro. J. Dairy Sci. 67:987-994.
Russell, J. B. and P. J. Van Soest. 1984. In vitro ruminal fermentation of organic acids
common in forage. Appl. Environ. Microbiol. 47:155-159.

204
Rychlik, J. L. and J. B. Russell. 2002. Bacteriocin-like activity of butyrivibrio
fibrisolvens jl5 and its effect on other ruminal bacteria and ammonia
production. Appl. Environ. Microbiol. 68:1040-1046.
Saltelli, A. 2000. What is sensitivity analysis ? Pages 3-13 in Sensitivity analysis. A.
Saltelli, K. Chan, and E. M. Scott, eds. John Wiley & Sons, Ltd, Chichester,
NY.
Sands, J. M. 2003. Mammalian urea transporters Annu. Rev. Physiol. 65:543-566.
Sannes, R. A., M. A. Messman, and D. B. Vagnoni. 2002. Form of rumen-degradable
carbohydrate and nitrogen on microbial protein synthesis and protein
efficiency of dairy cows. J. Dairy Sci. 85:900-908.
SAS. 2002. User's guide: Statistics, version 9th ed. SAS Institute Inc., Cary, NC.
Sauvant, D. 1994. Modelling homeostatic and homeorhetic regulations in lactating
animals. Livest. Prod. Sci. 39:105-113.
Schmidt-Nielsen, B., R. O'Dell, and H. Osaki. 1961. Interdependence of urea and
electrolytes in production of a concentrated urine. Am J Physiol. 200:1125-
1132.
Schroeder, G. E., L. J. Erasmus, K.-J. Leeuw, and H. H. Meissner. 1995. The use of
acid detergent insoluble nitrogen to predict digestibility of rumen undegradable
protein of heat processed plant proteins. South Afr. J. Anim. Sci. 26:49-52.
Schwab, C. G., C. K. Bozak, N. L. Whitehouse, and M. M. A. Mesbah. 1992. Amino
acid limitation and flow to duodenum at four stages of lactation. 1. Sequence
of lysine and methionine limitation. J. Dairy Sci. 75:3486-3502.
Schwab, C. G., P. Huhtanen, C. W. Hunt, and T. Hvelplund. 2005. Nitrogen
requirements in cattle Pages 13-70 in Nitrogen and phosphorus nutrition of
cattle. E. Pfeffer and A. Hristov, eds. CABI Publishing, Wallingford, UK.
Segel, I. H. 1976. Biochemical calculations. John Wiley & Sons, NY.

205
Seo, S., C. Lanzas, L. O. Tedeschi, and D. G. Fox. 2006a. Development of a
mechanistic model to represent the dynamics of liquid flow out of the rumen
and to predict rate of passage of liquid in dairy cattle. J. Dairy Sci. Submitted.
Seo, S., L. O. Tedeschi, C. Lanzas, C. G. Schwab, and D. G. Fox. 2006b.
Development and evaluation of empirical equations to predict feed passage
rate in cattle. Anim. Feed Sci. Technol. 128:67-83.
Shipley, R. A. and R. E. Clark. 1972. Tracer methods for in vivo kinetics: Theory and
applications. Academic Press, New York.
Siddons, R. C., D. E. Beever, and A. G. Kaiser. 1982. Evaluation of the effect of
formic-acid and level of formaldehyde application before ensiling on silage
protein degradability. J. Sci. Food Agric. 33:609-613.
Siddons, R. C. and J. Paradine. 1981. Effect of diet on protein degrading activity in the
sheep rumen. J. Sci. Food Agric. 32:973-981.
Siddons, R. C., J. Paradine, D. E. Beever, and P. R. Cornell. 1985. Ytterbium acetate
as a particulate-phase digesta-flow marker Br. J. Nutr. 54:509-519.
Smith, D. and D. Grotelueschen. 1966. Carbohydrate in grasses: I. Sugar and fructosan
composition of the stem bases of several northen-adapted grasses at seed
maturity. Crop Sci. 6:263-266.
Sniffen, C. J., J. D. Oconnor, P. J. Van Soest, D. G. Fox, and J. B. Russell. 1992. A net
carbohydrate and protein system for evaluating cattle diets .2. Carbohydrate
and protein availability. J. Anim Sci. 70:3562-3577.
Sorensen, L. K. 2004. Prediction of fermentation parameters in grass and corn silage
by near infrared spectroscopy. J. Dairy Sci. 87:3826-3835.
Srividhya, J. and S. Schnell. 2006. Why substrate depletion has apparent first-order
kinetics in enzymatic digestion. Comput. Biol. Chem. 30:209-214.

206
Sterman, J. D. 2000. Business dynamics: System thinking and modeling for a complex
world. Irwin McGraw-Hill, Boston, MA.
Stern, M. D., G. A. Varga, J. H. Clark, J. L. Firkins, J. T. Huber, and D. L. Palmquist.
1994. Evaluation of chemical and physical-properties of feeds that affect
protein-metabolism in the rumen. J. Dairy Sci. 77:2762-2786.
Stone, L., A. Gabric, and T. Berman. 1996. Ecosystem resilience, stability, and
productivity: Seeking a relationship. American Naturalist. 148:892-903.
Strobel, H. J. and J. B. Russell. 1986. Effect of ph and energy spilling on bacterial
protein synthesis by carbohydrate-limited cultures of mixed rumen bacteria. J.
Dairy Sci. 69:2941-2947.
Surra, J. C., J. A. Guada, J. Balcells, and C. Castrillo. 1997. Renal and salivary
clearance of purine derivatives in sheep. Anim. Sci. 65:83-91.
Susmel, P., B. Stefanon, C. R. Mills, and M. Candido. 1989. Change in amino-acid-
composition of different protein-sources after rumen incubation. Anim. Prod.
49:375-383.
Tebot, I., A. Britos, J. M. Godeau, and A. Cirio. 2002. Microbial protein production
determined by urinary allantoin and renal urea sparing in normal and low
protein fed corriedale sheep. Vet. Res. 33:101-106.
Tedeschi, L. O., D. G. Fox, and J. B. Russell. 2000. Accounting for the effects of a
ruminal nitrogen deficiency within the structure of the cornell net carbohydrate
and protein system. J. Anim. Sci. 78:1648-1658.
Tedeschi, L. O., A. N. Pell, D. G. Fox, and C. R. Llames. 2001. The amino acid
profiles of the whole plant and of four plant residues from temperate and
tropical forages. J. Anim. Sci. 79:525-532.
207
Theil, H. 1961. Economic forecasts and policy. in Contributions to economic analysis.
R. Strotz, J. Tinbergen, P. Verdoorn, and H. J. Witteveen, eds. North-Holland
Publishing Company, Amsterdam, The Netherlands.
Thornley, J. H. M. 2000. Plant and crop modeling: A mathematical approach to plant
and crop physiology. Blackburn Press, Caldwell, NJ.
Thornton, R. F. 1970. Urea excretion in ruminants:I. Studies in sheep and cattle
offered the same diet. Aust. J. Agric. Res. 21:323-336.
Tothi, R., P. Lund, M. R. Weisbjerg, and T. Hvelplund. 2003. Effect of expander
processing on fractional rate of maize and barley starch degradation in the
rumen of dairy cows estimated using rumen evacuation and in situ techniques.
Anim. Feed Sci. Technol. 104:71-94.
Tylutki, T. P. 2002. Improving herd nutrient management on dairy farms: 1)individual
cow milk production variance. 2) developing a quality management program
on a commercial dairy farm: A six sigma approach. 3) variation in nutrient
content of feeds on a commercial dairy farms. 4) predicting phosphorus
excretion by dairy cattle. 5) incorporating risk in managing dairy cattle
nutrition. Ph.D. Diss., Cornell Univ., Ithaca, USA.
Valadares Filho, S. C., G. A. Broderick, R. F. D. Valadares, and M. K. Clayton. 2000.
Effect of replacing alfalfa silage with high moisture corn on nutrient utilization
and milk production. J. Dairy Sci. 83:106-114.
Valadares, R. F. D., G. A. Broderick, S. C. V. Filho, and M. K. Clayton. 1999. Effect
of replacing alfalfa silage with high moisture corn on ruminal protein synthesis
estimated from excretion of total purine derivatives. J. Dairy Sci. 82:2686-
2696.
208
Van Kessel, J. S. and J. B. Russell. 1996. The effect of amino nitrogen on the
energetics of ruminal bacteria and its impact on energy spilling. J. Dairy Sci.
79:1237-1243.
Van Kessel, J. S. and J. B. Russell. 1997. The endogenous polysaccharide utilization
rate of mixed ruminal bacteria and the effect of energy starvation on ruminal
fermentation rates. J. Dairy Sci. 80:2442-2448.
Van Soest, P. J. 1989. On the digestibility of bound n in distillers grains: A reanalysis.
Pages 127-135 in Proc. Cornell. Nutr. Conf. Feed manuf. Cornell University,
Ithaca, NY.
Van Soest, P. J. 1994. Nutritional ecology of the ruminant. Second ed. Cornell
University Press, Ithaca, NY, USA.
Van Soest, P. J., J. B. Robertson, and B. A. Lewis. 1991. Methods for dietary fiber,
neutral detergent fiber, and nonstarch polysacharides in relation to animal
nutrition. J. Dairy Sci. 74:3583-3597.
Van Soest, P. J., C. J. Sniffen, D. Mertens, D. G. Fox, P. H. Robinson, and U.
Krishnamoorthy. 1981a. A net protein system for cattle:The rumen submodel
for nitrogen. Protein Requirements for Cattle: Symposium, Stillwater, OK:265-
279.
Van Soest, P. J., C. J. Sniffen, D. R. Mertens, D. G. Fox, P. H. Robinson, and U.
Krishnamoorthy. 1981b. A net protein system for cattle: The rumen submodel
for nitrogen. Protein requirements for cattle (MP109-P), Stillwater, OH:265.
Van Soest, P. J. and R. H. Wine. 1967. The use of detergents in analysis of fibrous
feeds: Iv. Determination of plant cell-wall constituents. Assoc. Off. Agr.
Chem. J. 50:50.

209
Vanhatalo, A. and E. Ketoja. 1995. The role of the large-intestine in post-ruminal
digestion of feeds as measured by the mobile-bag method in cattle. Br. J. Nutr.
73:491-505.
VanKessel, J. S. and J. B. Russell. 1996. The effect of amino nitrogen on the
energetics of ruminal bacteria and its impact on energy spilling. J. Dairy Sci.
79:1237-1243.
Vanvuuren, A. M., C. J. Vanderkoelen, H. Valk, and H. Devisser. 1993. Effects of
partial replacement of ryegrass by low-protein feeds on rumen fermentation
and nitrogen loss by dairy-cows. J. Dairy Sci. 76:2982-2993.
Vercoe, J. E. 1969. The transfer of nitrogen from the blood to the rumen in cattle.
Aust. J. Agric. Res. 20:191-197.
Virtanen, A. I. 1966. Milk production of cows on protein-free feed. Science.
153:1603-1614.
Visek, W. J. 1968. Some aspects of ammonia toxicity in animal cells. J. Dairy Sci.
51:286-295.
Voelker, J. A. and M. S. Allen. 2003. Pelleted beet pulp substituted for high-moisture
corn: 1. Effects on feed intake chewing behavior, and milk production of
lactating dairy cows. J. Dairy Sci. 86:3542-3552.
Volden, H., L. T. Mydland, and V. Olaisen. 2002. Apparent ruminal degradation and
rumen escape of soluble nitrogen fractions in grass and grass silage
administered intraruminally to lactating dairy cows. J. Anim. Sci. 80:2704-
2716.
Waldo, D. R., L. W. Smith, and E. L. Cox. 1972. Model of cellulose disappearance
from the rumen. J. Dairy Sci. 55:125-129.
Waterlow, J. C. 1999. The mysteries of nitrogen balance. Nutr. Res. Rev. 12:25-54.

210
Waterlow, J. C., P. J. Garlick, and D. J. Millward. 1978. Protein turnover in
mammalian tissues and in the whole body. North-Holland Pub. Co,
Amsterdam, The Netherlands.
Waters, C. J., M. A. Kitcherside, and A. J. F. Webster. 1992. Problems associated with
estimating the digestibility of undergraded dietary nitrogen from acid-detergent
insoluble nitrogen. Anim. Feed Sci. Technol. 39:279-291.
Wattiaux, M. A. and K. L. Karg. 2004a. Protein level for alfalfa and corn silage-based
diets: I. Lactational response and milk urea nitrogen. J. Dairy Sci. 87:3480-
3491.
Wattiaux, M. A. and K. L. Karg. 2004b. Protein level for alfalfa and corn silage-based
diets: Ii. Nitrogen balance and manure characteristics. J. Dairy Sci. 87:3492-
3502.
Weimer, P. J. 1996. Why don't ruminal bacteria digest cellulose faster? J. Dairy Sci.
79:1496-1502.
Weisbjerg, M. R., T. Hvelplund, and B. M. Bibby. 1998. Hydrolysis and fermentation
rate of glucose, sucrose and lactose in the rumen. Acta Agric. Scand. Sect. A-
Anim. Sci. 48:12-18.
Weisbjerg, M. R., T. Hvelplund, S. Hellberg, S. Olsson, and S. Sanne. 1996. Effective
rumen degradability and intestinal digestibility of individual amino acids in
different concentrates determined in situ. Anim. Feed Sci. Technol. 62:179-
188.
Weiss, W. P. 1994. Estimation of digestibility of forages by laboratory methods. Pages
644-681 in Forage quality, evaluation, and utilization. G. C. Fahey, M. Collins,
D. R. Mertens, and L. E. Moser, eds. ASA, CSSA, and SSSA, Madison, WI.
Wells, J. E. and J. B. Russell. 1996. Why do many ruminal bacteria die and lyse so
quickly? J. Dairy Sci. 79:1487-1495.
211
Wilson, J. R. and D. R. Mertens. 1995. Cell-wall accessibility and cell structure
limitations to microbial digestion of forage. Crop Sci. 35:251-259.
Woody, H. D. 1978. Influence of ration grain content on feedlot performance and
carcass characteristics. PhD dissertation, Michigan State University, Lansing,
MI, USA.
Yang, W. Z., K. A. Beauchemin, and L. M. Rode. 2000. Effects of barley grain
processing on extent of digestion and milk production of lactating cows. J.
Dairy Sci. 83:554-568.
Yu, P. 2005. Protein secondary structures (a-helix and ß-sheet) at a cellular level and
protein fractions in relation to rumen degradation behaviours of protein: A new
approach. Br. J. Nutr. 94:655-665.
Related Documents