Modelling Escherichia coli concentration in a wastewater reservoir using an operational parameter MRT%FE and first order kinetics Giuseppe Luigi Cirelli a , Simona Consoli a, * , Marcelo Juanico ´ b a Department of Agricultural Engineering, University of Catania, Via S. Sofia, 100, 95123 Catania, Italy b Juanico-Environmental Consulting Ltd., Moshav Ram-On, M.P. Megido 19205, Israel Received 8 February 2007; received in revised form 15 November 2007; accepted 11 December 2007 Available online 28 January 2008 Abstract The operational parameter MRT%FE, representing the mean residence time of different ages fractions of effluent within a completely mixed reactor, was evaluated and integrated with first order kinetics. The parameter was used to model Escherichia coli concentrations in a municipal wastewater reservoir managed under different operating conditions (continuous and discontinuous). The study was conducted during 2004e2005 in a reservoir receiving effluents from the activated sludge treatment plant of Caltagirone (Eastern Sicily e Italy). The analytical approach is applied to the hydraulic state variables of the system (daily stored volumes, inlet and outlet flows), and the physicalechemical (pH, temperature, EC, TSS, BOD 5 , COD) and bacteriological wastewater parameters (E. coli, FC, FS). In order to evaluate the reliability of the proposed approach, predicted E. coli concentrations within the reservoir were compared with measured ones by the correlation coefficient, F-test and Sperman’s index. The study included the evaluation of die-off coefficient K T (d 1 ), light extinction coefficient K (m 1 ) and their relationships with climatic factors. Results of the study confirm that E. coli removal is related to the fractions of fresh effluent remaining each day within the reservoir with MRT%FE of about 5e8 d, significantly lower than the nominal detention time (about 27 d). The E. coli die-off coefficient (K T ) was higher during system discontinuous operations and correlated with incident solar radiation and water temperature. Ó 2007 Elsevier Ltd. All rights reserved. Keywords: Bacteria removal; Mean residence time; Modelling; Operational parameters; PFE; MRT%FE; Wastewater storage 1. Introduction Wastewater reservoirs (WWRs) are particularly suitable for storage and stabilization of treated effluents and they are key- elements in all reuse systems for agricultural purposes. These hypertrophic aquatic systems contribute to the removal of refractory pollutants and pathogens and release effluents of much better quality than other alternative treatment schemes, at lower O&M costs (Juanico ´, 1993, 1999). The use of storage reservoirs to regulate and transfer winter wastewater volume, cope agricultural water needs and improve their bacteriologi- cal quality, requires the selection of appropriate operational procedures to combine the need for a continuous wastewater disposal with the natural removal processes dynamics (Frie- dler et al., 2003). Most completely mixed sewage treatment reactors (i.e., aer- ated lagoons, activated sludge, waste stabilization ponds with long residence time, etc.) are assumed to be steady-state flow systems with constant flow rate, volume and mean hydraulic residence time. The dynamics of water quality changes of these reactors are, generally, modelled using first order kinet- ics by the Marais (1974) approach, with predicted pollutant concentration related inversely with die-off or removal coeffi- cient (K T ,d 1 ) and effluent residence time (t d ) within the system. However, these reactors do not actually fulfill the ideal steady-state flow assumption, because of differences in flow rate between day and night, weekdays and weekend, summer and winter, and because of impact of storm water discharges, etc. Juanico ´ and Friedler (1994) developed a mathematical * Corresponding author. Tel.: þ39 095 714 7547; fax: þ39 095 714 7600. E-mail address: [email protected] (S. Consoli). 0301-4797/$ - see front matter Ó 2007 Elsevier Ltd. All rights reserved. doi:10.1016/j.jenvman.2007.12.015 Journal of Environmental Management 90 (2009) 604e614 www.elsevier.com/locate/jenvman

Welcome message from author
This document is posted to help you gain knowledge. Please leave a comment to let me know what you think about it! Share it to your friends and learn new things together.
Transcript
Journal of Environmental Management 90 (2009) 604e614www.elsevier.com/locate/jenvman
Modelling Escherichia coli concentration in a wastewater reservoirusing an operational parameter MRT%FE and first order kinetics
Giuseppe Luigi Cirelli a, Simona Consoli a,*, Marcelo Juanico b
a Department of Agricultural Engineering, University of Catania, Via S. Sofia, 100, 95123 Catania, Italyb Juanico-Environmental Consulting Ltd., Moshav Ram-On, M.P. Megido 19205, Israel
Received 8 February 2007; received in revised form 15 November 2007; accepted 11 December 2007
Available online 28 January 2008
Abstract
The operational parameter MRT%FE, representing the mean residence time of different ages fractions of effluent within a completely mixedreactor, was evaluated and integrated with first order kinetics. The parameter was used to model Escherichia coli concentrations in a municipalwastewater reservoir managed under different operating conditions (continuous and discontinuous).
The study was conducted during 2004e2005 in a reservoir receiving effluents from the activated sludge treatment plant of Caltagirone(Eastern Sicily e Italy). The analytical approach is applied to the hydraulic state variables of the system (daily stored volumes, inlet and outletflows), and the physicalechemical (pH, temperature, EC, TSS, BOD5, COD) and bacteriological wastewater parameters (E. coli, FC, FS). Inorder to evaluate the reliability of the proposed approach, predicted E. coli concentrations within the reservoir were compared with measuredones by the correlation coefficient, F-test and Sperman’s index. The study included the evaluation of die-off coefficient KT (d�1), light extinctioncoefficient K (m�1) and their relationships with climatic factors.
Results of the study confirm that E. coli removal is related to the fractions of fresh effluent remaining each day within the reservoir withMRT%FE of about 5e8 d, significantly lower than the nominal detention time (about 27 d). The E. coli die-off coefficient (KT) was higherduring system discontinuous operations and correlated with incident solar radiation and water temperature.� 2007 Elsevier Ltd. All rights reserved.
Keywords: Bacteria removal; Mean residence time; Modelling; Operational parameters; PFE; MRT%FE; Wastewater storage
1. Introduction
Wastewater reservoirs (WWRs) are particularly suitable forstorage and stabilization of treated effluents and they are key-elements in all reuse systems for agricultural purposes. Thesehypertrophic aquatic systems contribute to the removal ofrefractory pollutants and pathogens and release effluents ofmuch better quality than other alternative treatment schemes,at lower O&M costs (Juanico, 1993, 1999). The use of storagereservoirs to regulate and transfer winter wastewater volume,cope agricultural water needs and improve their bacteriologi-cal quality, requires the selection of appropriate operationalprocedures to combine the need for a continuous wastewater
* Corresponding author. Tel.: þ39 095 714 7547; fax: þ39 095 714 7600.
E-mail address: [email protected] (S. Consoli).
0301-4797/$ - see front matter � 2007 Elsevier Ltd. All rights reserved.
doi:10.1016/j.jenvman.2007.12.015
disposal with the natural removal processes dynamics (Frie-dler et al., 2003).
Most completely mixed sewage treatment reactors (i.e., aer-ated lagoons, activated sludge, waste stabilization ponds withlong residence time, etc.) are assumed to be steady-state flowsystems with constant flow rate, volume and mean hydraulicresidence time. The dynamics of water quality changes ofthese reactors are, generally, modelled using first order kinet-ics by the Marais (1974) approach, with predicted pollutantconcentration related inversely with die-off or removal coeffi-cient (KT, d�1) and effluent residence time (td) within thesystem. However, these reactors do not actually fulfill the idealsteady-state flow assumption, because of differences in flowrate between day and night, weekdays and weekend, summerand winter, and because of impact of storm water discharges,etc. Juanico and Friedler (1994) developed a mathematical
605G.L. Cirelli et al. / Journal of Environmental Management 90 (2009) 604e614
tool to analyze the hydraulic age distribution in completelymixed reactors and demonstrated that the performance of thesereactors is not determined by the whole volume of effluentswithin the reactor but by a small fraction of fresh effluentswithin it. These authors calculated this small fraction andcalled it PFE epercentage of fresh effluents. They concludedthat the mean residence time (MRT) of the whole effluentscan be used for the design of steady-state reactors becauseMRT and PFE have an absolute correlation under idealsteady-state conditions. The PFE is a measurement of theamount of fresh effluents within the reactor, where ‘‘fresh’’is defined in time units, i.e., PFE5 is the percentage of fresheffluents having 5 or less days (or hours, or minutes) withinthe reactor. PFE itself is a timeless unit (a percentage) andthus it cannot be used to implement kinetic models.
In the present paper, a new parameter derived from classicalMRT but involving the concept of ‘‘fresh effluents’’ used byPFE is developed. The procedure implies the definition ofthe operational parameter MRT%FE that represents themean residence time of different freshest effluent percentages(FE).
MRT%FE is herein applied to predict Escherichia coli con-centrations in a municipal wastewater reservoir located inEastern Sicily (Italy). The reactor was operated during theyears 2004 and 2005 using different inlet/outlet flow modali-ties. The MRT%FE values were related inversely with micro-bial concentrations of treated wastewater using first orderkinetics by the Marais (1974) model. In the study, the variabil-ity of die-off coefficient KT (d�1) for continuous and discon-tinuous reservoir operation modalities was evaluated andrelated to E. coli removal dynamics.
2. Methodology
2.1. Caltagirone reservoir
The reservoir is located at Caltagirone, a municipality ofabout 35,000 inhabitants in Eastern Sicily equipped with an
P1
P2
P5
Inlet
Flight
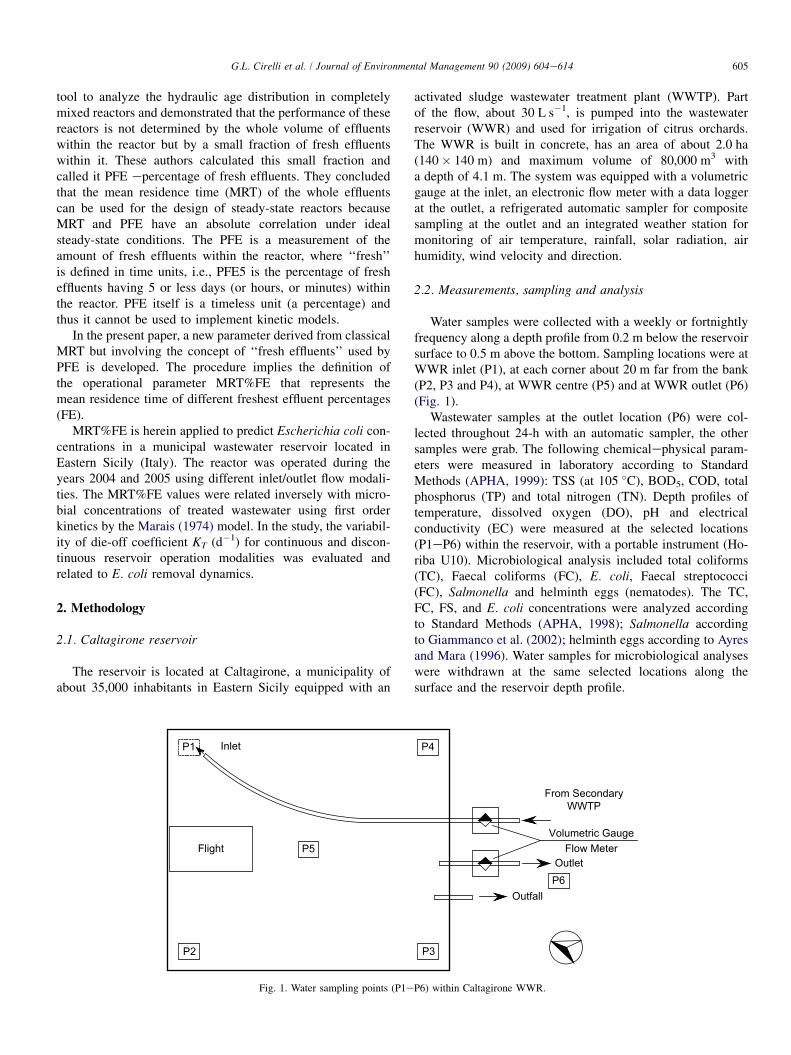
Fig. 1. Water sampling points (P1e
activated sludge wastewater treatment plant (WWTP). Partof the flow, about 30 L s�1, is pumped into the wastewaterreservoir (WWR) and used for irrigation of citrus orchards.The WWR is built in concrete, has an area of about 2.0 ha(140� 140 m) and maximum volume of 80,000 m3 witha depth of 4.1 m. The system was equipped with a volumetricgauge at the inlet, an electronic flow meter with a data loggerat the outlet, a refrigerated automatic sampler for compositesampling at the outlet and an integrated weather station formonitoring of air temperature, rainfall, solar radiation, airhumidity, wind velocity and direction.
2.2. Measurements, sampling and analysis
Water samples were collected with a weekly or fortnightlyfrequency along a depth profile from 0.2 m below the reservoirsurface to 0.5 m above the bottom. Sampling locations were atWWR inlet (P1), at each corner about 20 m far from the bank(P2, P3 and P4), at WWR centre (P5) and at WWR outlet (P6)(Fig. 1).
Wastewater samples at the outlet location (P6) were col-lected throughout 24-h with an automatic sampler, the othersamples were grab. The following chemicalephysical param-eters were measured in laboratory according to StandardMethods (APHA, 1999): TSS (at 105 �C), BOD5, COD, totalphosphorus (TP) and total nitrogen (TN). Depth profiles oftemperature, dissolved oxygen (DO), pH and electricalconductivity (EC) were measured at the selected locations(P1eP6) within the reservoir, with a portable instrument (Ho-riba U10). Microbiological analysis included total coliforms(TC), Faecal coliforms (FC), E. coli, Faecal streptococci(FC), Salmonella and helminth eggs (nematodes). The TC,FC, FS, and E. coli concentrations were analyzed accordingto Standard Methods (APHA, 1998); Salmonella accordingto Giammanco et al. (2002); helminth eggs according to Ayresand Mara (1996). Water samples for microbiological analyseswere withdrawn at the same selected locations along thesurface and the reservoir depth profile.
P3
P4
P6
From SecondaryWWTP
Volumetric GaugeFlow Meter
Outlet
Outfall
P6) within Caltagirone WWR.
606 G.L. Cirelli et al. / Journal of Environmental Management 90 (2009) 604e614
2.3. Operation of the reservoir
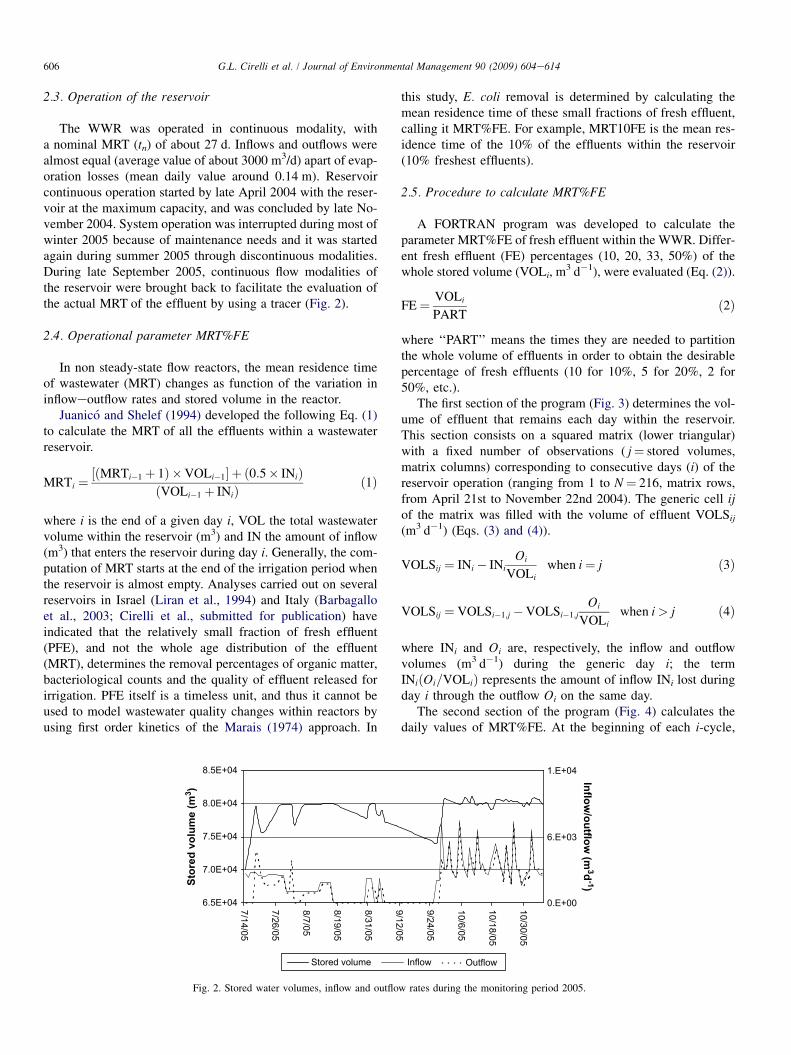
The WWR was operated in continuous modality, witha nominal MRT (tn) of about 27 d. Inflows and outflows werealmost equal (average value of about 3000 m3/d) apart of evap-oration losses (mean daily value around 0.14 m). Reservoircontinuous operation started by late April 2004 with the reser-voir at the maximum capacity, and was concluded by late No-vember 2004. System operation was interrupted during most ofwinter 2005 because of maintenance needs and it was startedagain during summer 2005 through discontinuous modalities.During late September 2005, continuous flow modalities ofthe reservoir were brought back to facilitate the evaluation ofthe actual MRT of the effluent by using a tracer (Fig. 2).
2.4. Operational parameter MRT%FE
In non steady-state flow reactors, the mean residence timeof wastewater (MRT) changes as function of the variation ininfloweoutflow rates and stored volume in the reactor.
Juanico and Shelef (1994) developed the following Eq. (1)to calculate the MRT of all the effluents within a wastewaterreservoir.
MRTi ¼½ðMRTi�1þ 1Þ �VOLi�1� þ ð0:5� INiÞ
ðVOLi�1 þ INiÞð1Þ
where i is the end of a given day i, VOL the total wastewatervolume within the reservoir (m3) and IN the amount of inflow(m3) that enters the reservoir during day i. Generally, the com-putation of MRT starts at the end of the irrigation period whenthe reservoir is almost empty. Analyses carried out on severalreservoirs in Israel (Liran et al., 1994) and Italy (Barbagalloet al., 2003; Cirelli et al., submitted for publication) haveindicated that the relatively small fraction of fresh effluent(PFE), and not the whole age distribution of the effluent(MRT), determines the removal percentages of organic matter,bacteriological counts and the quality of effluent released forirrigation. PFE itself is a timeless unit, and thus it cannot beused to model wastewater quality changes within reactors byusing first order kinetics of the Marais (1974) approach. In
6.5E+04
7.0E+04
7.5E+04
8.0E+04
8.5E+04
7/14/05
7/26/05
8/7/05
8/19/05
8/31/05
9/12/05
Sto
red
vo
lu
me (m
3)
Stored volume
Fig. 2. Stored water volumes, inflow and outflo
this study, E. coli removal is determined by calculating themean residence time of these small fractions of fresh effluent,calling it MRT%FE. For example, MRT10FE is the mean res-idence time of the 10% of the effluents within the reservoir(10% freshest effluents).
2.5. Procedure to calculate MRT%FE
A FORTRAN program was developed to calculate theparameter MRT%FE of fresh effluent within the WWR. Differ-ent fresh effluent (FE) percentages (10, 20, 33, 50%) of thewhole stored volume (VOLi, m3 d�1), were evaluated (Eq. (2)).
FE¼ VOLi
PARTð2Þ
where ‘‘PART’’ means the times they are needed to partitionthe whole volume of effluents in order to obtain the desirablepercentage of fresh effluents (10 for 10%, 5 for 20%, 2 for50%, etc.).
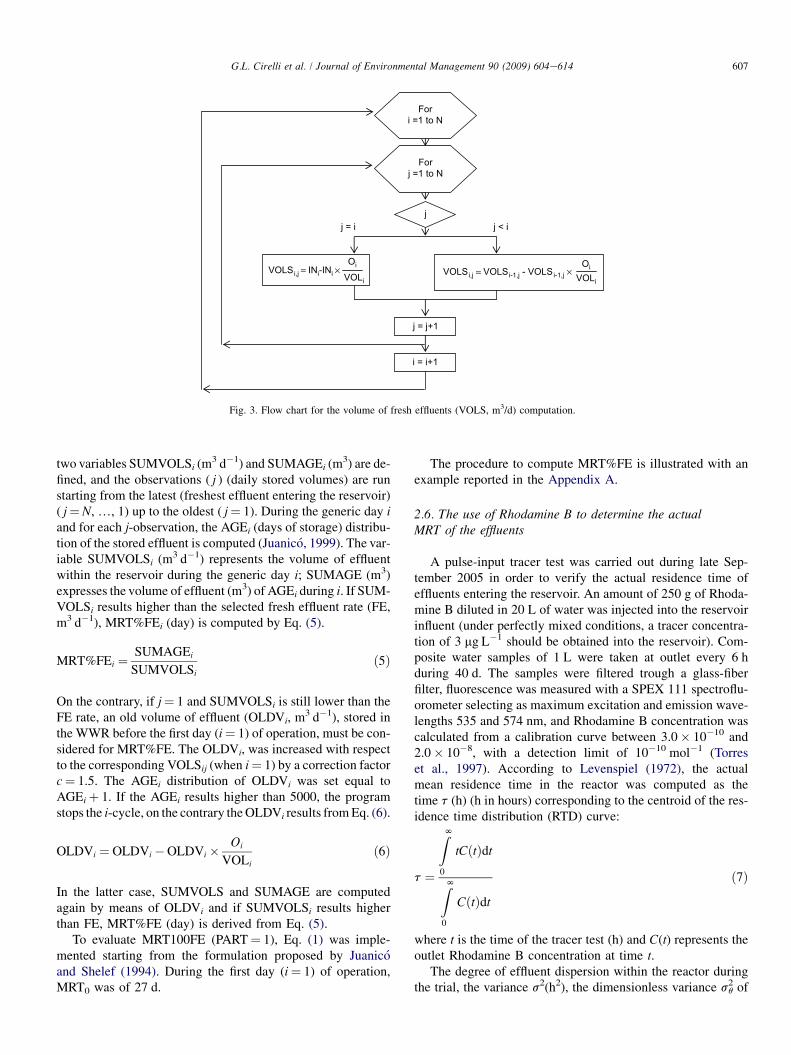
The first section of the program (Fig. 3) determines the vol-ume of effluent that remains each day within the reservoir.This section consists on a squared matrix (lower triangular)with a fixed number of observations ( j¼ stored volumes,matrix columns) corresponding to consecutive days (i) of thereservoir operation (ranging from 1 to N¼ 216, matrix rows,from April 21st to November 22nd 2004). The generic cell ijof the matrix was filled with the volume of effluent VOLSij
(m3 d�1) (Eqs. (3) and (4)).
VOLSij ¼ INi� INi
Oi
VOLi
when i¼ j ð3Þ
VOLSij ¼ VOLSi�1;j �VOLSi�1;j
Oi
VOLi
when i> j ð4Þ
where INi and Oi are, respectively, the inflow and outflowvolumes (m3 d�1) during the generic day i; the termINiðOi=VOLiÞ represents the amount of inflow INi lost duringday i through the outflow Oi on the same day.
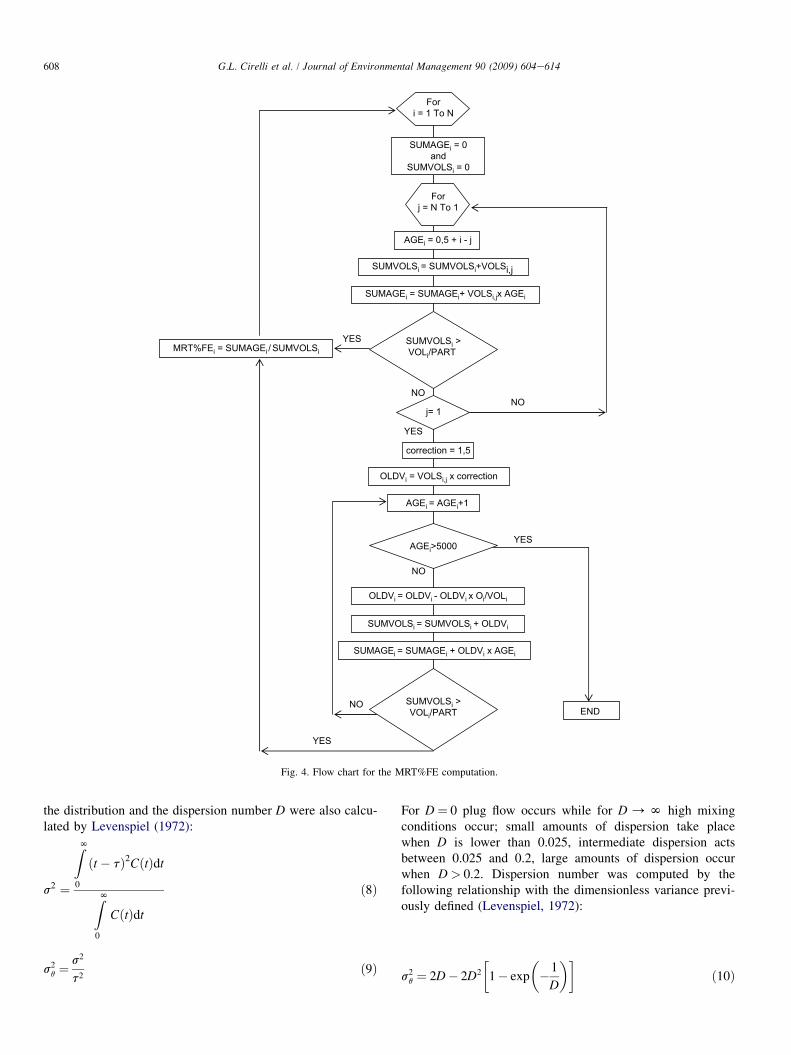
The second section of the program (Fig. 4) calculates thedaily values of MRT%FE. At the beginning of each i-cycle,
9/24/05
10/6/05
10/18/05
10/30/05
0.E+00
6.E+03
1.E+04
In
flo
w/o
utflo
w (m
3d
-1)
Inflow Outflow
w rates during the monitoring period 2005.
j = i j < i
VOLi
OiVOLSi,j = INi-INi × VOLi
OiVOLSi,j = VOLSi-1,j - VOLSi-1,j ×
j
j = j+1
Fori =1 to N
Forj =1 to N
i = i+1
Fig. 3. Flow chart for the volume of fresh effluents (VOLS, m3/d) computation.
607G.L. Cirelli et al. / Journal of Environmental Management 90 (2009) 604e614
two variables SUMVOLSi (m3 d�1) and SUMAGEi (m3) are de-fined, and the observations ( j ) (daily stored volumes) are runstarting from the latest (freshest effluent entering the reservoir)( j¼ N, ., 1) up to the oldest ( j¼ 1). During the generic day iand for each j-observation, the AGEi (days of storage) distribu-tion of the stored effluent is computed (Juanico, 1999). The var-iable SUMVOLSi (m3 d�1) represents the volume of effluentwithin the reservoir during the generic day i; SUMAGE (m3)expresses the volume of effluent (m3) of AGEi during i. If SUM-VOLSi results higher than the selected fresh effluent rate (FE,m3 d�1), MRT%FEi (day) is computed by Eq. (5).
MRT%FEi ¼SUMAGEi
SUMVOLSi
ð5Þ
On the contrary, if j¼ 1 and SUMVOLSi is still lower than theFE rate, an old volume of effluent (OLDVi, m3 d�1), stored inthe WWR before the first day (i¼ 1) of operation, must be con-sidered for MRT%FE. The OLDVi, was increased with respectto the corresponding VOLSij (when i¼ 1) by a correction factorc¼ 1.5. The AGEi distribution of OLDVi was set equal toAGEiþ 1. If the AGEi results higher than 5000, the programstops the i-cycle, on the contrary the OLDVi results from Eq. (6).
OLDVi ¼ OLDVi�OLDVi�Oi
VOLi
ð6Þ
In the latter case, SUMVOLS and SUMAGE are computedagain by means of OLDVi and if SUMVOLSi results higherthan FE, MRT%FE (day) is derived from Eq. (5).
To evaluate MRT100FE (PART¼ 1), Eq. (1) was imple-mented starting from the formulation proposed by Juanicoand Shelef (1994). During the first day (i¼ 1) of operation,MRT0 was of 27 d.
The procedure to compute MRT%FE is illustrated with anexample reported in the Appendix A.
2.6. The use of Rhodamine B to determine the actualMRT of the effluents
A pulse-input tracer test was carried out during late Sep-tember 2005 in order to verify the actual residence time ofeffluents entering the reservoir. An amount of 250 g of Rhoda-mine B diluted in 20 L of water was injected into the reservoirinfluent (under perfectly mixed conditions, a tracer concentra-tion of 3 mg L�1 should be obtained into the reservoir). Com-posite water samples of 1 L were taken at outlet every 6 hduring 40 d. The samples were filtered trough a glass-fiberfilter, fluorescence was measured with a SPEX 111 spectroflu-orometer selecting as maximum excitation and emission wave-lengths 535 and 574 nm, and Rhodamine B concentration wascalculated from a calibration curve between 3.0� 10�10 and2.0� 10�8, with a detection limit of 10�10 mol�1 (Torreset al., 1997). According to Levenspiel (1972), the actualmean residence time in the reactor was computed as thetime t (h) (h in hours) corresponding to the centroid of the res-idence time distribution (RTD) curve:
t ¼
ZN
0
tCðtÞdt
ZN
0
CðtÞdt
ð7Þ
where t is the time of the tracer test (h) and C(t) represents theoutlet Rhodamine B concentration at time t.
The degree of effluent dispersion within the reactor duringthe trial, the variance s2(h2), the dimensionless variance sq
2 of
MRT%FEi = SUMAGEi / SUMVOLSi
YES
YES
NONO
NO
YES
Fori = 1 To N
SUMAGEi = 0and
SUMVOLSi = 0
Forj = N To 1
AGEi = 0,5 + i - j
SUMVOLSi = SUMVOLSi+VOLSi,j
SUMAGEi = SUMAGEi+ VOLSi,jx AGEi
j= 1
correction = 1,5
OLDVi = VOLSi,j x correction
SUMVOLSi = SUMVOLSi + OLDVi
SUMAGEi = SUMAGEi + OLDVi x AGEi
SUMVOLSi >VOLi/PART
AGEi = AGEi+1
AGEi>5000
ENDSUMVOLSi >VOLi/PART
YES
NO
OLDVi = OLDVi - OLDVi x Oi/VOLi
Fig. 4. Flow chart for the MRT%FE computation.
608 G.L. Cirelli et al. / Journal of Environmental Management 90 (2009) 604e614
the distribution and the dispersion number D were also calcu-lated by Levenspiel (1972):
s2 ¼
ZN
0
ðt � tÞ2CðtÞdt
ZN
0
CðtÞdt
ð8Þ
s2q ¼
s2
t2ð9Þ
For D¼ 0 plug flow occurs while for D / N high mixingconditions occur; small amounts of dispersion take placewhen D is lower than 0.025, intermediate dispersion actsbetween 0.025 and 0.2, large amounts of dispersion occurwhen D> 0.2. Dispersion number was computed by thefollowing relationship with the dimensionless variance previ-ously defined (Levenspiel, 1972):
s2q ¼ 2D� 2D2
�1� exp
��1
D
��ð10Þ
609G.L. Cirelli et al. / Journal of Environmental Management 90 (2009) 604e614
2.7. The use of first order kinetics to model E. coli decayof Caltagirone reservoir
Removal of E. coli at Caltagirone WWR was modelled usingfirst order kinetics (Marais, 1974; modified by Barbagallo et al.,2004) for perfectly mixed reactors, expressed by Eq. (11).
Nt ¼No
1þKTMRT%FEð11Þ
where N0 and Nt represent, respectively, the E. coli concentra-tions (CFU/100 mL) at inlet and at reservoir outlet locationsduring the time step t; KT is the kinetic constant (or die-offcoefficient) (d�1) evaluated by solving the bacterial mass bal-ance of the reservoir during continuous operations (Eq. (12)).
DðVNtÞDt
zVt
DNt
Dt¼ INtN0�OtNt �KTNtVt ð12Þ
where Dt is the time step between two following samplings(between 7 and 14 d), VOLt the water volume within the res-ervoir (m3) during the time step t, DNt¼ Nt� Nt�Dt. The KT
data were used with different MRT%FE values to predictE. coli content through Eq. (11).
During WWR discontinuous operations (data from 2005),the KT was calculated from observed data of E. coli througha simple rearrangement of Eq. (11), leading to:
KT ¼
�N0
Nt
�� 1
MRT100%FEð13Þ
with MRT100FE expressed by Eq. (1). The obtained KT valueswere converted to standard temperature (T ) of 20 �C using Eq.(14) and the temperature coefficient q¼ 1.19 (Marais, 1974).
KTð20�CÞ ¼ KTqð20�TÞ ð14Þ
E = 99.8% E = 99
1.0E+00
1.0E+01
1.0E+02
1.0E+03
1.0E+04
1.0E+05
1.0E+06
FC E. Coli
[C
FU
/100 m
L] [M
PN
/100 m
L]
WWR inlet WWR o
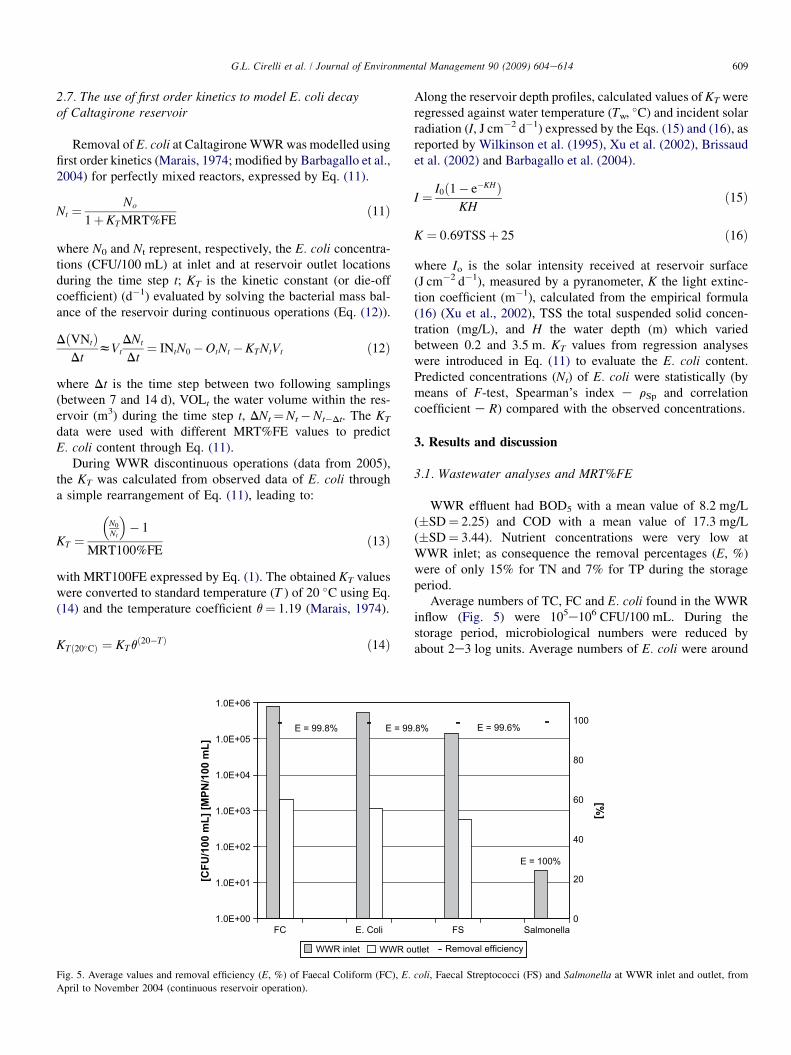
Fig. 5. Average values and removal efficiency (E, %) of Faecal Coliform (FC), E.April to November 2004 (continuous reservoir operation).
Along the reservoir depth profiles, calculated values of KT wereregressed against water temperature (Tw, �C) and incident solarradiation (I, J cm�2 d�1) expressed by the Eqs. (15) and (16), asreported by Wilkinson et al. (1995), Xu et al. (2002), Brissaudet al. (2002) and Barbagallo et al. (2004).
I ¼ I0ð1� e�KHÞKH
ð15Þ
K ¼ 0:69TSSþ 25 ð16Þ
where Io is the solar intensity received at reservoir surface(J cm�2 d�1), measured by a pyranometer, K the light extinc-tion coefficient (m�1), calculated from the empirical formula(16) (Xu et al., 2002), TSS the total suspended solid concen-tration (mg/L), and H the water depth (m) which variedbetween 0.2 and 3.5 m. KT values from regression analyseswere introduced in Eq. (11) to evaluate the E. coli content.Predicted concentrations (Nt) of E. coli were statistically (bymeans of F-test, Spearman’s index e rSp and correlationcoefficient e R) compared with the observed concentrations.
3. Results and discussion
3.1. Wastewater analyses and MRT%FE
WWR effluent had BOD5 with a mean value of 8.2 mg/L(�SD¼ 2.25) and COD with a mean value of 17.3 mg/L(�SD¼ 3.44). Nutrient concentrations were very low atWWR inlet; as consequence the removal percentages (E, %)were of only 15% for TN and 7% for TP during the storageperiod.
Average numbers of TC, FC and E. coli found in the WWRinflow (Fig. 5) were 105e106 CFU/100 mL. During thestorage period, microbiological numbers were reduced byabout 2e3 log units. Average numbers of E. coli were around
.8% E = 99.6%
E = 100%
FS Salmonella0
20
40
60
80
100
[%
]
utlet Removal efficiency
coli, Faecal Streptococci (FS) and Salmonella at WWR inlet and outlet, from
1.0
2.0
3.0
0.00 5 10 15 20 25 30 35 40 45
Times (days)
Ro
dam
in
e B
(µg
/L
)
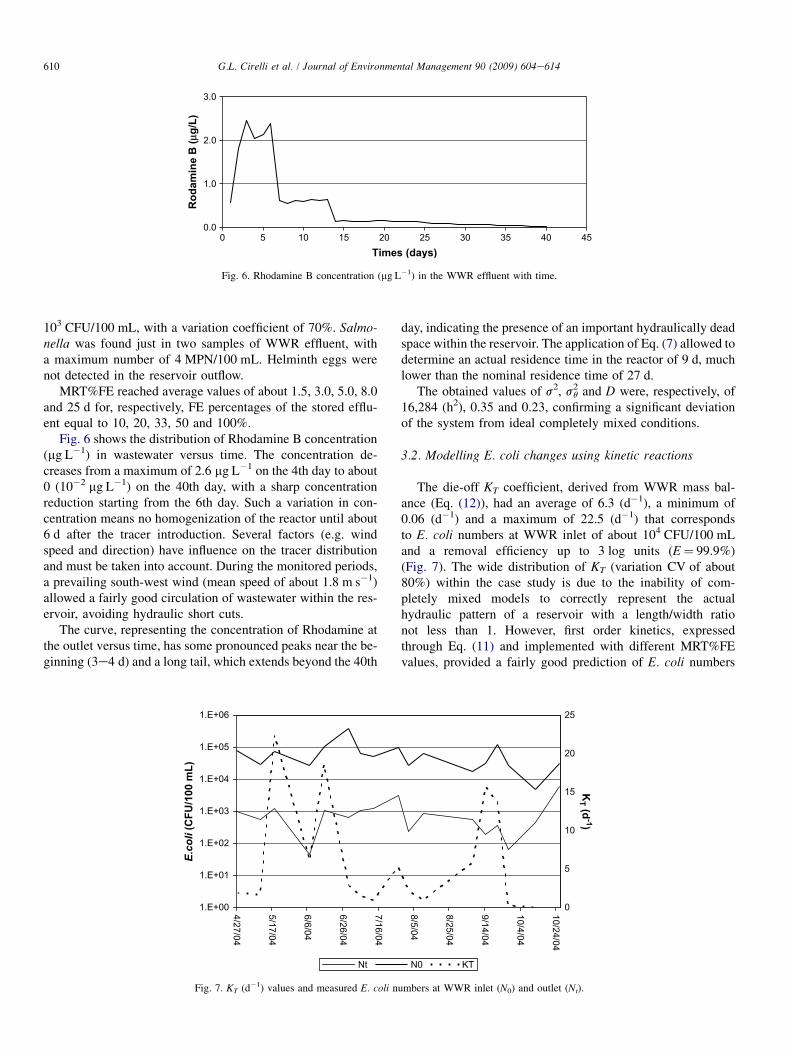
Fig. 6. Rhodamine B concentration (mg L�1) in the WWR effluent with time.
610 G.L. Cirelli et al. / Journal of Environmental Management 90 (2009) 604e614
103 CFU/100 mL, with a variation coefficient of 70%. Salmo-nella was found just in two samples of WWR effluent, witha maximum number of 4 MPN/100 mL. Helminth eggs werenot detected in the reservoir outflow.
MRT%FE reached average values of about 1.5, 3.0, 5.0, 8.0and 25 d for, respectively, FE percentages of the stored efflu-ent equal to 10, 20, 33, 50 and 100%.
Fig. 6 shows the distribution of Rhodamine B concentration(mg L�1) in wastewater versus time. The concentration de-creases from a maximum of 2.6 mg L�1 on the 4th day to about0 (10�2 mg L�1) on the 40th day, with a sharp concentrationreduction starting from the 6th day. Such a variation in con-centration means no homogenization of the reactor until about6 d after the tracer introduction. Several factors (e.g. windspeed and direction) have influence on the tracer distributionand must be taken into account. During the monitored periods,a prevailing south-west wind (mean speed of about 1.8 m s�1)allowed a fairly good circulation of wastewater within the res-ervoir, avoiding hydraulic short cuts.
The curve, representing the concentration of Rhodamine atthe outlet versus time, has some pronounced peaks near the be-ginning (3e4 d) and a long tail, which extends beyond the 40th
1.E+00
1.E+01
1.E+02
1.E+03
1.E+04
1.E+05
1.E+06
4/27/04
5/17/04
6/6/04
6/26/04
7/16/04
E.c
oli (C
FU
/1
00
m
L)
Nt
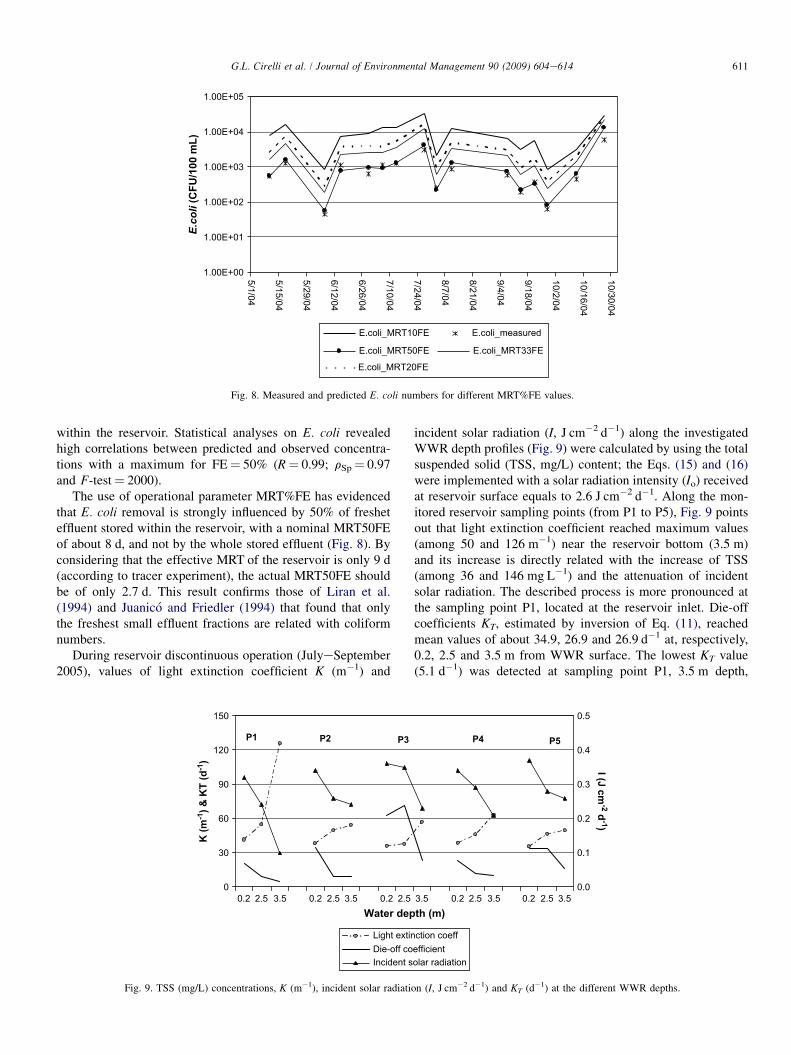
Fig. 7. KT (d�1) values and measured E. coli n
day, indicating the presence of an important hydraulically deadspace within the reservoir. The application of Eq. (7) allowed todetermine an actual residence time in the reactor of 9 d, muchlower than the nominal residence time of 27 d.
The obtained values of s2, sq2 and D were, respectively, of
16,284 (h2), 0.35 and 0.23, confirming a significant deviationof the system from ideal completely mixed conditions.
3.2. Modelling E. coli changes using kinetic reactions
The die-off KT coefficient, derived from WWR mass bal-ance (Eq. (12)), had an average of 6.3 (d�1), a minimum of0.06 (d�1) and a maximum of 22.5 (d�1) that correspondsto E. coli numbers at WWR inlet of about 104 CFU/100 mLand a removal efficiency up to 3 log units (E¼ 99.9%)(Fig. 7). The wide distribution of KT (variation CV of about80%) within the case study is due to the inability of com-pletely mixed models to correctly represent the actualhydraulic pattern of a reservoir with a length/width rationot less than 1. However, first order kinetics, expressedthrough Eq. (11) and implemented with different MRT%FEvalues, provided a fairly good prediction of E. coli numbers
8/5/04
8/25/04
9/14/04
10/4/04
10/24/04
0
5
10
15
20
25
KT (d
-1)
N0 KT
umbers at WWR inlet (N0) and outlet (Nt).
1.00E+00
1.00E+01
1.00E+02
1.00E+03
1.00E+04
1.00E+05
5/1/04
5/15/04
5/29/04
6/12/04
6/26/04
7/10/04
7/24/04
8/7/04
8/21/04
9/4/04
9/18/04
10/2/04
10/16/04
10/30/04E
.c
oli (C
FU
/1
00
m
L)
E.coli_MRT10FE
E.coli_MRT33FEE.coli_MRT50FE
E.coli_MRT20FE
E.coli_measured
Fig. 8. Measured and predicted E. coli numbers for different MRT%FE values.
611G.L. Cirelli et al. / Journal of Environmental Management 90 (2009) 604e614
within the reservoir. Statistical analyses on E. coli revealedhigh correlations between predicted and observed concentra-tions with a maximum for FE¼ 50% (R¼ 0.99; rSp¼ 0.97and F-test¼ 2000).
The use of operational parameter MRT%FE has evidencedthat E. coli removal is strongly influenced by 50% of fresheteffluent stored within the reservoir, with a nominal MRT50FEof about 8 d, and not by the whole stored effluent (Fig. 8). Byconsidering that the effective MRT of the reservoir is only 9 d(according to tracer experiment), the actual MRT50FE shouldbe of only 2.7 d. This result confirms those of Liran et al.(1994) and Juanico and Friedler (1994) that found that onlythe freshest small effluent fractions are related with coliformnumbers.
During reservoir discontinuous operation (JulyeSeptember2005), values of light extinction coefficient K (m�1) and
0
30
60
90
120
150
0.2 2.5 3.5 0.2 2.5 3.5 0.2 2.5
K (m
-1) &
K
T (d
-1)
Water dep
Light extinDie-off coIncident s
P1 P2 P3
Fig. 9. TSS (mg/L) concentrations, K (m�1), incident solar radiatio
incident solar radiation (I, J cm�2 d�1) along the investigatedWWR depth profiles (Fig. 9) were calculated by using the totalsuspended solid (TSS, mg/L) content; the Eqs. (15) and (16)were implemented with a solar radiation intensity (Io) receivedat reservoir surface equals to 2.6 J cm�2 d�1. Along the mon-itored reservoir sampling points (from P1 to P5), Fig. 9 pointsout that light extinction coefficient reached maximum values(among 50 and 126 m�1) near the reservoir bottom (3.5 m)and its increase is directly related with the increase of TSS(among 36 and 146 mg L�1) and the attenuation of incidentsolar radiation. The described process is more pronounced atthe sampling point P1, located at the reservoir inlet. Die-offcoefficients KT, estimated by inversion of Eq. (11), reachedmean values of about 34.9, 26.9 and 26.9 d�1 at, respectively,0.2, 2.5 and 3.5 m from WWR surface. The lowest KT value(5.1 d�1) was detected at sampling point P1, 3.5 m depth,
3.5 0.2 2.5 3.5 0.2 2.5 3.50.0
0.1
0.2
0.3
0.4
0.5
I (J cm
-2 d
-1)
th (m)
ction coeffefficientolar radiation
P4 P5
n (I, J cm�2 d�1) and KT (d�1) at the different WWR depths.
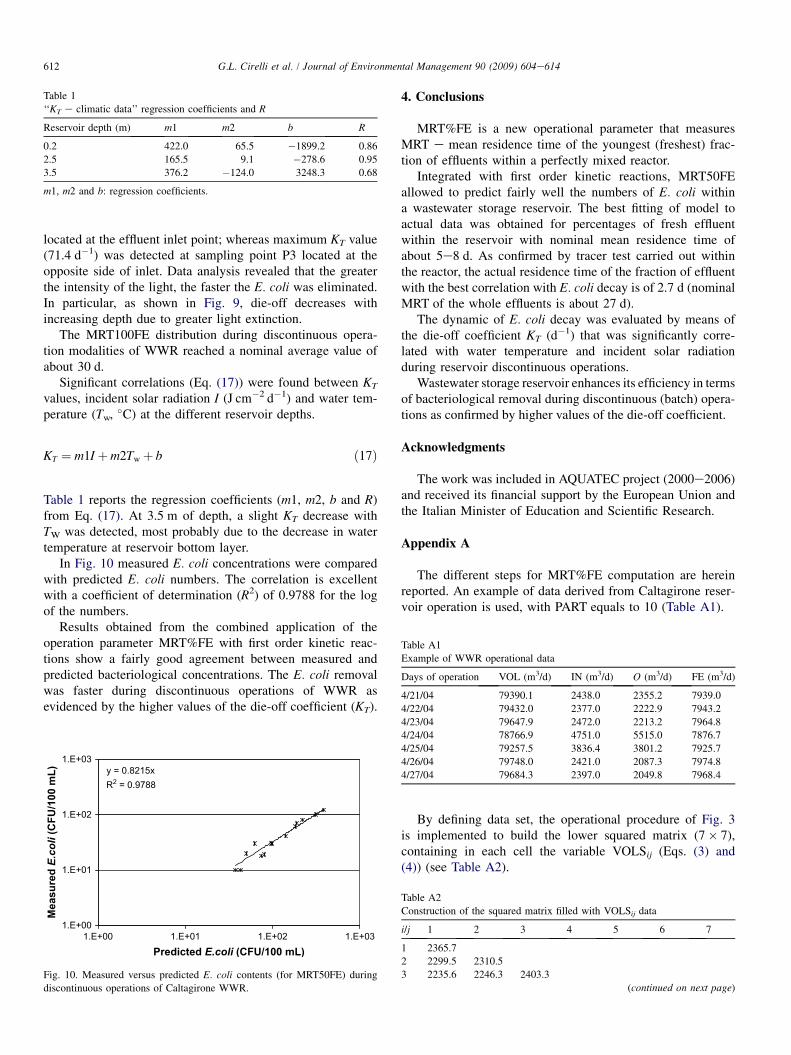
Table 1
‘‘KT e climatic data’’ regression coefficients and R
Reservoir depth (m) m1 m2 b R
0.2 422.0 65.5 �1899.2 0.86
2.5 165.5 9.1 �278.6 0.95
3.5 376.2 �124.0 3248.3 0.68
m1, m2 and b: regression coefficients.
Table A1
Example of WWR operational data
Days of operation VOL (m3/d) IN (m3/d) O (m3/d) FE (m3/d)
4/21/04 79390.1 2438.0 2355.2 7939.0
4/22/04 79432.0 2377.0 2222.9 7943.2
612 G.L. Cirelli et al. / Journal of Environmental Management 90 (2009) 604e614
located at the effluent inlet point; whereas maximum KT value(71.4 d�1) was detected at sampling point P3 located at theopposite side of inlet. Data analysis revealed that the greaterthe intensity of the light, the faster the E. coli was eliminated.In particular, as shown in Fig. 9, die-off decreases withincreasing depth due to greater light extinction.
The MRT100FE distribution during discontinuous opera-tion modalities of WWR reached a nominal average value ofabout 30 d.
Significant correlations (Eq. (17)) were found between KT
values, incident solar radiation I (J cm�2 d�1) and water tem-perature (Tw, �C) at the different reservoir depths.
KT ¼ m1Iþm2Tw þ b ð17Þ
Table 1 reports the regression coefficients (m1, m2, b and R)from Eq. (17). At 3.5 m of depth, a slight KT decrease withTW was detected, most probably due to the decrease in watertemperature at reservoir bottom layer.
In Fig. 10 measured E. coli concentrations were comparedwith predicted E. coli numbers. The correlation is excellentwith a coefficient of determination (R2) of 0.9788 for the logof the numbers.
Results obtained from the combined application of theoperation parameter MRT%FE with first order kinetic reac-tions show a fairly good agreement between measured andpredicted bacteriological concentrations. The E. coli removalwas faster during discontinuous operations of WWR asevidenced by the higher values of the die-off coefficient (KT).
y = 0.8215xR2 = 0.9788
1.E+00
1.E+01
1.E+02
1.E+03
1.E+00 1.E+01 1.E+02 1.E+03Predicted E.coli (CFU/100 mL)
Me
as
ure
d E
.c
oli (C
FU
/1
00
m
L)
Fig. 10. Measured versus predicted E. coli contents (for MRT50FE) during
discontinuous operations of Caltagirone WWR.
4. Conclusions
MRT%FE is a new operational parameter that measuresMRT e mean residence time of the youngest (freshest) frac-tion of effluents within a perfectly mixed reactor.
Integrated with first order kinetic reactions, MRT50FEallowed to predict fairly well the numbers of E. coli withina wastewater storage reservoir. The best fitting of model toactual data was obtained for percentages of fresh effluentwithin the reservoir with nominal mean residence time ofabout 5e8 d. As confirmed by tracer test carried out withinthe reactor, the actual residence time of the fraction of effluentwith the best correlation with E. coli decay is of 2.7 d (nominalMRT of the whole effluents is about 27 d).
The dynamic of E. coli decay was evaluated by means ofthe die-off coefficient KT (d�1) that was significantly corre-lated with water temperature and incident solar radiationduring reservoir discontinuous operations.
Wastewater storage reservoir enhances its efficiency in termsof bacteriological removal during discontinuous (batch) opera-tions as confirmed by higher values of the die-off coefficient.
Acknowledgments
The work was included in AQUATEC project (2000e2006)and received its financial support by the European Union andthe Italian Minister of Education and Scientific Research.
Appendix A
The different steps for MRT%FE computation are hereinreported. An example of data derived from Caltagirone reser-voir operation is used, with PART equals to 10 (Table A1).
4/23/04 79647.9 2472.0 2213.2 7964.8
4/24/04 78766.9 4751.0 5515.0 7876.7
4/25/04 79257.5 3836.4 3801.2 7925.7
4/26/04 79748.0 2421.0 2087.3 7974.8
4/27/04 79684.3 2397.0 2049.8 7968.4
By defining data set, the operational procedure of Fig. 3is implemented to build the lower squared matrix (7� 7),containing in each cell the variable VOLSij (Eqs. (3) and(4)) (see Table A2).
Table A2
Construction of the squared matrix filled with VOLSij data
i/j 1 2 3 4 5 6 7
1 2365.7
2 2299.5 2310.5
3 2235.6 2246.3 2403.3
(continued on next page)
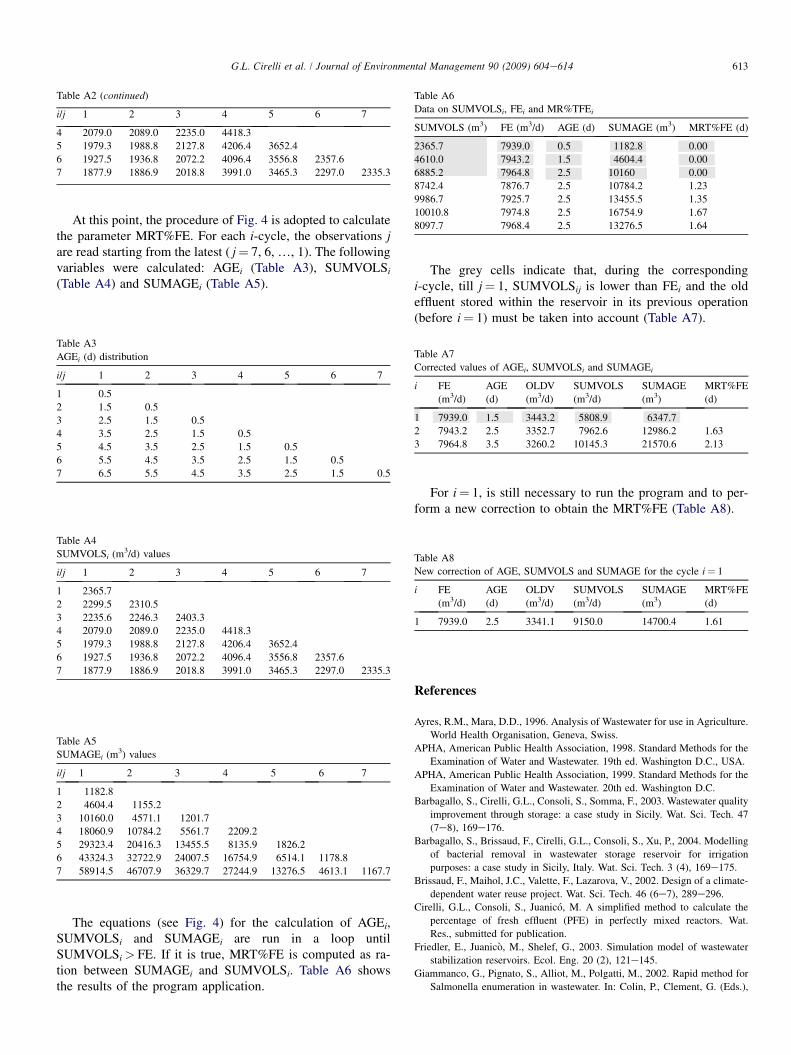
Table A6
Data on SUMVOLSi, FEi and MR%TFEi
SUMVOLS (m3) FE (m3/d) AGE (d) SUMAGE (m3) MRT%FE (d)
2365.7 7939.0 0.5 1182.8 0.00
4610.0 7943.2 1.5 4604.4 0.00
6885.2 7964.8 2.5 10160 0.00
8742.4 7876.7 2.5 10784.2 1.23
9986.7 7925.7 2.5 13455.5 1.35
10010.8 7974.8 2.5 16754.9 1.67
8097.7 7968.4 2.5 13276.5 1.64
Table A2 (continued)
i/j 1 2 3 4 5 6 7
4 2079.0 2089.0 2235.0 4418.3
5 1979.3 1988.8 2127.8 4206.4 3652.4
6 1927.5 1936.8 2072.2 4096.4 3556.8 2357.6
7 1877.9 1886.9 2018.8 3991.0 3465.3 2297.0 2335.3
613G.L. Cirelli et al. / Journal of Environmental Management 90 (2009) 604e614
At this point, the procedure of Fig. 4 is adopted to calculatethe parameter MRT%FE. For each i-cycle, the observations jare read starting from the latest ( j¼ 7, 6, ., 1). The followingvariables were calculated: AGEi (Table A3), SUMVOLSi
(Table A4) and SUMAGEi (Table A5).
Table A3
AGEi (d) distribution
i/j 1 2 3 4 5 6 7
1 0.5
2 1.5 0.5
3 2.5 1.5 0.5
4 3.5 2.5 1.5 0.5
5 4.5 3.5 2.5 1.5 0.5
6 5.5 4.5 3.5 2.5 1.5 0.5
7 6.5 5.5 4.5 3.5 2.5 1.5 0.5
Table A4
SUMVOLSi (m3/d) values
i/j 1 2 3 4 5 6 7
1 2365.7
2 2299.5 2310.5
3 2235.6 2246.3 2403.3
4 2079.0 2089.0 2235.0 4418.3
5 1979.3 1988.8 2127.8 4206.4 3652.4
6 1927.5 1936.8 2072.2 4096.4 3556.8 2357.6
7 1877.9 1886.9 2018.8 3991.0 3465.3 2297.0 2335.3
Table A5
SUMAGEi (m3) values
i/j 1 2 3 4 5 6 7
1 1182.8
2 4604.4 1155.2
3 10160.0 4571.1 1201.7
4 18060.9 10784.2 5561.7 2209.2
5 29323.4 20416.3 13455.5 8135.9 1826.2
6 43324.3 32722.9 24007.5 16754.9 6514.1 1178.8
7 58914.5 46707.9 36329.7 27244.9 13276.5 4613.1 1167.7
Table A8
New correction of AGE, SUMVOLS and SUMAGE for the cycle i¼ 1
i FE
(m3/d)
AGE
(d)
OLDV
(m3/d)
SUMVOLS
(m3/d)
SUMAGE
(m3)
MRT%FE
(d)
1 7939.0 2.5 3341.1 9150.0 14700.4 1.61
Table A7
Corrected values of AGEi, SUMVOLSi and SUMAGEi
i FE
(m3/d)
AGE
(d)
OLDV
(m3/d)
SUMVOLS
(m3/d)
SUMAGE
(m3)
MRT%FE
(d)
1 7939.0 1.5 3443.2 5808.9 6347.7
2 7943.2 2.5 3352.7 7962.6 12986.2 1.63
3 7964.8 3.5 3260.2 10145.3 21570.6 2.13
The equations (see Fig. 4) for the calculation of AGEi,SUMVOLSi and SUMAGEi are run in a loop untilSUMVOLSi> FE. If it is true, MRT%FE is computed as ra-tion between SUMAGEi and SUMVOLSi. Table A6 showsthe results of the program application.
The grey cells indicate that, during the correspondingi-cycle, till j¼ 1, SUMVOLSij is lower than FEi and the oldeffluent stored within the reservoir in its previous operation(before i¼ 1) must be taken into account (Table A7).
For i¼ 1, is still necessary to run the program and to per-form a new correction to obtain the MRT%FE (Table A8).
References
Ayres, R.M., Mara, D.D., 1996. Analysis of Wastewater for use in Agriculture.
World Health Organisation, Geneva, Swiss.
APHA, American Public Health Association, 1998. Standard Methods for the
Examination of Water and Wastewater. 19th ed. Washington D.C., USA.
APHA, American Public Health Association, 1999. Standard Methods for the
Examination of Water and Wastewater. 20th ed. Washington D.C.
Barbagallo, S., Cirelli, G.L., Consoli, S., Somma, F., 2003. Wastewater quality
improvement through storage: a case study in Sicily. Wat. Sci. Tech. 47
(7e8), 169e176.
Barbagallo, S., Brissaud, F., Cirelli, G.L., Consoli, S., Xu, P., 2004. Modelling
of bacterial removal in wastewater storage reservoir for irrigation
purposes: a case study in Sicily, Italy. Wat. Sci. Tech. 3 (4), 169e175.
Brissaud, F., Maihol, J.C., Valette, F., Lazarova, V., 2002. Design of a climate-
dependent water reuse project. Wat. Sci. Tech. 46 (6e7), 289e296.
Cirelli, G.L., Consoli, S., Juanico, M. A simplified method to calculate the
percentage of fresh effluent (PFE) in perfectly mixed reactors. Wat.
Res., submitted for publication.
Friedler, E., Juanico, M., Shelef, G., 2003. Simulation model of wastewater
stabilization reservoirs. Ecol. Eng. 20 (2), 121e145.
Giammanco, G., Pignato, S., Alliot, M., Polgatti, M., 2002. Rapid method for
Salmonella enumeration in wastewater. In: Colin, P., Clement, G. (Eds.),
614 G.L. Cirelli et al. / Journal of Environmental Management 90 (2009) 604e614
Proceedings of the International Symposium on Salmonella and Salmonello-
sis, St. Brieuc, France, 29e31 May. ISPAIA, Ploufragan, France, pp. 67e71.
Juanico, M., 1993. Alternative schemes for municipal sewage treatment and dis-
posal in industrialized countries: Israel as a case study. Ecol. Eng. 2 (2),
101e118.
Juanico, M., Friedler, E., 1994. Hydraulic age distribution in perfectly mixed
non steady-state reactors. ASCE J. Environ. Eng. 120 (6), 1427e1445.
Juanico, M., Shelef, G., 1994. Design, operation and performance of stabiliza-
tion reservoirs for wastewater irrigation in Israel. Wat. Res. 28 (1), 175e186.
Juanico, M., 1999. Process design and operation. In: Juanico, M., Dor, I.
(Eds.), Reservoirs for Wastewater Storage and Reuse. Springer-Verlag,
Berlin, Heidelberg, pp. 61e83.
Levenspiel, O., 1972. Chemical Reaction Engineering, second ed. Wiley, New
York, USA.
Liran, A., Juanico, M., Shelef, G., 1994. Coliform removal in a stabilization
reservoir for wastewater irrigation in Israel. Wat. Res. 28 (6), 1305e1314.
Marais, G.V.R., 1974. Faecal bacterial kinetics in stabilisation ponds. J. Env.
Eng. Div. 100 (1), 119e139.
Torres, J.J., Soler, A., Saez, J., Ortuno, J.F., 1997. Hydraulic performance
of a deep wastewater stabilization pond. Wat. Res. 31 (4), 679e688.
Wilkinson, J., Jenkins, A., Wyer, M., Kay, D., 1995. Modelling faecal
coliforms dynamics in streams and rivers. Wat. Res. 29 (3), 847e855.
Xu, P., Brissaud, F., Fazio, A., 2002. Non-steady-state modelling of faecal
coliform removal in deep tertiary lagoons. Wat. Res. 36 (12), 3074e3082.
Related Documents