Atmospheric Environment 39 (2005) 429–444 Modeling the ozone weekend effect in very complex terrains: a case study in the Northeastern Iberian Peninsula Pedro Jime´nez, Rene´ Parra, Santiago Gasso´, Jose´ M. Baldasano Laboratory of Environmental Modeling, Universitat Polite`cnica de Catalunya (UPC), Avda. Diagonal 647 10.23, 08028 Barcelona, Spain Received 22 August 2004; accepted 24 September 2004 Abstract Ambient ozone (O 3 ) concentrations tend to be higher on weekends than on weekdays in urban areas, a phenomenon known as the weekend effect. Nevertheless, its downwind influence could be diverse. The MM5-CMAQ model has been used to assess the causes of weekday/weekend O 3 differences in the north-eastern Iberian Peninsula during an episode of photochemical pollution covering the whole Western Mediterranean Basin (13–16 August 2000). Emissions were estimated with EMICAT2000 model. The key differences between weekday and weekend on-road vehicle emissions are in magnitude and timing. On-road traffic accounts for 57% of the anthropogenic NO x and VOC emissions in the modeling domain, and are principally located along the coast and mainly in the Barcelona Geographical Area. The drop of heavy-duty tracks traffic on weekends involves a 22% reduction of NO x emissions and just a slight change in VOC emissions. Changes in the timing of emissions are directly related to differences in weekday/weekend traffic profiles, being emissions shifted 1–2 h later on weekends. The response of both ambient and simulated O 3 concentrations to day-of-week differences in emissions varies by location. The combination of VOC-sensitive regimes and NO x -titration in urban areas as Barcelona, in addition to the different magnitude and timing of emissions (decreasing NO x /VOC ratios on weekend mornings) causes the raise of O 3 on weekends (+54%). In non-urban regimes, principally associated to NO x -sensitive chemistry, a lower concentration of O 3 is observed in non-labor days (decreases of –10% in downwind areas). Rural locations, dominated by medium-long range transport, depict similar O 3 concentrations. Both discrete and categorical model evaluations are shown in order to test the accuracy of the model for representing weekdays/weekends differences within the air basin. This work helps identifying the major causes of the weekend effect in the considered domain, as the changing in mass and time of precursors emissions, and may be a useful tool to reduce ambient O 3 levels. r 2004 Elsevier Ltd. All rights reserved. Keywords: Ozone; Weekend effect; Air quality modeling; Photochemistry; Very complex areas 1. Introduction Tropospheric ozone results form the photochemical interaction of NO x and VOCs under the presence of sunlight. The ozone weekend effect refers to a tendency in some areas for ozone concentrations to be higher on weekends compared to weekdays, despite emissions of VOCs and NO x are typically lower on weekends due to a different anthropogenic activity. This phenomenon was first reported in the United States in the 1970s (Cleve- land et al., 1974; Lebron, 1975) and has been since reported mainly in the US and Europe (Altshuler et al., ARTICLE IN PRESS www.elsevier.com/locate/atmosenv 1352-2310/$ - see front matter r 2004 Elsevier Ltd. All rights reserved. doi:10.1016/j.atmosenv.2004.09.065 Corresponding author. Tel: +34 934011744; fax: +34 93340255. E-mail address: [email protected] (J.M. Baldasano).

Welcome message from author
This document is posted to help you gain knowledge. Please leave a comment to let me know what you think about it! Share it to your friends and learn new things together.
Transcript
ARTICLE IN PRESS
1352-2310/$ - se
doi:10.1016/j.at
�Correspond+34 93340255.
E-mail addr
Atmospheric Environment 39 (2005) 429–444
www.elsevier.com/locate/atmosenv
Modeling the ozone weekend effect in very complex terrains:a case study in the Northeastern Iberian Peninsula
Pedro Jimenez, Rene Parra, Santiago Gasso, Jose M. Baldasano�
Laboratory of Environmental Modeling, Universitat Politecnica de Catalunya (UPC), Avda. Diagonal 647 10.23, 08028 Barcelona, Spain
Received 22 August 2004; accepted 24 September 2004
Abstract
Ambient ozone (O3) concentrations tend to be higher on weekends than on weekdays in urban areas, a phenomenon
known as the weekend effect. Nevertheless, its downwind influence could be diverse. The MM5-CMAQ model has been
used to assess the causes of weekday/weekend O3 differences in the north-eastern Iberian Peninsula during an episode of
photochemical pollution covering the whole Western Mediterranean Basin (13–16 August 2000). Emissions were
estimated with EMICAT2000 model. The key differences between weekday and weekend on-road vehicle emissions are
in magnitude and timing. On-road traffic accounts for �57% of the anthropogenic NOx and VOC emissions in the
modeling domain, and are principally located along the coast and mainly in the Barcelona Geographical Area. The
drop of heavy-duty tracks traffic on weekends involves a 22% reduction of NOx emissions and just a slight change in
VOC emissions. Changes in the timing of emissions are directly related to differences in weekday/weekend traffic
profiles, being emissions shifted 1–2 h later on weekends. The response of both ambient and simulated O3
concentrations to day-of-week differences in emissions varies by location. The combination of VOC-sensitive regimes
and NOx-titration in urban areas as Barcelona, in addition to the different magnitude and timing of emissions
(decreasing NOx/VOC ratios on weekend mornings) causes the raise of O3 on weekends (+54%). In non-urban
regimes, principally associated to NOx-sensitive chemistry, a lower concentration of O3 is observed in non-labor days
(decreases of –10% in downwind areas). Rural locations, dominated by medium-long range transport, depict similar O3
concentrations. Both discrete and categorical model evaluations are shown in order to test the accuracy of the model for
representing weekdays/weekends differences within the air basin. This work helps identifying the major causes of the
weekend effect in the considered domain, as the changing in mass and time of precursors emissions, and may be a useful
tool to reduce ambient O3 levels.
r 2004 Elsevier Ltd. All rights reserved.
Keywords: Ozone; Weekend effect; Air quality modeling; Photochemistry; Very complex areas
1. Introduction
Tropospheric ozone results form the photochemical
interaction of NOx and VOCs under the presence of
e front matter r 2004 Elsevier Ltd. All rights reserve
mosenv.2004.09.065
ing author. Tel: +34 934011744; fax:
ess: [email protected] (J.M. Baldasano).
sunlight. The ozone weekend effect refers to a tendency
in some areas for ozone concentrations to be higher on
weekends compared to weekdays, despite emissions of
VOCs and NOx are typically lower on weekends due to a
different anthropogenic activity. This phenomenon was
first reported in the United States in the 1970s (Cleve-
land et al., 1974; Lebron, 1975) and has been since
reported mainly in the US and Europe (Altshuler et al.,
d.
ARTICLE IN PRESSP. Jimenez et al. / Atmospheric Environment 39 (2005) 429–444430
1995; Bronnimann and Neu, 1997; Jenkin et al., 2002;
Pun et al., 2003; Qin et al., 2004a; among others). Higher
weekend ozone tends to be found in urban centers, while
lower weekend ozone is found in downwind areas.
Altshuler et al. (1995) and Blanchard and Fairley (2001)
have suggested that the weekend effect is related to
whether ozone formation in VOC- or NOx-sensitive,
with higher weekend ozone occurring in VOC-sensitive
areas. However, a major problem for the study of NOx-
VOC sensitivity on ozone formation has been the
inability to gain evidence based on direct measurements
rather than theoretical calculations (Sillman, 1999).
Despite there is a high uncertainty in the causes of the
weekend effect, the California Air Resources Board has
widely studied this problem in California, and six
hypothesis have been set for this area (CARB, 2003):
NOx reduction: Marr and Harley (2002a) analyzed the
day-of-week behavior of O3, NOx and VOC for two
decades of data from sites throughout California. They
concluded that the pattern of higher O3 on weekends has
become more widespread between 1980 and 1999 but the
pattern for precursors remained fairly constant over the
same time period. This study reported that NOx is
significantly lower on weekends at 85 out of 93 sites.
Blanchard and Tanenbaum (2003) found that in the
South Coast Air Basin of California, the mean Sunday
NOx and non-methane hydrocarbon concentrations
were 25–41% and 16–30% lower, respectively, than on
weekdays. Qin et al. (2004b) indicated that concentra-
tions of NOx, CO, NMOC and PM10 and the light
scatter in at weekend were about 37%, 18%, 15%, 14%
lower than those of weekdays.
NOx timing: Traffic studies (Chinkin et al., 2003;
Fujita et al., 2003b) indicate that NOx emissions on
weekends are substantially lower than on weekdays for
several hours following sunrise. However, the traffic
near midday is similar on weekdays and weekends. The
NOx timing hypothesis is that the timing of NOx emitted
on weekends causes the midday emissions to produce O3
more efficiently compared with the NOx emitted on
weekdays. Marr and Harley (2002b) indicated that NOx
emissions from heavy-duty truck activity reduced during
all hours on weekend days and that car and light-truck
activity is shifted in time because of the greatly reduced
morning commute on weekend days. Yarwood et al.
(2003) found out that the mass reduction effect was
much larger than the timing effect and concluded that
weekend ozone is relatively insensitive to changes in the
timing of motor vehicle emissions.
Carryover near the ground and carryover aloft:
Increased VOC and NOx emissions from traffic on
weekends nights may carry over near ground level and
lead to greater O3 formation after sunrise on the
following day. Fujita et al. (2003a) concurred that
pollutant carryover near the ground is at most a small
factor because differences in precursor concentrations
during the carryover period have only a small effect on
precursor concentrations and ratios during the O3
accumulation period. In addition, the reservoir of
pollutants that carries over above the nocturnal
boundary layer may exert a greater influence on surface
O3 concentrations on weekends than on weekdays. The
hypothesis suggests that morning concentrations of NOx
titrate O3 and quench radicals (Heuss et al., 2003).
Increased weekend emissions: Higher weekends O3
levels may be caused by increased emissions from
activities that occur more often on weekends that on
weekdays, such as recreational and maintenance activ-
ities. CARB (2003) has concluded that, in the case of
California, the increased weekend emissions hypothesis
is not plausible because air quality data from the
extensive monitoring network show that ambient levels
of precursors are lower on weekends compared with
weekdays for all daylight hours.
Increased sunlight caused by decreased soot emissions:
Because soot absorbs UV sunlight and prevents it from
initiating O3 formation, the lower levels of soot on
weekends results in increased UV sunlight and hence O3
formation by influencing meteorological variables.
While the soot and sunlight hypothesis is plausible as
a factor that would increase O3 on weekends, Blier and
Winer (1999) indicated that measured solar radiation is
not significantly higher on weekends than on weekdays.
In addition to these hypotheses, two recent studies
suggest some additional chemistry may need to be added
to the existing mechanisms in order to explain a possible
weekend effect. Tanaka et al. (2003) suggest the
possibility that chlorine (Cl) chemistry plays a role in
areas with Cl sources. The other study (Knipping and
Dabdub, 2002) is a proximate modeling exercise that
suggests surface-mediated renoxification may play a
role. In neither case, however, does there appear to be a
weekday/weekend difference that would explain the
variations in weekend effect.
Emission inventories for each day of week are needed
to help determine the causes of the ozone weekend
effect. These inventories must reveal in sufficient detail
the quantity, the timing, and the location of VOC and
NOx emissions for weekdays and weekends (CARB,
2003). In this work, a day-specific hourly emissions
inventory is used for stationary, area and on-road
sources in order to help assessing the ozone weekend
effect for the photochemical pollution episode of 13–16
August 2000, observed in a very complex terrain as the
Northeastern Iberian Peninsula. In this area, ambient O3
data indicates concentrations up to 189mgm�3 on
weekends and 177mgm�3 during weekdays, exceeding
the European Information Threshold of 180mgm�3. The
hypothesis of changing mass and timing of emissions,
ozone quenching and carryover are analyzed, discarding
the hypothesis that have been proved not to have
importance on weekend effect, such as increased
ARTICLE IN PRESSP. Jimenez et al. / Atmospheric Environment 39 (2005) 429–444 431
emissions or increased sunlight on weekends. An
evaluation of the performance of the model is also
considered, comparing results with air quality stations
data and analyzing the up-to-date hypothesis about the
ozone weekend effect.
2. Methods
2.1. Modeling case
Modeling was conducted for the photochemical
pollution event in the Western Mediterranean Basin
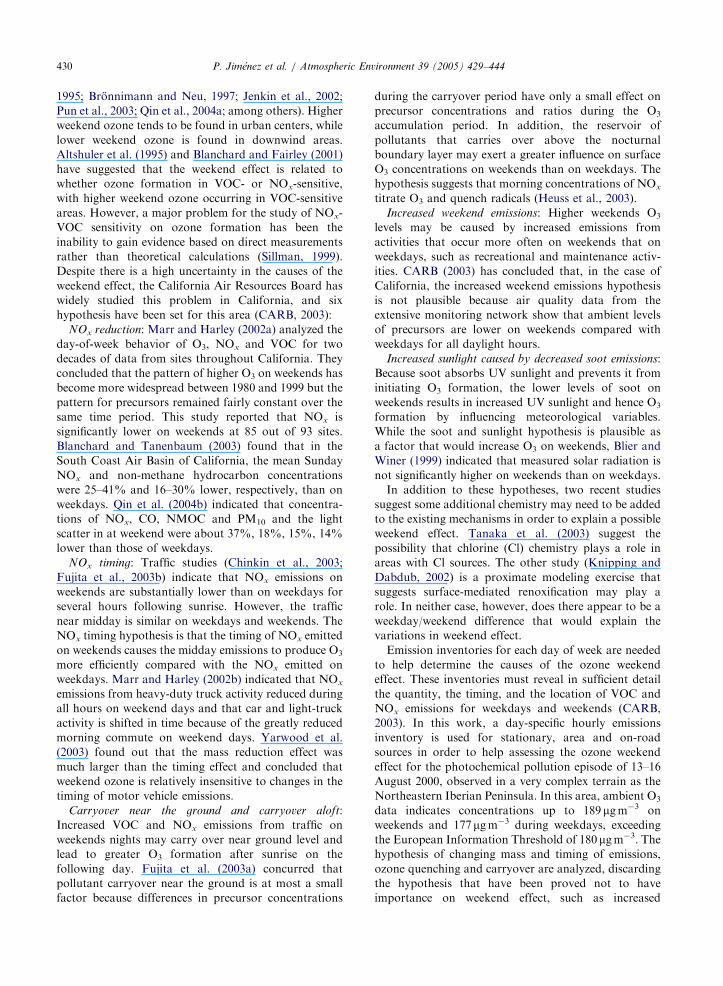
Fig. 1. Geography of the areas where main O3 problems in the North
Area (urban, upwind), Plana de Vic (downwind) and Tarragona (upw
highways.
from that took place on 13–16 August 2000, after a 48-h
spin-up in order to minimize the influence of initial
conditions. Two non-labor days (13 and 15 August) and
two working days (14 and 16 August) are considered in
order to evaluate the O3 weekend effect in the North-
eastern Iberian Peninsula. Values over the European
threshold of 90 ppb (180 mgm�3) for ground-level O3 are
attained. The domain of study (Fig. 1) covers a squared
area of 272� 272 km2 centered in Catalonia, located
in the Northeastern Iberian Peninsula. The complex
configuration of the zone comes conditioned by the
presence of the Pyrenees mountain range (with altitudes
over 3000m), the influence of the Mediterranean Sea
eastern Iberian Peninsula are located: Barcelona Geographical
ind, industrial); and main important on-road traffic roads and
ARTICLE IN PRESSP. Jimenez et al. / Atmospheric Environment 39 (2005) 429–444432
and the large valley canalization of Ebro River. That
produces a sharp gradient in the characteristics of the
Northeastern Iberian Peninsula. The very complex
orography of the area difficult the application both
meteorological, emission and chemical transport mod-
els; and it induces an extremely complicated structure
of the flow because of the development of a- and b-mesoscale phenomena that interact with synoptic flows.
The characteristics of the breezes have important effects
in the dispersion of pollutants emitted. In addition, the
flow can be even more complex because of the non-
homogeneity of the terrain, the land-use and the types
of vegetation. In these situations, the structure of the
flow is extremely complicated because of the super-
position of circulations of different scale, and forces to
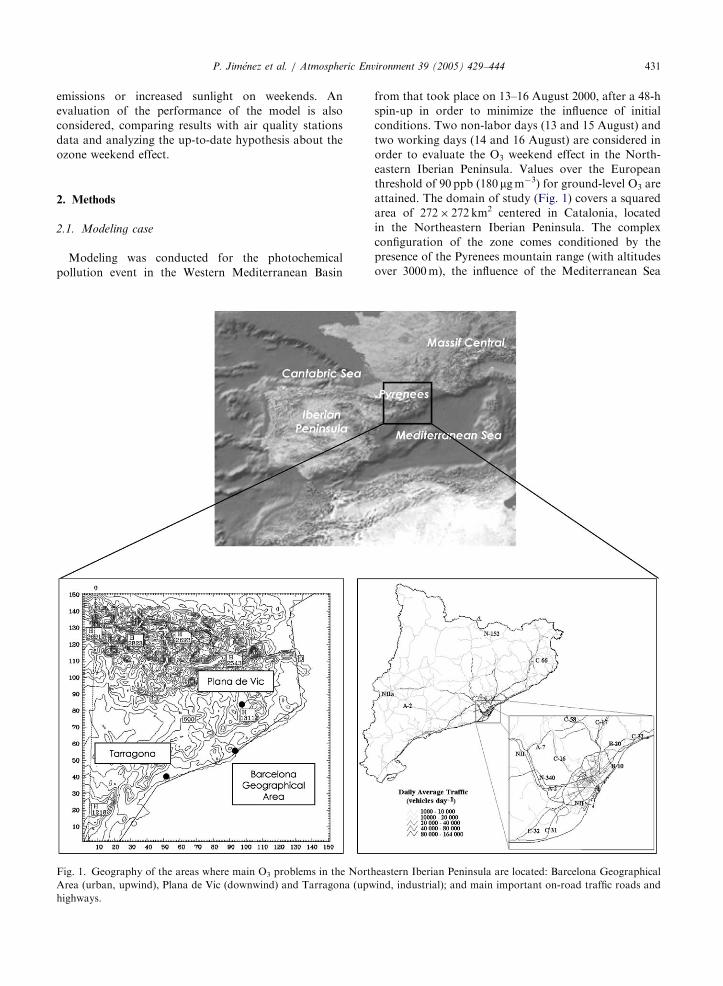
Fig. 2. Synoptic situation of 13 August–16 August 2000 (shaded ma
analysis).
the application of multiscale-nested models with very
high horizontal and vertical resolution.
The weekend effects results reported here correspond
to the episode of 13–16 August 2000, which corresponds
to a typical summertime low pressure gradient with high
levels of photochemical pollutants over the Iberian
Peninsula. This situation is related to a decrease in air
quality. The day was characterized by a weak synoptic
forcing (Fig. 2), so that mesoscale phenomena, induced
by the particular geography of the region would be
dominant. This situation is associated with weak winds
in the lower troposphere and high maximum tempera-
tures. A high sea level pressure and almost non-existent
surface pressure gradients over the domain chara-
cterize this day, with slow northwesterlies aloft.
p: 0000UTC 500 hPa analysis, contour map: 0000UTC surface
ARTICLE IN PRESSP. Jimenez et al. / Atmospheric Environment 39 (2005) 429–444 433
The meteorological situation of the episode (low
pressure gradient with a weak anticyclone over the
Mediterranean) strongly limits air mass inflows in the
area. Under this weak synoptic forcing, strong insola-
tion promotes the development of prevailing mesoscale
flows associated with the local orography (mountain and
valley breezes), while the difference of temperature
between the sea and the land enhances the development
of sea-land breezes (Barros et al., 2003). Meteorological
conditions are indeed very similar for the 4 days covered
in this episode, both on the synoptic and the meso- and
local scale. The situation presented in this study is
representative of an episode of photochemical pollution
in the Western Mediterranean Basin, since the occur-
rence of regional re-circulations at low levels represents
45% of the yearly flow transport patterns over the area
of study, and over 70% of summer transport patterns
(Jorba et al., 2004) and these situations are associated
with local-regional episodes of air pollution in the
Northeastern Iberian Peninsula that result in high levels
of ozone and an increase of particulate matter within the
boundary layer during summer.
Millan et al. (1997) generally described the re-
circulations processes occurring along the Western
Mediterranean Basin under similar synoptic situations
to those observed in this episode. During the day the sea
breezes transport coastal pollutants inland, while at the
leading edge of the breeze front, breezes combine with
upslope winds to inject a fraction of these pollutants in
their return flows aloft at heights ranging from 2 to
3 km. Once in those upper layers, pollutants move back
toward the sea (Baldasano et al., 1994), the air at the
middle troposphere is forced to go down by the
subsidence over the east coast, once in low levels the
air masses re-circulate over the sea with a possible later
return to the seaboard. Perez et al. (2004) confirmed this
behavior when analyzing the characteristic re-circula-
tions produced along the east coast of the Iberian
Peninsula for 14 August 2000.
The main emissions sources in the Northeastern
Iberian Peninsula are located on the coast, being the
most important emitting source the Barcelona Geogra-
phical Area. The peculiar topography of the zone is the
principal driving mechanism that contributes to the
dispersion of pollutants in the given domain. Maximum
O3 levels in Catalonia are measured downwind Barce-
lona and Alcover, downwind the industrial zone of
Tarragona.
2.2. Models
MM5 numerical weather prediction model (MMMD/
NCAR, 2001) provided the meteorology dynamical
parameters. MM5 physical options used for the simula-
tions were: Mellor-Yamada scheme as used in the Eta
model for the PBL parameterization; Anthes-Kuo and
Kain-Fritsch cumulus scheme; Dudhia simple ice
moisture scheme; the cloud-radiation scheme; and the
five-layer soil model. Initialization and boundary con-
ditions for the mesoscale model were introduced with
analysis data of the European Center of Medium-range
Weather Forecasts global model (ECMWF). Data were
available at a 1-degree resolution (100-km approxi-
mately at the working latitude) at the standard pressure
levels every 6 h.
The high resolution (1-h and 1 km2) EMICAT2000
emission model has been applied in the Northeastern
Iberian Peninsula. This emission model includes the
emissions from vegetation, on-road traffic, industries
and emissions by fossil fuel consumption and domestic-
commercial solvent use. Biogenic emissions were esti-
mated using a methodology that takes into account local
vegetation data (land-use distribution and biomass
factors) and meteorological conditions (surface air
temperature and solar radiation) together with emission
factors for native Mediterranean species and cultures
(Parra et al., 2004). On-road traffic emission includes the
hot exhaust, cold exhaust and evaporative emissions
using the methodology and emission factors of the
European model EMEP/CORINAIR–COPERTIII
(Ntziachristos and Samaras, 2000) as basis, and
differencing the vehicle park composition between
weekdays and weekends (Parra and Baldasano, 2004).
Industrial emissions include real records of some
chimneys connected to the emission control net of the
Environmental Department of the Catalonia Govern-
ment (Spain), and the estimated emissions from power
stations (conventional and cogeneration units), cement
factories, refineries, olefins plants, chemical industries
and incinerators.
The chemical transport model used to compute the
concentrations of photochemical pollutants was Mod-
els-3/CMAQ (Byun and Ching, 1999). The initial and
boundary conditions were derived from a one-way
nested simulation covering a domain of
1392� 1104 km2 centered in the Iberian Peninsula,
which used EMEP emissions corresponding to year
2000. However, as commented before, the limitation in
air mass inflows in the domain due to the meteorological
conditions of the episode minimizes the influence of
boundary conditions on ozone maximum concentra-
tions. The impact of modifying boundary ozone or
precursors on a 50% in ground-level ozone keeps under
a factor of 0.2 during the whole period of simulations for
most sites in the Northeastern Iberian Peninsula, since
boundaries of the domain selected are far enough from
relevant sites not to have a significant influence. A 48-h
spin-up was performed in order to minimize the effects
of initial conditions (Berge et al., 2001). The chemical
mechanism selected for simulations was CBM-IV (Gery
et al., 1989), including aerosols and heterogeneous
chemistry. NOx and VOC specification of EMICAT2000
ARTICLE IN PRESSP. Jimenez et al. / Atmospheric Environment 39 (2005) 429–444434
emissions, as required by CBM-IV, could be found in
Parra (2004). The algorithm chosen for the resolution of
tropospheric chemistry was the Modified Euler Back-
ward Iterative (MEBI) method (Huang and Chang,
2001). Horizontal resolution considered was 2 km, and
16-sigma vertical layers cover the troposphere.
2.3. Air quality data
Air quality stations hourly data averaged over the
domain of study were used in order to report weekend/
weekday differences. Hourly measures of ground-level
O3, NOx and CO was provided by 48 air quality surface
stations in Northeastern Spain which belong to the
Environmental Department of the Catalonia Govern-
ment (Spain). CO was used as a surrogate for VOC
because of the unavailability of VOCs measurements in
the area (Yarwood et al., 2003).
Those data were also utilized to indicate the
performance of models results. Despite a surface
measurement represents a value only at a given
horizontal location and height, while the concentration
predicted by the model represents a volume-averaged
value, ground-level O3 results were statistically evalu-
ated by comparing the first-layer simulations results and
the values measured in the air quality stations of the
domain under study. The analysis of the results will
consist in a statistical comparison of both discrete and
categorical parameters. The European Directive 2002/3/
EC relating to ozone in ambient air establishes an
uncertainty of 50% as the quality objective for modeling
assessment methods. This uncertainty is defined as the
maximum error of the measured and calculated con-
centration levels. In addition, the US Environmental
Protection Agency has developed guidelines (US EPA,
1991) for a minimum set of statistical measures to be
used for these evaluations where monitoring data are
Table 1
Statistical measures of model performance for 1-h O3 during the epis
EPA goal 13 August 2000
Discrete evaluation
Observed peak (mgm�3) 157
Modeled peak (mgm�3) 189
UPA (%) o720 14.4
MNBE (%) o715 �2.1
MNGE (%) o35 16.8
Categorical evaluation
A (%) 91.1
B (%) 0.7
POD (%) 22.1
CSI (%) 15.0
FAR (%) 67.9
sufficiently dense. Those statistical figures, considered in
this work, are the mean normalized bias error (MNBE),
the mean normalized gross error for concentrations
above a prescribed threshold (MNGE), and the un-
paired peak prediction accuracy (UPA). Categorical
statistics, as derived from Kang et al. (2003), have also
been used to evaluate the different vertical and
horizontal resolution, including parameters as the
model accuracy (A), bias (B), probability of detection
(POD), critical success index (CSI) and false alarm rates
(FAR). These criteria based also upon a 120mgm�3
threshold.
3. Results and discussion
3.1. Model evaluation
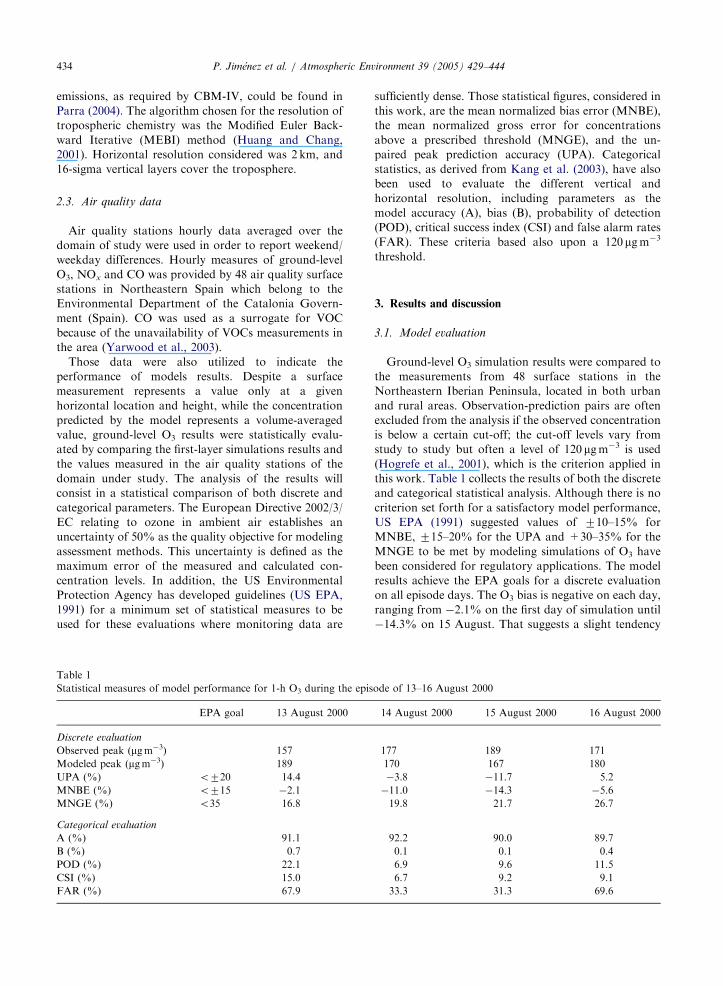
Ground-level O3 simulation results were compared to
the measurements from 48 surface stations in the
Northeastern Iberian Peninsula, located in both urban
and rural areas. Observation-prediction pairs are often
excluded from the analysis if the observed concentration
is below a certain cut-off; the cut-off levels vary from
study to study but often a level of 120 mgm�3 is used
(Hogrefe et al., 2001), which is the criterion applied in
this work. Table 1 collects the results of both the discrete
and categorical statistical analysis. Although there is no
criterion set forth for a satisfactory model performance,
US EPA (1991) suggested values of 710–15% for
MNBE, 715–20% for the UPA and +30–35% for the
MNGE to be met by modeling simulations of O3 have
been considered for regulatory applications. The model
results achieve the EPA goals for a discrete evaluation
on all episode days. The O3 bias is negative on each day,
ranging from �2.1% on the first day of simulation until
�14.3% on 15 August. That suggests a slight tendency
ode of 13–16 August 2000
14 August 2000 15 August 2000 16 August 2000
177 189 171
170 167 180
�3.8 �11.7 5.2
�11.0 �14.3 �5.6
19.8 21.7 26.7
92.2 90.0 89.7
0.1 0.1 0.4
6.9 9.6 11.5
6.7 9.2 9.1
33.3 31.3 69.6
ARTICLE IN PRESS
0
1
2
3
4
5
6
7
8
9
10
11
12
Hou
rly T
raffi
c C
oeffc
ient
(%
)H
ourly
Tra
ffic
Coe
ffcie
nt (
%)
A-7/N-152/N-IIa WDA-7/N-152/N-IIa WEA-2/B-20/B-10 WDA-2/B-20/B-10 WEC-17/C-32/C-66 WDC-17/C-32/C-66 WE
0
1
2
3
4
5
6
7
8
0:00 6:00 12:00 18:00
Time (UTC)
0:00 6:00 12:00 18:00
Time (UTC)
Typical urban street WDTypical urban street WEDiagonal Av. WDDiagonal Av. WEBalmes St. WDBalmes St. WE
(a)
(b)
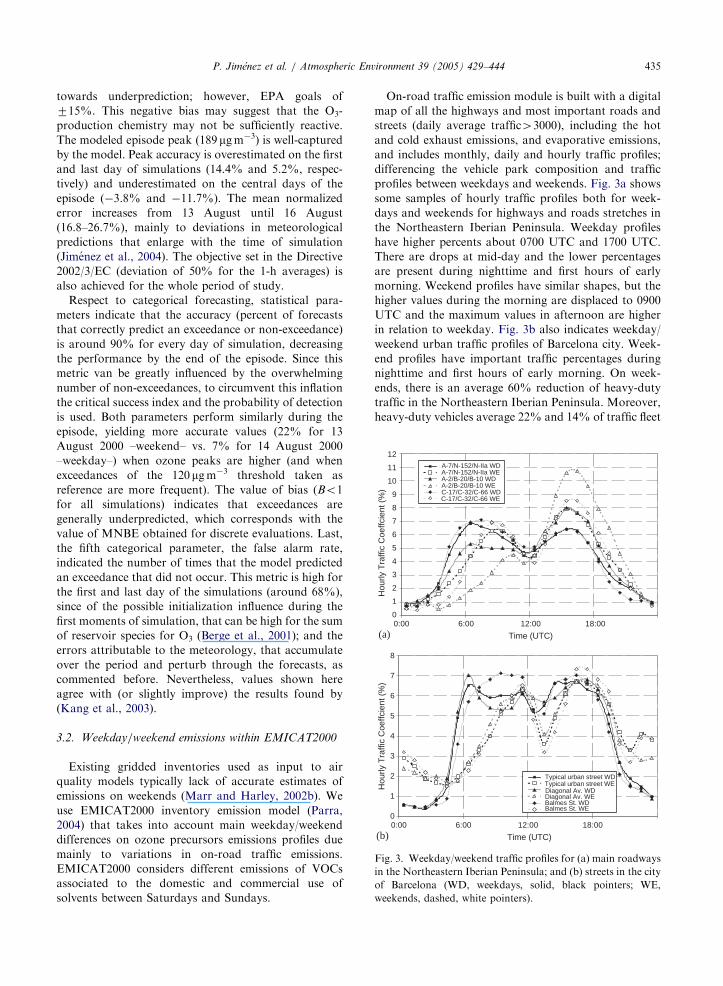
Fig. 3. Weekday/weekend traffic profiles for (a) main roadways
in the Northeastern Iberian Peninsula; and (b) streets in the city
of Barcelona (WD, weekdays, solid, black pointers; WE,
weekends, dashed, white pointers).
P. Jimenez et al. / Atmospheric Environment 39 (2005) 429–444 435
towards underprediction; however, EPA goals of
715%. This negative bias may suggest that the O3-
production chemistry may not be sufficiently reactive.
The modeled episode peak (189mgm�3) is well-captured
by the model. Peak accuracy is overestimated on the first
and last day of simulations (14.4% and 5.2%, respec-
tively) and underestimated on the central days of the
episode (�3.8% and �11.7%). The mean normalized
error increases from 13 August until 16 August
(16.8–26.7%), mainly to deviations in meteorological
predictions that enlarge with the time of simulation
(Jimenez et al., 2004). The objective set in the Directive
2002/3/EC (deviation of 50% for the 1-h averages) is
also achieved for the whole period of study.
Respect to categorical forecasting, statistical para-
meters indicate that the accuracy (percent of forecasts
that correctly predict an exceedance or non-exceedance)
is around 90% for every day of simulation, decreasing
the performance by the end of the episode. Since this
metric van be greatly influenced by the overwhelming
number of non-exceedances, to circumvent this inflation
the critical success index and the probability of detection
is used. Both parameters perform similarly during the
episode, yielding more accurate values (22% for 13
August 2000 –weekend– vs. 7% for 14 August 2000
–weekday–) when ozone peaks are higher (and when
exceedances of the 120mgm�3 threshold taken as
reference are more frequent). The value of bias (Bo1
for all simulations) indicates that exceedances are
generally underpredicted, which corresponds with the
value of MNBE obtained for discrete evaluations. Last,
the fifth categorical parameter, the false alarm rate,
indicated the number of times that the model predicted
an exceedance that did not occur. This metric is high for
the first and last day of the simulations (around 68%),
since of the possible initialization influence during the
first moments of simulation, that can be high for the sum
of reservoir species for O3 (Berge et al., 2001); and the
errors attributable to the meteorology, that accumulate
over the period and perturb through the forecasts, as
commented before. Nevertheless, values shown here
agree with (or slightly improve) the results found by
(Kang et al., 2003).
3.2. Weekday/weekend emissions within EMICAT2000
Existing gridded inventories used as input to air
quality models typically lack of accurate estimates of
emissions on weekends (Marr and Harley, 2002b). We
use EMICAT2000 inventory emission model (Parra,
2004) that takes into account main weekday/weekend
differences on ozone precursors emissions profiles due
mainly to variations in on-road traffic emissions.
EMICAT2000 considers different emissions of VOCs
associated to the domestic and commercial use of
solvents between Saturdays and Sundays.
On-road traffic emission module is built with a digital
map of all the highways and most important roads and
streets (daily average traffic43000), including the hot
and cold exhaust emissions, and evaporative emissions,
and includes monthly, daily and hourly traffic profiles;
differencing the vehicle park composition and traffic
profiles between weekdays and weekends. Fig. 3a shows
some samples of hourly traffic profiles both for week-
days and weekends for highways and roads stretches in
the Northeastern Iberian Peninsula. Weekday profiles
have higher percents about 0700 UTC and 1700 UTC.
There are drops at mid-day and the lower percentages
are present during nighttime and first hours of early
morning. Weekend profiles have similar shapes, but the
higher values during the morning are displaced to 0900
UTC and the maximum values in afternoon are higher
in relation to weekday. Fig. 3b also indicates weekday/
weekend urban traffic profiles of Barcelona city. Week-
end profiles have important traffic percentages during
nighttime and first hours of early morning. On week-
ends, there is an average 60% reduction of heavy-duty
traffic in the Northeastern Iberian Peninsula. Moreover,
heavy-duty vehicles average 22% and 14% of traffic fleet
ARTICLE IN PRESSP. Jimenez et al. / Atmospheric Environment 39 (2005) 429–444436
on highways and roads, respectively. EMICAT2000 uses
this and other information related with mileage distance
traveled into the two vehicle park composition each
one defined for weekday and weekend. The different
behavior of gasoline and diesel-vehicles traffic is
important in order to understand the contribution of
fleet and mileage driven on ozone precursors emission.
NOx were emitted mainly by heavy-duty diesel vehicles
(37%), gasoline passenger cars without catalyst (30%)
and heavy-duty gasoline cars (20%). Therefore, the 60%
reduction of heavy-duty vehicles on weekends has an
important impact on NOx levels. VOCs were emitted
mainly by gasoline passenger cars without catalyst
(38%), motorcycles (30%) and heavy-duty gasoline cars
(14%), and therefore diesel vehicles are not important
contributors to VOCs emissions and their reductions are
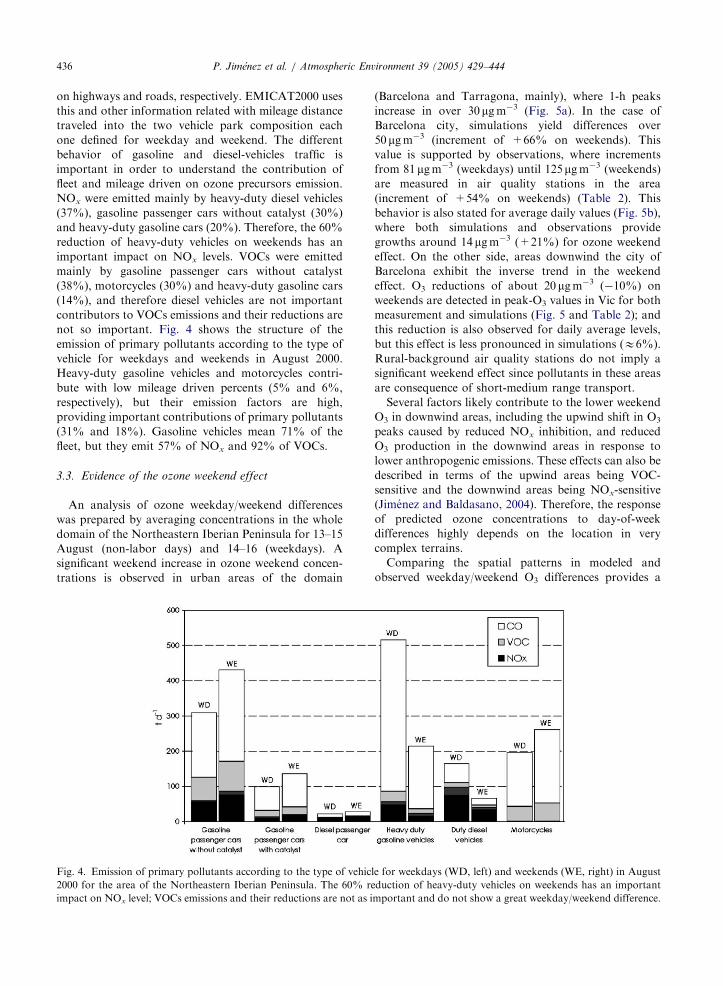
not so important. Fig. 4 shows the structure of the
emission of primary pollutants according to the type of
vehicle for weekdays and weekends in August 2000.
Heavy-duty gasoline vehicles and motorcycles contri-
bute with low mileage driven percents (5% and 6%,
respectively), but their emission factors are high,
providing important contributions of primary pollutants
(31% and 18%). Gasoline vehicles mean 71% of the
fleet, but they emit 57% of NOx and 92% of VOCs.
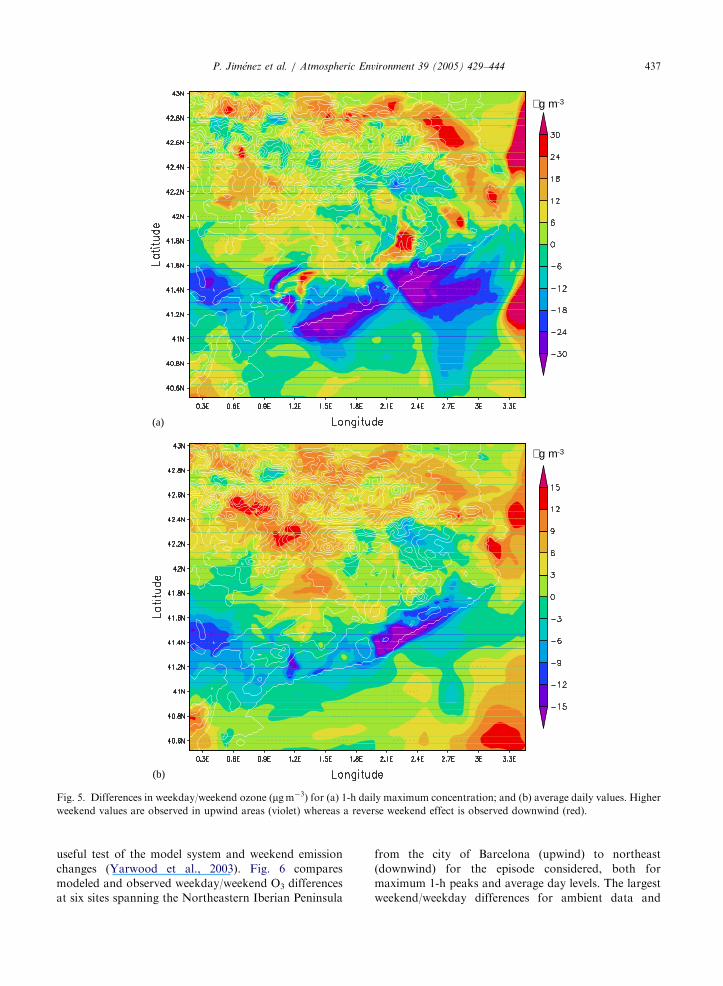
3.3. Evidence of the ozone weekend effect
An analysis of ozone weekday/weekend differences
was prepared by averaging concentrations in the whole
domain of the Northeastern Iberian Peninsula for 13–15
August (non-labor days) and 14–16 (weekdays). A
significant weekend increase in ozone weekend concen-
trations is observed in urban areas of the domain
Fig. 4. Emission of primary pollutants according to the type of vehic
2000 for the area of the Northeastern Iberian Peninsula. The 60% re
impact on NOx level; VOCs emissions and their reductions are not as i
(Barcelona and Tarragona, mainly), where 1-h peaks
increase in over 30mgm�3 (Fig. 5a). In the case of
Barcelona city, simulations yield differences over
50mgm�3 (increment of +66% on weekends). This
value is supported by observations, where increments
from 81 mgm�3 (weekdays) until 125mgm�3 (weekends)
are measured in air quality stations in the area
(increment of +54% on weekends) (Table 2). This
behavior is also stated for average daily values (Fig. 5b),
where both simulations and observations provide
growths around 14 mgm�3 (+21%) for ozone weekend
effect. On the other side, areas downwind the city of
Barcelona exhibit the inverse trend in the weekend
effect. O3 reductions of about 20mgm�3 (�10%) on
weekends are detected in peak-O3 values in Vic for both
measurement and simulations (Fig. 5 and Table 2); and
this reduction is also observed for daily average levels,
but this effect is less pronounced in simulations (E6%).
Rural-background air quality stations do not imply a
significant weekend effect since pollutants in these areas
are consequence of short-medium range transport.
Several factors likely contribute to the lower weekend
O3 in downwind areas, including the upwind shift in O3
peaks caused by reduced NOx inhibition, and reduced
O3 production in the downwind areas in response to
lower anthropogenic emissions. These effects can also be
described in terms of the upwind areas being VOC-
sensitive and the downwind areas being NOx-sensitive
(Jimenez and Baldasano, 2004). Therefore, the response
of predicted ozone concentrations to day-of-week
differences highly depends on the location in very
complex terrains.
Comparing the spatial patterns in modeled and
observed weekday/weekend O3 differences provides a
le for weekdays (WD, left) and weekends (WE, right) in August
duction of heavy-duty vehicles on weekends has an important
mportant and do not show a great weekday/weekend difference.
ARTICLE IN PRESS
µg m-3
µg m-3
(a)
(b)
Fig. 5. Differences in weekday/weekend ozone (mgm�3) for (a) 1-h daily maximum concentration; and (b) average daily values. Higher
weekend values are observed in upwind areas (violet) whereas a reverse weekend effect is observed downwind (red).
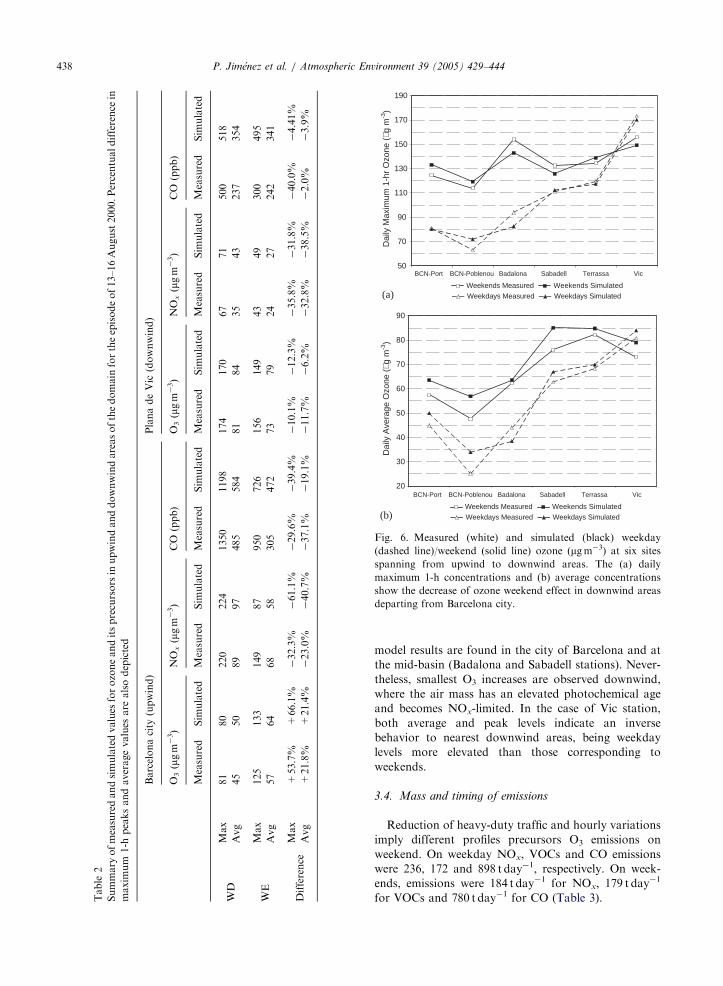
P. Jimenez et al. / Atmospheric Environment 39 (2005) 429–444 437
useful test of the model system and weekend emission
changes (Yarwood et al., 2003). Fig. 6 compares
modeled and observed weekday/weekend O3 differences
at six sites spanning the Northeastern Iberian Peninsula
from the city of Barcelona (upwind) to northeast
(downwind) for the episode considered, both for
maximum 1-h peaks and average day levels. The largest
weekend/weekday differences for ambient data and
ARTICLE IN PRESS
Table
2
Summary
ofmeasuredandsimulatedvalues
forozoneanditsprecursors
inupwindanddownwindareasofthedomain
fortheepisodeof13–16August2000.Percentualdifference
in
maxim
um
1-h
peaksandaveragevalues
are
alsodepicted
Barcelonacity
(upwind)
PlanadeVic
(downwind)
O3(mgm
�3)
NO
x(mgm
�3)
CO
(ppb)
O3(mgm
�3)
NO
x(mgm
�3)
CO
(ppb)
Measured
Sim
ulated
Measured
Sim
ulated
Measured
Sim
ulated
Measured
Sim
ulated
Measured
Sim
ulated
Measured
Sim
ulated
WD
Max
81
80
220
224
1350
1198
174
170
67
71
500
518
Avg
45
50
89
97
485
584
81
84
35
43
237
354
WE
Max
125
133
149
87
950
726
156
149
43
49
300
495
Avg
57
64
68
58
305
472
73
79
24
27
242
341
Difference
Max
+53.7%
+66.1%
�32.3%
�61.1%
�29.6%
�39.4%
�10.1%
�12.3%
�35.8%
�31.8%
�40.0%
�4.41%
Avg
+21.8%
+21.4%
�23.0%
�40.7%
�37.1%
�19.1%
�11.7%
�6.2%
�32.8%
�38.5%
�2.0%
�3.9%
50
70
90
110
130
150
170
190
Dai
ly M
axim
um 1
-hr
Ozo
ne (
µg m
-3)
20
30
40
50
60
70
80
90
BCN-Port BCN-Poblenou Badalona Sabadell Terrassa Vic
Dai
ly A
vera
ge O
zone
(µg
m-3
)
Weekends Measured Weekends Simulated
Weekdays Measured Weekdays Simulated
BCN-Port BCN-Poblenou Badalona Sabadell Terrassa Vic
Weekends Measured Weekends Simulated
Weekdays Measured Weekdays Simulated(a)
(b)
Fig. 6. Measured (white) and simulated (black) weekday
(dashed line)/weekend (solid line) ozone (mgm�3) at six sites
spanning from upwind to downwind areas. The (a) daily
maximum 1-h concentrations and (b) average concentrations
show the decrease of ozone weekend effect in downwind areas
departing from Barcelona city.
P. Jimenez et al. / Atmospheric Environment 39 (2005) 429–444438
model results are found in the city of Barcelona and at
the mid-basin (Badalona and Sabadell stations). Never-
theless, smallest O3 increases are observed downwind,
where the air mass has an elevated photochemical age
and becomes NOx-limited. In the case of Vic station,
both average and peak levels indicate an inverse
behavior to nearest downwind areas, being weekday
levels more elevated than those corresponding to
weekends.
3.4. Mass and timing of emissions
Reduction of heavy-duty traffic and hourly variations
imply different profiles precursors O3 emissions on
weekend. On weekday NOx, VOCs and CO emissions
were 236, 172 and 898 t day�1, respectively. On week-
ends, emissions were 184 t day�1 for NOx, 179 t day�1
for VOCs and 780 t day�1 for CO (Table 3).
ARTICLE IN PRESS
Table 3
Total emissions of ozone precursors for weekdays and week-
ends in the Northeastern Iberian Peninsula for August 2000
(t day�1)
Weekday Weekend
NOx VOC CO NOx VOC CO
Vegetation — 341.1 — — 368.1 —
On-road traffic 235.7 171.7 897.6 183.8 179.3 780.3
Industrial activities 105.9 61.8 20.3 104 61.9 20.2
Fossil fuelsa 5.3 0.3 1.7 5.3 0.3 1.7
Solventsa — 48.5 — — 48.5 —
Total 346.9 623.4 919.6 293.1 658.1 802.2
aDue to their use in the residential and commercial sectors.
0
2
4
6
8
10
12
14
16
18
Em
issi
on o
f pre
curs
ors
(t h
-1)
Em
issi
on o
f pre
curs
ors
(t h
-1)
NOx weekdayNOx weekend
0
2
4
6
8
10
12
14
16
18
0:00 6:00 12:00 18:00
Time (UTC)(b)
0:00 6:00 12:00 18:00
Time (UTC)(a)
VOC weekdayVOC weekend
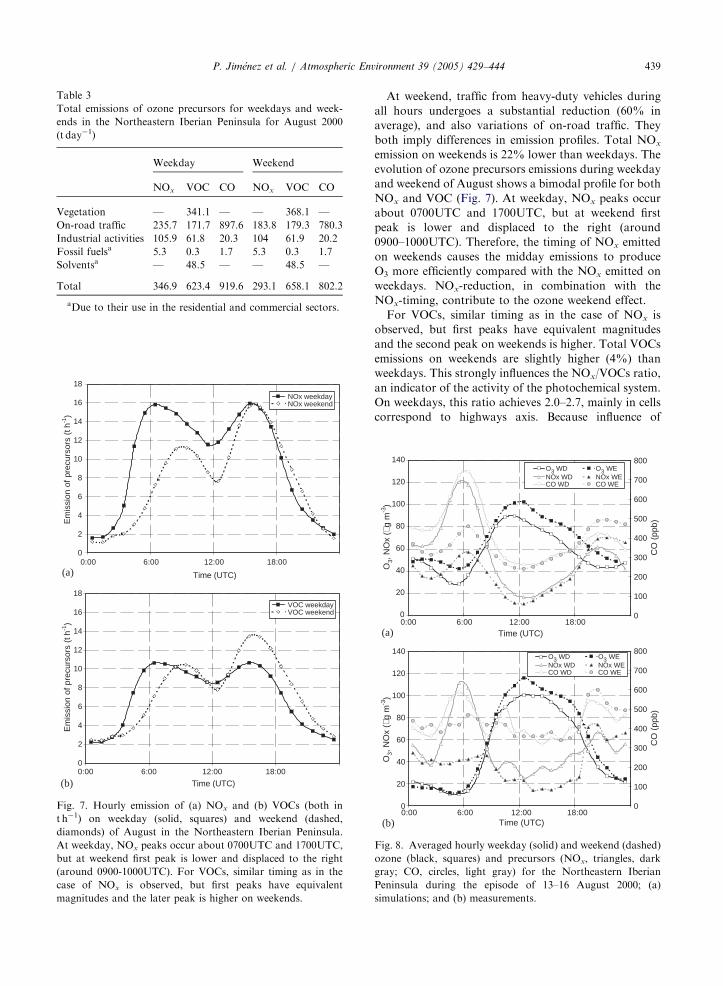
Fig. 7. Hourly emission of (a) NOx and (b) VOCs (both in
t h�1) on weekday (solid, squares) and weekend (dashed,
diamonds) of August in the Northeastern Iberian Peninsula.
At weekday, NOx peaks occur about 0700UTC and 1700UTC,
but at weekend first peak is lower and displaced to the right
(around 0900-1000UTC). For VOCs, similar timing as in the
case of NOx is observed, but first peaks have equivalent
magnitudes and the later peak is higher on weekends.
P. Jimenez et al. / Atmospheric Environment 39 (2005) 429–444 439
At weekend, traffic from heavy-duty vehicles during
all hours undergoes a substantial reduction (60% in
average), and also variations of on-road traffic. They
both imply differences in emission profiles. Total NOx
emission on weekends is 22% lower than weekdays. The
evolution of ozone precursors emissions during weekday
and weekend of August shows a bimodal profile for both
NOx and VOC (Fig. 7). At weekday, NOx peaks occur
about 0700UTC and 1700UTC, but at weekend first
peak is lower and displaced to the right (around
0900–1000UTC). Therefore, the timing of NOx emitted
on weekends causes the midday emissions to produce
O3 more efficiently compared with the NOx emitted on
weekdays. NOx-reduction, in combination with the
NOx-timing, contribute to the ozone weekend effect.
For VOCs, similar timing as in the case of NOx is
observed, but first peaks have equivalent magnitudes
and the second peak on weekends is higher. Total VOCs
emissions on weekends are slightly higher (4%) than
weekdays. This strongly influences the NOx/VOCs ratio,
an indicator of the activity of the photochemical system.
On weekdays, this ratio achieves 2.0–2.7, mainly in cells
correspond to highways axis. Because influence of
0
20
40
60
80
100
120
140
O3,
NO
x (µ
g m
-3)
O3,
NO
x (µ
g m
-3)
0
20
40
60
80
100
120
140
0
100
200
300
400
500
600
700
800
CO
(pp
b)
0
100
200
300
400
500
600
700
800C
O (
ppb)
O3 WD O3 WENOx WD NOx WECO WD CO WE
0:00 6:00 12:00 18:00Time (UTC)
0:00 6:00 12:00 18:00
Time (UTC)
O3 WD O3 WENOx WD NOx WECO WD CO WE
(a)
(b)
Fig. 8. Averaged hourly weekday (solid) and weekend (dashed)
ozone (black, squares) and precursors (NOx, triangles, dark
gray; CO, circles, light gray) for the Northeastern Iberian
Peninsula during the episode of 13–16 August 2000; (a)
simulations; and (b) measurements.
ARTICLE IN PRESSP. Jimenez et al. / Atmospheric Environment 39 (2005) 429–444440
circulation speed considered (108 kmh�1) in EMI-
CAT2000 model, high NOx and low VOCs emissions
are yielded. In addition, heavy-duty vehicle circulation
in highways is higher on weekends, and therefore, higher
NOx emissions. In urban cells, NOx/VOCs relation is
lower. On weekends, lower NOx emissions provide
values for the considered ratio under 1.0. Values of
0
20
40
60
80
100
120
140
160
180
13-8-000:00
13-8-0012:00
14-8-000:00
14-8-0012:00
15-8-000:00
15-8-0012:00
16-8-000:00
16-8-0012:00
Ozo
ne (
µg m
-3)
Observed Modeled
13-8-000:00
13-8-0012:00
14-8-000:00
14-8-0012:00
15-8-000:00
15-8-0012:00
16-8-000:00
16-8-0012:00
Observed Modeled
13-8-000:00
13-8-0012:00
14-8-000:00
14-8-0012:00
15-8-000:00
15-8-0012:00
16-8-000:00
16-8-0012:00
Observed Modeled
0
25
50
75
100
125
150
175
200
225
NO
x (µ
g m
-3)
0
200
400
600
800
1000
1200
CO
(pp
b)
(c)
(b)
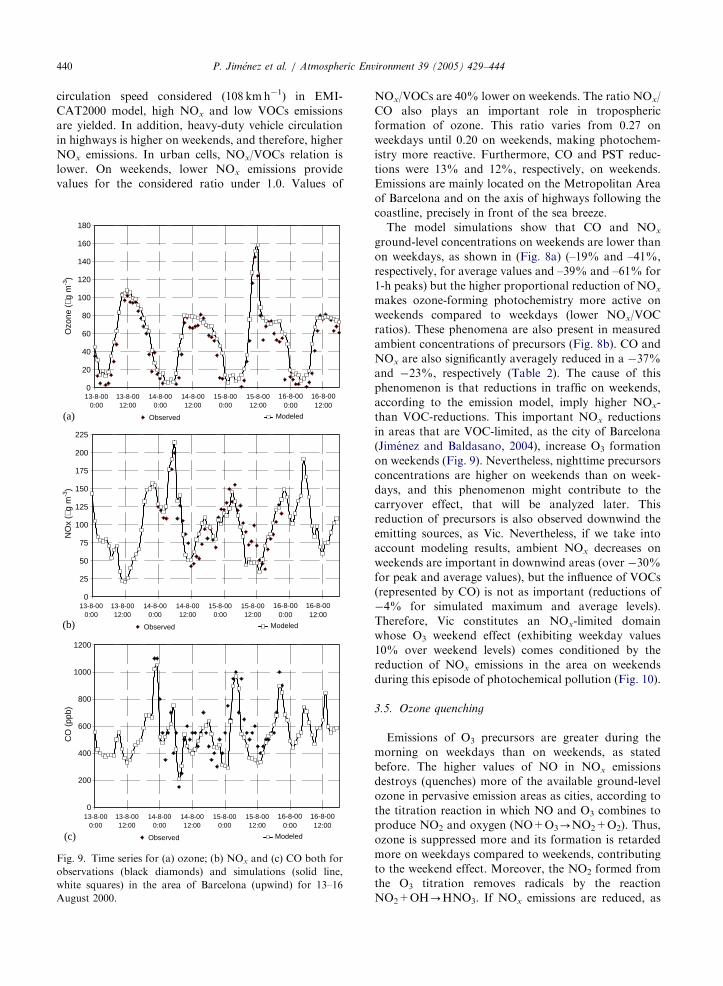
(a)
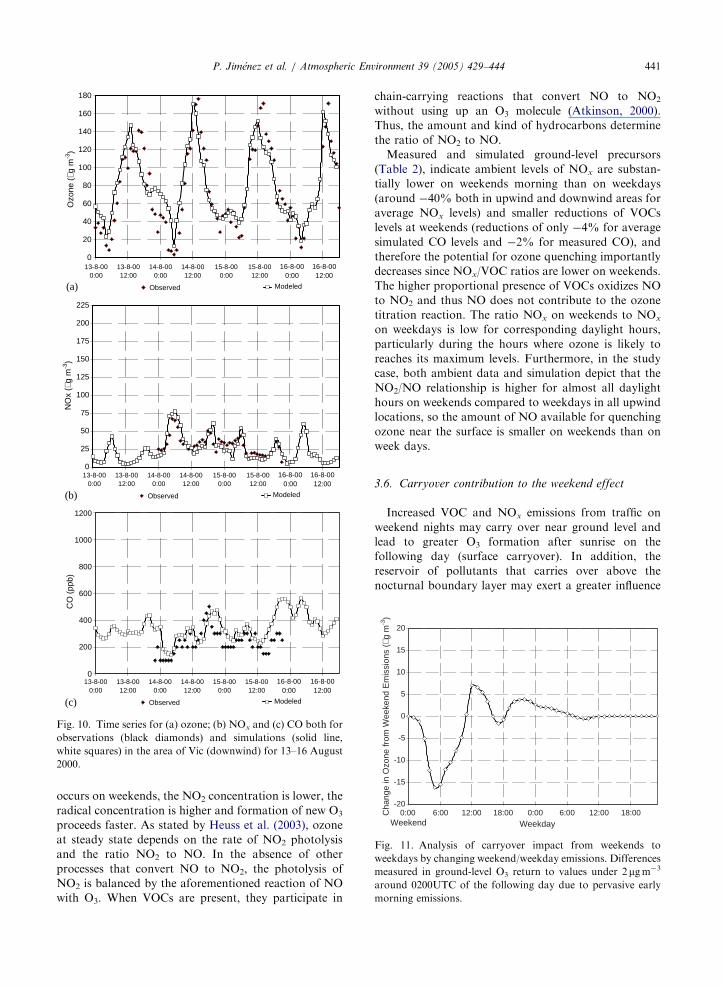
Fig. 9. Time series for (a) ozone; (b) NOx and (c) CO both for
observations (black diamonds) and simulations (solid line,
white squares) in the area of Barcelona (upwind) for 13–16
August 2000.
NOx/VOCs are 40% lower on weekends. The ratio NOx/
CO also plays an important role in tropospheric
formation of ozone. This ratio varies from 0.27 on
weekdays until 0.20 on weekends, making photochem-
istry more reactive. Furthermore, CO and PST reduc-
tions were 13% and 12%, respectively, on weekends.
Emissions are mainly located on the Metropolitan Area
of Barcelona and on the axis of highways following the
coastline, precisely in front of the sea breeze.
The model simulations show that CO and NOx
ground-level concentrations on weekends are lower than
on weekdays, as shown in (Fig. 8a) (–19% and –41%,
respectively, for average values and –39% and –61% for
1-h peaks) but the higher proportional reduction of NOx
makes ozone-forming photochemistry more active on
weekends compared to weekdays (lower NOx/VOC
ratios). These phenomena are also present in measured
ambient concentrations of precursors (Fig. 8b). CO and
NOx are also significantly averagely reduced in a �37%
and �23%, respectively (Table 2). The cause of this
phenomenon is that reductions in traffic on weekends,
according to the emission model, imply higher NOx-
than VOC-reductions. This important NOx reductions
in areas that are VOC-limited, as the city of Barcelona
(Jimenez and Baldasano, 2004), increase O3 formation
on weekends (Fig. 9). Nevertheless, nighttime precursors
concentrations are higher on weekends than on week-
days, and this phenomenon might contribute to the
carryover effect, that will be analyzed later. This
reduction of precursors is also observed downwind the
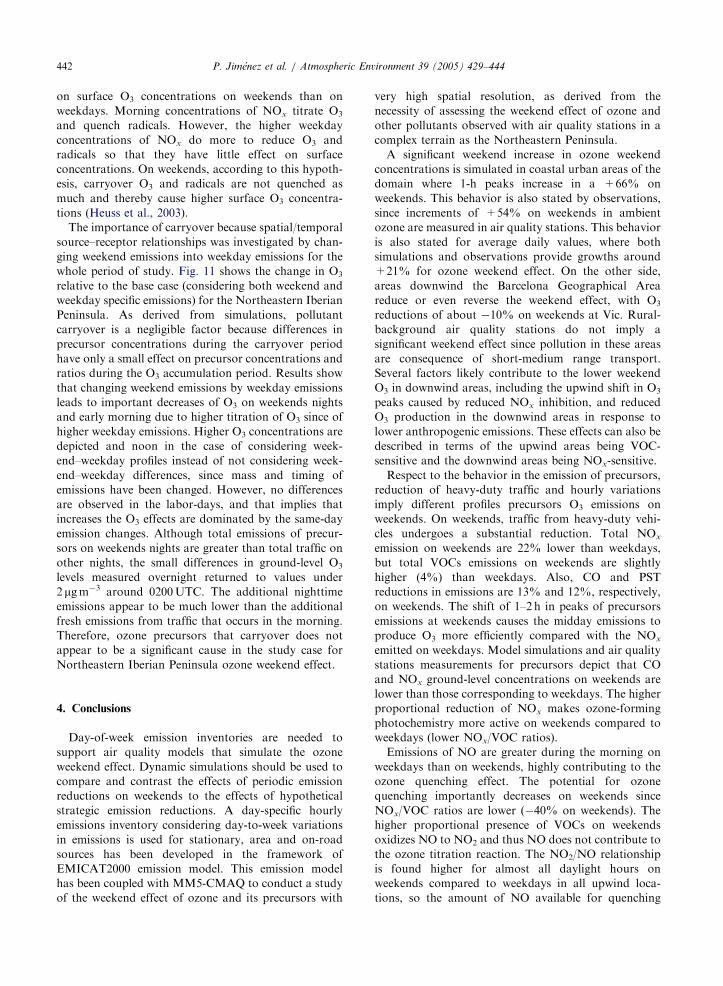
emitting sources, as Vic. Nevertheless, if we take into
account modeling results, ambient NOx decreases on
weekends are important in downwind areas (over �30%
for peak and average values), but the influence of VOCs
(represented by CO) is not as important (reductions of
�4% for simulated maximum and average levels).
Therefore, Vic constitutes an NOx-limited domain
whose O3 weekend effect (exhibiting weekday values
10% over weekend levels) comes conditioned by the
reduction of NOx emissions in the area on weekends
during this episode of photochemical pollution (Fig. 10).
3.5. Ozone quenching
Emissions of O3 precursors are greater during the
morning on weekdays than on weekends, as stated
before. The higher values of NO in NOx emissions
destroys (quenches) more of the available ground-level
ozone in pervasive emission areas as cities, according to
the titration reaction in which NO and O3 combines to
produce NO2 and oxygen (NO+O3-NO2+O2). Thus,
ozone is suppressed more and its formation is retarded
more on weekdays compared to weekends, contributing
to the weekend effect. Moreover, the NO2 formed from
the O3 titration removes radicals by the reaction
NO2+OH-HNO3. If NOx emissions are reduced, as
ARTICLE IN PRESS
0
20
40
60
80
100
120
140
160
180
013-8-00
0:0013-8-0012:00
14-8-000:00
14-8-0012:00
15-8-000:00
15-8-0012:00
16-8-000:00
16-8-0012:00
Observed Modeled
13-8-000:00
13-8-0012:00
14-8-000:00
14-8-0012:00
15-8-000:00
15-8-0012:00
16-8-000:00
16-8-0012:00
Observed Modeled
13-8-000:00
13-8-0012:00
14-8-000:00
14-8-0012:00
15-8-000:00
15-8-0012:00
16-8-000:00
16-8-0012:00
Observed Modeled
200
400
600
800
1000
1200
CO
(pp
b)
(c)
0
25
50
75
100
125
150
175
200
225
NO
x (µ
g m
-3)
Ozo
ne (
µg m
-3)
(b)
(a)
Fig. 10. Time series for (a) ozone; (b) NOx and (c) CO both for
observations (black diamonds) and simulations (solid line,
white squares) in the area of Vic (downwind) for 13–16 August
2000.
-20
-15
-10
-5
0
5
10
15
20
0:00Weekend
6:00 12:00 18:00 0:00
Weekday6:00 12:00 18:00C
hang
e in
Ozo
ne fr
om W
eeke
nd E
mis
sion
s (µ
g m
-3)
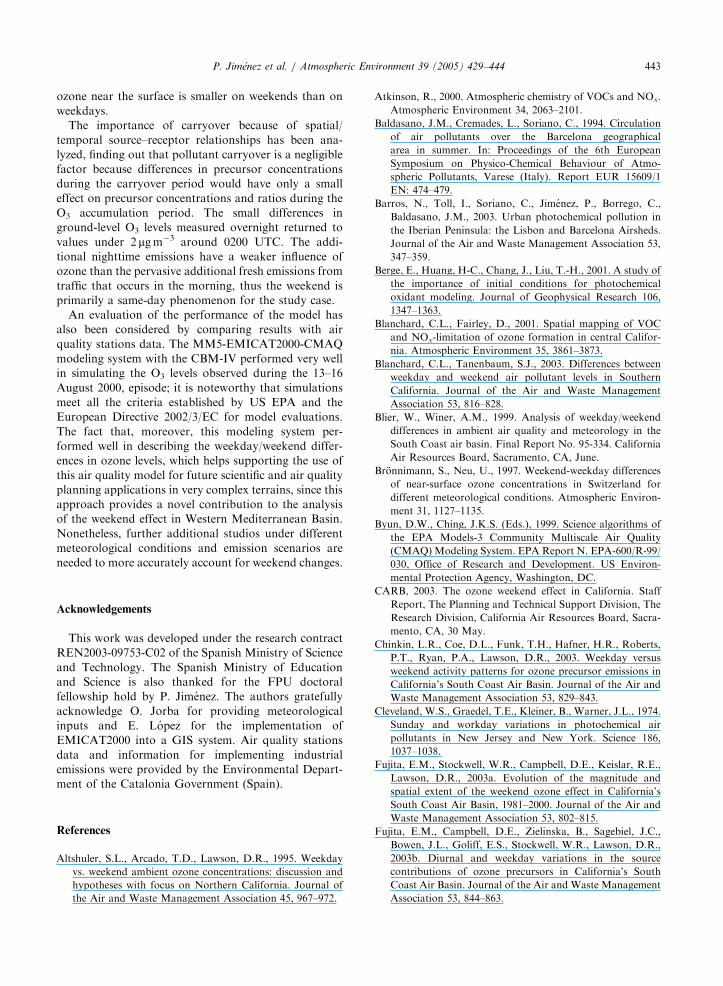
Fig. 11. Analysis of carryover impact from weekends to
weekdays by changing weekend/weekday emissions. Differences
measured in ground-level O3 return to values under 2mgm�3
around 0200UTC of the following day due to pervasive early
morning emissions.
P. Jimenez et al. / Atmospheric Environment 39 (2005) 429–444 441
occurs on weekends, the NO2 concentration is lower, the
radical concentration is higher and formation of new O3
proceeds faster. As stated by Heuss et al. (2003), ozone
at steady state depends on the rate of NO2 photolysis
and the ratio NO2 to NO. In the absence of other
processes that convert NO to NO2, the photolysis of
NO2 is balanced by the aforementioned reaction of NO
with O3. When VOCs are present, they participate in
chain-carrying reactions that convert NO to NO2
without using up an O3 molecule (Atkinson, 2000).
Thus, the amount and kind of hydrocarbons determine
the ratio of NO2 to NO.
Measured and simulated ground-level precursors
(Table 2), indicate ambient levels of NOx are substan-
tially lower on weekends morning than on weekdays
(around �40% both in upwind and downwind areas for
average NOx levels) and smaller reductions of VOCs
levels at weekends (reductions of only �4% for average
simulated CO levels and �2% for measured CO), and
therefore the potential for ozone quenching importantly
decreases since NOx/VOC ratios are lower on weekends.
The higher proportional presence of VOCs oxidizes NO
to NO2 and thus NO does not contribute to the ozone
titration reaction. The ratio NOx on weekends to NOx
on weekdays is low for corresponding daylight hours,
particularly during the hours where ozone is likely to
reaches its maximum levels. Furthermore, in the study
case, both ambient data and simulation depict that the
NO2/NO relationship is higher for almost all daylight
hours on weekends compared to weekdays in all upwind
locations, so the amount of NO available for quenching
ozone near the surface is smaller on weekends than on
week days.
3.6. Carryover contribution to the weekend effect
Increased VOC and NOx emissions from traffic on
weekend nights may carry over near ground level and
lead to greater O3 formation after sunrise on the
following day (surface carryover). In addition, the
reservoir of pollutants that carries over above the
nocturnal boundary layer may exert a greater influence
ARTICLE IN PRESSP. Jimenez et al. / Atmospheric Environment 39 (2005) 429–444442
on surface O3 concentrations on weekends than on
weekdays. Morning concentrations of NOx titrate O3
and quench radicals. However, the higher weekday
concentrations of NOx do more to reduce O3 and
radicals so that they have little effect on surface
concentrations. On weekends, according to this hypoth-
esis, carryover O3 and radicals are not quenched as
much and thereby cause higher surface O3 concentra-
tions (Heuss et al., 2003).
The importance of carryover because spatial/temporal
source–receptor relationships was investigated by chan-
ging weekend emissions into weekday emissions for the
whole period of study. Fig. 11 shows the change in O3
relative to the base case (considering both weekend and
weekday specific emissions) for the Northeastern Iberian
Peninsula. As derived from simulations, pollutant
carryover is a negligible factor because differences in
precursor concentrations during the carryover period
have only a small effect on precursor concentrations and
ratios during the O3 accumulation period. Results show
that changing weekend emissions by weekday emissions
leads to important decreases of O3 on weekends nights
and early morning due to higher titration of O3 since of
higher weekday emissions. Higher O3 concentrations are
depicted and noon in the case of considering week-
end–weekday profiles instead of not considering week-
end–weekday differences, since mass and timing of
emissions have been changed. However, no differences
are observed in the labor-days, and that implies that
increases the O3 effects are dominated by the same-day
emission changes. Although total emissions of precur-
sors on weekends nights are greater than total traffic on
other nights, the small differences in ground-level O3
levels measured overnight returned to values under
2mgm�3 around 0200UTC. The additional nighttime
emissions appear to be much lower than the additional
fresh emissions from traffic that occurs in the morning.
Therefore, ozone precursors that carryover does not
appear to be a significant cause in the study case for
Northeastern Iberian Peninsula ozone weekend effect.
4. Conclusions
Day-of-week emission inventories are needed to
support air quality models that simulate the ozone
weekend effect. Dynamic simulations should be used to
compare and contrast the effects of periodic emission
reductions on weekends to the effects of hypothetical
strategic emission reductions. A day-specific hourly
emissions inventory considering day-to-week variations
in emissions is used for stationary, area and on-road
sources has been developed in the framework of
EMICAT2000 emission model. This emission model
has been coupled with MM5-CMAQ to conduct a study
of the weekend effect of ozone and its precursors with
very high spatial resolution, as derived from the
necessity of assessing the weekend effect of ozone and
other pollutants observed with air quality stations in a
complex terrain as the Northeastern Peninsula.
A significant weekend increase in ozone weekend
concentrations is simulated in coastal urban areas of the
domain where 1-h peaks increase in a +66% on
weekends. This behavior is also stated by observations,
since increments of +54% on weekends in ambient
ozone are measured in air quality stations. This behavior
is also stated for average daily values, where both
simulations and observations provide growths around
+21% for ozone weekend effect. On the other side,
areas downwind the Barcelona Geographical Area
reduce or even reverse the weekend effect, with O3
reductions of about �10% on weekends at Vic. Rural-
background air quality stations do not imply a
significant weekend effect since pollution in these areas
are consequence of short-medium range transport.
Several factors likely contribute to the lower weekend
O3 in downwind areas, including the upwind shift in O3
peaks caused by reduced NOx inhibition, and reduced
O3 production in the downwind areas in response to
lower anthropogenic emissions. These effects can also be
described in terms of the upwind areas being VOC-
sensitive and the downwind areas being NOx-sensitive.
Respect to the behavior in the emission of precursors,
reduction of heavy-duty traffic and hourly variations
imply different profiles precursors O3 emissions on
weekends. On weekends, traffic from heavy-duty vehi-
cles undergoes a substantial reduction. Total NOx
emission on weekends are 22% lower than weekdays,
but total VOCs emissions on weekends are slightly
higher (4%) than weekdays. Also, CO and PST
reductions in emissions are 13% and 12%, respectively,
on weekends. The shift of 1–2 h in peaks of precursors
emissions at weekends causes the midday emissions to
produce O3 more efficiently compared with the NOx
emitted on weekdays. Model simulations and air quality
stations measurements for precursors depict that CO
and NOx ground-level concentrations on weekends are
lower than those corresponding to weekdays. The higher
proportional reduction of NOx makes ozone-forming
photochemistry more active on weekends compared to
weekdays (lower NOx/VOC ratios).
Emissions of NO are greater during the morning on
weekdays than on weekends, highly contributing to the
ozone quenching effect. The potential for ozone
quenching importantly decreases on weekends since
NOx/VOC ratios are lower (�40% on weekends). The
higher proportional presence of VOCs on weekends
oxidizes NO to NO2 and thus NO does not contribute to
the ozone titration reaction. The NO2/NO relationship
is found higher for almost all daylight hours on
weekends compared to weekdays in all upwind loca-
tions, so the amount of NO available for quenching
ARTICLE IN PRESSP. Jimenez et al. / Atmospheric Environment 39 (2005) 429–444 443
ozone near the surface is smaller on weekends than on
weekdays.
The importance of carryover because of spatial/
temporal source–receptor relationships has been ana-
lyzed, finding out that pollutant carryover is a negligible
factor because differences in precursor concentrations
during the carryover period would have only a small
effect on precursor concentrations and ratios during the
O3 accumulation period. The small differences in
ground-level O3 levels measured overnight returned to
values under 2mgm�3 around 0200 UTC. The addi-
tional nighttime emissions have a weaker influence of
ozone than the pervasive additional fresh emissions from
traffic that occurs in the morning, thus the weekend is
primarily a same-day phenomenon for the study case.
An evaluation of the performance of the model has
also been considered by comparing results with air
quality stations data. The MM5-EMICAT2000-CMAQ
modeling system with the CBM-IV performed very well
in simulating the O3 levels observed during the 13–16
August 2000, episode; it is noteworthy that simulations
meet all the criteria established by US EPA and the
European Directive 2002/3/EC for model evaluations.
The fact that, moreover, this modeling system per-
formed well in describing the weekday/weekend differ-
ences in ozone levels, which helps supporting the use of
this air quality model for future scientific and air quality
planning applications in very complex terrains, since this
approach provides a novel contribution to the analysis
of the weekend effect in Western Mediterranean Basin.
Nonetheless, further additional studios under different
meteorological conditions and emission scenarios are
needed to more accurately account for weekend changes.
Acknowledgements
This work was developed under the research contract
REN2003-09753-C02 of the Spanish Ministry of Science
and Technology. The Spanish Ministry of Education
and Science is also thanked for the FPU doctoral
fellowship hold by P. Jimenez. The authors gratefully
acknowledge O. Jorba for providing meteorological
inputs and E. Lopez for the implementation of
EMICAT2000 into a GIS system. Air quality stations
data and information for implementing industrial
emissions were provided by the Environmental Depart-
ment of the Catalonia Government (Spain).
References
Altshuler, S.L., Arcado, T.D., Lawson, D.R., 1995. Weekday
vs. weekend ambient ozone concentrations: discussion and
hypotheses with focus on Northern California. Journal of
the Air and Waste Management Association 45, 967–972.
Atkinson, R., 2000. Atmospheric chemistry of VOCs and NOx.
Atmospheric Environment 34, 2063–2101.
Baldasano, J.M., Cremades, L., Soriano, C., 1994. Circulation
of air pollutants over the Barcelona geographical
area in summer. In: Proceedings of the 6th European
Symposium on Physico-Chemical Behaviour of Atmo-
spheric Pollutants, Varese (Italy). Report EUR 15609/1
EN: 474–479.
Barros, N., Toll, I., Soriano, C., Jimenez, P., Borrego, C.,
Baldasano, J.M., 2003. Urban photochemical pollution in
the Iberian Peninsula: the Lisbon and Barcelona Airsheds.
Journal of the Air and Waste Management Association 53,
347–359.
Berge, E., Huang, H-C., Chang, J., Liu, T.-H., 2001. A study of
the importance of initial conditions for photochemical
oxidant modeling. Journal of Geophysical Research 106,
1347–1363.
Blanchard, C.L., Fairley, D., 2001. Spatial mapping of VOC
and NOx-limitation of ozone formation in central Califor-
nia. Atmospheric Environment 35, 3861–3873.
Blanchard, C.L., Tanenbaum, S.J., 2003. Differences between
weekday and weekend air pollutant levels in Southern
California. Journal of the Air and Waste Management
Association 53, 816–828.
Blier, W., Winer, A.M., 1999. Analysis of weekday/weekend
differences in ambient air quality and meteorology in the
South Coast air basin. Final Report No. 95-334. California
Air Resources Board, Sacramento, CA, June.
Bronnimann, S., Neu, U., 1997. Weekend-weekday differences
of near-surface ozone concentrations in Switzerland for
different meteorological conditions. Atmospheric Environ-
ment 31, 1127–1135.
Byun, D.W., Ching, J.K.S. (Eds.), 1999. Science algorithms of
the EPA Models-3 Community Multiscale Air Quality
(CMAQ) Modeling System. EPA Report N. EPA-600/R-99/
030, Office of Research and Development. US Environ-
mental Protection Agency, Washington, DC.
CARB, 2003. The ozone weekend effect in California. Staff
Report, The Planning and Technical Support Division, The
Research Division, California Air Resources Board, Sacra-
mento, CA, 30 May.
Chinkin, L.R., Coe, D.L., Funk, T.H., Hafner, H.R., Roberts,
P.T., Ryan, P.A., Lawson, D.R., 2003. Weekday versus
weekend activity patterns for ozone precursor emissions in
California’s South Coast Air Basin. Journal of the Air and
Waste Management Association 53, 829–843.
Cleveland, W.S., Graedel, T.E., Kleiner, B., Warner, J.L., 1974.
Sunday and workday variations in photochemical air
pollutants in New Jersey and New York. Science 186,
1037–1038.
Fujita, E.M., Stockwell, W.R., Campbell, D.E., Keislar, R.E.,
Lawson, D.R., 2003a. Evolution of the magnitude and
spatial extent of the weekend ozone effect in California’s
South Coast Air Basin, 1981–2000. Journal of the Air and
Waste Management Association 53, 802–815.
Fujita, E.M., Campbell, D.E., Zielinska, B., Sagebiel, J.C.,
Bowen, J.L., Goliff, E.S., Stockwell, W.R., Lawson, D.R.,
2003b. Diurnal and weekday variations in the source
contributions of ozone precursors in California’s South
Coast Air Basin. Journal of the Air and Waste Management
Association 53, 844–863.
ARTICLE IN PRESSP. Jimenez et al. / Atmospheric Environment 39 (2005) 429–444444
Gery, M.W., Whitten, G.Z., Killus, J.P., Dodge, M.C., 1989. A
photochemical kinetics mechanism for urban and regional
scale computer modeling. Journal of Geophysical Research
94 (D10), 12,925–12,956.
Heuss, J.M., Kahlbaum, D.F., Wolff, G.T., 2003. Weekday/
weekend ozone differences: what can we learn from them?
Journal of the Air and Waste Management Association 53,
772–788.
Hogrefe, C., Rao, S.T., Kasibhatla, P., Hao, W., Sistla, G.,
Mathur, R., McHenry, J., 2001. Evaluating the performance
of regional-scale photochemical modeling systems: Part
II–ozone predictions. Atmospheric Environment 35,
4175–4188.
Huang, H.-C., Chang, J.S., 2001. On the performance of
numerical solvers for a chemistry submodel in three-
dimensional air quality models. Journal of Geophysical
Research 106, 20,175–20,188.
Jenkin, M.E., Davies, T.J., Stedman, J.R., 2002. The origin and
day-of-week dependence of photochemical ozone episodes
in the UK. Atmospheric Envrionment 36, 999–1012.
Jimenez, P., Baldasano, J.M., 2004. Ozone response to
precursor controls: the use of photochemical indicators to
assess O3–NOx–VOC sensitivity in the Northeastern
Iberian Peninsula. Journal of Geophysical Research 109,
D20309.
Jimenez, P., Jorba, O., Baldasano, J.M., 2004. Influence of
horizontal model grid resolution on tropospheric ozone
levels. In: Suppan, P. (Ed.), Harmonisation 2004, Ninth
International Conference on Harmonisation within Atmo-
spheric Dispersion Modelling for Regulatory Purposes, vol.
2. Garmish-Partenkircher, Germany, pp. 219–223.
Jorba, O., Perez, C., Rocadenbosch, F., Baldasano, J.M., 2004.
Cluster analysis of 4-day back trajectories arriving in the
Barcelona Area (Spain) from 1997 to 2002. Journal of
Applied Meteorology 43 (6), 887–901.
Kang, D., Eder, B.K., Schere, K.L., 2003. The evaluation of
regional-scale air quality models as part of NOAA’s air
quality forecasting pilot program. In: 26th Nato Interna-
tional Technical Meeting on Air Pollution Modeling and its
Application, Istanbul, Turkey, pp. 404–411.
Knipping, E.M., Dabdub, D., 2002. Modeling surface-mediated
renoxification of the atmosphere via reaction of gaseous
nitric oxide with deposited nitric acid. Atmospheric
Environment 36, 5741–5748.
Lebron, F., 1975. A comparison of weekend-weekday ozone
and hydrocarbon concentrations in the Baltimore–Wa-
shington metropolitan area. Atmospheric Environment 9,
861–863.
Marr, L.C., Harley, R.A., 2002a. Spectral analysis of weekday-
weekend differences in ambient ozone, nitrogen oxide, and
non-methane hydrocarbon time series in California. Atmo-
spheric Environment 36, 2327–2335.
Marr, L.C., Harley, R.A., 2002b. Modeling the effect of
weekday-weekend differences in motor vehicle emissions of
photochemical air pollution in central California. Environ-
mental Science and Technology 36, 4099–4106.
Millan, M., Salvador, R., Mantilla, E., Kallos, G., 1997.
Photooxidant dynamics in the Mediterranean basin in
summer: results from European research projects. Journal
of Geophysical Research 102, 8811–8823.
MMMD/NCAR, 2001. PSU/NCAR Mesoscale Modeling
System Tutorial Class Notes and User’s Guide: MM5
Modeling System Version 3.
Ntziachristos, L., Samaras, Z., 2000. COPERTIII Computer
programme to calculate emissions from road transport.
Methodology and emission factors (Version 2.1), European
Environment Agency, Technical Report No. 49.
Parra, R., 2004. Development of the EMICAT2000 model for
the estimation of air pollutants emissions in Catalonia and
its use in photochemical dispersion models. Ph.D. Thesis (in
Spanish), Polytechnic University of Catalonia (Spain)
available at: http://www.tdx.cesca.es/TDX-0803104-102139.
Parra, R., Baldasano, J.M., 2004. Modeling the on-road traffic
emissions from Catalonia (Spain) for photochemical air
pollution research. Weekday—weekend differences. In: 12th
International Conference on Air Pollution (AP’2004),
Rhodes (Greece).
Parra, R., Gasso, S., Baldasano, J.M., 2004. Estimating the
biogenic emissions of non-methane volatile organic com-
pounds from the North western Mediterranean vegetation
of Catalonia, Spain. The Science of the Total Environment
329, 241–259.
Perez, C., Sicard, M., Jorba, O., Comeron, A., Baldasano, J.M.,
2004. Summertime re-circulations of air pollutants over the
North-eastern Iberian coast observed from systematic
EARLINET lidar measurements in Barcelona. Atmospheric
Environment 38, 3983–4000.
Pun, B.K., Seigneur, C., White, W., 2003. Day-of-week
behavior of atmospheric ozone in three US cities. Journal
of the Air and Waste Management Association 53, 789–801.
Qin, Y., Tonnesen, G.S., Wang, Z., 2004a. One-hour and eight-
hour average ozone in the California South Coast Air Basin:
trends in peaks values and sensitivity to precursors. Atmo-
spheric Environment 38, 2197–2207.
Qin, Y., Tonnesen, G.S., Wang, Z., 2004b. Weekend/weekday
differences of ozone, NOx, Co, VOCs, PM10 and the light
scatter during ozone season in southern California. Atmo-
spheric Environment 38, 3069–3087.
Sillman, S., 1999. The relation between ozone, NOx and
hydrocarbons in urban and polluted rural environments.
Atmospheric Environment 33, 1821–1845.
Tanaka, P.L., Reimer, D.D., Chang, S., Yarwood, G.,
McDonald-Butler, E.C., Apel, E.C., Orlando, J.J., Silva,
P.J., Jimenez, J.L., Canagaratna, M.R., Neece, J.D.,
Mullins, C.B., Allen, D.T., 2003. Direct evidence for
chlorine-enhanced urban ozone formation in Houston,
Texas. Atmospheric Environment 37, 1393–1400.
US EPA, 1991. Guideline for Regulatory Application of the
Urban Airshed Model. US EPA Report No. EPA-450/4-91-
013, Office of Air and Radiation, Office of Air Quality
Planning and Standards, Technical Support Division,
Research Triangle Park, North Carolina, US.
Yarwood, G., Stoeckenius, T.E., Dunker, A.M., 2003. Model-
ing weekday/weekend ozone differences in the Los Angeles
region for 1997. Journal of the Air and Waste Management
Association 53, 864–875.
Related Documents