Original article Modeling the activity of furin inhibitors using artificial neural network Apilak Worachartcheewan a , Chanin Nantasenamat a , Thanakorn Naenna b , Chartchalerm Isarankura-Na-Ayudhya a, * , Virapong Prachayasittikul a, * a Department of Clinical Microbiology, Faculty of Medical Technology, Mahidol University, Bangkok 10700, Thailand b Department of Industrial Engineering, Faculty of Engineering, Mahidol University, Nakhon Pathom 73170, Thailand article info Article history: Received 22 May 2008 Received in revised form 24 July 2008 Accepted 8 September 2008 Available online 1 October 2008 Keywords: Furin Anthrax QSAR Neural network abstract Quantitative structure–activity relationship (QSAR) models were constructed for predicting the inhibi- tion of furin-dependent processing of anthrax protective antigen of substituted guanidinylated aryl 2,5- dideoxystreptamines. Molecular descriptors calculated by E-Dragon and RECON were subjected to variable reduction using the Unsupervised Forward Selection (UFS) algorithm. The variables were then used as input for QSAR model generation using partial least squares and back-propagation neural network. Prediction was performed via a two-step approach: (i) perform classification to determine whether the molecule is active or inactive, (ii) develop a QSAR regression model of active molecules. Both classification and regression models yielded good results with RECON providing higher accuracy than that of E-DRAGON descriptors. The performance of the regression model using E-Dragon and RECON descriptors provided a correlation coefficient of 0.807 and 0.923 and root mean square error of 0.666 and 0.304, respectively. Interestingly, it was observed that appropriate representations of the protonation states of the molecules were crucial for good prediction performance, which coincides with the fact that the inhibitors interact with furin via electrostatic forces. The results provide good prospect of using the proposed QSAR models for the rational design of novel therapeutic furin inhibitors toward anthrax and furin-dependent diseases. Ó 2008 Elsevier Masson SAS. All rights reserved. 1. Introduction Anthrax is an infectious disease caused by Bacillus anthracis, a rod-shaped gram-positive bacterium. Infection occurs when endospores are introduced into the host cell via abrasion, inhala- tion or ingestion. Afterwards, they are phagocytosed by macro- phages and migrate to regional lymph nodes. They rapidly germinate and become vegetative bacteria which are then released from the macrophages, followed by their multiplication in the lymphatic system, and gaining access to the blood circulation system to cause massive septicemia and toxemia. Anthrax toxins, excreted from B. anthracis, are comprised of three proteins, anthrax protective antigen (PA, 83 kDa), edema factor (EF, 89 kDa), and lethal factor (LF, 90 kDa) [1–3]. Activation of anthrax toxin takes place when furin cleaves the 83 kDa PA into two subunits: a receptor-bound 63 kDa subunit and a free 20 kDa fragment [4]. Oligomerization of PA63 mediates the endocytosis of EF and LF into the cytosol which eventually leads to a cataclysmic chain of events that give rise to pathological conditions and culminating in cell death [5,6]. Therefore, furin is a lucrative target for the development of therapeutic agents. Early approaches toward the development of furin inhibitors are mostly based on proteins and peptides, for example, a 1 -antitrypsin (a 1 -PDX) [7], polyarginine peptides [8], and peptidyl boronic acids. However, they inherently possess some shortcomings that may limit their therapeutic potentials; this includes their rather large molecular weight [9], low turnover [10], and potential cytotoxicity [11]. Therefore, this has prompted the development of small molecule-based furin inhibitors to solve the drawbacks of proteins/ peptides. This new family of compounds is based on guanidinylated aryl 2,5-dideoxystreptamines (GADDs) which was tested against furin and was shown to effectively protect cells from furin- dependent processing of PA [12]. In the present work, artificial neural network was used for the construction of a quantitative structure–activity relationship (QSAR) model of the inhibitory activity of furin inhibitors derived from GADDs. Molecular descriptors were calculated using E-Dragon and RECON softwares, which served as input for QSAR model generation using partial least squares and back-propagation neural network. A two-step approach was carried out as follows: (i) clas- sify whether the molecule is active or inactive and (ii) quantita- tively predict the inhibition activity of the active molecules. It was discovered that by taking account of the protonation state of * Corresponding authors. Tel.: þ66 2 418 0227; fax: þ66 2 412 4110. E-mail addresses: [email protected] (C. Isarankura-Na-Ayudhya), mtvpr@ mahidol.ac.th (V. Prachayasittikul). Contents lists available at ScienceDirect European Journal of Medicinal Chemistry journal homepage: http://www.elsevier.com/locate/ejmech 0223-5234/$ – see front matter Ó 2008 Elsevier Masson SAS. All rights reserved. doi:10.1016/j.ejmech.2008.09.028 European Journal of Medicinal Chemistry 44 (2008) 1664–1673

Welcome message from author
This document is posted to help you gain knowledge. Please leave a comment to let me know what you think about it! Share it to your friends and learn new things together.
Transcript

lable at ScienceDirect
European Journal of Medicinal Chemistry 44 (2008) 1664–1673
Contents lists avai
European Journal of Medicinal Chemistry
journal homepage: ht tp: / /www.elsevier .com/locate/e jmech
Original article
Modeling the activity of furin inhibitors using artificial neural network
Apilak Worachartcheewan a, Chanin Nantasenamat a, Thanakorn Naenna b,Chartchalerm Isarankura-Na-Ayudhya a,*, Virapong Prachayasittikul a,*
a Department of Clinical Microbiology, Faculty of Medical Technology, Mahidol University, Bangkok 10700, Thailandb Department of Industrial Engineering, Faculty of Engineering, Mahidol University, Nakhon Pathom 73170, Thailand
a r t i c l e i n f o
Article history:Received 22 May 2008Received in revised form 24 July 2008Accepted 8 September 2008Available online 1 October 2008
Keywords:FurinAnthraxQSARNeural network
* Corresponding authors. Tel.: þ66 2 418 0227; faxE-mail addresses: [email protected] (C. Isara
mahidol.ac.th (V. Prachayasittikul).
0223-5234/$ – see front matter � 2008 Elsevier Masdoi:10.1016/j.ejmech.2008.09.028
a b s t r a c t
Quantitative structure–activity relationship (QSAR) models were constructed for predicting the inhibi-tion of furin-dependent processing of anthrax protective antigen of substituted guanidinylated aryl 2,5-dideoxystreptamines. Molecular descriptors calculated by E-Dragon and RECON were subjected tovariable reduction using the Unsupervised Forward Selection (UFS) algorithm. The variables were thenused as input for QSAR model generation using partial least squares and back-propagation neuralnetwork. Prediction was performed via a two-step approach: (i) perform classification to determinewhether the molecule is active or inactive, (ii) develop a QSAR regression model of active molecules. Bothclassification and regression models yielded good results with RECON providing higher accuracy thanthat of E-DRAGON descriptors. The performance of the regression model using E-Dragon and RECONdescriptors provided a correlation coefficient of 0.807 and 0.923 and root mean square error of 0.666 and0.304, respectively. Interestingly, it was observed that appropriate representations of the protonationstates of the molecules were crucial for good prediction performance, which coincides with the fact thatthe inhibitors interact with furin via electrostatic forces. The results provide good prospect of using theproposed QSAR models for the rational design of novel therapeutic furin inhibitors toward anthrax andfurin-dependent diseases.
� 2008 Elsevier Masson SAS. All rights reserved.
1. Introduction
Anthrax is an infectious disease caused by Bacillus anthracis,a rod-shaped gram-positive bacterium. Infection occurs whenendospores are introduced into the host cell via abrasion, inhala-tion or ingestion. Afterwards, they are phagocytosed by macro-phages and migrate to regional lymph nodes. They rapidlygerminate and become vegetative bacteria which are then releasedfrom the macrophages, followed by their multiplication in thelymphatic system, and gaining access to the blood circulationsystem to cause massive septicemia and toxemia. Anthrax toxins,excreted from B. anthracis, are comprised of three proteins, anthraxprotective antigen (PA, 83 kDa), edema factor (EF, 89 kDa), andlethal factor (LF, 90 kDa) [1–3].
Activation of anthrax toxin takes place when furin cleaves the83 kDa PA into two subunits: a receptor-bound 63 kDa subunit anda free 20 kDa fragment [4]. Oligomerization of PA63 mediates theendocytosis of EF and LF into the cytosol which eventually leads toa cataclysmic chain of events that give rise to pathological
: þ66 2 412 4110.nkura-Na-Ayudhya), mtvpr@
son SAS. All rights reserved.
conditions and culminating in cell death [5,6]. Therefore, furin isa lucrative target for the development of therapeutic agents.
Early approaches toward the development of furin inhibitors aremostly based on proteins and peptides, for example, a1-antitrypsin(a1-PDX) [7], polyarginine peptides [8], and peptidyl boronic acids.However, they inherently possess some shortcomings that maylimit their therapeutic potentials; this includes their rather largemolecular weight [9], low turnover [10], and potential cytotoxicity[11]. Therefore, this has prompted the development of smallmolecule-based furin inhibitors to solve the drawbacks of proteins/peptides. This new family of compounds is based on guanidinylatedaryl 2,5-dideoxystreptamines (GADDs) which was tested againstfurin and was shown to effectively protect cells from furin-dependent processing of PA [12].
In the present work, artificial neural network was used for theconstruction of a quantitative structure–activity relationship(QSAR) model of the inhibitory activity of furin inhibitors derivedfrom GADDs. Molecular descriptors were calculated using E-Dragonand RECON softwares, which served as input for QSAR modelgeneration using partial least squares and back-propagation neuralnetwork. A two-step approach was carried out as follows: (i) clas-sify whether the molecule is active or inactive and (ii) quantita-tively predict the inhibition activity of the active molecules. It wasdiscovered that by taking account of the protonation state of

A. Worachartcheewan et al. / European Journal of Medicinal Chemistry 44 (2008) 1664–1673 1665
GADDs, which is important in interaction and inhibition of furin,provided good predictive performance as observed fromimprovements in the correlation coefficient of predicted andexperimental pKi from 0.759 to 0.807 when using E-Dragondescriptors. Furthermore, charge-based descriptors generated fromRECON provided stellar performance as illustrated by the correla-tion coefficient of 0.923. The results suggested good prospect ofusing the proposed QSAR models as guides for designing novelcompounds with robust inhibition activity.
2. Methodology
2.1. Data set
The data set used in this study was obtained from the work ofJiao et al. [12]. It is comprised of 18 furin inhibitors based on gua-nidinylated aryl 2,5-dideoxystreptamine derivatives. The inhibitionconstant (Ki) value, which is a measure of the ability to inhibit furin,was converted to pKi by taking the negative logarithm to base 10 ofKi (�log Ki). The molecular structures and their activities are shownin Table 1. Of the 18 furin inhibitors, six (1h, 1j, 1k, 1l, 1m, and 1r)were discarded from the data set as they exhibit little or no inhi-bition against furin as judged from Ki> 100 mM. These moleculeswere labeled as inactive compounds while the remaining wasdesignated as active compounds (Table 1).
2.2. Descriptor generation
2.2.1. Construction of molecular structureThe two-dimensional structure of furin inhibitors was drawn
with ChemAxon’s Marvin [13] and saved as SMILES notations whichserves as input for the generation of molecular descriptors by E-Dragon, version 1.0 [14] and RECON version 5.5 [15].
2.2.2. Determination of protonation stateThe appropriate protonation state of the molecules in experi-
mental buffer at physiological pH 7.5 was identified with the Sketchmodule of the Marvin software package. The proposed ionizationstates were then introduced into the structures of furin inhibitorsfor generation of relevant molecular descriptors.
2.2.3. Calculation of molecular descriptorsThe online version of Dragon as available on the Virtual
Computational Chemistry Laboratory (VCCLAB) [16] as E-Dragonwas employed for calculating 1666 molecular descriptors spanning20 categories: Constitutional descriptors, Walk and path counts,Information indices, Edge adjacency indices, Topological chargeindicates, Randic molecular profiles, RDF descriptors, WHIMdescriptors, Functional group counts, Charge descriptors, Topolog-ical descriptors, Connectivity indices, 2D autocorrelation, Burdeneigenvalues, Eigenvalue based indices, Geometrical descriptors, 3DMoRSE descriptors, GETAWAY descriptors, Atom-centered frag-ments, and Molecular properties. The definitions of these descrip-tors are reviewed by Todeschini et al. [17]. SMILES notations of thechemical structures served as input data for subsequent conversionto three-dimensional structures using the built-in software option,CORINA.
Similarly, SMILES notation was used as input for the generationof 248 transferable atom equivalent (TAE) descriptors using RECON.The TAE methodology was developed by Breneman and Rhem [18]based on Bader’s theory of atom in molecules [19]. The algorithm isbased on building a library of precomputed atomic fragments by abinitio calculations. The molecular properties of the compounds ofinterests are then reconstructed from their atomic constituents.The TAE molecular descriptors are comprised of 11 electronicsurface properties [20,21] comprising Surface integral of
electrostatic potential (SIEP), Electrostatic potential (EP), Electrondensity gradient normal to 0.002 e/au3 electron density isosurface(Del(Rho)$N), Electronic kinetic energy density (G), Electronickinetic energy density (K), Gradient of K electronic kinetic energydensity normal to surface (Del(K)$N), Gradient of G electronickinetic energy density normal to surface (Del(G)$N), Fukui Fþ
function scalar value (Fuk), Laplacian of the electron density (Lapl),bare nuclear potential (BNP), and local average ionization potential(PIP).
2.3. Descriptor reduction
The calculated descriptors obtained from each of the softwarewere standardized using Weka, version 3.4.5 [22] so as to adjust allof the descriptors to the same scale with zero mean and unitvariance according to the following equation:
xstnij ¼
xij � xjPNi¼1�xij � xj
�2=N
(1)
where xinstn represents the standardized value, xij represents the
value of each sample, xj represents the mean of each descriptor, andN represents the sample size of the data set.
Descriptors with constant value were discarded using theRemoveUseless feature of Weka. In order to further improve thepredictive performance as well as reduce the computational time,multi-collinear and redundant descriptors were discarded usingthe Unsupervised Forward Selection algorithm of UFS, version 1.8[23] as described previously [24].
2.4. Generation of training and testing sets
The data set of furin inhibitors was divided into two setscomprising training and testing sets by the leave-one-out cross-validation (LOO-CV) approach in which one sample of the data setwas left out as the testing set while the remaining data sampleswere used as the training set. The training sets were employed tobuild a predictive model and predictions were made on the testingset. The process was repeated iteratively until all of the datasamples were used as the testing set.
2.5. Partial least squares analysis
Partial Least Squares models were performed using the PLS1algorithm of The Unscrambler 9.6 software package [25]. Moleculardescriptors derived from E-Dragon and RECON were used asindependent variables while the activity/inactivity served as theresponse variable. The input variables were pre-processed byautoscaling to zero mean and unit variance as previously describedby Eq. (1). The number of descriptors was reduced to a smallernumber of latent variables called PLS components (PC) that is ableto account for the core information of the original data set. Theoptimal number of PCs was determined according to the method ofHaaland and Thomas [26] from a plot of PCs versus the meansquared error (MSE) as calculated according to the followingequation:
MSE ¼Pn
i¼1ðpi � aiÞ2
n(2)
where pi is the predicted output, ai is the actual output, and n is thenumber of compounds presented in the data set. In this study, PLS isused in combination with cross-validation as an indicator ofpredictive performance. Therefore, the PLS model was calculatedusing LOO-CV.

Table 1Structures of furin inhibitors and their inhibition constants against furina
NH
NH2
NHR3HN G
R1O OR2
1
G =
No. Compound R1 R2 R3 Ki (mM) pKib
A-1 1a G
G
G
G
NH2
NH
0.169 0.77
A-2 1b G
G
GNH2
NH
0.089 1.05
A-3 1c G
G
G NH2
NH
0.404 0.39
A-4 1d G
H2N
G NH2
NH
0.022 1.66
A-5 1eG
G NH2
NH
0.006 2.22
A-6 1fG G NH2
NH
0.069 1.16
A-7 1gG G
NH2
NH
0.012 1.92
A-8 1i NG
NG
NH2
NH
0.042 1.38
A-9 1nG G G
0.046 1.34
A-10 1oG G G 0.423 0.37
A. Worachartcheewan et al. / European Journal of Medicinal Chemistry 44 (2008) 1664–16731666
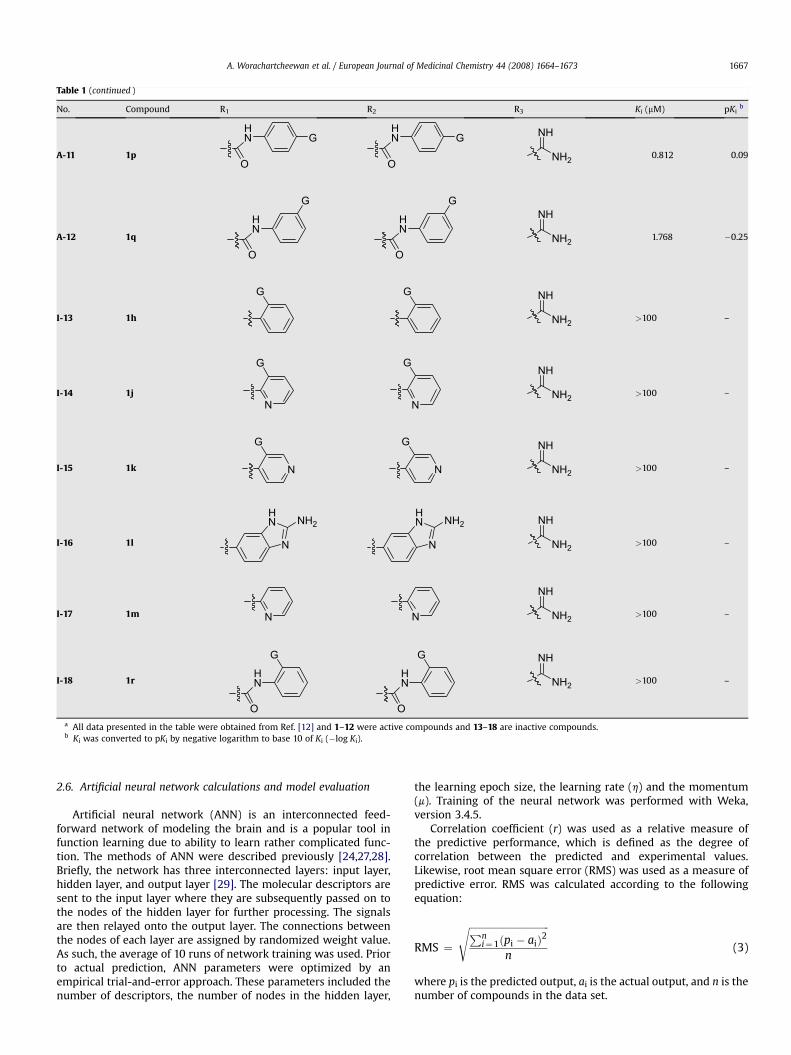
Table 1 (continued )
No. Compound R1 R2 R3 Ki (mM) pKib
A-11 1p
HN
O
GHN
O
G
NH2
NH
0.812 0.09
A-12 1q
HN
O
G
HN
O
G
NH2
NH
1.768 �0.25
I-13 1h
G G
NH2
NH
>100 –
I-14 1jN
G
N
G
NH2
NH
>100 –
I-15 1k N
G
N
G
NH2
NH
>100 –
I-16 1l N
HN NH2
N
HN NH2
NH2
NH
>100 –
I-17 1m N N NH2
NH
>100 –
I-18 1rHN
O
G
HN
O
G
NH2
NH
>100 –
a All data presented in the table were obtained from Ref. [12] and 1–12 were active compounds and 13–18 are inactive compounds.b Ki was converted to pKi by negative logarithm to base 10 of Ki (�log Ki).
A. Worachartcheewan et al. / European Journal of Medicinal Chemistry 44 (2008) 1664–1673 1667
2.6. Artificial neural network calculations and model evaluation
Artificial neural network (ANN) is an interconnected feed-forward network of modeling the brain and is a popular tool infunction learning due to ability to learn rather complicated func-tion. The methods of ANN were described previously [24,27,28].Briefly, the network has three interconnected layers: input layer,hidden layer, and output layer [29]. The molecular descriptors aresent to the input layer where they are subsequently passed on tothe nodes of the hidden layer for further processing. The signalsare then relayed onto the output layer. The connections betweenthe nodes of each layer are assigned by randomized weight value.As such, the average of 10 runs of network training was used. Priorto actual prediction, ANN parameters were optimized by anempirical trial-and-error approach. These parameters included thenumber of descriptors, the number of nodes in the hidden layer,
the learning epoch size, the learning rate (h) and the momentum(m). Training of the neural network was performed with Weka,version 3.4.5.
Correlation coefficient (r) was used as a relative measure ofthe predictive performance, which is defined as the degree ofcorrelation between the predicted and experimental values.Likewise, root mean square error (RMS) was used as a measure ofpredictive error. RMS was calculated according to the followingequation:
RMS ¼
ffiffiffiffiffiffiffiffiffiffiffiffiffiffiffiffiffiffiffiffiffiffiffiffiffiffiffiffiffiffiffiffiffiPni¼1ðpi � aiÞ2
n
s(3)
where pi is the predicted output, ai is the actual output, and n is thenumber of compounds in the data set.
Number of E-Dragon Molecular Descriptors
2 4 6 8 10 12
Cor
rela
tion
Coe
ffic
ient
(r)
-.8
-.6
-.4
-.2
0.0
.2
.4
.6
.8
optimal
a
Number of TAE Molecular Descriptors1 2 3 4 5 6 7
.3
.4
.5
.6
.7
.8
.9
optimal
Cor
rela
tion
Coe
ffic
ient
(r)
b
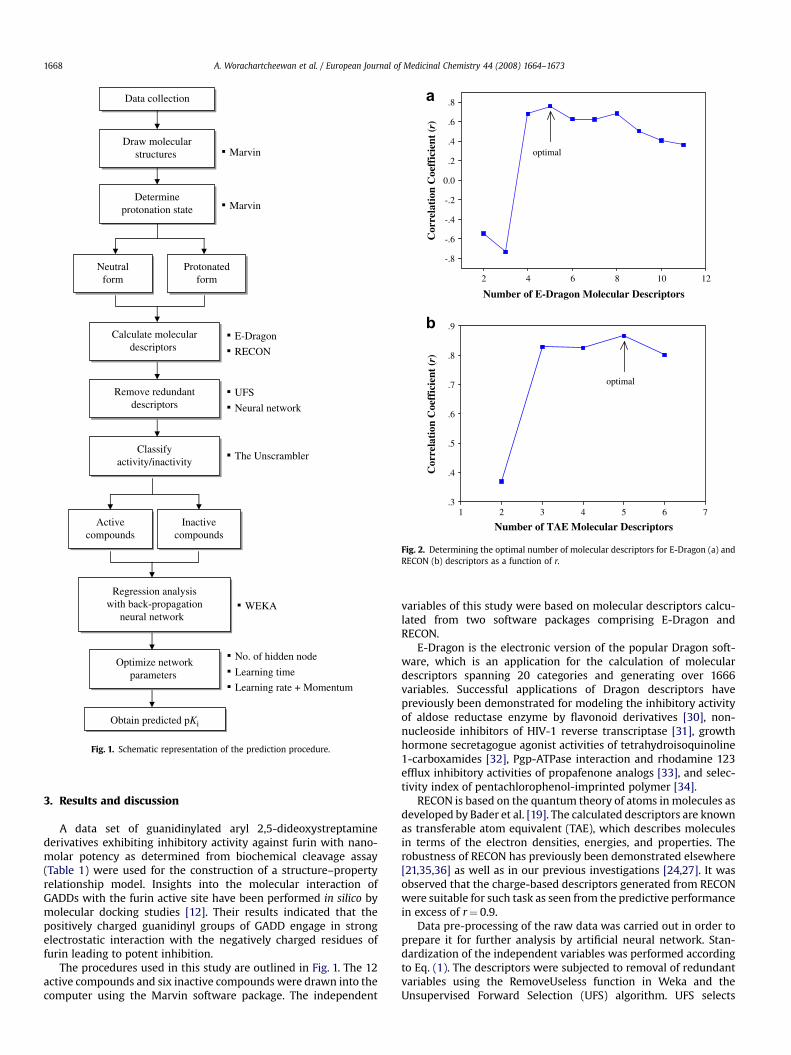
Fig. 2. Determining the optimal number of molecular descriptors for E-Dragon (a) andRECON (b) descriptors as a function of r.
Data collection
Draw molecularstructures
Determineprotonation state
Neutralform
Protonatedform
Calculate moleculardescriptors
Remove redundantdescriptors
Classifyactivity/inactivity
Optimize networkparameters
Activecompounds
Inactivecompounds
Regression analysiswith back-propagation
neural network
Obtain predicted pKi
No. of hidden node
Learning time
Learning rate + Momentum
E-Dragon
RECON
UFS
Neural network
The Unscrambler
WEKA
Marvin
Marvin
Fig. 1. Schematic representation of the prediction procedure.
A. Worachartcheewan et al. / European Journal of Medicinal Chemistry 44 (2008) 1664–16731668
3. Results and discussion
A data set of guanidinylated aryl 2,5-dideoxystreptaminederivatives exhibiting inhibitory activity against furin with nano-molar potency as determined from biochemical cleavage assay(Table 1) were used for the construction of a structure–propertyrelationship model. Insights into the molecular interaction ofGADDs with the furin active site have been performed in silico bymolecular docking studies [12]. Their results indicated that thepositively charged guanidinyl groups of GADD engage in strongelectrostatic interaction with the negatively charged residues offurin leading to potent inhibition.
The procedures used in this study are outlined in Fig. 1. The 12active compounds and six inactive compounds were drawn into thecomputer using the Marvin software package. The independent
variables of this study were based on molecular descriptors calcu-lated from two software packages comprising E-Dragon andRECON.
E-Dragon is the electronic version of the popular Dragon soft-ware, which is an application for the calculation of moleculardescriptors spanning 20 categories and generating over 1666variables. Successful applications of Dragon descriptors havepreviously been demonstrated for modeling the inhibitory activityof aldose reductase enzyme by flavonoid derivatives [30], non-nucleoside inhibitors of HIV-1 reverse transcriptase [31], growthhormone secretagogue agonist activities of tetrahydroisoquinoline1-carboxamides [32], Pgp-ATPase interaction and rhodamine 123efflux inhibitory activities of propafenone analogs [33], and selec-tivity index of pentachlorophenol-imprinted polymer [34].
RECON is based on the quantum theory of atoms in molecules asdeveloped by Bader et al. [19]. The calculated descriptors are knownas transferable atom equivalent (TAE), which describes moleculesin terms of the electron densities, energies, and properties. Therobustness of RECON has previously been demonstrated elsewhere[21,35,36] as well as in our previous investigations [24,27]. It wasobserved that the charge-based descriptors generated from RECONwere suitable for such task as seen from the predictive performancein excess of r¼ 0.9.
Data pre-processing of the raw data was carried out in order toprepare it for further analysis by artificial neural network. Stan-dardization of the independent variables was performed accordingto Eq. (1). The descriptors were subjected to removal of redundantvariables using the RemoveUseless function in Weka and theUnsupervised Forward Selection (UFS) algorithm. UFS selects
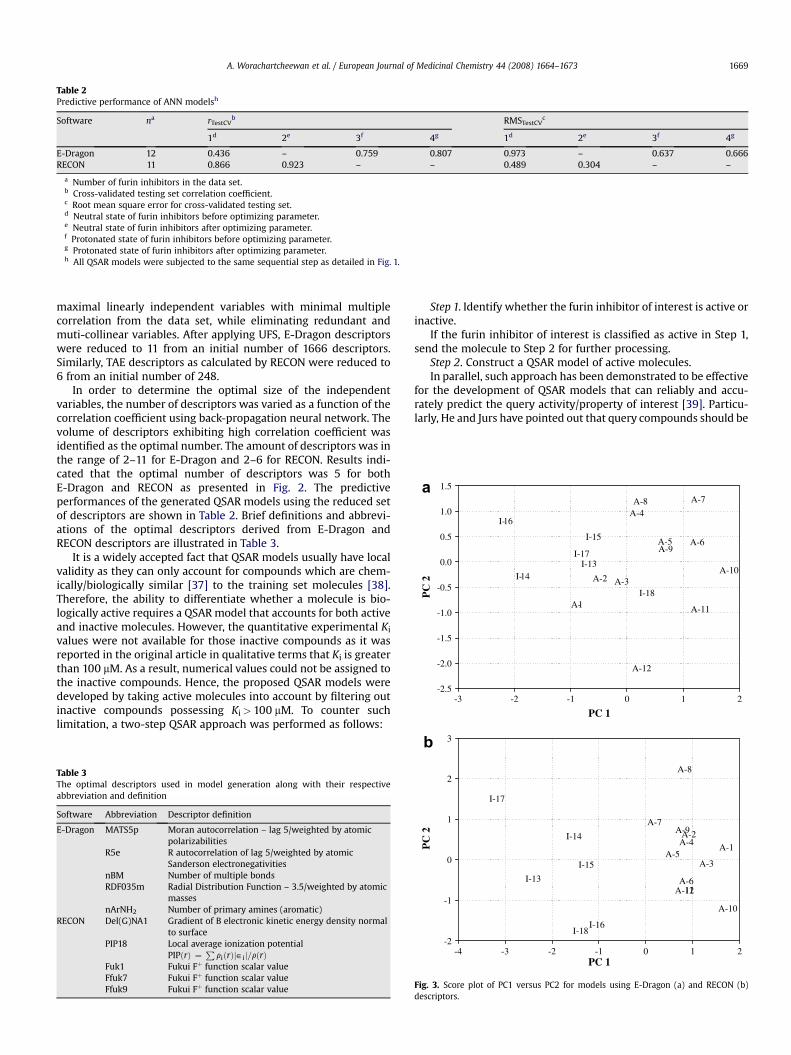
Table 2Predictive performance of ANN modelsh
Software na rTestCVb RMSTestCV
c
1d 2e 3f 4g 1d 2e 3f 4g
E-Dragon 12 0.436 – 0.759 0.807 0.973 – 0.637 0.666RECON 11 0.866 0.923 – – 0.489 0.304 – –
a Number of furin inhibitors in the data set.b Cross-validated testing set correlation coefficient.c Root mean square error for cross-validated testing set.d Neutral state of furin inhibitors before optimizing parameter.e Neutral state of furin inhibitors after optimizing parameter.f Protonated state of furin inhibitors before optimizing parameter.g Protonated state of furin inhibitors after optimizing parameter.h All QSAR models were subjected to the same sequential step as detailed in Fig. 1.
a
PC 1-3 -2 -1 0 1 2
PC
2
-2.5
-2.0
-1.5
-1.0
-0.5
0.0
0.5
1.0
1.5
A-1
A-2 A-3
A-4
A-5 A-6
A-7A-8
A-9
A-10
A-11
A-12
I-13I-14
I-15
I-16
I-17
I-18
A. Worachartcheewan et al. / European Journal of Medicinal Chemistry 44 (2008) 1664–1673 1669
maximal linearly independent variables with minimal multiplecorrelation from the data set, while eliminating redundant andmuti-collinear variables. After applying UFS, E-Dragon descriptorswere reduced to 11 from an initial number of 1666 descriptors.Similarly, TAE descriptors as calculated by RECON were reduced to6 from an initial number of 248.
In order to determine the optimal size of the independentvariables, the number of descriptors was varied as a function of thecorrelation coefficient using back-propagation neural network. Thevolume of descriptors exhibiting high correlation coefficient wasidentified as the optimal number. The amount of descriptors was inthe range of 2–11 for E-Dragon and 2–6 for RECON. Results indi-cated that the optimal number of descriptors was 5 for bothE-Dragon and RECON as presented in Fig. 2. The predictiveperformances of the generated QSAR models using the reduced setof descriptors are shown in Table 2. Brief definitions and abbrevi-ations of the optimal descriptors derived from E-Dragon andRECON descriptors are illustrated in Table 3.
It is a widely accepted fact that QSAR models usually have localvalidity as they can only account for compounds which are chem-ically/biologically similar [37] to the training set molecules [38].Therefore, the ability to differentiate whether a molecule is bio-logically active requires a QSAR model that accounts for both activeand inactive molecules. However, the quantitative experimental Ki
values were not available for those inactive compounds as it wasreported in the original article in qualitative terms that Ki is greaterthan 100 mM. As a result, numerical values could not be assigned tothe inactive compounds. Hence, the proposed QSAR models weredeveloped by taking active molecules into account by filtering outinactive compounds possessing Ki> 100 mM. To counter suchlimitation, a two-step QSAR approach was performed as follows:
Table 3The optimal descriptors used in model generation along with their respectiveabbreviation and definition
Software Abbreviation Descriptor definition
E-Dragon MATS5p Moran autocorrelation – lag 5/weighted by atomicpolarizabilities
R5e R autocorrelation of lag 5/weighted by atomicSanderson electronegativities
nBM Number of multiple bondsRDF035m Radial Distribution Function – 3.5/weighted by atomic
massesnArNH2 Number of primary amines (aromatic)
RECON Del(G)NA1 Gradient of B electronic kinetic energy density normalto surface
PIP18 Local average ionization potentialPIPðrÞ ¼
PriðrÞj˛ij=rðrÞ
Fuk1 Fukui Fþ function scalar valueFfuk7 Fukui Fþ function scalar valueFfuk9 Fukui Fþ function scalar value
Step 1. Identify whether the furin inhibitor of interest is active orinactive.
If the furin inhibitor of interest is classified as active in Step 1,send the molecule to Step 2 for further processing.
Step 2. Construct a QSAR model of active molecules.In parallel, such approach has been demonstrated to be effective
for the development of QSAR models that can reliably and accu-rately predict the query activity/property of interest [39]. Particu-larly, He and Jurs have pointed out that query compounds should be
b
PC 1-4 -3 -2 -1 0 1 2
PC
2
-2
-1
0
1
2
3
A-1
A-2
A-3
A-4A-5
A-6
A-7
A-8
A-9
A-10
A-12I-13
I-14
I-15
I-16
I-17
I-18
11
Fig. 3. Score plot of PC1 versus PC2 for models using E-Dragon (a) and RECON (b)descriptors.
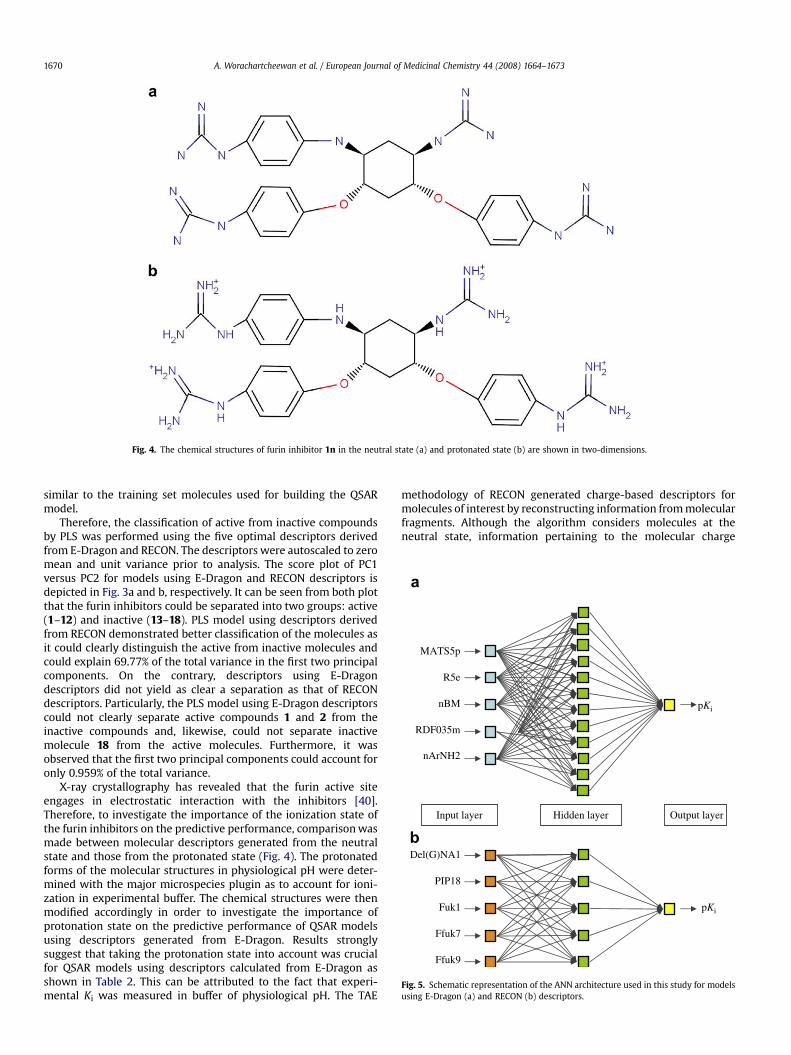
Fig. 4. The chemical structures of furin inhibitor 1n in the neutral state (a) and protonated state (b) are shown in two-dimensions.
Input layer
pKi
MATS5p
R5e
nBM
RDF035m
nArNH2
pKi
Del(G)NA1
PIP18
Fuk1
Ffuk7
Ffuk9
Hidden layer Output layer
a
b
Fig. 5. Schematic representation of the ANN architecture used in this study for modelsusing E-Dragon (a) and RECON (b) descriptors.
A. Worachartcheewan et al. / European Journal of Medicinal Chemistry 44 (2008) 1664–16731670
similar to the training set molecules used for building the QSARmodel.
Therefore, the classification of active from inactive compoundsby PLS was performed using the five optimal descriptors derivedfrom E-Dragon and RECON. The descriptors were autoscaled to zeromean and unit variance prior to analysis. The score plot of PC1versus PC2 for models using E-Dragon and RECON descriptors isdepicted in Fig. 3a and b, respectively. It can be seen from both plotthat the furin inhibitors could be separated into two groups: active(1–12) and inactive (13–18). PLS model using descriptors derivedfrom RECON demonstrated better classification of the molecules asit could clearly distinguish the active from inactive molecules andcould explain 69.77% of the total variance in the first two principalcomponents. On the contrary, descriptors using E-Dragondescriptors did not yield as clear a separation as that of RECONdescriptors. Particularly, the PLS model using E-Dragon descriptorscould not clearly separate active compounds 1 and 2 from theinactive compounds and, likewise, could not separate inactivemolecule 18 from the active molecules. Furthermore, it wasobserved that the first two principal components could account foronly 0.959% of the total variance.
X-ray crystallography has revealed that the furin active siteengages in electrostatic interaction with the inhibitors [40].Therefore, to investigate the importance of the ionization state ofthe furin inhibitors on the predictive performance, comparison wasmade between molecular descriptors generated from the neutralstate and those from the protonated state (Fig. 4). The protonatedforms of the molecular structures in physiological pH were deter-mined with the major microspecies plugin as to account for ioni-zation in experimental buffer. The chemical structures were thenmodified accordingly in order to investigate the importance ofprotonation state on the predictive performance of QSAR modelsusing descriptors generated from E-Dragon. Results stronglysuggest that taking the protonation state into account was crucialfor QSAR models using descriptors calculated from E-Dragon asshown in Table 2. This can be attributed to the fact that experi-mental Ki was measured in buffer of physiological pH. The TAE
methodology of RECON generated charge-based descriptors formolecules of interest by reconstructing information from molecularfragments. Although the algorithm considers molecules at theneutral state, information pertaining to the molecular charge
Number of nodes in hidden layer10 15 20 25
Cor
rela
tion
Coe
ffic
ient
(r)
.70
.72
.74
.76
.78
.80
Learning rate (η)
Learning epochs
0 1e+3 2e+3 3e+3 4e+3
Learning epochs
0 1e+3 2e+3 3e+3 4e+3
Cor
rela
tion
Coe
ffic
ient
(r)
0.0
.2
.4
.6
.8
1.0
.2
0.0
-.2
.6
.4
.8
.6
0.7525 0.7750
0.7508
0.7540 0.7995
0.7918
0.7064
0.7943
0.7925
0.4880
0.7876
0.7911
0.8068
0.7587
-0.0633
0.7701
0.7413
0.3096
-0.3803
0.3938
Number of nodes in hidden layer0 5 0 5 10 15 20 25
Cor
rela
tion
Coe
ffic
ient
(r)
.81
.82
.83
.84
.85
.86
.87
.88
Cor
rela
tion
Coe
ffic
ient
(r)
-.8
-.6
-.4
-.2
0.0
.2
.4
.6
.8
1.0
1.2
.6
.5
.4
.3
.8
.7
.9
0.0 .2 .4 .6 .8
Learning rate (η)0.0 .2 .4 .6 .8
Mom
entu
m (
μ)
0.0
.2
.4
.6
.8
Mom
entu
m (
μ)
0.0
.2
.4
.6
.8
0.9112 0.9179 0.8699 0.8187
0.9106 0.9101 0.8834 0.8767
0.9132 0.9120 0.8746 0.8033
0.9228 0.8806 0.6252
0.9191 0.8397 0.2638 0.2778
0.9122
optimaloptimal
optimal
optimal
optimal
optimal
a
c
b
fe
d
1
2
12
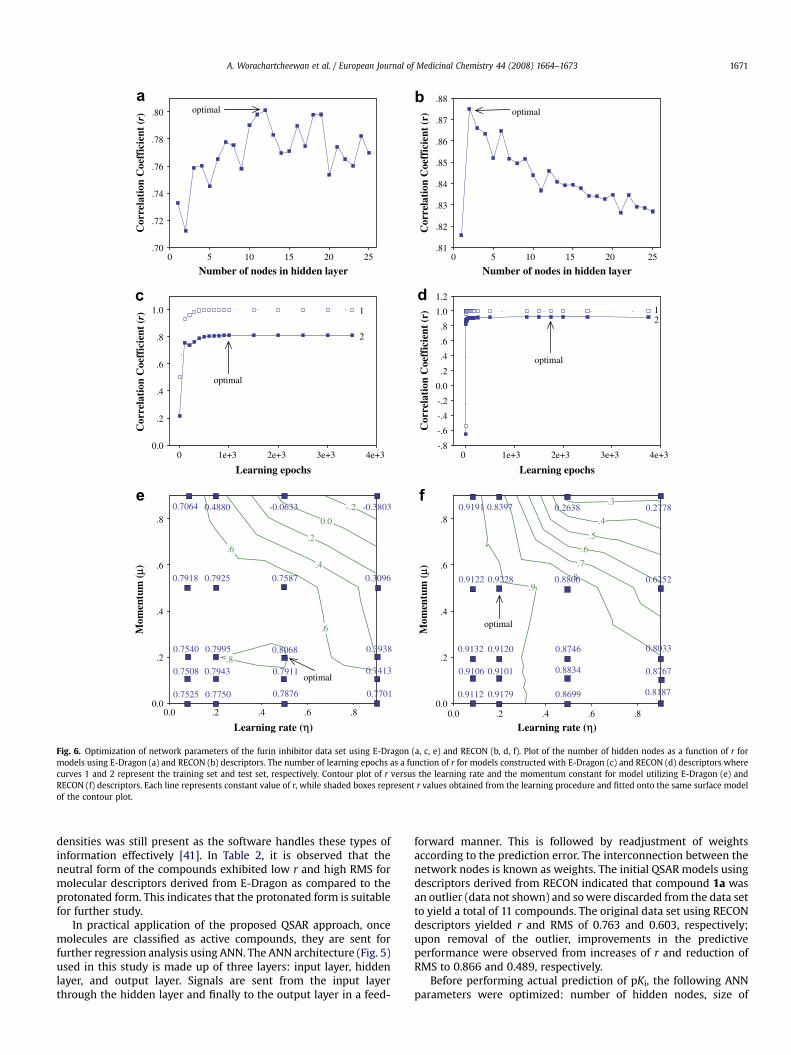
Fig. 6. Optimization of network parameters of the furin inhibitor data set using E-Dragon (a, c, e) and RECON (b, d, f). Plot of the number of hidden nodes as a function of r formodels using E-Dragon (a) and RECON (b) descriptors. The number of learning epochs as a function of r for models constructed with E-Dragon (c) and RECON (d) descriptors wherecurves 1 and 2 represent the training set and test set, respectively. Contour plot of r versus the learning rate and the momentum constant for model utilizing E-Dragon (e) andRECON (f) descriptors. Each line represents constant value of r, while shaded boxes represent r values obtained from the learning procedure and fitted onto the same surface modelof the contour plot.
A. Worachartcheewan et al. / European Journal of Medicinal Chemistry 44 (2008) 1664–1673 1671
densities was still present as the software handles these types ofinformation effectively [41]. In Table 2, it is observed that theneutral form of the compounds exhibited low r and high RMS formolecular descriptors derived from E-Dragon as compared to theprotonated form. This indicates that the protonated form is suitablefor further study.
In practical application of the proposed QSAR approach, oncemolecules are classified as active compounds, they are sent forfurther regression analysis using ANN. The ANN architecture (Fig. 5)used in this study is made up of three layers: input layer, hiddenlayer, and output layer. Signals are sent from the input layerthrough the hidden layer and finally to the output layer in a feed-
forward manner. This is followed by readjustment of weightsaccording to the prediction error. The interconnection between thenetwork nodes is known as weights. The initial QSAR models usingdescriptors derived from RECON indicated that compound 1a wasan outlier (data not shown) and so were discarded from the data setto yield a total of 11 compounds. The original data set using RECONdescriptors yielded r and RMS of 0.763 and 0.603, respectively;upon removal of the outlier, improvements in the predictiveperformance were observed from increases of r and reduction ofRMS to 0.866 and 0.489, respectively.
Before performing actual prediction of pKi, the following ANNparameters were optimized: number of hidden nodes, size of

Table 4Summary of the empirically derived optimal ANN parameters
Parameters E-Dragona RECONb
Number of descriptors 5 5Hidden node 12 2Number of learning epochs 1000 70 000Learning rate 0.5 0.2Momentum 0.2 0.5
a 12 Furin inhibitors in the data set for E-Dragon used in this study.b 11 Furin inhibitors in the data set for RECON used in this study.
Table 5The experimental and predicted pKi by ANNa
Compound pKi E-Dragon RECON
Predicted Residual Predicted Residual
1a 0.77 0.11 0.46 N/A N/A1b 1.05 1.34 0.29 0.94 �0.111c 0.39 0.91 0.52 0.50 0.111d 1.66 1.66 0.00 1.81 0.151e 2.22 1.45 �0.77 1.76 �0.461f 1.16 1.63 0.47 1.72 0.561g 1.92 3.14 1.22 2.13 0.211i 1.38 1.98 0.60 1.16 �0.221n 1.34 1.15 �0.19 1.68 0.341o 0.37 �0.81 �1.18 0.27 �0.101p 0.09 0.46 0.37 �0.25 �0.341q �0.25 �0.82 �0.57 0.09 0.34
Note: NA denotes not available.a 12 and 11 furin inhibitors were present in the data sets modeled with E-Dragon
and RECON, respectively.
A. Worachartcheewan et al. / European Journal of Medicinal Chemistry 44 (2008) 1664–16731672
learning epoch, learning rate and momentum. Correlation coeffi-cient was used as a measure of the predictive performance,therefore, parameters giving high r were selected as optimal. Thenumber of hidden nodes was varied from 1 to 25 for E-Dragon(Fig. 6a) and RECON descriptors (Fig. 6b). Next, the learning epochsize was tested from 1 to 3500 and 1 to 150 000 for models using E-Dragon (Fig. 6c) and RECON descriptors (Fig. 6d), respectively.Finally, the learning rate and momentum were adjusted from 0 to 1at steps of 0.1 for E-Dragon (Fig. 6e) and RECON (Fig. 6f) descriptors.The optimal parameters as derived from the empirical search aresummarized in Table 4 and used for actual prediction. Each run ofnetwork training begins with random initialization of weights to
Experimental pKi
-2 -1 0 1 2 3 4
Pre
dict
ed p
Ki
-2
-1
0
1
2
3
4
r = 0.807
a b
Fig. 7. Plot of the predicted versus the experimental inhibition constant (pKi) for the trainvalidated test set (-; regression line is represented as a solid line) of models developed w
obtain a reliable calculation of the predicted outputs as derivedfrom the average of 10 runs of network training.
The experimental and predicted activities along with theirrespective residuals are listed in Table 5. Comparisons of theexperimental values in relation to the predicted ones are repre-sented in Table 2 and Fig. 7. Results suggest that QSAR modelscomputed using RECON descriptors outperformed those of E-Dragon descriptors as observed from leave-one-out cross-validatedr of 0.923 and 0.807 together with RMS of 0.304 and 0.666,respectively. The stellar performance of RECON over that of E-Dragon could be ascribed to the fact that RECON provided a betterrepresentation of the charge properties of the compounds thanthose given by E-Dragon. This notion coincides with the reportedfindings by Jiao and co-workers [12] that the molecular interactionsof the inhibitors with the furin active site are essentially electro-static. The optimal descriptors derived from RECON werecomprised of Del(G)NA1, PIP18, Fuk1, Ffuk7, and Ffuk9, which are allbased on the electronic charge properties of molecules. The fiveoptimal descriptors derived from E-Dragon comprise of (i) 2D-Autocorrelation indices (MATS5p), (ii) GETAWAY descriptor (R5e)(iii) Constitutional descriptor (nBM), (iv) RDF descriptor(RDF035m), and (v) functional group (nArNH2). Two of thedescriptors, MATS5p and R5e, describe the electronic properties ofthe molecules, particularly in terms of the atomic polarizability andelectronegativity.
4. Conclusion
We have demonstrated the application of artificial neuralnetwork for predicting the inhibition of furin-dependent process-ing of anthrax protective antigen by furin inhibitors. It was foundthat the electronic charge properties were crucial for the predictionas observed from the importance of protonation state on thepredictive performance of QSAR models using descriptors derivedfrom E-Dragon. Descriptor derived from RECON was demonstratedto be far more superior to those using E-Dragon descriptors. Thisstudy has explored the use of PLS and ANN as efficient methodol-ogies for classifying and predicting the biological activity of furininhibitors. Therefore, it could be applied as robust tools for thecomputational design of novel furin inhibitor candidates possess-ing high bioactivity for future development as therapeuticcompounds for furin-dependent diseases.
Experimental pKi
Pre
dict
ed p
Ki
-.5 0.0 .5 1.0 1.5 2.0 2.5-.5
0.0
.5
1.0
1.5
2.0
2.5
r = 0.923
ing set (,; regression line is represented as dotted line) and the leave-one-out cross-ith E-Dragon (a) and RECON (b) descriptors.
A. Worachartcheewan et al. / European Journal of Medicinal Chemistry 44 (2008) 1664–1673 1673
Acknowledgements
The authors gratefully acknowledge financial support from theYoung Scholars Research Fellowship (No. MRG5080450) of theThailand Research Fund and the governmental budget of MahidolUniversity (B.E. 2551).
References
[1] M. Mock, A. Fouet, Annu. Rev. Microbiol. 55 (2001) 647–671.[2] T.C. Dixon, M. Meselson, J. Guillemin, P.C. Hanna, N. Engl. J. Med. 341 (1999)
815–826.[3] D.J. Banks, S.C. Ward, K.A. Bradley, Expert Rev. Mol. Med. 8 (2006) 1–18.[4] J.A. Young, R.J. Collier, Annu. Rev. Biochem. 76 (2007) 243–265.[5] F. Brossier, M. Mock, Toxicon 39 (2001) 1747–1755.[6] P. Ascenzi, P. Visca, G. Ippolito, A. Spallarossa, M. Bolognesi, C. Montecucco,
FEBS Lett. 531 (2002) 384–388.[7] F. Jean, K. Stella, L. Thomas, G. Liu, Y. Xiang, A.J. Reason, G. Thomas, Proc. Natl.
Acad. Sci. U.S.A. 95 (1998) 7293–7298.[8] M.S. Sarac, J.R. Peinado, S.H. Leppla, I. Lindberg, Infect. Immun. 72 (2004) 602–
605.[9] Z.X. Liu, H. Fei, C.W. Chi, FEBS Lett. 556 (2004) 116–120.
[10] T. Komiyama, R.S. Fuller, Biochemistry 39 (2000) 15156–15165.[11] G. Bolt, I.R. Pedersen, Virology 252 (1998) 387–398.[12] G.S. Jiao, L. Cregar, J. Wang, S.Z. Millis, C. Tang, S. O’Malley, A.T. Johnson,
S. Sareth, J. Larson, G. Thomas, Proc. Natl. Acad. Sci. U.S.A. 103 (2006) 19707–19712.
[13] ChemAxon Ltd., Marvin, Version 3.5.4, Budapest, Hungary.[14] Milano Chemometrics and QSAR Research Group, E-Dragon, Version 1.0, Italy.[15] Rensselaer Polytechnic Institute, RECON, Version 5.5, New York, USA.[16] I.V. Tetko, J. Gasteiger, R. Todeschini, A. Mauri, D. Livingstone, P. Ertl,
V.A. Palyulin, E.V. Radchenko, N.S. Zefirov, A.S. Makarenko, V.Y. Tanchuk,V.V. Prokopenko, J. Comput. Aided Mol. Des. 19 (2005) 453–463.
[17] R. Todeschini, V. Consonni, R. Mannhold, H. Kubinyi, H. Timmerman, Hand-book of Molecular Descriptors, Wiley-VCH, Weinheim, 2000.
[18] C.M. Brenemen, M. Rhem, J. Comput. Chem. 18 (1997) 182–197.[19] R.F.W. Bader, S.G. Anderson, A.J. Duke, J. Am. Chem. Soc. 101 (1979) 1389–1395.
[20] C.M. Breneman, C.M. Sundling, N. Sukumar, L. Shen, W.P. Katt, M.J. Embrechts,J. Comput. Aided Mol. Des. 17 (2003) 231–240.
[21] C.B. Mazza, K. Rege, C.M. Breneman, N. Sukumar, J.S. Dordick, S.M. Cramer,Biotechnol. Bioeng. 80 (2002) 60–72.
[22] I.H. Witten, E. Frank, Data Mining: Practical Machine Learning Tools andTechniques, second ed. Morgan Kaufmann, San Francisco, 2005.
[23] D.C. Whitley, M.G. Ford, D.J. Livingstone, J. Chem. Inf. Comput. Sci. 40 (2000)1160–1168.
[24] C. Nantasenamat, T. Naenna, C. Isarankura Na Ayudhya, V. Prachayasittikul, J.Comput. Aided Mol. Des. 19 (2005) 509–524.
[25] Camo Software AS, The Unscrambler, Version 9.6, Norway.[26] D.M. Haaland, E.V. Thomas, Anal. Chem. 60 (1988) 1193–1202.[27] C. Nantasenamat, C. Isarankura-Na-Ayudhya, T. Naenna, V. Prachayasittikul,
Biosens. Bioelectron. 22 (2007) 3309–3317.[28] C. Nantasenamat, C. Isarankura-Na-Ayudhya, N. Tansila, T. Naenna,
V. Prachayasittikul, J. Comput. Chem. 28 (2007) 1275–1289.[29] J. Zupan, J. Gasteiger, Neural Networks in Chemistry and Drug Design, second
ed, Wiley-VCH, Weinheim, 1999.[30] M. Fernandez, J. Caballero, A.M. Helguera, E.A. Castro, M.P. Gonzalez, Bioorg.
Med. Chem. 13 (2005) 3269–3277.[31] P.R. Duchowicz, M. Fernandez, J. Caballero, E.A. Castro, F.M. Fernandez, Bioorg.
Med. Chem. 14 (2006) 5876–5889.[32] J. Caballero, F.M. Zampini, S. Collina, M. Fernandez, Chem. Biol. Drug Des. 69
(2007) 48–55.[33] V. Tantishaiyakul, W. Wongpuwarak, J. Mol. Struct. (Theochem) 718 (2005)
183–189.[34] C. Nantasenamat, T. Tantimongcolwat, T. Naenna, C. Isarankura Na Ayudhya,
V. Prachayasittikul, Excli J. 5 (2006) 150–163.[35] J.S. Murray, P. Politzer, G.R. Famini, J. Mol. Struct. (Theochem) 454 (1998) 299–
306.[36] B.K. Lavine, C.E. Davidson, C. Breneman, W. Katt, J. Chem. Inf. Comput. Sci. 43
(2003) 1890–1905.[37] L. Eriksson, E. Johansson, M. Muller, S. Wold, J. Chemometr. 14 (2000) 599–616.[38] R. Guha, P.C. Jurs, J. Chem. Inf. Model. 45 (2005) 65–73.[39] L. He, P.C. Jurs, J. Mol. Graphics Model. 23 (2005) 503–523.[40] S. Henrich, A. Cameron, G.P. Bourenkov, R. Kiefersauer, R. Huber, I. Lindberg,
W. Bode, M.E. Than, Nat. Struct. Biol. 10 (2003) 520–526.[41] C.M. Breneman, T.R. Thomson, M. Rhem, M. Dung, Comput. Chem. 19 (1995)
161–179.
Related Documents