Modeling Parallel Scientific Applications through their Input/Output Phases Sandra M´ endez, Dolores Rexachs and Emilio Luque Computer Architecture and Operating Systems Department (CAOS) Universitat Aut` onoma de Barcelona Barcelona, Spain {sandra.mendez,dolores.rexachs,emilio.luque}@uab.es Abstract—The increase in computational power in processing units and the complexity of scientific applications that use high performance computing require more efficient Input/Output (I/O) systems. To use the I/O systems more efficiently it is necessary to know its performance capacity to determine if it fulfills applications’ I/O requirements. Evaluating the I/O system performance capacity is difficult due to the diversity of I/O architectures and the complexity of its I/O software stack. Furthermore, parallel scientific applications have different be- havior depending on their access patterns. Then, it is necessary to have some method to evaluate the I/O subsystem capacity taking into account the applications access patterns without executing the application in each I/O subsystem. Here, we propose a methodology to evaluate the I/O subsys- tem performance capacity through an I/O model of the parallel application independent of the I/O subsystem. This I/O model is composed of I/O phases representing ”where” and ”when” the I/O operations are performed into application logic. This approach encompasses the I/O subsystem evaluation at I/O library level for the application I/O model. The I/O phases are replicated by benchmark IOR which is executed in the target subsystem. This approach was used to estimate the I/O time of an application in different subsystems. The results show an relative error of estimation lower than 10%. This approach was also utilized to select the I/O subsystem that provide less I/O time for the application. Keywords-Parallel I/O System, Application I/O model, I/O phases, I/O configuration I. I NTRODUCTION Due to the historical “gap“ between the computing and Input/Output (I/O) performance, the I/O system is, in many cases, the bottleneck in parallel systems. Increasing com- putational power of processing units and the complexity of scientific applications that use high performance computing require more efficient Input/Output systems. In order to hide the ”gap” and to efficiently use the I/O, it is necessary to identify the I/O factors with the biggest effect on perfor- mance. The I/O factors depend on the I/O architecture and I/O software stack, however the application performance will depend on its access pattern. The architecture and software of the I/O subsystem are chosen by system administrators. The system administrator or designer has the difficulty either to select components of the I/O subsystem (JBOD, RAID level, filesystem, inter- connection network, among other factors) or to choose from different connection models (DAS, SAN, NAS, NASD) with different parameters to configure (redundancy level, stripe, among others). The computer clusters are built to provide parallel computing to several application. These application have different I/O requirements and the same I/O system is not always appropriate for all applications. Programmers can modify their programs to efficiently manage I/O operations, but they need to know the I/O system, especially the I/O software stack. The system administrators and programmers need in- formation to answer the following questions, When is it convenient to use a parallel or distributed file system? When is it convenient to use I/O nodes for management the Input/Output? When is it convenient to use RAID or single disks? When is it convenient to use local storage or remote storage? Users need informationa to answer questions as: Is the I/O subsystem a problem for the access patterns of the application? How much I/O subsystem capacity is being used by the application? How the application access pattern is done in a target subsystem? Therefore, a model of the I/O of the application and subsystem that can be used to compare and choose the appropriate I/O subsystem for the particular access patterns of the application is needed. In this context to address this, we define an I/O abstract model of scientific applications to support the evaluation, design and selection of different I/O configurations. We have implemented a tracing tool for extracting ”I/O patterns”, and based on these patterns, we have defined the concept of ”I/O phase” of parallel scientific applications. These I/O phases are key for defining an I/O behavioral model of parallel scientific applications. This model is used to analyze and select an I/O subsystem for the application. In this paper, we focus on describing the I/O abstract model of the application. We have extracted the I/O model of several applications in a system and we have tested its independence by testing it in two computer clusters. We also have applied this model to predict the I/O behavior of an application in two different computer cluster obtaining an error time prediction lower than 10%. This article is organized as follows: in Section II we 2012 IEEE International Conference on Cluster Computing Workshops 978-0-7695-4844-9/12 $26.00 © 2012 IEEE DOI 10.1109/ClusterW.2012.37 7

Welcome message from author
This document is posted to help you gain knowledge. Please leave a comment to let me know what you think about it! Share it to your friends and learn new things together.
Transcript
Modeling Parallel Scientific Applications through their Input/Output Phases
Sandra Mendez, Dolores Rexachs and Emilio Luque
Computer Architecture and Operating Systems Department (CAOS)
Universitat Autonoma de Barcelona
Barcelona, Spain
{sandra.mendez,dolores.rexachs,emilio.luque}@uab.es
Abstract—The increase in computational power in processingunits and the complexity of scientific applications that use highperformance computing require more efficient Input/Output(I/O) systems. To use the I/O systems more efficiently it isnecessary to know its performance capacity to determine ifit fulfills applications’ I/O requirements. Evaluating the I/Osystem performance capacity is difficult due to the diversity ofI/O architectures and the complexity of its I/O software stack.Furthermore, parallel scientific applications have different be-havior depending on their access patterns. Then, it is necessaryto have some method to evaluate the I/O subsystem capacitytaking into account the applications access patterns withoutexecuting the application in each I/O subsystem.
Here, we propose a methodology to evaluate the I/O subsys-tem performance capacity through an I/O model of the parallelapplication independent of the I/O subsystem. This I/O modelis composed of I/O phases representing ”where” and ”when”the I/O operations are performed into application logic.
This approach encompasses the I/O subsystem evaluation atI/O library level for the application I/O model. The I/O phasesare replicated by benchmark IOR which is executed in thetarget subsystem. This approach was used to estimate the I/Otime of an application in different subsystems. The results showan relative error of estimation lower than 10%. This approachwas also utilized to select the I/O subsystem that provide lessI/O time for the application.
Keywords-Parallel I/O System, Application I/O model, I/Ophases, I/O configuration
I. INTRODUCTION
Due to the historical “gap“ between the computing and
Input/Output (I/O) performance, the I/O system is, in many
cases, the bottleneck in parallel systems. Increasing com-
putational power of processing units and the complexity of
scientific applications that use high performance computing
require more efficient Input/Output systems. In order to hide
the ”gap” and to efficiently use the I/O, it is necessary to
identify the I/O factors with the biggest effect on perfor-
mance. The I/O factors depend on the I/O architecture and
I/O software stack, however the application performance will
depend on its access pattern.
The architecture and software of the I/O subsystem are
chosen by system administrators. The system administrator
or designer has the difficulty either to select components
of the I/O subsystem (JBOD, RAID level, filesystem, inter-
connection network, among other factors) or to choose from
different connection models (DAS, SAN, NAS, NASD) with
different parameters to configure (redundancy level, stripe,
among others). The computer clusters are built to provide
parallel computing to several application. These application
have different I/O requirements and the same I/O system is
not always appropriate for all applications. Programmers can
modify their programs to efficiently manage I/O operations,
but they need to know the I/O system, especially the I/O
software stack.
The system administrators and programmers need in-
formation to answer the following questions, When is it
convenient to use a parallel or distributed file system?
When is it convenient to use I/O nodes for management the
Input/Output? When is it convenient to use RAID or single
disks? When is it convenient to use local storage or remote
storage?
Users need informationa to answer questions as: Is the
I/O subsystem a problem for the access patterns of the
application? How much I/O subsystem capacity is being
used by the application? How the application access pattern
is done in a target subsystem?
Therefore, a model of the I/O of the application and
subsystem that can be used to compare and choose the
appropriate I/O subsystem for the particular access patterns
of the application is needed. In this context to address this,
we define an I/O abstract model of scientific applications
to support the evaluation, design and selection of different
I/O configurations. We have implemented a tracing tool for
extracting ”I/O patterns”, and based on these patterns, we
have defined the concept of ”I/O phase” of parallel scientific
applications. These I/O phases are key for defining an I/O
behavioral model of parallel scientific applications. This
model is used to analyze and select an I/O subsystem for
the application.
In this paper, we focus on describing the I/O abstract
model of the application. We have extracted the I/O model
of several applications in a system and we have tested its
independence by testing it in two computer clusters. We also
have applied this model to predict the I/O behavior of an
application in two different computer cluster obtaining an
error time prediction lower than 10%.
This article is organized as follows: in Section II we
2012 IEEE International Conference on Cluster Computing Workshops
978-0-7695-4844-9/12 $26.00 © 2012 IEEE
DOI 10.1109/ClusterW.2012.37
7

review the related work, Section III introduces our proposed
methodology. In Section IV we review the experimental
validation. Finally, we present our conclusions and future
work.
II. RELATED WORK
Application performance depends on access patterns and
the I/O system configuration. There are several tracing tools
to I/O operations of parallel applications, although most of
them are not available for external users. These tools can
help to identify application behavior.
Kim et. al. [1] presents a tracing tool for I/O software
stack which has been applied to PVFS2 and MPI-IO. They
provide a tracing tool which extracts I/O metrics through
the automatic instrumentation of source code of applications.
The user must select the appropriate metric and determine
that portion of code to trace.
Carns [2] presented the Darshan tracing tool for the
I/O workloads characterization of the petascale. Darshan
is designed to capture an accurate picture of the applica-
tion I/O behavior, including properties such as patterns of
access within files, with minimum overhead. Furthermore,
in [3], Carns presented a multilevel application I/O study
and a methodology for system-wide, continuous, scalable
I/O characterization that combines storage device instru-
mentation, static filesystem analysis, and a new mechanism
for capturing detailed application-level behavior. We have
utilized Darshan in the beginning of our research. However,
we decided to change to PAS2P [4] tracing tool due to it
was more appropriate to identify the I/O phases of parallel
application. We have extended PAS2P tool to trace MPI-IO
routines, of MPI2 standard [5], through an instrumentation
automatic that interposes to MPI-IO functions.
Nakka et. al. [6] presented a trace tool to extract MPI-IO
operations from very large applications running at full scale
in production systems. This trace tool is specific to their
system.
Byna et. al. [7] used I/O signatures for parallel I/O
prefetching. They presented a classification of I/O patterns
for parallel application, I/O signatures at local process level
and applying of signature to prefetching technical. We use
their propose to identify access patterns. However, we have
identified the global access pattern because we need the I/O
for the parallel application. From local access patterns and
by similarity, we have defined the global access pattern, then
global access patterns are divided in the I/O phases.
H. Shan and J. Shalf [8] have used IOR to mimic the I/O
pattern of parallel scientific applications. Also, they used this
mimic to predict the performance for the application. We
have used IOR to represent the I/O abstract model of the
application. The I/O model is represented by an I/O phases
sequence and IOR is applied to each I/O phases. In this
way, we only focus in time where the application does I/O
operations.
Table ISUMMARY OF NOTATION
Notation Descriptionapp parallel application ;np number of processes of parallel application ;traceF ile(p) tracing file of pth process;
nF number of files in the parallel application ;idP MPI Process identifier;idF File identifier (0 < idF < nF ) ;initOffset initial offset for the operation (in Bytes);disp Displacement in a position relative of the file
(in Bytes) ;rs request size for the operation (in Bytes);rep number of repetitions of an access pattern;tick Logical time unit;LAP local access patternLAPfile(p) local access pattern file for the pth process
weight(ph) weight of phase ph= {rep(simLAP ) ∗ rs(simLAP )}
simLAP similar local access patternwhere the initOffset can be different
phase = {idPH, idF,weight(ph), f(initOffset)}f(initOffset) a mathematical expression in function of initial
offset
Most of these researchers are aimed at supercomputers,
while our strategy is focused on computer clusters. Also,
these researchers have been focused in the analyze the
application executing. However, the main difference is that
our methodology is focused on obtain an I/O abstract model
of scientific application that we can apply in different I/O
systems without that the application is executed in the target
I/O subsystem.
III. PROPOSED METHODOLOGY
The proposed methodology is composed of three stages:
Characterization, I/O analysis and Evaluation. Next, we
explain each stage.
A. Characterization
The characterization is applied to the I/O subsystem and
parallel scientific application. This stage has two objectives:
i) Identifying the different I/O configurations of the I/O
subsystem; and ii) Extracting the I/O model of application.
These activities are independent. The characterization of
application is done off-line and the application I/O model
can be applied to analyze different target systems.1) Scientific Application: The I/O model of application
is defined by three characteristics: metadata, spatial global
pattern and temporal global pattern. We characterize the
application off-line and once at I/O library level because it
provides us two important benefits. First, to obtain a model
of the application’s I/O independent from the execution en-
vironment, i.e. the computer cluster. Second, to evaluate the
behavior of the application with different I/O configurations,
avoiding the overhead of the tracing tool. The I/O model of
application is expressed by I/O phases, where an I/O phase is
a repetitive sequence of same pattern on a file for a number
of processes of the parallel application.
8

Figure 1. Extracting I/O abstract model of application
Figure 2. Traces File (TraceF ile)
The notation utilized to explain the extraction of I/O
abstract model is shown in Table I. The methodology to
extract I/O abstract model of application is presented in
Figure 1.
The format of traces file is presented in Figure 2.
A logical time unit named tick (bold in the Figure 2)
is used to order the communication and I/O events of
MPI. In this case, we only show one I/O operation type
MPI File write at all.
Access local pattern is obtained from traces file for each
process MPI. Figure 3 shows the format for the access
patterns. Each line in Figure 3 is obtained taking into account
the similarity of I/O operation parameters and the tick. For
example, the first line in bold in Figure 3 means that the pro-
cess 0 has done 40 writing operations with the same request
size (10612080 bytes), displacement (10612080 bytes) and
initial offset 0 in its file view, next, the line second for the
process 0 shows 40 reading operations with same parameters
as writing operations. We can observe this behavior in the
four processes of the application. These access patterns
allows us to identify the I/O similar operations and the order
of occurrence for each process.
Furthermore, we need obtain the global behavior of the
application. We define the concept of I/O phase to express
the global behavior. We use the tick and local access pattern
to define the I/O phases. Figure 4 shows the I/O phases for
the example. Phase 1 is composed for the four processes MPI
Figure 3. Access Patterns (LAP )
Figure 4. I/O Phases (phase)
with similar access pattern simLAP and similar tick. This
phase has weight = 40MB. Phase 2 is similar to Phase
1 that occurs past 122 tick of Phase 1. The difference is
the offset that is calculated with the displacement disp and
the initOffset. We identify f(initOffset) to express the
initOffset of each process and this function is used in the
I/O abstract model of the application.
Global access pattern is obtained from I/O phases of npprocesses for the application app for each nF files.
Spatial global pattern is represented by the
f(initOffset), displacement, and request size. Temporal
global pattern is represented by the tick and the local
access patterns LAP . Due to that LAP was ordered by
ticks we also can obtain the temporarily of LAP in each
process and the ordering of LAP for the np processes.
An I/O phase is one part of Global access pattern, where
LAP are similar. LAP are similar if LAP has the similar
value for a number of processes of app, except to initialOffset because each process usually works in different part
of file to take advantage of parallel I/O. The significance of
an I/O phase in the application is valued through its weight.The weight of a phase depends on repetitions of operations
rep, number of processes in the phase, and request size rs.
Figure 5 shows an I/O model of the example, where
the global access pattern is shown through its spatial local
pattern, spatial global pattern, temporal local pattern, and
temporal global pattern. Also, we show the global access
pattern in three dimensional space, where file Offset indicates
the position where the process ”p” is accessing in the logical
time tick with a request size rs. In the global access pattern,
9

Figure 5. I/O abstract model example for 4 processes
first red dot of the four processes represent the Phase 1, the
second red dot represent Phase 2 and so on to Phase 40.
Next, the four processes do 40 reading operations in a phase
(blue in Figure 5). We have considered a phase of reading
operations because there are not other MPI events between
the reading operations. Due to this Phase 41 is similar to a
vertical blue line.
Furthermore, in the extracting of local access patterns, we
also consider the meta-data of each file of the application
because this allows us to define the different logical views
of the files and it obtains the logical global view of the
file for the processes of application. For the example, we
have identified that the access mode is ”strided” because
the application uses MPI File set view for the four
processes. Therefore, the offset for each process is about its
logical view. For example, we can observe in spatial pattern
of Figure 5, where in Phase 1 (#1) each process writes a
portion of the file (blue boxes), in Phase 2 (#2) each process
writes in the position offset + disp but this is in the file
logical view of each process for this reason we can observe
a strided access in the spatial access pattern.
2) I/O System: The I/O subsystem is structured as a hier-
archical scheme to give ordering to the evaluation process.
Table II shows the notation used in this stage.
In the I/O system characterization, we apply the following
steps:
• Identifying I/O configurations: In this step we identify
the I/O subsystem configurations. An I/O configuration
depends on number and type of filesystem (local,
distributed and parallel), number and type of network
(dedicated use and shared with the computing), state
and placement of buffer/cache, number of I/O devices,
I/O devices organization (RAID level, JBOD), and
number and placement of I/O node.
• Setting input parameters for the Benchmarks: IOR [9]
is applied at I/O library level and Global Filesystem
Table IINOTATIONS FOR THE I/O BENCHMARKS
Notation DescriptionFZ File Size: size of file to test.
minimumsize = 2 ∗RAMsize, RAM sizeof node where the benchmark will be executed;
RS Request Size. RS can be from KB to GBdepending on file size and transfer rate;
IOP Input/Output operations type.value = write, read,meta− oper;
#IOP Number of I/O operations
= FZRS
;
NP Number of Processes that will do the IOP ;AM Access Mode: Form of access to a file.
V alue = sequential, strided, random;AT Access Type: Number of file per process.
V alue = shared, unique, where shared isone file for all processes, unique isone file per process;
CIO Collective I/O;
Table IIIINPUT PARAMETERS FOR THE IOR
Parameters Parameters Values
FZ NP ∗s∗b; where −s IntegerNumber sets thenumber of segments and −b Number(k,m, g)sets contiguous bytes to write per process.
RS −t Number(k,m, g); where −t sets the re-quest size.
NP mpirun −n NP −a MPIIO setsthe API to MPIIO mode for NPprocesses. The API for I/O can be[POSIX|MPIIO|HDF5|NCMPI]
AM Default to Sequential, Not Working toStrided, −z to Random
AT Default to Shared , −F to UniqueIOT Default without collective I/O, −c to enable
collective I/O.
level. IOzone [10] is applied at I/O devices on local
filesystem. Parameters values are selected according
to the characteristics of the configurations identified.
We have selected different parameters of IOR and
IOzone for our methodology. Table III shows selected
parameters to IOR.
Table IV shows selected parameters to IOzone. Where
ION is I/O Node, CN is Computing Node.
• Selecting output for the Benchmarks: Output param-
eters depend on I/O requirements. The metrics are
the I/O time, number of operations, transfer rate, and
latency. Each benchmark has different options to select
metrics. Table V shows outputs for the two benchmarks.
Table IVINPUT PARAMETERS FOR THE IOZONE
Parameters Parameters Values
FZ −s FZ where −s sets the file size to FZ.RS −y RS sets Minimum request Size to RS.AM −i 0 −i 1 to Sequential, −i 0 −i 5 to Strided
and−j # Set stride of file accesses to (#∗RS),−i 0 −i 2 to Random.
AT Default to Shared , −F to Unique
10
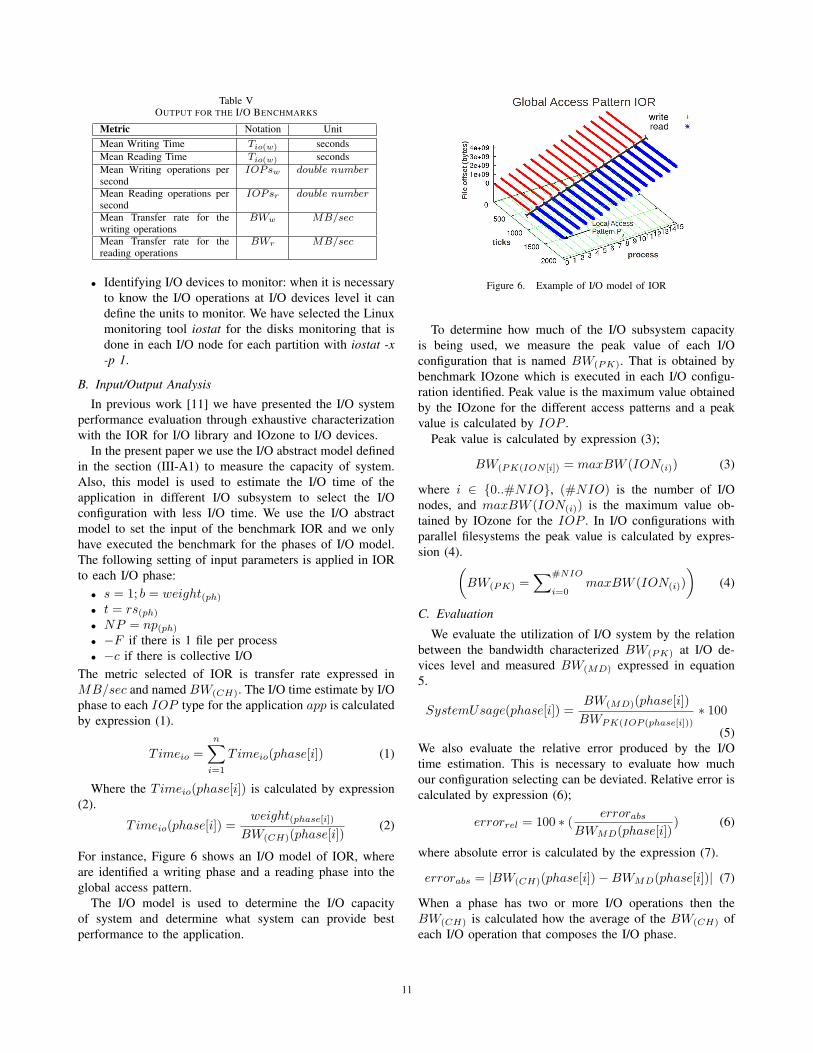
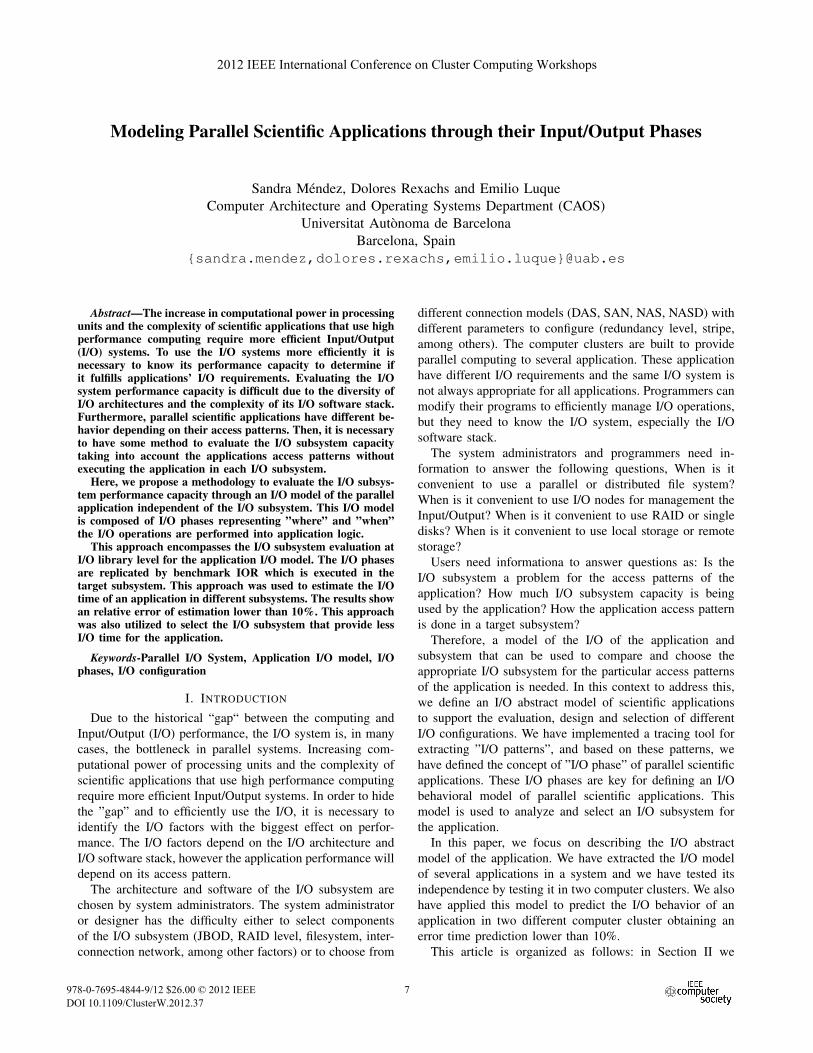
Table VOUTPUT FOR THE I/O BENCHMARKS
Metric Notation Unit
Mean Writing Time Tio(w) seconds
Mean Reading Time Tio(w) seconds
Mean Writing operations persecond
IOPsw double number
Mean Reading operations persecond
IOPsr double number
Mean Transfer rate for thewriting operations
BWw MB/sec
Mean Transfer rate for thereading operations
BWr MB/sec
• Identifying I/O devices to monitor: when it is necessary
to know the I/O operations at I/O devices level it can
define the units to monitor. We have selected the Linux
monitoring tool iostat for the disks monitoring that is
done in each I/O node for each partition with iostat -x-p 1.
B. Input/Output Analysis
In previous work [11] we have presented the I/O system
performance evaluation through exhaustive characterization
with the IOR for I/O library and IOzone to I/O devices.
In the present paper we use the I/O abstract model defined
in the section (III-A1) to measure the capacity of system.
Also, this model is used to estimate the I/O time of the
application in different I/O subsystem to select the I/O
configuration with less I/O time. We use the I/O abstract
model to set the input of the benchmark IOR and we only
have executed the benchmark for the phases of I/O model.
The following setting of input parameters is applied in IOR
to each I/O phase:
• s = 1; b = weight(ph)• t = rs(ph)• NP = np(ph)• −F if there is 1 file per process
• −c if there is collective I/O
The metric selected of IOR is transfer rate expressed in
MB/sec and named BW(CH). The I/O time estimate by I/O
phase to each IOP type for the application app is calculated
by expression (1).
T imeio =n∑
i=1
T imeio(phase[i]) (1)
Where the T imeio(phase[i]) is calculated by expression
(2).
T imeio(phase[i]) =weight(phase[i])
BW(CH)(phase[i])(2)
For instance, Figure 6 shows an I/O model of IOR, where
are identified a writing phase and a reading phase into the
global access pattern.
The I/O model is used to determine the I/O capacity
of system and determine what system can provide best
performance to the application.
Figure 6. Example of I/O model of IOR
To determine how much of the I/O subsystem capacity
is being used, we measure the peak value of each I/O
configuration that is named BW(PK). That is obtained by
benchmark IOzone which is executed in each I/O configu-
ration identified. Peak value is the maximum value obtained
by the IOzone for the different access patterns and a peak
value is calculated by IOP .
Peak value is calculated by expression (3);
BW(PK(ION [i]) = maxBW (ION(i)) (3)
where i ∈ {0..#NIO}, (#NIO) is the number of I/O
nodes, and maxBW (ION(i)) is the maximum value ob-
tained by IOzone for the IOP . In I/O configurations with
parallel filesystems the peak value is calculated by expres-
sion (4).(BW(PK) =
∑#NIO
i=0maxBW (ION(i))
)(4)
C. Evaluation
We evaluate the utilization of I/O system by the relation
between the bandwidth characterized BW(PK) at I/O de-
vices level and measured BW(MD) expressed in equation
5.
SystemUsage(phase[i]) =BW(MD)(phase[i])
BWPK(IOP (phase[i]))∗ 100
(5)
We also evaluate the relative error produced by the I/O
time estimation. This is necessary to evaluate how much
our configuration selecting can be deviated. Relative error is
calculated by expression (6);
errorrel = 100 ∗ ( errorabsBWMD(phase[i])
) (6)
where absolute error is calculated by the expression (7).
errorabs = |BW(CH)(phase[i])−BWMD(phase[i])| (7)
When a phase has two or more I/O operations then the
BW(CH) is calculated how the average of the BW(CH) of
each I/O operation that composes the I/O phase.
11

Table VII/O CONFIGURATIONS FOR THE AOHYPER CLUSTER
I/O Element Configuration A Configuration B
I/O library mpich2 mpich2, HDF5CommunicationNetwork
1 Gb Ethernet 1 Gb Ethernet
Storage Network 1 Gb Ethernet 1 Gb EthernetFilesystemGlobal
NFS Ver 3 PVFS2 2.8.2
I/O nodes 8 DAS and 1 NAS 8 DAS and 3 NASDMetadata Server 1 1Filesystem Local Linux ext4 Linux ext3LevelRedundancy
RAID 5, Stripe 256KB JBOD
Number of I/ODevices
5 disks 3 Disk
Capacity of I/ODevices
917GB 130GB
Mounting Point /raid/raid5 /mnt/pvfs2
Table VIIDESCRIPTION OF CONFIGURATION C AND FINISTERRAE
I/O Element Configuration C Finisterrae
I/O library OpenMPI mpich2, HDF5CommunicationNetwork
1 Gbps Ethernet 1 Infinibad 20 Gbps
Storage Network 1 Gbps Ethernet 1 Infinibad 20 GbpsFilesystemGlobal
NFS Ver 3 Lustre (HP SFS)
I/O nodes 8 DAS and 1 NAS 18 OSSMetadata Server 1 2 with 72 cabins SFS20Filesystem Local Linux ext4 Linux ext3LevelRedundancy
RAID 5 RAID 5
Number of I/ODevices
5 disks 866 disks
Capacity of I/ODevices
1.8 TB hot-swap SAS 866*250GB
Mounting Point /home $HOMESFS
IV. EXPERIMENTATION
To validate the methodology we present the experiments
in two parts; i) I/O capacity utilization; ii) validation of the
configuration selected.
We evaluate the system usage of two I/O configurations
in an own cluster which is named Aohyper. Table VI shows
the I/O configurations identified. Aohyper are composed of
8 computing nodes:
• AMD Athlon(tm) 64 X2 Dual Core Processor 3800+,
2GB RAM memory
• 150GB local disk.
• I/O nodes of PVS2: Intel(R) Pentium(R) 4 CPU
3.00GHz processors, 1GB RAM memory, 80 GB disk
Validation of configuration selected has been evaluated in
two I/O subsystem. Table VII shows configuration C and the
configuration of cluster Finisterrae. Finisterrae is a cluster of
Center of Supercomputing of Galicia (CESGA [12]), Spain.
FinisTerrae is composed of 143 computing nodes:
• 142 HP Integrity rx7640 nodes with 16 Itanium Mont-
vale cores and 128 GB of memory each.
• 1 HP Integrity Superdome node with 128 Itanium
Montvale cores and 1,024 GB of memory.
Configuration C is composed of 32 IBM x3550 Nodes:
• 2 x Dual-Core Intel(R) Xeon(R) CPU 5160 @ 3.00GHz
4MB L2 (2x2)
• 12 GB Fully Buffered DIMM 667 MHz
• Hot-swap SAS Controller 160GB SATA Disk
• Integrated dual Gigabit Ethernet
A. I/O subsystem utilization
To evaluate the system usage we evaluate the I/O phases
to MADBench2 [13]. MADbench2 is a tool for testing the
overall integrated performance of the I/O, communication
and calculation subsystems of massively parallel architec-
tures under the stress of a real scientific application.
MADbench2 is based on the MADspec code, which
calculates the maximum likelihood angular power spectrum
of the Cosmic Microwave Background radiation from a
noisy pixelated map of the sky and its pixel-pixel noise
correlation matrix. MADbench2 can be run as single or
multi-gang; in the former all the matrix operations are
carried out distributed over all processors, whereas in the
latter the matrices are built, summed and inverted over all
the processors (S & D), but then redistributed over subsets
of processors (gangs) for their subsequent manipulations (W
& C).
MADbench2 can be run on IO mode, in which all
calculations/communications are replaced with busy-work,
and the D function is skipped entirely. The function S
writes, W reads and writes, C reads. This is denoted as S w,
W w, W r, C r. MADbench2 reports the mean, minimum
and maximum time spent by each function during calcula-
tion/communication, busy-work, reading and writing in each
function. Running MADbench2 requires a n2 number of
processors.
We have obtained the I/O model of MADBench2 for 16
processes, 8KPIX, shared filetype, 32 MB request size. The
I/O model of MadBench2 is shown Figure 7 and Table VIII
shows the five phases identified and the general format for
the initial offset on each phase. By tracing MADBench2
with our tool we have obtained its metadata:
• Individual file pointers, Non-collective I/O operations,
Blocking I/O operations.
• Sequential access mode, Shared access type.
• A file shared by all processes
Table IX shows the utilization of configuration A and
Table X shows the utilization of configuration B. We also
show the amount of data transferred in each I/O phase, the
number and type of I/O operation (W=write, R=read, W-
R=write-read), BW(MD) and BW(PK) in MB/second.
We can observe in Table IX and Table X that MADBench2
use about 30% of the I/O subsystem capacity respect to
BW(PK). However, we have observed in the monitoring of
12

Figure 7. I/O model of MADBench2 for 16 processes, 8KPIX, and Filetype SHARED
Table VIIII/O PHASES DESCRIPTION OF MADBENCH2 FOR 16 PROCESSES
Phase #Oper. InitOffset Rep weight
1 16 write idP ∗ 8 ∗ 32MB 8 4GB2 16 read idP ∗ 8 ∗ 32MB 2 1GB3 16 write idP ∗ 8 ∗ 32MB 6 3GB
16 read idP ∗ 8 ∗ 32MB+ 6 3GB+2 ∗ 32MB
4 16 write idP ∗ 8 ∗ 32MB− 2 1GB−2 ∗ 32MB
5 16 read idP ∗ 8 ∗ 32MB 8 4GB
devices( Figure 8) that the configuration B in the I/O phases
of MADBench2 uses about the 100%, because when we
calculated the BW(PK) for the configuration B, we have
considered the ideal case, where I/O devices are working
in parallel without influence of other components. We can
observe in the monitoring how the different I/O phases of
MADBench2, that were obtained at I/O library level, are
Table IXI/O SYSTEM UTILIZATION, BW(PK) AND BW(MD) IN MB/SECOND
FOR MADBENCH2 WITH 16 PROCESSES, FILE SIZE 4 GB AND A
SHARED FILE ON CONFIGURATION A
Phase #Oper. weight BW(PK) BW(MD) System
on conf. A on conf. A Usage
1 128 W 4GB 400 93 232 32 R 1GB 350 68 183 192 W-R 6GB 375 63 164 32 W 1GB 400 89 225 128 R 4GB 350 66 19
Table XI/O SYSTEM UTILIZATION, BW(PK) AND BW(MD) IN MB/SECOND
FOR MADBENCH2 WITH 16 PROCESSES, FILE SIZE 4 GB AND A
SHARED FILE ON CONFIGURATION B
Phase #Oper. weight BW(PK) BW(MD) System
on conf. B on conf. B Usage
1 128 W 4GB 165 60 362 32 R 1GB 180 39 223 192 W-R 6GB 173 34 194 32 W 1GB 165 54 335 128 R 4GB 180 37 21
Figure 8. Sector per second and Bandwidth utilization for disk ofMAdBench2 on configuration B
reflected at I/O device level. This view of application I/O
can be useful for the matching of processes that do I/O
operations near to I/O nodes or for the planning the parallel
applications taking into account when the I/O phases are
done in the application executing.
B. Validation of the configuration selected
To validate the methodology, the I/O phases identification
is applied to Block Tridiagonal(BT) application of NAS
Parallel Benchmark suite (NPB)[14]. The BTIO benchmark
performs large collective MPI-IO writes and reads of a
nested strided datatype, and it is an important test of the
performance that a system can provide for non-contiguous
workloads. After every five time steps the entire solution
field, consisting of five double-precision words per mesh
point, must be written to one or more files. After all time
steps are finished, all data belonging to a single time step
must be stored in the same file, and must be sorted by vector
component, x-coordinate, y-coordinate, and z-coordinate,
respectively.
Due to that NAS BTIO has an access mode strided and
the IOR is not working in this mode, we have selected
the sequential access mode to replicate the I/O phases. We
have obtained the following meta-data of NAS BT-IO in the
FULL subtype with our tool:
• Explicit offset, Blocking I/O operations, Collective op-
erations.
• Strided access mode, Shared access type.
• MPI-IO routine MPI Set view with etype of 40.
• Request size 10MB.
Figure 9 shows I/O phases for 16 processes, Class C and
FULL subtype obtained in the configuration A and B.
We also have obtained the I/O model in the configuration
C and Finisterrae for the class D to 36 processes. Figure 10
shows the I/O model, we had obtained the same I/O model
in the four configurations to different classes. Difference
between the classes is the weights of the phases.
Table XI shows description of I/O phases for NAS BT-IO
where ph is the number of phase, rs is request size, np the
number of processes into the phase ph, idP is the rank of
MPI processes. We have obtained the same behavior for the
class D for 36, 64 and 121 processes.
13

Figure 9. I/O model of NAS BTIO, class C, 16 processes on configurationA and B
Figure 10. I/O model to NAS BT-IO, class D, 36 processes, and subtypeFULL on Configuration C and Finisterrae
We have calculated the I/O time using our proposed to
choose the configuration with less I/O time in the configu-
ration C and Finisterrae. Table XII shows the T imeio(CH),
we can observe that the configuration with less I/O time for
NAS BT-IO with 64 processes is Finisterrae.
Table XII/O PHASES DESCRIPTION OF NAS BT-IO SUBTYPE FULL FOR np
PROCESSES
Phase Oper. InitOffset Rep.
Class C1-40 np W in rs ∗ idP + (rs ∗ (ph− 1)+ 1
each phase +(rs ∗ (np− 1)) ∗ (ph− 1))41 np R rs ∗ idP + (rs ∗ (Rep− 1)+ 40
+(rs ∗ (np− 1)) ∗ (rep− 1))Class D
1-50 np W in rs ∗ idP + (rs ∗ (ph− 1)+ 1each phase +(rs ∗ (np− 1)) ∗ (ph− 1))
51 np R rs ∗ idP + (rs ∗ (Rep− 1)+ 50+(rs ∗ (np− 1)) ∗ (rep− 1))
Table XIII/O TIME ESTIMATION (T imeio(CH)) ON CONFIGURATION C AND
FINISTERRAE FOR 64 PROCESSES
Phase T imeio(CH) T imeio(CH)
on conf. C on Finisterrae64p
Phase 1-50 1167,40 932,36Phase 51 2868,51 844,42
Table XIIIERROR OF I/O TIME ESTIMATION ON CONFIGURATION C FOR 36, 64
AND 121 PROCESSES
Phase T imeio(CH) T imeio(MD) errorrel
36pPhase 1-50 1137,50 1239,05 9%Phase 51 2773,32 2701,22 3%
64pPhase 1-50 1167,40 1153,05 1%Phase 51 2868,51 2984,75 4%
121pPhase 1-50 1253,05 1262,10 1%Phase 51 3065,91 3107,192 1%
Table XIVERROR OF I/O TIME ESTIMATION ON FINISTERRAE FOR 64 PROCESSES
Phase T imeio(CH) T imeio(MD) errorrel
64pPhase 1-50 932,36 924,85 1%Phase 51 844,42 909,43 7%
Table XIII shows the errorrel in the estimation for 36,
64 and 121 processes on configuration C.
Table XIV shows the error in Finisterrae for 64 processes.
We have evaluated these errors by executing several times
NAS BT-IO and error was similar for the different tests.
Furthermore, the I/O model have obtained at a different
time to discard the influence of the tracing tool. The same
I/O model can be applied to estimate the I/O time in other
systems, where T imeio(CH) will be obtain by expression
(2), the BWCH will be obtain executing IOR with the input
parameters explained in the section III-A1. We can observe
that estimation is better to higher number of processes. The
error in the two configurations is less than 10% and it is
reduced for increased workload and number of processes.
V. CONCLUSION
A methodology to obtain the I/O abstract model of parallel
application has been proposed and it has been utilized to
compare different I/O subsystems. It allows us to determine
how much of the system’s capacity is being used taking into
account the I/O phases of application. The methodology can
be used to select the configuration with less I/O time from
different I/O configurations.
The I/O model of application is defined by three charac-
teristics: metadata, spatial global pattern and temporal global
pattern. We instrument the application to obtain the access
pattern and we analyze the pattern to find the I/O phases.
This instrumentation is done at MPI-IO level which does not
require the source code.
We have evaluated the I/O system utilization of different
configurations by considering the I/O model of application
and the I/O system.
This methodology was applied in four different config-
urations for the application kernel: NAS BT-IO and Mad-
Bench2. The characteristics of four I/O configurations were
evaluated with: IOR for the I/O phases of the I/O abstract
model and by IOzone on I/O devices to obtain the peak
14

values. We have obtained the I/O model of MadBench2 and
we have evaluated the difference of performance on two
configurations taking into account the I/O phase behavior of
application in I/O devices.
We have used the I/O model to estimate the I/O time and
choose the I/O configuration with less I/O time. Relative
errors are acceptable but we have observed the increasing
of error for the complex phases as phase 3 of MadBench2,
where the error was about the 50%. This is because we
used to the characterization IOR and this does not allow
to configure complex access patterns. We are designing
benchmark to replicate the I/O when there are 2 o more
operations in a phase to fit the characterization better and
reduce estimation error.
We will extend the I/O phases identification to different
applications which show different I/O behaviors. We are
analyzing real scientific applications to obtain their I/O
models. We are analyzing upwelling of ROMs framework
that use HDF5 parallel to writing operations. We have used
our tracing tool in the Finisterrae and have obtain the traces.
This application open different files in executing time and
we can observe that our model is applicable to each file but
still is necessary refine the methodology to I/O phases with
access patterns complex, and to the I/O library HDF5.
We will use the I/O model to support the evaluation,
design and selection of different configurations of the I/O
system. In order to test other configurations, we have ana-
lyzed the simulation framework SIMCAN [15] and we are
planning to use such tool to model I/O architectures.
ACKNOWLEDGMENT
This research has been supported by the MICINN Spain
under contract TIN2007-64974, the MINECO (MICINN)
Spain under contract TIN2011-24384, the European ITEA2
project H4H, No 09011 and the Avanza Competitividad
I+D+I program under contract TSI-020400-2010-120.
Appreciation to The Centre of Supercomputing of Gali-
cia (CESGA), Science and Technology Infrastructures (in
spanish ICTS).
REFERENCES
[1] S. Kim, Y. Zhang, S. Son, R. Prabhakar, M. Kandemir,C. Patrick, W.-k. Liao, and A. Choudhary, “Automated tracingof i/o stack,” in Recent Advances in the Message PassingInterface, ser. LNCS. Springer Berlin/Heidelberg, 2010, vol.6305, pp. 72–81.
[2] P. Carns, R. Latham, R. Ross, K. Iskra, S. Lang, and K. Riley,“24/7 Characterization of Petascale I/O Workloads,” in Pro-ceedings of 2009 Workshop on Interfaces and Architecturesfor Scientific Data Storage, September 2009.
[3] P. Carns, K. Harms, W. Allcock, C. Bacon, R. Latham,S. Lang, and R. Ross, “Understanding and improving compu-tational science storage access through continuous character-ization,” in 27th IEEE Conference on Mass Storage Systemsand Technologies (MSST 2011), 2011.
[4] A. Wong, D. Rexachs, and E. Luque, “Extraction of parallelapplication signatures for performance prediction,” in HPCC,2010 12th IEEE Int. Conf. on, sept. 2010, pp. 223–230.
[5] M. P. I. Forum. (2009) Mpi: A message-passing interfacestandard. [Online]. Available: http://www.mpi-forum.org/docs/mpi-2.2
[6] N. Nakka, A. Choudhary, W. Liao, L. Ward, R. Klundt, andM. Weston, “Detailed analysis of i/o traces for large scaleapplications,” in Intl. Conf. on High Performance Computing(HiPC), dec. 2009, pp. 419 –427.
[7] S. Byna, Y. Chen, X.-H. Sun, R. Thakur, and W. Gropp, “Par-allel i/o prefetching using mpi file caching and i/o signatures,”in High Performance Computing, Networking, Storage andAnalysis, 2008. SC 2008. International Conference for, nov.2008, pp. 1–12.
[8] H. Shan and J. Shalf, “Using IOR to analyze the I/O per-formance of HPC platforms,” in Cray Users Group Meeting(CUG) 2007, Seattle, Washington, May 7-10, 2007.
[9] T. M. William Loewe and C. Morrone. (2012) Ior benchmark.[Online]. Available: https://github.com/chaos/ior/blob/master/doc/USER GUIDE
[10] W. D. Norcott. (2006) Iozone filesystem benchmark. [Online].Available: http://www.iozone.org/
[11] S. Mendez, D. Rexachs, and E. Luque, “Methodology forperformance evaluation of the input/output system on com-puter clusters,” in Workshop IASDS on Cluster Computing(CLUSTER), 2011 IEEE International Conference on, sept.2011, pp. 474 –483.
[12] C. Finisterrae, “Centre of supercomputing of galicia (cesga),”Science and Technology Infrastructures (in spanish ICTS),Tech. Rep., 2012. [Online]. Available: https://www.cesga.es/
[13] J. Carter, J. Borrill, and L. Oliker, “Performance character-istics of a cosmology package on leading hpc architectures,”in High Performance Computing - HiPC 2004, ser. LectureNotes in Computer Science, L. Bouge and V. Prasanna, Eds.,vol. 3296. Springer Berlin / Heidelberg, 2005, pp. 21–34.
[14] P. Wong and R. F. V. D. Wijngaart, “Nas parallel benchmarksi/o version 2.4,” Computer Sciences Corporation, NASAAdvanced Supercomputing (NAS) Division, Tech. Rep., 2003.
[15] A. Nunez, et al., “Simcan: a simulator framework for com-puter architectures and storage networks,” in Simutools ’08:Procs of the 1st Int. Conf. on Simulation tools and techniquesfor communications, networks and systems & workshops.Belgium: ICST, 2008, pp. 1–8.
15
Related Documents


![SYNOPSIS DESCRIPTIONGNU Parallel Page 1 NAME parallel - build and execute shell command lines from standard input in parallel SYNOPSIS parallel [options] [command [arguments]] < list_of_arguments](https://static.cupdf.com/doc/110x72/5ec9f0feeb844964280cbf91/synopsis-description-gnu-parallel-page-1-name-parallel-build-and-execute-shell.jpg)