Louisiana State University LSU Digital Commons LSU Historical Dissertations and eses Graduate School 1994 Modeling of VDT Workstation System Risk Factors. Hongzheng Lu Louisiana State University and Agricultural & Mechanical College Follow this and additional works at: hps://digitalcommons.lsu.edu/gradschool_disstheses is Dissertation is brought to you for free and open access by the Graduate School at LSU Digital Commons. It has been accepted for inclusion in LSU Historical Dissertations and eses by an authorized administrator of LSU Digital Commons. For more information, please contact [email protected]. Recommended Citation Lu, Hongzheng, "Modeling of VDT Workstation System Risk Factors." (1994). LSU Historical Dissertations and eses. 5741. hps://digitalcommons.lsu.edu/gradschool_disstheses/5741

Welcome message from author
This document is posted to help you gain knowledge. Please leave a comment to let me know what you think about it! Share it to your friends and learn new things together.
Transcript
Louisiana State UniversityLSU Digital Commons
LSU Historical Dissertations and Theses Graduate School
1994
Modeling of VDT Workstation System RiskFactors.Hongzheng LuLouisiana State University and Agricultural & Mechanical College
Follow this and additional works at: https://digitalcommons.lsu.edu/gradschool_disstheses
This Dissertation is brought to you for free and open access by the Graduate School at LSU Digital Commons. It has been accepted for inclusion inLSU Historical Dissertations and Theses by an authorized administrator of LSU Digital Commons. For more information, please [email protected].
Recommended CitationLu, Hongzheng, "Modeling of VDT Workstation System Risk Factors." (1994). LSU Historical Dissertations and Theses. 5741.https://digitalcommons.lsu.edu/gradschool_disstheses/5741

INFORMATION TO USERS
This manuscript has been reproduced from the microfilm master. UMI films the text directly from the original or copy submitted. Thus, some thesis and dissertation copies are in typewriter face, while others may be from any type of computer printer.
The quality of this reproduction is dependent upon the quality of the copy submitted. Broken or indistinct print, colored or poor quality illustrations and photographs, print bleedthrough, substandard margins, and improper alignment can adversely affect reproduction.
In the unlikely event that the author did not send UMI a complete manuscript and there are missing pages, these will be noted. Also, if unauthorized copyright material had to be removed, a note will indicate the deletion.
Oversize materials (e.g., maps, drawings, charts) are reproduced by sectioning the original, beginning at the upper left-hand corner and continuing from left to right in equal sections with small overlaps. Each original is also photographed in one exposure and is included in reduced form at the back of the book.
Photographs included in the original manuscript have been reproduced xerographically in this copy. Higher quality 6" x 9" black and white photographic prints are available for any photographs or illustrations appearing in this copy for an additional charge. Contact UMI directly to order.
University M icrofilms International A Bell & Howell Information Com pany
300 North Zeeb Road. Ann Arbor. Ml 48106-1346 USA 313/761-4700 800/521-0600

Order N um ber 9502123
M odeling o f V D T w orkstation system risk factors
Lu, Hongzheng, Ph.D.
The Louisiana State University and Agricultural and Mechanical Col., 1994
C o p y rig h t © 1994 b y L u, H ongzheng . A ll r ig h ts re se rv ed .
U M I300 N. Zeeb Rd.Ann Arbor, MI 48106


MODELING OF VDT WORKSTATION SYSTEM
RISK FACTORS
A Dissertation
Submitted to the Graduate Faculty o f the Louisiana State University and
Agricultural and Mechanical College in partial fulfillment o f the
requirements for the degree o f Doctor o f Philosophy
in
The Interdepartmental Programs in Engineering
byHongzheng Lu
B.S., China Textile University, 1982 M.S. in E.E., China Textile University, 1986
M.S. in E.S., Louisiana State University, 1992 May 1994

©Copyright 1994 Hongzheng Lu All right reserved
ACKNOWLEDGMENTS
I would like to express my deep gratitude to Dr. F. Aghazadeh, my major
advisor, for his guidance, understanding, constant support, and continued
encouragement throughout the entire study. He has contributed to my professional
development thus far by not only challenging me, but by actively supporting me in my
academic endeavors.
I would also like to thank other committee members for their guidance and
support during the course o f this research. These individuals include Dr. Doris Carver,
Dr. T. Warren Liao, Dr. Avinash Waikar, Dr. Ralph W. Jr. Pike, and Dr. Kennth L.
Koonce. Their hard work and valuable suggestions have been greatly appreciated. I
want to thank Dr. E. Barry Moser for his consultation to the statistic methods used in
this research and for his guidance and efforts which are greatly appreciated. In
addition, I want to thank Dr. David E. Thompson for his constructive comments
reagarding this research.
My appreciation extends to those who helped me in the study. Mr. John Caylor,
the director o f the Department o f Occupational Safety in Freeport McMoRan Inc.,
New Orleans, Louisiana, who gave me the opportunity to investigate VDT health
issues at Freeport McMoRan and from where I generated the idea for the topic o f this
dissertation; Ms. Barbara Jump, the administrator o f the Business Office in Our Lady o f
the Lake Hospital, who kindly gave me permission to collect data for this research; Dr.
John J. Farrell, the director o f Fiscal Operations o f Pennington Biomedical Research
Center, who helped me contact subjects; and Dr. Katherine Chaperon, who discussed
many ideas with me.
iii
My appreciation is also given to the Dye's, my host family and best friends, for
their advice, support and encouragement in both my life and study.
I am indebted to my husband Zhiyuan, my daughter Yue, my sisters Hong-Qian
and Hong-Jin, and my dear parents Qingxian Lu and Qijing Zheng. Without their
emotional support, understanding, and patience, my study would have been impossible.
Special thanks is owed to my husband Zhiyuan, who gave me love, comfort and
encouragement every moment especially when things were not going well. He
undertook most family burdens so that I could concentrate on this research. This work
is dedicated to them.
TABLE OF CONTENTS
ACKNOWLEDGMENTS............................................................................................. iii
LIFT OF TABLES......................................................................................................... ix
LIST OF FIGURES........................................................................................................ xii
ABSTRACT..................................................................................................................... xv
CHAPTER1. INTRODUCTION.................................................................................................... 1
1.1 Objectives o f Research..................................................................................... 3
2. BACKGROUND....................................................................................................... 52.1 VDT Tasks.......................................................................................................... 52.2 Characteristics o f VDT Tasks.......................................................................... 62.3 VDT Related Health Problems......................................................................... 7
2.3.1 Musculoskeletal Discomfort.................................................................... 82.3.2 Vision Problems......................................................................................... 92.3.3 Psychological Stress................................................................................. 112.3.4 Other Health Complaints......................................................................... 112.3.5 Summary.................................................................................................... 12
3. LITERATURE REVIEW.......................................................................................... 133.1 Risk Factors......................................................................................................... 13
3.1.1 D em ographics............................................................................................ 133.1.2 VDT Task Factors..................................................................................... 153.1.3 Workstation Design.................................................................................... 173.1.4 Work Environment..................................................................................... 203.1.5 Psychosocial Factors................................................................................. 213.1.6 Psychological Stress.................................................................................. 233.1.7 Awkward Working Posture...................................................................... 233.1.8 Interactions o f Risk Factors...................................................................... 253.1.9 Summary..................................................................................................... 25
3.2 Research Approaches...................................................................................... 353.2.1 Experiment vs. Survey.............................................................................. 353.2.2 Measurements............................................................................................ 37
3.2.2.1 Measurements for Health Symptoms............................................ 38v
3.2.2.1 Measurements for Physical Work Conditions.............................. 403.3 Data Analysis Methodology........................................................................... 35
3.3.1 Descriptive Statistics................................................................................ 423.3.2 Univariate Analysis.................................................................................. 42
3.3.2.1 Correlation Measures..................................................................... 423.3.2.2 Analysis o f Variance, T-test, Chi-square Test.............................. 433.3.2.3 Regression Analysis.......................................................................... 43
3.3.3 Multivariate Analysis................................................................................ 453.3.3.1 Multivariate Analysis o f Variance (MANOV A)......................... 453.3.3.2 Factor Analysis................................................................................. 463.3.3.3 Canonical Correlation Analysis...................................................... 47
3.3.4 Summary..................................................................................................... 48
4. RATIONALE............................................................................................................. 49
5. METHODS AND PROCEDURES...................................................................... 525.1 Research Plan...................................................................................................... 525.2 Model Development.......................................................................................... 52
5.2.1 Conceptual Model...................................................................................... 525.2.2 Research Model........................................................................................... 54
5.2.2.1 Level I: Physical Symptoms.............................................................. 575.2.2.2 Level II: Psychological Stress and Awkward Posture................... 58
5.2.2.2.1 Psychological Stress................................................................... 585.2.2.2.2 Awkward Posture...................................................................... 59
5.2.2.3 Level III: Basic System Component Variables............................... 605.2.2.3.1 Demographics............................................................................ 605.2.2.3.2 Task.............................................................................................. 615.2.2.3.3 Workstation Design................................................................... 615.2.2.3.4 Work Environment.................................................................... 625.2.2.3.5 Psychosocial Factors................................................................ 62
5.2.2.4 Summary............................................................................................... 635.3 Survey Design...................................................................................................... 63
5.3.1 Questionnaire design.................................................................................. 635.3.1.1 Background Information.................................................................... 645.3.1.2 Possible Health Symptoms............................................................... 645.3.1.3 Computer, Workstation, and Work Environment......................... 66
5.3.2 Measurements and Checklist Design...................................................... 675.3.3 Posture Recording...................................................................................... 675.3.4 Sampling M ethod....................................................................................... 695.3.5 Survey Procedure........................................................................................ 69
5.4 Posture Analysis................................................................................................. 705.4.1 Brief Review o f Posture Analysis Methods............................................ 705.4.2 A posture Scoring Method...................................................................... 72
5.4.2.1 Head/neck Posture............................................................................. 73
vi
5.4.2.2 Trunk Posture...................................................................................... 735.4.2.3 Upper Arm Posture............................................................................. 745.4.2.4 Lower Arm Posture............................................................................. 755.4.2.5 Wrist Posture....................................................................................... 755.4.2.6 Leg and Foot Posture......................................................................... 77
5.5 Data Analysis Methodology............................................................................... 775.5.1 Descriptive Statistics.................................................................................... 785.5.2 Univariate Analysis...................................................................................... 785.5.3 Multivariate Analysis..................................................................................... 78
6. RESULTS.................................................................................................................... SI6.1 Background and Demographic Information...................................................... 81
6.1.1 Site and Department.................................................................................... 816.1.2 User Characteristics..................................................................................... 836.1.3 Task Characteristics.......................................................................................84
6.1.3.1 Types o f VDT task............................................................................... 856.2 The Extent and Pattern o f Health Complaints.................................................. 87
6.2.1 Descriptive Data........................................................................................... 876.2.2 Correlation Analysis.......................................................................................906.2.3 Factor Analysis............................................................................................. 93
6.3 Working Posture and Musculoskeletal Symptoms...........................................956.4 Workstation Design............................................................................................. 96
6.4.1 Subjective and Objective Evaluations....................................................... 966.4.1.1 Screen Glare........................................................................................ 996.4.1.2 Screen Position..................................................................................... 1006.4.1.3 Keyboard Position.............................................................................. 1026.4.1.4 Chair Comfort..................................................................................... 109
6.5 W ork Environment...............................................................................................1126.5.1 Lighting Conditions......................................................................................112
6.5.1.1 Illumination Level at Workstation..................................................... 1126.5.1.2 Luminance - Display, Keyboard, Document, and Background.. 1146.5.1.3 Lighting Condition and Vision Complaints......................................116
6.5.2 Other Work Environment Variables......................................................... 1186.6 Psychosocial Factors......................................................................................... 1186.7 Test o f Research Model.................................................................................... 120
6.7.1 Variable Reduction.................................................................................... 1206.7.2 Correlations among Variables in the Research Model........................ 121
6.7.2.1 Physical Symptoms........................................................................... 1216.7.2.2 Awkward Posture.............................................................................. 1216.7.2.3 Psychological Stress......................................................................... 121
6.7.3 Regression Models..................................................................................... 1216.7.4 Risk Factors for Awkward Postures..................................................... 1276.7.5 Risk Factors for Psychological Stress................................................... 1326.7.6 Risk Factors for Physical Symptoms.................................................... 136
vii
7. DISCUSSION.......................................................................................................... 1477.1 Research Model................................................................................................. 147
7.1.1 Physical Symptoms.................................................................................... 1477.1.2 Psychological Stress................................................................................. 1487.1.3 Working Posture....................................................................................... 1497.1.4 Demographics............................................................................................ 1517.1.5 Task............................................................................................................ 1527.1.6 Workstation Design.................................................................................. 1527.1.7 W ork Environment.................................................................................... 1537.1.8 Psychosocial Factors................................................................................ 154
7.2 The Most Important Risk Factors at VDT workstation............................... 1547.2.1 Risk Factors for Physical Symptoms..................................................... 154
7.2.1.1 Ocular Discomfort............................................................................. 1557.2.1.2 General Musculoskeletal Symptoms.............................................. 1567.2.1.3 Upper Body Musculoskeletal Symptoms...................................... 1567.2.1.4 Other Physical Symptoms................................................................ 157
7.2.2 Risk Factors for Awkward Work Posture............................................ 1577.2.3 Risk Factors for Psychological Stress.................................................... 158
7.3 Interactions among Risk Factors................................................................... 1587.4 Subjective and Objective Measurement...................................................... 159
8. SUMMARY AND CONCLUSIONS................................................................ 1638.1 Research Procedure and Major Results....................................................... 1638.2 Conclusions........................................................................................................ 1678 .3 The Impact and Contributions o f this Research............................................ 167
9. RECOMMENDATIONS FOR FUTURE WORK........................................... 171
REFERENCES.............................................................................................................. 174
APPENDIXESA. VARIABLES STUDIED IN THE QUESTIONNAIRE................................ 187
B. QUESTIONNAIRE.............................................................................................. 191
C. MEASUREMENTS AND CHECKLIST......................................................... 200
D. MEASUREMENT TECHNIQUE..................................................................... 203
E. POSTURE ANALYSIS WORK SHEET........................................................ 206
VITA............................................................................................................................... 208
viii
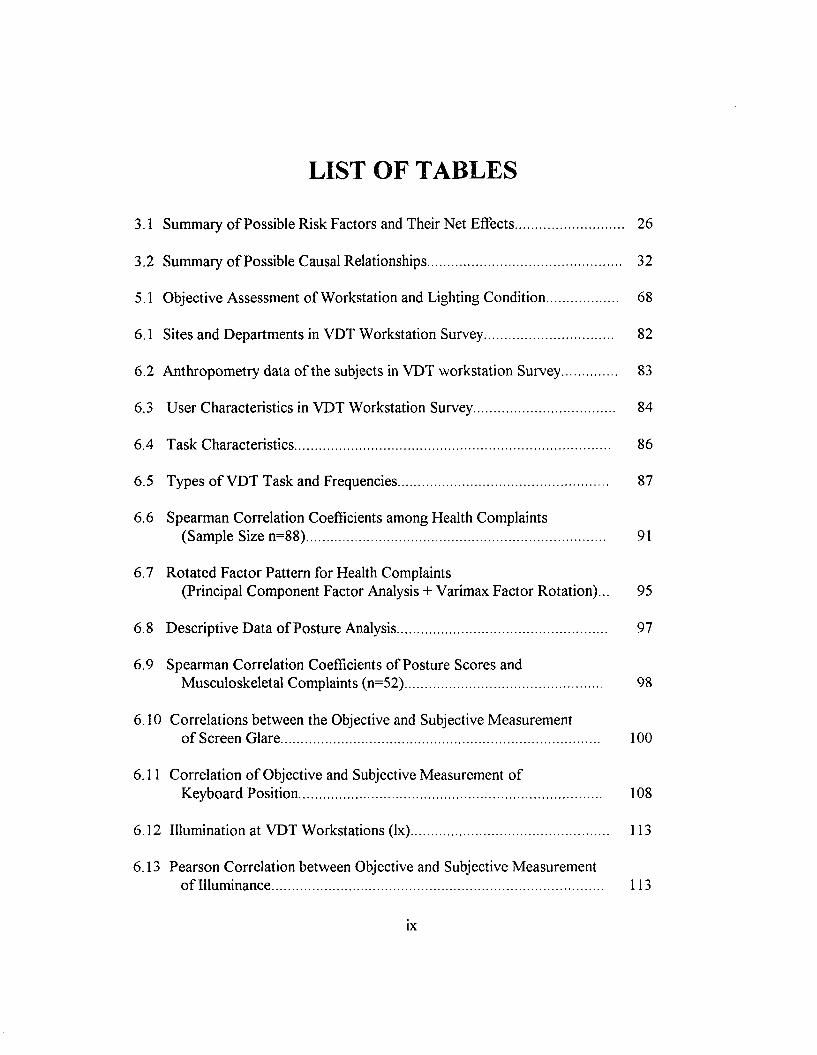
LIST OF TABLES
3.1 Summary o f Possible Risk Factors and Their Net Effects............................... 26
3.2 Summary o f Possible Causal Relationships........................................................ 32
5.1 Objective Assessment o f Workstation and Lighting Condition.................... 68
6.1 Sites and Departments in VDT Workstation Survey..................................... 82
6.2 Anthropometry data o f the subjects in VDT workstation Survey............... 83
6.3 User Characteristics in VDT Workstation Survey........................................ 84
6.4 Task Characteristics........................................................................................... 86
6.5 Types o f VDT Task and Frequencies............................................................ 87
6.6 Spearman Correlation Coefficients among Health Complaints(Sample Size n=88)...................................................................................... 91
6.7 Rotated Factor Pattern for Health Complaints(Principal Component Factor Analysis + Varimax Factor Rotation)... 95
6.8 Descriptive Data o f Posture Analysis............................................................ 97
6.9 Spearman Correlation Coefficients o f Posture Scores andMusculoskeletal Complaints (n=52)......................................................... 98
6.10 Correlations between the Objective and Subjective Measuremento f Screen Glare............................................................................................ 100
6.11 Correlation o f Objective and Subjective Measurement ofKeyboard Position....................................................................................... 108
6.12 Illumination at VDT Workstations (lx)......................................................... 113
6.13 Pearson Correlation between Objective and Subjective Measuremento f Illuminance............................................................................................... 113
ix

6.14 Correlation between Each Group o f Illuminance MeasurementSeparated from Its Median and Subjective Rated Comfortwith Illumination Level................................................................................ 115
6.15 Luminance at W orkstations........................................................................... 115
6.16 Correlation between Subjective Rating o f Illuminance and Luminanceat W orkstation.............................................................................................. 116
6.17 Pearson Correlations between Visual Complaints and LightingConditions (n=80)........................................................................................ 117
6.18 Other Environmental Variables........................................................................ 118
6.19 Correlation between Environmental Variables and Health Complaints. .. 119
6.20 Rotated Factor Pattern for Psychosocial Factors(Principal Component Factor Analysis + Varimax Factor Rotation).... 120
6.21 Reduced Variables for Testing Research Model......................................... 122
6.22 Canonical Correlations among the 10 Category Variablesin the Research Model.................................................................................. 123
6.23 Independent Variables in Regression Models o f Physical Symptoms 125
6.24 Interaction Variables and Their Possible Effects.......................................... 127
6.25 Regression Results for "Awkward Work Posture".................................... 128
6.26 Regression Results for "Psychological Stress"............................................ 133
6.27 Regression Results for "Ocular Discomfort" (M l) ..................................... 140
6.28 Regression Results for "General Musculoskeletal Stress" (M 2).............. 143
6.29 Regression Results for "Upper Body Symptoms" (M 3)........................... 143
6.30 Regression Results for "Other Symptoms" (M4)....................................... 145
7.1 Summary o f Interactions o f Risk Factors...................................................... 159
x
Summary o f Subjective and Objective Measurements
Summary o f Risk Factors in VDT Workstation Systems
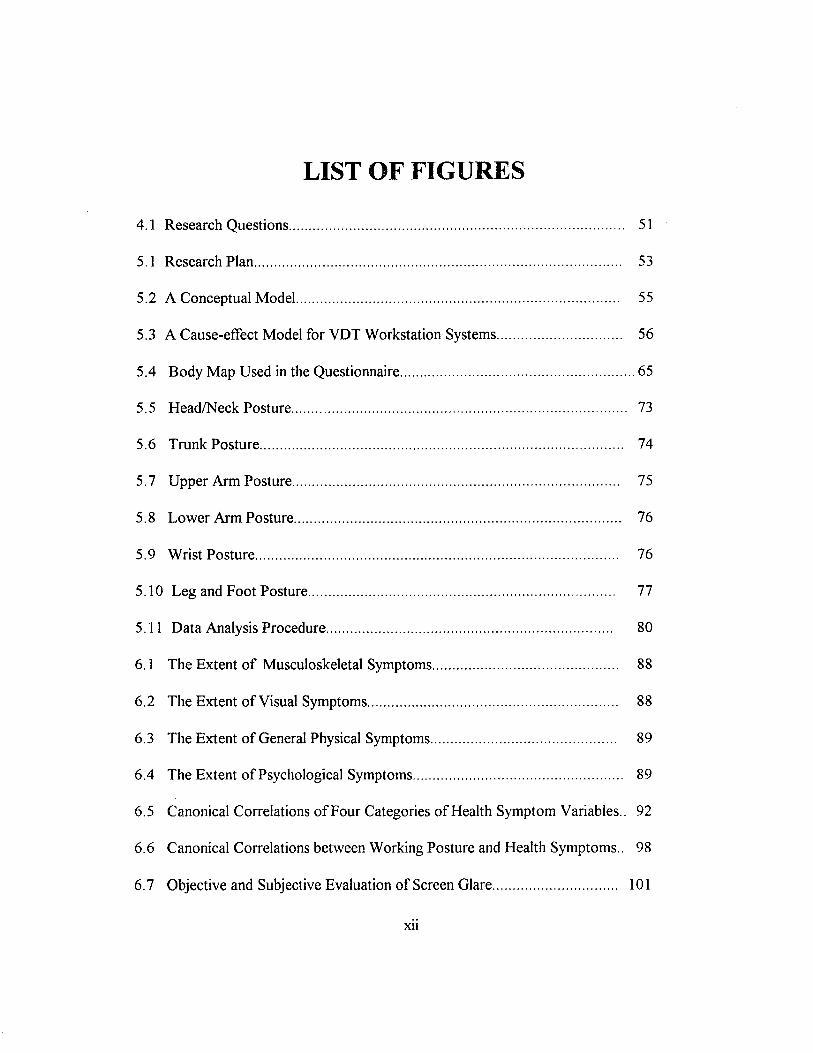
LIST OF FIGURES
4.1 Research Questions................................................................................................ 51
5.1 Research Plan.......................................................................................................... 53
5.2 A Conceptual Model............................................................................................. 55
5.3 A Cause-efFect Model for VDT Workstation Systems.................................... 56
5.4 Body Map Used in the Questionnaire.................................................................... 65
5.5 Head/Neck Posture................................................................................................ 73
5.6 Trunk Posture......................................................................................................... 74
5.7 Upper Arm Posture.............................................................................................. 75
5.8 Lower Arm Posture.............................................................................................. 76
5.9 Wrist Posture........................................................................................................ 76
5.10 Leg and Foot Posture........................................................................................ 77
5.11 Data Analysis Procedure.................................................................................. 80
6.1 The Extent o f Musculoskeletal Symptoms.......................................... 88
6.2 The Extent o f Visual Symptoms............................................................. 88
6.3 The Extent o f General Physical Symptoms........................................... 89
6.4 The Extent o f Psychological Symptoms.................................................. 89
6.5 Canonical Correlations o f Four Categories o f Health Symptom Variables.. 92
6.6 Canonical Correlations between Working Posture and Health Symptoms.. 98
6.7 Objective and Subjective Evaluation o f Screen Glare.................................... 101
xii
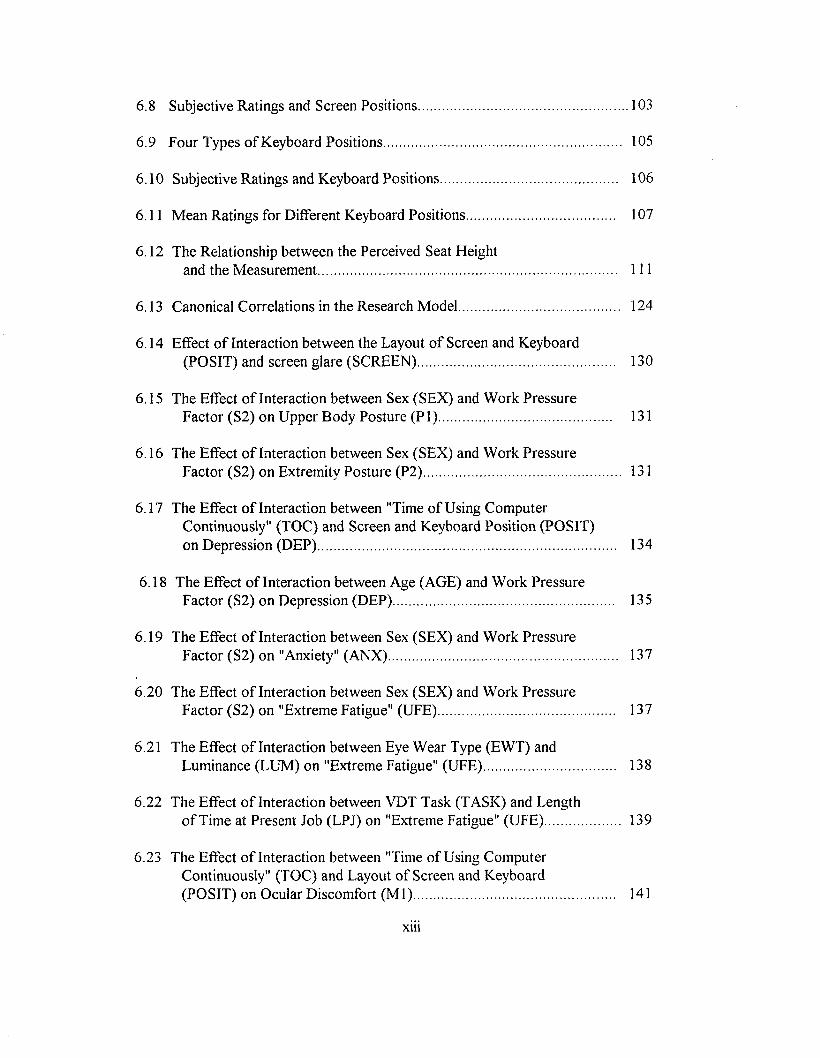
6.8 Subjective Ratings and Screen Positions.............................................................103
6.9 Four Types o f Keyboard Positions.................................................................... 105
6.10 Subjective Ratings and Keyboard Positions................................................... 106
6.11 Mean Ratings for Different Keyboard Positions.......................................... 107
6.12 The Relationship between the Perceived Seat Heightand the Measurement...................................................................................... 111
6.13 Canonical Correlations in the Research Model.............................................. 124
6.14 Effect o f Interaction between the Layout o f Screen and Keyboard(POSIT) and screen glare (SCREEN)......................................................... 130
6.15 The Effect o f Interaction between Sex (SEX) and Work PressureFactor (S2) on Upper Body Posture (P I).................................................. 131
6.16 The Effect o f Interaction between Sex (SEX) and Work PressureFactor (S2) on Extremity Posture (P2)......................................................... 131
6.17 The Effect o f Interaction between "Time o f Using ComputerContinuously" (TOC) and Screen and Keyboard Position (POSIT) on Depression (DEP)...................................................................................... 134
6.18 The Effect o f Interaction between Age (AGE) and Work PressureFactor (S2) on Depression (DEP)............................................................... 135
6.19 The Effect o f Interaction between Sex (SEX) and Work PressureFactor (S2) on "Anxiety" (ANX).................................................................. 137
6.20 The Effect o f Interaction between Sex (SEX) and Work PressureFactor (S2) on "Extreme Fatigue" (UFE)................................................... 137
6.21 The Effect o f Interaction between Eye Wear Type (EWT) andLuminance (LUM) on "Extreme Fatigue" (UFE)...................................... 138
6.22 The Effect o f Interaction between VDT Task (TASK) and Lengtho f Time at Present Job (LPJ) on "Extreme Fatigue" (UFE)..................... 139
6.23 The Effect o f Interaction between "Time o f Using ComputerContinuously" (TOC) and Layout o f Screen and Keyboard(POSIT) on Ocular Discomfort (M l).......................................................... 141
xiii
6.24 The Effect o f Interaction between Upper Body Posture (P I)and Layout o f Screen and Keyboard (POSIT) on "Upper Body Symptoms" (M 3)............................................................................................. 144
6.25 The Effect o f Interaction between Age (AGE) and Type o f Eye Wear(EWT) on "Other Physical Symptoms" (M 4).............................................. 146
7.1 Integration o f Subjective and Objective Measurements............................... 162
9.1 Proposed Process for the Research in VDT Workstation Systems 172
xiv

ABSTRACT
The objectives o f this research were to determine the most important risk factors
in VDT workstations associated with physical symptoms and to investigate the
interrelationship among these risk factors.
This research consisted o f the following four stages:
STAGE 1: Research model development. A conceptual model was developed to
describe the interrelationship among the basic components in a VDT workstation system
and their possible health effects. A research model was then proposed to describe the
hypothesized relationships among the following categories o f variables: demographics,
task, workstation design, work environment, psychosocial factors, awkward work
posture, psychological stress, musculoskeletal symptoms, visual symptoms, and general
physical symptoms.
STAGE 2 : Methodology development. In order to evaluate the workstation
system comprehensively, a method which consisted o f a questionnaire, measurement and
checklist, and posture analysis was developed. A questionnaire was designed for
collecting subjective reports o f health symptoms and evaluation o f workstation and work
environment. A checklist and measurement sheet were designed for collecting data of
workstation dimensions, lighting conditions, and anthropometric data. A posture analysis
method was also developed for evaluating operators' work postures.
STAGE 3 : Field study. A field study was conducted among daily computer users
at two different work sites; a local hospital and Louisiana State University. This field
xv
study consisted o f three parts; a questionnaire survey, measurements, and the video
recording o f operators' work posture. Ninety three subjects participated in the study.
STAGE 4 : Data analysis. Data was analyzed using both univariate and
multivariate approaches. In order to identify the most important variables used for
testing the research model development, the relationship between objective and
subjective evaluation o f workstation and environment were investigated.
Canonical correlation analysis was used to investigate the relationship between
each two sets o f variables which were described in the research model. Factor analysis
was applied to the physical symptoms to help identify the underlying factors. Multiple
regression was used to determine the most important factors related to physical
symptoms, awkward posture and psychological stress and the interactions among the
risk factors. Four factors among physical symptoms were identified and they were
named as ocular discomfort, general musculoskeletal symptoms, upper extremity
symptoms, and other physical symptoms.
Several conclusions are drawn from this research:
1. The risk factors contributing to the four categories o f physical symptoms
which are identified from the factor analysis are different and these factors are inter
related. Ocular discomfort is significantly related to screen glare; both general
musculoskeletal symptoms and other physical symptoms are related to fatigue; and upper
extremity symptoms are related to awkward upper body posture.
2. Psychosocial factors significantly interact with other variables, such as
demographic variables, and contribute to awkward work posture and psychological
stress.
3. Workstation design significantly affects working posture which in turn
contributes to physical symptoms.
xvi
4. Interactions exist among the risk factors not only within but also between the
seven categories o f risk factors.
5. Both subjective and objective measures should be used in investigating risk
factors in the VDT system.
The contributions o f this research to the investigation o f risk factors in VDT
systems are as follows:
1. Development o f a conceptual model which presents the interaction o f basic
components in a VDT workstation system.
2. Development o f a posture analysis method which can be used to rate the risk
associated with the working posture at the VDT workstation system.
3. Development a method which integrated both subjective measures
(questionnaire) and objective measures (workstation measurement and posture analysis)
for the investigation o f risk factors in the VDT workstation system.
4. Classification o f the physical symptoms into four (4) categories named; ocular
symptoms, general musculoskeletal symptoms, upper body symptoms, and other physical
symptoms.
5. Comprehensively examination o f the effects o f both physical and psychosocial
environments and their interactions to physical symptoms, awkward work posture and
psychological stress.
The implication o f this research is that both the physical and social environment
need to be evaluated and the interactions among the components o f a VDT workstation
system need to be understood in order to determine physical symptom risk factors.
CHAPTER 1
INTRODUCTION
As a result o f the rapid development o f computer technology, the use o f video
display terminals (VDTs) has increased dramatically in the workplace. According to a
recent OSHA report (OSHA, 1991), there were only 675,000 VDTs in use in the U.S.
offices in 1976. After 10 years, in 1986, this number increased to 28 million. At present,
there may be anywhere from 40 to 80 million VDTs in the workplace.
Computers have been used in offices and service-oriented establishments for
information processing; they are used in factories to control electronic equipment that
produce goods; and they are also used by many businesses to maintain control over
inventory. Computers are revolutionizing the way business is conducted world wide.
Use o f computers may increase productivity from 50 to 5000 percent, depending on the
nature o f the work (Bureau o f National Affairs, 1984). Computers are, in some ways,
benefiting workers as well as employers. Clerical workers have the opportunity to learn
new skills, thereby upgrading their employment status and even improving their earning
power. As we enter the 21st century, modern office demands and instant data access
needs will increase reliance upon office electronics. The workforce will spend more time
on VDT equipment.
Along with this expanding use of VDTs have come reports about adverse health
effects on VDT operators. Reports o f complaints include musculoskeletal or cumulative
trauma disorders (CTDs) and symptoms, vision problems, general physical discomfort,
psychological stress, facial skin effects, and reproductive effects (Bonnell, 1987; Bureau
o f National Affairs, 1984; NIOSH, 1981 and 1992; Pot et al., 1987). Secretaries, data
entry clerks and other clerical workers in offices suffer from these health issues more
than other professionals (Bureau o f National Affairs, 1984).
The reported rates o f injury are different in various studies. According to a
recent study by National Institute for Occupational Safety and Health (NIOSH), twenty-
two percent o f U.S. West Communications, workers whose jobs required use o f VDT,
had potential work-related musculoskeletal disorders and symptoms. LeGrande (1993)
surveyed repetitive motion health symptoms and disorders among the directory
assistance operators o f the Communications Workers o f America (CWA). This survey
indicated the following symptoms: hand and wrist pain (73%), numbness or tingling o f
fingers (59%), arm and shoulder pain (78%), neck or back pain (86%), and leg pain
(53%). Another survey o f 1,307 optometrists shows that about 10 million Americans
suffer from VDT-related vision problems (Sunday Advocate, 1993). Complaints about
carpal tunnel syndrome, a wrist disorder believed to be caused by the use o f computer
keyboards have flooded the courts (Occupational Safety & Health Reporter, 1993; The
Wall Street Journal, 1993). In most repetitive-stress worker's compensation cases against
employers, the awards have been below $50,000 (The Wall Street Journal, 1993). I f the
injury rate o f West Communications workers is extended to all VDT users, the total
number o f individuals with potential work related musculoskeletal disorders and
symptoms will be 17.6 million.
According to the Bureau o f Labor Statistics' 1991 survey o f job-related injuries
and illnesses, 368,000 new cases o f occupational illnesses were found among workers in
private industry. Out o f the 368,000 occupational illnesses, 224,000 were related to
repeated trauma injuries, a common problem among keyboard entry workers. This
number increased by 21 percent comparing to 185,000 in 1990. The rapid increase o f
injury rate o f cumulative trama disorders has resulted in a proposal for VDT
workstation standards by the State o f California (CAL/OSHA, 1993) . Concerns about
possible health effects o f VDT have also prompted numerous public and private studies
seeking to determine whether the VDT and its environment do, in fact, adversely affect a
worker's health.
Past research has identified many factors associated with VDT operators' health
complaints. These factors can be summarized into the following categories:
demographics/individual characteristics, VDT tasks, VDT workstations, work
environment, psychosocial factors, ergonomics risk factors (repetition, posture, and
force), and psychological stress (Bergqvist et al., 1990; Occupational Safety & Health
Reporter, 1992). However, these risk factors have not been examined comprehensively.
What are the most important risk factors and how these factors affect an operator's
physical complaints are not clear.
1.1 OBJECTIVES OF RESEARCH
The objectives o f this research were to determine the most important risk factors
in VDT workstation system which might affect operator's physical symptoms and to
investigate the interrelationship among the risk factors. Specifically, the objectives o f
this research were:
1. Development o f a research model which describes the relationships among the
physical symptoms and related risk factors in the VDT workstation system based on past
and current research.
2. Development o f subjective and objective measures for studying and analyzing
the relationship between physical symptoms and related risk factors.
3. Determination o f the most important risk factors associated with the physical
symptoms.

4. Examination o f the interactions between risk factors and their effect
physical symptoms.
CHAPTER 2
BACKGROUND
2.1 VDT TASKS
There are various VDT tasks. According to the predominant mode o f interaction
with the VDT, VDT tasks can be classified into four categories: data entry, word
processing, information retrieval/interactive communication, and programming/computer
aided design (CAD).
In data entry work, information that is usually nontextual (numbers, letters, or
symbols) is keyed into the computer, often in a repetitive manner according to a set
format. The work pace in data entry is often quite high — 8,000 - 12,000 key
stroks/hour is not unusual (Grandjean, 1980) — and VDT operators may be expected to
meet production quotas. Operators may read from printed or handwritten materials or
use auditory sources. In many cases the task does not require the operator to look at the
screen. Operators in jobs that primarily involve data entry work usually have little or no
control over the structure o f their work (National Research Council, 1983).
Information retrieval involves calling up information from the computer and
reading it from screen. Interactive communication work involves both data entry and
information retrieval. In both cases, there are fewer key strokes involved than data entry
work and the task is likely to be more screen-intensive. Telephone information operators
and airline reservation clerks are examples o f workers who seem to work predominantly
in this mode.
5
Word processing involves text entry, text recall, searching test for errors, keying
in corrections, and organizing format. The term is often used to refer to secretarial tasks
in document preparation, but there are similar operators in such jobs as layout,
formatting, proofreading, and editing. Some o f the tasks elements are source-document
intensive, some are screen-intensive, and word processing jobs usually involve different
combinations o f these elements at different times. There is wide variation among these
jobs in the degree o f control an operator may have over the structure and pace o f work
(National Research Council, 1983).
Programming and computer-aided design (CAD) often involve programming
computers which use VDTs. Many professional jobs — for example, data analysis,
computer programming, scientific research — include such use o f VDTs. In these jobs
the VDT may be only one o f several tools used, and the amount o f time a worker spends
at a terminal often varies greatly from day to day. A worker's control over the job tasks
is considerable.
Many jobs have elements which contain more than one o f these categories, and
some jobs many not fit into any o f them.
2.2 CHARACTERISTICS OF VDT TASKS
Comparing with traditional office work, the VDT task has the following
characteristics: constrained posture and increased load on the visual apparatus (Bruno,
1993; Grandjean, 1984a; Hunting et al., 1981; Grandjean, 1984c). Grandjean (1984a)
described the situation o f the VDT operator: "movements are restricted, attention is
directed to the screen or source documents and the hands are linked to the keyboard."
In VDT work, all the necessary information and instruments required to do the
jobs are directly available at the work station resulting in the same seated position being
maintained for many hours. Immobility is further increased because o f the fixed position
o f the VDT. Therefore, all the usual lay-out adjustments operators normally do
themselves, according to personal preference or changing organizational necessities, are
made extremely difficult. The increased load on the visual apparatus among VDT
operators is primarily due to the combination o f two factors. One is the reduced clarity
o f the details on the video screen and the other is the limited possibility to use far vision
due to physical obstruction, resulting from walls, dividers, windows, blinds etc., used to
resolve the most frequent lighting problems. Consequently, the operator is rarely able to
use accommodation and convergence/divergence mechanisms to their full extent.
Moreover the operator must maintain prolonged near point fixation which is also static
because the work entails fixating images and/or objects ("occupational gazes") located
between 50 and 100 cm from the eyes (Bruno, 1993; Grandjean, 1984a; Gratton et al.,
1990; Jaschinski-Kruza, 1988; Saito, et al., 1993).
After reviewing visual issues, Smith (1987) indicates that VDT use is highly
visually demanding and produces visual discomfort.
To summarize, the following characteristics exist in various types o f VDT tasks:
high concentration, close visual tasks, extended period o f sitting/restricted posture,
repetitively and/or prolonged use o f hands, wrists and fingers. Because o f the
characteristics o f VDT work, Grandjean (1984a) indicated that the VDT operators "are
more vulnerable to ergonomics shortcomings, to constrained postures, to unsuitable
lighting conditions and to uncomfortable furniture."
2.3 VDT-RELATED HEALTH PROBLEMS
Over the past two decades, workers who use VDTs regularly have voiced
concern about their health and about the safety o f the terminals. The complaints fall into
several distinct categories: musculoskeletal discomfort and strain, eyestrain, and stress.
Some operators have expressed fear that VDT radiation emissions may cause cataracts
or contribute to birth defects. Most o f the health and safety problems associated with
the terminals have been reported by clerical office workers.
2.3.1 MUSCULOSKELETAL DISCOMFORT
Musculoskeletal problems among office workers have become the subject o f
growing concern with the expanding use o f video display terminals (Sauter and Schleifer,
1991). The Word Health Organization concluded that "musculoskeletal discomfort was
commonplace during work with VDTs" and that "injury from repeated stress... is
possible" (World Health Organization, 1987, p i). Lyon (1992) states that cumulative
trauma disorders (CTDs) are generally considered the most costly and severe disorders
occurring in the VDT workplace.
CTDs is used as a collective term for syndromes characterized by discomfort,
impairment, disability, or persistent pain in joints, muscles, tendons, and other soft
tissues, with or without physical manifestations (Kroemer, 1992). CTDs may be caused
by repeated and/or forceful exertions, often in the hand-arm-shoulder region (Kroemer,
1989 and 1992). The most common and well-known musculoskeletal disorder occurring
in the VDT workplace is carpal tunnel syndrome (CTS). CTS is thought to be
aggravated/caused by repetitive motion, extension, flexion and twisting o f the wrist,
which leads to compression on the median nerve passed through the carpal tunnel. Some
CTS cases have been reported among computer keyboard workers in U.S. (Occupational
Safety & Health Reporter, 1992b). Other hand/wrist-related CTDs associated with VDT
use include ulnar and radial nerve compression, tendinitis and forms o f tenosynovitis
(Lyon, 1992). Apart from wrists, the major sites o f discomfort reported by VDT
operators are the shoulder and neck areas (Bergqvist, 1984; Hunting et al., 1981; Lu et
al. 1993a,.1993b; Sauter et al., 1991). Pain, tenderness and stiffness in the neck (tension
neck syndrome) has been shown to be more prevalent among data entry operators than
among other office workers. The Japanese authors (Committee on cervicobrachial
syndrome o f JAIH (1973), Hosokawa (1979)) as well as Laubli et al. (1980) interpret
these troubles in the upper extremities as a functional and organic disease o f the
locomotor system and call it the 'occupational cervicobrachial' syndrome.
According to a recent study by National Institute for Occupational Safety and
Health (NIOSH), twenty-two percent o f U.S. West Communications workers whose
jobs required use o f VDT had potential work-related musculoskeletal disorders and
symptoms. This study reported that 15 percent o f the 533 total participants had tendon-
related upper extremity disorders; 8 percent had muscle-related upper extremity
disorders; 4 percent had nerve entrapment syndrome; 3 percent had ganglion cysts; and 3
percent had joint-related disorders. The hand/wrist area was the body part affected in 12
percent o f the study's subjects; neck area in 9 percent; elbow area in 7 percent; and
shoulder area in 6 percent (NIOSH, 1992). LeGrande (1993) also reported catastrophic
occurrences o f repetitive motion health symptoms and disorders among the directory
assistance operators o f the Communications Workers o f America (CWA). The 1992
survey indicated the following symptoms: hand and wrist pain (73%), numbness or
tingling o f fingers (59%), arm and shoulder pain (78%), neck or back pain (86%), and
leg pain (53%).
Sauter et al. (1991) reported high prevalence rates o f musculoskeletal discomfort
among 539 data entry VDT users. Almost constant discomfort was most common for
the low back (33% o f respondents), followed by neck and buttocks discomfort, each
reported at the almost constant level by 27% of respondents. Almost constant right
shoulder discomfort was reported by 15% o f respondents. The findings suggest the need
for greater attention to relief o f stress to the neck, shoulder girdle, and wrist in VDT
work.
2.3.2 VISION PROBLEMS
VDT-users have a high incidence o f eye discomfort. Reported incidence from
field studies vary, levels between 40-92% (at least occasional) to 10-40% (daily) have
10
been reported (World Health Organization, 1987). The most common vision-related
complaint reported by VDT operators is that o f fatigue — tired, aching eyes and "heavy"
eyelids. Other frequently voiced complaints are o f irritation (burning, itching, watery
eyes), blurred vision, and difficulty in focusing. Some workers also complain that their
perception o f color is altered after prolonged VDT use (Bureau o f National Affairs,
1984; NIOSH, 1981).
Vision complaints were classified as ocular or visual symptoms. Ocular
symptoms were defined as any incident o f ocular discomfort such as tired eyes, dry eyes,
tearing/itching eyes, burning eyes, sore eyes, and red eyes. Visual symptoms were
defined as any incident o f impaired vision such as blurred vision and double vision
(Bruno, 1993; Collins, et al., 1990; Howarth and Istance, 1986; Laubli, et al., 1981;
Schleifer, et al., 1990). Duke-Elder and Abrams (1970) classify the eye symptoms as
visual (especially blurring), ocular(the eyes feel tired, hot, uncomfortable, or painful),
referral(e.g. headaches), and functional (behavioral). Some other researchers just use the
term visual fatigue or asthenopic as a reference to any subjective visual symptom or
distress resulting from use o f one's eyes (National Research Council, 1983; Rubino et al.,
1993; Tyrrell and Leibowitz, 1990; Watten et al., 1992).
The visual discomfort experienced by VDT operators tends to persist longer
than that experienced by other office workers. Laubli et al. (1981) interviewed both
VDT operators and traditional office workers and found that in the data-entry terminal
group the incidence o f visual impairments apparent the next morning was still noticeable;
however, it was nearly zero in traditional office work. Some health professionals and
ergonomists have raised the possibility that more serious, permanent eye damage may
result from prolonged VDT use. Considerable debate has been focused at the question o f
pathological changes o f the eyes. Acquired myopia has also figured in recent discussions.
2.3.3 PSYCHOLOGICAL STRESS
Stress is another major health problem among VDT operators, particularly
among those performing clerical tasks. A 1977 NIOSH study (cited by Bureau of
National Affairs, 1984) reported that office workers (secretaries, office managers, and
managerial administrators) were among the 12 (out o f 130) occupations associated with
the highest levels o f stress-related disease. This study shows that secretaries had the
second highest incidence o f stress-related diseases. The stress generally experienced by
clerical office workers due to boredom and lack o f autonomy tends to be exacerbated by
VDT work. According to a 1981 NIOSH study (NIOSH, 1981), anxiety, irritability,
sleep disorders, and fatigue — classic symptoms o f job stress — are prevalent among
VDT clerical workers. These conditions represent only the immediate effects o f job
stress; the long-term effects remain unknown.
2.3.4 OTHER HEALTH COMPLAINTS
Some general physical symptoms, such headaches, stomach pain, and ringing or
buzzing in ears, are also found in VDT operators. In NIOSH 1979 survey, ringing or
buzzing ears and stomach pain among VDT operators are higher than non-VDT
operators in all three sites surveyed (NIOSH, 1981).
In addition to the above symptoms, skin symptoms related to VDT work have
been reported since the late seventies, mainly from Scandinavian countries (Stenberg,
1993). However, many explanations for skin symptoms appearing in VDT workers have
been offered without any consensus being reached. Physical as well as psychological and
social factors have been suggested but many investigators even question the very
existence o f skin problems related to VDT work (Stenberg, 1993).
Another health issue among VDT workers is regarding the possibility that a
woman's work with a VDT during her pregnancy may influence the outcome o f her
pregnancy. This concern did originated with the published descriptions o f "clusters of
12
unfavorable pregnancy outcomes," i.e., the occurrence of several miscarriages within an
identifiable group o f pregnant women working with VDTs. However, the
epidemiological studies that have been performed have not been able to demonstrate an
association between work with a VDT during pregnancy and increased risks o f
miscarriage, giving birth to a malformed child, or growth retardation o f the fetus
(Bergqvist and Knave, 1993).
2.3.5 SUMMARY
In summary, VDT work is a close visual task involving frequent eye movement,
high concentration, repetitive hand motion and static sitting posture. Past studies have
show high prevalence rates o f complaints of musculoskeletal discomfort, visual
discomfort and stress. These reported complaints may be related to VDT use and/or the
work environment.
CHAPTER 3
LITERATURE REVIEW
Concerns about possible health effects o f video display terminals have prompted
numerous public and private studies seeking to determine whether the VDT and its
environment do, in fact, adversely affect the worker's health.
3.1 RISK FACTORS
Many factors have been identified which may affect VDT operator performance
and physical symptoms. These factors can be summarized into the following categories:
demographics/personal characteristics, VDT exposure/task demands, computer system
and equipment design, workstation design, work environment, psychosocial factors,
work posture, and psychological stress.
3.1.1 DEMOGRAPHICS
Individual factors such as age, sex, eye quality and work habit may have certain
effect on the worker's performance and health (Asakura and Fujigaki, 1993; Bergqvist et
al.,1990; NIOSH, 1992; Pot et al., 1987; Sauter, 1984; Sjogren & Elfstrom, 1990).
Asakura and Fujigake (1993) found that the impact o f office computerization on
the perceived job characteristics (psychosocial factors) differs by gender; males appeared
to be influenced greater than females. Lim and Carayon (1993) found that gender was
significantly related to upper extremity cumulative trauma disorders (UECTD); women
reported higher UECTD than men.
Sauter (1984) found that age and marital status were related to the strain
measure (job dissatisfaction, mood disturbance and illness symptoms) and contributed
14
10-30% o f the explained variance in these strain measures. The fact that increasing age
predicts reduced strain, is said to attributed to survival ("healthy worker") effect.
Pot et al. (1987) found that eye fatigue appeared to be related to eye quality.
Sjogren and Elfstrom (1990) found that VDT users with lower visual acuity reported
more eye discomfort than those with higher visual acuity. However, this was valid only
in the younger age-group. In the older group, the age factor seemed to be more
important than low visual acuity. Sauter found significant effect o f the need for
corrective eyewear in the prediction o f eye complaints after adjusting for age. Consistent
with observations by other researchers (Cakir et al., 1978; Laubli et al., 1981), VDT-
users with corrective eyewear reported greater eye strain that those without. The effect
was restricted mainly to users o f monofocal lenses. These effects were much less evident
in the control group (non-VDT users) (Sauter, 1984). Schleifer et al. (1990) reported an
interaction between age and eyewear in the prediction o f ocular discomfort. Older
workers (i.e., age>40) with glasses reported much less discomfort than did older workers
without glasses. However, Laubli et al. (1981) concluded that work at VDTs may cause
impairments in operators both with and without eye defects. A recent NIOSH study also
found that factors associated with upper extremity disorders included demographics and
prior medical conditions (NIOSH, 1992).
However, some studies found weak or no relationship between demographic data
and musculoskeletal discomfort. Sauter and Schleifer (1991) investigated
musculoskeletal discomfort and related factors among 539 data entry VDT users. The
regression analyses, which is aimed at examining the effects o f demographics (i.e., age,
height, weight, mass and glasses) and VDT exposure variables (i.e., VDT hours and
tenure) on each musculoskeletal discomfort measure demonstrates that all o f the
demographic and VDT exposure variables, except weight and glasses, have an effect on
at least one o f the discomfort measures. However, none o f the demographic or VDT
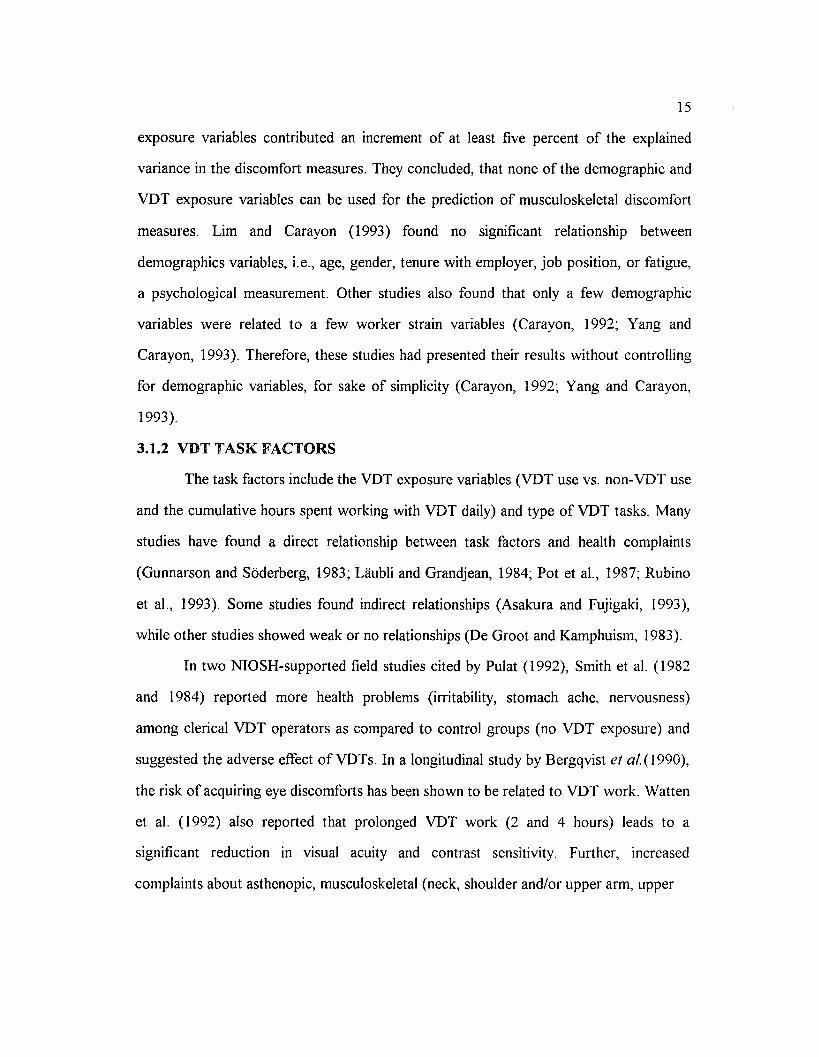
15
exposure variables contributed an increment o f at least five percent o f the explained
variance in the discomfort measures. They concluded, that none o f the demographic and
VDT exposure variables can be used for the prediction o f musculoskeletal discomfort
measures. Lim and Carayon (1993) found no significant relationship between
demographics variables, i.e., age, gender, tenure with employer, job position, or fatigue,
a psychological measurement. Other studies also found that only a few demographic
variables were related to a few worker strain variables (Carayon, 1992; Yang and
Carayon, 1993). Therefore, these studies had presented their results without controlling
for demographic variables, for sake o f simplicity (Carayon, 1992; Yang and Carayon,
1993).
3.1.2 VDT TASK FACTORS
The task factors include the VDT exposure variables (VDT use vs. non-VDT use
and the cumulative hours spent working with VDT daily) and type o f VDT tasks. Many
studies have found a direct relationship between task factors and health complaints
(Gunnarson and Soderberg, 1983; Laubli and Grandjean, 1984; Pot et al., 1987; Rubino
et al., 1993). Some studies found indirect relationships (Asakura and Fujigaki, 1993),
while other studies showed weak or no relationships (De Groot and Kamphuism, 1983).
In two NIOSH-supported field studies cited by Pulat (1992), Smith et al. (1982
and 1984) reported more health problems (irritability, stomach ache, nervousness)
among clerical VDT operators as compared to control groups (no VDT exposure) and
suggested the adverse effect o f VDTs. In a longitudinal study by Bergqvist et a l (1990),
the risk o f acquiring eye discomforts has been shown to be related to VDT work. Watten
et al. (1992) also reported that prolonged VDT work (2 and 4 hours) leads to a
significant reduction in visual acuity and contrast sensitivity. Further, increased
complaints about asthenopic, musculoskeletal (neck, shoulder and/or upper arm, upper
16
back and/or low back), and other symptoms, i.e., general tiredness and concentration
problems, were reported.
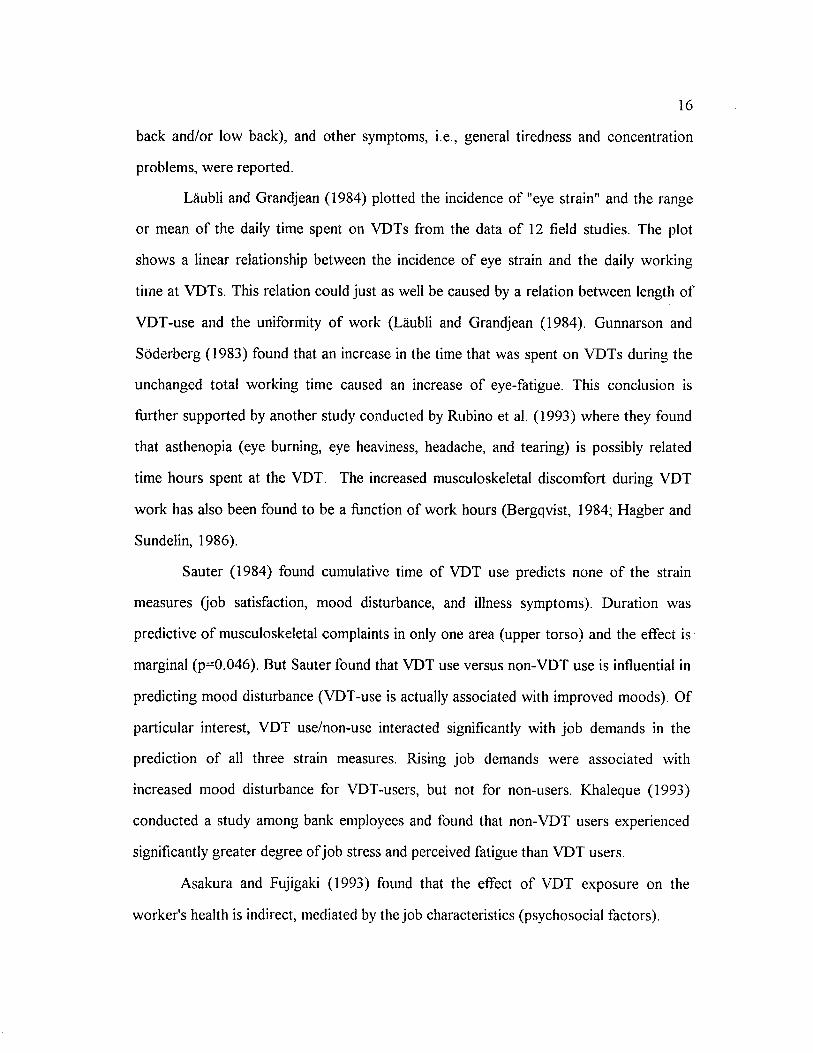
Laubli and Grandjean (1984) plotted the incidence o f "eye strain" and the range
or mean o f the daily time spent on VDTs from the data o f 12 field studies. The plot
shows a linear relationship between the incidence o f eye strain and the daily working
time at VDTs. This relation could just as well be caused by a relation between length o f
VDT-use and the uniformity o f work (Laubli and Grandjean (1984). Gunnarson and
Soderberg (1983) found that an increase in the time that was spent on VDTs during the
unchanged total working time caused an increase o f eye-fatigue. This conclusion is
further supported by another study conducted by Rubino et al. (1993) where they found
that asthenopia (eye burning, eye heaviness, headache, and tearing) is possibly related
time hours spent at the VDT. The increased musculoskeletal discomfort during VDT
work has also been found to be a function o f work hours (Bergqvist, 1984; Hagber and
Sundelin, 1986).
Sauter (1984) found cumulative time o f VDT use predicts none o f the strain
measures (job satisfaction, mood disturbance, and illness symptoms). Duration was
predictive o f musculoskeletal complaints in only one area (upper torso) and the effect is
marginal (p=0.046). But Sauter found that VDT use versus non-VDT use is influential in
predicting mood disturbance (VDT-use is actually associated with improved moods). O f
particular interest, VDT use/non-use interacted significantly with job demands in the
prediction o f all three strain measures. Rising job demands were associated with
increased mood disturbance for VDT-users, but not for non-users. Khaleque (1993)
conducted a study among bank employees and found that non-VDT users experienced
significantly greater degree o f job stress and perceived fatigue than VDT users.
Asakura and Fujigaki (1993) found that the effect o f VDT exposure on the
worker's health is indirect, mediated by the job characteristics (psychosocial factors).
17
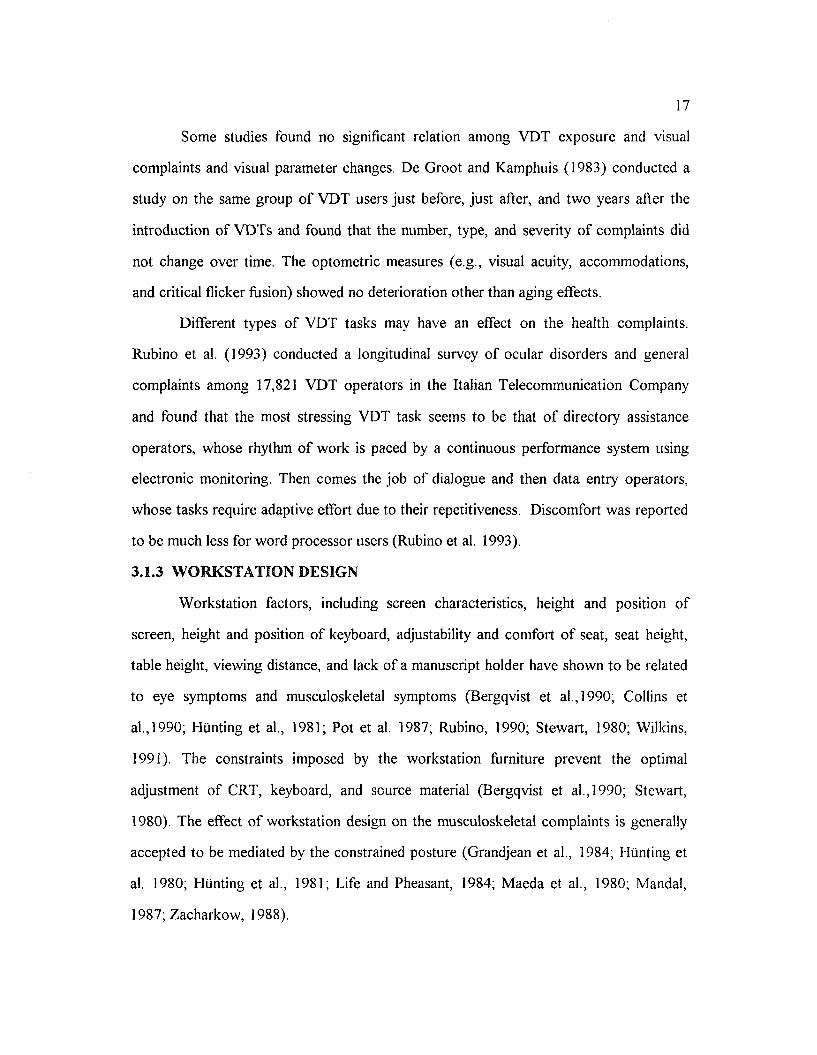
Some studies found no significant relation among VDT exposure and visual
complaints and visual parameter changes. De Groot and Kamphuis (1983) conducted a
study on the same group o f VDT users just before, just after, and two years after the
introduction o f VDTs and found that the number, type, and severity o f complaints did
not change over time. The optometric measures (e.g., visual acuity, accommodations,
and critical flicker fusion) showed no deterioration other than aging effects.
Different types o f VDT tasks may have an effect on the health complaints.
Rubino et al. (1993) conducted a longitudinal survey o f ocular disorders and general
complaints among 17,821 VDT operators in the Italian Telecommunication Company
and found that the most stressing VDT task seems to be that o f directory assistance
operators, whose rhythm o f work is paced by a continuous performance system using
electronic monitoring. Then comes the job o f dialogue and then data entry operators,
whose tasks require adaptive effort due to their repetitiveness. Discomfort was reported
to be much less for word processor users (Rubino et al. 1993).
3.1.3 WORKSTATION DESIGN
Workstation factors, including screen characteristics, height and position o f
screen, height and position o f keyboard, adjustability and comfort o f seat, seat height,
table height, viewing distance, and lack o f a manuscript holder have shown to be related
to eye symptoms and musculoskeletal symptoms (Bergqvist et al.,1990; Collins et
al.,1990; Hunting et al., 1981; Pot et al. 1987; Rubino, 1990; Stewart, 1980; Wilkins,
1991). The constraints imposed by the workstation furniture prevent the optimal
adjustment o f CRT, keyboard, and source material (Bergqvist et al.,1990; Stewart,
1980). The effect o f workstation design on the musculoskeletal complaints is generally
accepted to be mediated by the constrained posture (Grandjean et al., 1984; Hunting et
al. 1980; Hunting et al., 1981; Life and Pheasant, 1984; Maeda et al., 1980; Mandal,
1987; Zacharkow, 1988).
18
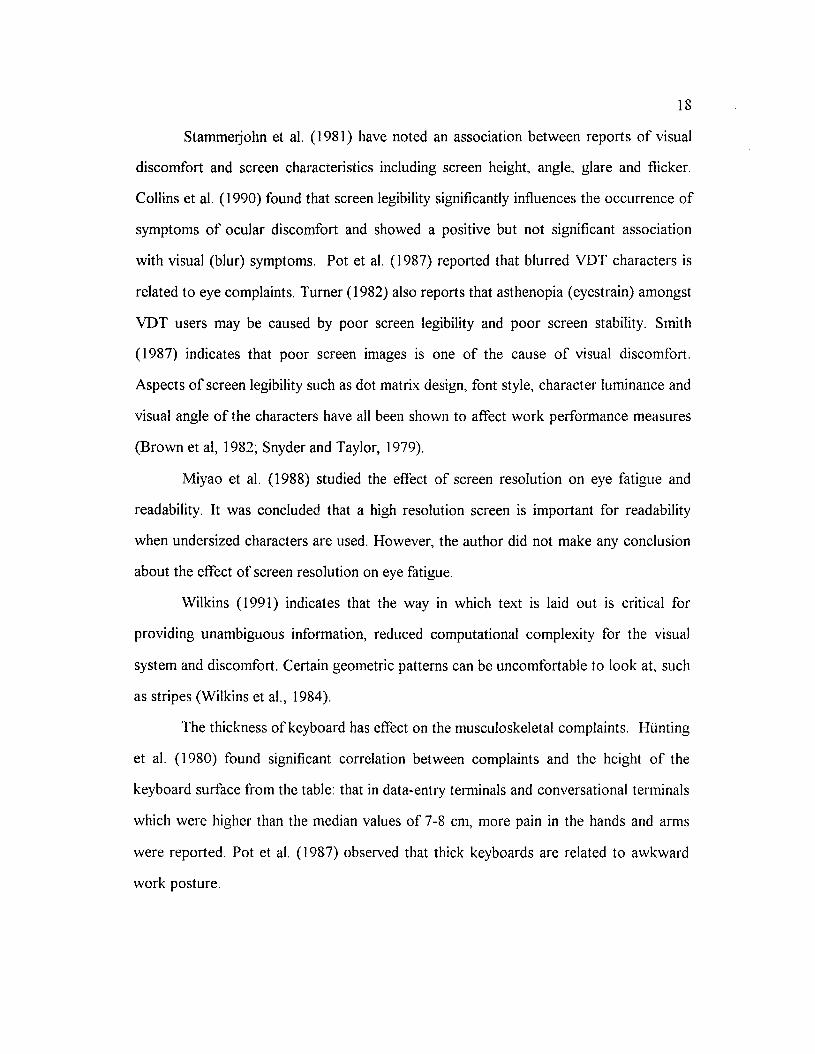
Stammerjohn et al. (1981) have noted an association between reports o f visual
discomfort and screen characteristics including screen height, angle, glare and flicker.
Collins et al. (1990) found that screen legibility significantly influences the occurrence of
symptoms o f ocular discomfort and showed a positive but not significant association
with visual (blur) symptoms. Pot et al. (1987) reported that blurred VDT characters is
related to eye complaints. Turner (1982) also reports that asthenopia (eyestrain) amongst
VDT users may be caused by poor screen legibility and poor screen stability. Smith
(1987) indicates that poor screen images is one o f the cause o f visual discomfort.
Aspects o f screen legibility such as dot matrix design, font style, character luminance and
visual angle o f the characters have all been shown to affect work performance measures
(Brown et al, 1982; Snyder and Taylor, 1979).
Miyao et al. (1988) studied the effect o f screen resolution on eye fatigue and
readability. It was concluded that a high resolution screen is important for readability
when undersized characters are used. However, the author did not make any conclusion
about the effect o f screen resolution on eye fatigue.
Wilkins (1991) indicates that the way in which text is laid out is critical for
providing unambiguous information, reduced computational complexity for the visual
system and discomfort. Certain geometric patterns can be uncomfortable to look at, such
as stripes (Wilkins et al., 1984).
The thickness o f keyboard has effect on the musculoskeletal complaints. Hunting
et al. (1980) found significant correlation between complaints and the height o f the
keyboard surface from the table: that in data-entry terminals and conversational terminals
which were higher than the median values o f 7-8 cm, more pain in the hands and arms
were reported. Pot et al. (1987) observed that thick keyboards are related to awkward
work posture.
19
Table height and keyboard height are significantly related to the frequency of
musculoskeletal complaints (Grandjean and Hunting, 1977; Hunting et al., 1980; Hunting
et al., 1981). Hunting et al., (1981) found that the lower the table and keyboards heights
above the floor, the more frequently pains in shoulder, neck and arms were indicated.
This relationship is clarified by the observations at workplaces: the higher the table, the
closer the documents were to eyes, then the better is the posture o f head and trunk, and
the fewer are the complaints since the documents were placed flat on the table at all
workplaces. Other surveys o f office workers (Grandjean and Hunting, 1977; and
Hunting et al., 1980) have found relationships between excessively high keyboard
positions and reported discomfort in the neck and shoulders. Pot et al. (1987) found that
instability o f the chair and lack o f space for legs are associated with musculoskeletal
complaints.
The height o f screen has an effect on operator's typing performance and
perceived musculoskeletal discomfort. This study conducted by Lu and Aghazadeh
showed that placing the screen at eye level results in fewer complaints o f the discomfort
in the neck, shoulder and upper back.
Viewing distance is an important factor that determines the load on
accommodation and convergence o f the eyes. The shorter the distance at which the eyes
fixate, the greater becomes the force exerted by the ciliary muscle (Fisher, 1977). Thus,
the closer the visual object the greater becomes the strain o f fusion. It is generally
accepted that excessive tension o f the ciliary and extraocular muscles produces visual
strain and that, as a consequence, visual strain increases as the viewing distance shortens
(Jaschinski-Kruza, 1988). Jaschinski-Kruza (1988) conducted a laboratory experiment to
examine the viewing distance (i.e. 50cm and 100cm) to VDT and visual strain. The result
shows that subjective reported visual strain was higher in the 50cm condition comparing
with 100cm condition.
2 0
Workstation variables are related to working postures. Pot et al., (1987)
indicated that absence o f manuscript holders and difficult or absent height-adjustability
o f VDT's and keyboards, in combination with lack o f footrests and thick keyboards are
related to awkward work posture. Wall et al. (1992) found that placing the VDT
monitor at eye height (middle o f the screen) would improve an operator's sitting posture.
A field study conducted by Coniglio and Paci (1987) among software design
workstations shows that the heaviest restrictions imposed by the hardware (height,
width, and depth o f the table, and height and design o f the chair) refer to the eye-screen
distance, head movement and curvature o f the trunk.
Zacharkow (1988) and Maeda (1977) indicated that the key to reducing the
potential for musculoskeletal stress at VDTs and other office machines is a well-
designed, adjustable workstation that will provide proper body stabilization for the
specific tasks being performed. Several studies have already demonstrated a reduction in
musculoskeletal complaints or stress, along with an increase in productivity, as a result
o f properly designed workstations (Dainoff, 1983, 1984b; Grandjean, et al. 1984; Ong,
1984; Pustinger et al., 1985; Secrest and Dainoff, 1984; ). A field study by Grandjean et
al. (1984) shows that after the adjustment of the workstation to the preferred settings
and using the chair with high backrest, the majority o f the operators rated their body
postures as relaxed, and the musculoskeletal complaints were reduced significantly.
3.1.4 WORK ENVIRONMENT
Poor ambient light level has been found to be a cause o f eye-strain (Bergqvist et
al.,1990; Sauter, 1984; Stewart, 1980; Wilkins, 1991). The variables in the evaluation o f
lighting condition are illuminance at screen, keyboard, document, and work surface;
screen background luminance; keyboard luminance, screen-background luminance ratio,
screen reflectance, average background luminance; presence o f a luminaire and/or
21
window in the visual field; brightness o f the luminaire or window; and visual angle to the
luminaire or window (Sauter, 1984; Schleifer et al., 1990).
Sauter (1984) found that eye-strain is significantly associated with illumination at
keyboard and worksurface. However, display related variables (luminance, screen-
background luminance ratio, reflectance, and glare) are not directly related to eye-strain,
but they tend to be related to ambient lighting indicators.
Schleifer et al. (1990) found that eye discomfort increases for VDT users with a
window in the visual foreground. They also found an interaction between the
illumination at the keyboard and the illumination at display. The interactive effect
suggests that when keyboard illumination is low (possibly indicating insufficient
workstation illumination), increasing illumination at the display might be associated with
improved lighting for visual tasks and, hence, reduced discomfort. On the other hand,
increasing screen illumination at other than low levels o f keyboard illumination may
create the potential for discomfort or disability glare and, thus, visual discomfort.
However, the model is generated under a relaxed stepping criteria (i.e., relaxed
significance level).
High contrast between the screen and the surrounding area, especially between
the screen and the source document, cause long lasting eye fatigue. Laubli et al. (1981)
found that incidence o f eye impairments at the end o f work was increased amongst the
high contrast group and continued during leisure time and even until next morning.
However, in typists and traditional office work there was no significant relation between
contrast and eye fatigue. Among users of data-entry terminals, impairments were
increased in the group with a high contrast between source documents and the table.
3.1.5 PSYCHOSOCIAL FACTORS
Psychosocial factors are recognized to be critical in both the causation and the
prevention o f disease and in the promotion o f health (Kalimo, 1987). Psychosocial
2 2
factors are "pertaining to or concerning the mental factors or activities which determine
the social relations o f an individual" (Webster's New Twentieth Century Dictionary of
English Language, p. 1451). Some indicators o f psychosocial factors are: work pressure,
quantitative workload, work pace, job control, utilization o f skills, task clarity, social
support from supervisor, colleague support, and job future ambiguity (Carayon, 1992;
Mclaney, 1988, Rogers, et al., 1990; Sauter et al., 1989; Staifort, 1990; Stellman et al.,
1987).
A NIOSH study found that the work practices, psychosocial aspects o f the
workplace, and electronic performance monitoring contribute to upper extremity
disorders and symptoms (NIOSH, 1992). This result is supported by other research
(Bergqvist et al.,1990; Lim and Carayon, 1993; Sauter, et al., 1992; Smith et al., 1992).
A group o f NIOSH researchers conducted a field study o f newspaper and
telecommunication workers to examine job risk factors for upper extremity
musculoskeletal disorders and concluded that job factors such as heavy work pressure
and surges in workload, lack o f job security, lack o f social support and amount o f VDT
work were predictors o f upper extremity symptoms and disorders (Sauter et al. 1992).
Psychosocial factors are significant predictors o f psychological stress outcomes
(i.e. tension, anxiety, depression and fatigue) (Jarvenpaa et al., 1993; Miezio, et al.,
1987; Rogers et al., 1990). Lim and Carayon (1993) found that the effect of
psychosocial factors is indirectly related to the upper extremity cumulative trauma
disorders through psychological stress and ergonomic risk factors (i.e., repetition and
posture). Carayon et al., (1993) found that task control is related to decreased levels of
several job stressors which, in turn, are related to several measures o f worker stress
(mood disturbances, anxiety, and distress).
Pot et al., (1987) found an interactive relation between health complaints on the
one hand and the percentage o f working with VDT, work pressure (time pressure,
23
mentally strenuous work, etc.), and work atmosphere (promotion possibilities, pay, etc.)
experienced on the other hand. It was concluded that headache, eye fatigue,
musculoskeletal complaints and complaints of general fatigue and nervousness are
related to a combination o f VDT exposure, substantial work pressure, and a poor work
atmosphere (Pot et al., 1987).
3.1.6 PSYCHOLOGICAL STRESS
Psychological disorders in the workplace have been identified as being among the
10 leading work-related diseases and injuries (NIOSH, 1988). NIOSH (1988)
recommended that "specific attention should be given to the increasing body o f evidence
linking physical illness and psychological factors (p.3). Psychological stress measures are
usually boredom, fatigue, tension-anxiety, distress, anger, and depression (Carayon,
1992; McNair et al., 1971; Rogers et al., 1990; Sainfort, 1990). Psychological stress is
found to be a mediator o f the effect o f psychosocial factors on musculoskeletal
discomfort and disorders (Lim and Carayon, 1993). However, no further literature can
be found to link psychological stress and musculoskeletal discomfort and visual fatigue.
3.1.7 AWKWARD WORKING POSTURE
It has been recognized that poor working posture (awkward posture) is a
potential risk factor for musculoskeletal problems in VDT work (Boussenna et al., 1982;
Grandjean, 1987; Life and Pheasant, 1984; Lim and Carayon, 1993; World Health
Organization, 1987; Zacharkow, 1988).
Life and Pheasant (1984) indicated that the stressful posture may cause physical
fatigue and/or discomfort. A stressful posture is defined here as that is maintained by
sustained active tension o f the musculature and/or by passive loading (compression or
tension) o f tissue. The requirement to maintain such postures for long periods is
considered undesirable, because static muscular tension can only be maintained with the
occurrence o f certain physiological and psychological costs: the use o f energy and the
24
production o f waste products, which, in turn give rise to fatigue and discomfort. The
effects will occur more quickly under static conditions, as a consequence o f ischaemia (a
reduction in the blood supply to the muscles caused by their own contraction). The
compression o f tissue for long periods can also lead to acute or chronic symptoms or
discomfort or disability (Life and Pheasant, 1984).
Working posture is determined by the interaction o f many factors in the work
place. Features o f workstation layout (e.g. the height, orientation, and location o f the
VDT, keyboard, and supporting surface) determine how a worker must position his/her
body when performing a task. Visual demands interact with workstation to determine the
posture o f the neck and trunk. The anthropometric characteristics o f a worker interact
with all o f the above factors to determine the specific postures used to perform a job
(Life and Pheasant, 1984; Pot et al. 1987).
Life and Pheasant (1984) found from an experiment that increasing keyboard
height and placing the source document flat on the table would result in stressful
shoulder and arm postures and increase discomfort. Other studies have found that one
result o f poor ergonomic placement o f the screen and source documents is an excessive
forward inclination o f the head, which is associated with an increase in musculoskeletal
complaints from the operator (Hunting et al., 1981; Maeda et al., 1982; Sauter et al.,
1983).
An increased forward tilt o f the head will result in an increased static loading o f
the posterior neck muscles, as well as an increase in the cervical spine compression
forces (Chaffin, 1973; Less and Eickelberg, 1976). An increase in forward inclination o f
the head is associated with musculoskeletal complaints involving the posterior neck,
shoulders, and upper back (Hunting et al., 1981; Maeda et al., 1982; Grandjean et al.,
1982); it is a major cause o f headache with VDT and other office machine operators
25
(Robinson, 1980; Stewart, 1979; Travell, 1967); It can also increase the stress on the
lower back (Grandjean et al., 1982).
Collins et al.(1990) found that vertical head movements significantly affected the
incidence o f postural/headache symptoms. The greater the amount and frequency o f
vertical head deviation when performing tasks at the VDT, the lower the incidence of
postural/headache symptoms. However, Lim and Carayon (1993) found that repetitive
movement and dynamic posture are associated with more complaints o f musculoskeletal
symptoms.
3.1.8 INTERACTIONS OF RISK FACTORS
Besides the direct and indirect effect o f the risk factor on the health complaints
(musculoskeletal discomfort and visual complaints), some studies have found the effect
o f the interaction o f the risk factors within the same category o f variables, such as the
age and eye quality (Sjogren and Elfstrom, 1990), VDT use and job demands (Sauter,
1984), illumination at keyboard and display (Schleifer et al., 1990). However, only one
study has examined the interaction o f the risk factors in different categories.
Pot et al. (1987) found a significant interactive relationship among health
complaints on the one hand and the percentage o f time o f working with VDT, work
pressure (time pressure, mentally strenuous work, etc.), and work atmosphere
(promotion possibilities, pay, etc.) experienced on the other hand: However, the
relationship is week.
3.1.9 SUMMARY
The possible risk factors for the health complaints in the VDT workplace are
listed in Table 3.1 and Table 3.2. Table 3.1 lists the summary o f risk factors and their net
effects which have been discussed above. Table 3.2 summaries the possible causal
relationships according to the stress and strain outcomes.
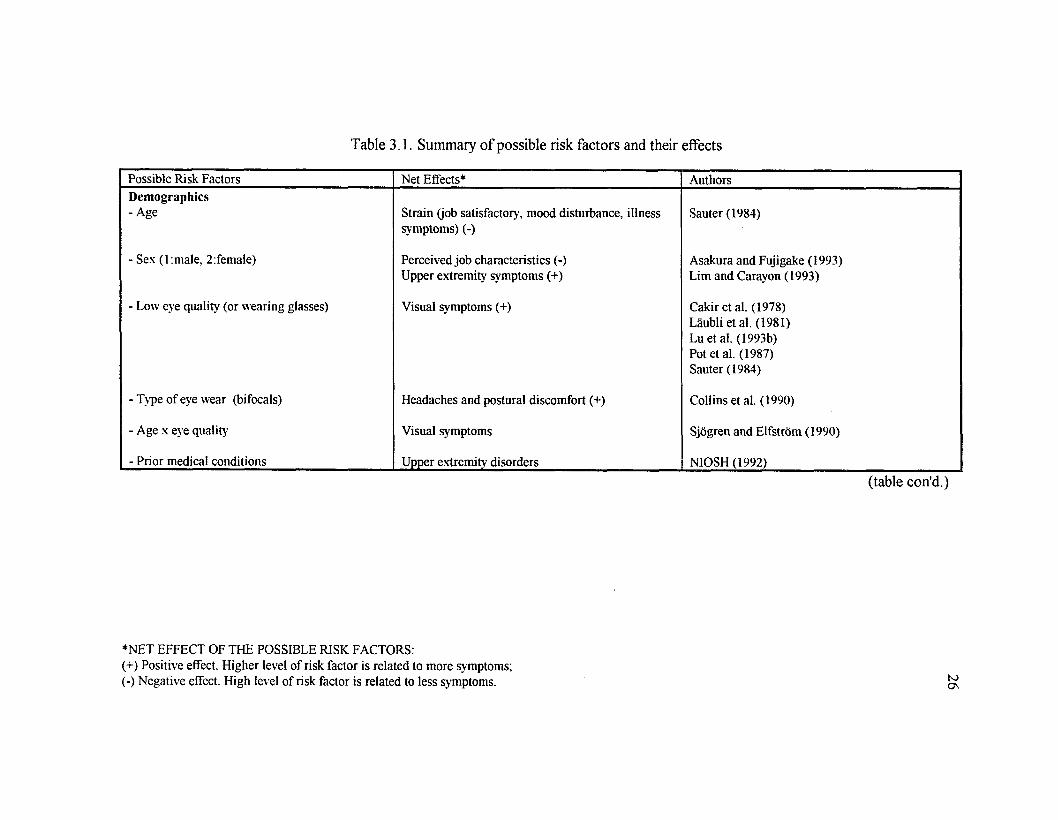
Table 3.1. Summary o f possible risk factors and their effects
Possible Risk Factors Net Effects^ AuthorsDemographics-A ge Strain (job satisfactory, mood disturbance, illness
symptoms) (-)Sauter (1984)
- Sex (Lmale, 2:female) Perceived job characteristics (-) Upper extremity symptoms (+)
Asakura and Fujigake (1993) Lim and Carayon (1993)
- Low eye quality (or wearing glasses) Visual symptoms (+) Cakir et al. (1978) Laubli etal. (1981) Luet al. (1993b) Pot et al. (1987) Sauter (1984)
- Type of eye wear (bifocals) Headaches and postural discomfort (+) Collins et al. (1990)
- Age x eye quality Visual symptoms Sjogren and Elfstrom (1990)
- Prior medical conditions Upper extremity disorders NIOSH (1992)(table con'd.)
♦NET EFFECT OF THE POSSIBLE RISK FACTORS:(+) Positive effect. Higher level o f risk factor is related to more symptoms;(-) Negative effect. High level o f risk factor is related to less symptoms. t o
ON
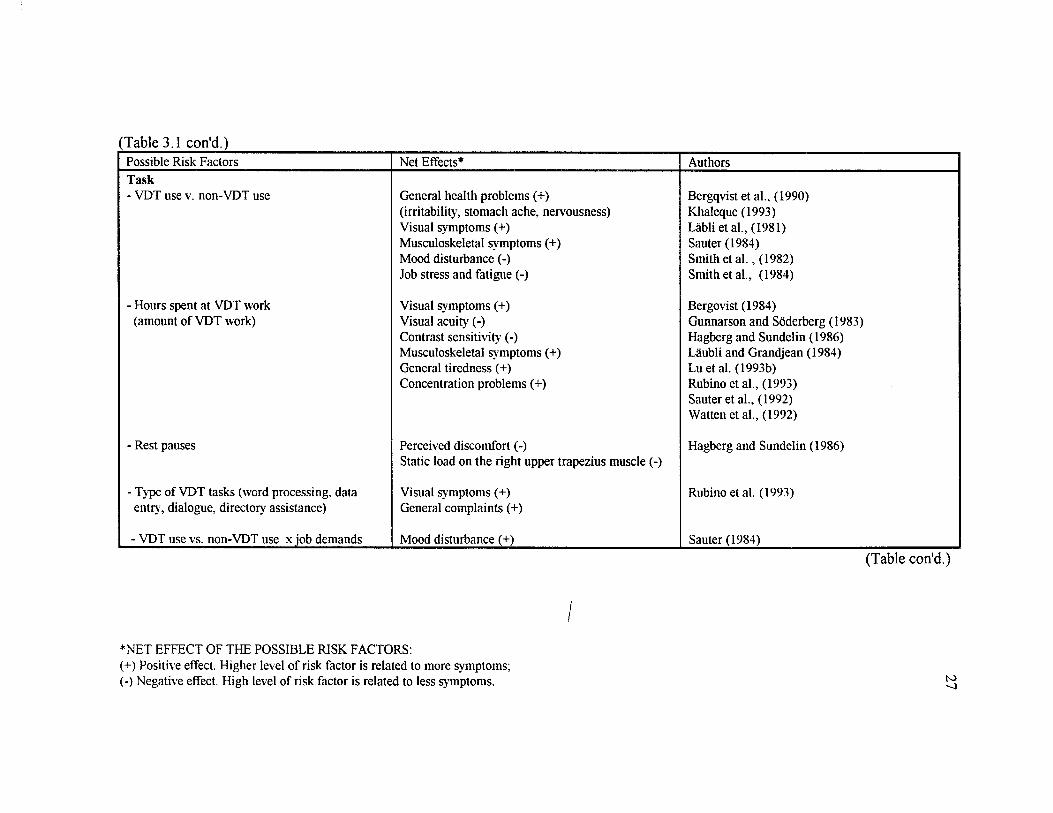
(T ab le 3.1 c o n 'd .)Possible Risk Factors Net Effects* AuthorsTask- VDT use v. non-VDT use General health problems (+)
(irritability, stomach ache, nervousness) Visual symptoms (+)Musculoskeletal symptoms (+)Mood disturbance (-)Job stress and fatigue (-)
Bergqvist et al., (1990) Khaleque (1993) Lablietal., (1981) Sauter (1984)Smith e ta l . , (1982) Smith eta!., (1984)
- Hours spent at VDT work (amount of VDT work)
Visual symptoms (+)Visual acuity (-)Contrast sensitivity (-) Musculoskeletal symptoms (+) General tiredness (+) Concentration problems (+)
Bergovist (1984)Gunnarson and Soderberg (1983) Hagberg and Sundelin (1986) Laubli and Grandjean (1984)Lu et al. (1993b)Rubino etal., (1993)Sauter etal., (1992)Watten et al., (1992)
- Rest pauses Perceived discomfort (-)Static load on the right upper trapezius muscle (-)
Hagberg and Sundelin (1986)
- Type of VDT tasks (word processing, data entry’, dialogue, directory assistance)
Visual symptoms (+) General complaints (+)
Rubino et al. (1993)
- VDT use vs. non-VDT use x job demands Mood disturbance (+) Sauter (1984)(Table con'd.)
/
*NET EFFECT OF THE POSSIBLE RISK FACTORS:(+) Positive effect. Higher level o f risk factor is related to more symptoms;(-) Negative effect. High level o f risk factor is related to less symptoms. N>
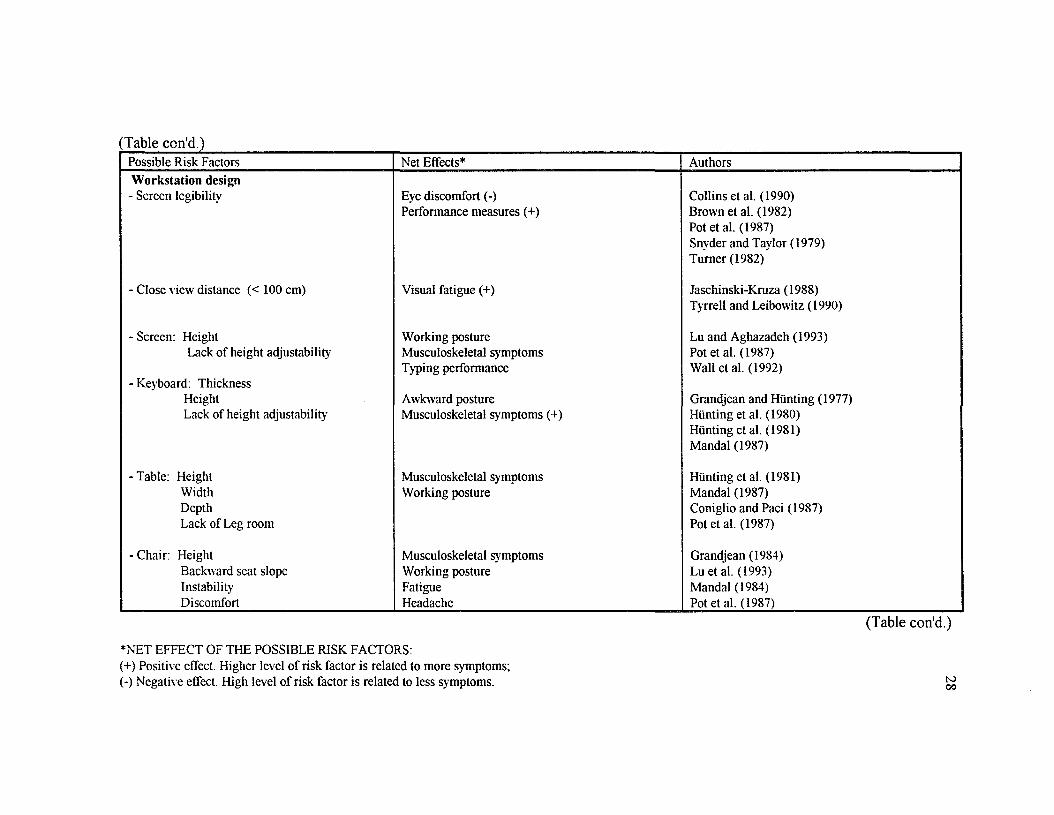
Table con'd.)Possible Risk Factors Net Effects* AuthorsWorkstation design - Screen legibility' Eye discomfort (-) Collins et al. (1990)
Performance measures (+) Brown et al. (1982)
- Close view distance (< 100 cm) Visual fatigue (+)
Pot etal. (1987)Snyder and Taylor (1979) Turner (1982)
Jaschinski-Kruza (1988)
- Screen: Height Working posture
Tyrrell and Leibowitz (1990)
Lu and Aghazadeh (1993)Lack of height adjustability Musculoskeletal symptoms Pot et al. (1987)
Typing performance Wall et al. (1992)- Keyboard: Thickness
Height Awkward posture Grandjean and Hunting (1977)Lack of height adjustability Musculoskeletal symptoms (+) Hunting et al. (1980)
-Table: Height Musculoskeletal symptoms
Hunting et al. (1981) Mandal (1987)
Hunting et al. (1981)Width Working posture Mandal (1987)Depth Coniglio and Paci (1987)Lack of Leg room Potet al. (1987)
- Chair: Height Musculoskeletal symptoms Grandjean (1984)Backward seat slope Working posture Lu et al. (1993)Instability Fatigue Mandal (1984)Discomfort Headache Pot et al. (1987)
(T ab le c o n 'd .)
*NET EFFECT OF THE POSSIBLE RISK FACTORS:(+) Positive effect. Higher level o f risk factor is related to more symptoms;(-) Negative effect. High level o f risk factor is related to less symptoms. to
00
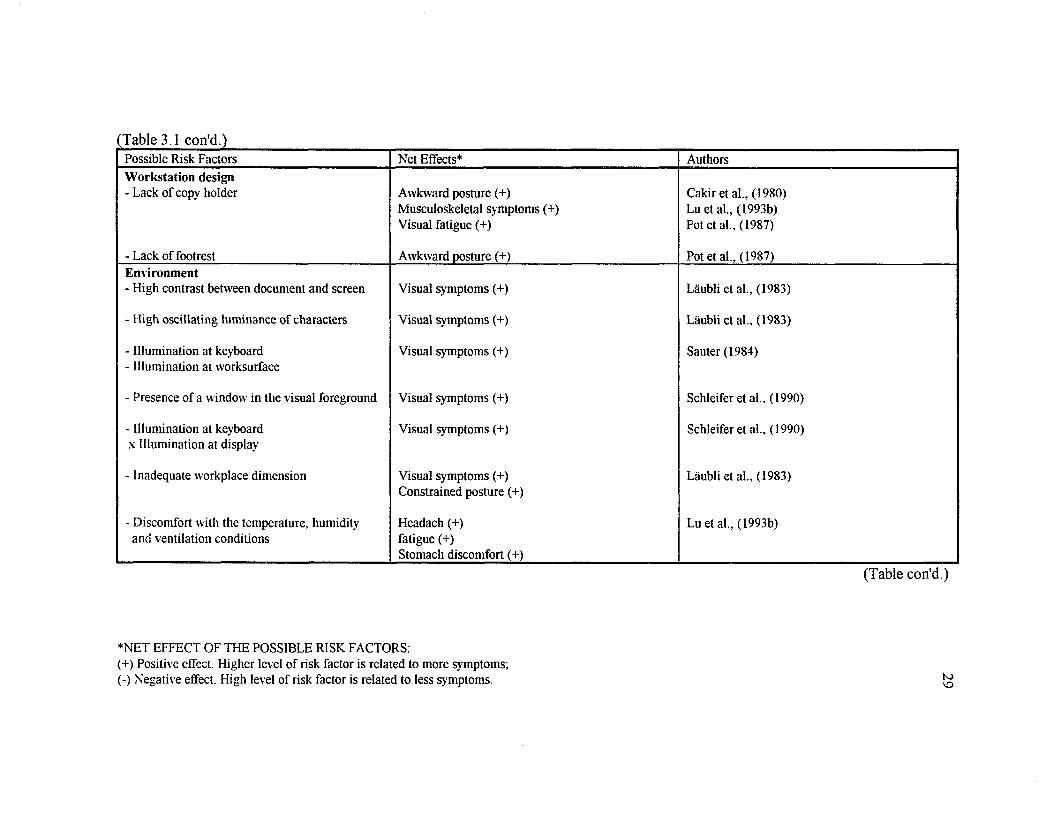
(T ab le 3.1 c o n 'd .)Possible Risk Factors Net Effects* AuthorsWorkstation design- Lack of copy holder Awkward posture (+)
Musculoskeletal symptoms (+) Visual fatigue (+)
Cakiretal., (1980) Luetal., (1993b) Pot et al., (1987)
- Lack of footrest Awkward posture (+) Pot etal., (1987)Environment- High contrast between document and screen Visual symptoms (+) Laubli et al., (1983)
- High oscillating luminance of characters Visual symptoms (+) Laubli et al., (1983)
- Illumination at keyboard- Illumination at vvorksurface
Visual symptoms (+) Sauter (1984)
- Presence of a window in the visual foreground Visual symptoms (+) Schleifer et al., (1990)
- Illumination at keyboard x Illumination at display
Visual symptoms (+) Schleifer et al., (1990)
- Inadequate workplace dimension Visual symptoms (+) Constrained posture (+)
Laubli et al., (1983)
- Discomfort with the temperature, humidity and ventilation conditions
Headach (+) fatigue (+)Stomach discomfort (+)
Lu et al., (1993b)
(Table con'd.)
*NET EFFECT OF THE POSSIBLE RISK FACTORS:(+) Positive effect. Higher level o f risk factor is related to more symptoms;(-) Negative effect. High level o f risk factor is related to less symptoms. to
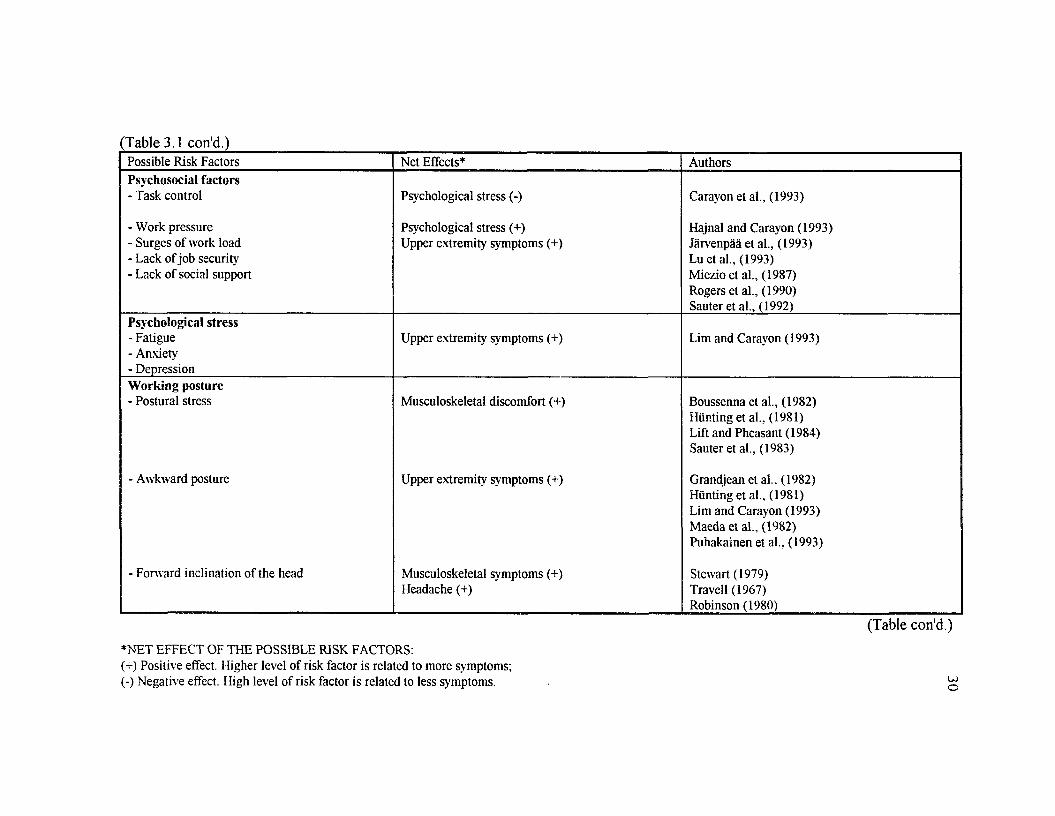
(T ab le 3.1 co n 'd .)Possible Risk Factors Net Effects* AuthorsPsychosocial factors - Task control Psychological stress (-) Carayon et al., (1993)
- Work pressure- Surges of work load- Lack of job security- Lack of social support
Psychological stress (+)Upper extremity symptoms (+)
Hajnal and Carayon (1993) Jarvenpaa et al., (1993) L uetal., (1993)Miezio et al., (1987)Rogers et al., (1990)Sauter et al., (1992)
Psychological stress- Fatigue- Anxiety- Depression
Upper extremity symptoms (+) Lim and Carayon (1993)
Working posture- Postural stress Musculoskeletal discomfort (+) Boussenna et al., (1982)
Hunting et al., (1981) Lift and Pheasant (1984) Sauter et al., (1983)
- Awkward posture Upper extremity symptoms (+) Grandjean et al., (1982) Hunting et al., (1981) Lim and Carayon (1993) Maeda et al., (1982) Puhakainen et al., (1993)
- Forward inclination of the head Musculoskeletal symptoms (+) Headache (+)
Stewart (1979) Travell (1967) Robinson (1980)
(T ab le c o n 'd .)
♦NET EFFECT OF THE POSSIBLE RISK FACTORS:(+) Positive effect. Higher level o f risk factor is related to more symptoms;(-) Negative effect. High level o f risk factor is related to less symptoms. u>
o
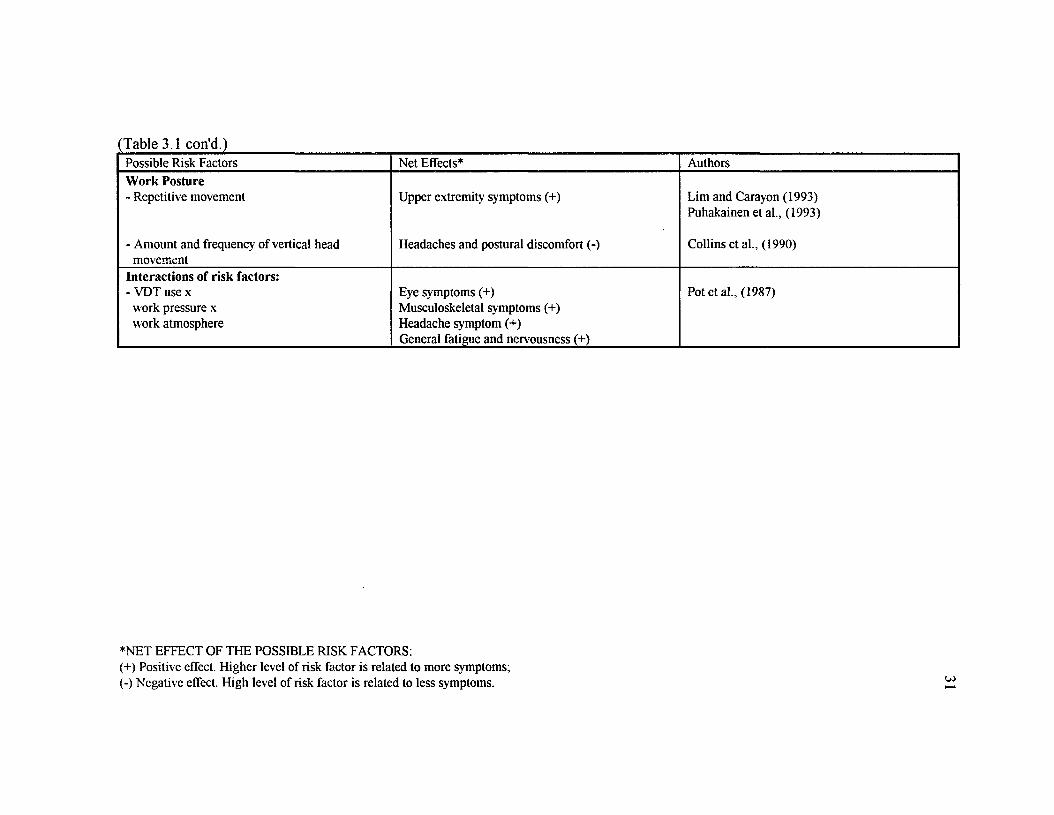
(T ab le 3.1 co n 'd .)Possible Risk Factors Net Effects* AuthorsWork Posture- Repetitive movement
- Amount and frequency of vertical head movement
Upper extremity symptoms (+)
Headaches and postural discomfort (-)
Lim and Carayon (1993) Puhakainen et al., (1993)
Collins etal., (1990)
Interactions of risk factors:- VDT use x
work pressure x work atmosphere
Eye symptoms (+)Musculoskeletal symptoms (+) Headache symptom (+)General fatigue and nervousness (+)
Pot et al., (1987)
♦NET EFFECT OF THE POSSIBLE RISK FACTORS:(+) Positive effect. Higher level o f risk factor is related to more symptoms;(-) Negative effect. High level o f risk factor is related to less symptoms.
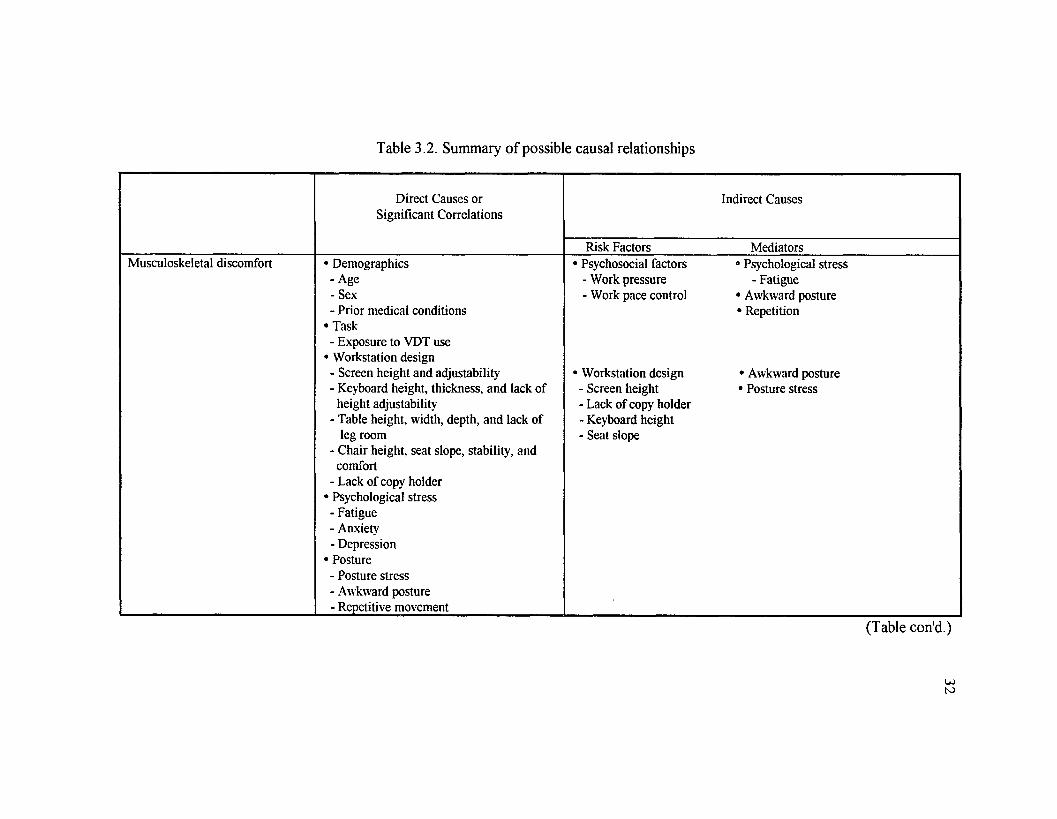
Table 3.2. Summary o f possible causal relationships
Direct Causes or Significant Correlations
Indirect Causes
Risk Factors MediatorsMusculoskeletal discomfort • Demographics
-A ge- Sex- Prior medical conditions
• Task- Exposure to VDT use
• Workstation design- Screen height and adjustability- Keyboard height, thickness, and lack of
height adjustability- Table height, width, depth, and lack of
leg room- Chair height, seat slope, stability, and
comfort- Lack of copy holder
• Psychological stress- Fatigue- Anxiety- Depression
• Posture- Posture stress- Awkward posture- Repetitive movement
• Psychosocial factors • Psychological stress- Work pressure - Fatigue- Work pace control • Awkward posture
• Repetition
• Workstation design • Awkward posture- Screen height • Posture stress- Lack o f copy holder- Keyboard height- Seat slope
(T ab le c o n 'd .)
to
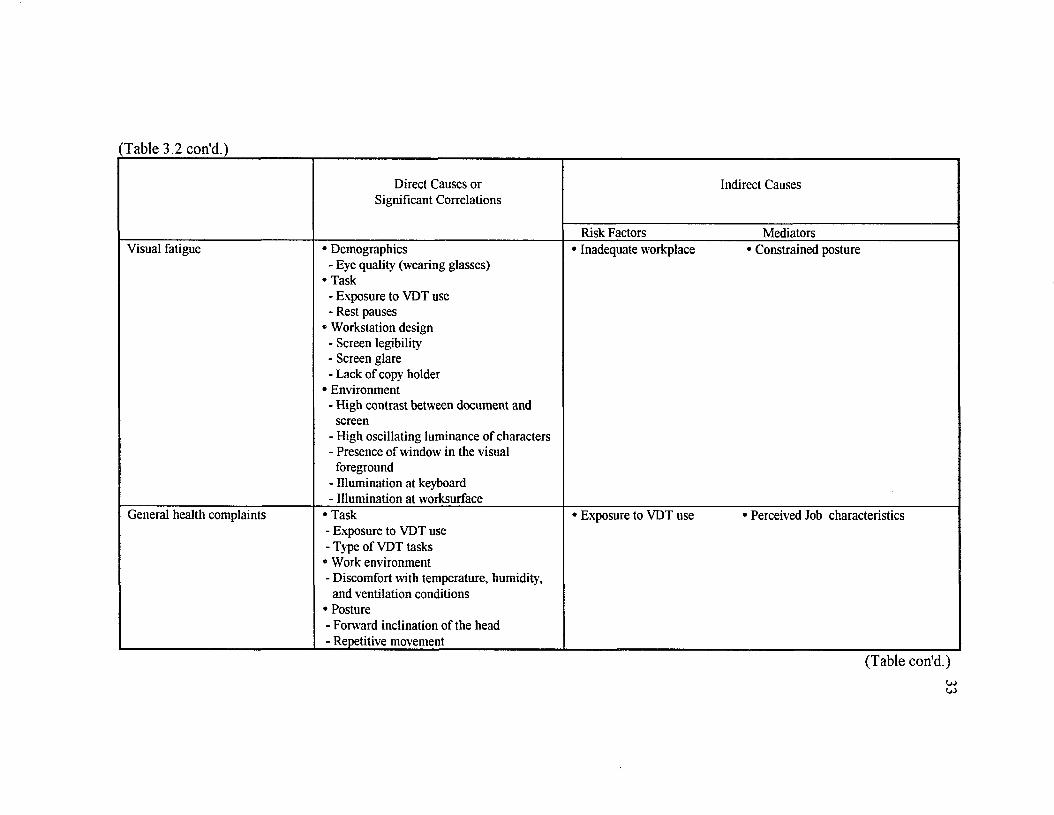
(T a b le 3 .2 c o n 'd .)
Direct Causes or Significant Correlations
Indirect Causes
Risk Factors MediatorsVisual fatigue • Demographics
- Eye quality (wearing glasses)• Task
- Exposure to VDT use- Rest pauses
• Workstation design- Screen legibility- Screen glare- Lack of copy holder
• Environment- High contrast between document and
screen- High oscillating luminance of characters- Presence of window in the visual
foreground- Illumination at keyboard- Illumination at worksurface
• Inadequate workplace • Constrained posture
General health complaints • Task- Exposure to VDT use- Type of VDT tasks• Work environment- Discomfort with temperature, humidity,
and ventilation conditions• Posture- Forward inclination of the head- Repetitive movement
• Exposure to VDT use • Perceived Job characteristics
(Table con'd.)U>
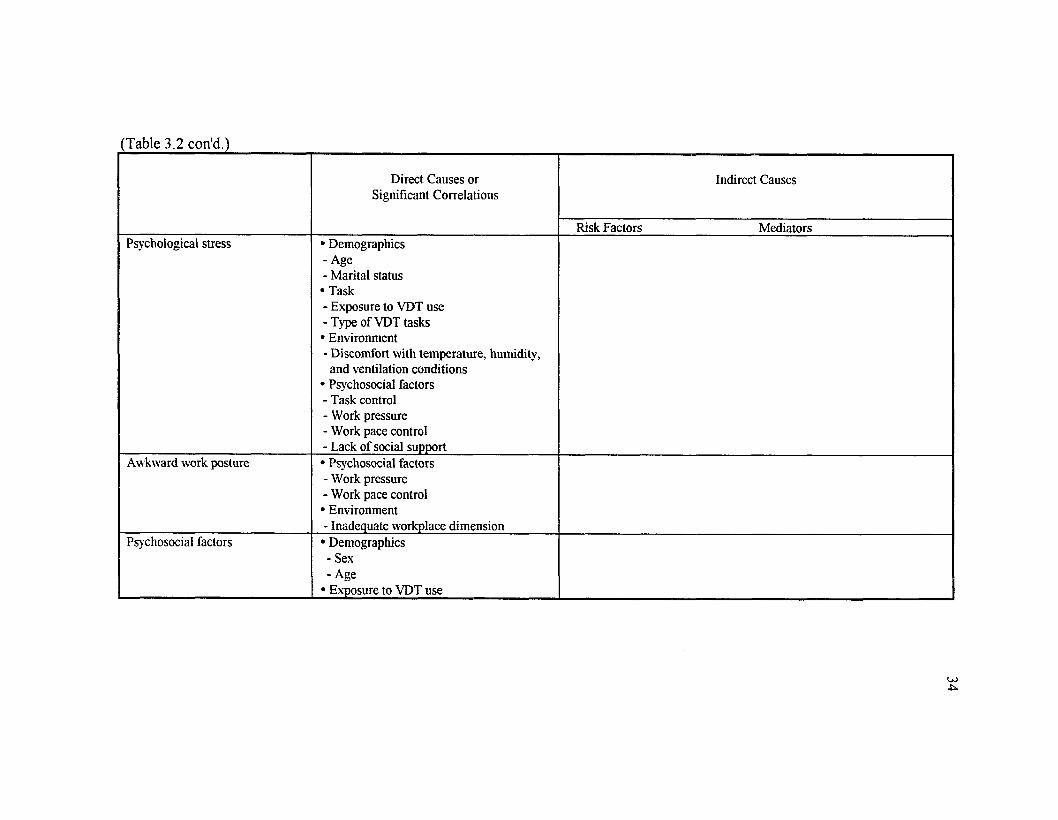
(T ab le 3 .2 co n 'd .)
Direct Causes or Significant Correlations
Indirect Causes
Risk Factors MediatorsPsychological stress • Demographics
-A ge- Marital status• Task- Exposure to VDT use- Type of VDT tasks• Environment- Discomfort with temperature, humidity,
and ventilation conditions• Psychosocial factors- Task control- Work pressure- Work pace control- Lack of social support
Awkward work posture • Psychosocial factors- Work pressure- Work pace control• Environment- Inadequate workplace dimension
Psychosocial factors • Demographics- Sex- Age
• Exposure to VDT use
U>
35
3.2 RESEARCH APPROACHES
3.2.1 EXPERIMENT VS. SURVEY
Research with VDTs has been designed to develop and test hypotheses about
effects o f VDTs on the operators: Is there an effect? Is it harmful? What are the causes
and mechanisms?
Tests o f these hypotheses have been made in two ways. One approach is to
conduct carefully controlled experiments; and another approach is to conduct field
surveys; most research falls into the second option. The survey approach is generally
used for exploratory purposes. The experiment approach is used for validating the
hypothesized causal relationship found in the survey study.
By using the experimental approach, the researcher designs the number and level
o f the hypothesized causal variable and randomly assign the people to each group. For
example, one could randomly assigns people to the group using the monitor with a
different height to perform word processing tasks and examine the effect o f the screen
height on typing performance and physical discomfort. In this way, the researcher may
find the suspected causal relationship, such as reported by Lu et al. (1993) for examining
the effect o f screen height on typing performance and discomfort; Hagberg and Sundelin
(1986) for examining the discomfort and load on the upper trapezius muscle when
operating a word-processor; and Brand and Judd (1993) for examining the angle o f hard
copy and text-editing performance.
There are several types o f survey designs: (1) One-shot questionnaire survey.
This is the most common survey method. In a one-shot design, one sample o f subjects is
questioned only once, such as the studies reported by Hunting et al. (1981), Laubli, et al.
(1981), Lu et al. (1993a and 1993b) and Smith et al. (1992). (2) Longitudinal study.
These are o f three types: a) Before/After design - where the same group o f subjects is
questioned before and after a particular event, e.g. before and after implementation o f a
36
new computer system (Puhakainen et al., 1993); b) Repeated design - where the same
group o f subjects is questioned several times over a period o f time, or by using a diary
style (Bergqvist et al., 1990; Collins et al., 1990); and c) Time series. In this design,
information is collected over a period o f time, from similar samples o f people, but the
participants may change from one occasion to the next, such as the study reported by
LeGrande (1993).
The experiment study offers an undeniable advantage. Using well-designed
experiments, one can control competing explanatory variables by randomly assigning
people to conditions that vary only in the variable hypothesized to be causal. However,
carefully controlled experimental research has some disadvantages. Compared with
survey research, the cost o f data collection per respondent is high. Special laboratory
conditions must be created just to collect the data, and only a limited number o f subjects
can occupy such facilities at any one time. Consequently, large sample databases can not
be economically generated in terms of time and financial costs. Another disadvantage is
that most carefully controlled research, by the act o f establishing the controls, creates an
artificial situation that may not generalize to typical working environments (National
Research Council, 1983). The subjects under the experiment condition do not have the
feeling o f real work situation. For example, the subjects may not worry about the loss of
job security through automation, nor do they experience the excitement o f meeting a
new challenge on the job. They do not find themselves in a changed career situation to
which they may be resistant, nor do they have the choices or variety o f tasks that might
characterize a real job. Consequently, the results may not generalize to people who
choose jobs with VDTs over jobs without such technology or to people who are in jobs
they have already learned to perform without VDTs. In short, the results o f such
experiments may not be generalized to real people in real jobs (National Research
Council, 1983). Because o f the disadvantage o f the experiment approach, some factors
37
such as psychosocial factors or psychological stress and their relationship to physical
complaints cannot be studied.
The survey approach avoids this problem. The main advantage o f field research is
the realism o f the phenomena it studies (Rosenberg, 1968; Warwick and Lininger, 1975).
However, it has the disadvantage o f being unable to fully control competing causes of
effects by randomization. The data collected by the one-shot survey approach may
involve some variation which results in random correlations. In longitudinal study, a
central question is, how long is it necessary or possible to follow-up certain groups of
people after a specific change in their VDT use; while trying to measure the effect on
well-being or productivity (Lindstrom, 1993)? Because o f the disadvantage, the survey
study needs to be carefully designed and the sampled population needs to be well defined
and controlled.
Several studies adopted the following approach: using the survey method to
discover the health complaints and associated factors and then conducting experiments
to further validate the relationships (Life and Pheasant, 1984). This approach integrates
the survey and experiment into one study. Another way to integrate the survey and
experiment approach is to design the experiment and then conduct the study in a real
workplace using real workers to perform their routine job (Mandal, 1987; Wall et al.,
1992).
The research approach and design chosen for the study will depend on the nature
o f the variables the researcher is investigating.
3.2.2 MEASUREMENTS
The measurement used for the evaluation o f VDT work environment and health
symptoms experienced by operators can be classified as subjective and objective.
Subjective measurements are the person's opinion regarding a particular event and
usually used in the survey study. In some experiment studies, the subjective

38
measurements are also used for the discomfort rating or preference rating, such as the
studies by Lu et al. (1993) and Brand and Judd (1993). Objective measurements are the
measurements which are based on certain criteria. The objective measurements are
usually used in the experiment study. They have also been used in survey studies for
evaluating health conditions and the physical work environment (Burgqvist et al., 1991;
NIOSH, 1992).
3.2.2.1 MEASUREMENTS FOR HEALTH SYMPTOMS
There are four types o f measurements for evaluating the health symptoms among
VDT operators: self-reported measures, medical examinations, physiological measures,
and postural measures. A self-reported measure is subjective while the other three are
considered to be objective.
The self-reported measure is widely used in various survey and experiment
studies for the symptoms o f eye, muscle, and general physical problems. It usually
requires the operators to report the frequency and/or severity o f the symptoms they have
experienced according to a certain scale. It has the advantage o f low cost and immediate
response. The disadvantage is that some operators may over- or under-report the
symptoms because o f some other factors that may affect the person's reporting behavior,
such as misunderstanding the wording or the presence o f other symptoms. The subjective
reports o f discomfort have been questioned for its validity (Howarth and Istance, 1986).
However, it is continuously widely used because it is expensive or some times impossible
to repeat the identical questionnaire to validate the symptoms.
Medical examination has been used in survey studies for the examination o f
musculoskeletal disorders, such as tendon related upper extremity disorders, muscle-
related upper extremity disorders, nerve entrapment syndromes, and joint-related
disorders (Bergqvist et al., 1990; Laubli et al., 1981; Hunting et al., 1981; NIOSH,
1992). The advantage o f medical examination is it's reliability in determining illnesses
39
from symptoms detected with the survey. However, it requires medical specialists,
special equipment, longer time and has higher costs.
Some studies have measured physiological parameters to indicate the symptoms,
primarily muscular or eye fatigue. Saito et al. (1993) states that visual comfort in VDT
work can be evaluated by analyzing several physiological responses o f the eye. Such
physiological responses as critical flicker frequency (CFF), accommodation, pupil size,
eye movements are the efficient indices o f visual fatigue (Saito et al., 1993). Lunn and
Bank (1986) and Watten (1992) correlated visual contrast sensitivity and visual acuity to
visual fatigue. Muscle load has been assessed by recording electromyography (EMG)
from upper trapezius muscle in the study by Hagberg and Sundelin (1986).
Electroencephalogram (EEG) and heart rate (HR) have also been correlated with the
boredom o f repetitive tasks such as data entry (Floru et al., 1985). Urinary excretion o f
catecholamine, urinary excretions o f aldosterone, blood pressure, and heart rate have
also been used to correlate with fatigue (Gao et al., 1990; Tanaka et al., 1988; Tanaka et
al., 1989).
Posture change has been suggested to be an indicator o f general and localized
muscular fatigue (Delvolve and Queinnec, 1983; Kogi, 1982; Swanson and Sauter,
1993). Swanson and Sauter (1993) conducted a laboratory study about VDT operators'
working posture and found a significant increase in fidgets over the workday.
Additionally, operators' were found to spend more time in postures indicative o f fatigue
by the end o f the workday.
The advantage o f the medical examination and physiological measurements are
that they objectively detect the illness experienced by the operator. However, some
symptoms and discomforts may not be reflected in the medical examination. Unless large
samples are used, medical examination can provide very little information to on health
symptoms and their correlation with working conditions.
40
Medical examination, physiological measurements, and postural measures all
require special equipment or instruments and may be more expensive when compared
with subjective reporting.
3.2.2.2 MEASUREMENTS FOR PHYSICAL WORK CONDITIONS
As that o f health complaints, subjective and objective measures have been used in
evaluating the physical work conditions and the subjective measures have been criticized.
Subjective measurements have been used to collect subjective ratings o f physical
workplace conditions, such screen height, keyboard height, the comfort with chair,
screen glare, lighting conditions, etc. In an extensive evaluation o f VDT work and health
effects, the World Health Organization (1987) cited 12 field studies that examined the
relationship between display or workroom characteristics and visual complaints. Seven
o f these studies were based on subjective ratings o f physical workplace conditions. The
use o f subjective measurements for this purpose has been criticized (National Research
Council, 1983).
Objective measurements are those measurements made by the investigator and
based on a certain criteria, such as lighting conditions, reflect screen glare, keyboard
height, screen height, etc. Some studies have correlated these objective measurements
with visual and ocular discomfort (Knave et al., 1985; Laubli et al., 1981; Padomos and
Pot, 1987; Sauter et al., 1983; Schleifer et al. 1990; Stammerjohn et al., 1981).
However, in the study by Schleifer et al. (1990), the objectively assessed glare variables
failed to have any apparent influence on visual system strain. On the other hand,
subjective reports o f "glare at the workstation" were associated with increased strain and
could explain a certain amount o f the variance in the ocular and perceptual discomfort
scale. The authors suggested that VDT users' perceptions o f certain, potentially stressful,
lighting conditions (e.g., glare) may be more sensitive or valid than measures based upon
efforts to quantify these lighting conditions in a more objective manner.
41
It is apparent that both objective and subjective ratings are important for
evaluating the VDT system.
3.3 DATA ANALYSIS METHODOLOGY
In early studies o f VDTs, the following data analysis methods were commonly
used: descriptive data analysis (frequency table, histogram, etc.) and univariate analysis,
i.e., correlation analysis (Pearson correlation), t-test, analysis o f variance, and regression.
There was an emphasis on correlation and multiple regression techniques to link
variables. Conclusions about the risk factors which might have an effect on the health
complaints were generally based on the test o f significance o f the correlations or the
univariate analysis. The advantage o f the univariate test is its simplicity. The
disadvantage is that when the number o f variables increases, the number o f tests
increases. This may result in increased error. Another disadvantage is that univariate
approach test the relationship between one dependent variable and one or more
predictors without considering the effect o f other dependent variables. This may lead to
wrong conclusions about the relationship between the dependent variables and
predictors.
The National Research Council (1983) suggested that a multivariate approach
should be used because o f the complex nature o f the VDT system. VDT operators work
within a complex system in which many variables interact, probably in complex ways, to
affect their well-being. The use o f multivariate techniques is essential to understanding
the interplay among the variables. It is stated that "we do not yet have sufficient
knowledge about which variables are important and how they may interact" (National
Research Council, 1983, p.43).
In this section, univariate and multivariate analysis methods are reviewed as
preparation for the data analysis used in this study.
42
3.3.1 DESCRIPTIVE STATISTICS
Frequency tables, means, medians, ranges, standard deviations, histograms, and
plots are commonly used in VDT literature for illustrating the demographic data
(Bergqvist et al., 1990), the prevalence and pattern o f the health complaints (Bergqvist
et al., 1990; Hagberg and Sundlin, 1986; Horgen and Aaras, 1993; Lu et al., 1993b),
measurements (Grandjean et al., 1984; Hunting et al., 1981; Ong et al., 1988), and
conditions o f the workstation and work environment (Hunting et al., 1981; Schleifer et
al., 1990).
Descriptive statistics is a useful tool to summarize the general information in the
sampled population. To describe the observations that might occur in a sample more
completely, the concept o f the probability distribution is used.
3.3.2 UNIVARIATE ANALYSIS
3.3.2.1 CORRELATION MEASURES
Correlation measures the closeness o f a linear relationship between two variables.
I f one variable x can be expressed exactly as a linear function o f another variable y, then
the correlation is 1 or -1, depending on whether the two variables are directly related or
inversely related. A correlation o f zero between two variables means that each variable
has no linear predictive ability for the other. However, the two variables have equal
status in that either may be the cause o f the other or both may be caused by some other
variable(s) (Barker and Barker, 1983, p8). Therefore, causation cannot be inferred from
simple correlations.
Pearson product-moment correlation (r = L ZxZy/n) is the most commonly used
method to measure association between two continuous variables. Spearman's rank-
order correlation coefficient is a nonparametric measure that is calculated as the
correlation o f the ranks o f the data. It is appropriate only when both variables lie on an
ordinal scale.
43
In the VDT literature, correlation analysis has been used for examining the
association among health complaints and demographics, workstation, physical and the
social environment (Sauter, 1983). Levy and Ramberg (1987) and Lu et al. (1993b) used
correlation analysis to examine the relationship among various health complaints (i.e.,
visual fatigue, musculoskeletal symptoms, and general physical symptoms).
3.3.2.2 ANALYSIS OF VARIANCE, T-TEST, CHI-SQUARE TEST
When comparing the means between two groups, t-test and chi-square test are
commonly used (Hunting et al., 1981; Laubli et al., 1981; Levy and Ramberg, 1987).
Many experiments involve more than two levels o f a factor and/or more than one factor
(or independent variable). Analysis o f variance (ANOVA) is thus used to compare the
means. ANOVA can be used to compare the means when there are any number of
independent variables, but the method allows for only one dependent variable. The
relationship between the dependent variable and the separate independent variables may
be assessed as well as the possible interaction o f independent variable on the dependent
variable.
3.3.2.3 REGRESSION ANALYSIS
Regression analysis is the analysis o f the relationship between one variable and
another set o f variables. The relationship is expressed as an equation that predicts a
response variable (also called a dependent variable) from a function or regressor variable
(also called independent variables, predictors, explanatory variables) and parameters. The
parameters are adjusted so that a measure o f fit is optimized. For example, the equation
for the /th observation might be:
y/=Bo + Bix/ + e; (3.1)
where y/ is the response variable, x/ is a regressor variable, Bo and Bi are unknown
parameters to be estimated, and e/ is an error term. Multiple regression allows for more
than one independent variable but only one dependent variable.
There are several methods of model selection. One o f the methods that is used
most commonly in the VDT literature is stepwise regression (Lu et al., 1993b; Schleifer
et al., 1990). This method starts with no variables in the model and adds variables one by
one to the model. At each step, the variable added is the one that maximizes the fit o f the
model given previously added variables. In the mean time, it deletes the variable with the
smallest contribution to the model if it is no longer important. The criteria for entry into
the model and for remaining in the model can be specified. Another model selection
method used in the literature is to use all the regressors to fit the regression model, such
as Collins et al. (1990). The stepwise method has the advantage o f selecting the most
important predictors and avoiding multi-colinearity problem when there are many
predictors as in VDT field study and these variables possibly are inter-related. The
disadvantage o f the stepwise regression is that it may miss some important variables
since these variables might be taken out before other variables coming into the model.
The use o f the full model can examine the effects o f all the predictors but may have the
multi-colinearity problem.
The proportion o f variance o f the response that can be explained by the regressor
variables is R2. Whether a given R2 value is considered to be large or small depends on
the context o f the particular study. In field study, an R2 o f 0.30 might be considered
large, while in experiment study, this value might be considered small.
The adjusted R2 statistic is an alternative to R2 that is adjusted for the number o f
parameters in the model. The adjusted R2 statistic is calculated as
ADJRSQ = 1 - [(n-i)(l-R2)/(n-p)] (3.2)
where n is the number o f observations used in fitting the model, and i is an indicator
variable that is 1 if the model includes an intercept, and 0 otherwise.
Cp is another criterion for selecting a model. It is a measure o f total squared
error. When the right model is chosen, the parameters estimated are unbiased, and this is
45
reflected in Cp near the number o f parameters p in the model (SAS/STAT User's Guide,
p. 1400).
Many studies have used multiple regression technique to find the predictors of
the visual and musculoskeletal symptoms among the variables o f workstation, physical
and social environment (Lu et al., 1993b; Schleifer et al., 1990).
3.3.3 MULTIVARIATE ANALYSIS
Multivariate analysis deals with the data which has simultaneous measurements
on many variables. Some objectives o f multivariate analysis methods are as follows: (1)
Data reduction or structural simplification. The phenomenon being studied is represented
as simply as possible without sacrificing valuable information valuable information and
this may make interpretation easier, (2) Investigation o f the dependence among variables.
The nature o f the relationships among variables is o f interest. Are all the variables
mutually independent or are one or more variables dependent on the others? (3)
Hypothesis construction and testing. Specific statistical hypotheses, formulated in terms
o f the parameters o f multivariate populations, are tested. This may be done to validate
assumptions or to reinforce prior convictions (Johnson and Wichern, 1992).
3.3.3.1 MULTIVARIATE ANALYSIS OF VARIANCE (MANOVA)
MANOVA is essentially ANOVA but with multiple dependent variables. These
dependent variables to some degree measure the same thing, i.e., there are high
correlations among these dependent variables. MANOVA allows one to determine the
effect o f the independent variables on the dependent variables as a whole. It looks at the
picture between the dependent and independent variables more comprehensively. It is
very useful in the VDT research. For example, there are usually many measures for
evaluating eye fatigue, i.e., sore eyes, tire eyes, burning eyes, etc., when examining the
effect o f age on the eye symptoms, MANOVA is a good tool to use. Unfortunately, no
study has employed this approach.
46
3.3.3.2 FACTOR ANALYSIS
Factor analysis is a method to describe, if possible, the covariance relationships
among a larger number o f variables in terms o f a few underlying, but unobservable,
random quantities called factors. The factor model is motivated by the following
arguments. Suppose variables can be grouped by their correlations. That is, all variables
within a particular group are highly correlated among themselves but have relatively
small correlations with variables in a different group. It is conceivable that each group o f
variables represents a single underlying construct, or factor, that is responsible for the
observed correlations. For example, correlations from the group o f symptom ratings dry
eyes, tired eyes, red eyes, and burning eyes suggests an underlying "ocular discomfort."
Another set o f variables, which rate pains or discomfort in the neck, shoulder, upper
back, and arms, corresponds to another factor, "upper extremity musculoskeletal
symptoms." It is this type o f structure that factor analysis seeks to confirm.
The factors can be extracted using several criteria differing in how to define
"good fit". The common methods o f parameter estimation o f the common factors are
principal component factor analysis, principal factor analysis, iterated principal factor
analysis and Maximum-likelihood factor analysis. The loadings o f the variables in each
factor indicate the contribution o f the variables to this factor. The sum o f square o f the
loadings in each factor, called communality, constitutes the total variance explained by
this factor, which indicates the importance o f the factor in study.
The original factor matrix may not be readily interpretable, therefore, it is usual
practice to rotate them until a "simpler structure" is achieved. There are several rotation
methods. The most commonly used is the Varimax ratio, which minimizes the number o f
variables that have high loadings on a factor to enhance the interpretability o f the factors.
Other commonly used factor rotation methods are Quartimax and Promax rotation.
47
Factor scores are the estimated values o f common factors. These quantities are
often used for diagnostic purposes as well as inputs to a subsequent analysis, such as
regression.
There are many decisions that must be made in any factor analytic study.
Probably the most important decision is the choice o f m, the number o f common factors.
M ost often, the final choice o f m is based on some combination o f (1) the proportion of
sample variance explained, (2) subject matter knowledge, and (3) the "reasonableness" of
the results. The choice o f solution method and type o f rotation are less crucial decisions.
In fact, the most satisfactory factory analyses are those where rotations are tried with
more than one method and all the results substantially confirm the same factor-structure.
Factor analysis was used by Schleifer et al. (1990) on the visual discomfort items
in the survey sample. A two-factor solution accounting for 72% o f the total variance was
generated. One factor, corresponding to "ocular" discomfort, consisted o f five items:
tearing/itching eyes, burning eyes, sore eyes, red eyes, and dry eyes. The second factor,
corresponding to "perceptual" discomfort, consisted o f two items: blurred vision and
double vision. The factor scores were then used in the regression analysis to find the
associated risk factors.
3.3.3.3 CANONICAL CORRELATION ANALYSIS
Canonical correlation analysis seeks to identify and quantify the associations
between two sets o f variables. Canonical correlation analysis focuses on the correlation
between a linear combination o f the variables in one set and a linear combination o f the
variables o f in another set. The idea is first to determine the pair o f linear combinations
having the largest correlation. Next, we determine the pair o f linear combinations having
the largest correlation among all pairs uncorrelated with the initially selected pair. The
pairs o f linear combinations are called the canonical variables, and their correlations are
called canonical correlations.
48
Canonical correlations measure the strength o f linear association between the two
sets o f variables. The maximization aspect o f the technique represents an attempt to
concentrate a high-dimensional relationship between two sets o f variables into a few
pairs o f canonical variables. Plots o f the canonical variables can be useful in examining
multivariate dependencies. Canonical correlation analysis has been used in the VDTs
studies.
3.3.4 SUM M ARY
Descriptive statistics and univariate analysis are simple tools to describe the
population and find the association among variables. However, univariate analysis allows
only one dependent variable. In VDT literature, especially in field study, there are often
multiple variables measured on a similar phenomenon, e.g., eye symptoms. The
multivariate approach allows us to understand the phenomenon more comprehensively.
CHAPTER 4
RATIONALE
Literature shows that there is increased concern about the possible "adverse
health effects" caused by VDT work and its environment. The prevalence o f
musculoskeletal disorders and visual fatigue has been recognized. The contribution o f
ergonomics factors and environment to visual and musculoskeletal complaints in VDT
work is widely identified. However, the interacting relationships between the discomforts
and their possible causes remain undefined. There has been little empirical research to
validate the probable factors involved, to define the interrelationships among these
factors, and to rank their relative importance. The deficiency may be due to the fact that
although the signs and symptoms and their associated impairments have been thoroughly
investigated, the exposure conditions until now have been analyzed only superficially and
are incomplete. The whole picture o f variables in a VDT workstation system has not
been made clear.
A VDT workstation system consists of a user, a computer system (hardware and
software), a workstation (supporting furniture), a physical environment, and social
environment (work organization). The system is complicated in that each system
component (e.g. the user, computer system, etc.) has many variables, and these variables
are interrelated not only within the component but also between the components.
The literature review shows that there are seven categories o f variables that may
have effect on VDT operators' health, i.e., demographics, tasks, workstation design,
work environment, psychosocial factors, work posture, and psychological stress, and
49
50
that these variables may be interrelated. However, no study has been conducted to
examine the effect o f these factors simultaneously and the interrelationships among these
risk factors comprehensively.
The research questions are: what VDT factors are most important to a specific
category o f physical complaints? how do these seven categories o f risk factors affect the
physical symptoms experienced by VDT operators, and what are the interactions among
these risk factors? (see Figure 4.1)
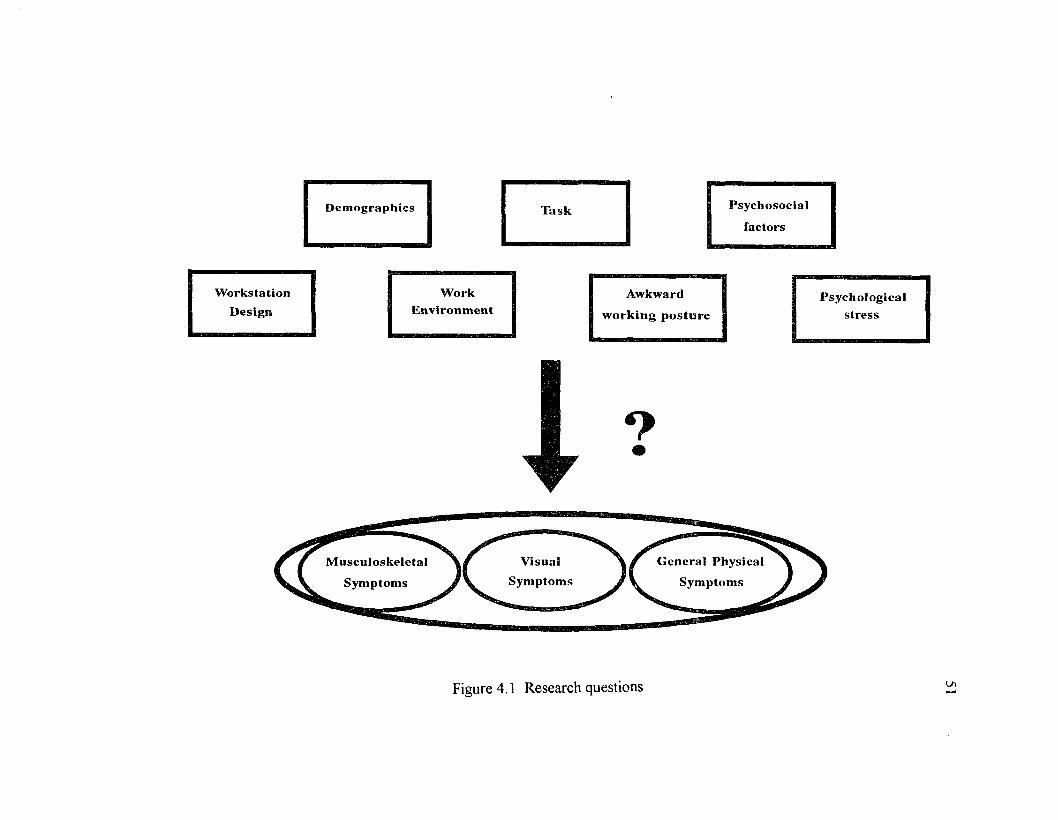
D em ographics T ask P sych osocia l
factors
W orkstation W ork Awkward P sych o log ica lD esign E nvironm ent w o rk in g p ostu re stress
V isualSym ptom s
G eneral Physical
Sym ptom s
M uscu loskeleta l
Sym ptom s
Figure 4.1 Research questions
CHAPTER 5
METHODS AND PROCEDURES
5.1 RESEARCH PLAN
As stated in Chapter 1, the objectives o f this research were to identify the most
important risk factors in the VDT work station system and examine how these factors
influence the physical symptoms experienced by VDT operators. The research plan
proposed for the above purpose is illustrated in Figure 5.1. This research consisted o f
four parts: research model development, methodology development, field study, and data
analysis.
In order to examine the relationship between the risk factors and the physical
complaints, a framework was needed to decide the hypothesized relationship based on
past research. To collect the health complaints, it was necessary to conduct a survey
study at a real work place. A survey was designed for collecting data and analyzing the
relationships in the research model. A methodology for the posture analysis was
developed to assess the operator's working posture and its effects on the physical
symptoms. A field study was then conducted. The data collected from the survey was
used to test the hypothesized relationships.
5.2 MODEL DEVELOPMENT
5.2.1 CONCEPTUAL MODEL
A work system consists of the following five elements: (1) the person, (2) the
work environment, (3) tasks, (4) technology and (5) the work organization (Smith and
Carayon, 1992). These various elements interact when work is being done. Demands are
52
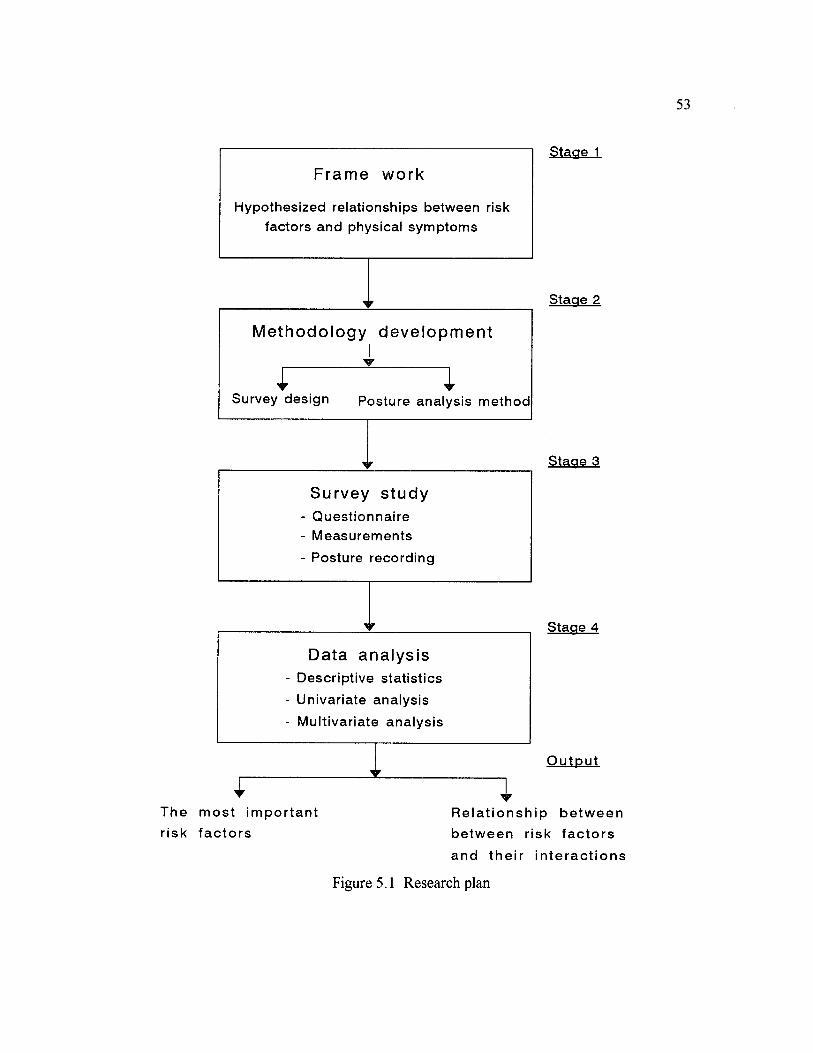
53
Fram e work
H ypothes ized relationships betw een risk
factors and physical sym ptom s
w
M e tho do logy d e ve lo p m e n t
Survey design Posture analysis m e th o d
r
Survey study- Q u e s t io n n a ire- M ea su re m en ts
- Posture record ing
f
Data a- Descrip tiv i
- U n iva r ia te
- M ultivaria t
nalysiss statistics
analysis
e a na lys is
S tage 1
Stage 2
Stage 3
Stage 4
O u t p u t
T h e m o s t im p o r t a n t
r is k f a c t o r s
R e l a t i o n s h i p b e t w e e n
b e t w e e n r isk f a c t o r s
a n d t h e i r i n t e r a c t i o n s
Figure 5.1 Research plan

54
placed on the individual by the other four elements which create loads that can be healthy
or harmful. Harmful loads lead to physical and psychological stress responses that may
produce adverse health effects such as cumulative trauma disorders or musculoskeletal
stress or visual fatigue.
In a VDT system, the interaction o f these element may lead to physical and
physiological effects via the ergonomic risk factors or repetition, posture, and duration,
and psychological stress. In addition, ergonomic risk factors alone may influence the
physical and psychological stress directly. According to the literature, psychological
stress can also lead to physical symptoms (Lim and Carayon, 1993; Smith and Carayon;
1992). This relationship is illustrated in Figure 5.2.
This conceptual model shows how the interaction o f the system components may
result in possible adverse health effect. There are many variables in the proposed
conceptual model. For this research, a research model is to be further developed which
incorporates the nine categories o f variables discussed in Chapter 3 into the model, i.e.,
demographics, tasks, workstation design, work environment, psychosocial factors,
posture, psychological stress, musculoskeletal symptoms, visual symptoms, and general
physical symptoms.
5.2.2 RESEARCH MODEL
The proposed research model is shown in Figure 5.3. This model shows the
hypothesized relationship among the components in the VDT system based on the
literature review in Chapter 3. It is actually a simplified form o f the conceptual model
shown in Figure 5.2.
There are three levels o f variables in the model. The first level consists o f the
variables o f physical symptoms experienced by VDT operators. These physical
symptoms are classified into 3 categories, i.e., musculoskeletal, visual, and general
physical. Since the purpose o f this research is to examine the effect o f other risk factors
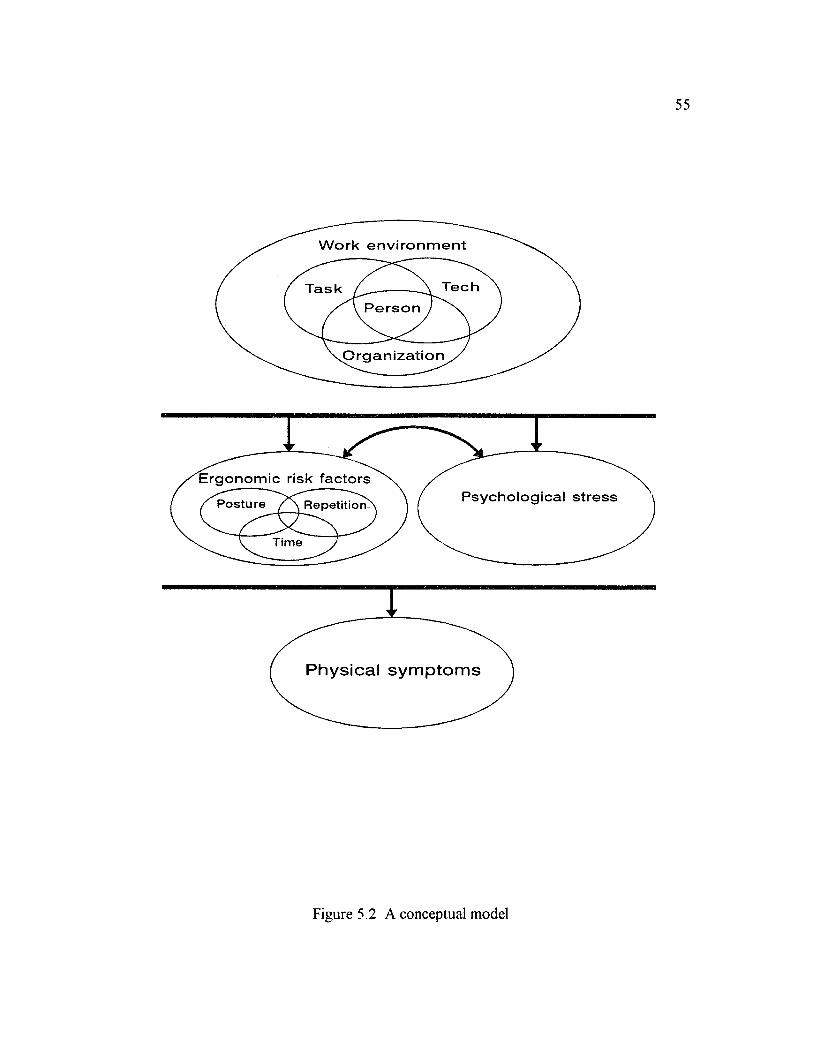
55
W o r k e n v i r o n m e n t
T e c hT a s kP e r s o n
O r g a n i z a t i o n
E r g o n o m i c r i s k f a c t o r s
f P o s t u r eP s y c h o l o g i c a l s t r e s s
R e p e t i t i o n
T i m e
Physical symptom s
Figure 5.2 A conceptual model
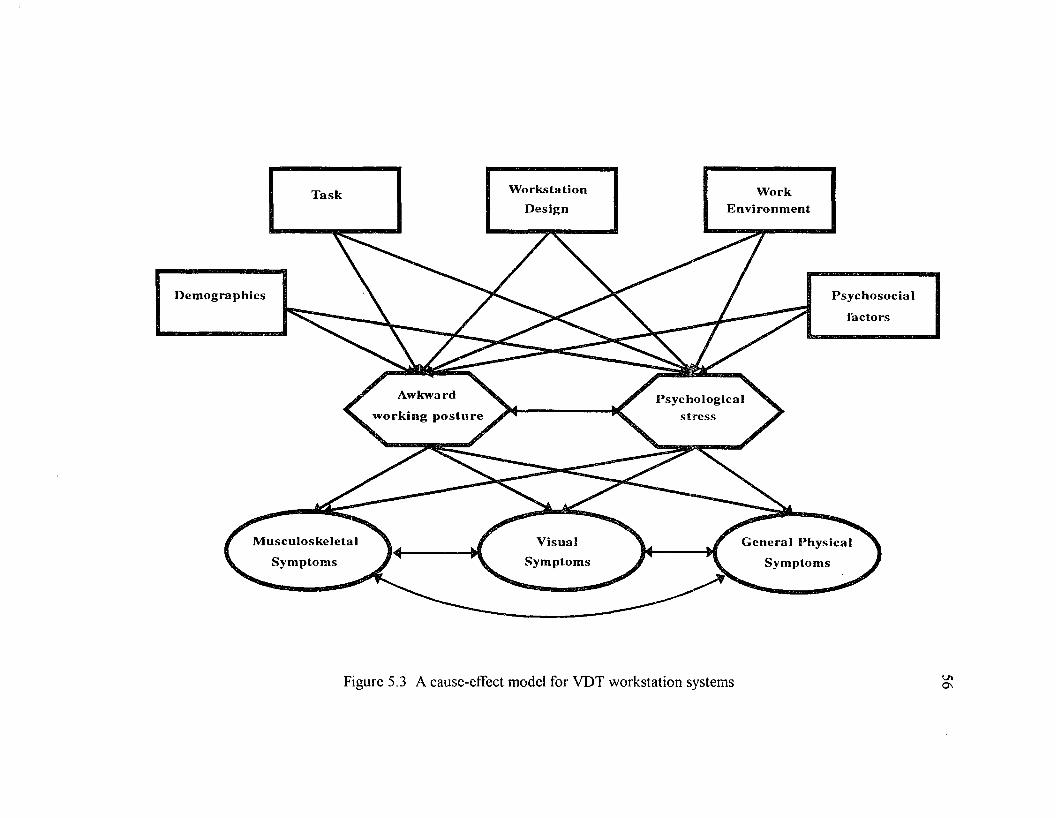
T ask W orkstation W orkD esig n E nvironm ent
D em ograp h ics P sy ch o so c ia l
factors
Awkwa rd
w o r k in g p o stu r eP sy ch o lo g ica l
stress
M u scu lo sk e le ta l
Sym ptom sV isu a l
Sym ptom sG eneral P h y sica l
Sym ptom s
Figure 5.3 A cause-effect model for VDT workstation systems
57
on these physical symptoms, they are considered as endogenous or dependent variables
in the research model. The three categories o f physical symptoms are assumed to be
inter-related. The second level consists o f variables o f working posture and
psychological stress. The variables o f the second level act as mediators, i.e., both "cause"
(to the first level variables) and "effect" (to the third level variables). The third level
consists o f the variables o f tasks, workstation design, work environment, and
psychosocial factors. They are assumed to be acting as "cause" in the model, so they are
exogenous or independent variables. The third level variables have both direct and
indirect effects on the first level variables. The direct effects are not drawn in the
research model. The indirect effects o f the third level variables on the first level o f
variables (physical symptoms) are via their impact on the second level o f variables
(awkward working posture and psychological stress).
5.2.2.1 LEVEL I: PHYSICAL SYMPTOMS
The physical symptoms experienced by VDT operators are classified into the
following three categories: musculoskeletal symptoms, visual symptoms, and general
physical discomfort. Musculoskeletal symptom is defined as the discomfort, numbness,
or pain which is related to muscle and nerve systems at any part o f body, including neck,
shoulders, elbows, wrists, upper back, lower back, hips/thighs, knees, and ankles/feet.
Visual symptom is defined as any ocular and visual discomfort including tearing eyes,
tired eyes, eye dryness, burning eyes, and blurred vision. General physical symptoms
include headaches, stomach discomfort, and ringing ears which do not fall into the other
two categories. It is assumed that these health complaints are inter-related based on the
past field study (Lu, et al, 1993). This can be interpret as when a person experiences
more symptoms in one category, for example, musculoskeletal symptoms, he/she may
have more complaints about the symptoms in other categories, such as visual and general
physical discomfort.
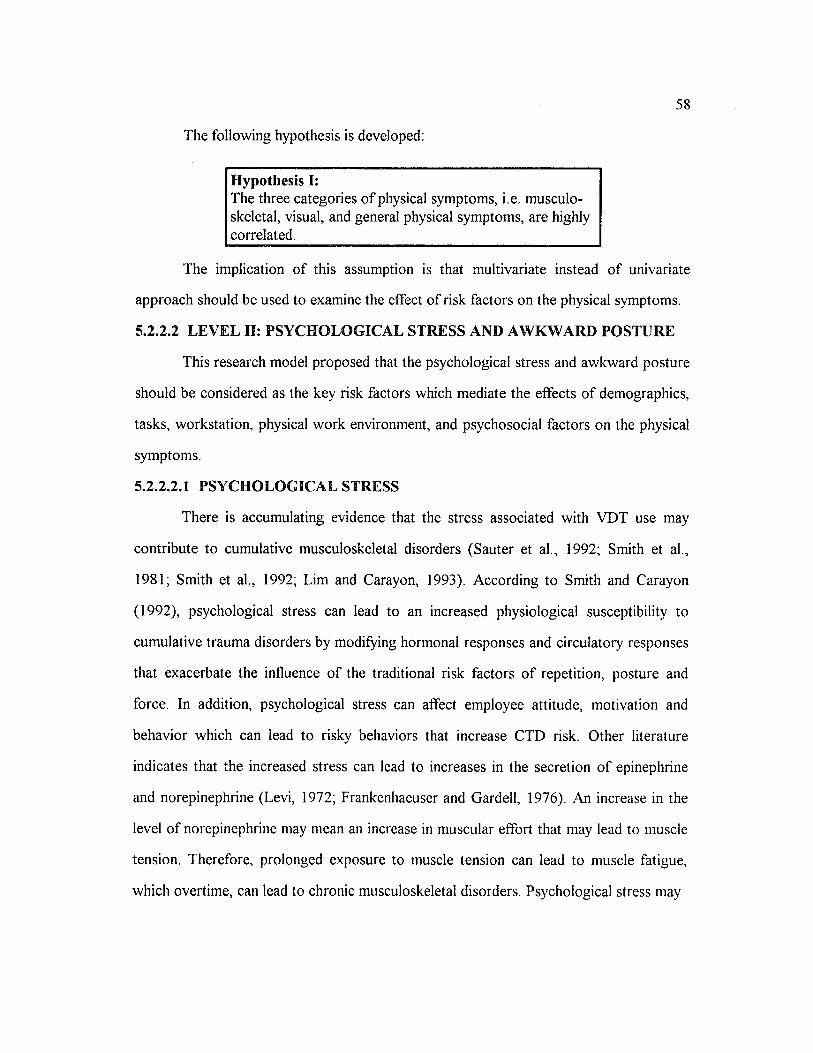
T h e fo llo w in g h y p o th es is is developed :
58
H ypothesis I:The three categories o f physical symptoms, i.e. musculoskeletal, visual, and general physical symptoms, are highly correlated.___________________________________________
The implication o f this assumption is that multivariate instead o f univariate
approach should be used to examine the effect o f risk factors on the physical symptoms.
5.1.2.2 LEV EL II: PSY CH O LO G ICA L STRESS AND A W KW ARD POSTURE
This research model proposed that the psychological stress and awkward posture
should be considered as the key risk factors which mediate the effects o f demographics,
tasks, workstation, physical work environment, and psychosocial factors on the physical
symptoms.
5.2.2.2.1 PSY C H O LO G IC A L STRESS
There is accumulating evidence that the stress associated with VDT use may
contribute to cumulative musculoskeletal disorders (Sauter et al., 1992; Smith et al.,
1981; Smith et al., 1992; Lim and Carayon, 1993). According to Smith and Carayon
(1992), psychological stress can lead to an increased physiological susceptibility to
cumulative trauma disorders by modifying hormonal responses and circulatory responses
that exacerbate the influence o f the traditional risk factors o f repetition, posture and
force. In addition, psychological stress can affect employee attitude, motivation and
behavior which can lead to risky behaviors that increase CTD risk. Other literature
indicates that the increased stress can lead to increases in the secretion o f epinephrine
and norepinephrine (Levi, 1972; Frankenhaeuser and Gardell, 1976). .An increase in the
level o f norepinephrine may mean an increase in muscular effort that may lead to muscle
tension. Therefore, prolonged exposure to muscle tension can lead to muscle fatigue,
which overtime, can lead to chronic musculoskeletal disorders. Psychological stress may
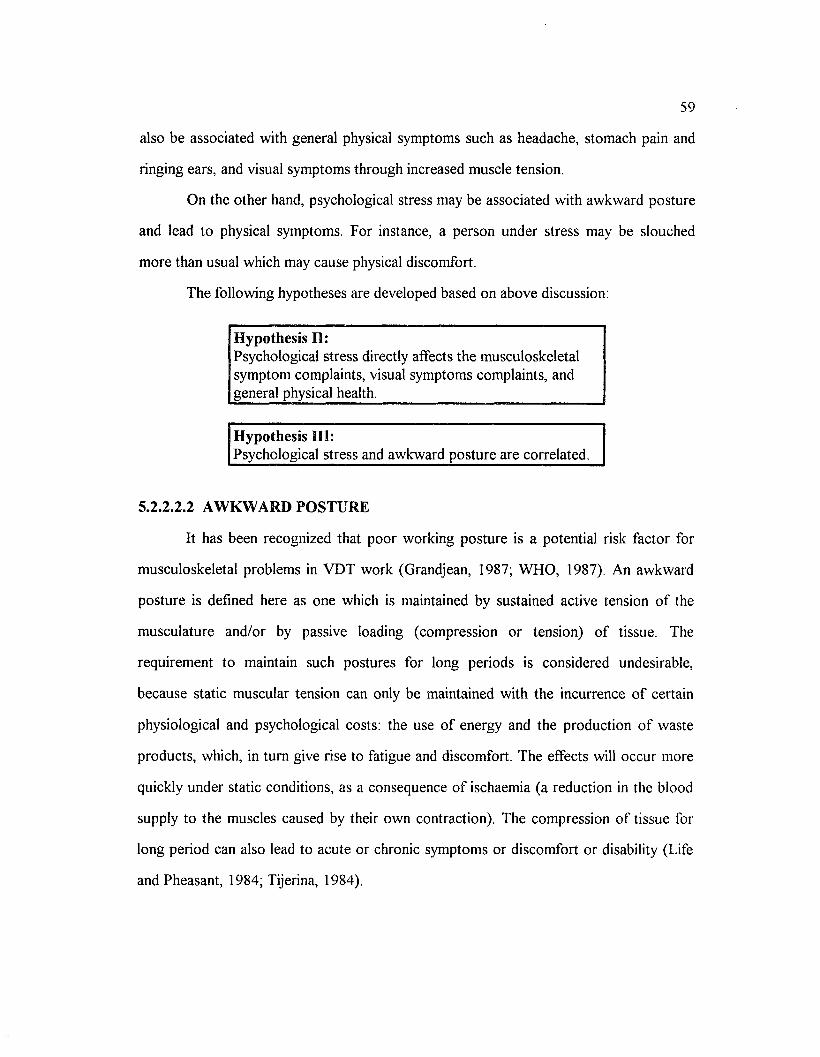
59
also be associated with general physical symptoms such as headache, stomach pain and
ringing ears, and visual symptoms through increased muscle tension.
On the other hand, psychological stress may be associated with awkward posture
and lead to physical symptoms. For instance, a person under stress may be slouched
more than usual which may cause physical discomfort.
The following hypotheses are developed based on above discussion:
Hypothesis H:Psychological stress directly affects the musculoskeletal symptom complaints, visual symptoms complaints, and general physical health.
Hypothesis HI:Psychological stress and awkward posture are correlated.
5.2.2.2.2 AWKWARD POSTURE
It has been recognized that poor working posture is a potential risk factor for
musculoskeletal problems in VDT work (Grandjean, 1987; WHO, 1987). An awkward
posture is defined here as one which is maintained by sustained active tension o f the
musculature and/or by passive loading (compression or tension) o f tissue. The
requirement to maintain such postures for long periods is considered undesirable,
because static muscular tension can only be maintained with the incurrence o f certain
physiological and psychological costs: the use o f energy and the production o f waste
products, which, in turn give rise to fatigue and discomfort. The effects will occur more
quickly under static conditions, as a consequence o f ischaemia (a reduction in the blood
supply to the muscles caused by their own contraction). The compression o f tissue for
long period can also lead to acute or chronic symptoms or discomfort or disability (Life
and Pheasant, 1984; Tijerina, 1984).
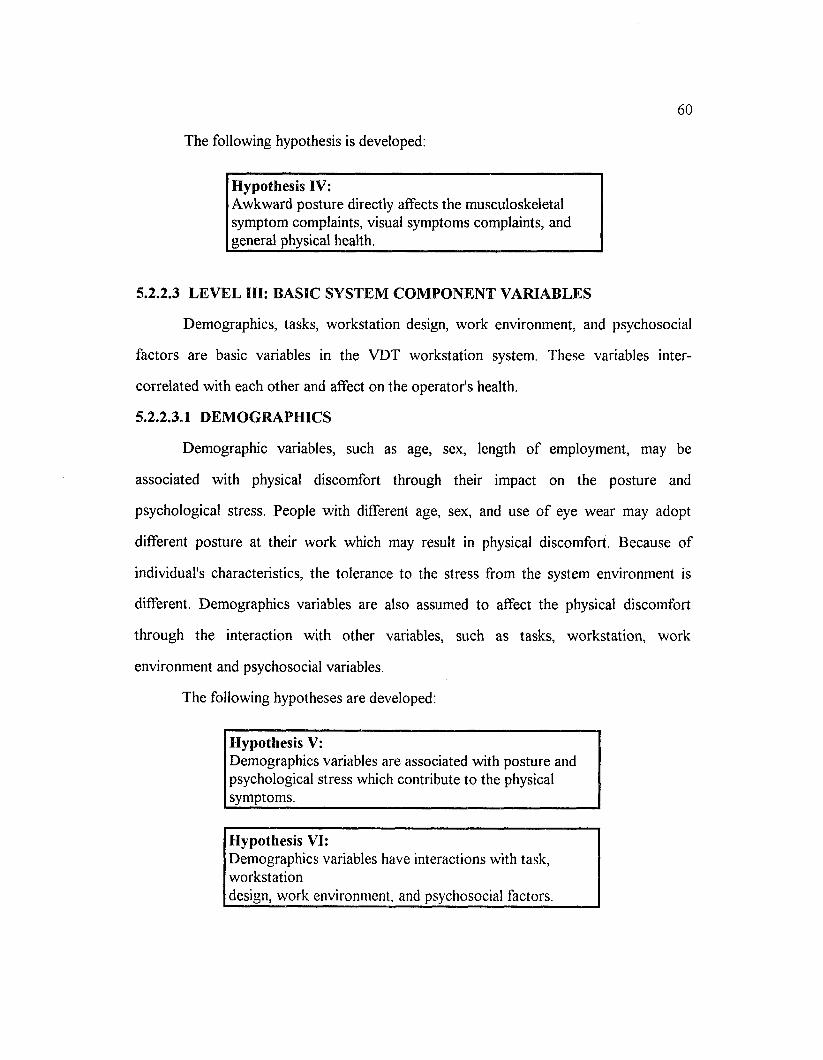
60
T h e fo llo w in g h y p o th es is is dev e lo p ed :
H ypothesis IV:Awkward posture directly affects the musculoskeletal symptom complaints, visual symptoms complaints, and general physical health.
5.2.2.3 LE V EL IH: BASIC SYSTEM CO M PO N ENT VARIABLES
Demographics, tasks, workstation design, work environment, and psychosocial
factors are basic variables in the VDT workstation system. These variables inter
correlated with each other and affect on the operator's health.
5.2.2.3.1 D EM O G RA PH ICS
Demographic variables, such as age, sex, length o f employment, may be
associated with physical discomfort through their impact on the posture and
psychological stress. People with different age, sex, and use o f eye wear may adopt
different posture at their work which may result in physical discomfort. Because of
individual's characteristics, the tolerance to the stress from the system environment is
different. Demographics variables are also assumed to affect the physical discomfort
through the interaction with other variables, such as tasks, workstation, work
environment and psychosocial variables.
The following hypotheses are developed:
H ypothesis V:Demographics variables are associated with posture and psychological stress which contribute to the physical symptoms.
H ypothesis VI:Demographics variables have interactions with task, workstationdesign, work environment, and psychosocial factors.
61
5.2.2.3.2 TASK
VDT work can be classified into four different tasks, data entry, word
processing, interactive work/information retrieval, and programming/CAD. As discussed
in Chapter 2, each task has its own characteristics and require different amount o f work
on hands and eyes. Therefore, different VDT tasks may result in different postures that
operators use at work. For example, interactive work and informar tion retrieval need
intensive reading from the screen which may easily cause slouched posture.
Different VDT tasks are also associated with different levels o f psychological
stress. Many studies found that monotony is related to data entry work and results in
quick fatigue and depression. Prolonged working hours and the time worked with a
computer may also be related to fatigue and anxiety.
The following hypothesis is developed:
Hypothesis VII:Task variables are associated with awkward posture and psychological stress which contribute to the physical symptoms.___________________________________________
5.2.2.3.S WORKSTATION DESIGN
Improper workstation designs constrain working posture and these constraints
lead to "posture stress" which in turn leads to physical discomfort. Life and Pheasant
(1984) found that increasing the keyboard height above the elbow gives rise to higher
levels o f discomfort, due to the greater amount o f work that must be performed by the
shoulder to maintain the hands correctly oriented to the keyboard. In addition, laying the
copy script flat on the desk beside the keyboard results in the need for increased
muscular activity to support the head while it is craned over to read. In addition, the
workstation design contributes to the perceived discomfort o f the workstation which
may cause the psychological stress.
62T h e fo llo w in g h y p o th es is is deve loped :
Hypothesis VHI:Workstation variables are associated with awkward posture and psychological stress which contribute to the physical symptoms.___________________ _________ ______
5.2.2.3.4 W O R K ENVIRONM EN T
W ork environment variables include the variables o f lighting conditions, work
space, noise, and comfort with the temperature, humidity, and ventilation conditions.
Many studies have shown that the work environment is associated with visual
symptoms (Laubli et al. 1983; Sauter, 1984; Schleifer et al., 1990). W ork environment
may also be associated with constrained posture and result in musculoskeletal
discomfort (Laubli et al., 1983). Lu et al. (1993b) found that discomfort with the
temperature, humidity, and ventilation conditions is also related with headache, fatigue,
and stomach ache.
The following hypothesis is developed:
Hypothesis IX:Work environment variables are directly associated with visual symptoms._____________________________________
Hypothesis X:
Work environment variables are directly associated with posture and psychological stress which contribute to physical symptoms._________________________________
S.2.2.3.5 PSY CH O SO CIA L FACTORS
Psychosocial factors are associated with psychological stress. Psychosocial
factors are important factors contributing to the musculoskeletal symptoms via their
impact on awkward posture and psychological stress (Lim and Carayon, 1993).
63T h e fo llo w in g h y p o th es is is deve loped :
Hypothesis XI:Psychosocial variables are directly associated with posture and psychological stress which contribute to physical symptom s._________ _____________ ___________ ______
5.2.2.4 SUMMARY
Based on past research, a model which describes the relationship between the
seven (7) categories o f risk factors and three (3) categories o f physical health symptoms,
is proposed and eleven hypotheses are formed.
5.3 SURVEY DESIGN
As discussed in Chapter 3, survey has the advantage o f realism over the
experiment approach. Because o f the amount o f variables and the complex relationship
to be investigated in this research, the survey method is more appropriate than the
experimented approach. The survey consisted o f three parts, a questionnaire,
measurements and posture recording. A questionnaire for the purpose o f collecting
personal background information, subjective opinions o f the tasks, workstation design,
environment, and health complaints was designed. A measurement worksheet and a
checklist for the objective evaluation o f workstation and work environment were also
developed. A posture analysis was conducted.
5.3.1 QUESTIONNAIRE DESIGN
Before designing the questionnaire, the specific variables representing each
category defined in the research model (Figure 5.3) were identified (see Appendix A). A
questionnaire was then designed (see Appendix B).
The questionnaire is divided into the following three parts: (1) background
information, which collects the information on demographics, subjective report o f the
VDT tasks, and psychosocial factors; (2) possible health symptoms, which include
musculoskeletal, visual, general physical, and psychological complaints; and (3)
64
computer, workstation, and work environment, which include subjective evaluation of
workstation design and work environment.
5.3.1.1 BACKGROUND INFORMATION
Demographics information had the following dimensions: work site (institution),
department, sex, age, job title, type o f eye wear, the frequency o f eye examination, work
habit, and exercises. The above information reflects the basic characteristics o f the
operator.
VDT task information is concerned with the amount o f exposure to VDTs and
the type o f VDT tasks. It was obtained by the following information: length o f time at
present job, VDT work history, working hours/day, typing speed, the major tasks with
VDTs, the time spent using computer continuously, the total time o f using computer
daily, and the percentage o f time spent using mouse.
Psychosocial factors examined in this study are: perceived surges o f work load,
work pressure, job satisfaction, supervisor support and feedback, and interaction with
other people at work (Sainfort, 1990; Carey, 1992). A 4-point scale with end points of
'never' and 'daily' was used for evaluating the response to the surges o f workload and
work pressure. A 6-point Likert scale with end points o f 'strongly disagree' and 'strongly
agree' were used to measure the response to the statements regarding the other
psychosocial variables stated above (Carey, 1992).
5.3.1.2 POSSIBLE HEALTH SYMPTOMS
Musculoskeletal, visual, general physical symptoms and psychological complaints
were collected by using a 5-point scale, i.e., 1 - Never, 2 - less than once a week, 3 -
once a week, 4 - several times a week, and 5 - daily.
A body map was used for subjects to indicate the area(s) which they experienced
stiffness, ache, pain, numbness, or discomfort (Figure 5.4). As shown in Figure 5.4, the
body is divided into nine regions, i.e. neck, shoulders, upper back, low back, elbows,
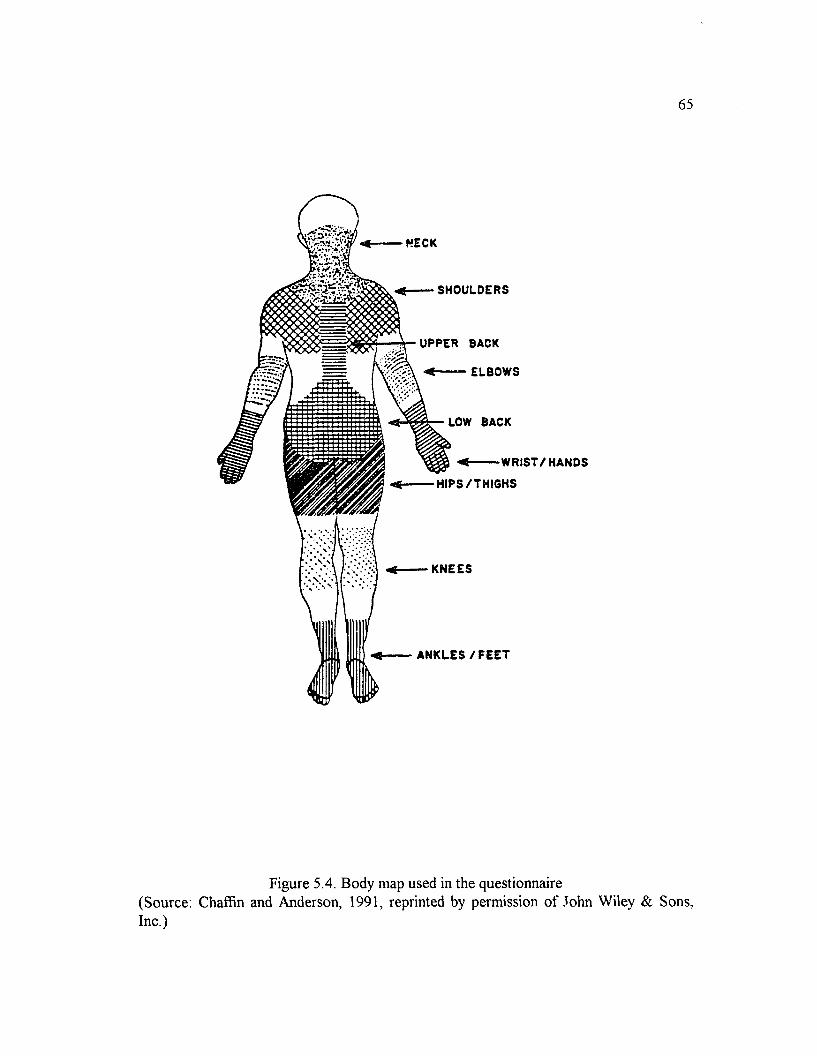
65
HECK
SHOULDERS
UPPER BACK
ELBOWS
LOW BACK
I
WRIST/HANDS
HIPS/THIGHS
ANKLES/FEET
Figure 5.4. Body map used in the questionnaire (Source: Chaffin and Anderson, 1991, reprinted by permission o f John Wiley & Sons, Inc.)
6 6
wrist/hands, hips/thighs, knees, and ankles/feet. If the subject indicated the presence of
the symptom, a scale was provided for indicating the frequency o f the problem. It was
also asked whether the problem was associated with any accident and the first time of
having the problem.
Visual symptoms were recognized as the following items, tearing/itching eyes,
dry eyes, burning eyes, tired eyes, blurred vision/double vision. The first four items
corresponded to 'ocular discomfort' and the last one represented 'conceptual
discomfort'(Schleifer et al., 1990). A question was also asked for the frequency o f
changing glasses because o f deteriorating vision.
General physical symptoms were recognized as the symptoms o f
headache/dizziness, ringing ears, and stomach discomfort. The psychological complaints
examined by fatigue, anxiety, and depression (McNair et al., 1971; Sainfort, 1990).
5.3.1.3 COMPUTER, WORKSTATION, AND WORK ENVIRONMENT
Workstation information was collected by the subjective evaluation o f screen,
keyboard, and chair which are the basic hardware o f a VDT workstation system.
Screen glare, legibility o f screen characters, readability o f text on the screen,
screen size, and position o f screen were evaluated by a 4-point scale, from 1 to 4,
representing from excellent condition to poor or uncomfortable condition. A 5-point
scale was provided for rating the height o f the screen, from 1 to 5, corresponding to 'too
high' to 'too low'.
The subjective evaluation o f keyboard included the rating o f the comfort with the
position o f keyboard and the height o f keyboard. Past research has found that the height
o f the keyboard is associated with the musculoskeletal discomfort (Hunting et al., 1981).
However, the position o f the keyboard, i.e., in front o f the user or tilted, has not been
evaluated.
67
Chair was evaluated by the height, the comfort with the back rest, and the
comfort with the seat pan. The reasons for too high or too low chair were also asked
since most chairs used by computer operators were observed to be adjustable in the
work place (Lu et al. 1993a).
W ork environment was assessed for the illumination o f the working area, the
comfort level o f the illumination, the noise level o f the working area, the comfort with
the temperature, humidity, and ventilation conditions, the work space, and privacy o f the
work area.
5.3.2 MEASUREMENT AND CHECKLIST DESIGN
In order to objectively assess workstation design and lighting condition in the
workplace, a checklist and measurement worksheet for workstation, lighting condition,
and anthropometry data were developed.
The following items at workstation were assessed objectively: computer system,
workstation layout, workstation accessories, chair, screen glare, workstation dimensions,
lighting conditions, and screen glare (Table 5.1). An anthropometric set was used for the
measurement o f workstation and dimension. A triple range, light meter made by General
Electric was used for measuring the lighting conditions. Measurement technique and
landmark for each item are defined in Appendix D. Anthropometric data including
height, eye height while sitting, elbow height while sitting, and popliteal height were also
measured by using the anthropometry set.
5.3.3 POSTURE RECORDING
The purpose o f posture recording was to collect working posture data and
investigate the association o f posture and other variables in the research model. A
posture analysis method was developed and is to be described in section 5.4. The
operator's working was recorded for 5-10 min. during his/her normal working period and
assumed to represent the operator's dominant working posture in the workplace.
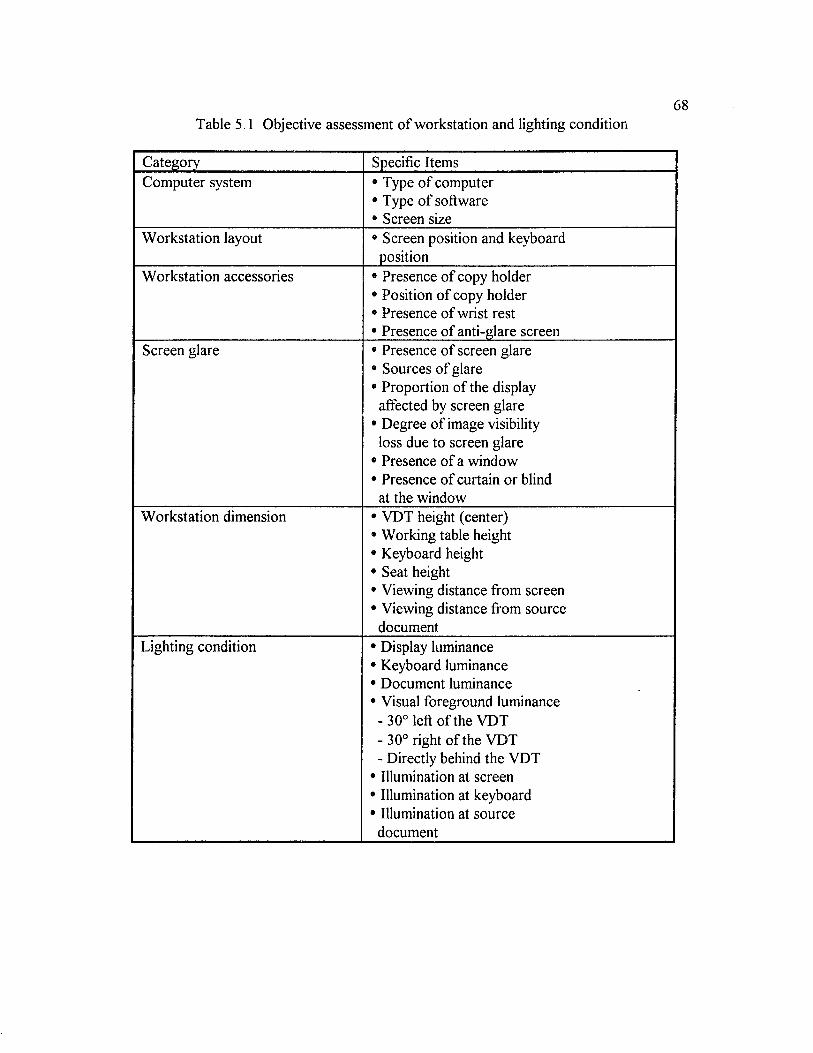
68Table 5.1 Objective assessment o f workstation and lighting condition
Category Specific ItemsComputer system • Type o f computer
• Type o f software• Screen size
Workstation layout 9 Screen position and keyboard position
Workstation accessories 9 Presence o f copy holder 9 Position o f copy holder 9 Presence o f wrist rest 9 Presence o f anti-glare screen
Screen glare 9 Presence o f screen glare 9 Sources o f glare 9 Proportion of the display
affected by screen glare 9 Degree o f image visibility
loss due to screen glare 9 Presence o f a window 9 Presence o f curtain or blind
at the windowWorkstation dimension 9 VDT height (center)
9 Working table height 9 Keyboard height 9 Seat height9 Viewing distance from screen 9 Viewing distance from source
documentLighting condition 9 Display luminance
9 Keyboard luminance 9 Document luminance 9 Visual foreground luminance
- 30° left o f the VDT- 30° right o f the VDT- Directly behind the VDT
9 Illumination at screen9 Illumination at keyboard 9 Illumination at source
document
69
5.3.4 SAMPLING METHOD
The ideal way to select survey area is to find health records in different work
organizations and to select two areas with one having the most health complaints and the
other having the least health complaints. This is hard to do because firstly, there are no
records showing the health complaints such as musculoskeletal discomfort and eye
fatigue, and secondly, there are no such database in which to search and compare the
data.
In order to search for the workplace for this survey, the author contacted several
government and private agencies and several departments o f LSU which had computer
workstations and daily computer users. Our Lady o f the Lake Hospital was selected as
the study place because: (1) there were many computer users; and (2) this was the only
place that permitted the author to enter the workplace and conduct the study. Several
departments o f LSU were also selected including Penington Biomedical Research Center
and some department offices.
Subject were randomly selected in the sampled area based on the following
criteria: (1) full time employee, (2) working at present workstation at least three months,
and (3) daily computer user.
5.3.5 SURVEY PROCEDURE
The survey procedure consists o f three steps: administration o f the questionnaire,
workstation measurement and evaluation, and video tape o f working posture. At each
interview, the subject was told about the purpose and procedure o f the survey. The
survey procedure was continued if the subject agreed to participate the survey.
The questionnaire was given to the subject at each workstation and the subject
was asked to return to it the next day. Some subjects answered the questionnaire
immediately. It generally took 10 minutes to answer the questionnaire.

70
The dimensions o f workstation, work environment, and anthropometry data were
measured. A checklist was used to evaluate the workstation for the type o f computer
system, software, glare source, etc. Questions were also asked by the investigator for
confirming some items on the checklist. It took about 10 to 15 minutes for this step.
The subject was then asked to continue her work. The working posture,
workstation, and the surrounding area were then video taped for 5-10 minutes.
5.4 POSTURE ANALYSIS
In order to analyze working postures among VDT operators, a posture scoring
system needed to be developed.
5.4.1 BRIEF REVIEW OF POSTURE ANALYSIS METHOD
Various methods have been found in the literature to assess the postures,
movements and forces exerted while performing a job and their effect on the physical
capacity and capability o f the person. Methods to evaluate the working posture can be
classified as observation (Priel, 1974; Corlett and Bishop, 1976; Karhu, et al., 1977;
Corlett et al., 1979; McAtamney and Corlett, 1993), videotape, optical or frame-
grabbing systems (Occhipinti et al, 1985; Keyserling, 1986; Foreman et al, 1988; Tracy
and Gray, 1989; Corlett, 1990; Wrigley, et al, 1991). All these methods are undoubtedly
useful and are served as the basis o f development o f the posture analysis method in this
research.
Since the data collection in this research will be conducted at a real workplace,
the major consideration in developing the posture analysis method here is simplicity and
ease-of-use. Compared with other methods, the observation method is simple, quick, and
do not require complicated and expensive equipment. The OWAS system (Karhu et al,
1977) and RULA system (McAtamney and Corlett, 1993), which use the concept of
numbers to represent postures with an associated coding system, are clear and concise
methods which can be used quickly. This is used as a suitable basis for this research.
71
Most o f the literature on neck posture has emphasized discomfort and disorders
related to the head inclination angle. Kumar and Scaife (1979) showed bioinechanically
that small neck flexion angles cause significant muscle contractions. Subjective
discomfort rating methods have demonstrated a relationship between forward neck
flexion and localized pain (Hunting et al., 1980). Epidemiological studies have found a
relationship between awkward neck posture and cervicobrachial disorders (Jonsson et
al., 1988).
Laboratory studies have shown that trunk flexion, lateral bending, or twisting
increases mechanical stresses on the spinal muscles and intervertebral discs (Anderson et
al., 1977; Schultz et al., 1982) and that prolonged trunk flexion causes extreme levels of
muscle fatigue (Chaffin, 1973). Epidemiologic studies have shown that sustained static
postures o f the trunk such as prolonged sitting or forward bending result in increased
risk o f low back pain (Magora, 1972; Kelsey and Hochberg, 1988). Periodic or repetitive
bending and/or twisting o f the trunk have also been cited as factors in the development
o f back pain (Keyserling et al, 1988).
Laboratory studies o f the shoulder have shown that prolonged elevation o f the
arms (glenohumral flexion or abduction) causes extreme levels o f muscle fatigue, and in
some cases, acute tendinitis (Chaffin, 1973; Hagberg, 1982). The relationship between
shoulder elevation and increased risk o f tendinitis has been demonstrated in a cross-
sectional field study (Hagberg, 1984). Shoulder elevation and extension have been
associated with increased risk o f a variety o f cervicobrachial disorders including thoracic
outlet syndrome (Feldman et al., 1983; Armstrong, 1986; Jonsson et al., 1988).
Excessive extension o f the wrists may cause symptoms in the hands. Previous
studies among accounting workers have shown that the incidence o f tiredness, pains and
cramps in the right hand increases with the degree o f ulna deviation o f the same hand
(Grandjean, 1984b).
72
5.4.2 A POSTURE SCORING METHOD
After reviewing the literature, it is seen that the following measurements are
important for assessing the working posture: head/neck angle, trunk posture, arm
posture, and wrist posture.
To simplify the posture analysis process, only the operator's dominant working
posture was analyzed. The dominant posture was defined here as the posture that the
operator uses most o f the time when he/she working with the computer. It represented
the operator's habitual posture and movement in accommodation o f the design of
workplace and work nature. The basic assumption was that the deviation from neutral
sitting position require extra muscle effort to balance the body and therefore may easily
cause operator's discomfort and fatigue. Awkward posture and body movement such as
twisting or bending sideways could also lead to physical discomfort.
Similar to those observation methods (Priel, 1974; Corlett and Bishop, 1976;
Karhu, et al., 1977; Corlett et al., 1979), the body is divided into several segments for
the evaluation o f posture. Using the concept from OWAS system (Karhu et al., 1977)
and RULA system (McAtamney and Corlett, 1993), standard postures for each segment
are pre-defmed and a score corresponding to the possible risk o f each posture are
assigned. Because this research concentrates on the posture when the subject is sitting
and performing the job, and the major moving part o f the body is the head/neck, arms,
and trunk, the body is divided into the following six segments for the evaluation o f the
posture: head/neck, trunk, upper arms, lower arms, wrists, and legs/feet (Figure 4.1).
The posture and movement range o f each body part are divided into different sections
according to the criteria derived through the interpretation o f relevant literature. These
sections are numbered so that the number one (1) is given to the working posture or the
range o f movement where the risk factors present are minimal. Higher numbers are
allocated to parts o f the working posture or movement range with more extreme posture
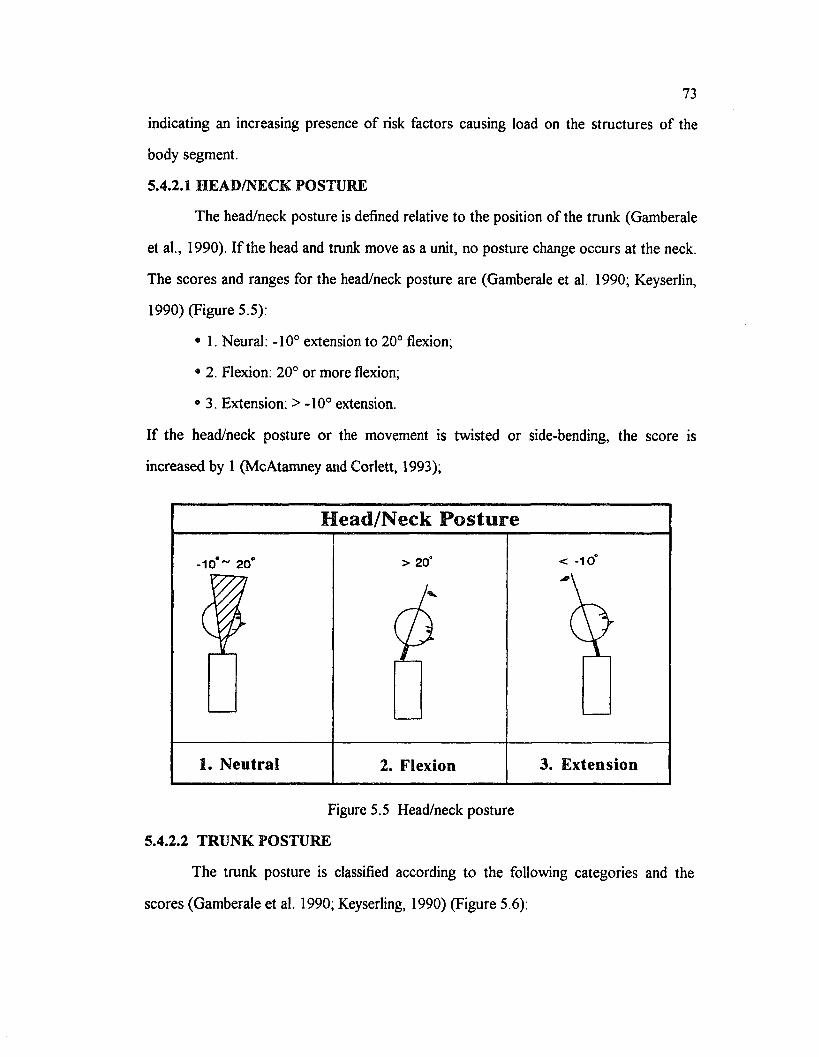
73
indicating an increasing presence o f risk factors causing load on the structures o f the
body segment.
5.4.2.1 H EA D /N ECK POSTURE
The head/neck posture is defined relative to the position o f the trunk (Gamberale
et al., 1990). I f the head and trunk move as a unit, no posture change occurs at the neck.
The scores and ranges for the head/neck posture are (Gamberale et al. 1990; Keyserlin,
1990) (Figure 5.5):
• 1. Neural: -10° extension to 20° flexion;
• 2. Flexion: 20° or more flexion;
• 3. Extension: > -10° extension.
If the head/neck posture or the movement is twisted or side-bending, the score is
increased by 1 (McAtamney and Corlett, 1993);
Head/Neck Posture
-10*~ 20° > 20° < -10°
1. Neutral 2. Flexion 3. Extension
Figure 5.5 Head/neck posture
5.4.2.2 TRU N K POSTURE
The trunk posture is classified according to the following categories and the
scores (Gamberale et al. 1990; Keyserling, 1990) (Figure 5.6):
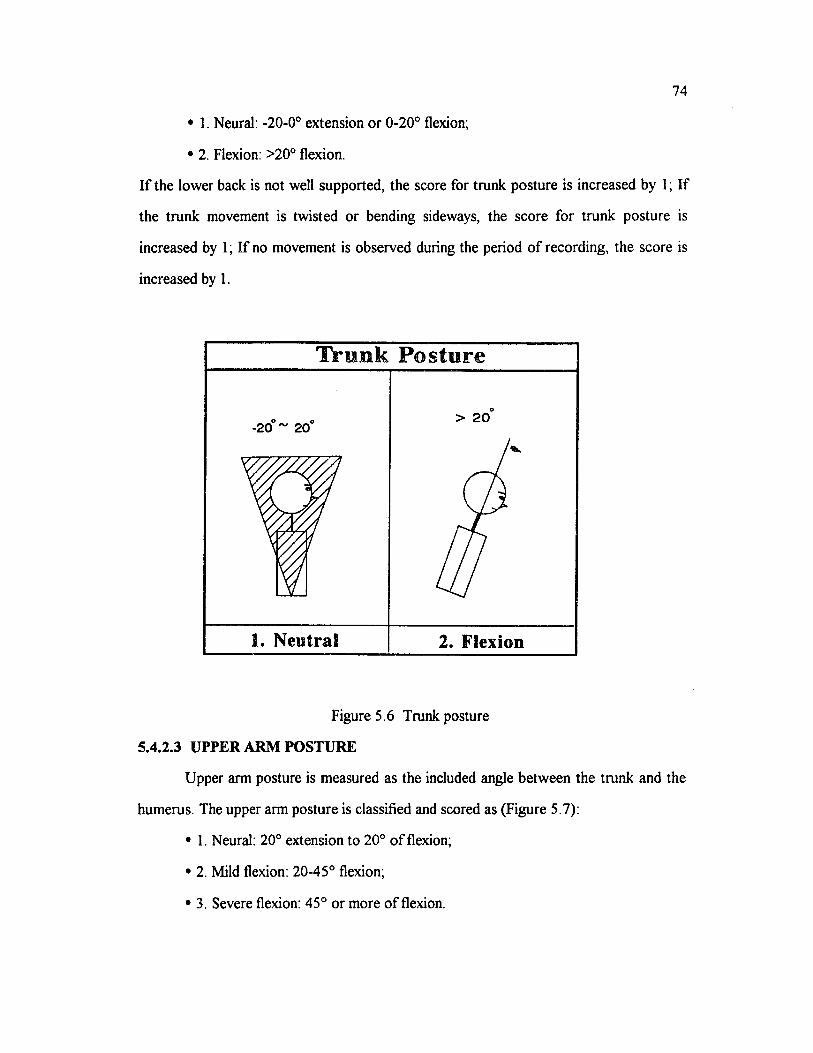
74
• 1. Neural: -20-0° extension or 0-20° flexion;
• 2. Flexion: >20° flexion.
I f the lower back is not well supported, the score for trunk posture is increased by 1; If
the trunk movement is twisted or bending sideways, the score for trunk posture is
increased by 1; If no movement is observed during the period o f recording, the score is
increased by 1.
T ru n k P ostu re
> 20°-20 ~ 20/*■
V / i1. Neutral 2. Flexion
Figure 5.6 Trunk posture
5.4.2.3 UPPER ARM POSTURE
Upper arm posture is measured as the included angle between the trunk and the
humerus. The upper arm posture is classified and scored as (Figure 5.7):
• 1. Neural: 20° extension to 20° o f flexion;
• 2. Mild flexion: 20-45° flexion;
• 3. Severe flexion: 45° or more o f flexion.
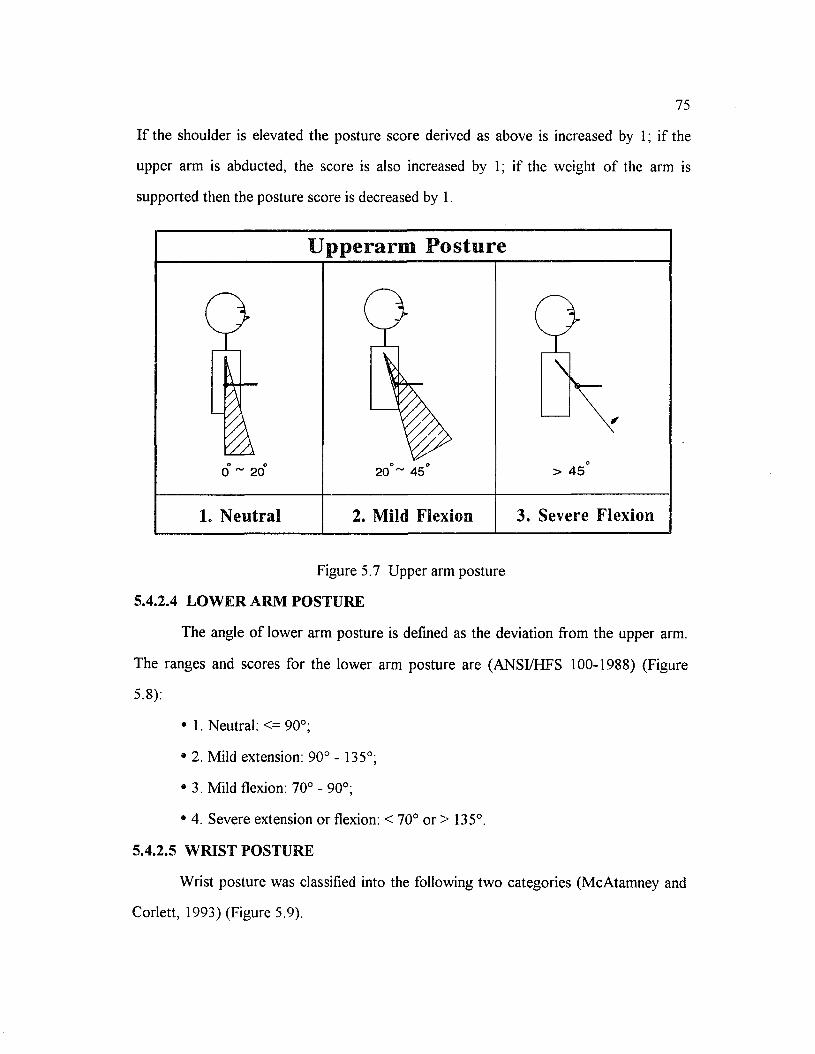
75
I f the shoulder is elevated the posture score derived as above is increased by 1; if the
upper arm is abducted, the score is also increased by 1; if the weight o f the arm is
supported then the posture score is decreased by 1.
Upperarm Posture
9I-1
o o 0 ~ 20
io o
20 ~ 45
9'V"S'̂ XSS\^ '
> 45°
1. Neutral 2. Mild Flexion 3. Severe Flexion
Figure 5.7 Upper arm posture
5.4.2.4 LOWER ARM POSTURE
The angle o f lower arm posture is defined as the deviation from the upper arm.
The ranges and scores for the lower arm posture are (ANSI/HFS 100-1988) (Figure
5.8):
• 1. Neutral: <= 90°;
• 2. Mild extension: 90° - 135°;
• 3. Mild flexion: 70° - 90°;
• 4. Severe extension or flexion: < 70° or > 135°.
5.4.2.5 WRIST POSTURE
Wrist posture was classified into the following two categories (McAtamney and
Corlett, 1993) (Figure 5.9):
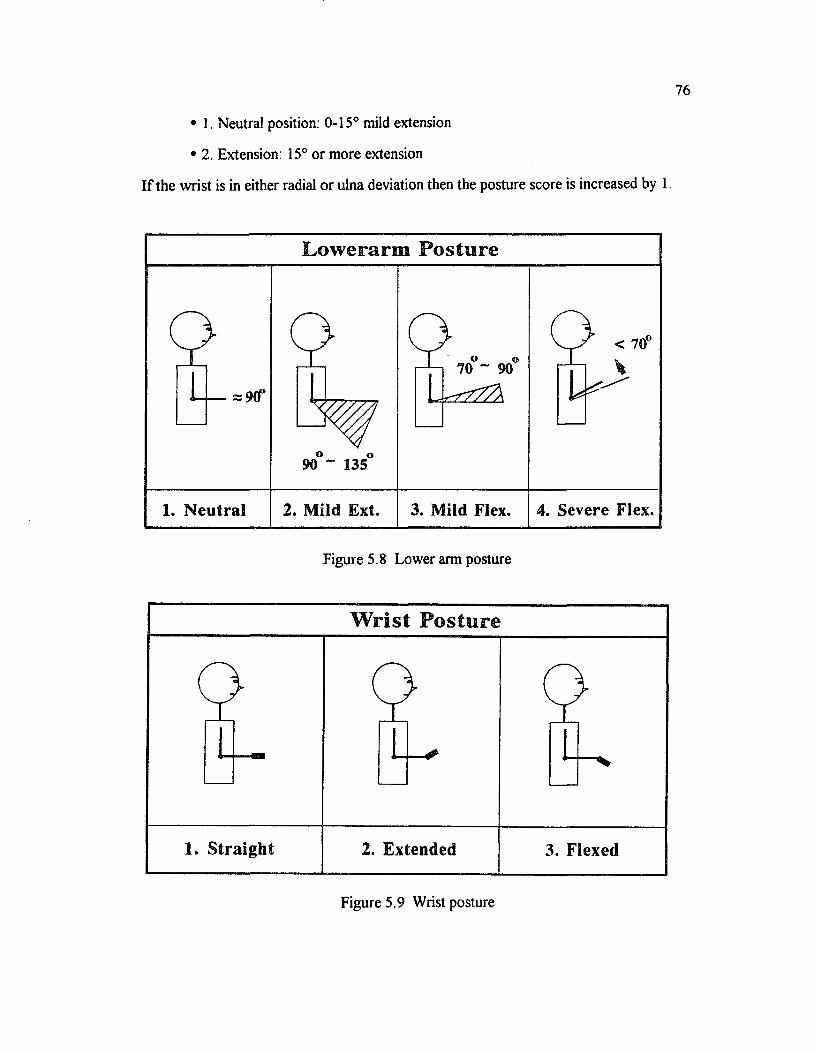
• 1. Neutral position: 0-15° mild extension
• 2. Extension: 15° or more extension
If the wrist is in either radial or ulna deviation then the posture score is increased by 1.
Lowerarm Posture
< 70
J- i 70 ~ 90
o o90 ~ 135
3. Mild Flex.2. Mild Ext. 4. Severe Flex.1. Neutral
Figure 5.8 Lower arm posture
W rist Posture
9L _
9U
9u
1. Straight 2. Extended 3. Flexed
Figure 5.9 Wrist posture
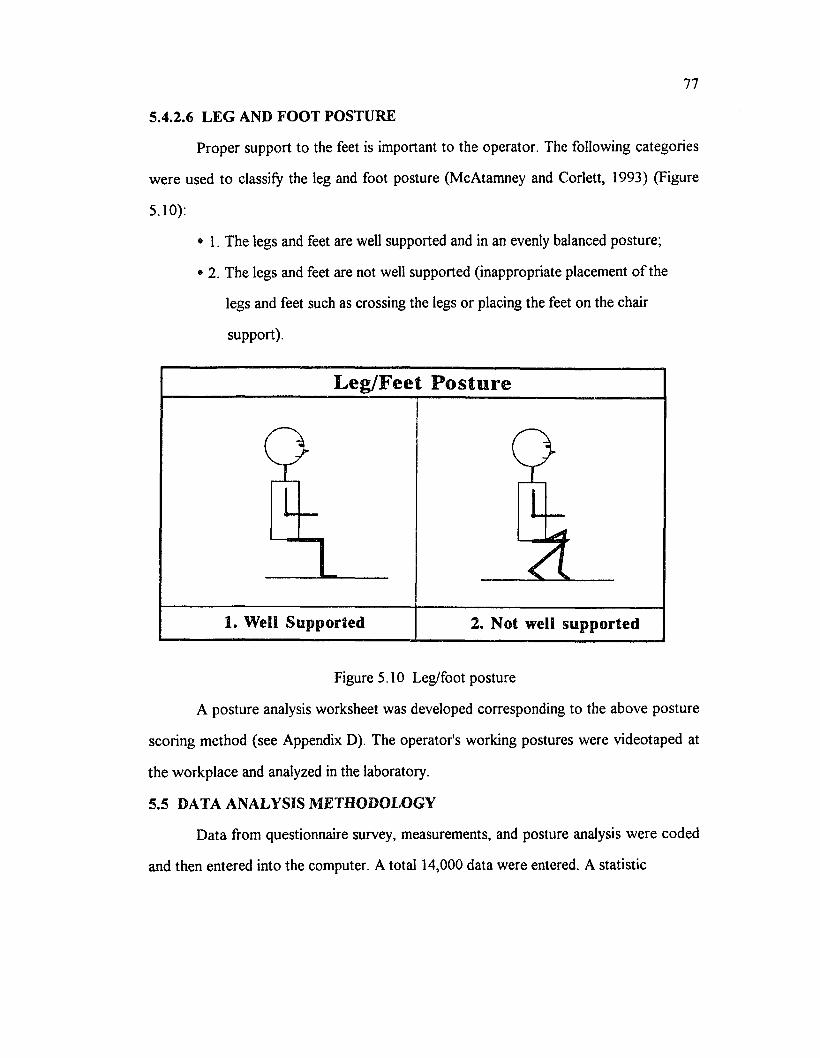
77
5.4.2.6 LEG AND FOOT POSTURE
Proper support to the feet is important to the operator. The following categories
were used to classify the leg and foot posture (McAtamney and Corlett, 1993) (Figure
5.10):
• 1. The legs and feet are well supported and in an evenly balanced posture;
* 2. The legs and feet are not well supported (inappropriate placement o f the
legs and feet such as crossing the legs or placing the feet on the chair
support).
Leg/Feet Posture
9L
9L _
1. Well Supported 2. Not well supported
Figure 5.10 Leg/foot posture
A posture analysis worksheet was developed corresponding to the above posture
scoring method (see Appendix D). The operator's working postures were videotaped at
the workplace and analyzed in the laboratory.
5.5 DATA ANALYSIS METHODOLOGY
Data from questionnaire survey, measurements, and posture analysis were coded
and then entered into the computer. A total 14,000 data were entered. A statistic
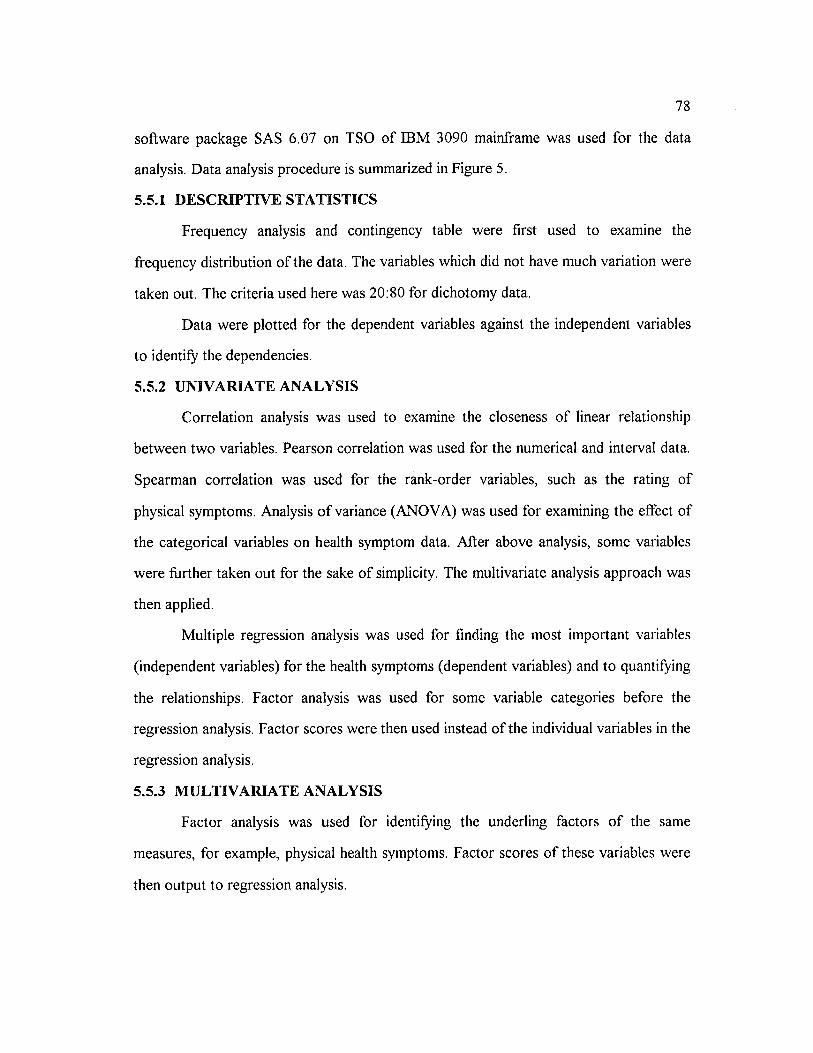
78
software package SAS 6.07 on TSO o f IBM 3090 mainframe was used for the data
analysis. Data analysis procedure is summarized in Figure 5.
5.5.1 DESCRIPTIVE STATISTICS
Frequency analysis and contingency table were first used to examine the
frequency distribution o f the data. The variables which did not have much variation were
taken out. The criteria used here was 20:80 for dichotomy data.
Data were plotted for the dependent variables against the independent variables
to identify the dependencies.
5.5.2 UNIVARIATE ANALYSIS
Correlation analysis was used to examine the closeness o f linear relationship
between two variables. Pearson correlation was used for the numerical and interval data.
Spearman correlation was used for the rank-order variables, such as the rating of
physical symptoms. Analysis o f variance (ANOVA) was used for examining the effect o f
the categorical variables on health symptom data. After above analysis, some variables
were further taken out for the sake o f simplicity. The multivariate analysis approach was
then applied.
Multiple regression analysis was used for finding the most important variables
(independent variables) for the health symptoms (dependent variables) and to quantifying
the relationships. Factor analysis was used for some variable categories before the
regression analysis. Factor scores were then used instead o f the individual variables in the
regression analysis.
5.5.3 MULTIVARIATE ANALYSIS
Factor analysis was used for identifying the underling factors o f the same
measures, for example, physical health symptoms. Factor scores o f these variables were
then output to regression analysis.
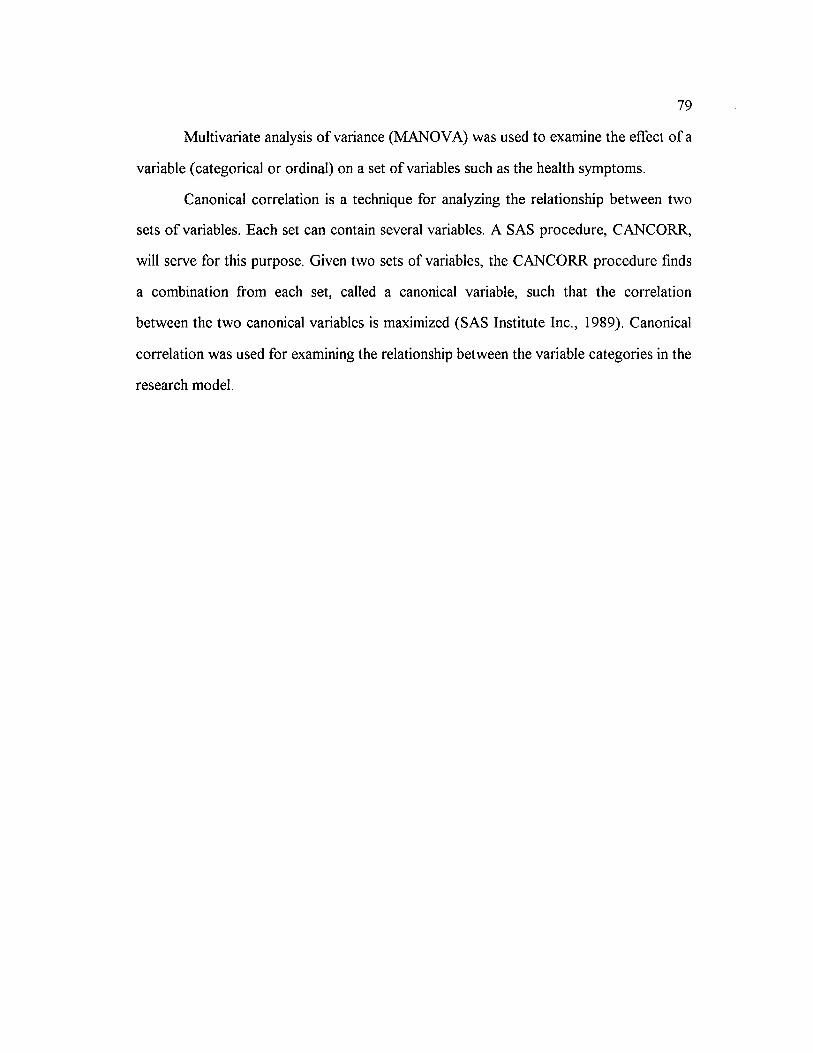
79
Multivariate analysis o f variance (MANOVA) was used to examine the effect o f a
variable (categorical or ordinal) on a set o f variables such as the health symptoms.
Canonical correlation is a technique for analyzing the relationship between two
sets o f variables. Each set can contain several variables. A SAS procedure, CANCORR,
will serve for this purpose. Given two sets of variables, the CANCORR procedure finds
a combination from each set, called a canonical variable, such that the correlation
between the two canonical variables is maximized (SAS Institute Inc., 1989). Canonical
correlation was used for examining the relationship between the variable categories in the
research model.
80
Data entry
Survey data Coding sheet design
Data coding
Data entry
Univariate analysisDescriptive data analysis
Descriptive statistics
Correlations, ANOVA
Multivariate analysis
MANOVA Factor analysis Canonical correlations
Multiple regression
The most important Relationship betweenrisk factors variable sets
Figure 5.11 Data analysis procedure

CHAPTER 6
RESULTS
6.1 BACKGROUND INFORMATION
Ninety-three VDT users answered the questionnaire, among which 80
participated in workstation, environment, and anthropometric measurements, and 74
participated in video recording o f working postures in the workplace. There were 88
valid respondents. Some questionnaire answers were considered invalid for the reasons
o f short employment length (less than three months), not full-time employees, or
incomplete questionnaire answers.
6.1.1 SITE AND DEPARTMENT
Subjects came from two different sites, Our Lady o f the Lake Hospital (OLOL)
and Louisiana State University (LSU). The number o f subjects in each department and
site is listed in Table 6.1.
Seventy-two subjects (81.8%) were from OLOL. These operators worked
intensively on the computer for data entry, information retrieval, word processing, and
programming. Among the offices surveyed, two offices had very heavy computer users,
Business Office and Accounting & Payroll Office. Operators in the Business Office
worked on the medical records, payment collection from patients and interacted with the
insurance company. They worked in one big office that was separated by dividers into
three sections: Medicare, Collection, and Insurance. In addition to the computer, they
spent a lot o f time answering phone calls. Their work pace was basically controlled by
phone calls and the noise level in the workplace was the highest when compared with the
8 1
82
Table 6.1 Sites and departments in VDT workstation survey
Site Department Number PercentOLOL 72 81.8
• Business Office- Medicare 11- Collection 13- Insurance 10
• Accounting and Payroll 17
• Other Offices- Administration office 5- Human resource 4- Decision support group 3- Quality services 2- Nursing services 2- Library 1- Social services 1- Elderly services 1- Foundation 1
LSU 16 18.2• Penington Biomedical Center 6• IE Department 2• Engineering Services 2• Independent Study 2• Deans Office 1• Agriculture Lab 1• Traffic Office 1• Safety and Risk Management 1
Total: 88 100%
other departments surveyed. The type of computer most operators used was a terminal
that was connected to a database system in the hospital. In the Accounting and Payroll
Office which was another big office, most people worked with personal computers
(PCs). They worked heavily with numerical data, either data entry or retrieval. In other
offices o f OLOL, VDT operators were more isolated than people in the Business Office
and Accounting & Payroll Office. In Decision Support Group, all operators worked on
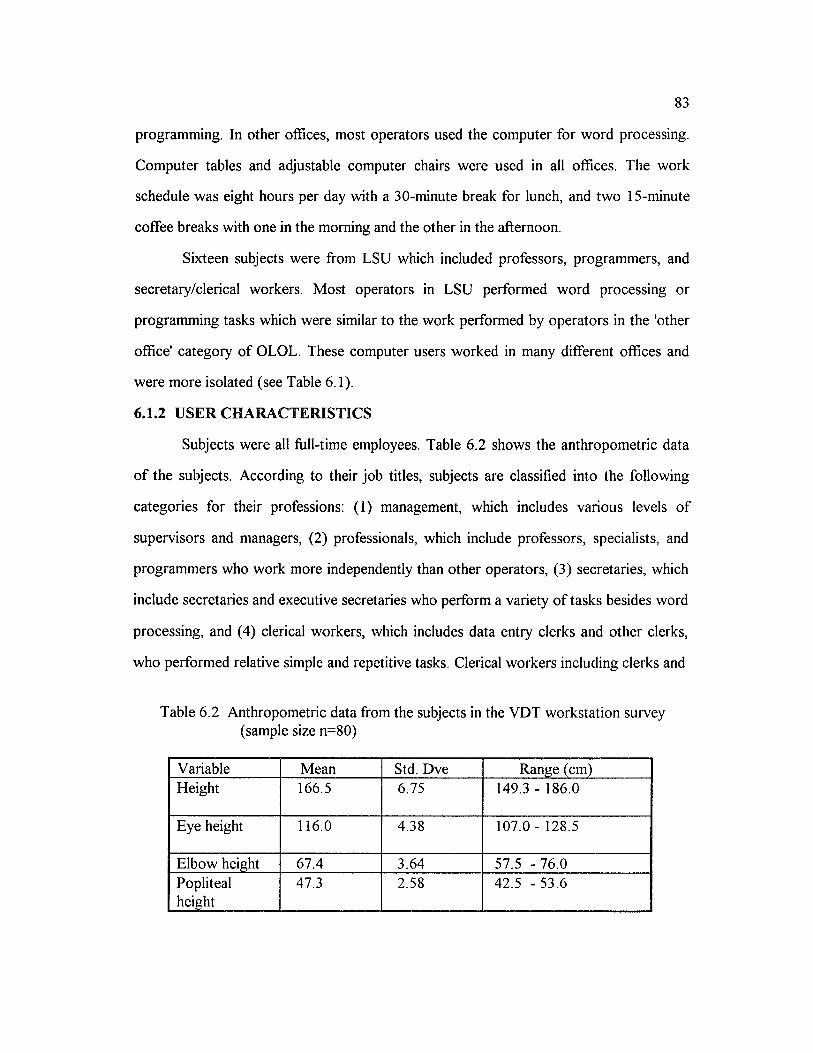
83
programming. In other offices, most operators used the computer for word processing.
Computer tables and adjustable computer chairs were used in all offices. The work
schedule was eight hours per day with a 30-minute break for lunch, and two 15-minute
coffee breaks with one in the morning and the other in the afternoon.
Sixteen subjects were from LSU which included professors, programmers, and
secretary/clerical workers. Most operators in LSU performed word processing or
programming tasks which were similar to the work performed by operators in the 'other
office' category o f OLOL. These computer users worked in many different offices and
were more isolated (see Table 6.1).
6.1.2 USER CHARACTERISTICS
Subjects were all full-time employees. Table 6.2 shows the anthropometric data
o f the subjects. According to their job titles, subjects are classified into the following
categories for their professions: (1) management, which includes various levels o f
supervisors and managers, (2) professionals, which include professors, specialists, and
programmers who work more independently than other operators, (3) secretaries, which
include secretaries and executive secretaries who perform a variety o f tasks besides word
processing, and (4) clerical workers, which includes data entry clerks and other clerks,
who performed relative simple and repetitive tasks. Clerical workers including clerks and
Table 6.2 Anthropometric data from the subjects in the VDT workstation survey (sample size n=80)
Variable Mean Std. Dve Range (cm)Height 166.5 6.75 149.3 - 186.0
Eye height 116.0 4.38 107.0- 128.5
Elbow height 67.4 3.64 57.5 -76 .0Poplitealheight
47.3 2.58 42.5 - 53.6
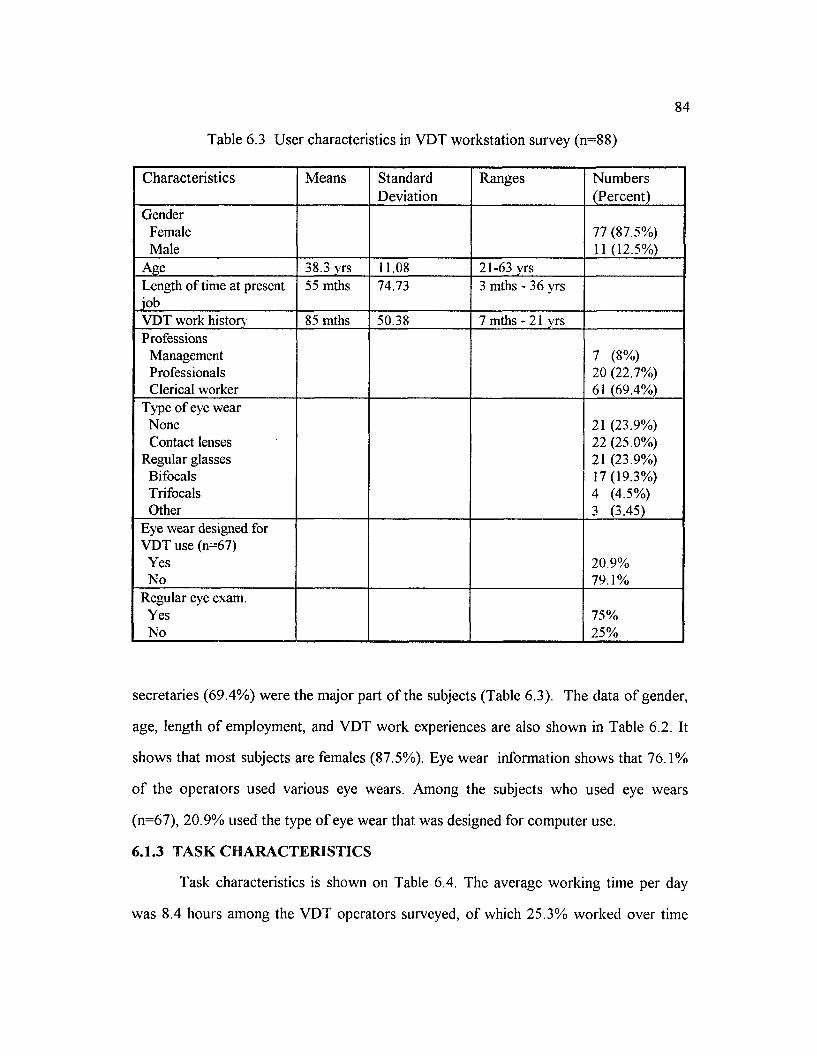
84
Table 6.3 User characteristics in VDT workstation survey (n=88)
Characteristics Means StandardDeviation
Ranges Numbers(Percent)
GenderFemaleMale
77 (87.5%) 11 (12.5%)
Age 38.3 vrs 11.08 21-63 yrsLength of time at present job
55 mths 74.73 3 mths - 36 yrs
VDT work history 85 mths 50.38 7 mths - 21 yrsProfessions
Management Professionals Clerical worker
7 (8%)20 (22.7%) 61 (69.4%)
Type of eye wear NoneContact lenses
Regular glasses Bifocals Trifocals Other
21 (23.9%)22 (25.0%) 21 (23.9%) 17(19.3%) 4 (4.5%)3 (3.45)
Eye wear designed for VDT use (n=67)
YesNo
20.9%79.1%
Regular eye exam. Yes No
75%25%
secretaries (69.4%) were the major part o f the subjects (Table 6.3). The data o f gender,
age, length o f employment, and VDT work experiences are also shown in Table 6.2. It
shows that most subjects are females (87.5%). Eye wear information shows that 76.1%
o f the operators used various eye wears. Among the subjects who used eye wears
(n=67), 20.9% used the type o f eye wear that was designed for computer use.
6.1.3 TASK CHARACTERISTICS
Task characteristics is shown on Table 6.4. The average working time per day
was 8.4 hours among the VDT operators surveyed, o f which 25.3% worked over time
85
from 0.5 hour to 4 hours per day. Subjects were all daily computer users. The average
time o f computer use was between 4-6 hours per day. Sixty-five percent (65%) of
operators used the computer over 4 hours per day, nineteen (19%) o f operators used
computer less than 4 hours per day, and for the other operators (16%), the time spent
using the computer varied greatly. It is seen that most operators performed more than
one task with the computer. It also shows that most VDT operators (97.3%) did not use
a mouse for their tasks. The computers used by VDT operators were IBM personal
computers or compatible (PCs) (55%) and mainframe terminals (45%). The major
software used were a database system on the mainframe, a database system on PCs, a
Lotus 1-2-3 spread sheet, Word Perfect, and Harvard Graphics/AutoCAD.
6.1.3.1 TYPES OF VDT TASK
The major tasks performed by VDT operators were data entry, information
retrieval/interactive work, word processing, programming, and drawing/computer aided
design (CAD) (Table 6.4).
Since most operators performed more than one type o f task with VDTs, tasks
are further classified into the following two categories (Table 6.5): (1) single task, and
(2) multiple task. The first category "Single task" means that operators perform only one
type o f task, either data entry, or word processing, or interactive work/information
retrieval. 44.3% o f operators belonged to this category. The second category' "Multiple
task" means that the operators performed a combination o f more than one type o f VDT
task. 55.7% o f operators belonged to this category. The single task is then further
divided into 3 categories: (1) word processing, which includes the task o f typing reports,
letters, and memos, (2) data entry, which includes the task o f entering numerical data,
(3) interactive work or information retrieval, which includes interactive task, information
retrieval, programming, and drawing/CAD. The Multiple tasks are also divided into the
following four categories: (4) word processing and interactive work/information
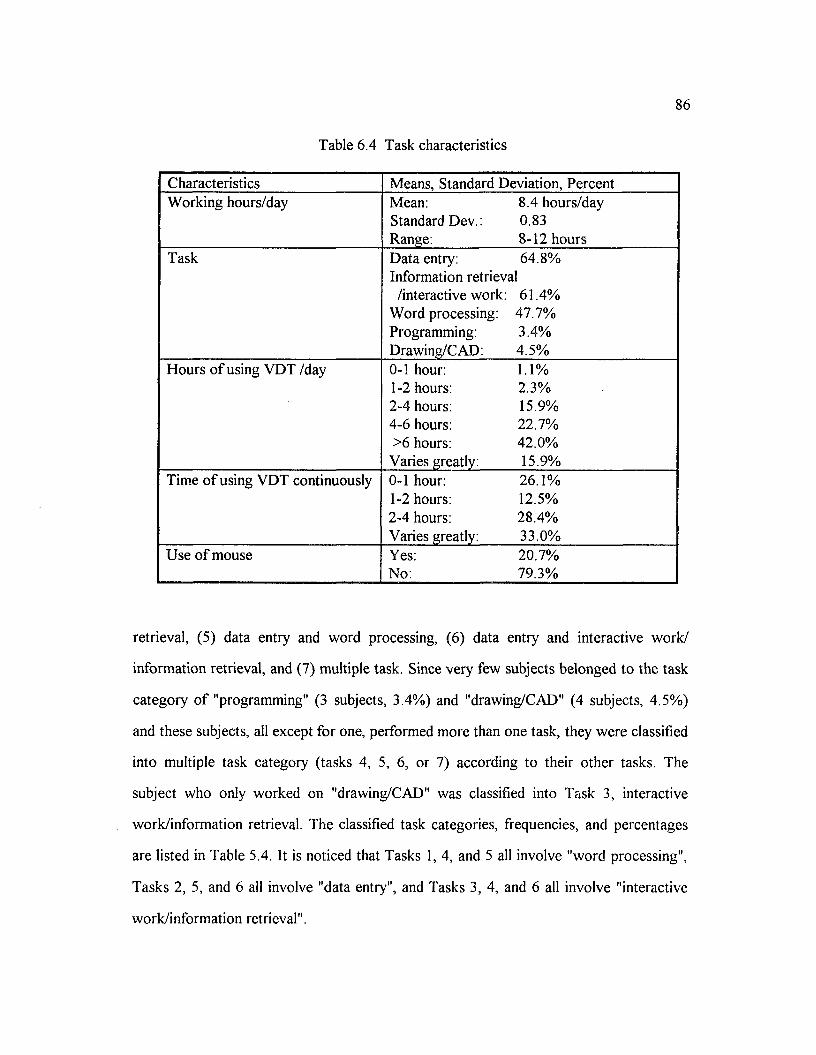
86
T ab le 6 .4 T ask ch a rac te ris tic s
Characteristics Means, Standard Deviation, PercentWorking hours/day Mean: 8.4 hours/day
Standard D ev.: 0.83Range. 8-12 hours
Task Data entry: 64.8%Information retrieval
/interactive work: 61.4%Word processing: 47.7%Programming: 3.4%Drawing/CAD: 4.5%
Hours o f using VDT /day 0-1 hour: 1.1%1-2 hours: 2.3%2-4 hours: 15.9%4-6 hours: 22.7%>6 hours: 42.0%
Varies greatly: 15.9%Time o f using VDT continuously 0-1 hour: 26.1%
1-2 hours: 12.5%2-4 hours: 28.4%Varies greatly: 33.0%
Use o f mouse Yes: 20.7%No: 79.3%
retrieval, (5) data entry and word processing, (6) data entry and interactive work/
information retrieval, and (7) multiple task. Since very few subjects belonged to the task
category o f "programming" (3 subjects, 3.4%) and "drawing/CAD" (4 subjects, 4.5%)
and these subjects, all except for one, performed more than one task, they were classified
into multiple task category (tasks 4, 5, 6, or 7) according to their other tasks. The
subject who only worked on "drawing/CAD" was classified into Task 3, interactive
work/information retrieval. The classified task categories, frequencies, and percentages
are listed in Table 5.4. It is noticed that Tasks 1, 4, and 5 all involve "word processing",
Tasks 2, 5, and 6 all involve "data entry", and Tasks 3, 4, and 6 all involve "interactive
work/information retrieval".
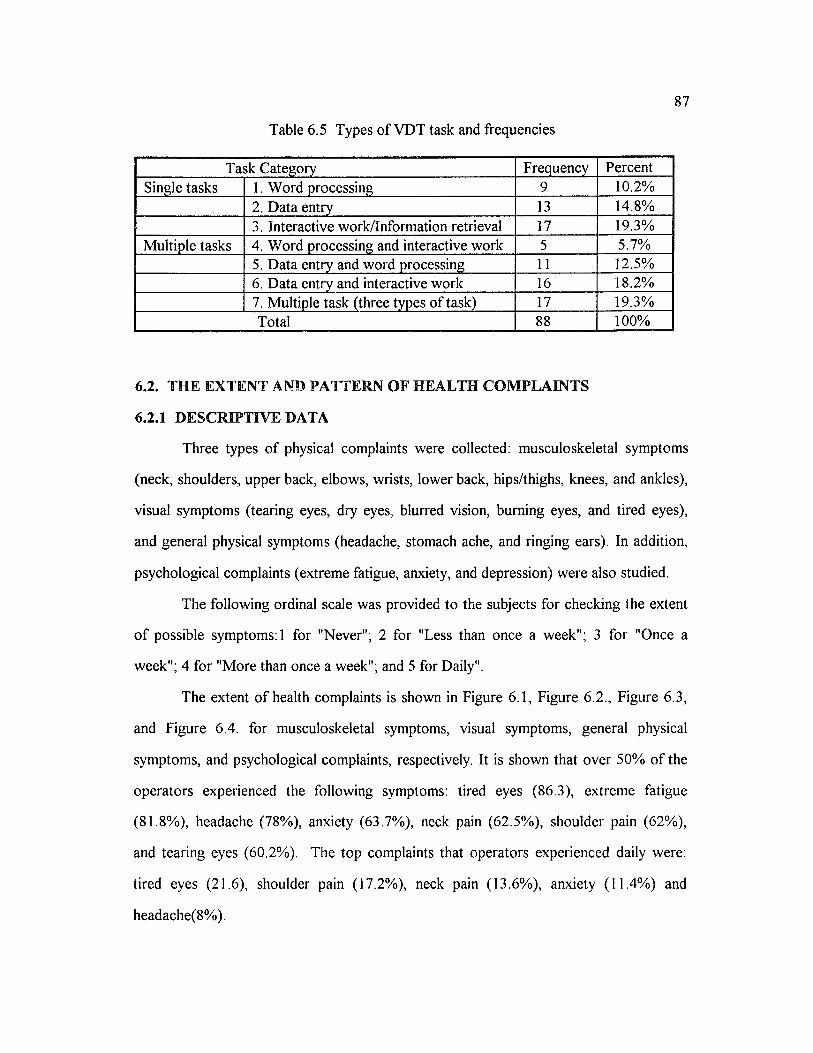
87
T ab le 6 .5 T y p es o f V D T ta sk and freq u en c ies
Task Category Frequency PercentSingle tasks 1. Word processing 9 10.2%
2. Data entry 13 14.8%3. Interactive work/information retrieval 17 19.3%
Multiple tasks 4. Word processing and interactive work 5 5.7%5. Data entry and word processing 11 12.5%6. Data entry and interactive work 16 18.2%7. Multiple task (three types o f task) 17 19.3%Total 88 100%
6.2. THE EXTENT AND PATTERN OF HEALTH COMPLAINTS
6.2.1 DESCRIPTIVE DATA
Three types o f physical complaints were collected: musculoskeletal symptoms
(neck, shoulders, upper back, elbows, wrists, lower back, hips/thighs, knees, and ankles),
visual symptoms (tearing eyes, dry eyes, blurred vision, burning eyes, and tired eyes),
and general physical symptoms (headache, stomach ache, and ringing ears). In addition,
psychological complaints (extreme fatigue, anxiety, and depression) were also studied.
The following ordinal scale was provided to the subjects for checking the extent
o f possible symptoms: 1 for "Never"; 2 for "Less than once a week"; 3 for "Once a
week"; 4 for "More than once a week"; and 5 for Daily".
The extent o f health complaints is shown in Figure 6.1, Figure 6.2., Figure 6.3,
and Figure 6.4. for musculoskeletal symptoms, visual symptoms, general physical
symptoms, and psychological complaints, respectively. It is shown that over 50% o f the
operators experienced the following symptoms: tired eyes (86.3), extreme fatigue
(81.8%), headache (78%), anxiety (63.7%), neck pain (62.5%), shoulder pain (62%),
and tearing eyes (60.2%). The top complaints that operators experienced daily were:
tired eyes (21.6), shoulder pain (17.2%), neck pain (13.6%), anxiety (11.4%) and
headache(8%).
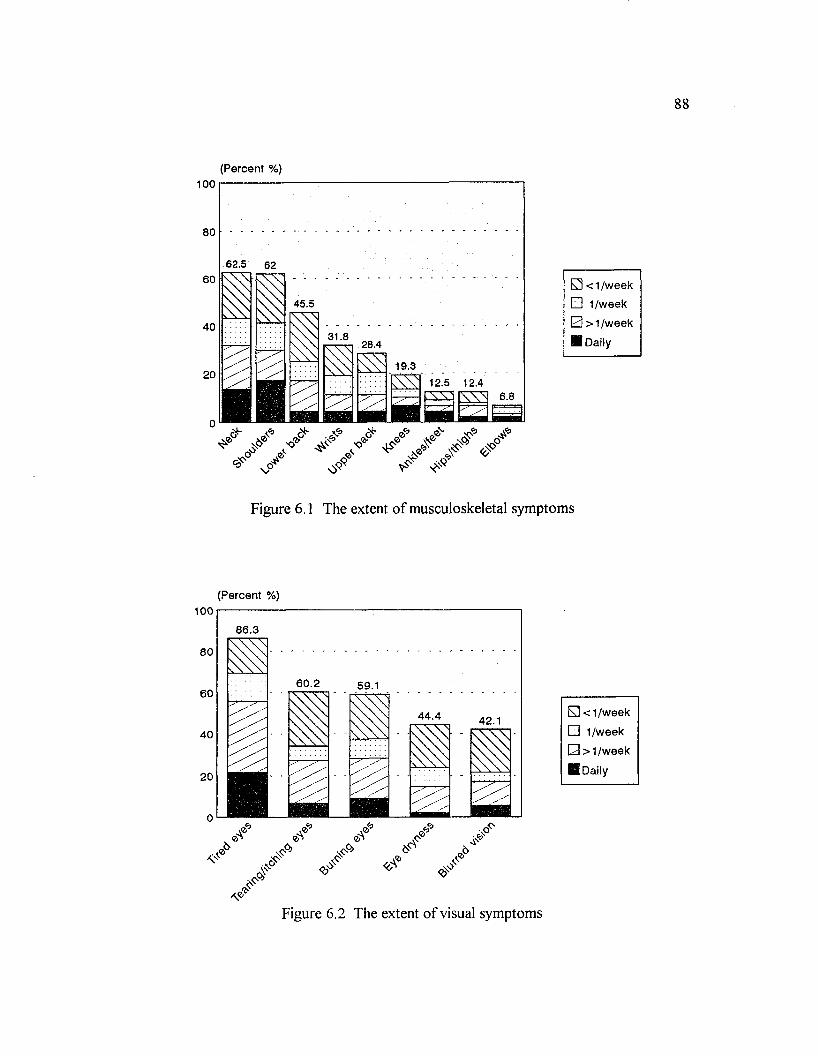
(Percent %)100
62.5 62
12.5 12.4
?■ ^
0 <1 /w eek
□ 1/week
0 > 1/week
■ Daily
Figure 6.1 The extent o f musculoskeletal symptoms
(Percent %)
Figure 6.2 The extent o f visual symptoms
□ <1/w eek
□ 1/week
□ > 1 /w eek
■ Daily
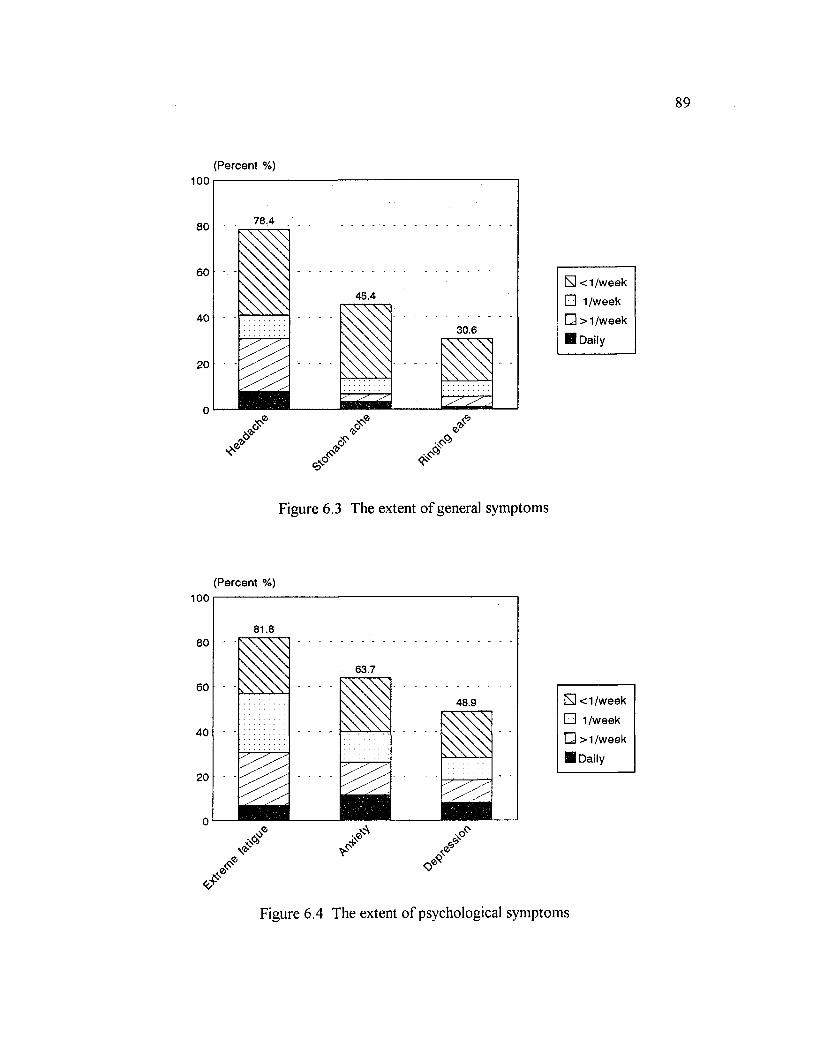
(Percent %)100
H < 1 /w eek
□ 1 /week
□ > 1 /w ee k
■ Daily
Figure 6.3 The extent o f general symptoms
(Percent %)100
S < 1/week
□ 1/week
□ > 1/week
H Daily
Figure 6.4 The extent o f psychological symptoms
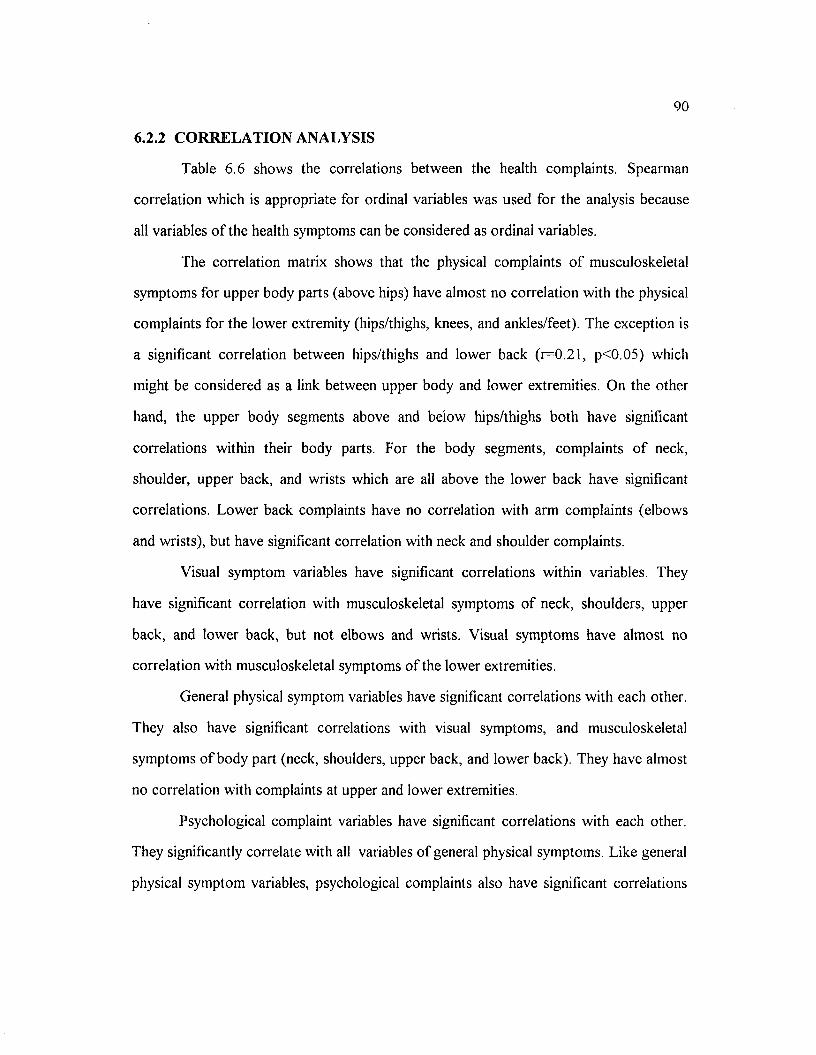
90
6.2.2 CORRELATION ANALYSIS
Table 6.6 shows the correlations between the health complaints. Spearman
correlation which is appropriate for ordinal variables was used for the analysis because
all variables o f the health symptoms can be considered as ordinal variables.
The correlation matrix shows that the physical complaints o f musculoskeletal
symptoms for upper body parts (above hips) have almost no correlation with the physical
complaints for the lower extremity (hips/thighs, knees, and ankles/feet). The exception is
a significant correlation between hips/thighs and lower back (r=0.21, p<0.05) which
might be considered as a link between upper body and lower extremities. On the other
hand, the upper body segments above and below hips/thighs both have significant
correlations within their body parts. For the body segments, complaints o f neck,
shoulder, upper back, and wrists which are all above the lower back have significant
correlations. Lower back complaints have no correlation with arm complaints (elbows
and wrists), but have significant correlation with neck and shoulder complaints.
Visual symptom variables have significant correlations within variables. They
have significant correlation with musculoskeletal symptoms o f neck, shoulders, upper
back, and lower back, but not elbows and wrists. Visual symptoms have almost no
correlation with musculoskeletal symptoms o f the lower extremities.
General physical symptom variables have significant correlations with each other.
They also have significant correlations with visual symptoms, and musculoskeletal
symptoms o f body part (neck, shoulders, upper back, and lower back). They have almost
no correlation with complaints at upper and lower extremities.
Psychological complaint variables have significant correlations with each other.
They significantly correlate with all variables o f general physical symptoms. Like general
physical symptom variables, psychological complaints also have significant correlations
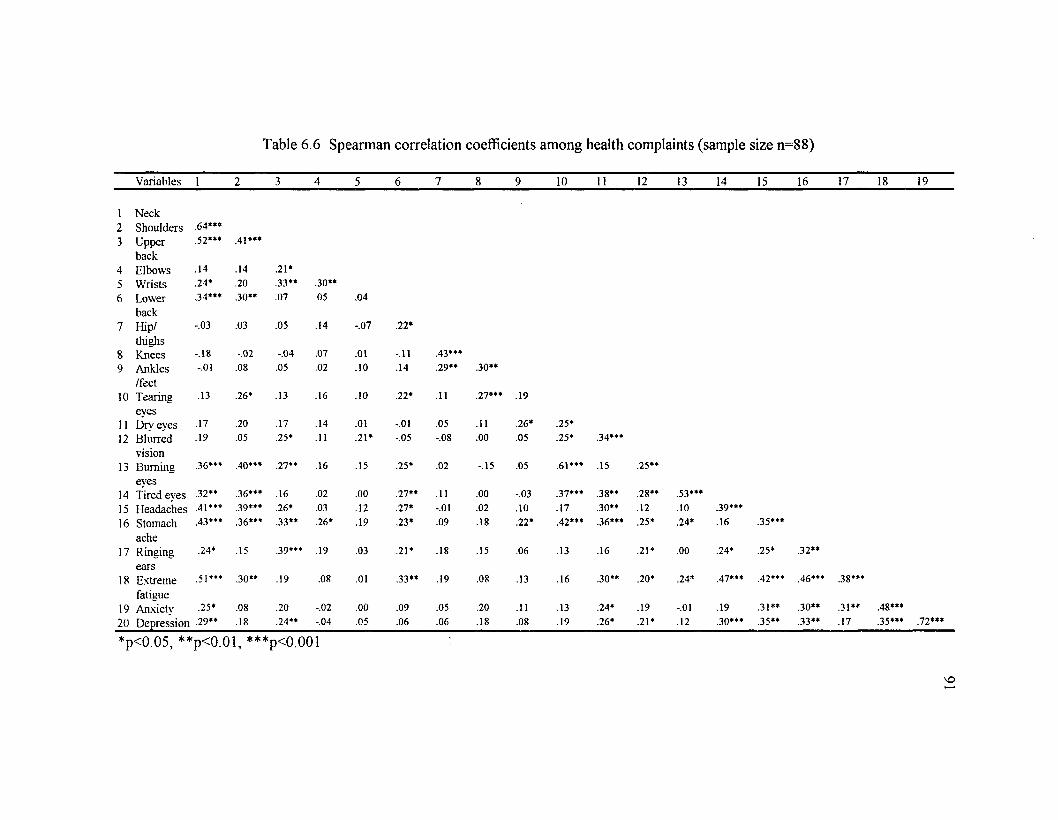
T ab le 6 .6 S p ea rm an c o rre la tio n co effic ien ts a m o n g h ea lth co m p la in ts (sam p le size n = 8 8 )
V ariables 1 2 3 4 5 6 7 8 9 10 11 12 13 14 15 16 17 18 19
1 Neck2 Shoulders .64***3 U pper
back.52*** .41***
4 Elbows .14 .14 .21*5 W rists .24* .20 .33** .30**6 Lower
back.34*** .30** .07 .05 .04
7 Hip/thighs
-.03 .03 .05 .14 -.07 .22*
8 K nees -.18 -.02 -.04 .07 .01 -.11 .43***9 A nkles
/feet-.01 .08 .05 .02 .10 .14 .29** .30**
10 Tearing .13 .26* .13 .16 .10 .22* .11 .27*** .19eyes
11 Dry eyes .17 .20 .17 .14 .01 -.01 .05 .11 .26* .25*12 Blurred
vision.19 .05 .25* .11 .21* -.05 -.08 .00 .05 .25* .34***
13 Burning .36*** .40*** .27** .16 .15 .25* .02 -.15 .05 .61*** .15 .25**eyes
14 T ired eyes .32** .36*** .16 .02 .00 .27** .11 .00 -.03 .37*** .38** .28** .53***15 H eadaches .41*** .39*** .26* .03 .12 .27* -.01 .02 .10 .17 .30** .12 .10 .39***16 Stom ach
ache.43*** .36*** .33** .26* .19 .23* .09 .18 .22* .42*** .36*** .25* .24* .16 .35***
17 Ringing .24* .15 .39*** .19 .03 .21* .18 .15 .06 .13 .16 .21* .00 .24* .25* .32**ears
18 Extrem efatigue
.51*** .30** .19 .08 .01 .33** .19 .08 .13 .16 .30** .20* .24* .47*** .42*** .46*** .38***
19 Anxiety .25* .08 .20 -.02 .00 .09 .05 .20 .11 .13 .24* .19 -.01 .19 .31** .30** .31** .48***
20 D epression .29** .18 .24** -.04 .05 .06 .06 .18 .08 .19 .26* .21* .12 .30*** .35** .33** .17 .35*** .72***
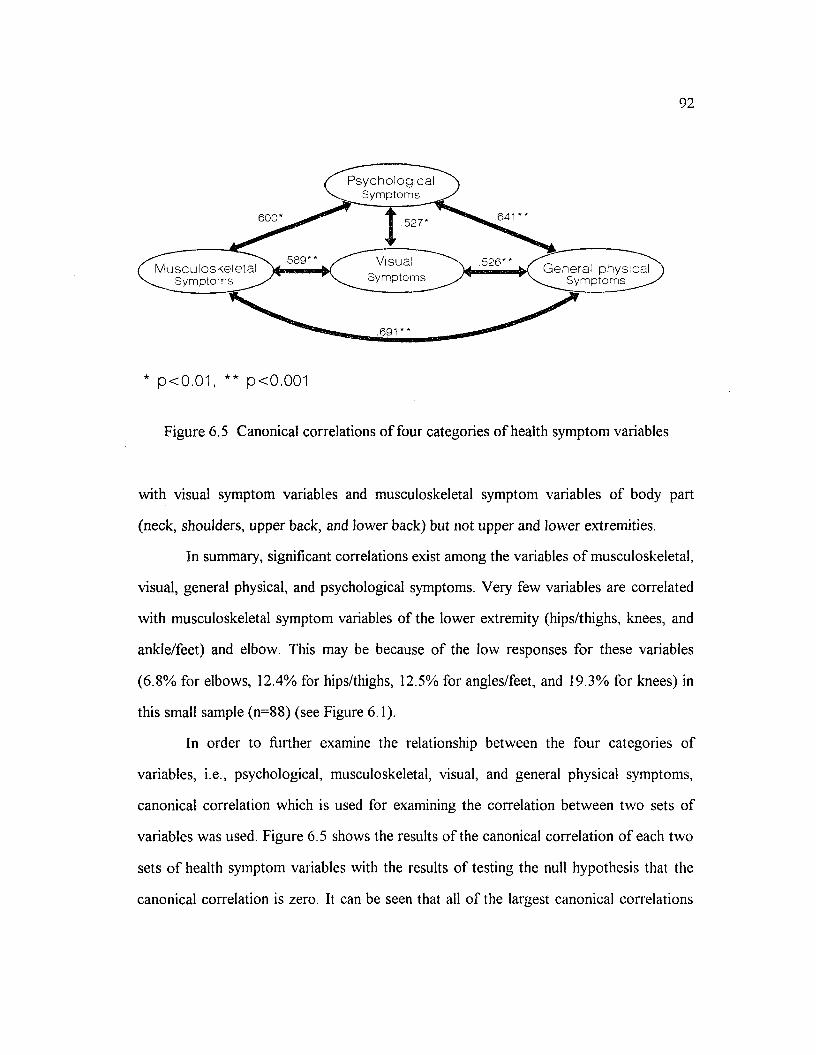
92
P s y c h o l o g i c a lSymptoms
. 6 4 1 * *. 6 0 0 *. 5 2 7 *
. 5 8 9 * * VisualSymptoms
. 5 2 6 * *M u s c u l o s k e l e t a lSymptoms
G e n e r a l p h y s ic a l Sym ptom s ^
. 6 9 1 * *
* p < 0 . 0 1 , * * p < 0 . 0 0 1
Figure 6.5 Canonical correlations o f four categories o f health symptom variables
with visual symptom variables and musculoskeletal symptom variables o f body part
(neck, shoulders, upper back, and lower back) but not upper and lower extremities.
In summary, significant correlations exist among the variables o f musculoskeletal,
visual, general physical, and psychological symptoms. Very few variables are correlated
with musculoskeletal symptom variables o f the lower extremity (hips/thighs, knees, and
ankle/feet) and elbow. This may be because o f the low responses for these variables
(6.8% for elbows, 12.4% for hips/thighs, 12.5% for angles/feet, and 19.3% for knees) in
this small sample (n=88) (see Figure 6.1).
In order to further examine the relationship between the four categories of
variables, i.e., psychological, musculoskeletal, visual, and general physical symptoms,
canonical correlation which is used for examining the correlation between two sets of
variables was used. Figure 6.5 shows the results o f the canonical correlation o f each two
sets o f health symptom variables with the results o f testing the null hypothesis that the
canonical correlation is zero. It can be seen that all o f the largest canonical correlations
93
between each two sets o f variables are significant at p=0.01 level. It can be concluded
that the four categories o f health symptom variables are significantly correlated.
6.2.3 FACTOR ANALYSIS
Factor analysis was used to investigate the underlying factors among the health
complaints. Principal component factor analysis, principal factor analysis, iterated
principal factor analysis, and maximum-likelihood factor analysis were used. Varimax,
equamax, and quartimax were used for orthogonal factor rotation in conjunction with the
factor analysis. Three-, four-, and five-factor pattern solutions were tried. A scree plot
was also used to help determine the number o f factors.
The results o f principal component factor analysis with varimax rotation were
finally used and four factors were identified based on (1) reasonableness o f the results
and (2) the proportion o f sample variance explained by the factors. Table 6.6 shows the
factor loadings o f variables and their communalities. The cumulative proportion o f total
sample variance explained by the 4 factors is 62 percent.
The first factor might be called "stress" factor. Six variables are included in this
factor: fatigue (UFE), anxiety (ANX), depression (DEP), headache (HDE), stomach
discomfort (SDE), and ringing ears (ERE). These variables are "psychological
complaints" and "general physical symptoms." This might imply that all above symptoms
(psychological and general physical symptoms) are related to stress. It is seen, that all
general physical symptoms have relatively low factor loadings when compared with that
o f psychological stress. The second factor might be called "vision" factor. Five visual
symptom variables are included in this factor: tearing/itching eyes (TIE), dry eyes
(DRE), burning eyes (BEE), tired eye (TRE), and blurred vision (BVE). The third factor
might be called "general musculoskeletal stress" factor. The variable "lower back
(LBE)" has the highest loading in this factor, and then the variables o f neck (NCE) and
shoulder (SHE). Fatigue (UFE) and headache (HDE) also have relatively high loadings
94
in this factor and should be included. So this factor includes a mix o f musculoskeletal and
fatigue symptoms. This might suggest that these symptoms are the musculoskeletal
symptoms related to general fatigue. The fourth factor might be called "upper body"
factor. It includes the variables o f body segments which are above the lower back, i.e.
neck (NCE), shoulders (SHE), wrists (WHE), and upper back (UBE).
Table 6.7 also shows the communalities for all variables. The ith communality is
the portion o f the variance o f the /'th variable contributed by the m common factors
(Johnson and Wichern, 1992). It may be seen that communalities o f most variables are
over 0.55, i.e., over 55% o f variance o f these variables can be explained by the 4 factors,
except the variables HDE (headache), SDE (stomach ache), ERE (ringing ears) and DRE
(dry eyes).
To summarize, the health complaints from VDT use mainly presents the
following pattern:
• Stress related complaints. This category includes variables o f psychological
stress, i.e., extreme fatigue, anxiety, and depression, and general physical symptoms, i.e.,
headaches, stomach ache, and ringing ears.
• Visual symptoms. Visual symptom category includes the variables o f the
symptoms o f visual and ocular discomfort, i.e., tearing/itching eyes, dried eyes, burning
eyes, tired eyes, and blurred vision.
• General musculoskeletal stress symptoms. This category includes the
musculoskeletal symptoms o f lower back, neck, shoulders, fatigue, and headache.
• Upper body musculoskeletal symptoms. This category includes the symptoms
o f wrists, shoulders, upper back, and neck which are all geographically above the lower
back o f the body.
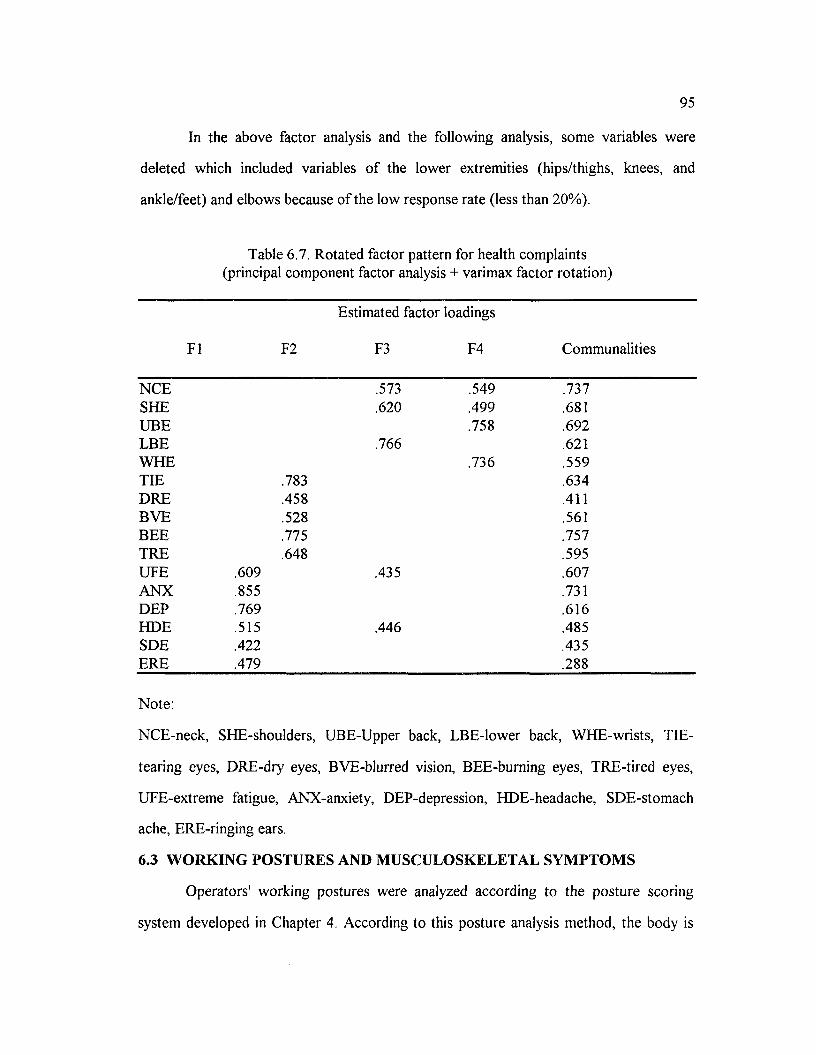
95
In the above factor analysis and the following analysis, some variables were
deleted which included variables o f the lower extremities (hips/thighs, knees, and
ankle/feet) and elbows because o f the low response rate (less than 20%).
Table 6.7. Rotated factor pattern for health complaints (principal component factor analysis + varimax factor rotation)
FI F2
Estimated factor loadings
F3 F4 Communalities
NCE .573 .549 .737SHE .620 .499 .681UBE .758 .692LBE .766 .621WHE .736 .559TIE .783 .634DRE .458 .411BVE .528 .561BEE .775 .757TRE .648 .595UFE .609 .435 .607ANX .855 .731DEP .769 .616HDE .515 .446 .485SDE .422 .435ERE .479 .288
Note:
NCE-neck, SHE-shoulders, UBE-Upper back, LBE-lower back, WHE-wrists, TIE-
tearing eyes, DRE-dry eyes, BVE-blurred vision, BEE-buming eyes, TRE-tired eyes,
UFE-extreme fatigue, ANX-anxiety, DEP-depression, HDE-headache, SDE-stomach
ache, ERE-ringing ears.
6.3 WORKING POSTURES AND MUSCULOSKELETAL SYMPTOMS
Operators' working postures were analyzed according to the posture scoring
system developed in Chapter 4. According to this posture analysis method, the body is
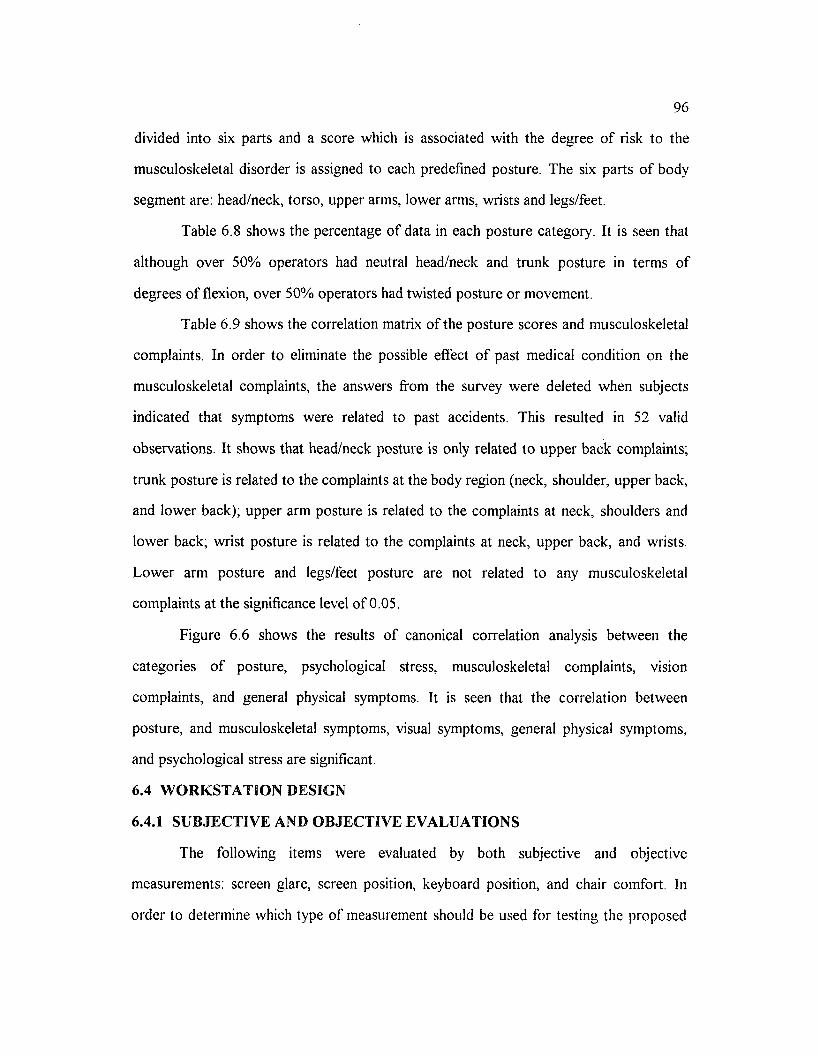
96
divided into six parts and a score which is associated with the degree o f risk to the
musculoskeletal disorder is assigned to each predefined posture. The six parts o f body
segment are: head/neck, torso, upper arms, lower arms, wrists and legs/feet.
Table 6 . 8 shows the percentage o f data in each posture category. It is seen that
although over 50% operators had neutral head/neck and trunk posture in terms of
degrees o f flexion, over 50% operators had twisted posture or movement.
Table 6.9 shows the correlation matrix o f the posture scores and musculoskeletal
complaints. In order to eliminate the possible effect o f past medical condition on the
musculoskeletal complaints, the answers from the survey were deleted when subjects
indicated that symptoms were related to past accidents. This resulted in 52 valid
observations. It shows that head/neck posture is only related to upper back complaints;
trunk posture is related to the complaints at the body region (neck, shoulder, upper back,
and lower back), upper arm posture is related to the complaints at neck, shoulders and
lower back; wrist posture is related to the complaints at neck, upper back, and wrists.
Lower arm posture and legs/feet posture are not related to any musculoskeletal
complaints at the significance level o f 0.05.
Figure 6 . 6 shows the results o f canonical correlation analysis between the
categories o f posture, psychological stress, musculoskeletal complaints, vision
complaints, and general physical symptoms. It is seen that the correlation between
posture, and musculoskeletal symptoms, visual symptoms, general physical symptoms,
and psychological stress are significant.
6.4 WORKSTATION DESIGN
6.4.1 SUBJECTIVE AND OBJECTIVE EVALUATIONS
The following items were evaluated by both subjective and objective
measurements: screen glare, screen position, keyboard position, and chair comfort. In
order to determine which type o f measurement should be used for testing the proposed
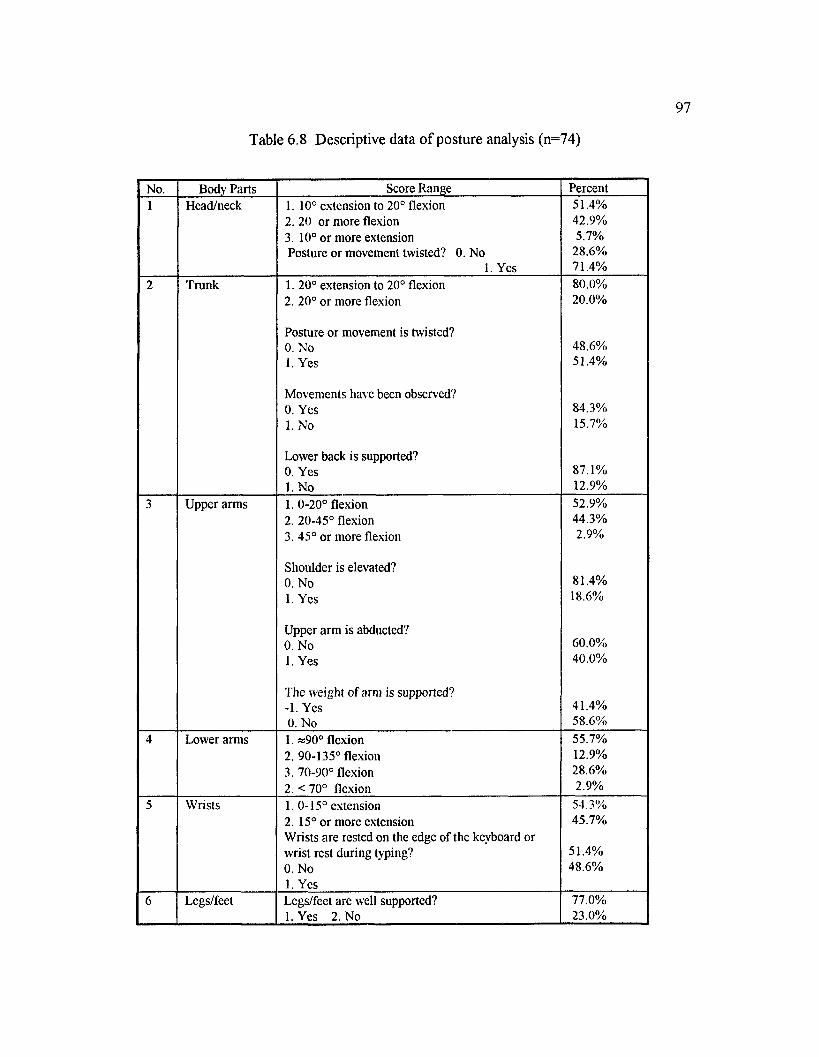
Table 6 . 8 Descriptive data o f posture analysis (n=74)
No. Body Parts Score Range Percent1 Head/neck 1 . 1 0 ° extension to 2 0 ° flexion
2 . 2 0 or more flexion3. 10° or more extensionPosture or movement twisted? 0. No
1. Yes
51.4%42.9%5.7%
28.6%71.4%
2 Trunk 1 . 2 0 ° extension to 2 0 ° flexion2 . 2 0 ° or more flexion
Posture or movement is twisted?0. No1. Yes
Movements have been observed?0. Yes1. No
Lower back is supported?0. Yes1. No
80.0%2 0 .0 %
48.6%51.4%
84.3%15.7%
87.1%12.9%
3 Upper arms 1 . 0 -2 0 ° flexion2. 20-45° flexion3. 45° or more flexion
Shoulder is elevated?0. No1. Yes
Upper arm is abducted?0. No1. Yes
The weight of arm is supported? -1. Yes 0. No
52.9%44.3%2.9%
81.4%18.6%
60.0%40.0%
41.4%58.6%
4 Lower arms 1. »90° flexion2. 90-135° flexion3. 70-90° flexion 2. < 70° flexion
55.7%12.9%28.6%2.9%
5 Wrists 1 . 0-15° extension2 . 15° or more extensionWrists are rested on the edge of the keyboard or wrist rest during typing?0 . No1. Yes
54.3%45.7%
51.4%48.6%
6 Legs/feet Legs/feet are well supported? 1. Yes 2. No
77.0%23.0%
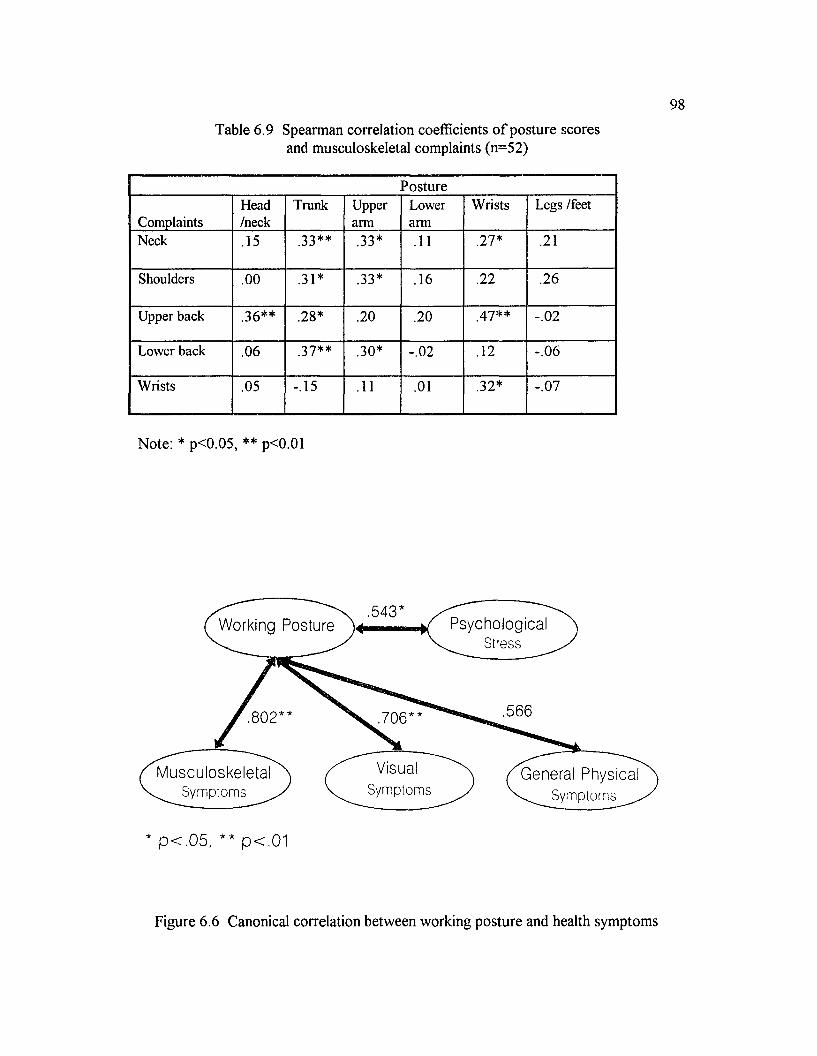
98
T ab le 6 .9 S p earm an c o rre la tio n co effic ien ts o f p o s tu re sco re sand m u scu lo sk e le ta l co m p la in ts (n = 5 2 )
5osture
ComplaintsHead/neck
Trunk Upperarm
Lowerarm
Wrists Legs /feet
Neck .15 .33** .33* . 1 1 .27* . 2 1
Shoulders . 0 0 .31* .33* .16 . 2 2 .26
Upper back .36** .28* . 2 0 . 2 0 4 7 ** - . 0 2
Lower back .06 .37** .30* - . 0 2 . 1 2 -.06
Wrists .05 -.15 . 1 1 . 0 1 .32* -.07
Note: * p<0.05, ** p<0.01
.543Psychological
StressWorking Posture )«
.566.802 .706
VisualSymptoms
MusculoskeletalSymptoms
General Physicalv. Symptoms
* p < . 0 5 , ** p < . 0 1
Figure 6 . 6 Canonical correlation between working posture and health symptoms
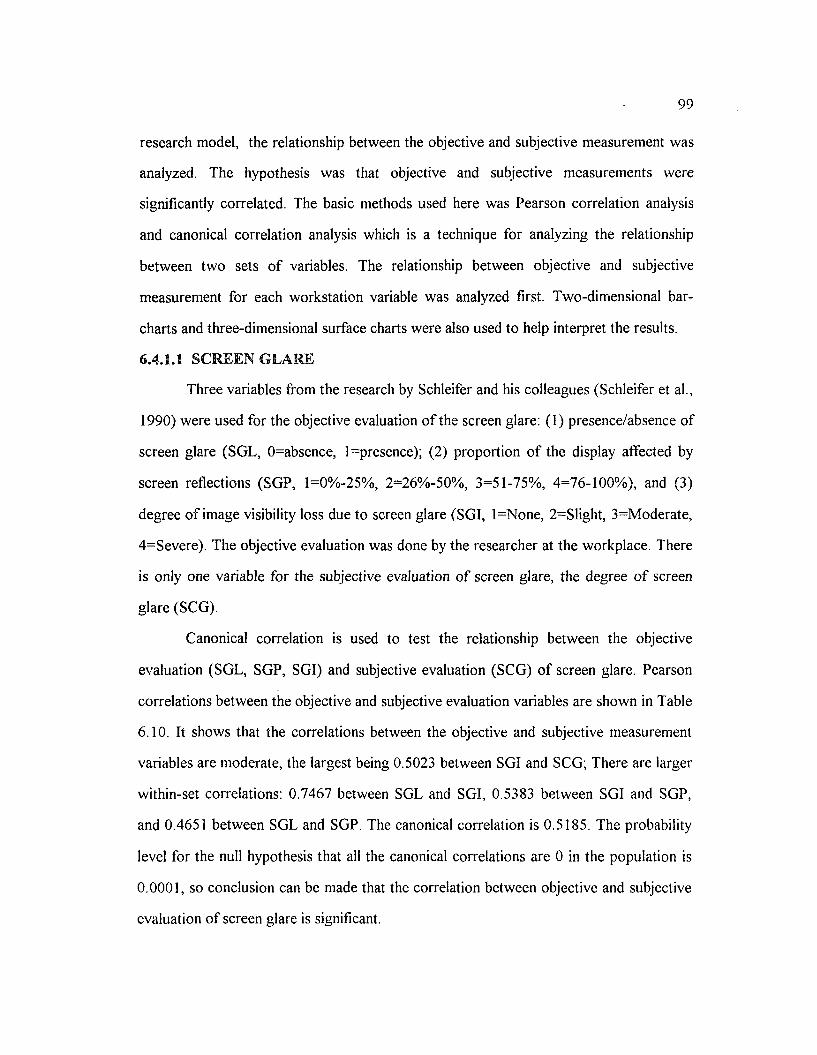
99
research model, the relationship between the objective and subjective measurement was
analyzed. The hypothesis was that objective and subjective measurements were
significantly correlated. The basic methods used here was Pearson correlation analysis
and canonical correlation analysis which is a technique for analyzing the relationship
between two sets o f variables. The relationship between objective and subjective
measurement for each workstation variable was analyzed first. Two-dimensional bar-
charts and three-dimensional surface charts were also used to help interpret the results.
6.4.1.1 SCREEN GLARE
Three variables from the research by Schleifer and his colleagues (Schleifer et al.,
1990) were used for the objective evaluation o f the screen glare: (1) presence/absence o f
screen glare (SGL, 0=absence, 1 ̂ presence); (2) proportion o f the display affected by
screen reflections (SGP, l=0%-25%, 2=26%-50%, 3=51-75%, 4=76-100%), and (3)
degree o f image visibility loss due to screen glare (SGI, l=None, 2=Slight, 3=Moderate,
4=Severe). The objective evaluation was done by the researcher at the workplace. There
is only one variable for the subjective evaluation o f screen glare, the degree o f screen
glare (SCG).
Canonical correlation is used to test the relationship between the objective
evaluation (SGL, SGP, SGI) and subjective evaluation (SCG) o f screen glare. Pearson
correlations between the objective and subjective evaluation variables are shown in Table
6.10. It shows that the correlations between the objective and subjective measurement
variables are moderate, the largest being 0.5023 between SGI and SCG; There are larger
within-set correlations: 0.7467 between SGL and SGI, 0.5383 between SGI and SGP,
and 0.4651 between SGL and SGP. The canonical correlation is 0.5185. The probability
level for the null hypothesis that all the canonical correlations are 0 in the population is
0 .0 0 0 1 , so conclusion can be made that the correlation between objective and subjective
evaluation o f screen glare is significant.
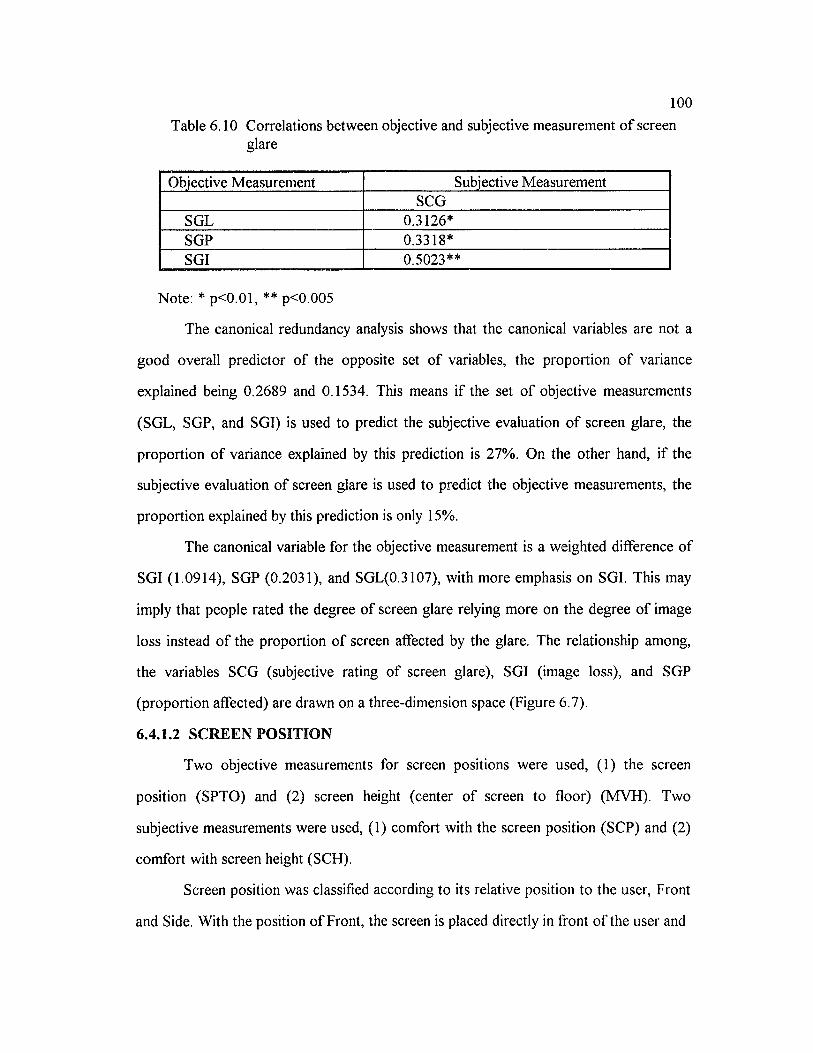
100
Table 6 .10 Correlations between objective and subjective measurement o f screen glare
Objective Measurement Subjective MeasurementSCG
SGL 0.3126*SGP 0.3318*SGI 0.5023**
Note: * p<0.01, ** p<0.005
The canonical redundancy analysis shows that the canonical variables are not a
good overall predictor o f the opposite set o f variables, the proportion o f variance
explained being 0.2689 and 0.1534. This means if the set o f objective measurements
(SGL, SGP, and SGI) is used to predict the subjective evaluation o f screen glare, the
proportion o f variance explained by this prediction is 27%. On the other hand, if the
subjective evaluation o f screen glare is used to predict the objective measurements, the
proportion explained by this prediction is only 15%.
The canonical variable for the objective measurement is a weighted difference o f
SGI (1.0914), SGP (0.2031), and SGL(0.3107), with more emphasis on SGI. This may
imply that people rated the degree o f screen glare relying more on the degree o f image
loss instead o f the proportion o f screen affected by the glare. The relationship among,
the variables SCG (subjective rating o f screen glare), SGI (image loss), and SGP
(proportion affected) are drawn on a three-dimension space (Figure 6.7).
6.4.1.2 SCREEN POSITION
Two objective measurements for screen positions were used, (1) the screen
position (SPTO) and (2) screen height (center o f screen to floor) (MVH). Two
subjective measurements were used, (1) comfort with the screen position (SCP) and (2)
comfort with screen height (SCH).
Screen position was classified according to its relative position to the user, Front
and Side. With the position o f Front, the screen is placed directly in front o f the user and
Sc
r e
g n
Clo
ne
Co
t t n
g
101
S c r e e n G l a r e Re t i n g
<S
&
CD
Figure 6.7 Objective and subjective evaluation o f screen glare
102
the keyboard, and user can view the screen without twisting when working with the
keyboard. With the Side position, the operator has to twist the neck or body to view the
screen while working with the keyboard. It was assumed that the operator should feel
more comfortable with Front position compared with the Side position.
Literature indicates that the top o f screen should be the same as the eye height
(ANSI/HFS 100-1988). Eye height was measured and the difference between the
distance from the top o f screen to floor and eye height was calculated (DIFF V E).
Figure 6 . 8 shows the subjective evaluation o f the screen position for the two
types o f screen position. It shows that the percentage o f operators who rated the screen
position "comfortable" decreases from 72.5% with Front screen position to 58.6% with
the Side position; the percentage o f operators who rated the screen position 'slightly
uncomfortable' increased from 17.6% to 31%, however, the percentage o f operators
who rated the screen position "moderate uncomfortable" decreases from 9.8% with
Front position to 3% with Side position. However, analysis o f variance (ANOVA) and
correlation analysis indicates that there is no significant difference between the subjective
ratings in terms o f the objectively defined screen position.
Correlation analysis was also applied to the difference between the screen height
(from the top o f screen to floor) and the eye height. However, no significant correlation
was found.
6.4.1.3 KEYBOARD PO SITIO N
Two objective measurements were used for evaluating the keyboard position: (1)
keyboard position (KBPO), and (2) relative keyboard height, which was the difference
between keyboard height and elbow (DIFF_K_L). Two subjective measurements were
used: (1) comfort with keyboard position (KBPS), and (2) comfort with keyboard height
(KBHS).
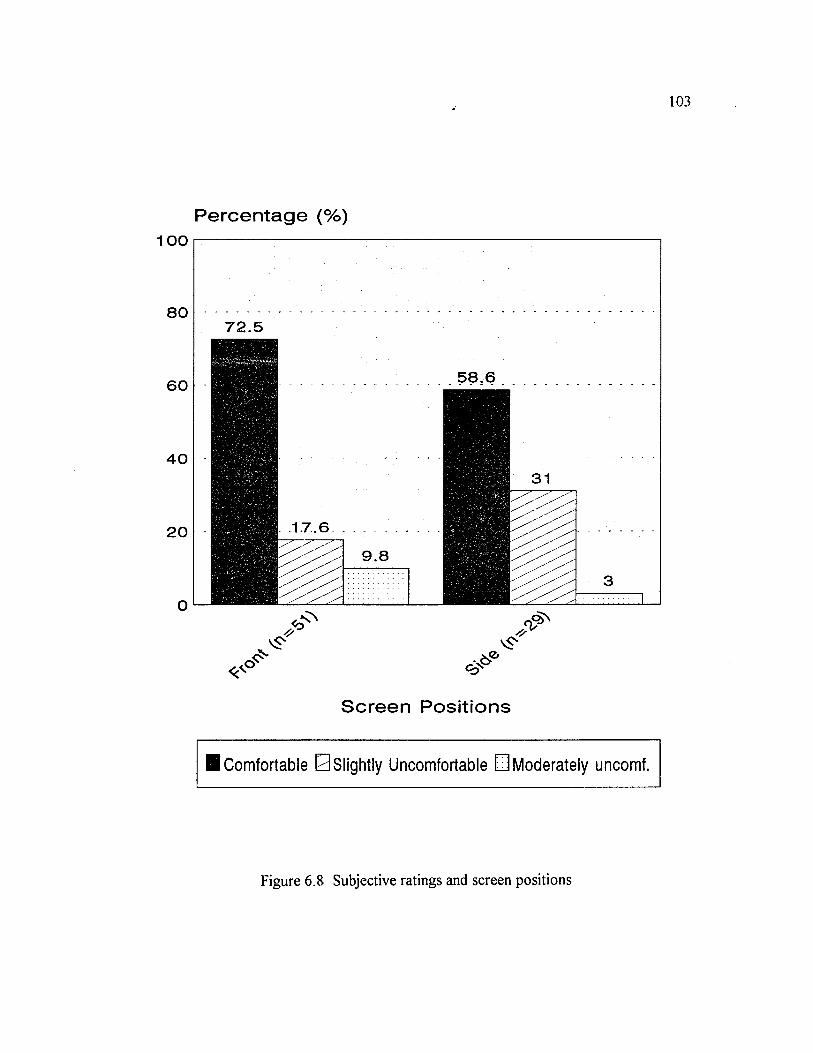
103
Percentage (%)100
72.5
58.6
17.6
40
Screen Positions
I Comfortable E Slightly Uncomfortable E3 Moderately uncomf.
F ig u re 6 .8 S ub jec tiv e ra tin g s and sc reen p o s itio n s
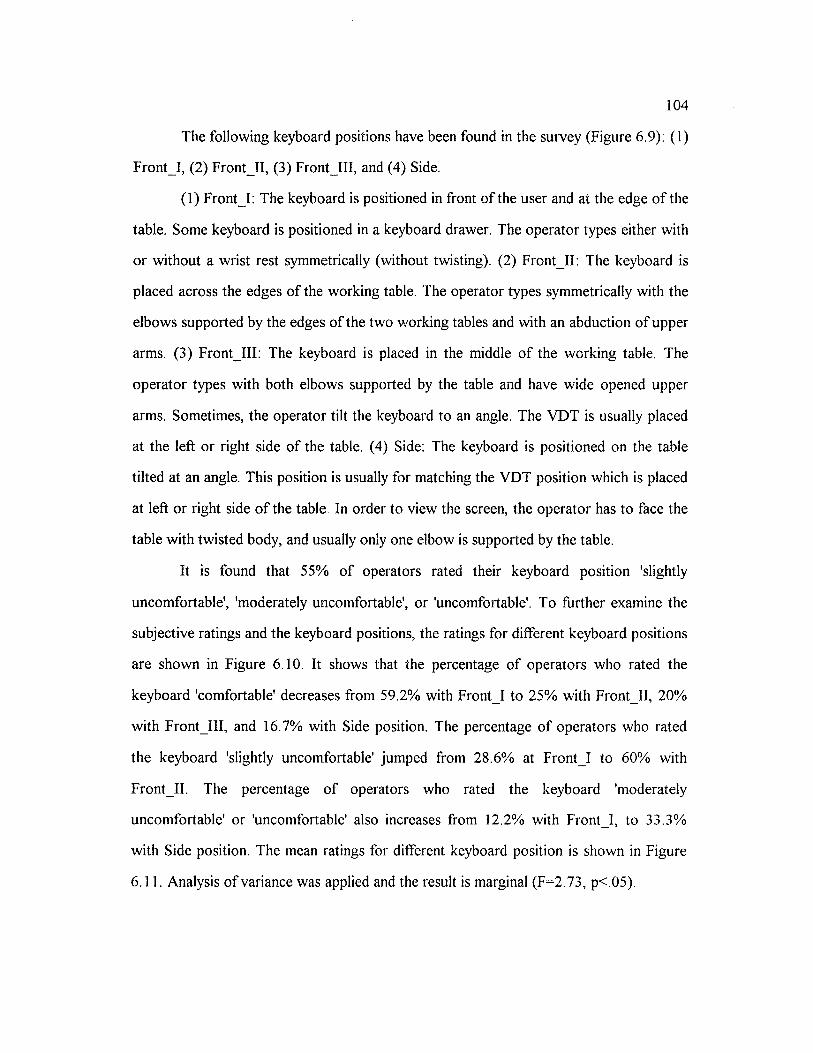
104
The following keyboard positions have been found in the survey (Figure 6.9): (1)
F ro n tI , (2) F ro n tl l , (3) F ro n tll l , and (4) Side.
(1) Front I: The keyboard is positioned in front o f the user and at the edge o f the
table. Some keyboard is positioned in a keyboard drawer. The operator types either with
or without a wrist rest symmetrically (without twisting). (2) Front_II: The keyboard is
placed across the edges o f the working table. The operator types symmetrically with the
elbows supported by the edges o f the two working tables and with an abduction o f upper
arms. (3) Front lll: The keyboard is placed in the middle o f the working table. The
operator types with both elbows supported by the table and have wide opened upper
arms. Sometimes, the operator tilt the keyboard to an angle. The VDT is usually placed
at the left or right side o f the table. (4) Side: The keyboard is positioned on the table
tilted at an angle. This position is usually for matching the VDT position which is placed
at left or right side o f the table In order to view the screen, the operator has to face the
table with twisted body, and usually only one elbow is supported by the table.
It is found that 55% of operators rated their keyboard position 'slightly
uncomfortable', 'moderately uncomfortable', or 'uncomfortable'. To further examine the
subjective ratings and the keyboard positions, the ratings for different keyboard positions
are shown in Figure 6.10. It shows that the percentage o f operators who rated the
keyboard 'comfortable' decreases from 59.2% with Front_I to 25% with Front ll, 20%
with Front lll, and 16.7% with Side position. The percentage o f operators who rated
the keyboard 'slightly uncomfortable' jumped from 28.6% at Front I to 60% with
Front_II. The percentage o f operators who rated the keyboard 'moderately
uncomfortable' or 'uncomfortable' also increases from 12.2% with Front I, to 33.3%
with Side position. The mean ratings for different keyboard position is shown in Figure
6.11. Analysis o f variance was applied and the result is marginal (F=2.73, p< 05).
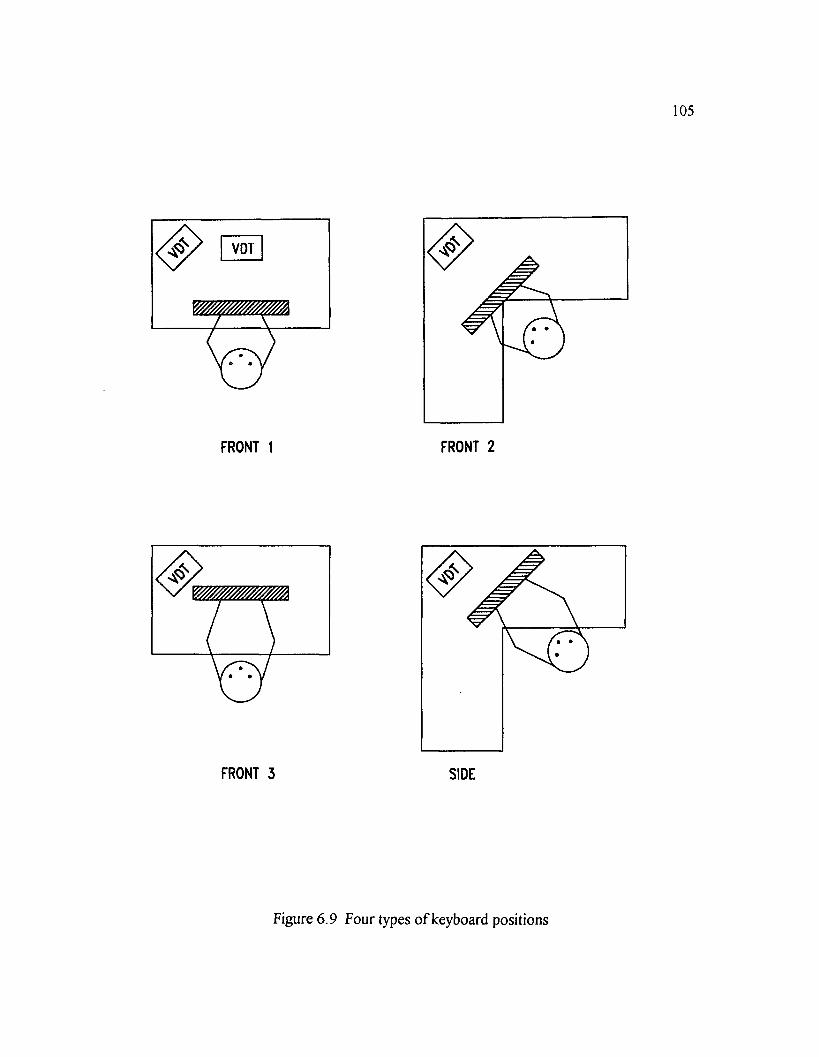
105
VDT
FRONT 1 FRONT 2
FRONT 3 SIDE
F ig u re 6 .9 F o u r typ es o f k ey b o ard p o s itio n s
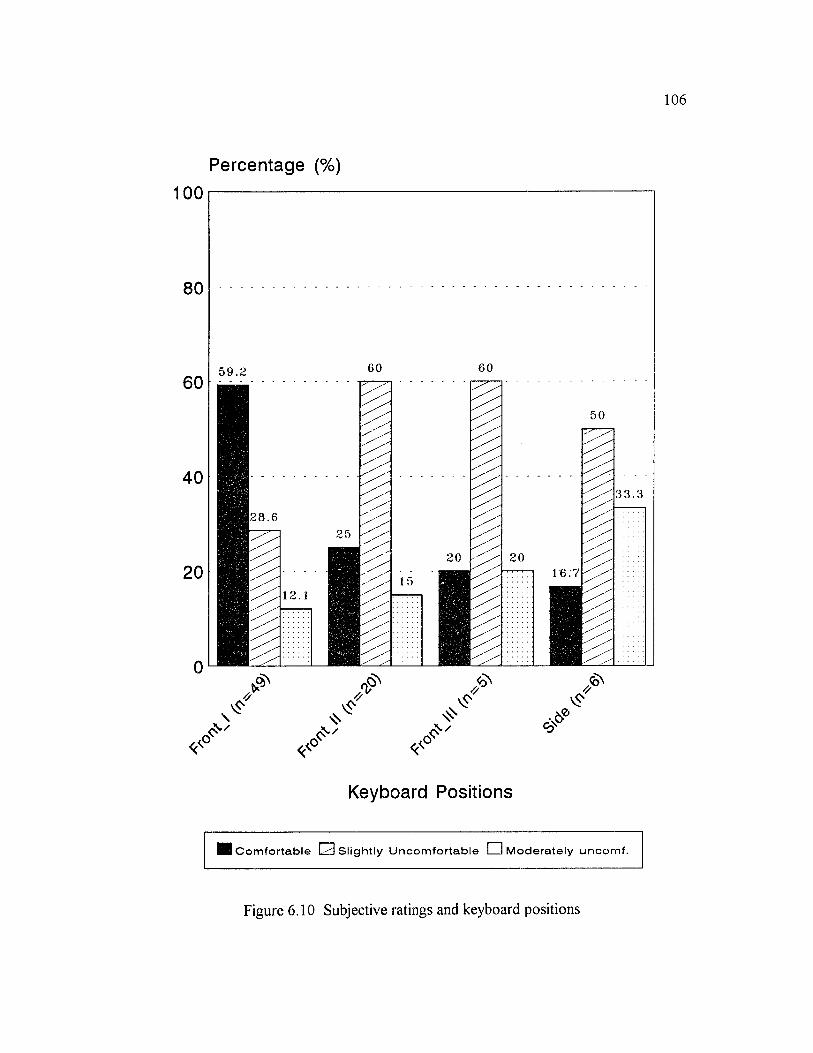
106
Percentage (%
1 0 0
80
Keyboard Positions
H C o m f o r t a b l e C3 Slight ly U n c o m f o r t a b l e HU M o d e ra te l y u n co m f .
F ig u re 6 .1 0 S ub jec tiv e ra tin g s and k ey b o ard p o sitio n s

107
Subjective ratings
•ever <V“O'
'/
<£O' &
£//&
&
Keyboard Positions
F ig u re 6.11 M ean ra tin g s fo r d ifferen t k ey b o a rd p o sitio n s
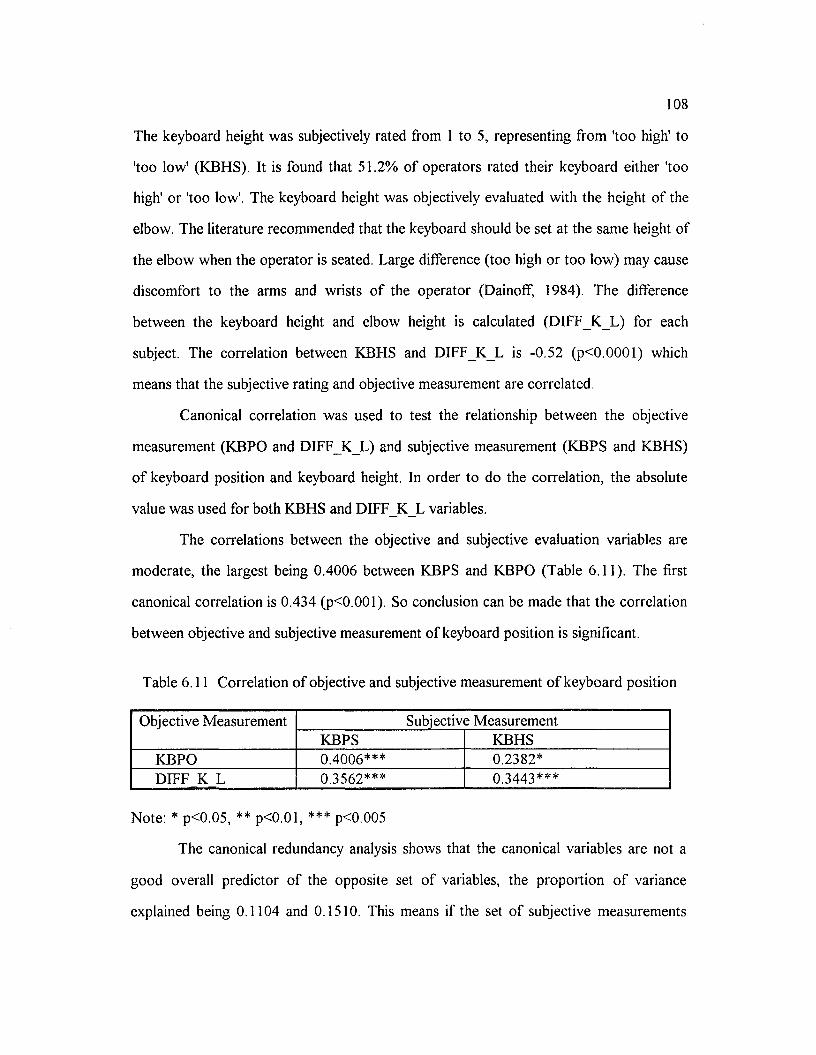
108
The keyboard height was subjectively rated from 1 to 5, representing from 'too high' to
'too low' (KBHS). It is found that 51.2% o f operators rated their keyboard either 'too
high' or 'too low'. The keyboard height was objectively evaluated with the height o f the
elbow. The literature recommended that the keyboard should be set at the same height of
the elbow when the operator is seated. Large difference (too high or too low) may cause
discomfort to the arms and wrists o f the operator (Dainoff, 1984). The difference
between the keyboard height and elbow height is calculated ( D I F F K L ) for each
subject. The correlation between KBHS and D I F F K L is -0.52 (p<0.0001) which
means that the subjective rating and objective measurement are correlated.
Canonical correlation was used to test the relationship between the objective
measurement (KBPO and DIFF K L) and subjective measurement (KBPS and KBHS)
o f keyboard position and keyboard height. In order to do the correlation, the absolute
value was used for both KBHS and DIFF K L variables.
The correlations between the objective and subjective evaluation variables are
moderate, the largest being 0.4006 between KBPS and KBPO (Table 6 . 1 1 ). The first
canonical correlation is 0.434 (p<0.001). So conclusion can be made that the correlation
between objective and subjective measurement o f keyboard position is significant.
Table 6 .11 Correlation o f objective and subjective measurement o f keyboard position
Objective Measurement Subjective MeasurementKBPS KBHS
KBPO 0.4006*** 0.2382*DIFF K L 0.3562*** 0.3443***
Note: * p<0.05, ** p<0.01, *** p<0.005
The canonical redundancy analysis shows that the canonical variables are not a
good overall predictor o f the opposite set o f variables, the proportion o f variance
explained being 0.1104 and 0.1510. This means if the set o f subjective measurements
109
(KBPS and KBHS) is used to predict the objective evaluation o f the keyboard position,
the proportion o f variance explained by this prediction is only 11%. On the other hand, if
the objective evaluation o f keyboard position (KBPO and D I F F K L ) is used to predict
the subjective measurement, the proportion o f the variance explained by this prediction is
only 15%.
The subjective ratings for the comfort o f the keyboard position is related to the
height o f the keyboard (Table 6.11). This might be because several operators rated the
keyboard position uncomfortable not only for the inappropriate position but also for the
height.
6.4.1.4 CHAIR COMFORT
Chairs used by operators in the survey were all height adjustable with fixed back.
The angles between the seat back and seat pan fell into the range o f 90 to 105 degree
which is specified in ANSI/HFS 100-1988 (ANSI/HFS, 1988).
Two objective measurements were used to evaluate the chair: (1) the difference
between the chair height and popliteal height ( D I F F S P ) , and (2) presence/absence o f
arm rests. Three subjective measurements are used: (1) perceived chair height (CHTS),
(2) perceived comfort with the back rest (CBR), and (3) perceived comfort with the seat
pan (CSP).
According to ANSI/HFS 100-1988, seat height is a function o f popliteal heights
o f the 5th percentile female to the 95th percentile male, shoe heel height, angle o f the
lower leg as supported by the seating system, and the height and type o f foot support
provided by the workstation system. In this survey, no foot rest was used by the subjects.
The popliteal height o f subjects were measured with shoes on. It was assumed that the
difference of shoe heel heights due to changing shoes were negligible. The difference
between seat height and popliteal height was calculated (DIFF S P). The hypothesis
110
was that a large difference between the seat height and popliteal height could affect the
subjectively rated seat height.
Arm rests are recommended by the literature to provide stability for the seated
posture (Chaffin, 1991). The presence/ absence o f arm rests is used to evaluate the chair.
The hypothesis was that operators feel more comfortable with chairs that have arm rests.
Figure 6.12 shows the relationship between DIFF S P and subjectively rated
seat height. It was expected that when DIFF S P is within a certain range around zero,
the perceived chair height should be 3 (just right); when beyond the range (greater or
less), the perceived chair height should be correspondingly rated greater than 3 ("a little
too high" to "too high"), or less than 3 ("a little too low" to " too low'). However, Figure
6 .11 shows that when DIFF S P is less than zero (seat height is less than popliteal
height), the subjective rating is from 3 to 4 (from "just right" to "a little lower"); when
DIFF S P is greater than zero (seat height is greater that popliteal height), the perceived
height is from 3 to I (from "just right" to "too high"). There are two outliers at the right
side o f the figure.
Pearson correlation shows that the correlation between the subjective rating o f
chair height (CHT) and the difference between the chair height and popliteal height
(DIFF_S_P) is significant (r=0.3659, p<0.001). The relative low correlation indicates
that other factors may affect subjective judgment o f chair height, for example, personal
preference and matching with working surface height, etc..
It is also found that the correlation between ARM and CBR is significant
(r = -0.225, p<0.05). This result may imply that the presence o f arm rests influences the
perceived comfort o f chair back rests, i.e., subjects rated the back rest more comfortable
for chairs with arm rests.
Canonical correlation was used to examine the relationship between the objective
measurements (D1FF P S, and ARM) and subjective measurement (CHTS, CBR, and
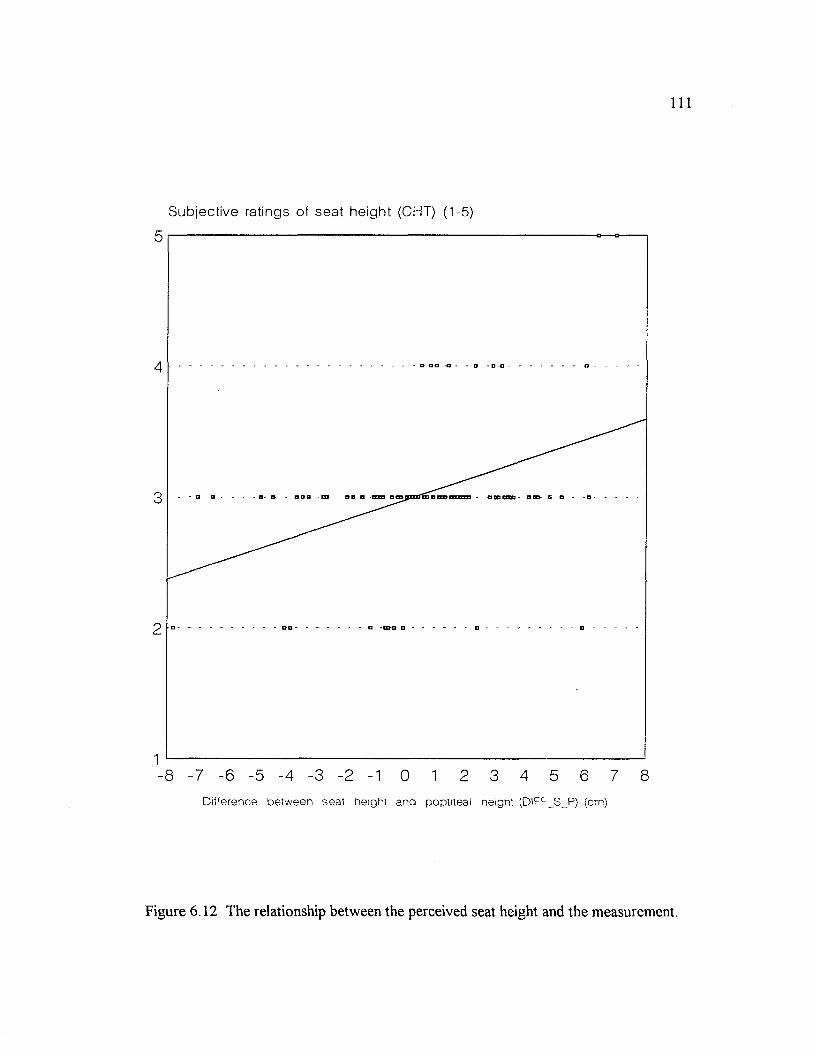
I l l
S u b j e c t i v e rat ings of s e a t he ig h t (CHT) (1-5)
5
4
3
2
17 3 1 1
Difference betw een se a t height and poptiteal height (DIFF_S_P) (cm)
Figure 6.12 The relationship between the perceived seat height and the measurement.
112
CSP) o f chair. The absolute values were used for the variables o f DIFF P S and CHTS
for the correlation analysis with other variables. The canonical correlation is 0.3238
(p=0.1678). So no conclusion can be made about the correlation between objective and
subjective measurement o f chairs for these two sets o f variables.
6.5 WORK ENVIRONMENT
6.5.1 LIGHTING CONDITIONS
The following measurements were made at workstations to evaluate lighting
conditions (Schleifer et al., 1990): (1) illuminance at the display (D ISPLA Y ILLU M ),
keyboard (KEYBOARD ILLUM), and document (DOCUMENT ILLUM) (lx); (2)
luminance o f display (D ISPLA YLUM ), keyboard (KEYBOARDLUM ), and document
(DOCUMENT LUM) (candelas/m2); and (3) visual foreground luminance: luminance at
30° left o f display (LEFT LU M ), 30° right o f display (R IG H T LU M ), and directly
behind VDT (BACK_LUM) (candelas/m2).
Two subjective measurement variables were used: (1) perceived illuminance level
(ILLUMJLEVEL, from 1 to 5, representing from " too dim" to "too bright"); and (2)
perceived comfort with the illumination in work area (ILLUM_COMFORT, from 1 to
4, representing from "comfortable" to "uncomfortable").
6.5.1.1 ILLUMINATION LEVEL AT WORKSTATION
Table 6.12 shows the means o f the illuminance measured at display, keyboard,
document areas and the overall mean. It shows that the illuminance at screen is lower
than that at keyboard and document. This is because screens are nearly vertical to the
luminaire while keyboards and most documents are parallel to the luminaire.
ANSI/HFES 100-1988 recommends that "in workplaces with visual display
terminals, an illuminance in the range o f 200 lux to 500 lux, measured on the work area
o f the work surface, is normally sufficient". The overall mean o f the illuminance at
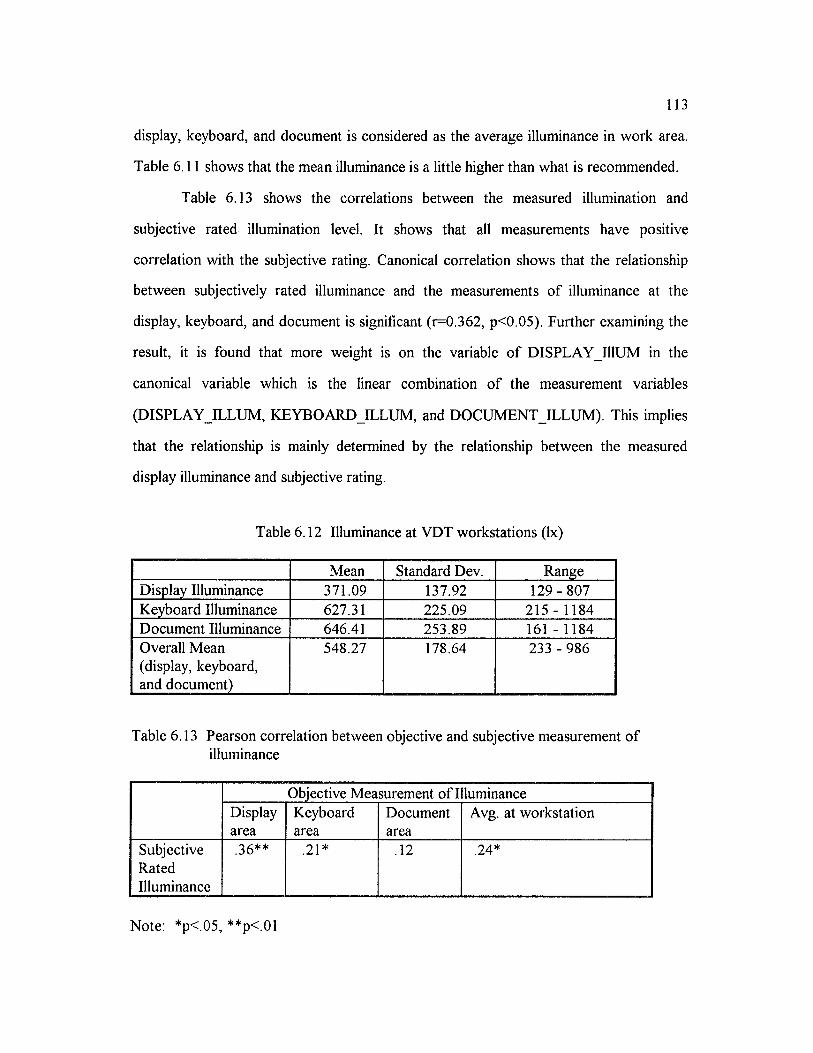
113
display, keyboard, and document is considered as the average illuminance in work area.
Table 6 .11 shows that the mean illuminance is a little higher than what is recommended.
Table 6.13 shows the correlations between the measured illumination and
subjective rated illumination level. It shows that all measurements have positive
correlation with the subjective rating. Canonical correlation shows that the relationship
between subjectively rated illuminance and the measurements o f illuminance at the
display, keyboard, and document is significant (r=0.362, p<0.05). Further examining the
result, it is found that more weight is on the variable o f DISPLAY_I11UM in the
canonical variable which is the linear combination o f the measurement variables
(DISPLAY ILLUM, KEYBOARD ELLUM, and DOCUMENT ILLUM ). This implies
that the relationship is mainly determined by the relationship between the measured
display illuminance and subjective rating.
Table 6 .12 Illuminance at VDT workstations (lx)
Mean Standard Dev. RangeDisplay Illuminance 371.09 137.92 129 - 807Keyboard Illuminance 627.31 225.09 215 - 1184Document Illuminance 646.41 253.89 161 - 1184Overall Mean (display, keyboard, and document)
548.27 178.64 233 - 986
Table 6.13 Pearson correlation between objective and subjective measurement o f illuminance
Objective Measurement o f I luminanceDisplayarea
Keyboardarea
Documentarea
Avg. at workstation
SubjectiveRatedIlluminance
.36** .2 1 * . 1 2 .24*
Note: *p< 05, **p< 01
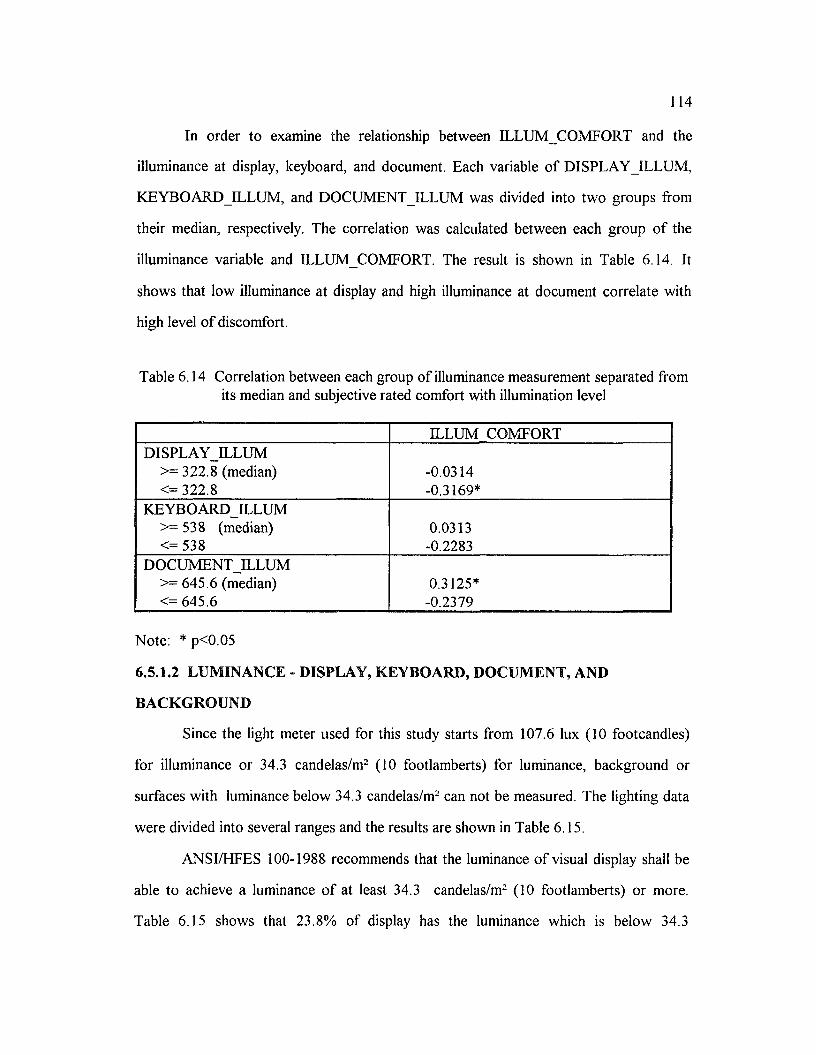
114
In order to examine the relationship between ILLU M CO M FO RT and the
illuminance at display, keyboard, and document. Each variable o f D ISPLA Y ILLU M ,
KEYBOARD ELLUM, and DOCUMENT ILLUM was divided into two groups from
their median, respectively. The correlation was calculated between each group o f the
illuminance variable and ILLUM COM FORT. The result is shown in Table 6.14. It
shows that low illuminance at display and high illuminance at document correlate with
high level o f discomfort.
Table 6.14 Correlation between each group o f illuminance measurement separated from its median and subjective rated comfort with illumination level
ILLUM COMFORTD ISPLA Y ILLU M
>=322.8 (median) -0.0314<= 322.8 -0.3169*
KEYBOARD ILLUM>= 538 (median) 0.0313<=538 -0.2283
DOCUMENT ILLUM>=645.6 (median) 0.3125*<= 645.6 -0.2379
Note: * p<0.05
6.5.1.2 LUMINANCE - DISPLAY, KEYBOARD, DOCUMENT, AND
BACKGROUND
Since the light meter used for this study starts from 107.6 lux (10 footcandles)
for illuminance or 34.3 candelas/m2 (10 footlamberts) for luminance, background or
surfaces with luminance below 34.3 candelas/m2 can not be measured. The lighting data
were divided into several ranges and the results are shown in Table 6.15.
ANSI/HFES 100-1988 recommends that the luminance o f visual display shall be
able to achieve a luminance o f at least 34.3 candelas/m2 (10 footlamberts) or more.
Table 6.15 shows that 23.8% of display has the luminance which is below 34.3
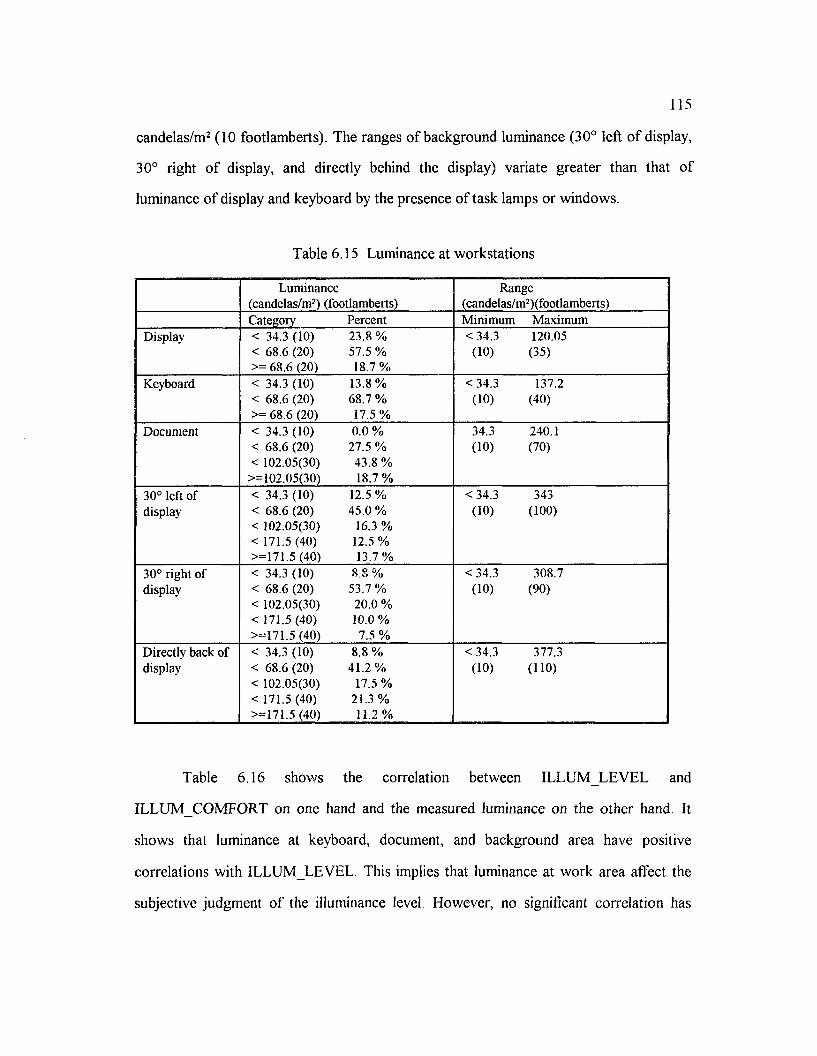
candelas/m2 (10 footlamberts). The ranges o f background luminance (30° left o f display,
30° right o f display, and directly behind the display) variate greater than that of
luminance o f display and keyboard by the presence o f task lamps or windows.
Table 6.15 Luminance at workstations
Luminance (candelas/m2) (footlamberts)
Range(candelas/m2)(footlamberts)
Category Percent Minimum MaximumDisplay < 34.3 (10) 23.8 % <34.3 120.05
< 6 8 . 6 (2 0 ) 57.5 % ( 1 0 ) (35)>= 6 8 . 6 (2 0 ) 18.7 %
Keyboard < 34.3 (10) 13.8 % <34.3 137.2< 6 8 . 6 (2 0 ) 68.7 % ( 1 0 ) (40)>= 6 8 . 6 (2 0 ) 17.5 %
Document < 34.3 (10) 0 . 0 % 34.3 240.1< 6 8 . 6 (2 0 ) 27.5 % ( 1 0 ) (70)< 102.05(30) 43.8 %
>=102.05(30) 18.7 %30° left of < 34.3 (10) 12.5 % <34.3 343display < 6 8 . 6 (2 0 ) 45.0 % ( 1 0 ) ( 1 0 0 )
< 102.05(30) 16.3 %< 171.5 (40) 12.5 %>=171.5 (40) 13.7%
30° right of < 34.3(10) 8 . 8 % <34.3 308.7display < 6 8 . 6 (2 0 ) 53.7 % ( 1 0 ) (90)
< 102.05(30) 2 0 . 0 %< 171.5(40) 1 0 . 0 %>=171.5 (40) 7.5 %
Directly back of < 34.3 (10) 8 . 8 % <34.3 377.3display < 6 8 . 6 (2 0 ) 41.2% ( 1 0 ) (1 1 0 )
< 102.05(30) 17.5 %< 171.5 (40) 21.3 %>=171.5 (40) 1 1 . 2 %
Table 6.16 shows the correlation between ILLUM LEVEL
ILLUM COMFORT on one hand and the measured luminance on the other hand. It
shows that luminance at keyboard, document, and background area have positive
correlations with ILLU M LEV EL. This implies that luminance at work area affect the
subjective judgment o f the illuminance level. However, no significant correlation has
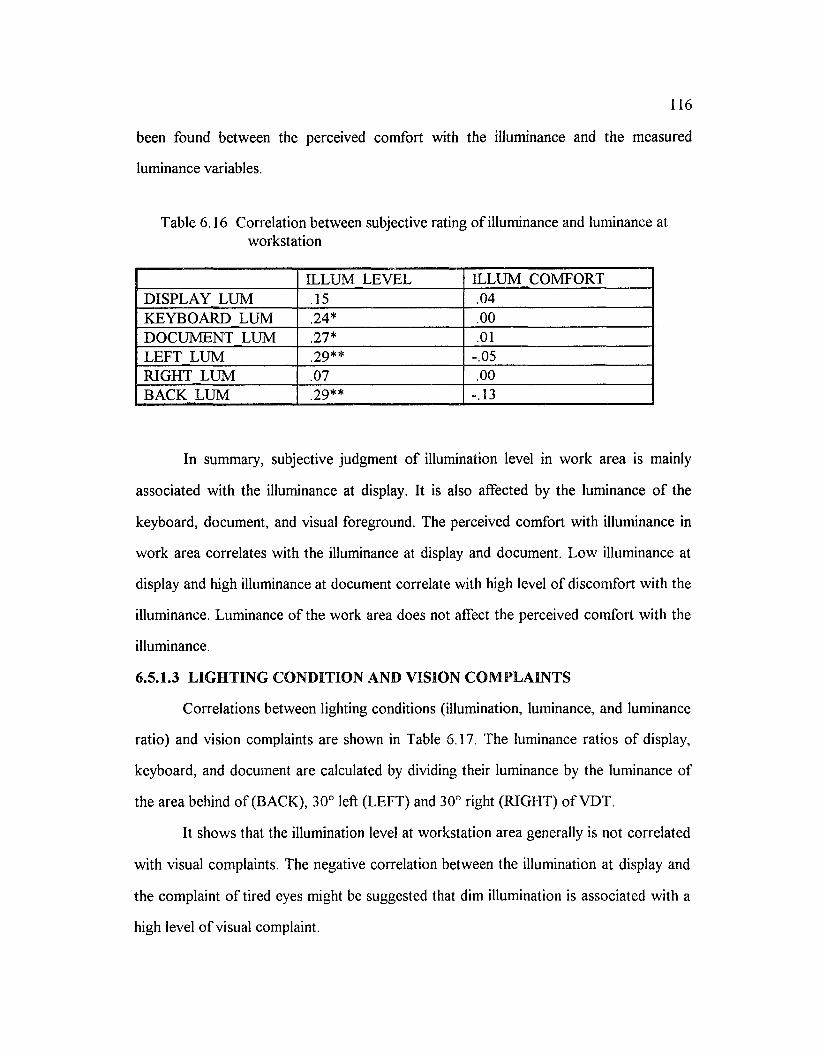
116
been found between the perceived comfort with the illuminance and the measured
luminance variables.
Table 6.16 Correlation between subjective rating o f illuminance and luminance at workstation
ILLUM LEVEL ILLUM COMFORTDISPLAY LUM .15 .04KEYBOARD LUM .24* . 0 0
DOCUMENT LUM .27* . 0 1
LEFT LUM .29** -.05RIGHT LUM .07 . 0 0
BACK LUM .29** -.13
In summary, subjective judgment o f illumination level in work area is mainly
associated with the illuminance at display. It is also affected by the luminance o f the
keyboard, document, and visual foreground. The perceived comfort with illuminance in
work area correlates with the illuminance at display and document. Low illuminance at
display and high illuminance at document correlate with high level o f discomfort with the
illuminance. Luminance o f the work area does not affect the perceived comfort with the
illuminance.
6.5.1.3 LIGHTING CONDITION AND VISION COMPLAINTS
Correlations between lighting conditions (illumination, luminance, and luminance
ratio) and vision complaints are shown in Table 6.17. The luminance ratios o f display,
keyboard, and document are calculated by dividing their luminance by the luminance of
the area behind o f (BACK), 30° left (LEFT) and 30° right (RIGHT) o f VDT.
It shows that the illumination level at workstation area generally is not correlated
with visual complaints. The negative correlation between the illumination at display and
the complaint o f tired eyes might be suggested that dim illumination is associated with a
high level o f visual complaint.
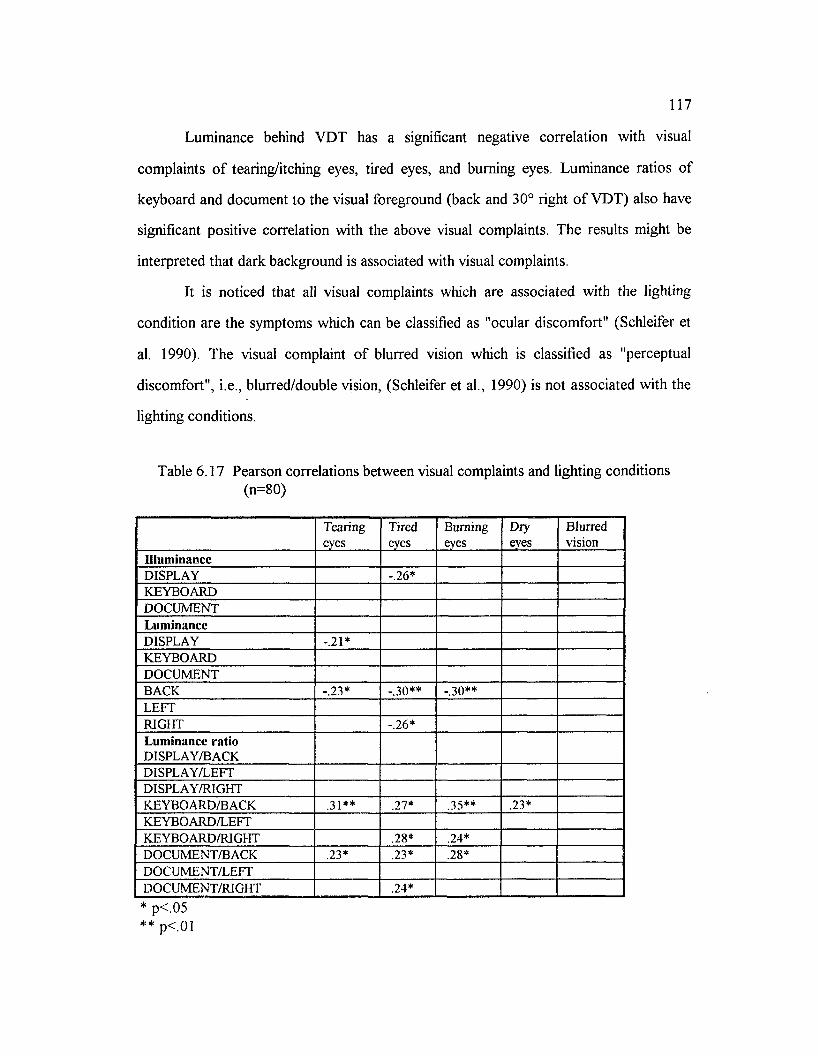
117
Luminance behind VDT has a significant negative correlation with visual
complaints o f tearing/itching eyes, tired eyes, and burning eyes. Luminance ratios of
keyboard and document to the visual foreground (back and 30° right o f VDT) also have
significant positive correlation with the above visual complaints. The results might be
interpreted that dark background is associated with visual complaints.
It is noticed that all visual complaints which are associated with the lighting
condition are the symptoms which can be classified as "ocular discomfort" (Schleifer et
al. 1990). The visual complaint o f blurred vision which is classified as "perceptual
discomfort", i.e., blurred/double vision, (Schleifer et al., 1990) is not associated with the
lighting conditions.
Table 6.17 Pearson correlations between visual complaints and lighting conditions (n=80)
Tearingeyes
Tiredeyes
Burningeyes
Dryeyes
Blurredvision
IlluminanceDISPLAY -.26*KEYBOARDDOCUMENTLuminanceDISPLAY -.2 1 *KEYBOARDDOCUMENTBACK -.23* -.30** -.30**LEFTRIGHT -.26*Luminance ratio DISPLAY/BACKDISPLAY/LEFTDISPLAY/RIGHTKEYBOARD/BACK .31** .27* 3 5 ** .23*KEYBOARD/LEFTKEYBOARD/RIGHT .28* .24*DOCUMENT/BACK .23* .23* .28*DOCUMENT/LEFTDOCUMENT/RIGHT .24*
* p<05** p< 0 1
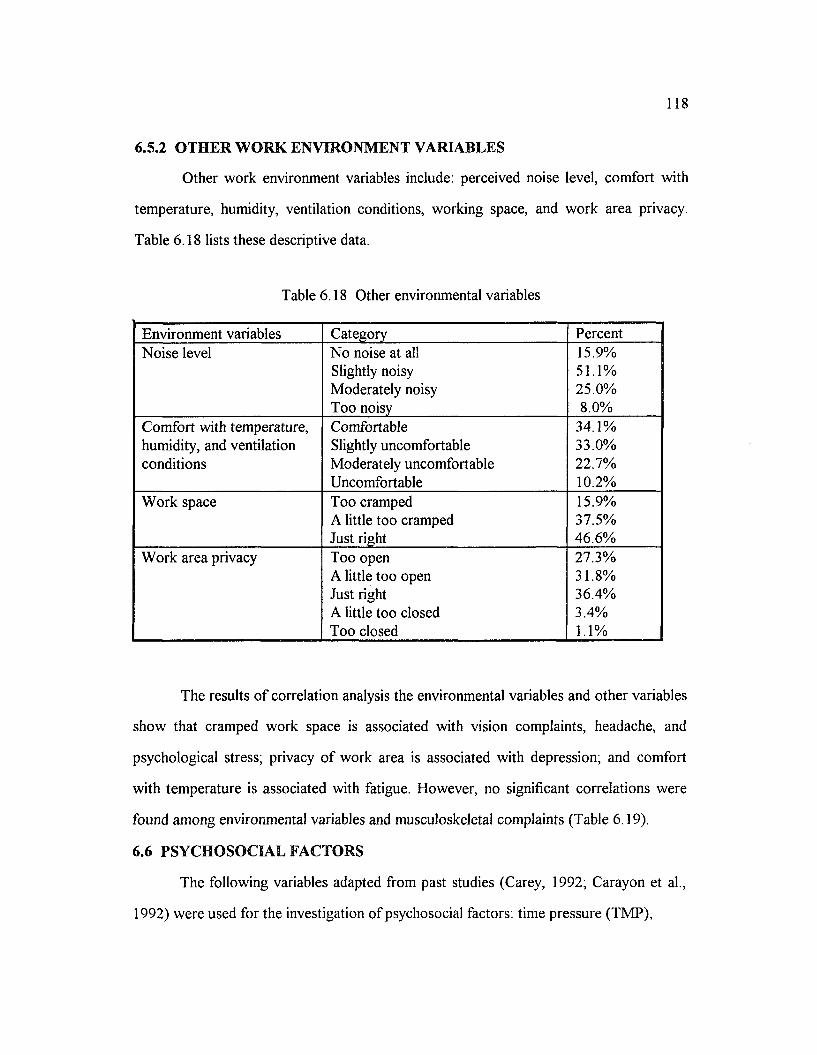
118
6.5.2 OTHER WORK ENVIRONMENT VARIABLES
Other work environment variables include: perceived noise level, comfort with
temperature, humidity, ventilation conditions, working space, and work area privacy.
Table 6.18 lists these descriptive data.
Table 6.18 Other environmental variables
Environment variables Category PercentNoise level No noise at all
Slightly noisy Moderately noisy Too noisy
15.9%51.1%25.0%8 .0 %
Comfort with temperature, humidity, and ventilation conditions
Comfortable Slightly uncomfortable Moderately uncomfortable Uncomfortable
34.1%33.0%22.7%1 0 .2 %
Work space Too cramped A little too cramped Just right
15.9%37.5%46.6%
W ork area privacy Too open A little too open Just right A little too closed Too closed
27.3%31.8%36.4%3.4%1 .1%
The results o f correlation analysis the environmental variables and other variables
show that cramped work space is associated with vision complaints, headache, and
psychological stress; privacy o f work area is associated with depression; and comfort
with temperature is associated with fatigue. However, no significant correlations were
found among environmental variables and musculoskeletal complaints (Table 6.19).
6.6 PSYCHOSOCIAL FACTORS
The following variables adapted from past studies (Carey, 1992; Carayon et al.,
1992) were used for the investigation o f psychosocial factors: time pressure (TMP),
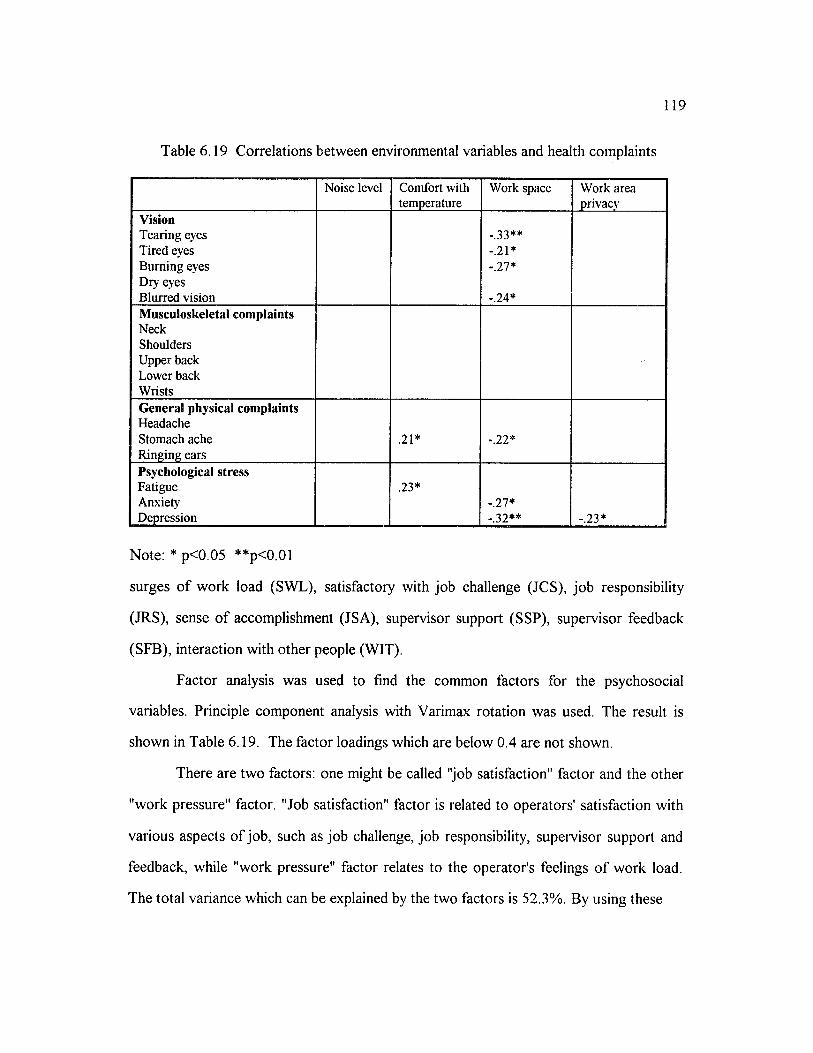
119
T ab le 6 .1 9 C o rre la tio n s b e tw e e n env iro n m en ta l v ariab les an d h ea lth c o m p la in ts
Noise level Comfort with temperature
Work space Work area privacy
VisionTearing eyes Tired eyes Burning eyes Dry eyes Blurred vision
-.33**-.2 1 *-.27*
-.24*Musculoskeletal complaintsNeck Shoulders Upper back Lower back WristsGeneral physical complaintsHeadache Stomach ache Ringing ears
.2 1 * -.2 2 *
Psychological stressFatigueAnxietyDepression
.23*-.27*-.32** -.23*
Note: * p<0.05 **p<0.01
surges o f work load (SWL), satisfactory with job challenge (JCS), job responsibility
(JRS), sense o f accomplishment (JSA), supervisor support (SSP), supervisor feedback
(SFB), interaction with other people (WIT).
Factor analysis was used to find the common factors for the psychosocial
variables. Principle component analysis with Varimax rotation was used. The result is
shown in Table 6.19. The factor loadings which are below 0.4 are not shown.
There are two factors: one might be called "job satisfaction" factor and the other
"work pressure" factor. "Job satisfaction" factor is related to operators' satisfaction with
various aspects o f job, such as job challenge, job responsibility, supervisor support and
feedback, while "work pressure" factor relates to the operator's feelings o f work load.
The total variance which can be explained by the two factors is 52.3%. By using these
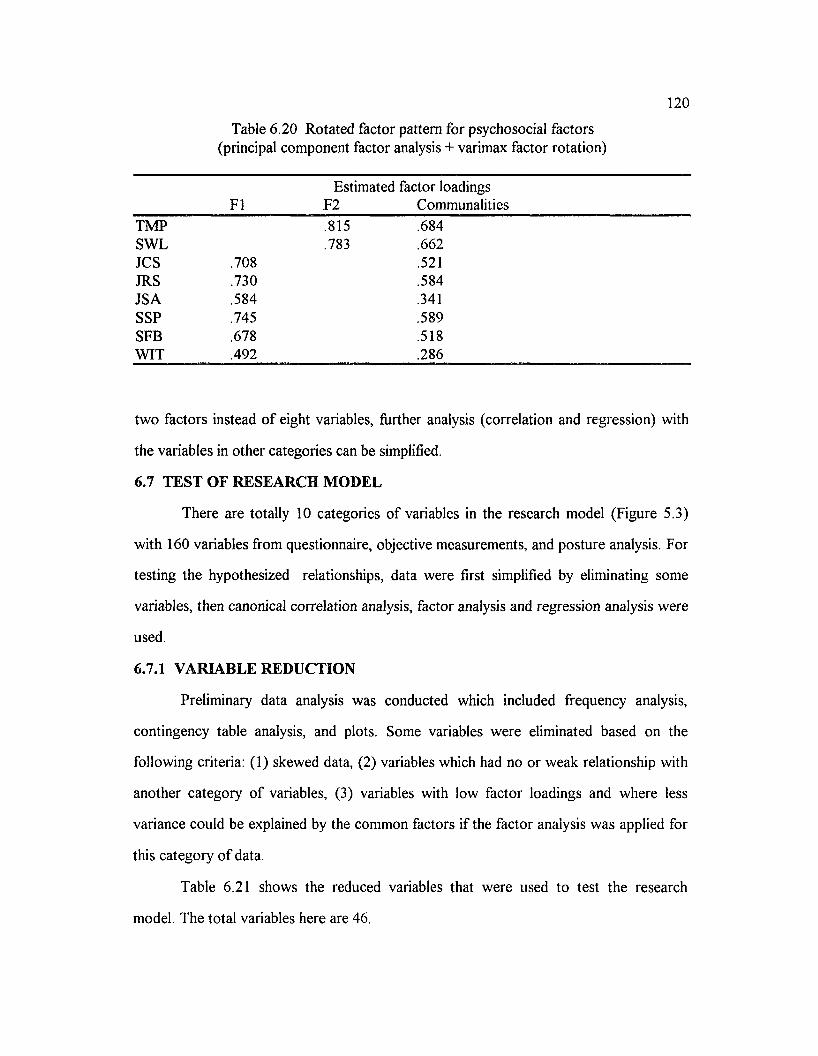
120
Table 6.20 Rotated factor pattern for psychosocial factors (principal component factor analysis + varimax factor rotation)
FIEstimated factor loadings
F2 CommunalitiesTMP .815 .684SWL .783 .662JCS .708 .521JRS .730 .584JSA .584 .341SSP .745 .589SFB .678 .518WIT .492 .286
two factors instead o f eight variables, further analysis (correlation and regression) with
the variables in other categories can be simplified.
6.7 TEST OF RESEARCH MODEL
There are totally 10 categories o f variables in the research model (Figure 5.3)
with 160 variables from questionnaire, objective measurements, and posture analysis. For
testing the hypothesized relationships, data were first simplified by eliminating some
variables, then canonical correlation analysis, factor analysis and regression analysis were
used.
6.7.1 VARIABLE REDUCTION
Preliminary data analysis was conducted which included frequency analysis,
contingency table analysis, and plots. Some variables were eliminated based on the
following criteria: ( 1) skewed data, (2 ) variables which had no or weak relationship with
another category o f variables, (3) variables with low factor loadings and where less
variance could be explained by the common factors if the factor analysis was applied for
this category o f data.
Table 6.21 shows the reduced variables that were used to test the research
model. The total variables here are 46.
121
6.7.2 CORRELATIONS AMONG VARIABLES IN THE RESEARCH MODEL
Canonical correlation analysis was applied to each category o f variables. The
results are shown in Table 6.22 and Figure 6.13. The following observation can be made
from the above results.
6.7.2.1 PHYSICAL SYMPTOMS
Musculoskeletal symptoms. This category o f variables is significantly associated
with 'awkward work posture' and 'psychological stress'. It shows that the third level
variables in the research model (i.e., demographics, task, workstation design, work
environment and psychosocial factors) have no direct relationship with musculoskeletal
symptoms.
Visual symptoms. Many categories o f variables have significant relationship with
visual symptoms: awkward work posture, psychological stress, task, workstation design,
work environment, and psychosocial factors. It is noticed that most third level variables
except "Demographics" have direct relationship with "Visual symptoms."
General physical symptoms. The variables that are significantly correlated with
general physical symptoms are psychological stress and psychosocial factors. The third
level variables have no direct relationship with this category o f variables.
6.1.2.2 AWKWARD POSTURE
The factors directly associated with this category o f variables are demographics,
workstation design, psychosocial factors, and psychological stress.
6.7.2.3 PSYCHOLOGICAL STRESS
Workstation design, work environment, psychosocial factors, and awkward work
posture are significantly correlated with this category o f variables.
6.7.3 REGRESSION MODELS
In order to reduce the variables for further analysis o f risk factors related to
physical symptoms by using regression analysis, factor analysis was applied to the
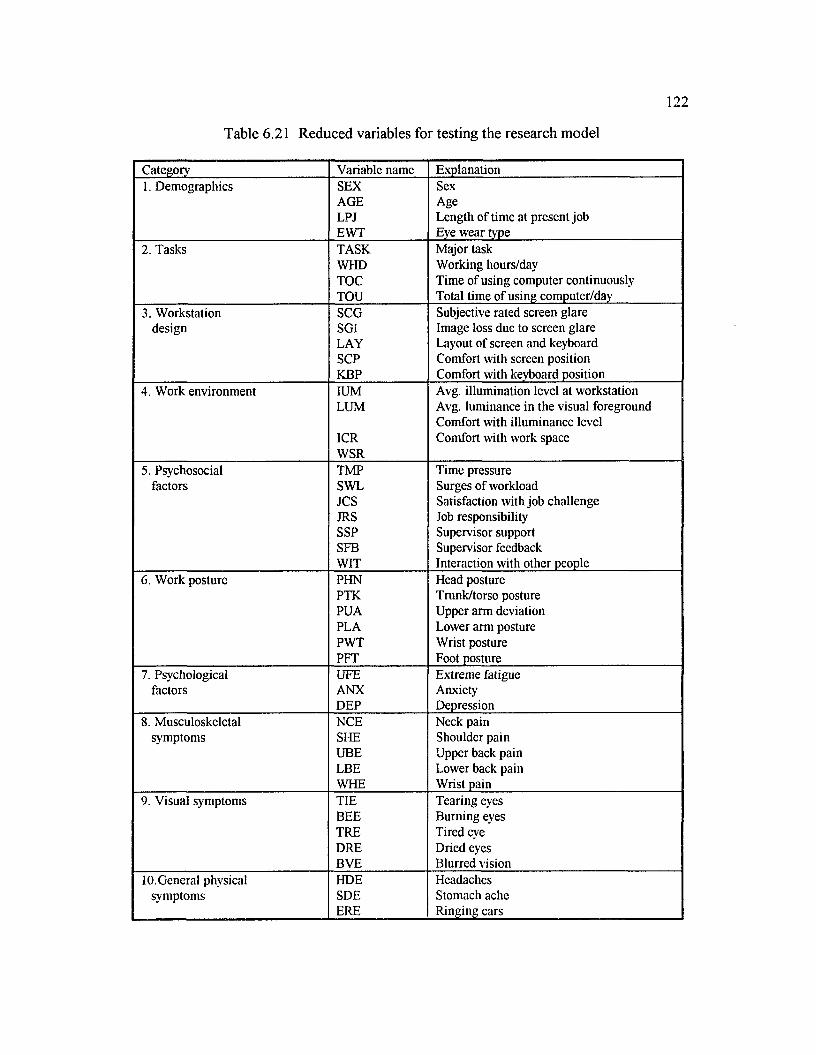
122
Table 6.21 Reduced variables for testing the research model
Category Variable name Explanation1. Demographics SEX Sex
AGE AgeLPJ Length of time at present jobEWT Eye wear type
2. Tasks TASK Major taskWHD Working hours/dayTOC Time of using computer continuouslyTOU Total time of using computer/day
3. Workstation SCG Subjective rated screen glaredesign SGI Image loss due to screen glare
LAY Layout of screen and keyboardSCP Comfort with screen positionKBP Comfort with keyboard position
4. Work environment IUM Avg. illumination level at workstationLUM Avg. luminance in the visual foreground
Comfort with illuminance levelICRWSR
Comfort with work space
5. Psychosocial TMP Time pressurefactors SWL Surges of workload
JCS Satisfaction with job challengeJRS Job responsibilitySSP Supervisor supportSFB Supervisor feedbackWIT Interaction with other people
6 . Work posture PHN Head posturePTK Trunk/torso posturePUA Upper arm deviationPLA Lower arm posturePWT Wrist posturePFT Foot posture
7. Psychological UFE Extreme fatiguefactors ANX Anxiety
DEP Depression8 . Musculoskeletal NCE Neck pain
symptoms SHE Shoulder painUBE Upper back painLBE Lower back painWHE Wrist pain
9. Visual symptoms TIE Tearing eyesBEE Burning eyesTRE Tired eyeDRE Dried eyesBVE Blurred vision
lO.General physical HDE Headachessymptoms SDE Stomach ache
ERE Ringing ears

123
Table 6.22 Canonical correlations among 10 categories o f variables in the research model
1 2 3 4 5 6 7 8 91. Demographics2. Tasks .493. Workstation .38 .314. Work environment .51 .47* .63**5. Psychosocial factors .59** .39 .58 .54*6 . Work posture .56** .45 .57** .44 .59*7. Psychological .38 .33 .53** .46* .62** .54*
factors8 . Musculoskeletal .38 .39 .49 .26 .51 .80** 71**
symptoms9. Visual symptoms .37 .53* .55* .53** .64* .71* .57* .59**lO.General physical .42 .51 .38 .35 .52* .57 64** .69** .53**
symptoms
following categories to identify common factors: psychosocial variables, awkward work
posture, musculoskeletal symptoms and workstation design variables.
Physical symptoms. Four factors have been identified: (1) ocular symptom factor
(M l), which included the symptoms o f burning eyes, tired eyes, tearing/itching eyes, and
dry eyes; (2) general musculoskeletal stress factor (M2), which included the symptoms o f
lower back, neck, shoulders, and headache, (3) upper extremity factor (M3), which
included the symptoms o f wrists, upper back, shoulders, and neck, (4) other symptom
factor (M4), which included blurred vision, ringing ears and stomach ache. The four-
factor pattern explained 62% variances o f physical symptom variables.
Psychosocial factors. Two factors were identified among psychosocial variables:
(1) job satisfaction (SI), which reflected various aspects o f satisfaction with the job
including satisfaction with job challenge, job responsibility, supervisor support,
supervisor feedback, and interaction with other people, and (2) workload pressure (S2),
which reflected the subjective feeling o f work load including the variables o f time
pressure and surges o f work load. The two-factor pattern explains 51% o f the variances
o f psychosocial variables.
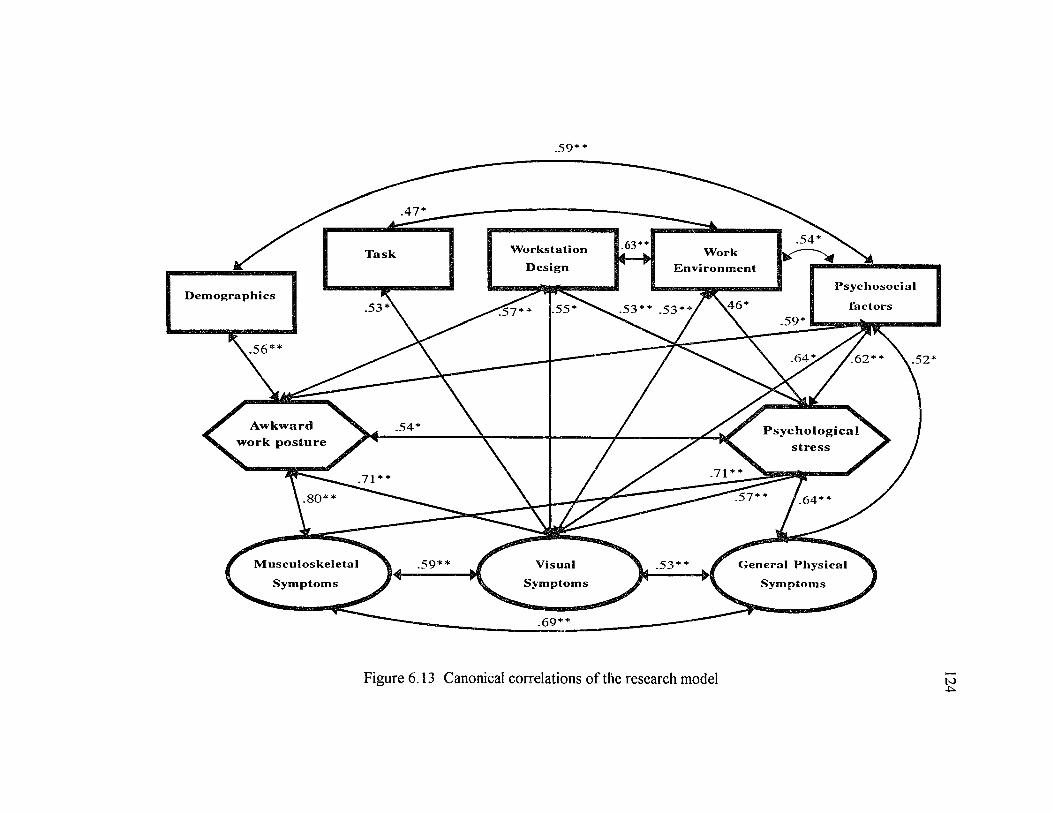
.5 9 * *
.47
.54.63W o r k s ta t io n W o rkE n v ir o n m e n t
T askD e s ig n
P s y c h o s o c ia l
fa c to r sD e m o g r a p h ic s
.46.53 .55.51.59
.56.64 .62 .52
A w k w ard w o rk p o s tu r e
.54 P s y c h o lo g ic a ls tr e s s
.71.71.57.80 . 6 4 *
M u s c u lo s k e le t a l .59 V is u a l
S y m p to m s
G e n e r a l P h y s ic a l
S y m p to m s
.53S y m p to m s
.69
Figure 6.13 Canonical correlations o f the research model to4̂

125
Awkward work posture. Two factors were identified: (1) upper body posture
(P I), which included the postures o f head/neck, trunk, and upper arm, and (2) extremity
posture (P2), which included the variables o f lower arm, wrist and foot posture. The
two-factor pattern explained 61% of the variance o f the posture variables.
Workstation design variables. Two factors were identified: (1) screen glare factor
(GLARE), which included subjective and objective measurement o f screen glare, and (2)
layout factor (LAYOUT), which included the layout o f keyboard and screen, subjective
rating o f comfort with screen position, and subjective rating o f comfort with keyboard
position. The two-factor pattern explains 68% o f the variances among workstation
design variables.
Table 6.23 lists the reduced variables used as independent variables in the
regression models for physical symptoms. It is noticed that posture variables (PI and P2)
and psychological stress variables (DEP, ANX and UFE) are related to both physical
symptom variables and environmental variables (i.e. demographics, workstation design,
work environment and psychosocial factors) (Figure 6.12). These variables may depend
on the environmental variables and they may influence physical symptom variables.
Table 6.23 Independent variables in regression models o f physical symptoms
No. Variables Categories1 - 4 SEX, AGE, LPJ, EWT Demographics5 - 8 TASK, WHD, TOC TOU Task9 - 1 0 GLARE, LAYOUT Workstation design11 - 14 IUM, LUM, ICR, WSR Work environment15 - 16 SI, S2 Psychosocial factors
SI: job satisfaction S2: work pressure
1 7 - 1 8 PI, P2 Awkward work posture P I: upper body posture P2: extremity posture
19-21 DEP, ANX, UFE Psychological stress
Note: see Table 6.21 for variable names.
126
The following relationships were tested using the multiple regression method.
The interactions and their possible effects are listed in Table 6.24.
Regression model 1-2:
Awkward work posture (PI P2)= / (demographics, task, workstation design, work environment, psychosocial
factors, psychological stress)
Regression model 3-5:
Psychological stress (DEP ANX UFE)= / (demographics, task, workstation design, work environment, psychosocial
factors, awkward work posture)
Regression model 6-9:
Physical symptoms (M l M2 M3 M4)= / (demographics, task, workstation design, work environment, psychosocial
factors, work posture, psychological stress)
The following regression methods were used to determine the predictors for each
regression model: forward, backward, stepwise, and adjusted-R2. In order to choose the
model that provides the best prediction using the sample estimates, several significance
levels were tested. The significance level for entering the model by forward selection
method was tested at 50 percent (default), 10 percent and five percent. The significance
level for leaving model by backward method was tested at 15 percent, 10 percent
(default) and five percent. The significant level for entering model in stepwise selection
method was tested at 15 percent (default), 10 percent and five percent; for leaving
model, 15 percent (default), 10 percent and five percent.
The results from the different methods were compared and the final regression
model was determined based on the following criteria: (1) high adjusted R2, which is an
alternative to R2, which represents the proportion o f variiance that can be explained by
the model that has been adjusted for the model degrees o f freedom; (2) reasonable
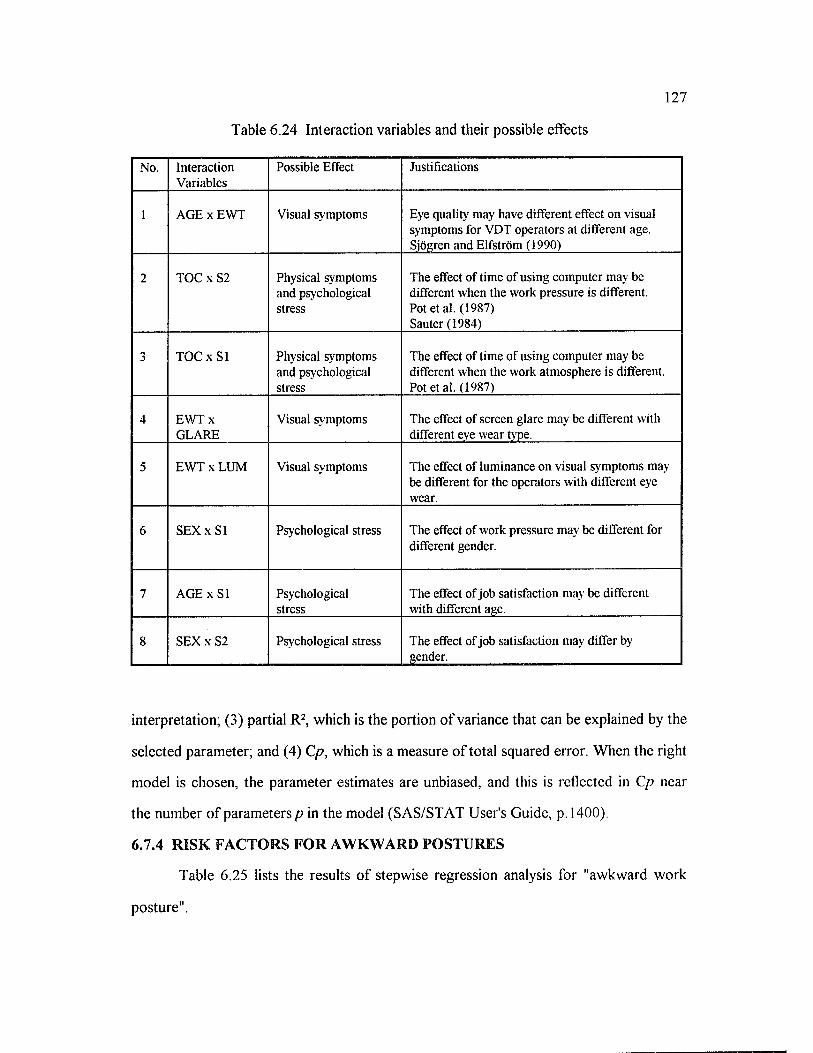
127
Table 6.24 Interaction variables and their possible effects
No. InteractionVariables
Possible Effect Justifications
1 AGE x EWT Visual symptoms Eye quality may have different effect on visual symptoms for VDT operators at different age. Sjogren and Elfstrom (1990)
2 TOC x S2 Physical symptoms and psychological stress
The effect of time of using computer may be different when the work pressure is different. Pot et al. (1987)Sauter(1984)
3 TOC x SI Physical symptoms and psychological stress
The effect of time of using computer may be different when the work atmosphere is different. Pot et al. (1987)
4 EWT x GLARE
Visual sy mptoms The effect of screen glare may be different with different eve wear type.
5 EW TxLUM Visual symptoms The effect of luminance on visual symptoms may be different for the operators with different eye wear.
6 SEX x SI Psychological stress The effect of work pressure may be different for different gender.
7 AGE x SI Psychologicalstress
The effect of job satisfaction may be different with different age.
8 SEX x S2 Psychological stress The effect of job satisfaction may differ by gender.
interpretation; (3) partial R2, which is the portion o f variance that can be explained by the
selected parameter; and (4) Cp, which is a measure o f total squared error. When the right
model is chosen, the parameter estimates are unbiased, and this is reflected in Cp near
the number o f parameters p in the model (SAS/STAT User's Guide, p. 1400).
6.7.4 RISK FACTORS FOR AWKWARD POSTURES
Table 6.25 lists the results o f stepwise regression analysis for "awkward work
posture".
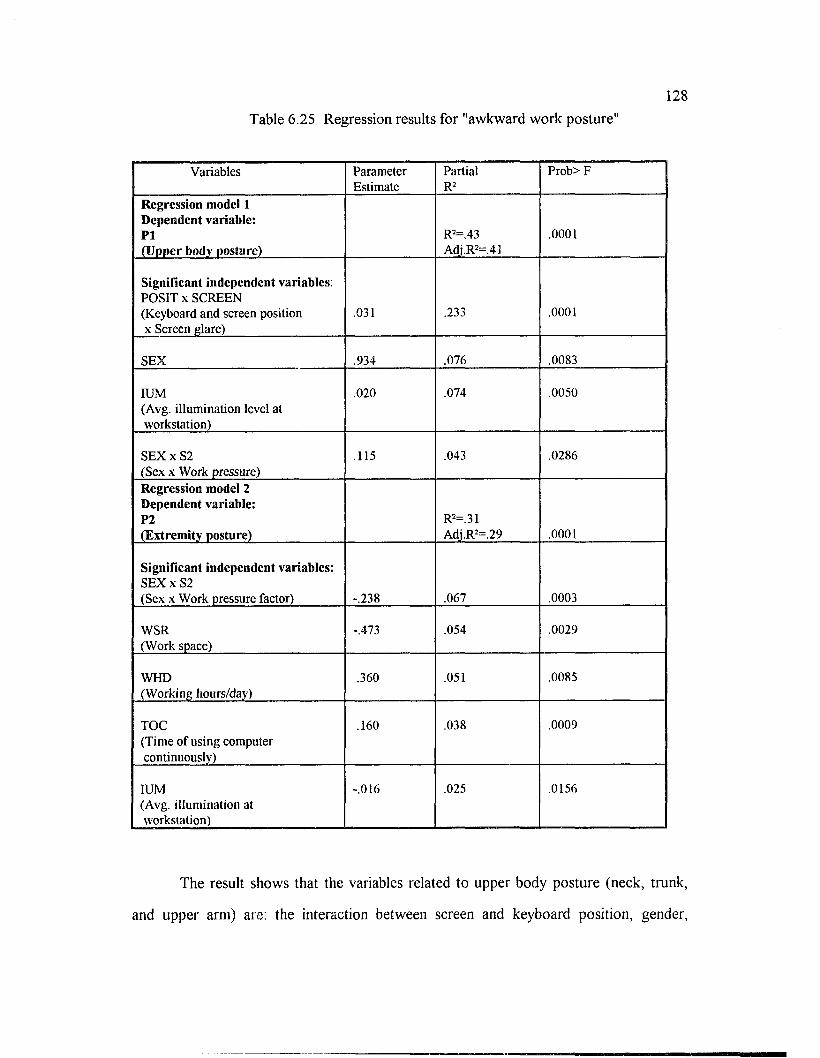
128
Table 6.25 Regression results for "awkward work posture"
Variables ParameterEstimate
PartialR2
Prob> F
Regression model 1 Dependent variable: PI(Upper body posture)
R2=.43Adj.R2=43
.0001
Significant independent variables: POSIT x SCREEN (Keyboard and screen position x Screen glare)
.031 .233 .0001
SEX .934 .076 .0083
IUM(Avg. illumination level at workstation)
.020 .074 .0050
SEX x S2(Sex x Work pressure)
.115 .043 .0286
Regression model 2 Dependent variable: P2(Extremity posture)
R2=,31Adj.R2=.29 .0001
Significant independent variables:SEX x S2(Sex x Work pressure factor) -.238 .067 .0003
WSR(Work space)
-.473 .054 .0029
WHD(Working hours/day)
.360 .051 .0085
TOC(Time of using computer continuously)
.160 .038 .0009
IUM(Avg. illumination at workstation)
-.016 .025 .0156
T h e re su lt sh o w s th a t th e v a riab les re la ted to u p p e r b o d y p o s tu re (n e c k , tru n k ,
an d u p p e r a rm ) are: th e in te rac tio n b e tw een sc reen and k e y b o a rd p o sitio n , g en d er,
129
average illumination level at VDT workstation, and the interaction between gender and
work pressure. The total proportion o f the variance o f the upper body posture that can
be explained by the above variables after adjustment for the degrees o f freedom is 41%
(adjusted R2).
It is seen that the interaction between the layout o f screen and keyboard (POSIT)
and screen glare (SCREEN) are the most important variables associated with upper body
posture. The proportion o f the variance o f upper body posture that can be explained by
this variable is 23.3%. The positive regression coefficient can be interpreted that the bad
layout o f screen and keyboard and more glare is related to poor/awkward work posture.
The effect o f interaction between POSIT and SCREEN is shown in Figure 6.14. It is
seen that when the score o f position is low, the effect o f screen glare is not very
important. As the score of position increases, high score o f screen glare is associated
with high score o f upper body posture (PI). Gender is another factor which is positively
related to the upper body posture: females have higher scores on awkward upper body
posture (i.e., worse posture) than males. The average illumination level (average o f
illumination at display, keyboard, and document) is also positively associated with
awkward work posture.
After examination o f the effect o f interactions o f gender (SEX) and work
pressure factor (S2) on the upper body posture (PI) (Figure 6.14), it was found that the
posture score (P I) increased as work pressure (S2) increased among females but not
among males. The effect o f work pressure (S2) on upper body posture (P I) among both
genders.
The following factors are related to the extremity posture (i.e. lower arm, wrist
and foot posture): the interaction between gender and work pressure factor (SEX*S2),
work space (WSR), working hours/day (WHD), time o f using computer continuously
(TOC) and illumination level at workstation (IUM). The negative regression coefficient
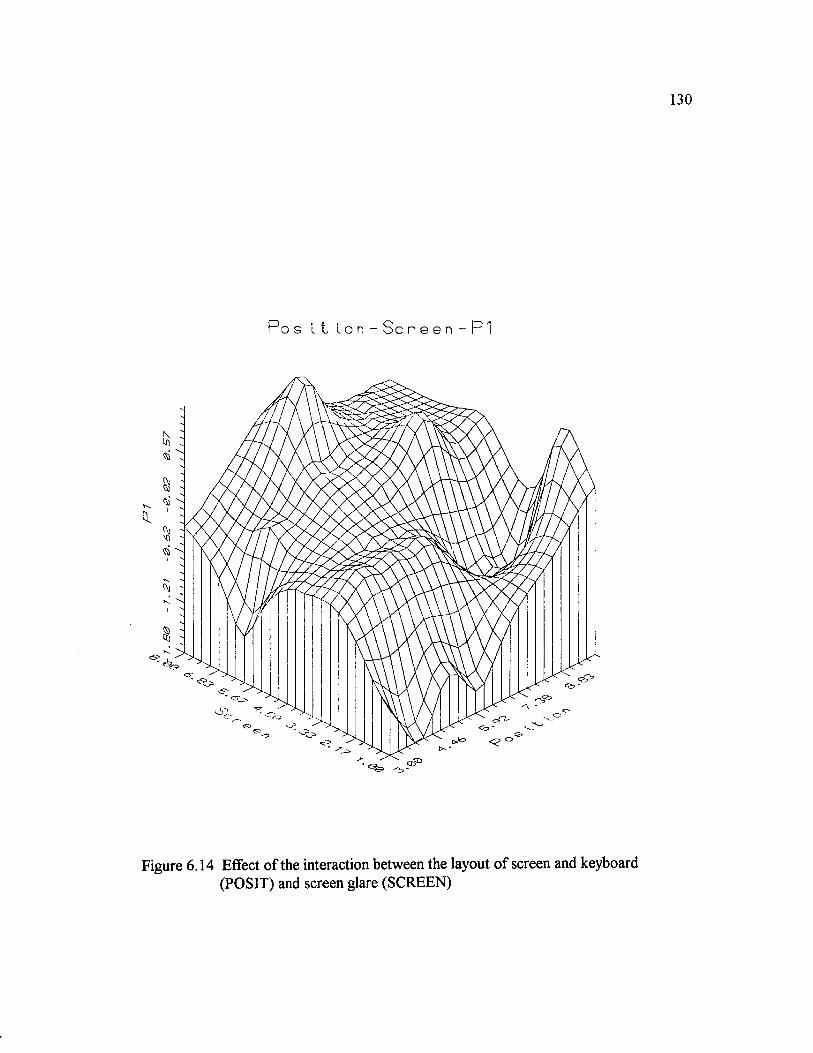
P o s I t i o n - S c r e e n - P1
Figure 6.14 Effect o f the interaction between the layout o f screen and keyboard (POSIT) and screen glare (SCREEN)
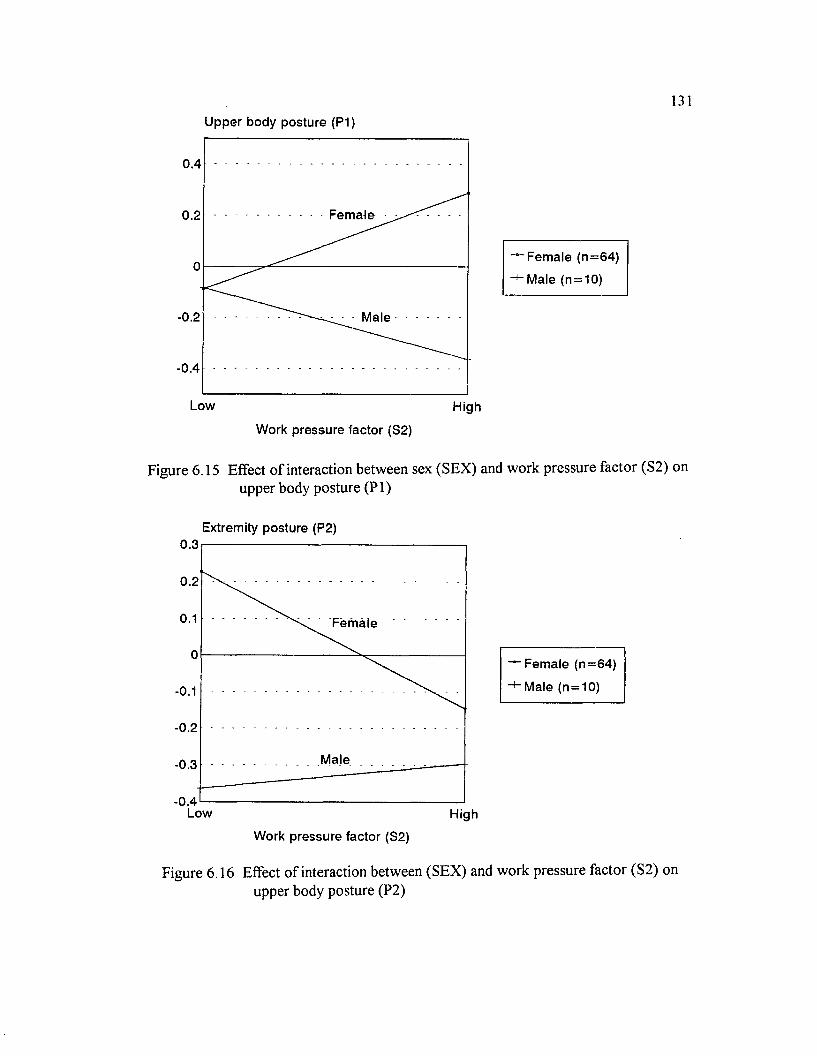
131
Upper body posture (P1)
0.4
0.2
- 0.2 Male
-0.4
Low High
• Female (n=64)
Male (n=10)
Work pressure factor (S2)
Figure 6.15 Effect o f interaction between sex (SEX) and work pressure factor (S2) on upper body posture (PI)
Extremity posture (P2)0.3
0.2
Female
- 0.1
- 0.2
Male-0.3
-0.4Low High
Female (n=64)
■+■ Male (n = 10)
Work pressure factor (S2)
Figure 6.16 Effect o f interaction between (SEX) and work pressure factor (S2) on upper body posture (P2)
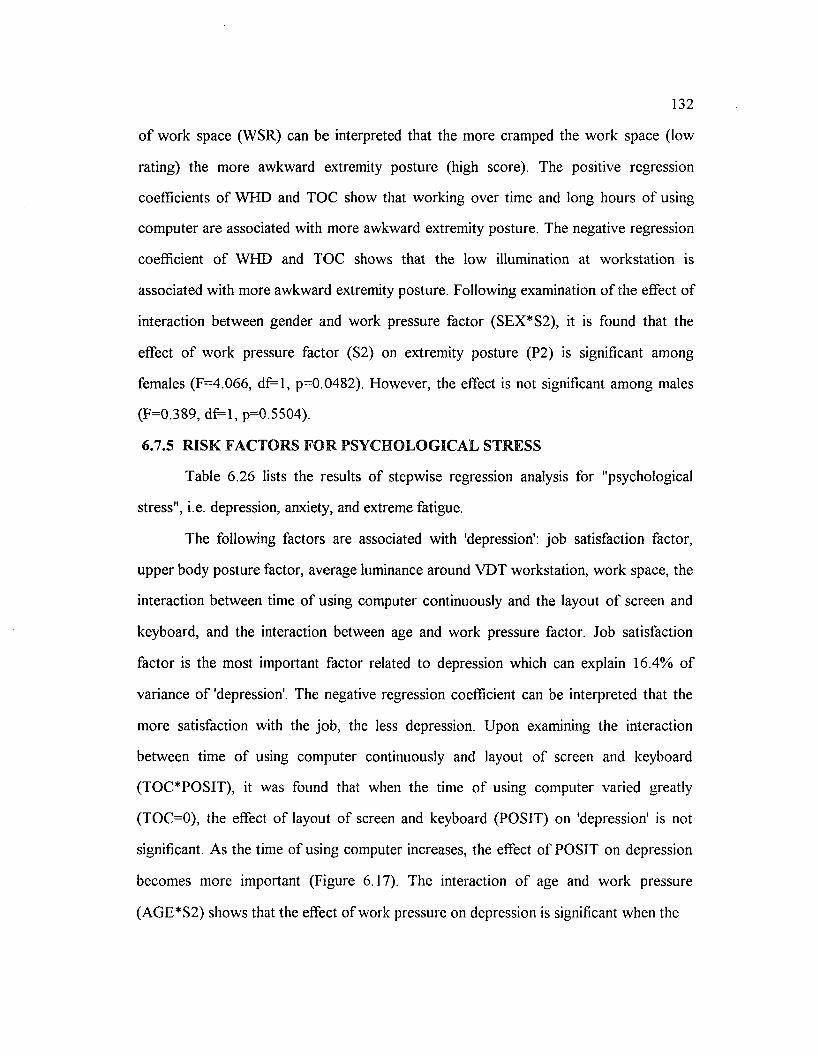
132
o f work space (WSR) can be interpreted that the more cramped the work space (low
rating) the more awkward extremity posture (high score). The positive regression
coefficients o f WHD and TOC show that working over time and long hours o f using
computer are associated with more awkward extremity posture. The negative regression
coefficient o f WHD and TOC shows that the low illumination at workstation is
associated with more awkward extremity posture. Following examination o f the effect of
interaction between gender and work pressure factor (SEX*S2), it is found that the
effect o f work pressure factor (S2) on extremity posture (P2) is significant among
females (F=4.066, df=l, p=0.0482). However, the effect is not significant among males
(F=0.389, df= l, p=0.5504).
6.7.5 RISK FACTORS FOR PSYCHOLOGICAL STRESS
Table 6.26 lists the results o f stepwise regression analysis for "psychological
stress", i.e. depression, anxiety, and extreme fatigue.
The following factors are associated with 'depression': job satisfaction factor,
upper body posture factor, average luminance around VDT workstation, work space, the
interaction between time o f using computer continuously and the layout o f screen and
keyboard, and the interaction between age and work pressure factor. Job satisfaction
factor is the most important factor related to depression which can explain 16.4% o f
variance o f 'depression'. The negative regression coefficient can be interpreted that the
more satisfaction with the job, the less depression. Upon examining the interaction
between time o f using computer continuously and layout o f screen and keyboard
(TOC*POSIT), it was found that when the time o f using computer varied greatly
(TOC=0), the effect o f layout o f screen and keyboard (POSIT) on 'depression' is not
significant. As the time o f using computer increases, the effect o f POSIT on depression
becomes more important (Figure 6.17). The interaction o f age and work pressure
(AGE*S2) shows that the effect o f work pressure on depression is significant when the
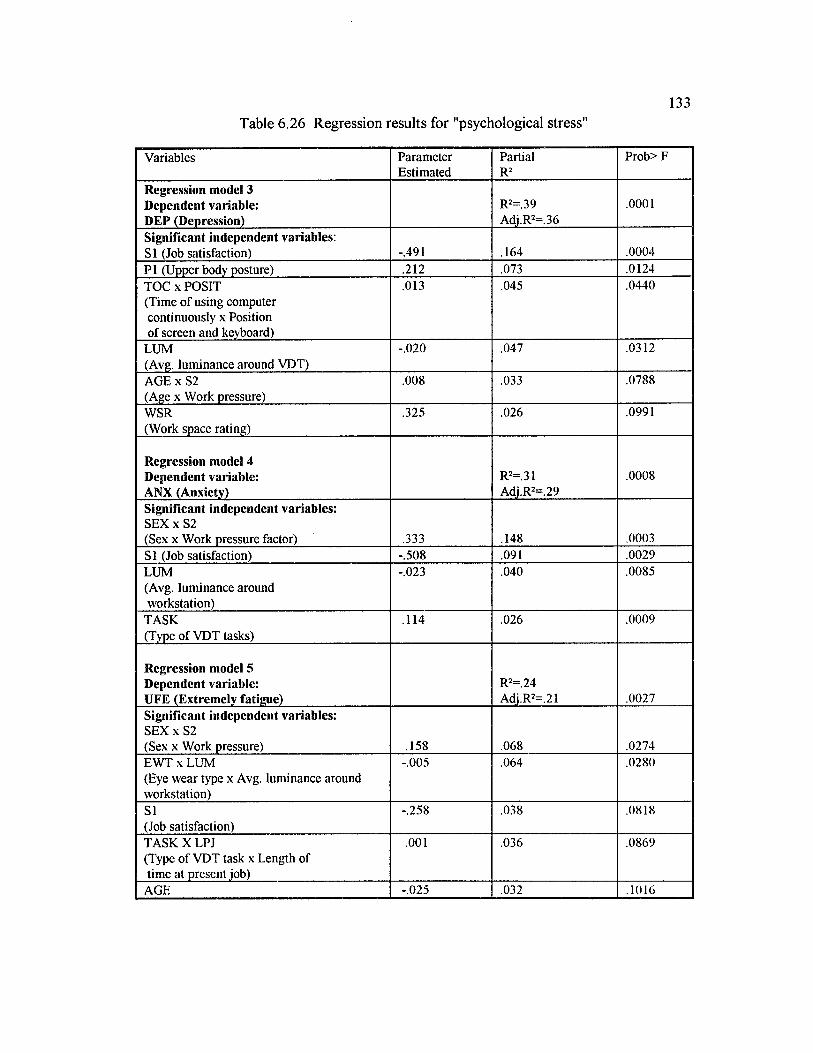
133
Table 6.26 Regression results for "psychological stress"
Variables ParameterEstimated
PartialR2
Prob> F
Regression model 3 Dependent variable: DEP (Depression)
R2=.39Adj.R2= 36
.0001
Significant independent variables: SI (Job satisfaction) -.491 .164 .0004PI (Upper body posture) .212 .073 .0124TOC x POSIT (Time of using computer continuously x Position of screen and keyboard)
.013 .045 .0440
LUM(Avg. luminance around VDT)
-.020 .047 .0312
AGE x S2(Age x Work pressure)
.008 .033 .0788
WSR(Work space rating)
.325 .026 .0991
Regression model 4 Dependent variable: ANX (Anxiety)
R2=.31Adj.R2=.29
.0008
Significant independent variables:SEX x S2(Sex x Work pressure factor) .333 .148 .0003SI (Job satisfaction) -.508 .091 .0029LUM(Avg. luminance around workstation)
-.023 .040 .0085
TASK(Type of VDT tasks)
.114 .026 .0009
Regression model 5 Dependent variable: UFE (Extremely fatigue)
R2=.24Adj.R2=.21 .0027
Significant independent variables:SEX x S2(Sex x Work pressure) .158 .068 .0274EWTxLUM(Eye wear type x Avg. luminance around workstation)
-.005 .064 .0280
SI(Job satisfaction)
-.258 .038 .0818
TASK X LPJ(Type of VDT task x Length of time at present job)
.001 .036 .0869
AGE -.025 .032 .1016
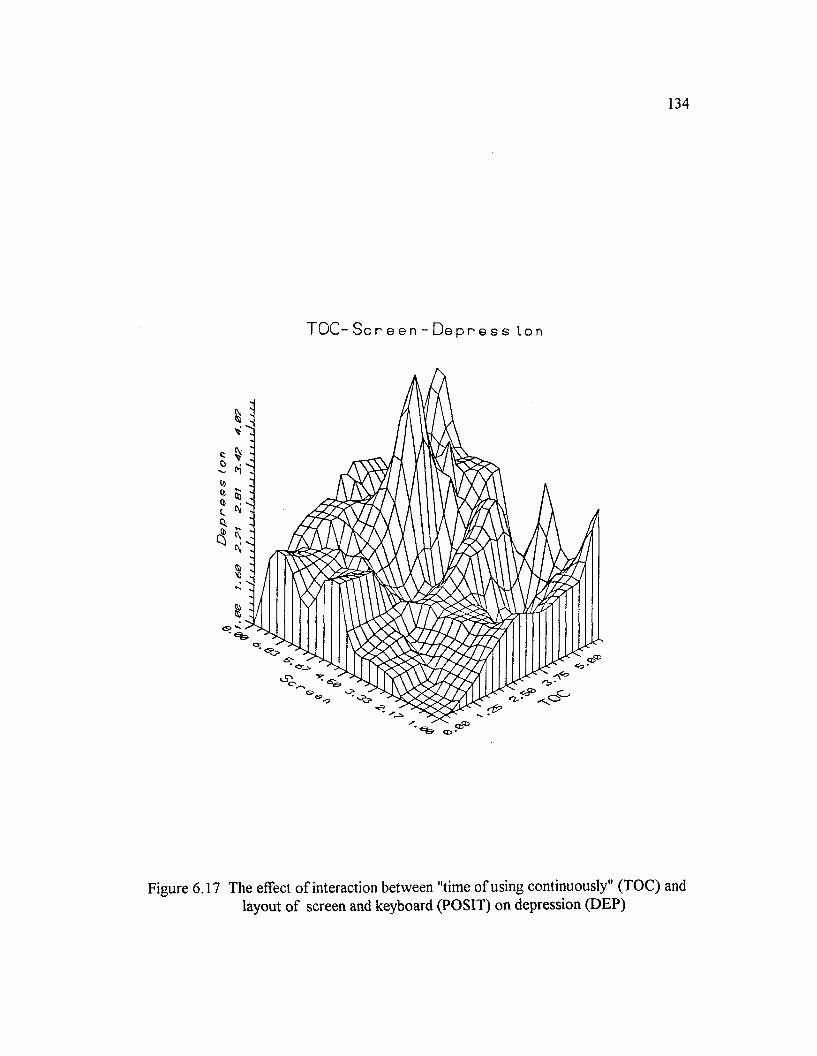
134
T O C - S c r e e n - D e p r e s s I on
F ig u re 6 .1 7 T h e e ffec t o f in te rac tio n b e tw een "tim e o f u s in g co n tin u o u sly " (T O C ) andlay o u t o f sc reen and k ey b o a rd (P O S IT ) o n d e p re ss io n (D E P )
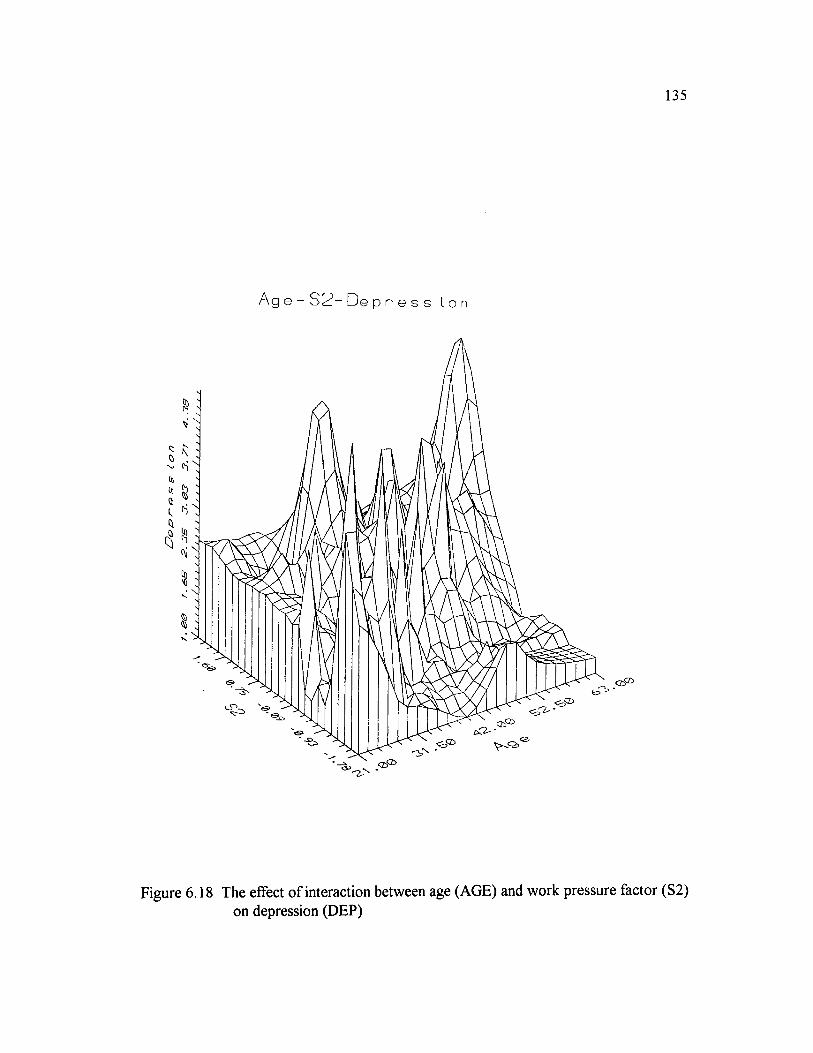
135
Ag e - S 2 - D e p r e s s I o n
V
F ig u re 6 .1 8 T h e e ffec t o f in te ra c tio n b e tw een ag e (A G E ) and w o rk p re s su re fa c to r (S 2 )o n d ep re ss io n (D E P )

136
age is over 50, the higher work pressure the operator perceived, the higher depression
(Figure 6.18).
The following factors are related to 'anxiety': job satisfaction factor (SI), average
luminance around VDT workstation (LUM), the type o f VDT tasks (TASK), and the
interaction between gender and work pressure (SEX*S2). The interaction between sex
and work pressure factor is the most important factor which can explain 15% o f the
variance in 'anxiety'. The negative regression coefficient o f SI can be interpreted that the
more satisfaction with the job, the less anxiety. It is also seen that low luminance is
associated with high level of'anxiety'. The interaction between gender and work pressure
(SEX*S2): high work pressure is significantly related to fatigue among females
(F-13.271, df=l, p=0.0006) but not among males (F=0.445, df=l, p=0.5236) (Figure
6.19).
The following factors are related to 'extremely fatigue': job satisfaction factor,
age, the interaction between sex and work pressure, the interaction between eye wear
type and luminance around VDT, and the interaction between type o f VDT tasks and
length o f time at present job. The interaction between gender and work pressure factor
(SEX*S2) is the most important factor which can explain 6.8% o f variance of'extrem e
fatigue'. Examination o f above interaction on 'extremely fatigue', it is found that high
work pressure is significantly related to high score o f fatigue among females (F=5.058,
dft=l, p=0.028) but not among males (Figure 6.20).
6.7.6 R ISK FACTORS FO R PHYSICAL SYM PTOM S
As discussed in section 6.8.3, four factors were identified among physical
symptoms, i.e., ocular discomfort (M l), general musculoskeletal stress (M2), upper body
symptom (M3), and other physical symptoms (M4). The above four factors are not
correlated after the orthogonal transformation (rotation).
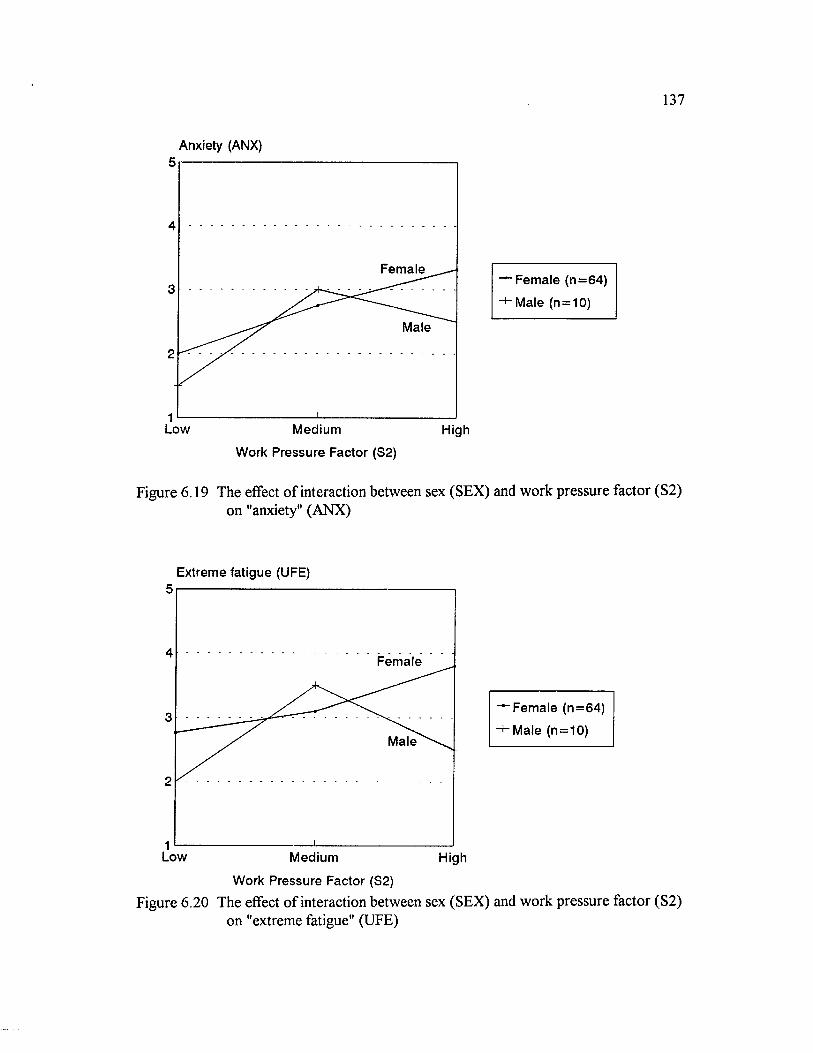
137
Anxiety (ANX)
— Female (n= 64)
■+■ Male (n = 10)
Fem ale
Male
Low Medium High
Work Pressure Factor (S2)
Figure 6.19 The effect o f interaction between sex (SEX) and work pressure factor (S2) on "anxiety" (ANX)
Extreme fatigue (UFE)
— Female (n=64)
~+~Male (n = 10)
Female
Male
Low Medium High
Work Pressure Factor (S2)
F ig u re 6 .2 0 T h e e ffec t o f in te ra c tio n b e tw een sex (S E X ) and w o rk p re s su re fa c to r (S 2 )o n "ex trem e fa tig u e" (U F E )
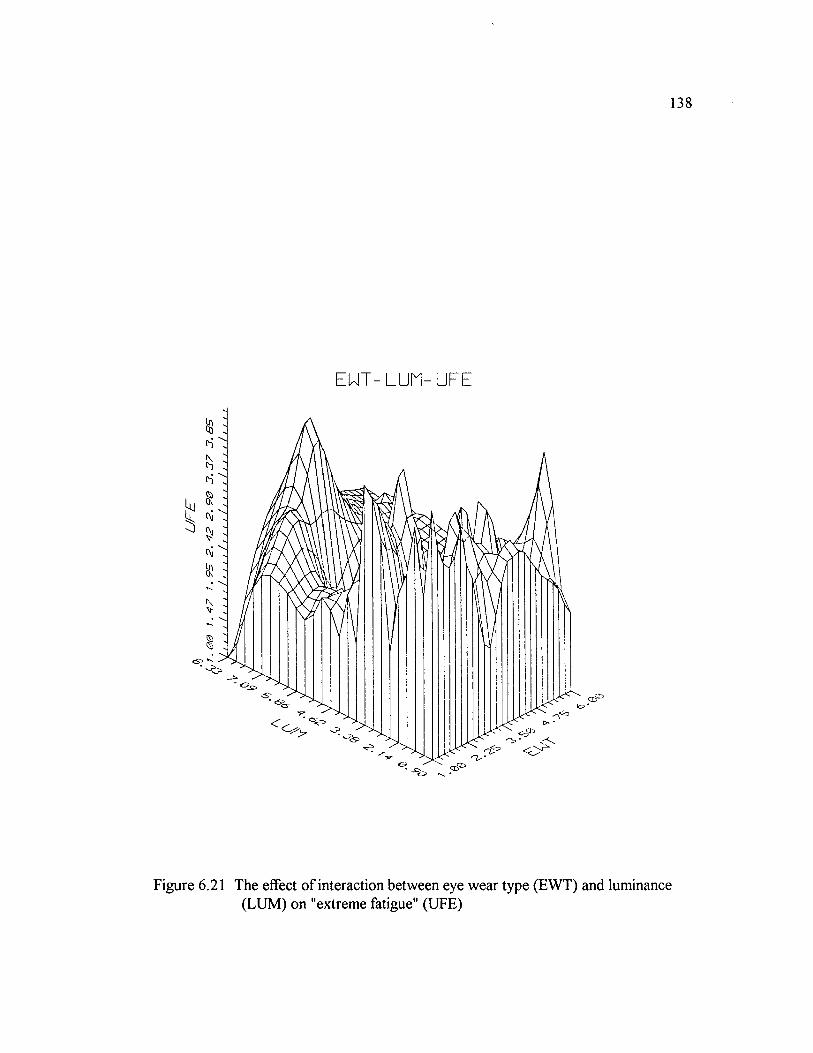
138
E W T - L U M - U F E
* O '
F ig u re 6.21 T h e e ffec t o f in te ra c tio n b e tw een eye w e a r ty p e (E W T ) an d lu m in an ce(L U M ) o n "ex trem e fa tigue" (U F E )
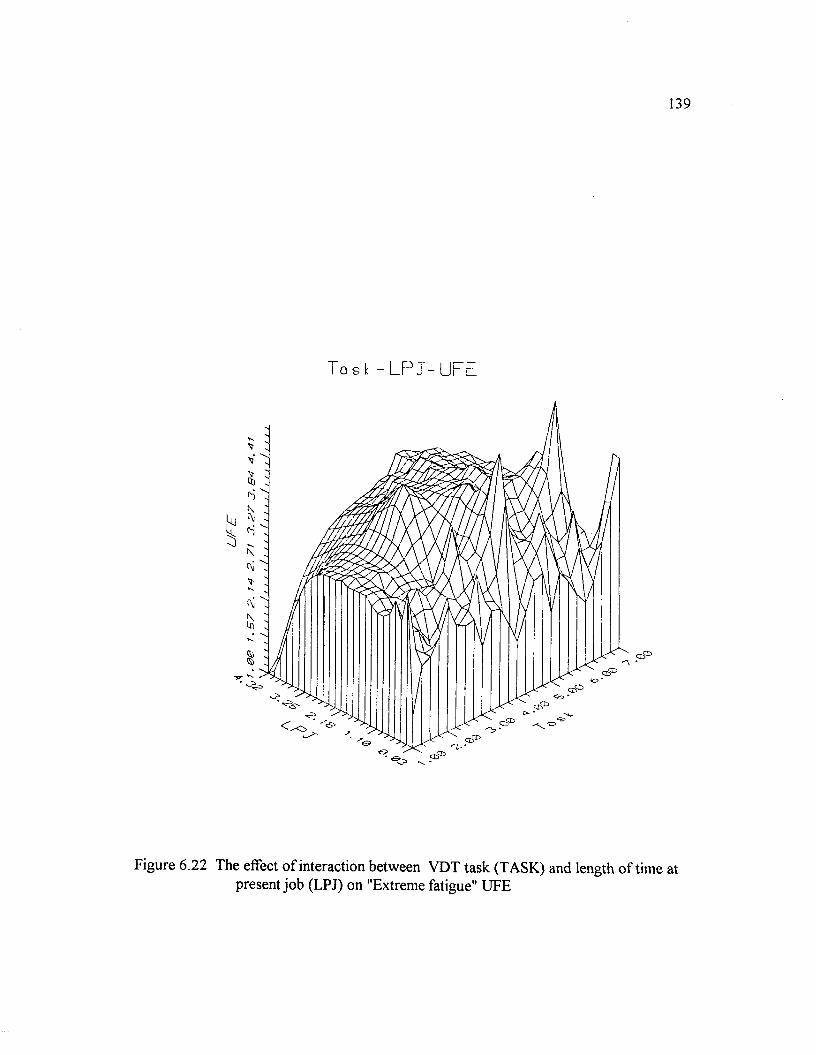
139
T a s k - L P J - U F E
CJ-
F ig u re 6 .2 2 T h e e ffec t o f in te ra c tio n b e tw e e n V D T ta s k (T A S K ) a n d len g th o f tim e atp re se n t jo b (L P J) o n "E x trem e fa tig u e" U F E
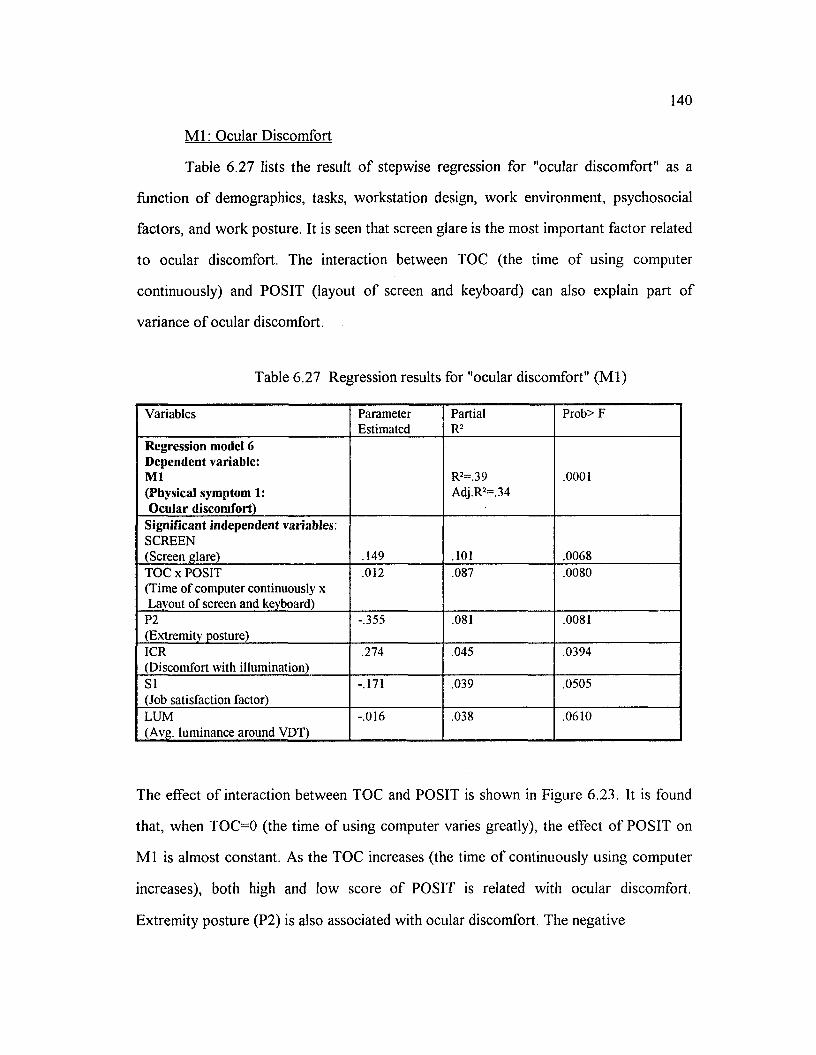
140
M l: Ocular Discomfort
Table 6.27 lists the result o f stepwise regression for "ocular discomfort" as a
function o f demographics, tasks, workstation design, work environment, psychosocial
factors, and work posture. It is seen that screen glare is the most important factor related
to ocular discomfort. The interaction between TOC (the time o f using computer
continuously) and POSIT (layout o f screen and keyboard) can also explain part o f
variance o f ocular discomfort.
Table 6.27 Regression results for "ocular discomfort" (M l)
Variables ParameterEstimated
PartialR2
Prob> F
Regression model 6 Dependent variable: M l(Physical symptom 1: Ocular discomfort)
R2=.39Adj.R2=.34
.0001
Significant independent variables:SCREEN(Screen glare) .149 .101 .0068TOC x POSIT(Time of computer continuously x Layout of screen and keyboard)
.012 .087 .0080
P2(Extremity posture)
-.355 .081 .0081
ICR(Discomfort with illumination)
.274 .045 .0394
SI(Job satisfaction factor)
-.171 .039 .0505
LUM(Avg. luminance around VDT)
-.016 .038 .0610
The effect o f interaction between TOC and POSIT is shown in Figure 6.23. It is found
that, when T O C O (the time o f using computer varies greatly), the effect o f POSIT on
M l is almost constant. As the TOC increases (the time o f continuously using computer
increases), both high and low score o f POSIT is related with ocular discomfort.
Extremity posture (P2) is also associated with ocular discomfort. The negative
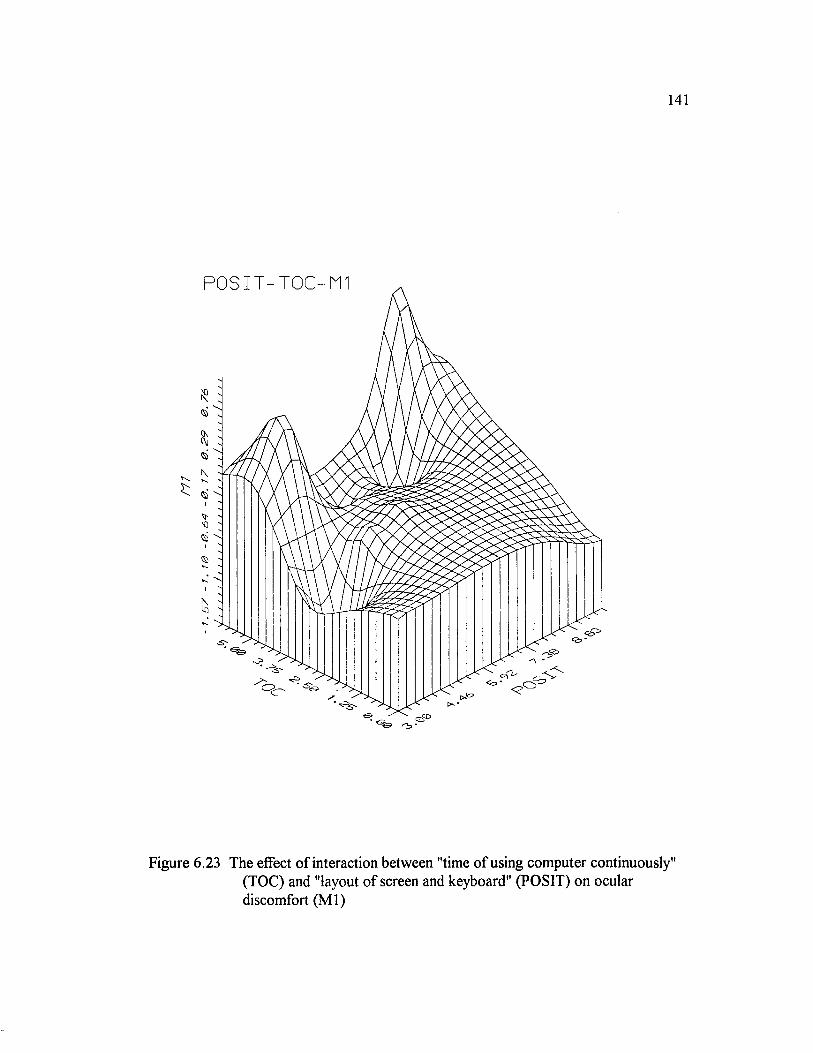
m
141
P OS I T-T O C -M 1
<o ,o
Figure 6.23 The effect o f interaction between "time o f using computer continuously" (TOC) and "layout o f screen and keyboard" (POSIT) on ocular discomfort (M l)
142
regression coefficient o f P2 means that the high score o f P2 is related to fewer
complaints o f ocular discomfort. Further examining the above result, it is found that a
high score o f P2 is related to a high score o f lower arm posture less angle between upper
arm and lower arm, see Figure 5.8). This posture might result from a high work surface.
The higher the working surface, the closer the document is to the eyes and this may
result in fewer ocular complaints.
Table 6.27 also shows that ocular discomfort is associated with discomfort with
illumination level at workstation, the more discomfort with illumination, the more ocular
discomfort (positive regression coefficient). Job satisfaction factor is another predictor
for the ocular discomfort, the negative coefficient reveals that the more satisfied with the
job the less complaints. It also shows that low luminance around the workstation is
related to more ocular complaints.
M2: General Musculoskeletal Stress
Table 6.28 lists the results o f stepwise regression analysis for 'general
musculoskeletal stress'. In this factor, lower back pain and headache have high factor
loadings (weights). It is seen that 'extreme fatigue' (UFE) is the most important factor
contributed to this stress factor. Another factor is PI (upper body posture). More
complaints about general musculoskeletal stress are associated with poor upper body
posture. The musculoskeletal complaints are also negatively related to age (AGE) and
time o f using computer continuously (TOC).
M3: Upper body symptoms
Table 6.29 lists the results o f stepwise regression analysis for 'upper body
symptoms' (M3). It shows that the following factors are significantly associated with M3:
extremity posture (lower arm, wrist, and foot posture), depression, VDT work history,
and the interaction between upper body posture (P I) and the layout o f screen and
keyboard (POSIT). It is found that high scores o f extremity posture, depression, and
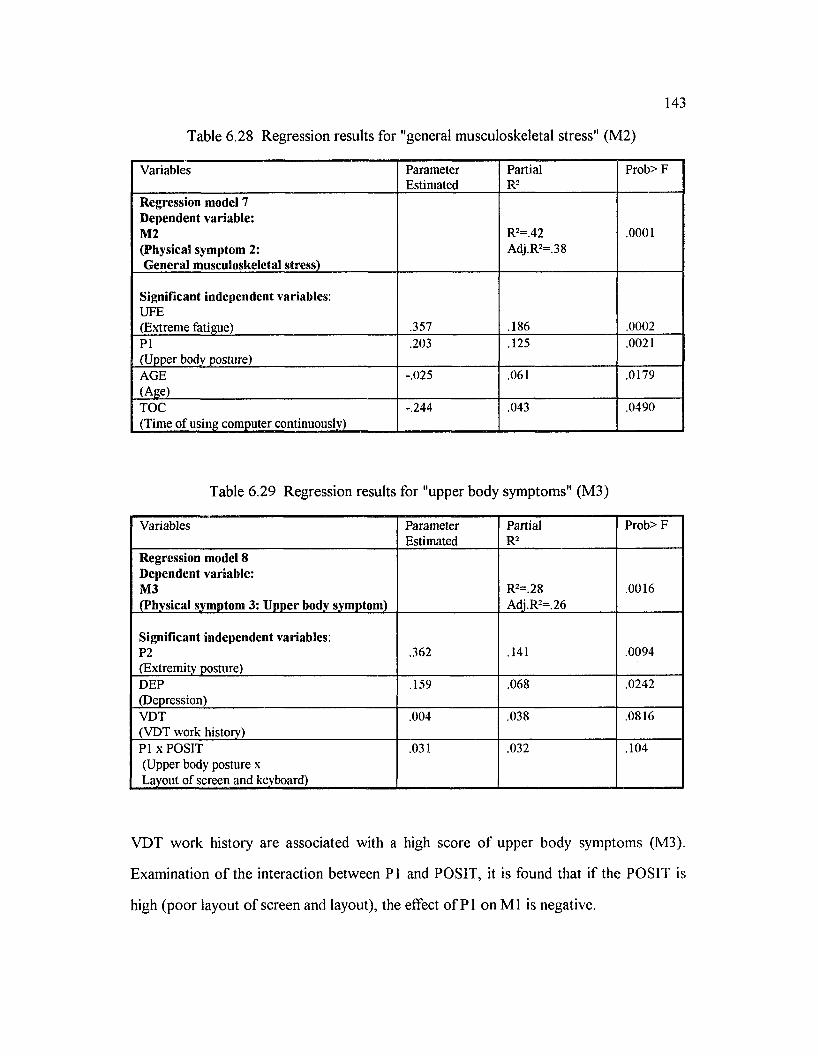
143
Table 6.28 Regression results for "general musculoskeletal stress" (M2)
Variables ParameterEstimated
PartialR2
Prob> F
Regression model 7 Dependent variable:M2(Physical symptom 2:General musculoskeletal stress)
R2=.42Adj.R2=.38
.0001
Significant independent variables: UFE(Extreme fatigue) .357 .186 .0002PI(Upper body posture)
.203 .125 .0021
AGE(Age)
-.025 .061 .0179
TOC(Time of using computer continuously)
-.244 .043 .0490
Table 6.29 Regression results for "upper body symptoms" (M3)
Variables ParameterEstimated
PartialR2
Prob> F
Regression model 8 Dependent variable:M3(Physical symptom 3: Upper body symptom)
R2=.28Adj.R2=.26
.0016
Significant independent variables: P2(Extremity posture)
.362 .141 .0094
DEP(Depression)
.159 .068 .0242
VDT(VDT work history)
.004 .038 .0816
PI x POSIT (Upper body posture x Layout of screen and keyboard)
.031 .032 .104
VDT work history are associated with a high score o f upper body symptoms (M3).
Examination o f the interaction between PI and POSIT, it is found that if the POSIT is
high (poor layout o f screen and layout), the effect o f PI on M l is negative.
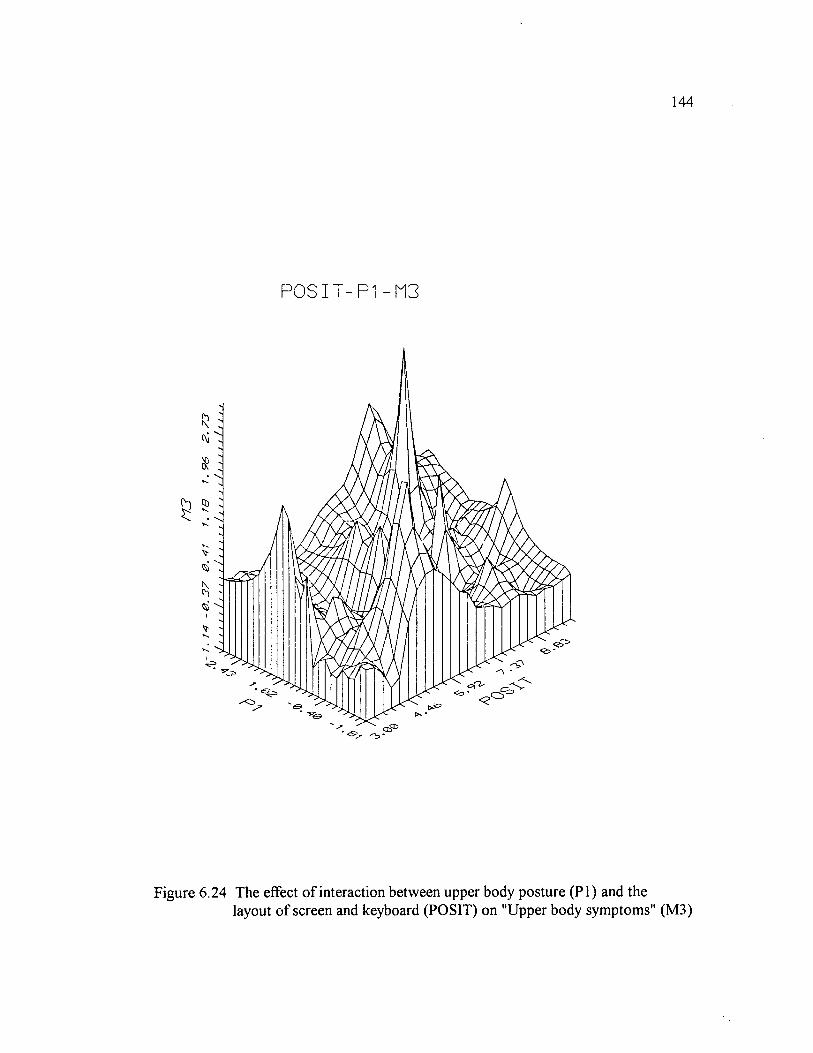
M3
144
P O S I T - P 1 - M3
Figure 6.24 The effect o f interaction between upper body posture (P I) and thelayout o f screen and keyboard (POSIT) on "Upper body symptoms" (M3)
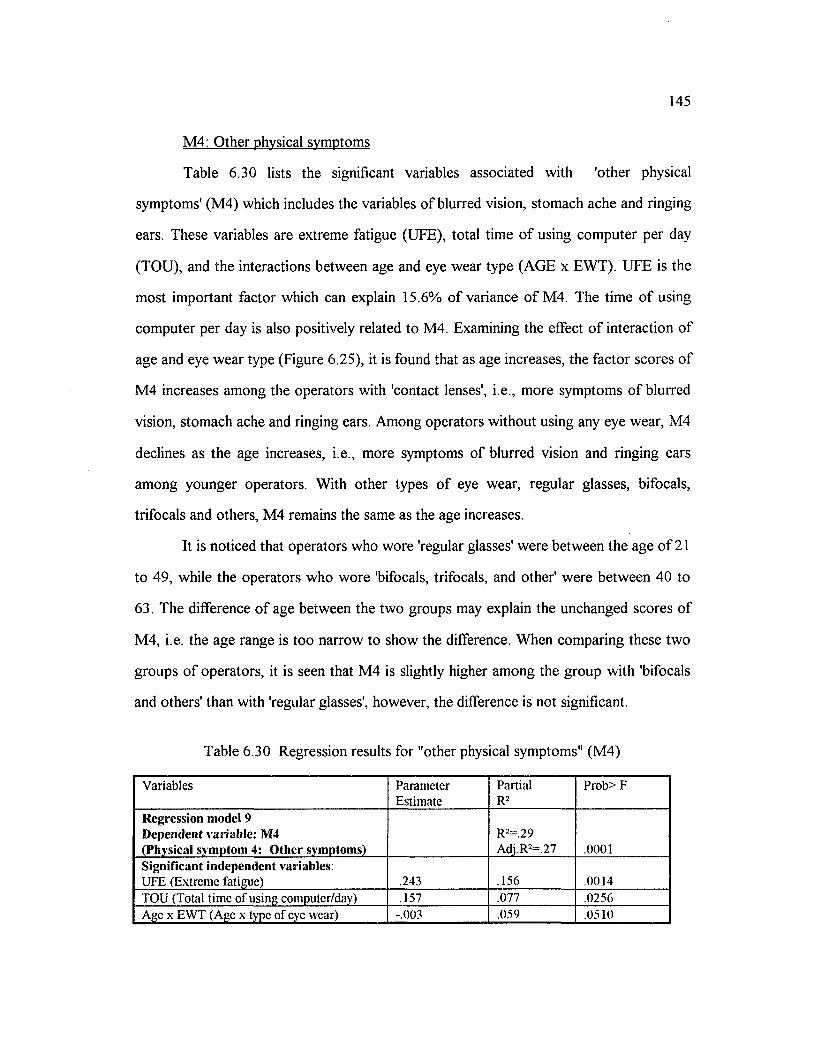
145
M4: Other physical symptoms
Table 6.30 lists the significant variables associated with 'other physical
symptoms' (M4) which includes the variables o f blurred vision, stomach ache and ringing
ears. These variables are extreme fatigue (UFE), total time o f using computer per day
(TOU), and the interactions between age and eye wear type (AGE x EWT). UFE is the
most important factor which can explain 15.6% o f variance o f M4. The time o f using
computer per day is also positively related to M4. Examining the effect o f interaction o f
age and eye wear type (Figure 6.25), it is found that as age increases, the factor scores o f
M4 increases among the operators with 'contact lenses', i.e., more symptoms o f blurred
vision, stomach ache and ringing ears. Among operators without using any eye wear, M4
declines as the age increases, i.e., more symptoms o f blurred vision and ringing ears
among younger operators. With other types o f eye wear, regular glasses, bifocals,
trifocals and others, M4 remains the same as the age increases.
It is noticed that operators who wore 'regular glasses' were between the age o f 21
to 49, while the operators who wore 'bifocals, trifocals, and other' were between 40 to
63. The difference o f age between the two groups may explain the unchanged scores o f
M4, i.e. the age range is too narrow to show the difference. When comparing these two
groups o f operators, it is seen that M4 is slightly higher among the group with 'bifocals
and others' than with 'regular glasses', however, the difference is not significant.
Table 6.30 Regression results for "other physical symptoms" (M4)
Variables ParameterEstimate
PartialR2
Prob> F
Regression model 9Dependent variable: M4(Physical symptom 4: Other symptoms)
R2=.29Adj.R2= 2 7 .0001
Significant independent variables: UFE (Extreme fatigue) .243 .156 .0014TOU (Total time of using computer/day) .157 .077 .0256Age x EWT (Age x type of eye wear) -.003 .059 .0510
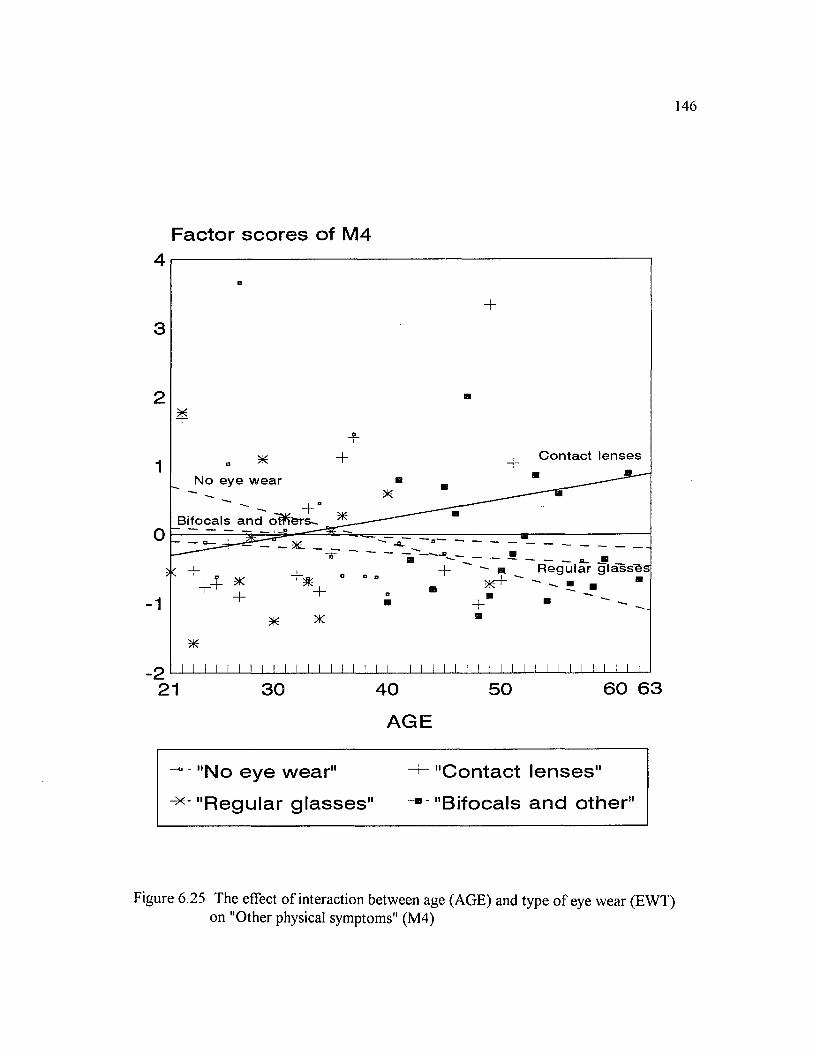
146
Factor scores of M 4
D
+
■
¥-SLI
* + _j Contact lenses
No eye wear H " ____^
Bifocals and o^ers-^_^___
” V * -
— — — :— — o __ B _B — ^ — a ~ - B _
+ «. Regular glasses
■ + " "* * a
*
I I I I I ................................... ! I I I I I M I M I I I I II I I ! I II I I
21 30 40 50 60 63
A G E
"No eye wear" -+" "Contact lenses"
"Regular glasses" -* "Bifocals and other"
F ig u re 6 .2 5 T h e e ffec t o f in te rac tio n b e tw een age (A G E ) and ty p e o f eye w e a r (E W T )o n "O th e r physica l sym ptom s" (M 4 )
CHAPTER 7
DISCUSSION
7.1 RESEARCH MODEL
This study represents an attempt to explain the relationship between the risk
factors in a VDT workstation system and their effect on physical symptoms experienced
by VDT operators.
It was hypothesized that the interaction o f the system components have effects
on the physical symptoms via their effect on the awkward work posture and
psychological stress. Awkward work posture and psychological stress are directly related
to physical symptoms. It was also hypothesized that interactions exist among both the
risk factors and physical symptoms.
7.1.1 PHYSICAL SYMPTOMS
As Figure 6.12 shows, the three categories o f physical symptom variables are
correlated with each other. This confirms the Hypothesis I in Chapter 5. This relationship
was also found by other studies among VDT operators (Lu et al. 1993a and 1993b). This
relationship may exist because these physical symptoms are pathologically related to each
other. For example, visual symptoms and neck pain may cause headache (Zacharkow,
1988). It might also suggest that operators who have one type o f physical discomfort are
more sensitive to or tend to report on other types o f physical symptoms.
Factor analysis shows four (4) factors among the physical symptoms; i.e. ocular
discomfort (M l), general musculoskeletal symptoms (M2), upper body discomfort (M3),
and other physical symptoms (M4). The variables o f the four factors are a little different
1 47
148
from the original classifications (Figure 4.1 and Figure 5.3). For visual symptoms defined
in the research model, the variable "blurred vision" is separated from M l (ocular
discomfort) in factor analysis. This result is not surprising because all other variables of
"visual symptoms" can be classified as "ocular" symptoms and the "blurred vision" is
usually considered as "perceptual" or "visual" symptom which is the incident o f impaired
vision (Bruno, 1993; Collins, et al., 1990; Howarth and Istance, 1986; Laubli, 1981;
Schleifer, et al., 1990). For musculoskeletal symptoms in the research model, the
variables are divided into two groups, general musculoskeletal symptoms (M2) and
upper body symptoms (M3). In the factor M2, the variables o f "lower back" and
"headache" have the highest loadings. The reason may be that they are all stress related
and are not related to computer use. The regression analysis result shows that this factor
is negatively affected by the duration o f using VDTs continuously. Factor M3 contains
all musculoskeletal symptoms on upper body, i.e., neck, shoulders, upper arms, and
upper back. Among the variables in factor M3, the variable o f "upper back" has the
highest factor loading. For the "general physical symptoms" defined in the research
model, the variable o f "headache" belongs to M2, and "ringing ears" and "stomach ache"
are grouped to factor M4, other physical symptoms. However, the factor loading of
"stomach ache" is low.
In summary, the three categories o f physical symptoms are correlated. A four-
factor pattern is found among the physical symptoms.
7.1.2 PSY C H O LO G IC A L STRESS
The measurements for psychological stress are extreme fatigue, anxiety, and
depression. It was hypothesized that psychological stress had a direct effect on physical
symptoms (Hypothesis II). Canonical correlation analysis shows that psychological stress
is significantly related to all three categories o f physical symptoms (Figure 6.5).
However, the regression analy sis shows that only one o f these three variables is selected
149
by the regression models for M2 (general musculoskeletal stress), M3 (upper body
symptoms) and M4 (other physical symptoms) (see Table 6.28, 6.29 and 6.30) and none
o f them is selected for M l (ocular symptoms). The above results can be explained as
follows. It is found that these three variables are highly correlated (Table 6.6). Since the
regression model selects the most important predictors, it is reasonable that only one of
the three variables which are highly correlated was selected for M2, M3 and M4. For
M l, the psychological stress variables are not selected because they may not be as
important as other variables (e.g., workstation design and work environment). From the
above results, conclusion can still be made that psychological stress is directly related to
physical symptoms. This result agrees with past studies which found that stress
associated with VDT use contributed to cumulative musculoskeletal disorders (Sauter et
al., 1992; Smith et al., 1981; Smith et al., 1992; Lim and Carayon, 1993).
7.1.3 W O R K IN G POSTURE
It was hypothesized that working posture is related to psychological stress and all
three categories o f physical symptoms.
Canonical correlation analysis shows that working posture is significantly related
to psychological stress, musculoskeletal symptoms, and visual symptoms. However,
working posture is not found to be significantly related to general physical symptoms.
The above results support Hypothesis III by which working posture and psychological
stress are assumed to be correlated. The results also partly support Hypothesis IV where
working posture is assumed to affect physical symptoms directly.
Posture variables are divided into two factors by factor analysis, upper body
posture (P I) and extremity posture (P2). In examining the regression analysis result, it is
found that PI is the significant predictor for "General musculoskeletal symptoms" (M2).
This result may be interpreted to mean that poor upper body posture (deviation from
neutral position at head/neck, trunk and upper arm) contributes to the symptoms at
150
lower back, neck, shoulders, and headache. This result agrees with the findings by other
studies (Boussenna et al. 1982; Grandjean et al., 1982; Hunting et al., 1981; Life and
Pheasant, 1984; Maeda et al., 1982; Sauter et al., 1983; Zacharkow, 1988).
The interaction o f PI and the layout o f screen and keyboard (POSIT) is
significant to "Upper body symptoms" (M3) (Table 6.29). When examining Figure 6.24,
it shows that when the score o f POSIT increases (i.e., the workstation layout is worse),
the score for M3 (upper body symptoms) increases as the score o f PI increases. This
result shows that the effect o f poor working posture on upper body musculoskeletal
symptoms (i.e., the symptoms o f wrist, upper back, neck and shoulder) is more
significant with an improperly designed workstation. In the study by Lim and Carayon
(1993), "Ergonomics risk factors" which includes repetition and awkward postures, were
found directly associated with upper extremity musculoskeletal symptoms. Other studies
show that an increased forward tilt o f the head will result in an increased static loading o f
the posterior neck muscles, as well as an increase in the cervical spine compression
forces (Chaffin, 1973; Less and Eickelberg, 1976). However, no previous research is
found which examines the interaction o f working posture and workstation design.
It is also found that P2 is significant to "Ocular discomfort" (M l) (Table 6.27).
The effect o f awkward working posture on ocular symptoms may be because o f the
change o f viewing distance to the display, keyboard, and document. It was expected that
upper body posture might contribute to the ocular symptoms since poor trunk posture
may lead to close viewing distance and cause eye fatigue. However, this relationship is
not significant for the present data.
No significant relationship was found between the working posture and the other
physical symptoms (i.e., blurred vision, ringing ears, and stomach ache). This result is
not surprising because the above physical symptoms may not have a direct relationship
with the working posture.
151
From the above analysis, it is concluded that working posture is directly related
to the musculoskeletal and ocular symptoms but not the "other physical symptoms".
7.1.4 D EM O G RA PH ICS
The significant relationship between demographics and awkward posture and
psychosocial factors found in canonical analysis suggest that interactions might exist
between demographics, working posture and psychosocial factors.
Among the variables o f demographics, only the variable "Age" and the
interaction o f "Age" and "Eye wear type (EWT)" were found to be significant to the
variables o f physical symptoms. It is noticed that age is negatively related to the "general
musculoskeletal stress (M2) (i.e. discomfort at lower back, neck, shoulders, and
headache)." This finding agrees with that o f the study by Sauter (1984) where the
increasing age was found to predict reduced strain. The effect is said to attribute to
survival, "healthy worker" effect (Sauter, 1984).
The interaction o f "Eye wear type" (EWT) and "Age" is found to be related to
'other physical symptoms'. It indicates that with different eye wear type, the effect o f age
on the physical symptoms is different. It is noticed that the factor score o f M4 increases
as the age increases among the operators with "contact lenses "(Figure 6.25).
It is found that the variable o f "Sex" has significant effect on the "Awkward work
posture" (Table 6.25). The interaction o f sex and work pressure factor (SEX*S2) on
work posture was also found. Other interactions between demographics variables and
psychosocial factors on physiological stress were found (i.e., Age*Work pressure and
Sex*Work pressure factor).
The above results partially support Hypothesis VI where demographics variables
are assumed to interact with task, workstation design, work environment, and
psychosocial factors. Hypothesis V is also partially supported by the effect of
demographics on work posture and psychological stress.
152
7.1.5 TASK
The canonical correlation analysis shows that the task variables which include the
type o f VDT tasks, working hours/day, time o f using computer continuously, and total
time o f using computer per day are significantly correlated with visual symptoms and
work environment. This finding is reasonable because the task variables defined here
represent the amount and forms o f exposure to VDTs which have been found to be
related to visual symptoms by past research (Laubli and Grandjean, 1984). The
relationship between task variables and work environment variables suggest that
interactions might exist between these two sets o f variables and have influence on the
physical symptoms.
Task variables are also found to be related to all variables o f psychological stress,
and the interactions exist between task variables, workstation design and demographics
variables. It is noticed that the variable WHD (working hours/day) is associated with the
posture factor P2 (extremity posture which includes the variables o f lower arms, wrists
and feet). This may suggest that poor extremity posture may be the result o f fatigue
caused by longer working hours.
The above findings support the hypothesis VII where task variables are assumed
to be associated with awkward posture and psychological stress.
7.1.6 WORKSTATION DESIGN
The variables o f workstation design have significant relationship with awkward
work posture, psychological stress, and visual symptoms. However, the relationships
between workstation design and musculoskeletal symptoms, and workstation design and
general physical symptoms are not significant. This might suggest that musculoskeletal
symptoms are affected by workstation variables indirectly via their impact on work
posture and physiological stress. In examining the canonical variables o f workstation
design and visual symptoms, it was found that the most important variables related to
153
visual symptoms were screen glare variables. The relationship between workstation
design and work environment is also determined by screen glare variables and light
conditions.
The above result supports the hypothesis which assumed that the workstation
variables are associated with awkward posture and psychological stress.
7.1.7 WORK ENVIRONMENT
Work environment variables are significantly related to task variables,
workstation design, psychosocial factors and psychological stress. This result suggests
that work environment variables have interactions with many components in the VDT
systems to affect physical symptoms. The interaction between the variable o f luminance
around VDT (LUM) and eye wear type (EWT) is found to be significant to the
psychological stress variable and extreme fatigue (UFE). The variable IUM (average
illumination level around VDT) is found to be related to both factors o f "awkward
posture", upper body posture (PI) and extremity posture (P2). The regression analysis
(Table 6.25) also indicates that the variable o f "comfort with work space" is a predictor
for extremity posture. The more cramped the space that an operator has, the poorer the
posture. The above results support the Hypothesis IX which assumed that work
environment variables be associated with posture and psychological stress.
Work environment variables are also found to directly affect visual symptoms.
The variable LUM (average luminance around VDT) is found to be negatively associated
with the 'Ocular discomfort'(Ml). The result can be interpreted that VDT operators feel
more comfort with brighter background.
The variable o f "comfort with temperature, humidity and ventilation conditions"
was found to be related to the "headache" and "extreme fatigue". This result suggests
that the environment is related to the physical and psychological stress.
154
The variable o f "noise level" was not found to be related to any physical
symptoms. This may be because that the variations o f this variable is not large enough
for testing the effect although the noise level was observed higher in the Business Office
o f OLL than other offices. Another reason may be that the information from the
measurement (questionnaire) is not enough for testing the effect. More variables should
be used including some objective measurement.
7.1.8 PSYCHOSOCIAL FACTORS
Psychosocial factors are significantly related to many sets o f variables which
include demographics, work environment, awkward posture, psychological stress, visual
symptoms, and general physical symptoms (Table 6.22 and Figure 6.13). This finding
suggests that psychosocial factors are important variables that affect operators' health
complaints.
Kalimo (1987) states that psychosocial factors are critical in both the causation
and the prevention o f disease and in the promotion o f health. Many past studies conclude
that psychosocial aspects o f the workplace contributing to both physical symptoms and
psychological stress (Bergqvist et al., 1990; NIOSH, 1992; Sauter, et al. 1992; Smith et
al. 1992). The above result agrees with the findings o f past studies. In addition, it shows
that psychosocial factors are not only important risk factors which affect the work
postures, psychological stress and physical stress in a VDT workstation system but also
important risk factors that interact with other system components. The effect o f the
interaction o f psychosocial factors with other factors is complicated.
7.2 THE MOST IMPORTANT RISK FACTORS AT VDT WORKSTATION
7.2.1 RISK FACTORS TO PHYSICAL SYMPTOMS
As discussed in Chapter 6 , the physical symptoms were classified into four
different categories after factor analysis, i.e. ocular discomfort (M l), general
musculoskeletal symptoms (M2), upper body symptoms (M3), and other physical
155
symptoms (M4). This classification is slightly different from previous classification o f the
physical symptoms in the research model where the physical symptoms were classified
into three groups. The advantage o f this classification, as derived from factor analysis, is
that the variables within each group are highly correlated and can be explained
statistically by a common factor. Another advantage is that the four factors are
orthogonal (not correlated), multiple regression analysis can be applied instead of
multivariate multiple regression. The analysis and interpretation can therefore be
simplified.
The variables associated with the physical symptoms determined by regression
analysis can be considered as the most important risk factors among others. These
factors are discussed below for the above four categories o f physical symptoms.
7.2.1.1 OCULAR DISCOMFORT
Ocular discomfort includes the symptoms o f tired eyes, burning eyes,
tearing/itching eyes, and dry eyes. Screen glare (SCREEN) is the most important factor
related to visual symptoms. The interaction o f TOC and POSIT (time using computer
continuously and position o f screen and keyboard) is another important factor
accounting for the variance o f ocular discomfort. It suggests that as the time o f using
computer increases, the ocular discomfort increases. Luminance and illuminance around
VDT workstations are also important factors for ocular discomfort. Discomfort with
illumination level and low luminance level are associated with ocular discomfort. Job
satisfaction and extremity posture also contribute to the symptoms.
Interestingly, the symptom of 'blurred/double vision' which was defined as a
visual symptom does not belong to this factor. However, it was not surprising because
this symptom was also found to be apart from 'ocular symptom' and was called
'perceptual symptom' by other researchers (Schleifer et al., 1990).
156
In summary, many factors contribute to ocular discomfort. The important risk
factors for ocular discomfort at VDT workstation include factors o f workstation design,
lighting conditions, psychosocial factors, posture and time o f using computer
continuously.
7.2.1.2 GENERAL MUSCULOSKELETAL SYMPTOMS
General musculoskeletal symptoms include the symptoms o f low back, headache,
neck and shoulders. Extreme fatigue is the most important factor in this category of
discomfort. Another important risk factor is upper body posture (PI). The poorer the
upper body posture (i.e., increased head/neck tilt, increased trunk angle and upper arm
angle) the more risk o f musculoskeletal complaints at lower back, neck, shoulder areas
and headache. Age is also a risk factor to the general musculoskeletal symptoms.
7.2.1.3 UPPER BODY MUSCULOSKELETAL SYMPTOMS
This category o f variables includes all the symptoms above the low back, i.e.
neck, shoulders, wrists, and upper back. As Tables 6.29 indicates that the extremity
posture accounts for a large amount o f variance o f the upper body musculoskeletal
symptoms. This result suggests that deviation from neutral position o f low arms affects
the upper body musculoskeletal symptoms. Another risk factor is depression, a
psychological stress factor. This result supports Hypothesis II that psychological stress
may affect musculoskeletal discomfort. This finding agrees with the result o f another
study by Lim and Carayon (1993). VDT work history is also an important factor to the
upper body symptoms. This result suggests that poor upper body posture at VDT
workstation may result from long-time computer use. Upper body posture interacting
with the layout o f screen and keyboard also affects the upper body symptoms.
To summarize, the important risk factors to upper body symptoms (i.e.,
musculoskeletal complaints at neck, shoulder, upper back and wrist area) are awkward
157
posture, VDT work history, psychological stress and the interaction between upper
body posture and the layout o f screen and keyboard.
7.2.1.4 OTHER PHYSICAL SYMPTOMS
This category include the symptoms o f blurred vision, ringing ears and stomach
ache. These results indicate that fatigue is the most important factor for this category o f
variables. This result suggests that these symptoms are stress related. Another risk factor
is the total time spent using the computer per day. The longer time using a computer is
associated with higher scores for "other physical symptoms." This result suggests that
long time computer use is related to stress. The interaction o f age and the type o f eye
wear also affects the "other physical symptoms." Examination o f the interaction found
that operators wearing contact lenses have high complaints o f these symptoms.
The risk factors to the "other physical symptoms" can be summarized as
psychological stress, length o f time using computer and demographics.
7.2.2 RISK FACTORS TO AWKWARD WORK POSTURE
The most important risk factors to upper body posture, i.e., head/neck, trunk and
upper arm posture, are the interaction of the layout o f screen and keyboard and screen
glare. For poor workstation design, the screen glare is more significant to affect upper
body posture. Other risk factors are sex, average illumination level at workstation and
the interaction between sex and work pressure factor (S2). The most important risk
factors to extremity posture are the interaction o f sex and work pressure factor (S2),
comfort with work space, working hours per day, time o f using computer continuously
and the illumination level at VDT workstation. The above risk factors come from the
categories o f workstation design, demographics, tasks, work environment and
psychosocial factors. The results indicate that working posture is determined by the
interaction o f many factors in the work place. Among these factors that affect work
posture, the features o f workstation layout (e.g. the height, orientation, and location of
158
VDT, keyboard and supporting surface) are most important as these factors determine
how a worker must position his/her body when performing a task. Many past studies
have found that a poorly designed workstation is associated with increasing
musculoskeletal complaints from VDT operators (Hunting et al., 1981; Maeda et al.,
1982; Sauter et al., 1983), although the present study did not folly confirm this for the
neck, shoulders and lower back.
7.2.3 RISK FACTORS TO PSYCHOLOGICAL STRESS
Many factors affect psychological stress (Table 6.26). These factors include
psychosocial factors, work environment, workstation design, tasks and demographics.
Among these factors, psychosocial factors, i.e. job satisfaction and work pressure
factors, are most important for all the variables used to measure psychological stress, i.e.
depression, anxiety and extreme fatigue. This result agrees with past studies in which
psychosocial factors are found to be significant predictors o f psychological stress
(Jarvenpaa et al., 1993; Miezio, et al., 1987; Rogers et al., 1990).
7.3 INTERACTIONS AMONG RISK FACTORS
As discussed above, there are many factors that may create harmful loads on an
individual in a VDT workstation system. These factors interact when work is being done.
However, very few studies have examined the interactions o f these risk factors. This
study examined the interactions o f the factors within and between the system
components in the VDT workstation system. Among these interactions, the layout of
screen and keyboard is found to interact with other factors, screen glare, time o f using
computer continuously and extremity posture, and to affect upper body posture, general
musculoskeletal symptoms, ocular discomfort and psychological stress. Psychosocial
factors are important factors interacting with other factors and affecting the
psychological stress and awkward working posture. Among the variables of
demographics, sex and age are the factors that interact with other variables affecting the
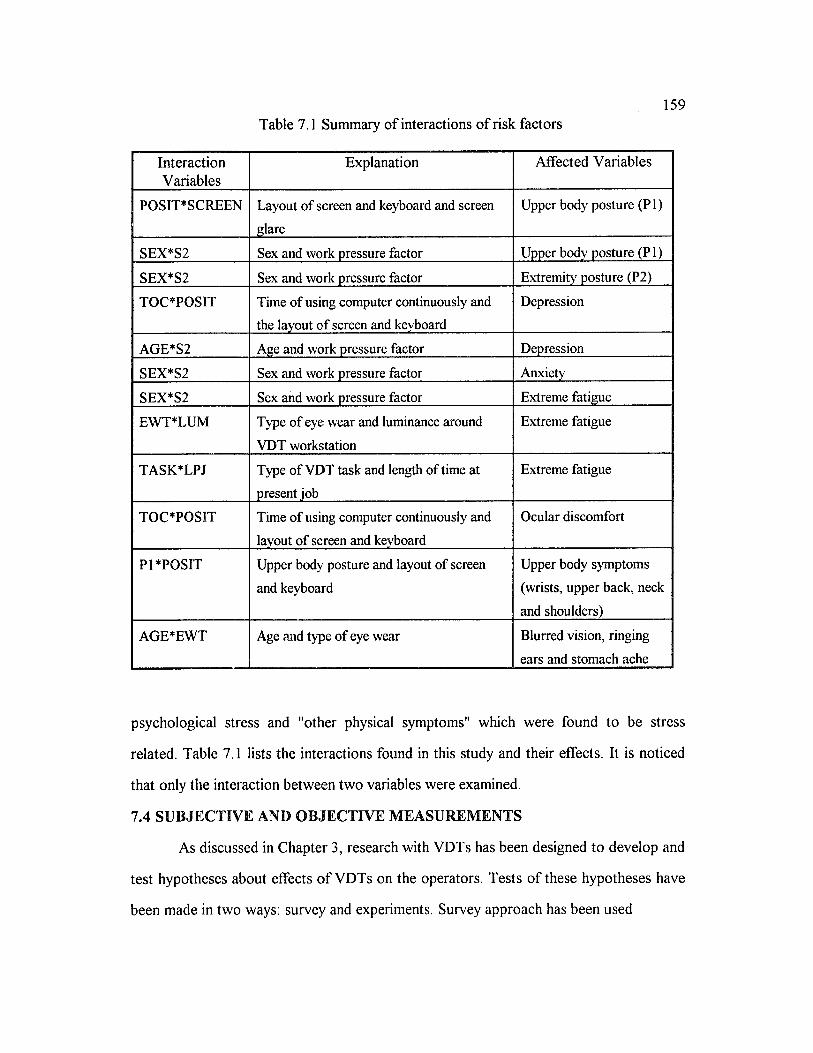
159Table 7.1 Summary o f interactions o f risk factors
InteractionVariables
Explanation Affected Variables
POSFPSCREEN Layout of screen and keyboard and screen
glare
Upper body posture (PI)
SEX*S2 Sex and work pressure factor Upper body posture (PI)
SEX*S2 Sex and work pressure factor Extremity posture (P2)
TOC*POSIT Time of using computer continuously and
the layout of screen and keyboard
Depression
AGE*S2 Age and work pressure factor Depression
SEX*S2 Sex and work pressure factor Anxiety
SEX*S2 Sex and work pressure factor Extreme fatigue
EW PLUM Type of eye wear and luminance around
VDT workstation
Extreme fatigue
TASK*LPJ Type of VDT task and length of time at
present job
Extreme fatigue
TOC*POSIT Time of using computer continuously and
layout of screen and keyboard
Ocular discomfort
Pl*POSIT Upper body posture and layout of screen
and keyboard
Upper body symptoms
(wrists, upper back, neck
and shoulders)
AGE*EWT Age and type of eye wear Blurred vision, ringing
ears and stomach ache
psychological stress and "other physical symptoms" which were found to be stress
related. Table 7.1 lists the interactions found in this study and their effects. It is noticed
that only the interaction between two variables were examined.
7.4 SUBJECTIVE AND OBJECTIVE MEASUREMENTS
As discussed in Chapter 3, research with VDTs has been designed to develop and
test hypotheses about effects o f VDTs on the operators. Tests o f these hypotheses have
been made in two ways: survey and experiments. Survey approach has been used
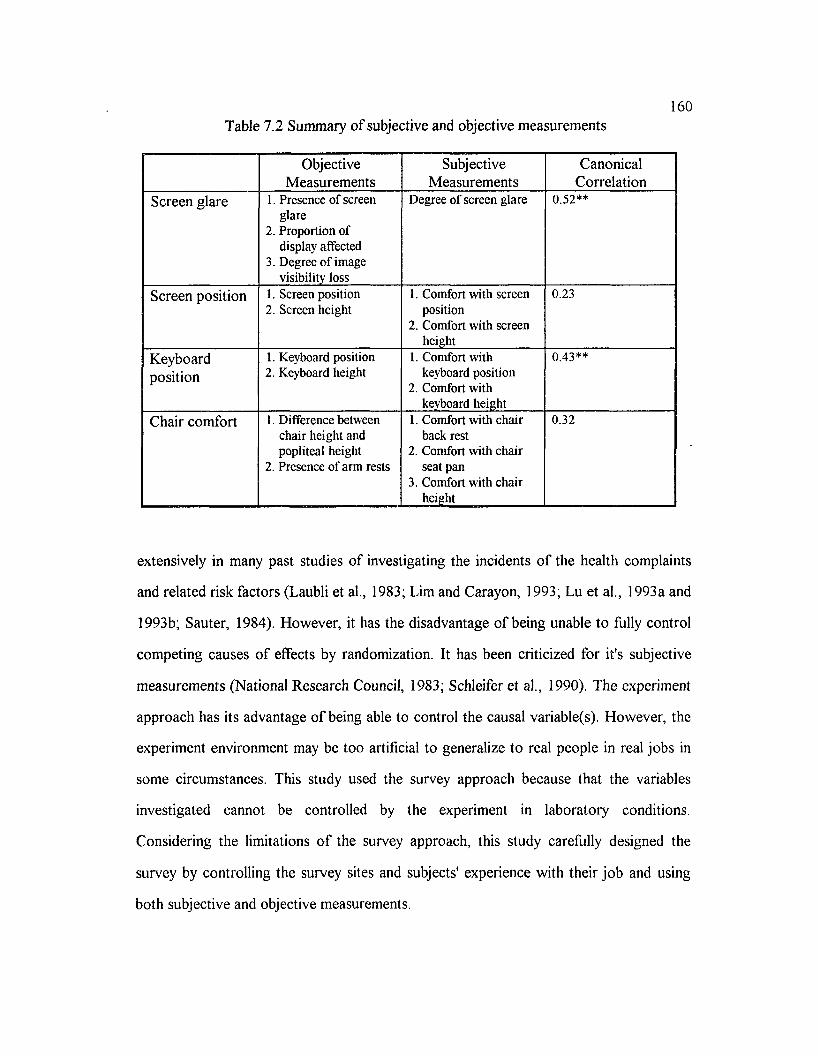
160Table 7.2 Summary o f subjective and objective measurements
ObjectiveMeasurements
SubjectiveMeasurements
CanonicalCorrelation
Screen glare 1. Presence of screen glare
2. Proportion of display affected
3. Degree of image visibility loss
Degree of screen glare 0.52**
Screen position 1. Screen position2. Screen height
1. Comfort with screen position
2. Comfort with screen height
0.23
Keyboardposition
1. Keyboard position2. Keyboard height
1. Comfort with keyboard position
2. Comfort with keyboard height
0.43**
Chair comfort 1. Difference between chair height and popliteal height
2. Presence of arm rests
1. Comfort with chair back rest
2. Comfort with chair seat pan
3. Comfort with chair height
0.32
extensively in many past studies o f investigating the incidents o f the health complaints
and related risk factors (Laubli et al., 1983; Lim and Carayon, 1993; Lu et al., 1993a and
1993b; Sauter, 1984). However, it has the disadvantage o f being unable to folly control
competing causes o f effects by randomization. It has been criticized for it's subjective
measurements (National Research Council, 1983; Schleifer et al., 1990). The experiment
approach has its advantage o f being able to control the causal variable(s). However, the
experiment environment may be too artificial to generalize to real people in real jobs in
some circumstances. This study used the survey approach because that the variables
investigated cannot be controlled by the experiment in laboratory conditions.
Considering the limitations o f the survey approach, this study carefully designed the
survey by controlling the survey sites and subjects' experience with their job and using
both subjective and objective measurements.
161
The subjective measures used in this study were subjective reports o f health
complaints and subjective evaluations o f the work place environment by using a careful
designed questionnaire. The objective measures used in this study were the
measurements o f workstation and lighting conditions and posture analysis. To examine
the relationship between subjective and objective measurements o f workstation and
physical work environment, canonical correlation analysis was used. It is found that
subjective and objective measurements are significantly correlated. However, they should
not be substitute with each other because the variance that can be explained by the other
side o f measurement is low. This finding is important because some researcher tried to
objectively assess glare variables and failed to have any apparent influence on visual
system strain (Schleifer et al., 1990). Table 7.2 summaries the subjective and objective
measures o f workstation and lighting conditions used in this study. It is noticed that
some relationships between subjective and objective measures are not significant. This
may result from the variables chosen for the measurement.
Another objective measurement used by this research was the postural analysis.
This approach is simple and was found to be feasible because reasonable relationships
were found between the postural measurement and other variables. The integration o f
subjective and objective measurements in this study is summarized in Figure 7.1.
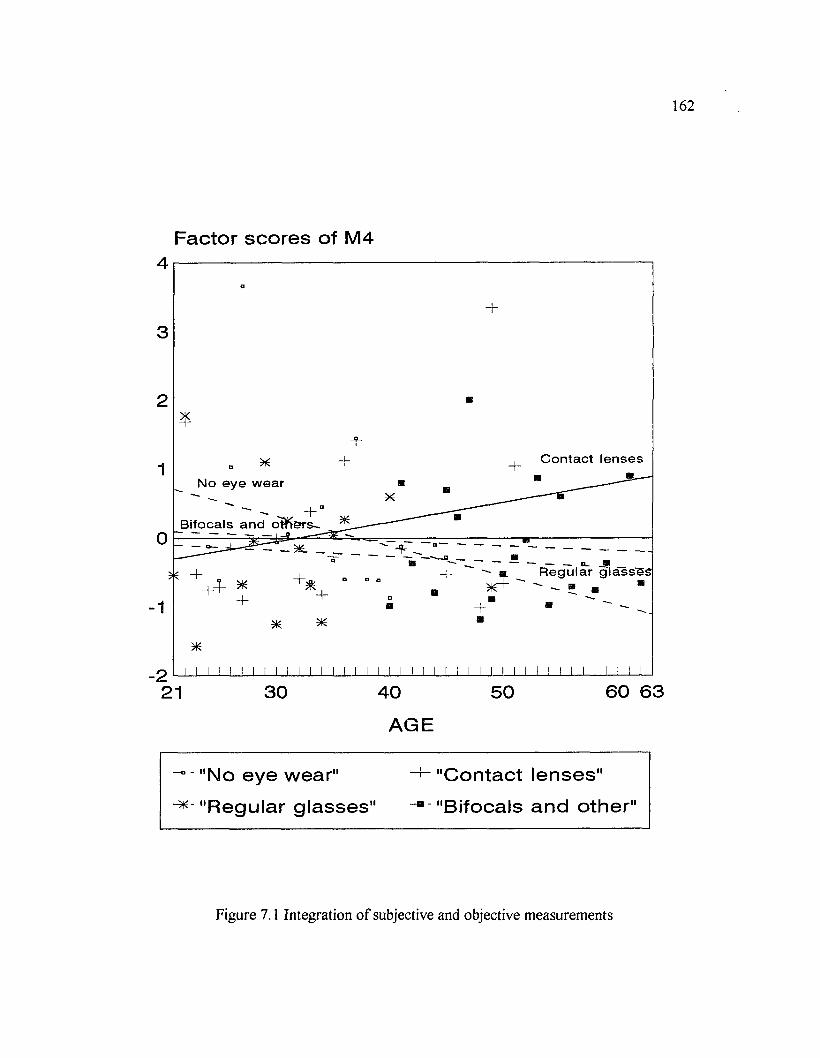
162
Factor scores of M 4
Contact lenses
No eye wear
Bifocals and outers- '’I
Regular glasses
60 6330 5021 40
A G E
■" "No eye wear" -+- "Contact lenses"
■* "Regular glasses" “■ "Bifocals and other"
Figure 7.1 Integration o f subjective and objective measurements
CHAPTER 8
SUMMARY AND CONCLUSIONS
A literature search shows there is increased concern about the possible "adverse
health effects" caused by VDT work and its environment. The prevalence o f
musculoskeletal disorders and visual fatigue has been recognized; and the contribution o f
ergonomics factors and environment to visual and musculoskeletal complaints in VDT
work is widely identified. However, the interacting relationships between the physical
discomfort and possible risk factors remain undefined. There has been little research to
defined the interrelationships among these risk factors and to rank their relative
importance. The whole picture o f variables affecting the VDT workstation system has
not been made clear.
The objectives o f this research were to determine the most important risk factors
in VDT workstation system associated with physical symptoms and to investigate the
interrelationship among the risk factors.
8.1 RESEARCH PROCEDURE AND MAJOR RESULTS
This research consisted o f the following four stages:
STAGE 1:
Research model development. A conceptual model was developed to present the
interrelationship between the basic components in a VDT workstation system and their
possible health effects. A research model is then proposed to show the hypothesized
relationships among the following categories o f variables: demographics, tasks,
workstation design, work environment, psychosocial factors, awkward work posture,
163
164
psychological stress, musculoskeletal symptoms, visual symptoms and general physical
symptoms. This study investigated the interrelationship among the above ten categories
o f variables comprehensively.
STAGE 2:
Methodology development. In order to evaluate the workstation system
comprehensively, a method which consisted o f a questionnaire, measurement and
checklist, and posture analysis was developed. A questionnaire was designed for
collecting subjective reports o f health symptoms and evaluation o f workstation and work
environment. A checklist and measurement sheet were designed for collecting data of
workstation dimensions, lighting conditions, and anthropometry. A posture analysis
method was also developed for evaluating operators' work postures. By using this
posture analysis method, the body is divided into the following six parts: head/neck,
trunk, upper arms, lower arms, wrists, and legs and feet. Standard postures for each
body part are defined and a risk score is assigned to each standard posture. These body
parts are numbered so that the number one ( 1 ) is given to the working posture or the
range o f movement where the risk factors present are minimal. Higher numbers are
allocated to parts o f the working posture or movement range with more extreme posture
indicating presence o f risk factors causing load on the structures o f the body parts.
STAGE 3
Field study. A field study was conducted among daily computer users at two
different sites, a local hospital and Louisiana State University. This field study consisted
o f three parts, a questionnaire survey, measurements, and video recording o f operators'
work posture. Ninety-three subjects participated in the study. They were all daily
computer uers and they had been at present job for at least three months.
165
STAGE 4:
Data analysis. Data was analyzed using both univariate and multivariate
approaches. Descriptive data shows that the physical symptoms and the symptoms of
psychological stress are prevalent among VDT operators. Over 50% o f the operators
experienced the following symptoms: tired eyes (86.3), extreme fatigue (81.8%),
headache (78%), anxiety (63.7%), neck pain (62.5%), shoulder pain (62%), and tearing
eyes (60.2%). The top complaints that operators experienced daily were: tired eyes
(21.6), shoulder pain (17.2%), neck pain (13.6%), anxiety (11.4%) and headache (8 %).
In order to identify the most important variables used for testing the research model, the
relationship between objective and subjective evaluation o f workstation and environment
was investigated. The results show that the objective and subjective measurements were
significantly correlated but they should not be substituted for each other. Canonical
correlation analysis was applied to investigate the relationship among the ten categories
o f variables under a multivariate environment. The results show that the three categories
o f physical symptoms, i.e. musculoskeletal, visual, and general physical symptoms are
significantly interrelated and the variables related to the each category o f symptoms are
different. Musculoskeletal symptoms are related to awkward posture and psychological
stress; visual symptoms are related to awkward posture, psychological stress,
workstation design, work environment, and psychosocial factors; and the general
physical symptoms are related to psychological stress and psychosocial factors.
Multiple regression method was used to determine the most important factors
related to the physical symptoms and the effect o f interactions among the risk factors.
Factor analysis was applied to the physical symptoms to identify the underlying factors.
Four factors were identified: ocular discomfort, general musculoskeletal symptoms,
upper extremity symptoms, and other physical symptoms. Ocular discomfort is
significantly related to screen glare; general musculoskeletal symptoms and other
physical symptoms are related to fatigue; and upper extremity discomfort is related to
awkward upper body posture. The following interactions among the risk factors are
identified to affect the physical symptoms, the period o f time o f using computer and
workstation layout, work posture and workstation layout, and age and type o f eye wear.
It is found that when the period o f time o f using computer is various, operators have less
complaints about ocular discomfort although the workstation layout is poor. As the time
o f using computer increases, the complaint about ocular discomfort increases among the
VDT operators with both good and bad designed workstation. The complaint o f ocular
discomfort is more among VDT operators with poor designed workstation than that with
good designed workstation. Examination o f the interaction between work posture and
workstation design found that upper body symptom (symptoms in wrist, shoulder and
neck areas) is affected more by poor work posture (extremity posture) as the
workstation design becomes worse.
Risk factors associated with awkward posture and psychological stress were also
identified. Many interactions were found to affect the work posture and psychological
stress, such as, psychosocial factors and demographic variables, workstation design and
working posture. The interaction o f the layout o f screen and keyboard and screen glare
is the most important risk factor for awkward work posture. Psychosocial factors are
identified to interact with other variables and contribute to psychological stress. It is
found that the extremity posture (lower arm, wrist and leg and foot posture) is
significantly affected by work pressure factor (psychosocial factor) among female VDT
operators (F=4.066, df=l, p=0.0482), the higher the work pressure, the more awkward
posture. However, the effect is not significant among male VDT operators. The effect o f
167
psychosocial factors on the psychological stress is also more significant among female
worker than among male workers.
8.2 CONCLUSIONS
In summary, several conclusions can be drawn from this research:
1. The risk factors contributing to different physical symptoms are different and
these factors are inter-related. Screen glare is the most important risk factor contributing
to ocular symptoms; fatigue and awkward posture are the most important risk factors to
general musculoskeletal symptoms; awkward posture is the most important risk factor to
upper body symptoms; and fatigue is the most important factor to other physical
symptoms. The risk factors found in this study are summarized in Table 8 . 1 . The risk
factors in bold are the most important to the health symptoms.
2. Psychosocial factors should not be ignored when examining the workstation
design factors and work environment. Psychosocial factors interact with other variables
and contribute to work posture psychological stress. The effect is more significant
among female workers than among male workers.
3. Workstation design significantly affects working posture which in turn
contributes to physical symptoms.
4. Interactions exist among the risk factors not only within but also between the
seven categories o f risk factors.
5. Both subjective and objective measures should be used in investigating risk
factors in the VDT system.
8.3 THE IMPACT AND CONTRIBUTIONS OF THIS RESEARCH
With the increased use o f computers in offices, VDT operators' health and well
being become an important issue to management, health and safety professionals. The
objective is to provide an environment which increases productivity and work efficiency

168
Table 8.1 Summary o f risk factors in VDT workstation systems
Physical Symptoms Risk FactorsOcular discomfort
• Tearing eyes• Dry eyes• Burning eyes• Tired eyes
• Workstation design:-Screen glare-Layout of screen and keyboard -Time of using computer continuously
• Awkward posture« Psychosocial factor: -Job satisfaction• Work environment:
-Discomfort with illumination -Luminance around workstation
General musculoskeletal symptoms• Lower back• Headache• Neck® Shoulders
• Extreme fatigue• Awkward posture• Age« Time of using computer continuously
Upper body symptoms• Wrists• Upper back• Neck• Shoulders
• Awkward posture• Depression• VDT work history7• Workstation design
Other physical symptoms• Ringing ears• Stomach discomfort• Blurred vision
• Extreme fatigue® Total time of using computer /day » Age• Type of eye wear
Awkward Work Posture• Upper body posture• Extremity posture
• Workstation design• Sex• Work pressure• Illumination level• Comfort with work space• Working hours/day• Time of using computer continuously
Psychological Stress• Depression• Anxiety• Extreme fatigue
• Psychosocial factors:-Job satisfaction -Work pressure factor
• Awkward work posture « Workstation design• Task:
-Time of using computer continuously -Type of VDT tasks
• Demographics:-Sex-Age-Type of eye wear -Length of time at present job
• Work environment:-Luminance around workstation -Comfort with work space

169
and reduces operator health complaints and turn over. To achieve this purpose,
identifying the risk factors in the VDT workstation system is very important for the
development o f prevention strategies. Although numerous studies have been performed
for the investigation o f health complaints and their related risk factors, and many risk
factors have been identified, the interacting relationship among the risk factors has not
been made clear. This study has moved ergonomics research forward by examining the
inter-relationship o f the risk factors more comprehensively. Future research can be
developed based on the conceptual model and the methodology developed in this study.
This study also shows that both the physical and psychosocial environments need
to be considered to optimize operators' health in a VDT workstation system. The most
important factors identified and the interactions among the risk factors described in this
research will be very useful in further effort.
In summary, the contributions o f this research to the investigation o f risk factors
in VDT systems are as follows:
1. Development o f a conceptual model which presents the interaction o f basic
components in a VDT workstation system.
2. Development o f a posture analysis method which can be used to rate the risk
associated with the working posture at VDT workstation.
3. Development o f a method which integrated both subjective measures
(questionnaire) and objective measures (workstation measurement and posture analysis)
for the investigation o f risk factors in the VDT workstation system.
4. Classification o f the physical symptoms into four (4) categories, i.e. ocular
symptoms, general musculoskeletal symptoms, upper body symptoms, and other physical
symptoms.
170
5. Comprehensive examination o f the effect o f both the physical and
psychosocial environment and their interactions to the physical symptoms, awkward
work posture and psychological stress.
The implication o f this research is that both physical and social environment need
to be evaluated and the inter-relationships between the components in a VDT
workstation system need to be understood in order to determine the risk factors to the
physical symptoms.
CHAPTER 9
RECOMMENDATIONS FOR FUTURE WORK
The goal o f identifying risk factors in VDT workstation systems is to help
prevent injury among VDT operators. Figure 9.1 represents a process for achieving this
goal. As a first step, the prevalence o f injury and related cost need to be identified; then
the risk factors for these physical symptoms need to be determined. After identifying the
most important risk factors, the process which identifies how these risk factors can lead
to injury need to be researched and the cutoff scores need to be determined. Finally,
prevention strategies can be developed based on the above mentioned quantitative
results.
Many studies have been conducted to identify the prevalence o f the physical
symptoms. Many studies have also investigated the related risk factors associated with
the physical symptoms. This study investigated comprehensively the risk factors
associated with physical symptoms, work posture and psychological stress by examining
both the physical and social environment. As a result o f the study, the relationship among
the many complex musculoskeletal, visual, psychological and environmental variables for
the VDT user are understood better.
Based on this study, the followings are recommended for further investigation:
1. Validation o f the conceptual and research models developed in this study.
Further field and laboratory studies are needed to validate the relationships presented in
this research. The variables in each category o f the system components need to be
171
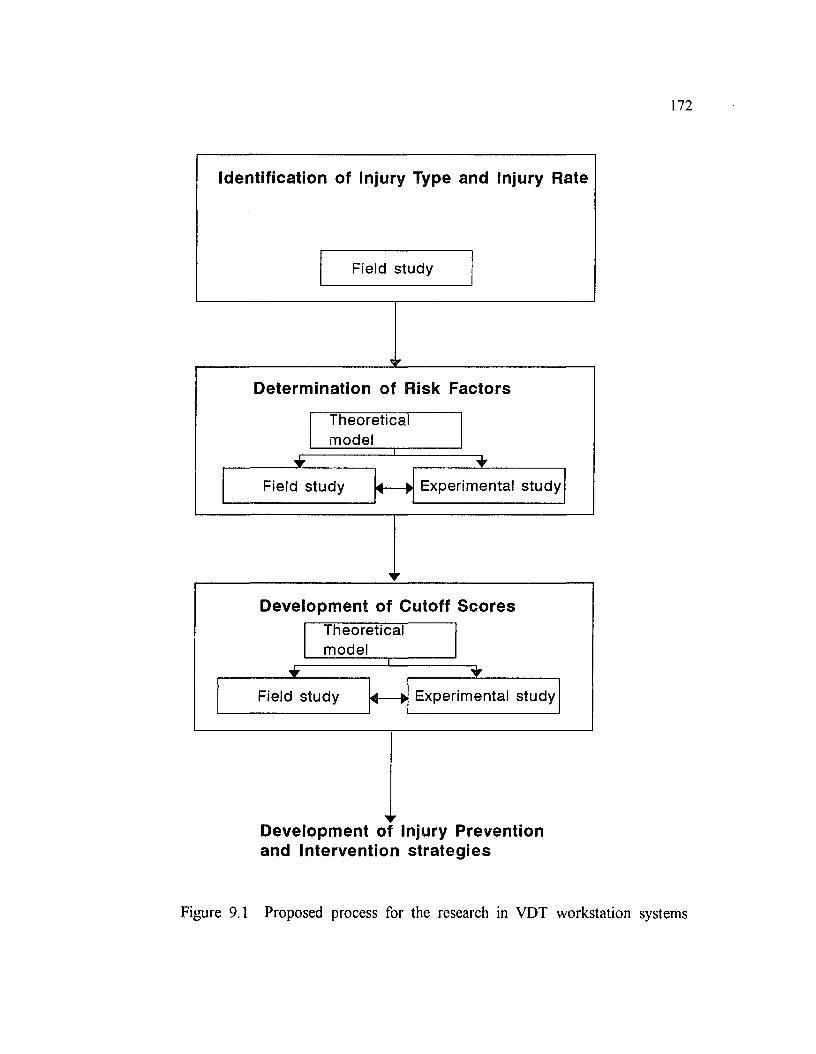
172
Field study
Field study Experimental study
Theoreticalmodel
Identification of Injury Type and Injury Rate
Determ ination of Risk Factors
Developm ent of Cutoff ScoresTheoreticalmodel
Field study Experimental study
Developm ent o Injury Preventionand Intervention strategies
Figure 9.1 Proposed process for the research in VDT workstation systems
173
further defined and examined. Future experimental studies should be developed for
validating the relationship among the components o f the physical work environment,
which include workstation design, lighting conditions and other environmental variables
and their possible effects.
2. Interactions among risk factors. Much work has been done to identify the risk
factors and examine their effects on the VDT operators health in the literature. However,
very few studies have identified and examined the interactions o f the risk factors. Since
the variables in the VDT systems do not exist independently, their effects should also be
examined simultaneously, especially the interacting relationship between the physical and
social environment.
3. Understanding the injury process. The process o f the exposure to the risk
factors and the resulted injury need to be researched and understood. A quantitative
description o f all the human components are o f all the risk factors is not yet possible.
However, the process o f the exposure to some risk factors, such as repetition and
duration, and potential injuries to muscles, tendons, and nerves should be studied and
quantified.
4. Development o f reasonable injury prevention cutoff scores. Once we identify
the risk factors and understand the potential injury process, it is imperative to develop
the reasonable injury prevention cutoff score for work duration and musculoskeletal
stress. Intervention and prevention strategies can therefore be developed.
REFERENCES
Andersson, G., Ortengren, R. and Herberts, P., 1977, Quantitative electromyographic studies o f back muscle activity related to posture and loading. Orthopedic Clinics North Amer., 8 , 85-96.
Armstrong, T., 1986, Ergonomics and cumulative trauma disorders. Hand Clinics, 2, 553-565.
Asakura, T., and Fujigaki, Y., 1993, The impact o f computer technology on job characteristics and workers' health. In: Michael J. Smith and Gavriel Salvendy (Eds.), Human-Computer Interaction: Applications and Case Studies. Elsevier Science Publishers B.V., 982-987.
Barker, Harry, and Barker, Barbara, 1983, Multivariate Analysis o f Variance (MANOVA) - A Practical guide to Its Use in Scientific Decision Making. The University o f Alabama Press, Alabama.
Bergqvist, Ulf, and Knave, Bengt, 1993, Is the outcome o f a woman's pregnancy influenced by her work at a VDU? In Michael J. Smith and Gavriel Salvendy (Ed ): Human-Computer Interaction: Applications and Case Studies. Elsevier Science Publishers B.V., 740-745.
Bergqvist, Ulf, Nisson, Birgitta, Voss, Margaretha, Wibom, Roger, and Wolgast, Ewa. 1990. Discomforts and disorders among office workers using visual display terminals - a longitudinal study. In Work with Display Units 89 (edited by L.Berlinguet and D. Berthelette), Elsevier Science Publishing Company Inc, New York, 1-11.
Bergqvist, U.O.V., 1984. Video display terminals and health. Scandinavian Journal of W ork Environment Health, 10, Supplement 2.
Bonnell, J.A. 1987. VDT's and heath fact or fancy. In Work With Display Units 8 6 , (B. Knave P. -G. Wideback ed ). Elsevier Science Publishers. 3-5.
Boussenna, M., Corlett, E.N., and Pheasant, S T., The relation between discomfort and postural loading at the joints. Ergonomics, 25, 315-322.
Brand, Jay L., and Judd, Kenneth W., 1993, Angle o f Hard Copy and Text - Editing Performance. Human Factors, 35(l):57-69
1 7 4
175Brown, B.S., Dismukes, K., and Rinalducci, E.J., 1982, Video display terminals and vision o f workers. Behavior and Information Technology. 1, 121-140.
Bruno, Piccoli, 1993. Eye discomfort and "VDT" work. In Human-computer Interactio Applications and Cases Studies, edited by Michael J. Smith and Gavriel Salvendy, Elsevier Science Publishers B.V., pp.722-727.Bureau o f National Affairs, Inc. 1984, VDTs in the Workplace: A Study o f the Effects on Employment. A BNA special report. Washington, D C.
Cakir, A., Hart, D.J., and Stewart, T.F.M., 1980, Visual display terminals. John Wiley and Sons.
Cakir, A., Reuter, J.H., Von Schmude, L., Armbruster, A. and Shultie, L.B., 1978, Investigations o f the Accommodation o f Human Psychic and Physical Functions to Data Display Screens in the Workplace (Bonn, West Germany. Der Bundesminster fur Arbeit und Aozialordnung).
Carayon, Pascale, 1992, A longitudinal study o f job design and worker strain: Preliminary results. In James Campbell Quick, Lawrence R. Murphy, and Joseph J. Hurrell, Jr. (Eds.) Stress & Well-Being at Work: Assessments and interventions for occupational mental health. American Psychological Association, Washington, DC. 19- 32.
Carayon, Pascale, Jarvenpaa, Eila, and Hajnal, Catherine, 1993, Effect o f job control on the design o f jobs and stress among computer users. In Michael J. Smith and Gavriel Salvendy (Eds.): Human-Computer Interaction: Applications and Case Studies. Elsevier Science Publishers B.V., 863-868.
Chaffin, D.B., 1973, Localized muscle fatigue-definition and measurement. Journal of Occupational Medicine, 15, 346-354.
Chaffin, D.B., and Andersson, Gunnar B. J., 1991, Occupational Biomechanics. John Wiley & Sons, Inc., 280.
Corlett, E.N. 1990, Static muscle loading and the evaluation o f posture, in Wilson, J R. and Corlett, E.N. (eds) Evaluation o f human work. Taylor &Francis, London, 542-570.
Corlett, E.N. and Bishop, R.P. 1976, A technique for assessing postural discomfort. Ergonomics, Vol. 19, 175-182.
Collins, M., Brown, B., Bowman, K., and Carkeet, A., 1990, Workstation variables and visual discomfort associated with VDTs. Applied Ergonomics, 21.2, 157-161.
176Corlett et al., Madeley, S.J., and Manenica, I., 1979, Posture targeting: a technique for recording working postures. Ergonomics, 22, 357-366.
Coniglio, Ivana, and Paci, Anna Maria, 1987, Ergonomic field analysis o f the software design workstation. Behavior and Information Technology. 6 , 369-379.
Committee on cervicobrachial syndrome in JAIH, 1973, The report on the committee in 1972, Japanese Journal o f Industrial Health, 15, 304-311.
DainofF, M.J., 1983, Video display terminals. The relationship between ergonomics design, health complaints and operator performance. Occupational Health Nursing, 31, 29-33.
DainofF, M.J., 1984a, Ergonomics o f office automation - a conceptual overview. In Matthews, M.L., and Webb, R.D.G. (Eds ): Proceedings o f the 1984 International Conference on Occupational Ergonomics, vol.2. Toronto, Ontario, Canada, May 7-9, 72-80.
DainofF, M.J., 1984b, Some issues surrounding the design o f ergonomics office chairs. In cohen, B.G.F (Ed.): Human Aspects in Office Automation. Amsterdam, Elsevier, 143- 151.
Delvolve, N., and Queinnec, Y., 1983, Opertors' activities at CRT terminals: a behavioral approach. Ergonomics, 26, 329-340.
De Groot, Jan P., and Kamphuis, Andre, 1983. Eyestrain in VDU users: physical correlates and long-term effects. Human Factors, 25(4), 409-413.
Feldman, R., Goldman, R., and Keyserling, W., 1983, Peripheral Nerve Entrapment Syndromes and Ergonomic Factors. American Journal o f Industrial Medicine, 4, 661- 681.
Fisher, R.F., 1977, The force o f contraction o f the human ciliary muscle during accommodation. Journal o f Physiology (London), 245, 351-369.
Floru, R., Cail, F., and Elias, R., 1985, Psychophysiological changes during a VDU repetitive task. Ergonomics, 28(10), 1455-1468.
Foreman, T.K., J.C. Davies, and J.D.G. Troup, 1988, A posture activity classification system using a micro-computer. Int. J. Ind. Ergonomics, 2, 285-289.
Frankenhaeuser, M. and Gardell, B. Underload and overload in working life: outline o f a multidisciplinary approach. Journal o f Human Stress 2:35-46, 1976.
177Gao, Chuansi, Lu, Demao, She, Qiyuan, Cai, Rongtai, Yang, Lei, and Zhang, Guogao, 1990, The effects o f VDT data entry work on operators. Ergonomics, 33(7), 917-924.
Grandjean, E., 1980, Ergonomics o f VDTs: review o f present knowledge. In Ergonomic Aspects o f Visual Display Terminals (Edited by E. Grandjean and E. Vigliani) (London: Taylor & Francis Ltd).
Grandjean, E., 1984a, Preface. In Ergonomics and Health in Modern Offices. Edited by E. Grandjean, Taylor & Francis, London.
Grandjean, E., 1984b, Postural problems at office machine work stations. In Ergonomics and Health in Modern Offices. Edited by E. Grandjean, Taylor & Francis, London, 445- 455.
Grandjean, E., 1984c, Postures and the design o f VDT workstations. Behavior and Information Technology. 3, 301-311.
Grandjean, E., Nishiyama, K., Hunting, W., and Piderman, M., 1982, A laboratory study on preferred and imposed settings o f a VDT workstation. Behavior and Information Technology, 1, 289-304.
Grandjean, E., Hunting, W., and Nishiyama, K., 1984, Preferred VDT worstation settings, body posture and physical impairments. Applied Ergonomics, 15.2, 99-104.
Gratton, I., Bruno, Piccoli, 1990, Changes in visual function and viewing distance during VDT work. Ergonomics, 1990, 33, 1433-1441.
Gunnarsson, E., and Soderberg, I., 1983, Eye strain resulting from VDT work at the Swedish Telecommunications Administration. Applied Ergonomics, 14, 61-69.
Hagberg, M., 1982, Local shoulder muscular strain - symptoms and disorders. Journal o f Human Ergology, 11, 99-108.
Hagberg, M., 1984, Occupational musculoskeletal stress and disorders o f the neck and shoulder: a review o f possible pathophysiology. International Archives o f Occupational and Environmental Health, 53, 269-278.
Hagberg, Mats, and Sundelin, Gunnevi, 1986, Discomfort and load on the upper trapezius muscle when operating a word processor. Ergonomics, 29, 1637-1645.
Hajnal, Catherine, and Carayon, Pascale, 1993, A study o f additive and interactive effects o f work and extra-organizational factors on female VDT workers. In Michael J. Smith and Gavriel Salvendy (Eds.): Human-Computer Interaction: Applications and Case Studies. Elsevier Science Publishers B.V., 925-930.
178Horgen, Gunnar, Aaras, Arne, 1993, Optimetric intervention studies in VDT workplace. In: R. Nielsen and K. Jorgensen (Eds ), Advances in Industrial Ergonomics and Safety V, Taylor & Francis. 107-113.
Hosokawa, M., 1979, Occupational cervicobrachial disorder. Nihon Rodosha anzen senta, Tokyo.
Howarth, P. A., and Istance, H. O., 1986, Research Note: the validity o f subjective reports o f visual discomfort. Human Factors, 28(3), 347-351.
Hunting, W., Grandjean, E., and Maeda, K., 1980, Constrained postures in accounting machine operators. Applied Ergonomics, 14, 145-149.
Hunting, W., Laubli, Th., and Grandjean, E., 1981, Postural and visual loads at VDT workplaces I. Constrained postures. Ergonomics, 24, 917-931.
Jarvenpaa, Eila, Carayon, Pascale, Hajnal, Catherine, Lim, Soo-Yee, and Yang, Chien- Lin, 1993, A cross-cultural framework for the study o f stress among computer users: comparison o f the USA and Finland. In Human-Computer Interaction: Applications and Case Studies. (Edited by Michael J. Smith and Gavriel Salvendy), Elsevier Science Publishers B.V., 874-879.
Jaschinski-Kruza, W., 1988, Visual strain during VDU work: the effect o f viewing distance and dark focus. Ergonomics, 31(10), 1449-1465.
Johnson, Richard A., and Wichem, Dean A., 1992, Applied Multivariate Statistics Analysis. Prentice Hall Inc., Englewood Cliffs, New Jersey.
Jonsson, B., Persson, J. and Kibom, A., 1988, Disorders o f the cervicobrachial region among female workers in the electronics industry. International Journal o f Industrial Ergonomics, 3, 1-12.
Kalimo, Raija, 1987, Psychosocial factors and workers' health: an overview. In Psychosocial Factors at Work (Edited by Raija Kalimo, Mostafa A. El-Batawi, and Cary L. Cooper), World Health Organization, Geneva, 3.
Karhu, O, Kansi, P. and Kuorinka, I. 1977. Correcting working postures in industry, a practical method for analysis. Applied Ergonomics, Vol.8 , 199-201.
Kelsey, J. and Hochberg, M., 1988, Epidemiology o f chronic musculoskeletal disorders. Annual Review o f Public Health, 9, 379-401.
Keyserling, W.M., 1986, A computer-aided system to evaluate postural stress in the workplace. American Industrial Hygiene Association Journal, 47, 417-425.
179Keyserling, W., Punnett, L. and Fine, L., 1988, Trunk posture and low back pain: identification and control o f occupational risk factors. Applied Industrial Hygiene, 3, 87- 92.
Khaleque, A., 1993. Job stress, fatigue, job involvement and satisfaction o f manual and computerized bank employees.In Michael J. Smith and Gavriel Salvendy (Eds.): Human- Computer Interaction: Applications and Case Studies. Elsevier Science Publishers B.V., 943-948.
Kogi, K., 1982, Finding appropriate work-rest rhythm for occupational strain on the basis o f electromyographic and behavioral changes. In: P. A. Buser, W.A. Cobb, and T. Okuma, Kyoto Symposia, Ansterdam, Elsevier Biomedical Press, 738-749.
Kroemer, K.H.E. 1989. Cumulative trauma disorders: their recognition and ergonomics measures to avoid them. Applied Ergonomics, 20.4, 274-280.
Kroemer, K.H.E. 1992. Avoiding cumulative trauma disorders in shops and offices. American Industrial Hygienist Association Journal, 53(9), 596-604.
Kumar, S. and Scaife, W.G.S., 1979, A precision task, posture, and strain. Journal of Safety Research, 11, 28-36.
Laubli, T., Hunting, W., and Grandjean, E., 1980, Visual impairments in VDT operators related to environmental conditions. In Ergonomic Aspects o f VDTs (Edited by E. Grandjean and E. Vigliani) (London: Taylor & Francis Ltd.), 85-94.
Laubli, T. and Grandjean, E., 1984. The magic o f control groups in VDT field studies (introductory paper). In Etienne Grandjean (Ed.) Ergonomics and Health in Modern Offices. Taylor & Francis, Philadelphia, 105-112.
Laubli, Th., Hunting, W. and Gradjean, E., 1981, Postural and visual loads at VDT workplaces II. Lighting conditions and visual impairments. Ergonomics, 24, 933-944.
LeGrande, D.E., 1993, VDT repetitive motion health concerns in the U.S. telecommunications industry. In: Michael J. Smith and Gavriel Salvendy (Eds.), Human- Computer Interaction: Applications and Case Studies. Elsevier Science Publishers B.V., 780-785.
Less, M., and Eickelberg, W.W.B., 1976, Force changes in neck vertebrae and muscles. In Komi, P.V. (Ed.) Biomechanics V-A. International Series on Biomechanics, vol. 1A. Baltimore, Univ Park, 530-536.
Levi, L. Stress and distress in response to psychosocial stimuli. Pergamon Press, New York, 1972.
180Levy, Finn, and Ramberg, Greger, 1987, Eye fatigue among VDU users and non-VDU users. In B.Knave and P.-G. Wideback (Eds.), Work with Display Units 86. Elsevier Science Publishers B.V., North-Holland, 42-52.
Life, M.A. and Pheasant, S.T., 1984, An integrated approach to the study o f posture in keyboard operation. Applied Ergonomics, 15.2, 83-90.
Lim, Soo-Yee, and Carayon, Pascale, 1993. An integrated approach to cumulative trauma disorders in computerized offices: the role o f psychosocial work factors, psychological stress and ergonomic risk factors. In Michael J. Smith and Gavriel Salvendy (Eds.): Human-Computer Interaction: Applications and Case Studies. Elsevier Science Publishers B.V., 880-885.
Lindstrom, K., 1993. Finish Longitudinal Studies o f Job Design and VDT work. In Michael J. Smith and Gavriel Salvendy (Eds.): Human-Computer Interaction: Applications and Case Studies. Elsevier Science Publishers B.V., 697-702.
Lu, H. and Aghazadeh, F., 1993, "VDT positions: effects on performance and comfort ", Designing for Diversity, Proceedings o f Human Factors and Ergonomics Society 37th Annual Meeting, 397-400.
Lu, H., Caylor, J., and Aghazadeh, F., 1993a, "An ergonomic study o f VDT workstations in office". American Industrial Hygiene Conference & Exposition (Abstracts), pp. 104, New Orleans, Louisiana, May 15-21.
Lu, H., Caylor, J., and Aghazadeh, F., 1993b, "VDTs in offices: A Field Study". In: Michael J. Smith and Gavriel Salvendy (Eds.), Advances in Human Factors/Ergonomics, 19A, Human-Computer Interaction: Applications and Case Studies. Elsevier Science Publishers B.V., 786-790.
Lunn, r., and Bank, W.P., 1986, Visual fatigue and spatial frequency adaptation to video displays o f text. Human Factors, 28, 457-464.
Lyon, Bruce K. 1992. Video display terminal ergonomics. Professional Safety. June 1992, 32-39.
Maeda, K., 1977, Occupational cervicobrachial disorder and its causative factors. Journal o f Human Ergology, 6, 193-202.
Maeda, K., Hunting, W., and Grandjean, E., 1980, Localized fatigue in accounting machine opertors. Journal o f Occupational Medicine, 22, 810-816.
Maeda, K., Hunting, W., and Grandjean, E., 1982, Factor analysis o f localized fatigue complaints o f accounting-machine opertors. Journal o f Human Ergology. 11, 37-43
181
Mandal, A. C., 1984, What is the correct height o f furniture? In: Ergonomics and Health in Modern Offices. Edited by E. Granjean, Taylor & Francis, London, pp.472-476.
Mandal, A.C., 1987, The influence o f furniture height on backpain. Behavior and information technology, 6, 347-352.
McAtamney, Lynn and Corlett, E. Nigel, 1993, RULA: a survey method for the investigation o f work-related upper limb disorders. Applied Ergonomics, 24(2), 91-99.
McNair, D., Lorr, M., and Droppleman, L., 1971, Profile o f M ood States. Educational and Industrial Testing Service, San Diego.
McLaney, M.A. and Hurrell, J.J. Jr., 1988, Control, stress, and job satisfaction in Canadian nurses. Work and Stress 2(3): 217-224.
Miezio, K., Smith, M. J. and Carayon, P., 1987, Electronic performance monitoring: behavioral and motivational issues. Trends in Ergonomics/Human Factors IV. Editor S.S. Asfour. Elsevier Science Publishers B.V. (North-Holland). 253-259.
Miyao, Masaru, Allen, John S., Hacisalihzade, Cronin, Stacia A., and Start, Lawrence W., 1988, The effect o f CRT quality on visual fatigue. Trends in Ergonomics/Human Factors V, Edited by F. Aghazadeh, Elasvier Science Publishers B.V., North-Holland, 297-304.
Magora, A., 1972, Investigation of the relation between low back pain and occupation; physical requirements: sitting, standing, and weight lifting, Industrial Medicine and surgery, 41,5.
National research council, 1983. Video Displays, Work, and Vision. National Academy Press, Washington, D.C.
NIOSH, 1981, Potential Health Hazards o f Video Display Terminal. DHHS (NIOSH) Publication N o.81-129. U.S. Government printing office, Washington, D.C., 20402.
NIOSH, 1988, Proposed national strategies for the prevention o f leading work-related diseases and injuries - Psychological disorders. U.S. Department o f Health and Human Services, Public Health Services, Center for Disease Control, NIOSH.
NIOSH, 1992, "More than One in Five U.S. West Workers Have Work-Related Disorders, NIOSH Finds." Occupational Safety & Health Reporter, Bureau o f National Affairs, Inc. 22:243.
Occhipinti, E. Colombini, D., Frigo, C., and Pedotti, A., 1985. Sitting posture: analysis o f lumbar stresses with upper limbs supported. Ergonomics, Vol.28, N o.9, 1347-1362.
182Occupational Safety & Health Reporter, 1992b, "Carpal Tunnel Cases Ordered Consolidated, Federal Judge to Decide if Joint Trial Warranted". Bureau o f National Affairs, Inc. 22:56.
Ong, C.N., 1984, VDT work place design and physical fatigue: a case study in Singapore. In Grandjean, E. (Ed.): Ergonomics and Health in Modern Offices. London, Taylor and Francis, 484-494.
OSHA, 1991, Working Safely with Video Display Terminals (Revised). Occupational Safety and Health Administration. OSHA 3092, Washington, D.C.: U.S. Government Printing Office.
Pot, Frank, Padmos, Pieter, and Brouwers, Alfred, 1987, Determinants o f the VDU operator's well-being. In Work With Display Units 86 (B. Knave and P.-G. Wideback ed.). Elsevier Science Publishers. 16-25.
Priel, Z. V. 1974, Numerical definition o f posture, Human Factors, 576-584.
Puhakainen, M., Torstila, I., and Lindstrom, K., Follow-up after implementation o f a new data system and health aspects in an insurance company. In Michael J. Smith and Gavriel Salvendy (Eds.): Human-Computer Interaction: Applications and Case Studies. Elsevier Science Publishers B.V., 999-1004.
Pulat, B. Mustafa 1992. Fundamentals o f Industrial Ergonomics. Prentice-Hall Inc. New Jersey.
Pustinger, C., Dainoff, M.J., and Smith, M., 1985, VDT workstation adjustability: effects on worker posture, productivity, and health complaints. In Eberts, R.E., and Eberts, C.G. (Eds ): Trends in Ergonomics/Human Factors II. Amsterdam, Elsevier, 445-451.
Robinson, C.A., 1980, Cervical spondylosis and muscle contraction headache. In Dalessio, D.J. (Ed.), W olffs Headache and Other Head Pain, 4th ed. New York, Oxford Univ. Press, 362-380.
Rogers, Katherine, J.S., Smith, Michael J., Sainfort, Pascale C., 1990, Electronic performance monitoring, job design and psychological stress. Proceedings o f Human Factors Society 34th Annual Meeting. 854-858.
Rubino, G.F., Maina, G., Piolatto, G., Sonnino, A., Turbati, M., 1993, Longitudinal survey o f ocular disorders and general complaints in VDU operators. In Michael J. Smith and Gavriel Salvendy (Ed.): Human-Computer Interaction: Applications and Case Studies. 768-773.
183Saito, S., Taptagaporn, S., Saito, Sh., Sotoyama, M., and Suzuki, T., 1993, Physiological indices o f visual fatigue and visual comfort related to VDT work. In Michael J. Smith and Gavriel Salvendy (Ed.): Human-Computer Interaction: Applications and Case Studies. 909-913.
Sainfort, P. Carayon, 1990, Perceptions o f work environment and psychological strain across categories o f office jobs. Proceedings o f Human Factors Society 34th Annual Meeting. 849-853.
SAS Institute Inc., 1990, SAS/Stat User's Guide, Version 6, Fourth Edition, Volume 1. Cary, NC, USA.
Sauter, S.L., Gottlieb. M.S., Rohrer, K.M., and Dodson, V.N., 1983, The Well-Being of Video Display Terminal Users: An Exploratory Study. Cincinnati, National Institute for Occupational Safety and Health.
Sauter, S.L., Schleifer, L.M. and Knutson, S.J., 1991, Work posture, workstation design and musculoskeletal discomfort in a VDT data entry task. Human Factors, 33(2), 151- 167.
Sauter, Steven L., 1984. Predictors o f strain in VDT-users and traditional office workers. In Etienne Grandjean (Ed.) Ergonomics and Health in Modern Offices. Taylor & Francis, Philadelphia, 129-135.
Sauter, S. L., Hurrell, J.J. Jr., and Copper, C.L., 1989, Job Control and Worker Health. John Wiley & Sons, New Work.
Sauter, S. L., Putz-Anderson, V., Schleifer, L., Hales, T., Bernard, B., Peterson, M. and Ochs, T., 1992, Job risk factors for upper extremity musculoskeletal disorders among newspaper and telecommunications workers. Work with Display Units '92, Berlin, September 1-4.
Schleifer, Lawrence M., Sauter, Steven L., and Smith, Randall J., 1990, Ergonomic predictors o f visual system complaints in VDT data entry work. Behavior & Information Technology, Vol.9, No.4, 273-282.
Schultz, A., Andersson, G., Ortengren, R., Nachemson, A. and Haderspeck, K., 1982, Loads on the lumber spine: validation o f a biomechanical analysis: measurements of intradiscal pressures and myoelectric signals. Journal o f Bone and Joint Surgery, 64A, 713-720.
Secrest, D., and Dainoff, M, 1984, Performance changes resulting from ergonomic factors in VDT data entry workstation design. In Mital, A. (Eds ), Advances in
184Ergonomics /Human Factors I. Proceedings o f the First Mid-Central Ergonomics/Human Factors Conference. Cincinnati, April 12-14.
Smith, A. B., Tanaka, S., Haperin, W., and Richards, R.D. 1982. Report o f a Cross Sectional Survey o f VDT Users at the Baltimore Sun. National Institute o f Occupational Safety and Health, Center for Disease Control, Cincinnati, OH.
Smith, A. B., Tanaka, S., and Haperin, W. 1984. Correlates o f Ocular and Somatic Symptoms among VDT Users. Human Factors, 26, 143-156.
Smith, M.J., Cohen, B.G. and Stammerjohn, L.W. Jr., 1981. An investigation o f health complaints and job stress in video display operators. Human Factors. 23(4), 387-400.
Smith, Michael J., 1987, Mental and physical strain at VDT workstations. Behavior and information technology, 6(3), 243-255.
Smith, M.J., Carayon, P., Sanders, K. J., Lim, S.Y., and LeGrande, D., 1992, Employee stress and health in jobs with and without electronic performance monitoring. Applied Ergonomics, 23(1), 17-28.
Sjogren, Sven, and Elfstrom, Arne, 1990. Eye discomfort among 4000 VDU-users. In Work with Display Units 89 (edited by L.Berlinguet and D. Berthelette), Elsevier Science Publishing Company Inc, New York, 21-27.
Stammerjohn, L.W., Smith, M.J., and Cohen, B.G.F., 1981. Evaluation o f workstation design factors in VDT operations. Human Factors, 23, 401-412.
Stellman, J. M., Klitzman, S., Gordon, G. C. and Snow, B. R., 1987, Work environment and the well-being o f clerical and VDT workers. Journal o f Occupational Behavior, 8, 95-114.
Stenberg, B., 1993, Skin symptoms and VDT work., In Michael J. Smith and Gavriel Salvendy (Ed.): Human-Computer Interaction: Applications and Case Studies, 734-739.
Stewart, T., 1979, Ergonomics and visual display units - is there a problem? In McPhee, B., and Howie, A. (Eds), Ergonomics and Visual Display Units. Proceedings o f a Conference. Melbourne, September 5, 1979 and Sydney, September 7, 1979, 3-23.
Snyder, H.L., and Taylor, G.B., 1979, The sensitivity o f response measures of alphanumeric legibility to variations in dot matrix display parameter. Human Factors, 21, 457-471.
Swanson, Naomi g., and Sauter, Steven L., 1993, The relationship o f working posture to performance in a data entry task. In Michael J. Smith and Gavriel Salvendy (Eds.):
185Human-Computer Interaction: Applications and Case Studies. Elsevier Science Publishers B.V., 994-998.
Tanaka, Toshiko, Fukumoto, Teruo, Yamamoto, Sakae, and Noro, Kageyu, 1988. The effect o f VDT work on urinary excretion o f catecholamine. Ergonomics, 31(12), 1753- 1763.
Tanaka, Toshiko, Yamamoto, Sakae, Noro, Kageyu, Fukumoto, Teruo, and Kuroiwa, Akio, 1989. The effects o f VDT work on the regulation o f hemodynamics compared with aging. Ergonomics, 32(12), 1595-1605.
Tijerina, Louis, 1984, Video Display Terminal Workstation Ergonomics. OCLC Online Computer Library Center, Inc., Product No. 819. Columbus, Ohio.
Tracy, M.F. and Gray, M., 1989, Block laying in the construction industry, Contemporary Ergonomics, 373-379.
Travell, J., 1967, Mechanical headache. Headache, 7, 23-29.
Turner, P. J., 1982, Visual requirements for VDU operators. Aust. J. Optom., 65, 58-64.
Tyrrell, Richard A., and Leibowitz, Herschell W., 1990, The relationship o f vergence effort to reports o f visual fatigue following prolonged near work. Human Factors, 32(3), 341-357.
Wall, M. De, Riel, M.P.J.M. Van, Aghina, J.C.F.M., Burdorf, A., and Snijders, C.J., 1992, Improving the sitting posture o f CAD/CAM workers by increasing VDU monitor working height. Ergonomics, 35(4), 427-436.
Watten, Reidulf G., Lie, Ivar, and Magnussen, Svein, 1992, VDU work, contrast adaptation, and visual fatigue. Behavior and Information Technology, 11, 262-267.
Webster's New Twentieth Century Dictionary o f the English Language (2nd edition). William Collins, World Publishing Co., Inc.
Wilkins, A. J., Nimmo-Smith, I., Tait, A., McManus, C , Della Salla, S., Tiley, A., Arnold, K., Barrie, M. and Scott, S., 1984, A neurological basis for visual discomfort, Brain, 107, 989-1017.
Wilkins, Arnold J., 1991, Visual display units versus visual computation. Behavior and Information Technology, 10, 5151-523.
World Health Organization, 1987, Visual Display Terminals and Workers' Health, Geneva: World Health Organization.
186
Wrigley, T.V., Green, R.A. and Briggs, C.A. Microcomputer video image processing technology in working posture analysis. Applied Ergonomics, Vol. 22, No. 1, 2-9.
Yang, Chien-Lin, Carayon, Pascale, 1993, Effects o f computer system performance and job support on stress among office workers. In Michael J. Smith and Gavriel Salvendy (Eds.): Human-Computer Interaction: Applications and Case Studies. Elsevier Science Publishers B.V., 931-936.
Zacharkow, Dennis, 1988, Posture: sitting, standing, chair design, & exercise. Charles C Thomas Publisher, Illinois.

APPENDIX A
VARIABLES STUDIED IN THE QUESTIONNAIRE
187

DEMOGRAPHICS/INDIVIDUAL CHARACTERISTICSSEX Gender AGE Age JBT Job titleLPJ Length o f present job_______ monthsVDT Computer experience _______ monthsTYS Typing speedEWT Eye wear typeEEF Eye exam frequencyHAB Sitting habitsEXB Exercises during breaks?EXS Exercises?
TASKSWHD Working hours/day TAS Major tasksTOC Length o f time using computer continuously TOU Total time o f using computer TOM Percentage o f using mouse
PSYCHOSOCIAL FACTORSFTP Times o f feeling time pressureFSW Surges in workloadJCS Satisfy job challenge?JRS Job responsibility?JSA Sense o f accomplishment?SSP Supervisor support?SFB Supervisor feedback?WIT Interaction at work?
COMPUTER AND SYSTEMSCST Computer type CSS Type o f software
WORKSTATION ERGONOMICS -SUBJECTIVE EVALUATIONS:SCG Screen glareSCP Comfort with the screen positionKBP Comfort with the position o f keyboardCHT Comfort with the height o f chairCBR Comfort with the back restCSP Comfort with the seat pan
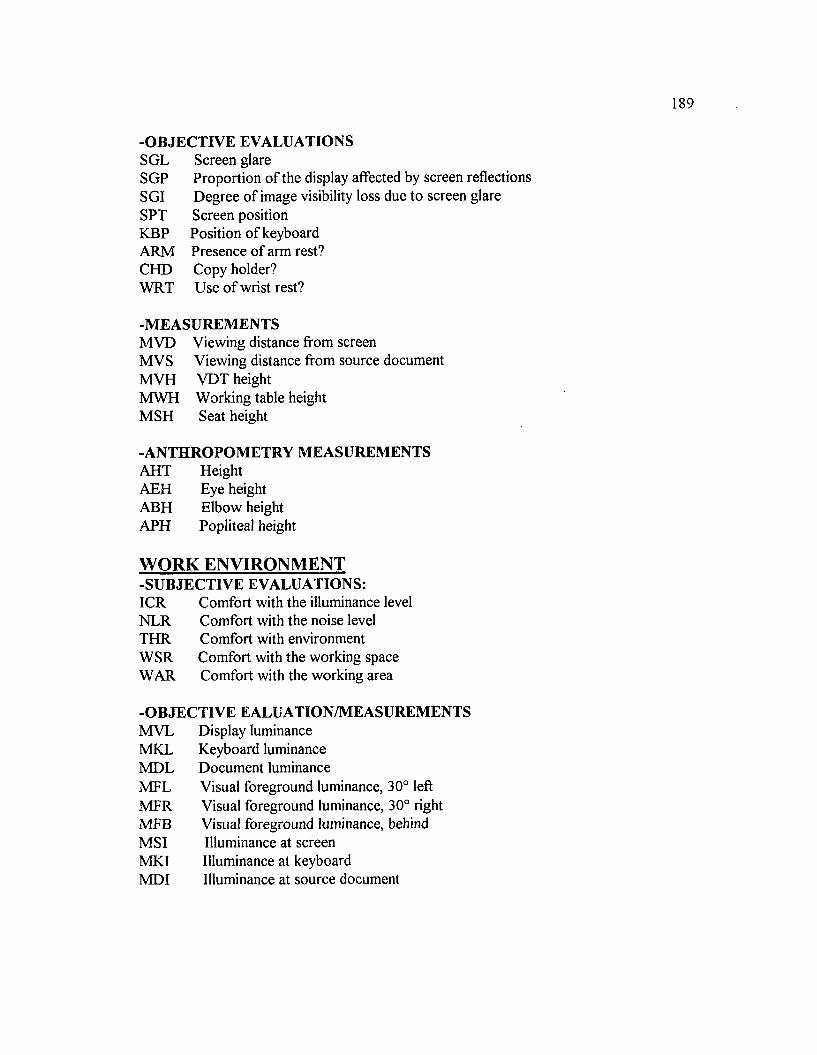
-O B JE C T IV E EVALUATIONSSGL Screen glareSGP Proportion o f the display affected by screen reflectionsSGI Degree o f image visibility loss due to screen glareSPT Screen positionKBP Position o f keyboardARM Presence o f arm rest?CHD Copy holder?WRT Use o f wrist rest?
-M EA SU REM EN TSMVD Viewing distance from screenMVS Viewing distance from source documentMVH VDT heightMWH Working table heightMSH Seat height
-A N TH R O PO M ETR Y M EASUREM ENTSAHT HeightAEH Eye heightABH Elbow heightAPH Popliteal height
WORK ENVIRONMENT-SU B JEC TIV E EVALUATIONS:ICR Comfort with the illuminance levelNLR Comfort with the noise levelTHR Comfort with environmentW SR Comfort with the working spaceWAR Comfort with the working area
-O B JE C T IV E EALUATION/M EASUREM ENTSMVL Display luminanceMKL Keyboard luminanceMDL Document luminanceMFL Visual foreground luminance, 30° leftMFR Visual foreground luminance, 30° rightMFB Visual foreground luminance, behindMSI Illuminance at screenMKI Illuminance at keyboardMDI Illuminance at source document
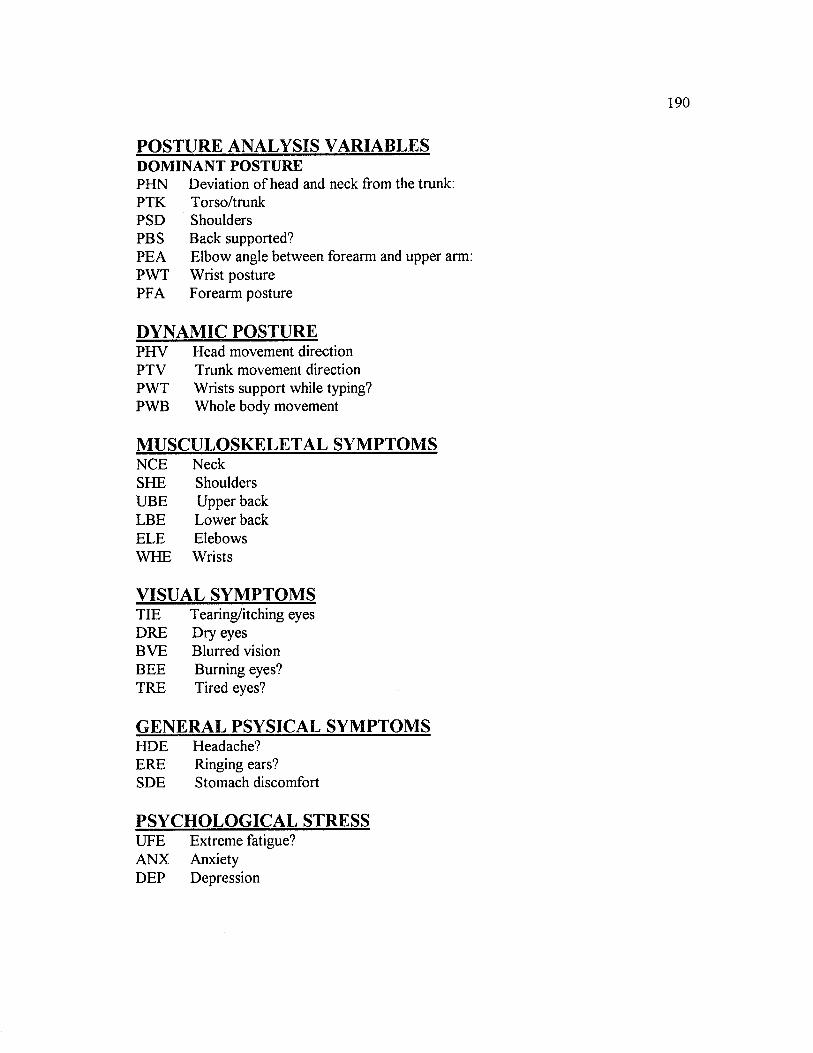
POSTURE ANALYSIS VARIABLESDOMINANT POSTUREPHN Deviation o f head and neck from the trunk:PTK Torso/trunkPSD ShouldersPBS Back supported?PEA Elbow angle between forearm and upper arm:PWT Wrist posturePFA Forearm posture
DYNAMIC POSTUREPHV Head movement directionPTV Trunk movement directionPWT Wrists support while typing?PWB Whole body movement
MUSCULOSKELETAL SYMPTOMSNCE NeckSHE ShouldersUBE Upper backLBE Lower backELE ElebowsWHE Wrists
VISUAL SYMPTOMSTIE Tearing/itching eyes DRE Dry eyes BVE Blurred vision BEE Burning eyes?TRE Tired eyes?
GENERAL PSYSICAL SYMPTOMSHDE Headache?ERE Ringing ears?SDE Stomach discomfort
PSYCHOLOGICAL STRESSUFE Extreme fatigue?ANX Anxiety DEP Depression

APPENDIX B
QUESTIONNAIRE
191
VDT WORKSTATION SURVEY
A Questionnaire Presented to Computer Users
192
OBJECTIVE:
The objective o f this survey is to obtain subjective opinion o f the health problems and evaluation o f the workstation system. The questions are divided into three parts: (I) background information, (II) possible health symptoms, and (III) perceived comfort o f the computer, workstation and environment. All information obtained from each individual will be kept confidential. A general summary o f findings will be provided after the study.
How To Answer the Questionnaire:
Please mark your answer for each question by putting an X in the appropriate box(s). You may have more than one answer for some o f the questions. In this case, you should select all the answers which apply to you. It is most important that you answer all questions to the best o f your ability.
Thank you for participating. The time and effort you invest are greatly appreciated.
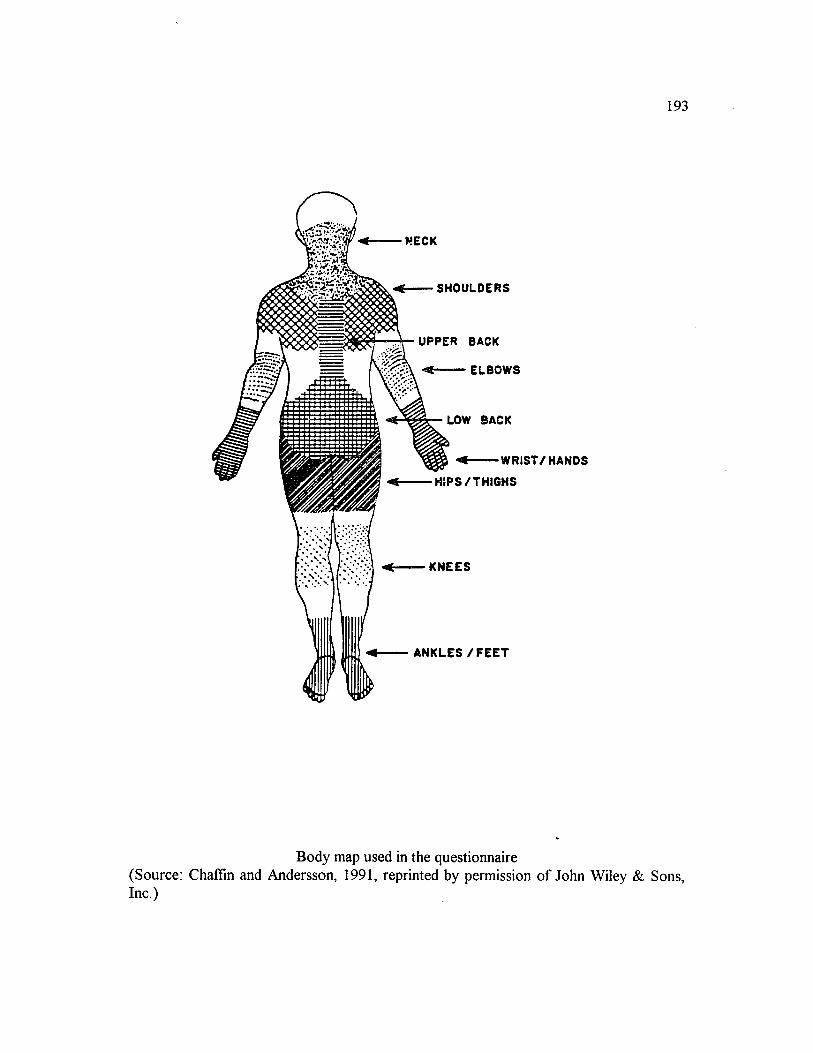
193
NECK
SHOULDERS
UPPER BACK
r.:\ •«*— — ELBOWS
LOW BACK
■KNEES
i
WRIST/HANDS
HIPS/THIGHS
ANKLES/FEET
Body map used in the questionnaire (Source: Chaffin and Andersson, 1991, reprinted by permission o f John Wiley & Sons, Inc.)
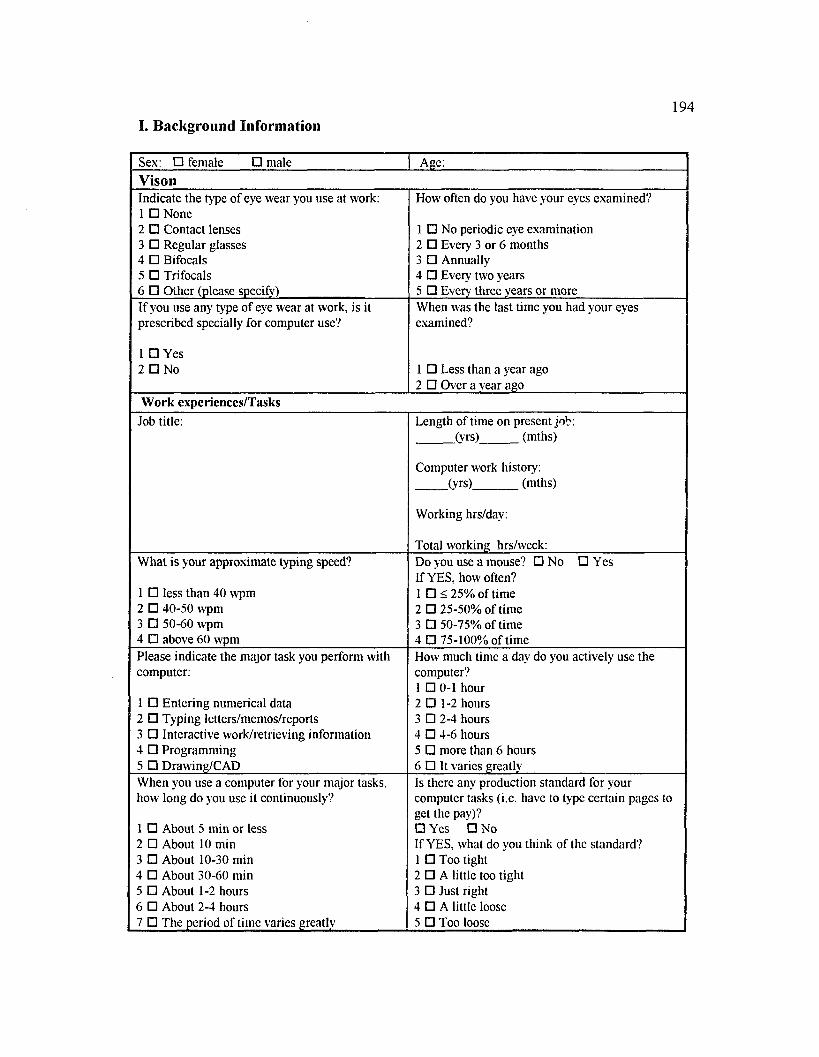
194I. Background Information
Sex: □ female □ male Age:V iso nIndicate the type of eye wear you use at work:1 □ None2 □ Contact lenses3 □ Regular glasses4 □ Bifocals5 □ Trifocals6 □ Other (please specify)
How often do you have your eyes examined?
1 □ No periodic eye examination2 □ Every 3 or 6 months3 □ Annually4 □ Every two years5 □ Every three years or more
If you use any type of eye wear at work, is it prescribed specially for computer use?
1 □ Yes2 □ No
When was the last time you had your eyes examined?
1 □ Less than a year ago2 □ Over a year ago
Work experiences/TasksJob title: Length of time on present job:
(vrs) (mths)
Computer work history:(vrs) (mths)
Working hrs/day:
Total working hrsAveek:What is your approximate typing speed?
1 □ less than 40 wpm2 □ 40-50 wpm3 □ 50-60 wpm4 □ above 60 wpm
Do you use a mouse? □ No □ Yes If YES, how often?1 □ £ 25% of time2 □ 25-50% of time3 □ 50-75% of time4 □ 75-100% of time
Please indicate the major task you perform with computer:
1 □ Entering numerical data2 □ Typing letters/memos/reports3 □ Interactive work/retrieving information4 □ Programming5 □ Drawing/CAD
How much time a day do you actively use the computer?1 □ 0 - 1 hour2 □ 1 - 2 hours3 □ 2-4 hours4 □ 4-6 hours5 □ more than 6 hours6 □ It varies greatly
When you use a computer for your major tasks, how long do y ou use it continuously?
1 □ About 5 min or less2 □ About 10 min3 □ About 10-30 min4 □ About 30-60 min5 □ About 1-2 hours6 □ About 2-4 hours7 □ The period of time varies greatly
Is there any production standard for your computer tasks (i.e. have to type certain pages to get the pay)?□ Yes □ NoIf YES, what do you think of the standard?1 □ Too tight2 □ A little too tight3 □ Just right4 □ A little loose5 □ Too loose
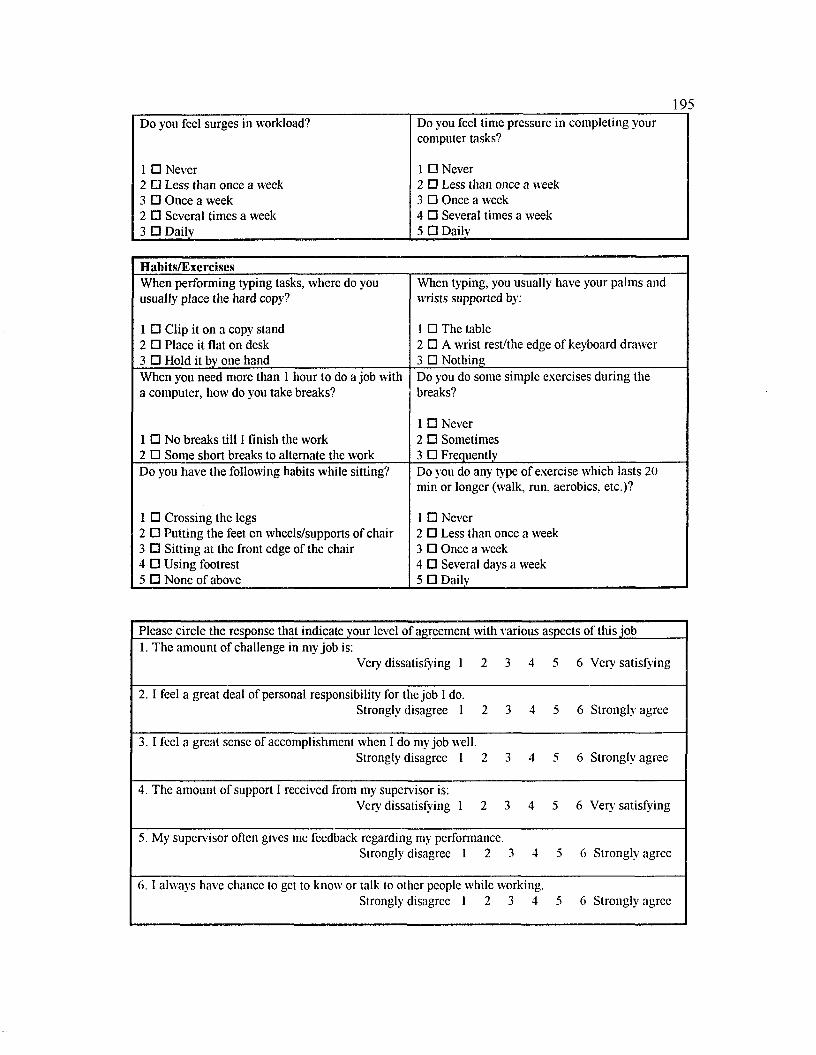
195Do you feel surges in workload? Do you feel time pressure in completing your
computer tasks?
1 □ Never 1 □ Never2 □ Less than once a week 2 O Less than once a week3 □ Once a week 3 □ Once a week2 □ Several times a week 4 □ Several times a week3 □ Daily 5 □ Daily
Hahits/ExcrciscsWhen performing typing tasks, where do you usually place the hard copy?
1 □ Clip it on a copy stand2 □ Place it flat on desk3 □ Hold it by one hand
When typing, you usually have your palms and wrists supported by:
1 □ The table2 □ A wrist rest/the edge of keyboard drawer3 □ Nothing
When you need more than 1 hour to do a job with a computer, how do you take breaks?
1 □ No breaks till I finish the work2 □ Some short breaks to alternate the work
Do you do some simple exercises during the breaks?
1 □ Never2 □ Sometimes3 □ Frequently
Do you have the following habits while sitting?
1 □ Crossing the legs2 □ Putting the feet on wheels/supports of chair3 □ Sitting at the front edge of the chair4 □ Using footrest5 □ None of above
Do you do any type of exercise which lasts 20 min or longer (walk, run, aerobics, etc.)?
1 □ Never2 □ Less than once a week3 □ Once a week4 □ Several days a week5 □ Daily
Please circle the response that indicate your level of agreement with various aspects of this job1. The amount of challenge in my job is:
Very dissatisfying 1 2 3 4 5 6 Very satisfying
2. 1 feel a great deal of personal responsibility for the job I do.Strongly disagree 1 2 3 4 5 6 Strongly agree
3. I feel a great sense of accomplishment when I do my job well.Strongly disagree 1 2 3 4 5 6 Strongly agree
4. The amount of support I received from my supervisor is:Very dissatisfying 1 2 3 4 5 6 Very satisfying
5. My supervisor often gives me feedback regarding my performance.Strongly disagree 1 2 3 4 5 6 Strongly agree
6 . I always have chance to get to know or talk to other people while workingStrongly disagree 1 2 3 4 5 6 Strongly agree
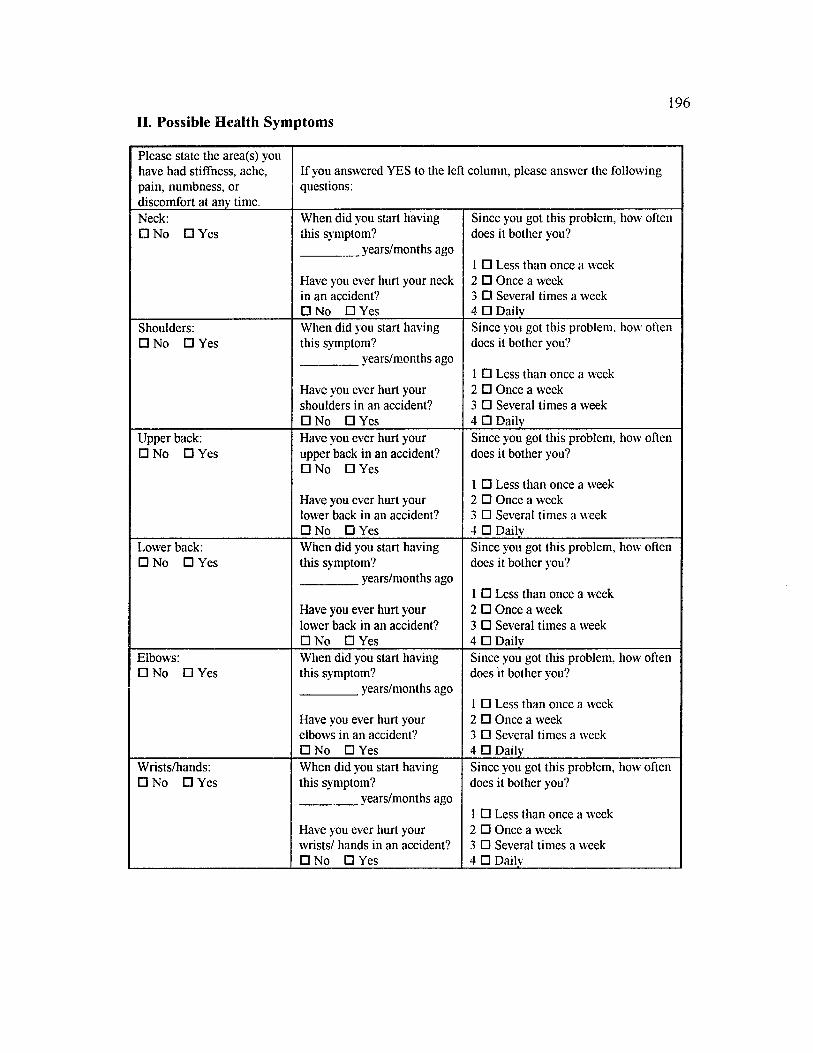
196II. Possible Health Symptoms
Please state the area(s) you have had stiffness, ache, pain, numbness, or discomfort at any time.
If you answered YES to the left column, please answer the following questions:
Neck:□ No □ Yes
When did you start having this symptom?
years/months ago
Since you got this problem, how often does it bother you?
1 □ Less than once a week2 □ Once a week3 □ Several times a week4 □ Dailv
Have you ever hurt your neck in an accident?□ No □ Yes
Shoulders:□ No □ Yes
When did you start having this symptom?
years/months ago
Since you got this problem, how often does it bother you?
1 □ Less than once a week2 □ Once a week3 □ Several times a week4 □ Daily
Have you ever hurt your shoulders in an accident? □ No □ Yes
Upper back:□ No □ Yes
Have you ever hurt your upper back in an accident?□ No □ Yes
Have you ever hurt your lower back in an accident?□ No □ Yes
Since you got this problem, how often does it bother you?
1 □ Less than once a week2 □ Once a week3 □ Several times a week4 □ Dailv
Lower back:□ No □ Yes
When did you start having this symptom?
vears/months ago
Since you got this problem, how often does it bother you?
1 □ Less than once a week2 □ Once a week3 □ Several times a week4 □ Daily
Have you ever hurt your lower back in an accident? □ No □ Yes
Elbows:□ No □ Yes
When did you start having this symptom?
years/months ago
Since you got this problem, how often does it bother you?
1 □ Less than once a week2 □ Once a week3 □ Several times a week4 □ Daily
Have you ever hurt your elbows in an accident? □ No □ Yes
Wrists/hands: □ No □ Yes
When did you start having this symptom?
vears/months ago
Since you got this problem, how often does it bother you?
1 □ Less than once a week2 □ Once a week3 □ Several times a week4 □ Dailv
Have you ever hurt your wrists/ hands in an accident? □ No □ Yes

197Hips/thighs:□ No □ Yes
When did you start having this symptom?
vears/months ago
Since you got this problem, how often does it bother you?
1 □ Less than once a week2 □ Once a week3 □ Several times a week4 □ Dailv
Have you ever hurt your hips/thighs in an accident? □ No □ Yes
Knees:□ No □ Yes
When did you start having this symptom?
years/months ago
Since you got this problem, how often does it bother you?
1 □ Less than once a week 2. □ Once a week3 □ Several times a week4 □ Dailv
Have you ever hurt your knees in an accident?□ No □ Yes
Ankles/feet:□ No □ Yes
When did you start having this symptom?
vears/months ago
Since you got this problem, how often does it bother you?
1 □ Less than once a week2 □ Once a week3 □ Several times a week4 □ Dailv
Have you ever hurt your ankles/feet in an accident? □ No □ Yes
Please indicate the frequency/intensity of the following symptoms if you have any during work
Tearing/itching eyes?
1 □ Never2 □ Less than once a week3 □ Once a week4 □ Several times a week5 □ Daily
Burning eyes?
1 □ Never2 □ Less than once a week3 □ Once a week4 □ Several times a week5 □ Daily
Dry eyes?
1 □ Never2 □ Less than once a week3 □ Once a week4 □ Several times a week5 □ Daily
Tired eyes?
1 □ Never2 □ Less than once a week3 □ Once a week4 □ Several times a week5 □ Daily
Blurred vision/double vision?
1 □ Never2 □ Less than once a week3 □ Once a week4 □ Several times a week5 □ Daily
Acquiring new glasses because of deteriorating vision?
1 □ Never2 □ Every 6 months3 □ Every year4 □ Every 18 months5 □ Every 2 years or over
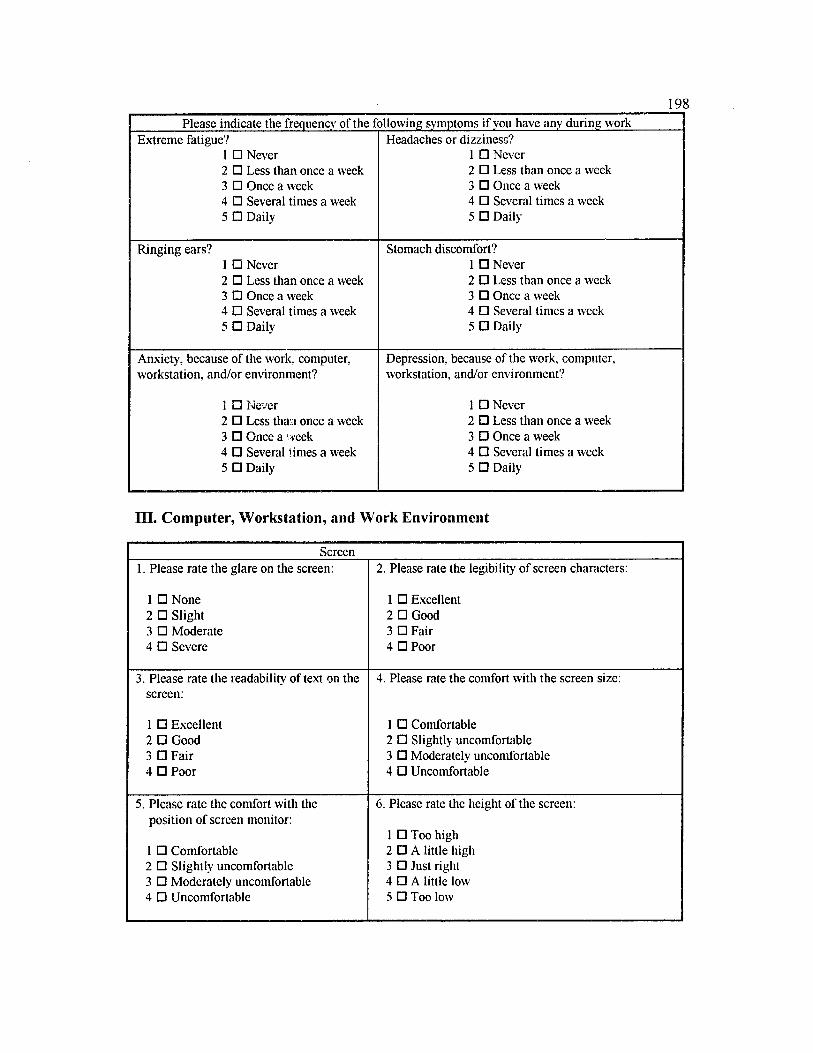
198Please indicate the frequency of the following symptoms if you have any during work
Extreme fatigue?1 □ Never2 □ Less than once a week3 □ Once a week4 □ Several times a week5 □ Daily
Headaches or dizziness?1 □ Never2 □ Less than once a week3 □ Once a week4 □ Several times a week5 □ Daily
Ringing ears?1 □ Never2 □ Less than once a week3 □ Once a week4 □ Several times a week5 □ Daily
Stomach discomfort?1 □ Never2 □ Less than once a w'eek3 □ Once a week4 □ Several times a week5 □ Daily
Anxiety, because of the work, computer, workstation, and/or environment?
1 □ Never2 □ Less than once a week3 □ Once a week4 □ Several times a week5 □ Daily
Depression, because of the work, computer, workstation, and/or environment?
1 □ Never2 □ Less than once a week3 □ Once a week4 □ Several times a week5 □ Daily
HI. Computer, Workstation, and Work Environment
Screen1. Please rate the glare on the screen:
1 □ None2 □ Slight3 □ Moderate4 □ Severe
2. Please rate the legibility of screen characters:
1 □ Excellent2 □ Good3 □ Fair4 □ Poor
3. Please rate the readability of text on the screen:
1 □ Excellent2 □ Good3 □ Fair4 □ Poor
4. Please rate the comfort with the screen size:
1 □ Comfortable2 □ Slightly uncomfortable3 □ Moderately uncomfortable4 □ Uncomfortable
5. Please rate the comfort with the position of screen monitor:
1 □ Comfortable2 □ Slightly uncomfortable3 □ Moderately uncomfortable4 □ Uncomfortable
6 . Please rate the height of the screen:
1 □ Too high2 □ A little high3 □ Just right4 □ A little low5 □ Too low
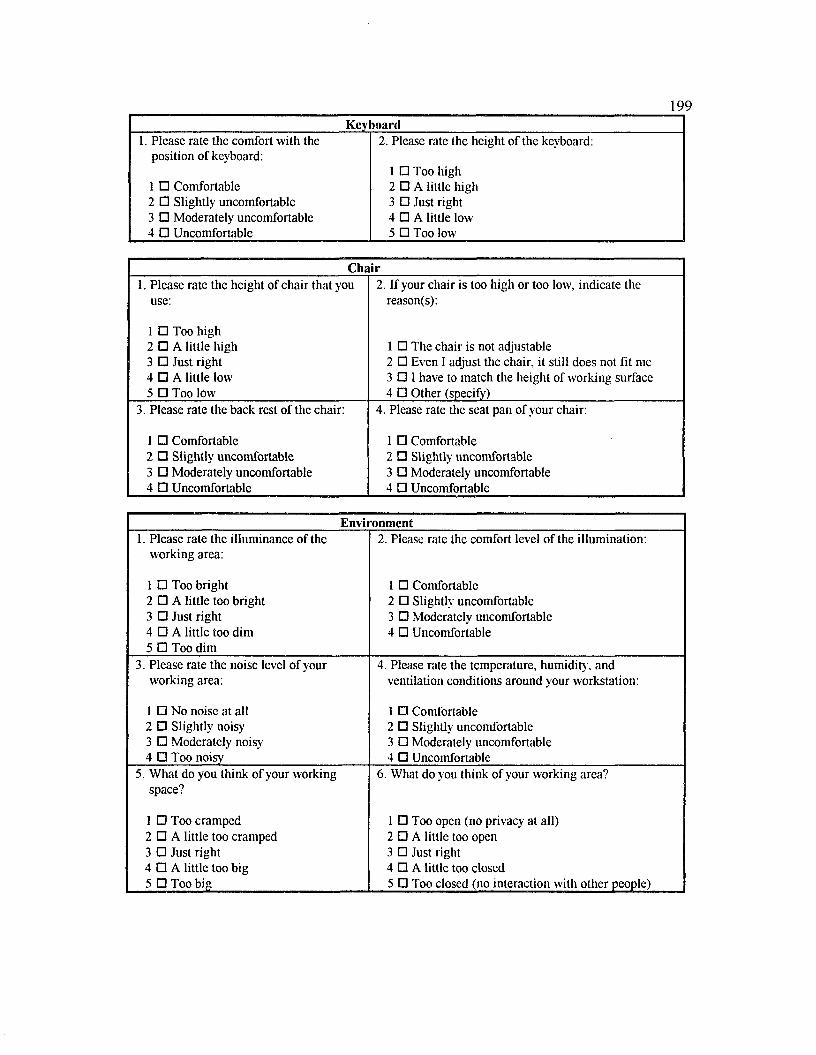
199Keyboard
1. Please rate the comfort with the 2. Please rate the height of the keyboard:position of keyboard:
1 □ Too high1 □ Comfortable 2 □ A little high2 □ Slightly uncomfortable 3 □ Just right3 □ Moderately uncomfortable 4 □ A little low4 □ Uncomfortable 5 □ Too low
Chair1. Please rate the height of chair that you
use:
1 □ Too high2 □ A little high3 □ Just right4 □ A little low5 □ Too low
2. If your chair is too high or too low, indicate the reason(s):
1 □ The chair is not adjustable2 □ Even I adjust the chair, it still does not fit me3 □ I have to match the height of working surface4 □ Other (specify)
3. Please rate the back rest of the chair:
1 □ Comfortable2 □ Slightly uncomfortable3 □ Moderately uncomfortable4 □ Uncomfortable
4. Please rate the seat pan of your chair:
1 □ Comfortable2 □ Slightly uncomfortable3 □ Moderately uncomfortable4 □ Uncomfortable
Environment1. Please rate the illuminance of the
working area:
1 □ Too bright2 □ A little too bright3 □ Just right4 □ A little too dim5 □ Too dim
2 . Please rate the comfort level o f the illumination:
1 □ Comfortable2 □ Slightly uncomfortable3 □ Moderately uncomfortable4 □ Uncomfortable
3. Please rate the noise level of your working area:
1 □ No noise at all2 □ Slightly noisy’3 □ Moderately noisy4 □ Too noisv
4. Please rate the temperature, humidity, and ventilation conditions around your workstation:
1 □ Comfortable2 □ Slightly uncomfortable3 □ Moderately uncomfortable4 □ Uncomfortable
5. What do you think of your working space?
1 □ Too cramped2 □ A little too cramped3 □ Just right4 □ A little too big5 □ Too big
6 . What do you think of your working area?
1 □ Too open (no privacy at all)2 □ A little too open3 □ Just right4 □ A little too closed5 □ Too closed (no interaction with other people)

APPENDIX C
MEASUREMENT AND CHECKLIST
2 0 0
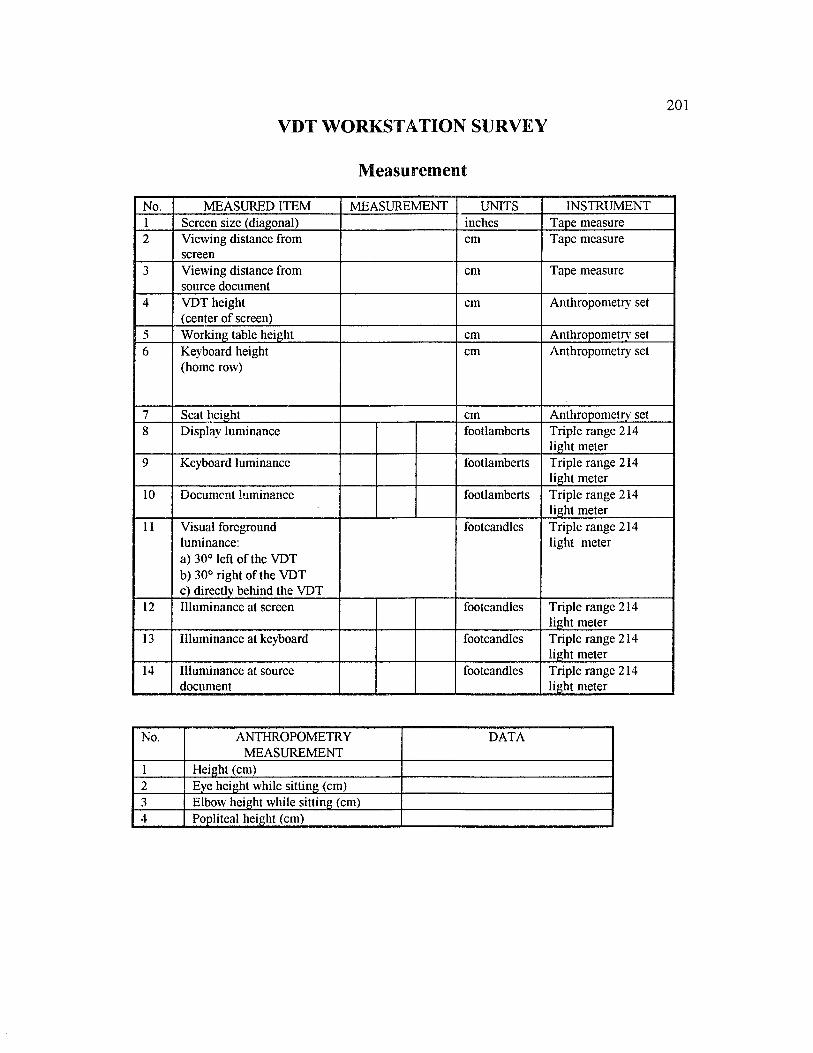
VDT WORKSTATION SURVEY201
Measurement
No. MEASURED ITEM MEASUREMENT UNITS INSTRUMENT1 Screen size (diagonal) inches Tape measure2 Viewing distance from
screencm Tape measure
3 Viewing distance from source document
cm Tape measure
4 VDT height (center of screen)
cm Anthropometry set
5 Working table height cm Anthropometry' set6 Keyboard height
(home row)cm Anthropometry set
7 Seat height cm Anthropometry set8 Display luminance footlamberts Triple range 214
light meter9 Keyboard luminance footlamberts Triple range 214
light meter1 0 Document luminance footlamberts Triple range 214
light meter1 1 Visual foreground
luminance:a) 30° left of the VDTb) 30° right of the VDTc) directly behind the VDT
footcandles Triple range 214 light meter
1 2 Illuminance at screen footcandles Triple range 214 light meter
13 Illuminance at keyboard footcandles Triple range 214 light meter
14 Illuminance at source document
footcandles Triple range 214 light meter
No. ANTHROPOMETRYMEASUREMENT
DATA
1 Height (cm)2 Eye height while sitting (cm)3 Elbow height while sitting (cm)4 Popliteal height (cm)
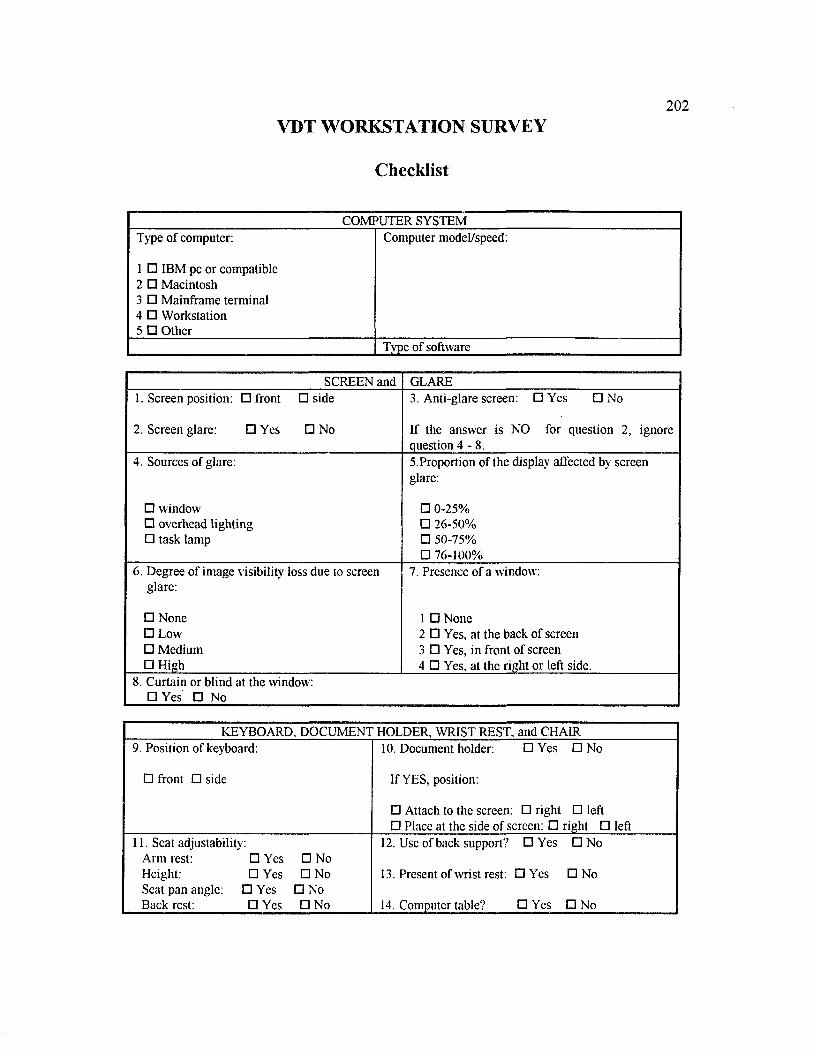
VDT WORKSTATION SURVEY2 0 2
Checklist
COMPUTER SYSTEMType of computer:
1 □ IBM pc or compatible2 □ Macintosh3 □ Mainframe terminal4 □ Workstation5 □ Other
Computer model/speed:
Type of software
SCREEN and GLARE1. Screen position: □ front □ side
2. Screen glare: □ Yes □ No
3. Anti-glare screen: □ Yes □ No
If the answer is NO for question 2, ignore question 4 - 8 .
4. Sources of glare:
□ window□ overhead lighting□ task lamp
5. Proportion of the display affected by screen glare:
□ 0-25%□ 26-50%□ 50-75%□ 76-100%
6 . Degree of image visibility loss due to screen glare:
□ None□ Low□ Medium□ High
7. Presence of a window:
1 □ None2 □ Yes, at the back of screen3 □ Yes, in front of screen4 □ Yes, at the right or left side.
8 . Curtain or blind at the window: □ Yes □ No
KEYBOARD. DOCUMENT HOLDER, WRIST REST, and CHAIR9. Position of keyboard:
□ front □ side
10. Document holder: □ Yes □ No
If YES, position:
□ Attach to the screen: □ right □ left□ Place at the side of screen: □ right □ left
11. Seat adjustability:Arm rest: □ Yes □ No Height: □ Yes □ No Scat pan angle: □ Yes □ No Back rest: □ Yes □ No
12. Use of back support? □ Yes □ No
13. Present of wrist rest: □ Yes □ No
14. Computer table? □ Yes □ No
APPENDIX D
MEASUREMENT TECHNIQUES
203
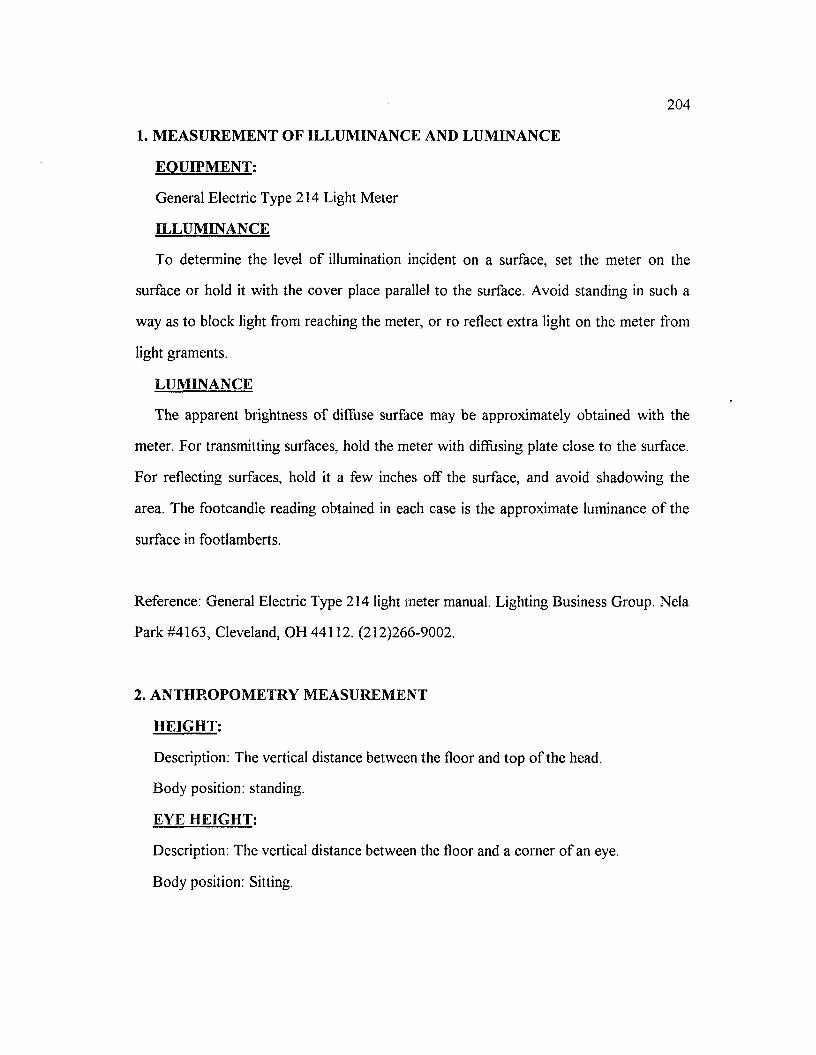
204
1. M EA SU REM EN T O F ILLUM INANCE AND LUM INANCE
E Q U IPM EN T;
General Electric Type 214 Light Meter
ILLUM INAN CE
To determine the level o f illumination incident on a surface, set the meter on the
surface or hold it with the cover place parallel to the surface. Avoid standing in such a
way as to block light from reaching the meter, or ro reflect extra light on the meter from
light graments.
LUM INANCE
The apparent brightness o f diffuse surface may be approximately obtained with the
meter. For transmitting surfaces, hold the meter with diffusing plate close to the surface.
For reflecting surfaces, hold it a few inches off the surface, and avoid shadowing the
area. The footcandle reading obtained in each case is the approximate luminance o f the
surface in footlamberts.
Reference: General Electric Type 214 light vneter manual. Lighting Business Group. Nela
Park #4163, Cleveland, OH 44112. (212)266-9002.
2. A N TH R O PO M ETR Y M EASUREM ENT
H E IG H T :
Description: The vertical distance between the floor and top o f the head.
Body position: standing.
EYE H E IG H T :
Description: The vertical distance between the floor and a comer o f an eye.
Body position: Sitting.
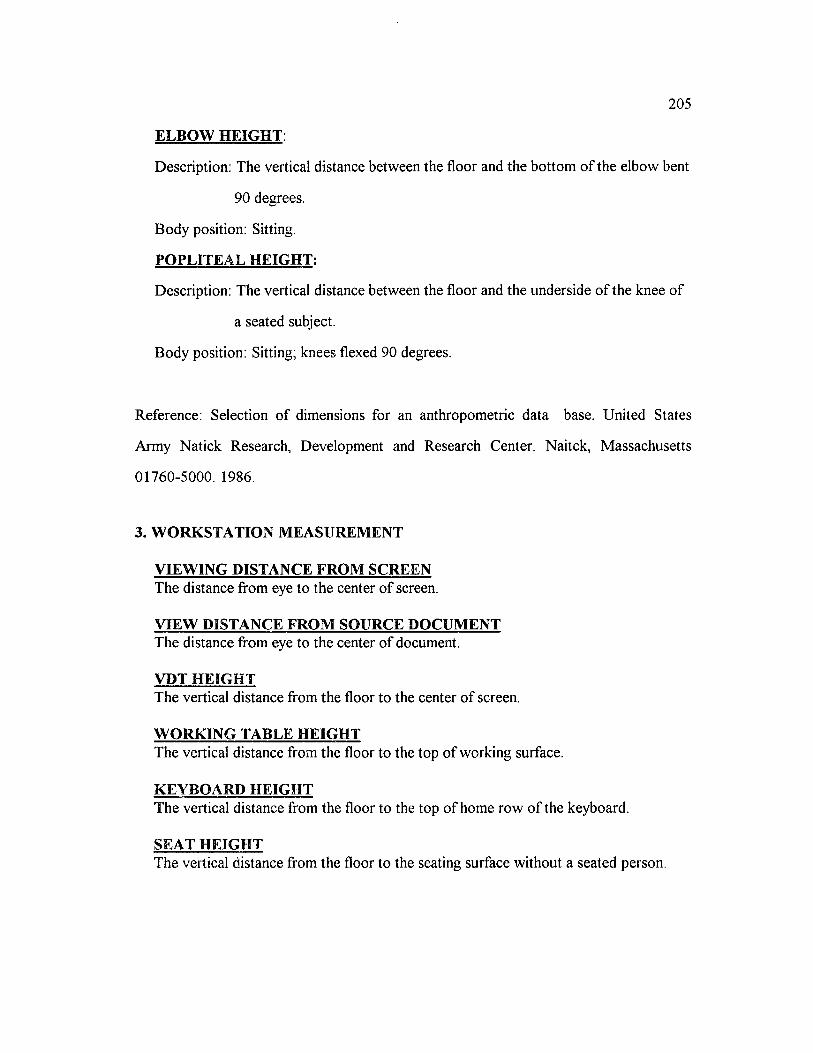
205
ELB O W H E IG H T :
Description: The vertical distance between the floor and the bottom o f the elbow bent
90 degrees.
Body position: Sitting.
PO PL IT E A L H E IG H T :
Description: The vertical distance between the floor and the underside o f the knee o f
a seated subject.
Body position: Sitting; knees flexed 90 degrees.
Reference: Selection o f dimensions for an anthropometric data base
Army Natick Research, Development and Research Center. Naitck,
01760-5000. 1986.
3. W O R K STA TIO N M EASU REM EN T
V IEW IN G DISTANCE FR O M SCREENThe distance from eye to the center o f screen.
V IEW DISTANCE FR O M SOURCE DOCUM ENTThe distance from eye to the center o f document.
VDT H E IG H TThe vertical distance from the floor to the center o f screen.
W O R K IN G TABLE H EIG H TThe vertical distance from the floor to the top o f working surface.
K EY BO A RD H EIG H TThe vertical distance from the floor to the top o f home row o f the keyboard.
. United States
Massachusetts
SEAT H E IG H TThe vertical distance from the floor to the seating surface without a seated person.
APPENDIX E
POSTURE ANALYSIS WORK SHEET
2 0 6
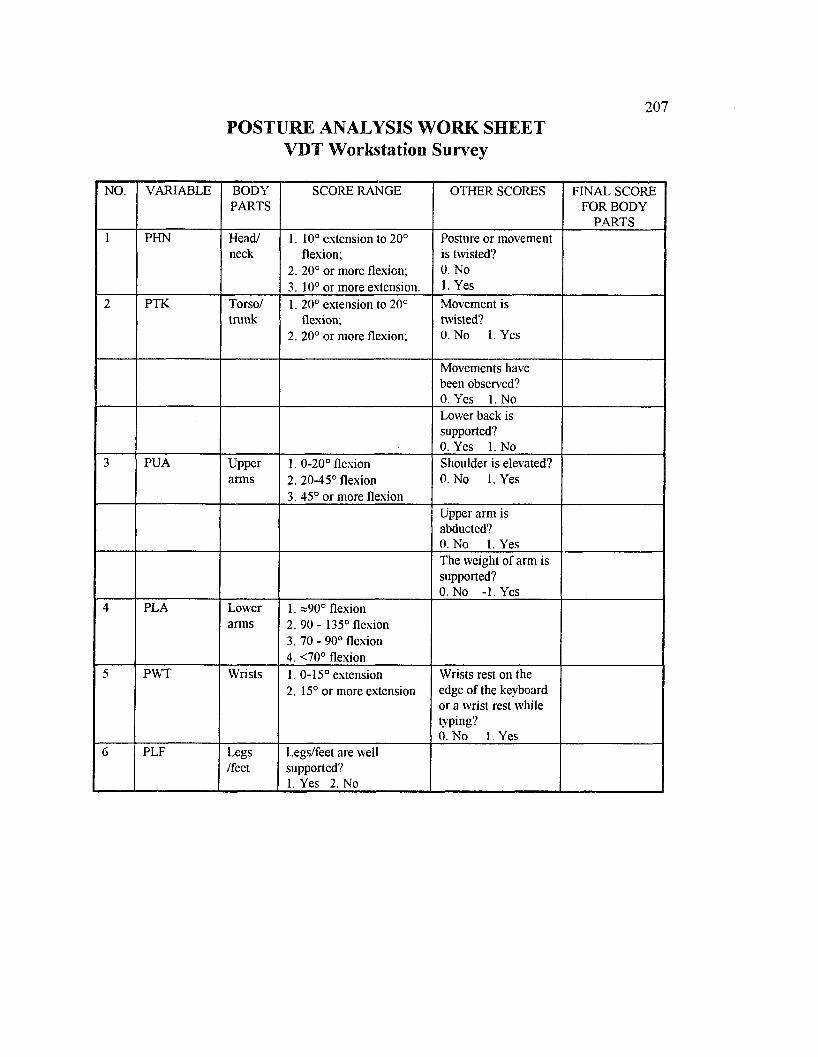
207
POSTURE ANALYSIS WORK SHEET VDT Workstation Survey
NO. VARIABLE BODYPARTS
SCORE RANGE OTHER SCORES FINAL SCORE FOR BODY
PARTS1 PHN Head/
neck1. 10° extension to 20°
flexion;2. 20° or more flexion;3. 10° or more extension.
Posture or movement is twisted?0. No1. Yes
2 PTK Torso/trunk
1. 20° extension to 20° flexion;
2. 20° or more flexion;
Movement is twisted?0. No 1. Yes
Movements have been observed?0. Yes 1. NoLower back is supported?0. Yes 1. No
3 PUA Upperarms
1. 0-20° flexion2. 20-45° flexion3. 45° or more flexion
Shoulder is elevated? 0. No 1. Yes
Upper arm is abducted?0. No 1. YesThe weight of arm is supported?0. No -1. Yes
4 PLA Lowerarms
1. »90° flexion2. 90 - 135° flexion3. 70 - 90° flexion4. <70° flexion
5 PWT Wrists 1. 0-15° extension2. 15° or more extension
Wrists rest on the edge of the keyboard or a wrist rest while typing?0. No 1. Yes
6 PLF Legs/feet
Legs/feet are well supported?1. Yes 2. No

VITA
Hongzheng Lu, female, was born in Beinging, the People's Republic o f China, on July
26, 1960. She enrolled in the Department o f Automation at China Textile University in
Shanghai in September 1978 and received a Bachelor's degree in Electrical Engineering
in July 1982. She worked as an electrical engineer from 1982 to 1983 in a textile plant.
After receiving a Master's degree in Industrial Automation from the same university in
April 1986, she worked as an instructor and researcher in the Department o f Mechanical
Engineering o f China Textile University from 1986 to 1989. In August 1989, she
enrolled in the Department o f Industrial and Manufacturing Systems Engineering at
Louisiana State University as a graduate student in an interdisciplinary Ph.D. program in
Engineering Science with concentration on ergonomics and minors in computer science
and manufacturing systems. She received a Maters's degree in Engineering Science from
Louisiana State University in December 1992.
She is a student member o f Ergonomics society, Human Factors and Ergonomics
society, and Institute o f Industrial Engineering. She is also a member o f Phi Kappa Phi,
a national honor society.
208
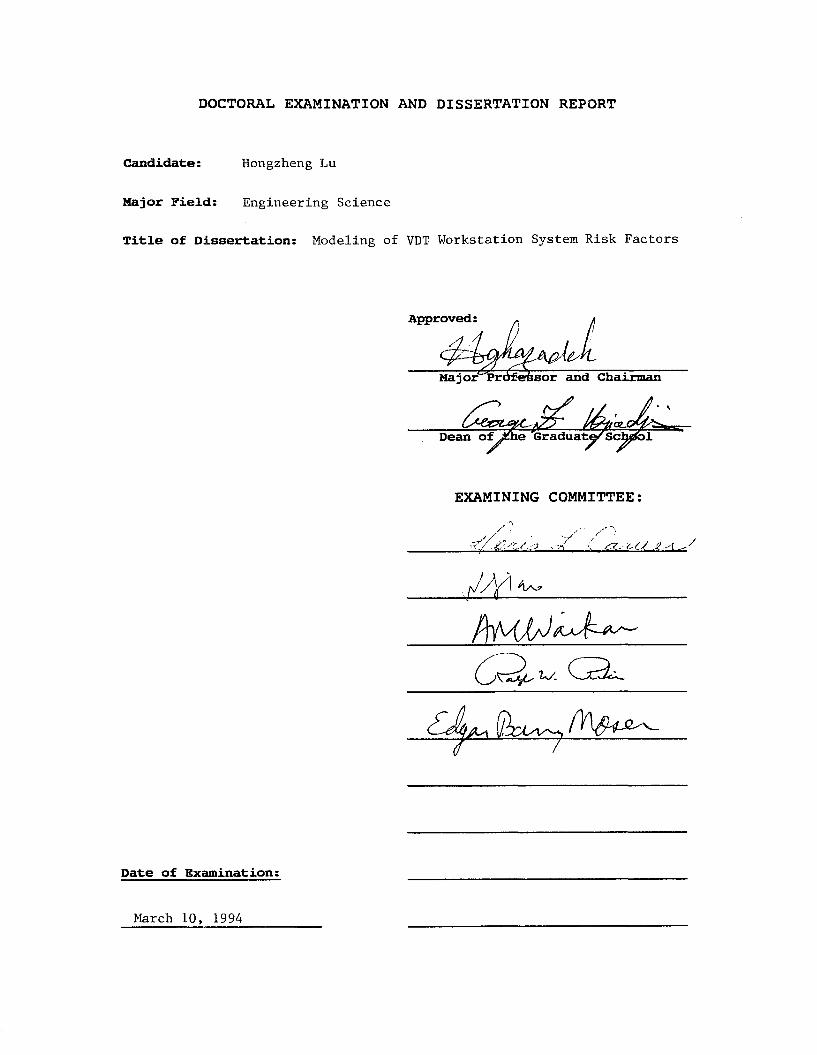
D O C TO R AL E X A M IN A T IO N AN D D IS S E R T A T IO N R EPO R T
Candidate: Hongzheng Lu
Major Field: Engineering Science
Title of Dissertation: Modeling of VDT Workstation System Risk Factors
Approved:
Major Pri sor and Chairman• \
Dean of le 'GraduatedSc;
E X A M IN IN G C O M M IT T E E :
v C . 4 X - - ^
Date of Examination:
March 10, 1994
Related Documents


![· hitac e-7300 . sev sev sev sev sov _ vdt kpr hit 2050 2050 vdt wc mac il pc98 wc (34) kcp mt vdt vdt vdt vdt vdt vdt vdt vdt vdt vdt wc (9) 20509— 20209 — c3cjc]c) cpu oku](https://static.cupdf.com/doc/110x72/5e7efcb6b66a945e22181068/hitac-e-7300-sev-sev-sev-sev-sov-vdt-kpr-hit-2050-2050-vdt-wc-mac-il-pc98-wc.jpg)