MODELING OF SOLAR CELLS by Balaji Padmanabhan A Thesis Presented in Partial Fulfillment of the Requirements for the Degree Master of Science ARIZONA STATE UNIVERSITY November 2008

Welcome message from author
This document is posted to help you gain knowledge. Please leave a comment to let me know what you think about it! Share it to your friends and learn new things together.
Transcript

MODELING OF SOLAR CELLS
by
Balaji Padmanabhan
A Thesis Presented in Partial Fulfillment of the Requirements for the Degree
Master of Science
ARIZONA STATE UNIVERSITY
November 2008
MODELING OF SOLAR CELLS
by
Balaji Padmanabhan
has been approved
November 2008
Graduate Supervisory Committee:
Dragica Vasileska, Chair Dieter K. Schroder
Denis Mamaluy
ACCEPTED BY GRADUATE COLLEGE

iii
ABSTRACT
Solar energy is becoming one of the primary sources of energy replacing fossil
fuels due to its abundance. Its versatility, abundance and environmental friendly have
made it one of the most promising renewable sources of energy. Solar cells convert this
solar energy into Electrical Energy used to drive various appliances. The effort to
improve the efficiency of these cells and the reduction of their costs has been a major
concern for a long time. Modeling of various structures of solar cells provides an insight
into the physics involved in its operation and better understanding of the ways to improve
their efficiency.
In this work a three dimensional Drift Diffusion Model has been developed and
has been used to simulate Silicon Solar cells. This model involves the self consistent
solution of the Poisson and Continuity Equations. A pn silicon solar cell has been
simulated to test the working of the code. Later a p+-p-n+ and n+-p-p+ structure of
various lengths has been simulated to understand the physics behind the operation of a
realistic silicon solar cell. Recombination mechanisms which play a crucial role in the
determination of the cell efficiency such as Radiative Recombination, SHR
recombination, Auger Recombination have been included in the code.
Light does not enter through all the regions of the device since the top metal
contact has some reflectivity and thus prevents the light to enter the device called the
Shadowing effect. Thus Shadowing effect tends to reduce the efficiency of the solar cell
as the effective number of electron hole pairs generated within the device has been
reduced and this is observed during simulation. The surface recombination effect has also

iv
been included for the surface of the window through which light enters the device and
this also tends to reduce the efficiency.
Finally the efficiency variation with the variation in the length of the device has
been simulated. Theoretically the efficiency increases initially with the increase in the
base length since the capture of higher wavelength photons or lower energy photons is
possible thus increasing the efficiency but with increase after a certain length a decrease
in the efficiency takes place due to the increase in the ratio of the length of the device to
the diffusion length. In this work the increase in the efficiency with length has been
simulated but the length could not be increased a lot to observe the decrease in efficiency
due to limitation of simulation time.

v
Dedicated to my parents,
Mr. M. Padmanabhan and Ms. P. Rohini
And my elder sister,
P.Krishnaveni
.

vi
ACKNOWLEDGMENTS
I would first like to thank my Professor Dr. Dragica Vasileska for her extensive support
in giving direction to my research, constant support and encouragement. I would like to
thank my committee members Dr. Dieter Schroder, Dr. Denis Mamaluy for
accommodating me irrespective of their busy schedules and providing me useful
information regarding my research. I would like to specially thank Dr. Dieter Schroder in
being an inspiration for me to take up the field of solid state devices not only as a field of
research but also as a career. I would like to acknowledge my research colleague Ashwin
Ashok for providing me with lot of information regarding Device simulation and helping
me out in my research. I would also like to thank my research colleagues and roommates
Sunil Baliga and Deepak Kamalanathan in providing guidelines to edit my thesis and also
provide stimulating discussions on the physics of the device. I thank my parents Mr. M.
Padmanabhan and Ms. P. Rohini and my elder sister P.Krishnaveni for being a great
support for me all throughout my research and my life.

vii
TABLE OF CONTENTS
Chapter Page
LIST OF FIGURES.......................................................................................................ix
INTRODUCTION..........................................................................................................1
I. Alternative sources of energy ...................................................................1
II. Generations of solar cells..........................................................................4
III. Ultimate limits in efficiency .....................................................................8
IV. Working of a solar cell ...........................................................................10
V. Solar cell modelling history....................................................................12
VI. Purpose and content of this thesis ...........................................................14
DRIFT DIFFUSION MODELING ...............................................................................15
I. Drift diffusion model ..............................................................................15
II. Scharfetter gummel discretization of continuity equations ......................17
A. Discretization of the Continuity Equation....................................17
B. Numerical Solution of Continuity equation using Bi-Conjugate
gradient stabilized method ......................................................................21
III. Poisson equation solver ..........................................................................28
A. Discretization of the 3D Poisson Equation ..................................28
B. Linearization of the Discretized 3D Poisson Equation .................31
C. Boundary Conditions ..................................................................33
SIMULATION RESULTS ...........................................................................................35
I. Structures simulated and inputs used for the simulation ..........................35
II. Simulation results under illumination .....................................................39

viii
III. Simulation results under illumination with shadowing and surface
recombination ....................................................................................................45
IV. Efficiency calculation and trends in efficiency........................................47
CONCLUSIONS AND FUTURE WORK ....................................................................50
I. Conclusions............................................................................................50
II. Future work............................................................................................51
References....................................................................................................................52

ix
LIST OF FIGURES
Figure Page
1.2 Global PV Installations by Year . ...............................................................................3
1.3 Best Research Cell Efficiencies .................................................................................4
1.4 First Generation Solar Cell Efficiencies . ...................................................................5
1.5 Second Generation Solar Cell Efficiencies ................................................................7
1.6 Third Generation Solar Cell Efficiencies ...................................................................7
1.7 Narrowing gap between Existing and Theoretical PV efficiencies . ............................8
1.8 Data showing potential magnitude of future improvements in performance across
device configurations ......................................................................................................9
1.9 Working of a pn diode solar cell . ............................................................................10
1.10 Current Voltage characteristics of solar cell . .........................................................11
2.1 Central difference scheme in 3D leading to a 7-point discretization stencil...............29
3.1 p-n junction Silicon Solar Cell .................................................................................36
3.2 Solar spectrum for AM 1.5.......................................................................................36
3.3 Absorption Coefficients Vs Wavelength for Silicon .................................................37
3.4 Simulated n+-p-p+ Silicon Solar cell structure .........................................................38
3.5 Current Density Vs Voltage for a pn junction Silicon Solar cell ...............................39
3.6 Equilibrium Potential Profile of an n+-p-p+ structure...............................................40
3.7 Equilibrium Electric Field of an n+-p-p+ structure ...................................................40
3.8 Equilibrium Electron Density Profile of an n+-p-p+ structure ..................................41
3.9 Equilibrium Hole Density Profile of an n+-p-p+ structure........................................41
3.10 Electron Density Profile of an n+-p-p+ structure under Illumination ......................42

x
3.11 Hole Density Profile of an n+-p-p+ structure under Illumination............................43
3.12 Potential Profile of an n+-p-p+ structure under Illumination...................................43
3.13 Difference in Electric field profile before and after simulation ...............................44
3.14 Simulations of Potential, Electron and Hole Density Carrier Profiles under no light
and under Illumination...................................................................................................45
3.15 Hole Density Profile under Illumination with Shadowing (n+-p-p+) ......................46
3.16 Efficiency Vs thickness of base (n+-p-p+)..............................................................48

Chapter 1
INTRODUCTION
I. ALTERNATIVE SOURCES OF ENERGY
Sun provides enormous amounts of energy powering oceans, atmospheric
currents, and cycle of evaporation and drives river flow, hurricanes and tornadoes that
destroy natural landscape. The San Francisco earthquake of 1906, with magnitude 7.8,
released an estimated 1017 joules of energy which sun delivers in one second. Earth’s
resource of oil mounts up to 3 trillion barrels containing 1.7×10²² joules of energy that
the sun supplies in 1.5 days. Humans annually use about 4.6×10²⁰ joules annually which
sun supplies in one hour. The sun continuously supplies about 1.2×1025 terawatts of
energy which is very much greater than any other renewable or non renewable sources of
energy can provide. This energy is much greater than the energy required by human
beings which is about 13 terawatts. By covering 0.16% of Earth’s land with 10% efficient
solar cells would provide 20 Terawatts of energy about twice of fossil fuel consumption
of the world including numerous nuclear fission reactors [1].
Solar energy is in abundance but only a little is used to directly power human
activities. About 80%-85% of our total energy comes from fossil fuels. These resources
are non renewable, fast depleting, produce greenhouse gases and other harmful
environmental pollutants [2]. Threat to climate is one of the main concerns in adopting
any resource as a primary source of energy. Fossil Fuels emit a large volume of green
house gas like CO2 into the atmosphere and disturb the ecological balance. These
emissions have been increasing due to overutilization of fuels to meet the ever expanding

2
needs of human society. The solutions for this problem are to use fossil fuels in
conjunction with carbon sequestration, nuclear power and solar power. Carbon
sequestration is an extremely difficult method since a large volume of space is required to
store the emitted green house gases and its maintenance is a very crucial issue. Nuclear
power seems to be a good option but the feasibility of deploying several thousands of
1Gegawatt power plants all over the world to meet the 10Tera watt demand of the society
is skeptical. The Uranium resource for these power plants on earth also gets exhausted in
this process in about 10 years after which the processing of sea water has to be adopted
which is also exhaustible and difficult. On the other hand shifting the focus on renewable
sources of energy is the ideal choice and solar power is by far the most prominent energy
source owing to its versatility, inexhaustible and environmental friendly features [1].
Figure 1.1 Annual Production of Oil [3]

3
The exhaustible nature of fossil fuels has also pushed us into the adoption of
renewable sources of energy as the future. Fig1.1 shows the plot of the annual production
of oil Vs year with a 2% annual growth and decline rate. We observe that these estimates
show a very steep decline of this resource after the year 2016 thus demanding the need
for an alternative source of energy [3]. The burgeoning solar cell market is maturing to
become a very profitable investment to industries resulting in an annual growth of 41% in
the last five years [4].
Figure 1.2 Global PV Installations by Year [4].

4
High costs and conversion efficiency have been the major bottlenecks in the
potential of solar power becoming a primary source of energy. Nowadays major research
done with the motive of improving the efficiency of these cells has brought this dream
closer to reality. New methods of harnessing the full spectrum of the sun’s wavelength,
mutlijunction solar cells (homojunctions and heterojunctions), and new materials for
making solar cells are paving way for solar power to be the emerging power resource for
the world at large.
Figure 1.3 Best Research Cell Efficiencies [5].
II. GENERATIONS OF SOLAR CELLS
Solar cells are categorized into three generations based on the order of their
prominence. Research is being conducted on all the three generations concurrently to

5
improve their efficiencies while the first generation solar cells comprise the major share
of commercial production about 89.7% in 2007 [6].
Large area, high quality and single junction devices form the ‘first generation’
solar cells. Reduction in production costs of this technology is nullified owing to high
energy and labor costs, material costs mostly for the silicon wafer, strengthened low-iron
glass cover sheet and costs of other encapsulants. This trend is continuing as the
photovoltaic industry is expanding. Although it has a broad spectral absorption range, the
high energy photons at the blue and violent end of the spectrum is wasted as heat [7].
Producing solar cells using high-efficiency processing sequences with high energy
conversion efficiency are thus favored provided they do not increase the complexity of
the solar cell. Theoretical limit on efficiency for single junction silicon solar cells i.e.
33% and this is also being reached very rapidly.
Figure 1.4 First Generation Solar Cell Efficiencies [7].
To address these problems of energy requirements and production costs of solar

6
cells a switch from ‘first generation’ to ‘second generation’ of thin-film cell technology
has been imminent. By eliminating the silicon wafer a major reduction in material costs
have been possible in the thin-film technology. They also have an advantage of
increasing the unit size from silicon (~100cm2) to glass plate (~1m2). Over time the
second generation solar cells are expected to bridge the gap between them and the first
generation cells with respect to energy conversion efficiency. With the increase in
dominance of this technology the costs of the constituent materials also goes up for top
cover and other encapsulants to give it a longer life [8].
The materials generally used in this thin film technology are cadmium telluride,
copper indium gallium arsenide, amorphous silicon and micromorphous silicon. These
materials reduce mass and therefore cost by forming substrates for supporting glass and
ceramics. Not only do they reduce costs but also promise very high energy conversion
efficiency. A trend towards shifting to second generation from first generation is showing
up but the commercialization of this technology has proven to be difficult [8]. Fortunately
with the development of new materials over the coming decades the future of thin-film
technology seems to be promising [6].
Research for improving solar cell performance by enhancing its efficiency and
pushing it closer to the thermodynamic limits has led to the development of third
generation solar cells [8]. To improve upon the poor electrical performance of the thin-
film technology by maintaining low production costs this technology includes among
others, non semiconductor technologies (including polymer based cells and biometrics)
[9].
7
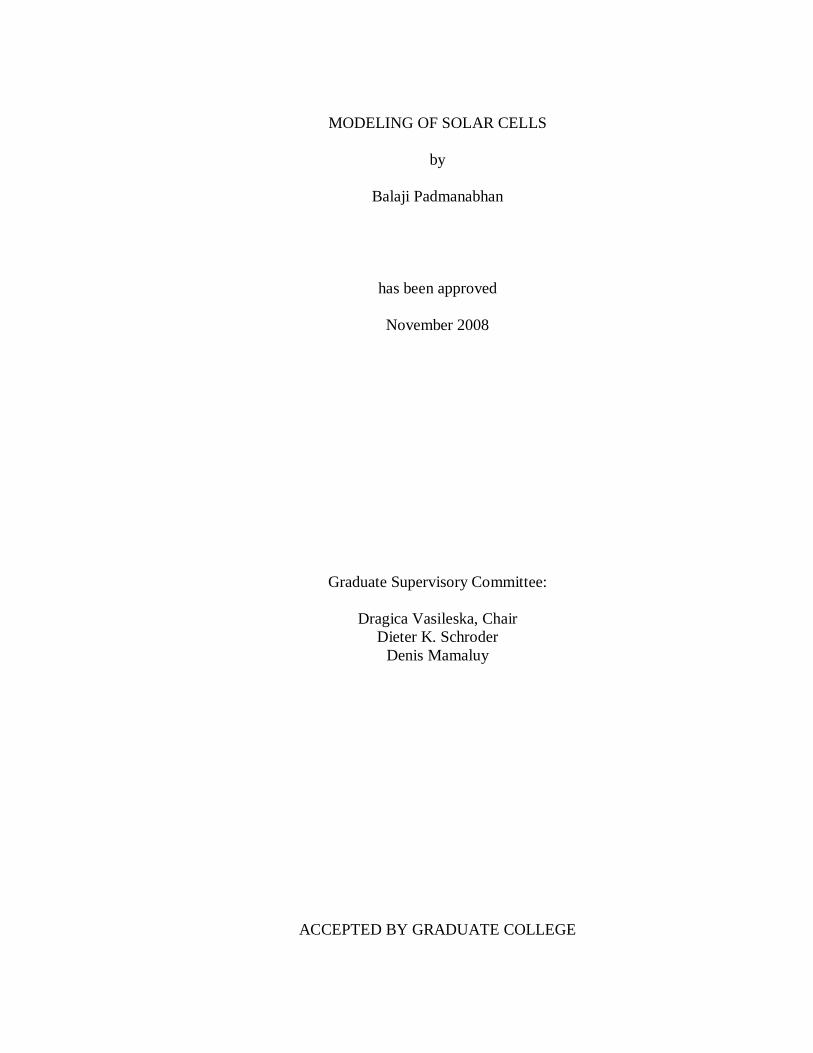
Figure 1.5 Second Generation Solar Cell Efficiencies [7]
The devices comprising the third generation solar cells are quantum dot
technologies, tandem/multi junction cells, hot-carrier cells, up conversion technologies
and solar thermal technologies like thermophotonics.
Figure 1.6 Third Generation Solar Cell Efficiencies [7].

8
III. ULTIMATE LIMITS IN EFFICIENCY
The steady evolutionary progress of the PV industry is the result of increase in
automation of production of thin film solar cells with increased efficiency and lower
costs. The need for revolutionizing breakthroughs in the PV industry is sometimes halted
by the advancements in the PV materials and manufacturing technology leading to
improvements in the cost competitiveness and the expansion of the PV market. By
shattering the old limits of efficiency and cost by bringing about innovations by
exploiting new understanding of physics and material science will become a fast paced
revolution [4].
Figure 1.7 Narrowing gap between Existing and Theoretical PV efficiencies [4].
The maximum theoretical limit for a single junction solar cell without sunlight
(one sun) is about 31% established by the Schokley-Quiesser limit. Under the highest
possible amount of sunlight i.e. 50,000 suns a single junction solar cell can have a

9
maximum efficiency of about 41%. This efficiency value can be increased by using
multi-junction solar cells by capturing more of the solar spectrum.
The true limit of efficiency is the thermodynamic limit of 68% for PV with one
sun concentration and is about 87% for maximum solar concentration. Research and
development in the PV industry are developing technologies based on concepts such as
multiple exciton generation, optical frequency shifting, multi energy level and hot carrier
devices. Carbon nanotubes, organic materials and other nanofabrication technologies
enable these concepts in practice [4].
Figure 1.8 Data showing potential magnitude of future improvements in performance across
device configurations [4].

10
IV. WORKING OF A SOLAR CELL
Figure 1.9 Working of a pn diode solar cell [10].
When light shines on a pn diode it generated electron-hole pairs across the whole
device. If the device is open circuited, the electron hole pairs generated near the depletion
region tend to recombine with the charge in the depletion region, thus reducing the
depletion region charge and eventually reducing the depletion region. The reduction in
depletion region is equivalent of applying a forward bias to the device i.e. this reduction
in depletion region tends to develop a potential across the open terminals of the device.
The maximum voltage that can be developed is the maximum forward drop across the

11
device which theoretically is possible with the complete elimination of the depletion
region. This maximum voltage that can be developed across the open circuited device is
called the open circuit voltage represented by the point C in Fig 1.9. If the device is short
circuited, the generated holes and electrons produce a current corresponding to the
incoming photons. This current is called the short circuit current represented by the point
A in Fig 1.9. When the pn device is used to drive an external load say ‘R’ the region of
operation is somewhere in between these two points. The reason being a current I flow
through the device which creates a drop across the resistor and the direction of the current
is such that the device comes into forward bias condition. As there is some drop across
the load and the device the maximum output voltage is not equal to open circuit voltage.
The forward bias conducts the device in the direction opposite to the current generated by
the photons called the dark current. The presence of the dark current does not allow the
device to operate at short circuit current. Thus the device operates in the fourth quadrant
where the voltage is positive but the current is negative making the power negative i.e.
the device generates power using light as source.
Figure 1.10 Current Voltage characteristics of solar cell [10].

12
V. SOLAR CELL MODELLING HISTORY
The photovoltaic community has demonstrated and proposed a wide variety of
solar cell structures using a wide range of photovoltaic semiconductor materials.
Numerical modeling has proved to be a valuable tool in understanding the operation of
these devices. There are several numerical solar cell simulation programs in use. The first
solar cell program was developed by Mark S. Lundstrom as part of his PhD Thesis [11].
Other programs developed at Purdue University at later times include Thin-Film
Semiconductor Simulation Program (TFSSP) [12], Solar Cell Analysis Program in 1
Dimension (SCAPlD), Solar Cell Analysis Program in 2 Dimension (SCAP2D) [13],
PUPHS, and PUPHS2D [14]. These have been used to model a number of solar cells -
thin-film Si:H, CdS/CIS, CdS/CdTe, Si, Ge, & GaAs cells in one spatial dimension and
high efficiency Si and GaAs solar cells in two-dimensions.
One-dimensional simulations are usually adequate for conventional geometry
solar cells, especially at low solar intensities and for semiconductor materials that are not
well characterized. At high intensities, 2D effects can become important even in
conventional geometry solar cells and many high efficiency cell designs require 2D
simulations or even 3D simulations. The interdigitated back contact solar cell is an
example of a 2D geometry and the point contact solar cell is an example of an inherently
3D geometry.
While the basic approach to modeling any of these devices is essentially the same,
special purpose codes have typically been developed for each material. This usually

13
makes modification tedious since many different codes must be updated and tested.
ADEPT (A Device Emulation Program and Toolbox) has been developed to address this
problem by unifying the common components of all these codes [[12], [15]]. In addition,
ADEPT was being developed to be a tool to examine novel materials and device
structures.
Today, there are numerous solar cell programs developed by researchers from all
over the world and there are also commercial simulation tools that can do solar cells
modeling. Among those the best programs are probably Silvaco [16] and Crosslight [17],
even though Synopsis has announced that it also has some solar cell simulation
capabilities [18]. In SILVACO, TFT is an advanced device technology simulator
equipped with the physical models and specialized numerical techniques required to
simulate amorphous or polysilicon devices including thin film transistors. Specialized
applications include the large area display electronics such as Flat Panel Displays (FPDs)
and solar cells. In Crosslight, APSYS, Advanced Physical Models of Semiconductor
Devices, is based on 2D/3D finite element analysis of electrical, optical and thermal
properties of compound and silicon semiconductor devices. Emphasis has been placed on
band structure engineering and quantum mechanical effects. Inclusion of various optical
modules also makes this simulation package attractive for applications involving
photosensitive or light emitting devices and solar cells. For Si rear-contacted cells (RCC)
with textured front surface, RT techniques are utilized to compute the enhanced optic
absorption. Conversion efficiency could be improved with about 20.7% percent for
certain textured devices and good agreement with the experimental can be obtained.

14
Other Si cells, like passivated emitter, rear totally diffused (PERT), and passivated
emitter, rear locally diffused (PERL) cells can also be modeled with APSYS. While EDA
giant Synopsys Inc hasn’t formally announced its solar cell simulation technology, the
company discussed the capabilities of its Sentaurus technology as applied to solar cell
design during the Semicon West tradeshow held in July, 2008.
VI. PURPOSE AND CONTENT OF THIS THESIS
The purpose of this M.S. Thesis was to develop an in-house 3D drift-diffusion
solar cell code that includes shadowing effects and utilize this code in the simulation of a
prototypical Si solar cell. The existence of an in-house tool has the advantage that we can
do modifications of the tool to include effects not covered in the above-described
commercial simulation modules. Other purpose of this tool is to serve as a test-bed for the
development of a Monte Carlo simulator for modeling solar cells that also includes the
degradation in the solar cell efficiency due to lattice heating.
The thesis is organized as follows: In Chapter 2 we describe in details the
theoretical model implemented in the simulator and the numerical methods used for the
solution of the 3D Poisson and the 3D electron and hole continuity equations. In Chapter
3 the results of the structures simulated have been presented. The I-V plots, Carrier
density distributions, Potential profiles, Electric field profiles, effect of Shadowing,
efficiency variation with the length of the device has been presented. In the final Chapter
i.e. Chapter 4 the summary and future work haven been stated.

Chapter 2
DRIFT DIFFUSION MODELING
I. DRIFT DIFFUSION MODEL
The semi classical transport of charges can be explained using BTE (Boltzmann
Transport equation). However, the direct analytical solution of the BTE is difficult
combined with the field solvers for device simulation. Therefore the predominant model
providing solutions for the Drift Diffusion equations is generally used for traditional
semiconductor device modeling. In this model the electric fields and spatial gradient of
the carrier density is localized i.e. the current at a particular point only depends on the
instantaneous electric field and concentration gradient of carriers at that point.
The drift diffusion equations can be obtained by solving the BTE (Boltzmann
Transport equation) by solving for the moments of this equation. For steady-state and 1D
geometry, the use of relaxation time approximation for the BTE results in
τ),(
*0 xvff
v
fv
v
f
m
eE −=
∂∂+
∂∂
(2.1)
The assumption of parabolic bands has been considered for simplicity. The
current density is defined as,
∫= dvxvvfexJ ),()( (2.2)

16
Here, the integral on the right –hand side represents the first moment of the
distribution function. By multiplying eq. (2.1) by v on both sides and integrating over v
we can relate it to the definition of the current. We thus obtain,
[ ]ττ e
xJdvxvvfdvvf
)(),(
10 −=−∫∫ (2.3)
Since the equilibrium distribution function is symmetric inv , the first integral
goes to zero. Therefore, we have
−∂∂−= ∫∫ dvxvfv
dx
ddv
v
fv
m
eEexJ ),(
*)( 2τ (2.4)
Integrating the above equation by parts we get,
)(),()],([ xndvxvfxvvfdvv
fv −=−=
∂∂
∫∫∞
∞− (2.5)
The above equation can be written as,
22 )(),( vxndvxvfv =∫ (2.6)
Here, 2v represents the average of the square of the velocity. By introducing
mobility */ meτµ = and assuming that most of the average carrier energy (that is
proportional to 2v ) is due to the random thermal motion of the carriers we can replace
this term with its equilibrium value i.e. */ mTkB in 1D case and */3 mTkB for 3D. By
introducing the Diffusion coefficient D we obtain the drift diffusion equations as,

17
dx
dnqDxExqnJ nnn += )()( µ
dx
dpqDxExqpJ ppp −= )()( µ (2.7)
Even though no assumptions were made for the non-equilibrium distribution
function ),( xvf the choice of the thermal velocity signifies that the-drift diffusion
equations are only valid for small perturbations from the equilibrium state (low fields).
Numerical schemes involving solution of the continuity equations follow the rules
that the total charge inside the device as well as the charge leaving and entering the
device must be considered. Carrier density localized in a place has to be positive i.e.
negative density is unphysical. Also, no spurious space oscillations have to be introduced
i.e. monotonicity of the solution has to be maintained [19]. The complete drift-diffusion
model, which includes the Poisson Equation and the continuity equations for electrons
and holes is given below:
II. SCHARFETTER GUMMEL DISCRETIZATION OF CONTINUITY EQUATIONS
A. Discretization of the Continuity Equation
Generally, conservative schemes are achieved by subdivision of the
computational domain into boxes surrounding the mesh points. Currents are defined on

18
the boundaries of these elements, thus enforcing conservation. Consider the 1D electron
current continuity equation under steady state equations:
GJe n =∇.1
(2.8)
which by using half-point difference expansion based on the centered difference scheme,
gives:
i
ni
ni G
JJ
e=
∆− −+ )(
1 2/12/1 (2.9)
where,
dx
dneDEenJ n
iini
ni 2/12/12/12/1 ++++ += µ (2.10)
ni
ni
ni
ini
eD
J
D
En
dx
dn
2/1
2/1
2/1
2/12/1
+
+
+
++ =+µ
(2.11)
ni
ni
t
ini
eD
J
V
En
dx
dn
2/1
2/12/12/1
+
+++ =−µ
(2.12)
We make use of the following,
∆Ψ−Ψ
Ψ=Ψ
Ψ= + ii
d
dn
dx
d
d
dn
dx
dn 1 (2.13)
to get,
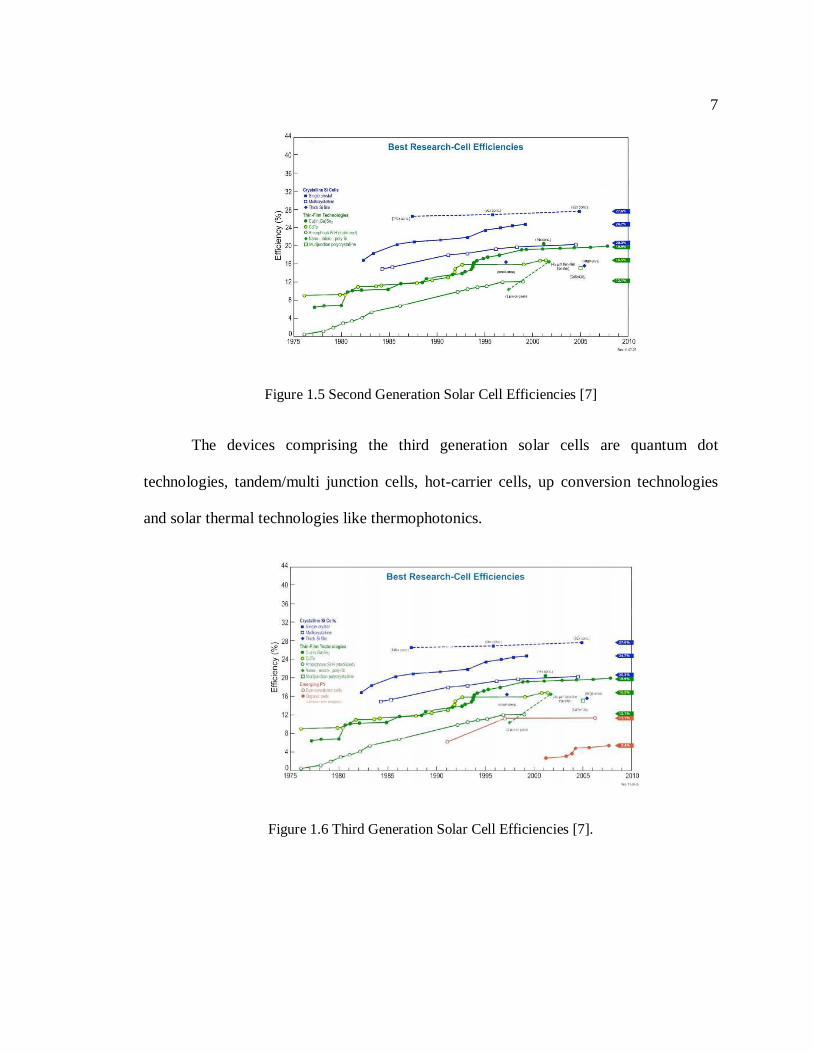
19
ni
ni
iit D
J
eV
n
d
dn
2/1
2/1
1 )( +
+
+ Ψ−Ψ∆=−
Ψ (2.14)
Using Laplace transform and the conditions,
ii nn =Ψ )( 11)( ++ =Ψ ii nn (2.15)
We get,
)()](1[)( 1 Ψ+Ψ−=Ψ + gngnn ii (2.16)
where,
1
1)(
1
−
−=Ψ Ψ−Ψ
Ψ−Ψ
+
t
ii
t
i
V
V
e
eg (2.17)
Therefore,
)]()([ 111
2/12/1
t
iii
t
iii
nin
i VBn
VBn
eDJ ++
++
+Ψ−Ψ
−Ψ−Ψ
∆= (2.18)
In the above equation )(xB is Bernoulli function,1
)(−
=xe
xxB
Similarly,
)]()([ 11
12/12/1
t
iii
t
iii
nin
i VBn
VBn
eDJ
Ψ−Ψ−
Ψ−Ψ∆
= −−
−−− (2.19)

20
The equations (2.18) and (2.19) represent the discretization of the current density
expressions that can be used to calculate the total current in the device. Thus, the
discretized form of continuity equations for electrons and holes respectively is,
iit
iini
t
iini
t
iini
iit
iini
GnV
BD
VB
D
VB
Dnn
VB
D
=Ψ−Ψ
∆+
Ψ−Ψ∆
+Ψ−Ψ
∆−
Ψ−Ψ∆
−−−
++−−+
++
11
22/1
12
2/112
2/11
12
2/1
)(
)]()([)(
(2.20)
iit
iip
i
t
iip
i
t
iip
iii
t
iip
i
GpV
BD
VB
D
VB
Dpp
VB
D
=Ψ−Ψ
∆+
Ψ−Ψ∆
+Ψ−Ψ
∆−
Ψ−Ψ∆
+++
++−−−
−−
11
22/1
12
2/112
2/11
12
2/1
)(
)]()([)(
(2.21)
Scharfetter-Gummel scheme leads to positive definitive matrices eliminating the
occurrence of complex Eigen valued coefficient matrices. Therefore the SOR (Successive
over relaxation method) can be used as a numerical computation method. Linear
interpolation schemes can be used in determining the half point values for the diffusion
coefficient and carrier mobility,
21
2/1+
++
= iii
DDD
21
2/1+
++
= iii
µµµ (2.22)
Bernoulli function can be defined in the following way,

21
≥<≤
≤≤−
<≤−
<≤−
<−
=
−
−
−
5
54
43
32
21
1
,0
,
,1
,2
1
,1
,
)(
xx
xxxxe
xxxe
xe
xxxx
xxxe
x
xxx
xB
x
x
x
x
(2.23)
where, 1x through 5x depend upon the computer [20].
B. Numerical Solution of Continuity equation using Bi-Conjugate gradient stabilized
method
Conjugate gradient methods are very effective to solve large system of linear
equations. The equations of the type,
bAx = (2.24)
where x is an unknown vector, b is a known vector and A is a known square,
symmetric, positive definite matrix ( or positive indefinite matrix). Many numerical
systems involving finite difference and finite element methods adopt this method to solve
set of partial difference equations. These methods are generally used with sparse
matrices. Dense matrices are very hard to solve as they have to be factorized which
would take the same time as to solve it iteratively. Factorizing requires a lot of memory
and it is much slower than the iterative methods. By the use of sparse matrices the
efficiency and the memory utilization of the numerical methods improves [21].

22
This algorithm is used for a function of n variables for finding its local minimum
under the assumption that the gradient of the function can be computed. Conjugate
directions is used instead of local gradient for going downhill unlike steepest decent
method and if the vicinity of the minimum is in the shape of a long narrow valley
convergence is achieved much faster than the steepest decent method. It is the oldest and
best known non stationary method for solving positive definite systems effectively.
Vector sequences of iterations which are successive approximations to the
solution are generated, residues corresponding to these iterations are computed and
directions used in updating these residues and iterations are searched for. The memory
utilized by this algorithm is less since only a small number of sequences are required to
be stored although the length of these vectors is large. In order to compute update scalars
that are defined to make the sequences satisfy certain orthogonality conditions two inner
products are performed for every iteration in this method. These conditions imply that the
distance to the true solution is minimized on a positive definitive linear system.
The search direction vector )(ip is found by updating the iterates )(ix in every
iteration by a multiple iα ,
)()1()( ii
ii pxx α+= − (2.25)
The residuals )()( ii Axbr −= are updated as,
)()1()( ii
ii qrr α−= − (2.26)

23
where,
)()( ii Apq = (2.27)
The proper choice of α i.e. )()(
)1()1(
ii
ii
iApp
rrT
T −−
=α minimizes )(1)( ii rArT − over all possible
choices of α . The residuals used in updating the search vectors are,
)1(1
)()( −−+= i
iii prp β (2.28)
where,
)1()1(
)()(
−−=
ii
ii
irr
rrT
T
β (2.29)
This choice of iβ is done to ensure that )(ip and )1( −iAp i.e. the residuals Tir )( and )1( −ir
are orthogonal. It also makes )(ip and Tir )( orthogonal to all previous )( jAp and
Tjr )(
respectively. This algorithm is not preconditioned. The preconditioned form of Conjugate
gradient method is done by using a preconditioner M (when M = 1 it is without
preconditioning). Thus, the pseudocode for preconditioned conjugate gradient method is,
Compute )0()0( Axbr −= for some initial guess )0(x . For every value of i we
solve for )1()1( −− = ii rMz and we have )1()1(1
−−− = ii
i zrT
ρ . The value of )(ip is,
)0()1( zp = (If 1=i ) else )1(1
)1()( −−
− += ii
ii pzp β where,

24
2
11
−
−− =
i
ii ρ
ρβ
The values of )(iq , iα , )(ix and )(ir are updated till convergence is reached.
)()( ii Apq =
)()(
1
ii
ii
qpT
−=ρα
)()1()( ii
ii pxx α+= − )()1()( ii
ii qrr α−= −
Conjugate gradient method has one matrix vector product, two inner products and
three vector updates per iteration. This makes it computationally very attractive [22].
The residual vectors for non symmetric systems cannot be made orthogonal and
therefore conjugate gradient method cannot be used to solve such systems. The
orthogonality of the residues can be maintained by using long sequences as per the
generalized minimal residual method but at the cost of lot of storage space. Another
approach can be followed by using two mutually orthogonal sequences instead of the
orthogonal sequences of residuals called the Bi conjugate gradient Method (BCG).The
update sequences of the two residuals are,
)()1()( ii
ii Aprr α−= − )(~)1(~)(~ iTi
ii pArr α−= − (2.30)
and the two search direction vectors are,

25
)1(1
)1()( −−
− += ii
ii prp β )1(~1
)1(~)(~ −−
− += ii
ii prp β (2.31)
The choices are,
)()(~
)1()1(~
ii
ii
iApp
rrT
T −−
=α )1()1(~
)()(~
−−=
ii
ii
irr
rrT
T
β (2.32)
ensuring orthogonality relations,
0)()(~)()(~ == jiji ApprrTT
(2.33)
Thus we observe that updates for the residuals in conjugate gradient method are
augmented in the bi-conjugate gradient method by the relations that are similar but based
on TA instead ofA [22].
The algorithm for BCG method is, (if ji ≠ )
Compute )0()0( Axbr −= for some initial guess )0(x . Choose )0(~r (for example
)0()0(~ rr = ). For every value of i we solve for )1()1( −− = ii rMz and )1(~)1(~ −− = iiT rzM . We
also have )1(~)1(1
−−− = ii
i rzT
ρ . If 01 =−iρ then the method fails. The value of )(ip and
)(~ ip are,
)1()( −= ii zp )1(~)(~ −= ii zp (If 1=i )
else )1(1
)1()( −−
− += ii
ii pzp β )1(~1
)1(~)(~ −−
− += ii
ii pzp β where,

26
2
11
−
−− =
i
ii ρ
ρβ
The values of )(iq , )(~ iq , iα , )(ix , )(ir and )(~ ir are updated till convergence is
reached as,
)()( ii Apq = )(~)(~ iTi pAq =
)()(
1
ii
ii
qpT
−=ρα
)()1()( ii
ii pxx α+= −
)()1()( ii
ii qrr α−= − )(~)1(~)(~ ii
ii qrr α−= −
The above algorithm when used for positive definite symmetric matrices gives the
same result as the conjugate gradient stabilized method but at twice the cost per iteration.
For non symmetric matrices this method is more or less similar to the generalized
minimal residue method although a significant reduction in the norm of the residual is
observed.
To avoid the irregular pattern in the convergence of the conjugate gradient
squared method the Bi-conjugate gradient stabilized method was developed. Instead of
computing the conjugate gradient squared method sequence )0(2 )( rAPi i→ , BCGSTAB
uses )0()()( rAPAQi ii→ where Q is an thi degree polynomial describing the steepest
decent update. This algorithm requires two-matrix vector products, four inner products

27
which is two more than the conjugate gradient squared method or the bi-conjugate
gradient method. The algorithm is [22],
Compute )0()0( Axbr −= for some initial guess )0(x . Choose )0(~r (for example
)0()0(~ rr = ). For every value of i we calculate )1(~1
−− = iT
i rrρ . If 01 =−iρ then the
method fails. The value of )(ip is,
)1()( −= ii rp (If 1=i ) else )( )1(1
)1(1
)1()( −−
−−
− −+= ii
ii
ii vprp ωβ where,
))((1
1
2
11
−
−
−
−− =
i
i
i
ii ω
αρρβ
We solve for )(~ ipMp = . The values of iα and s are given by,
)(~
1iT
ii vr
−=ρα )()1( i
ii vrs α−= −
We check norm ofs ; if small enough: set ~)1()( pxx iii α+= − and stop. We then solve
for sMs =~ . We updatet , iω , )(ix and )(ir till convergence is achieved,
~Ast =
tt
stT
T
i =ω
~~)1()( spxx iiii ωα ++= −

28
tsr ii ω−=)(
III. POISSON EQUATION SOLVER
A. Discretization of the 3D Poisson Equation
The potential variation in a semiconductor device can be determined by solving
the Poisson equation,
)().( +− −+−==∇∇ DA NNpnqρψε (2.24)
where ε is the dielectric constant of the corresponding semiconductor, ψ is the
electrostatic potential, ρ is the total charge density, q is the elementary charge, n is the
electron concentration, p represents the hole concentration, AN − is the ionized acceptor
concentration and DN + is the ionized donor concentration.
The electron and hole densities at thermal equilibrium for non degenerate
materials is given by,
( )F i
B
E E
k Tin n e
−
= ( )i F
B
E E
k Tip p e
−
= (2.25)
where n and p represent the electron and hole concentration respectively, ni is the
intrinsic carrier concentration, EF is the Fermi Energy level and Ei the intrinsic energy
level. Taking EF =0 i.e. the Fermi energy level being the reference and representing
Energy in terms of potential i.e. iE qψ= − we get,

29
in n eφ= ip p e φ−= (2.26)
Here ψ represents the potential,φ represents the normalized potential i.e. ψ is
normalized with the thermal voltage /T BV k T q= . Assuming the device is made of the
same material i.e. no variation inε , Poisson equation can be represented as
2 '( )i
T
qne e C
Vφ φφ
ε−∇ = + + (2.27)
where the normalized dopant concentration is represented by 'C and ' ( ) /A D iC N N n− += −
Figure 2.1 Central difference scheme in 3D leading to a 7-point discretization stencil
Expressing the second derivative of the potential in the Poisson equation using the
Central difference scheme as shown in Figure 2.1 in all the three directions we obtain,
2, , 1, , , , 1, ,
21 1 1 1
2 2 2
( ) ( )i j k i j k i j k i j k
i i i i i i i ix x x x x x x x x
φ φ φ φ+ −
− − − −
∂= − +
∂ + + (2.28)

30
2, , , 1, , , , 1,
21 1 1 1
2 2 2
( ) ( )i j k i j k i j k i j k
j j j j j j j jy y y y y y y y y
φ φ φ φ+ −
− − − −
∂= − +
∂ + +, and (2.29)
2, , , , 1 , , , , 1
21 1 1 1
2 2 2
( ) ( )i j k i j k i j k i j k
k k k k k k k kz z z z z z z z z
φ φ φ φ+ −
− − − −
∂= − +
∂ + + (2.30)
By combining all these three equations we can get the expression for 2φ∇ . The mesh
sizes along the x, y and z direction are given byix , jy and kz , respectively, as shown in
Figure 2.1. Thus the finite-difference representation of the 3D Poisson equation is given
by,
1, , , , 1, , , , , 1, , , , 1, , ,
1 1 1 1 1 1( ) ( ) ( ) ( )i j k i j k i j k i j k i j k i j k i j k i j k
i i i i i i j j j j j jx x x x x x y y y y y y
φ φ φ φ φ φ φ φ+ − + −
− − − − − −
− − − −+ + + +
+ + + +
, , 1 , , , , 1 , , ', , , , , ,2
1 1 1
1( )
( ) ( ) 2i j k i j k i j k i j k
i j k i j k i j kk k k k k k D
C n pz z z z z z L
φ φ φ φ+ −
− − −
− −+ + = + −
+ + (2.31)
where the intrinsic Debye length, ( )D T iL V qnε= . The carrier concentrations n and p
are normalized by the intrinsic concentration, ni as given by Equation (2.31). The above
equation can also be represented as,
, , , , 1 , , , 1, , , 1, , , , , ,i j k i j k i j k i j k i j k i j k i j k i j kB C D Eφ φ φ φ− − −+ + + +
, , 1, , , , , 1, , , , , 1 , ,i j k i j k i j k i j k i j k i j k i j kF G H Qφ φ φ+ + ++ + + = (2.32)
where

31
, ,1 1
2
( )i j kk k k
Bz z z− −
=+
, ,1 1
2
( )i j kj j j
Cy y y− −
=+
, ,1 1
2
( )i j ki i i
Dx x x− −
=+
, ,1
2
( )i j ki i i
Fx x x −
=+
(2.33)
, ,1
2
( )i j kj j j
Gy y y −
=+
, ,1
2
( )i j kk k k
Hz z z −
=+
,
, ,1 1 1
2 2 2i j k
i i j j k k
Ex x y y z z− − −
= − + +
( )'
, , , , , , , ,i j k i j k i j k i j kQ C n p= + −
It is important to note that all the discretization increments ix , jy and kz appearing in Eq.
(3.10), are normalized with the intrinsic Debye length DL . Charge neutrality condition is
used to calculate the initial concentration for n and p for a good initial guess for potential
in the RHS of equation (2.32).
B. Linearization of the Discretized 3D Poisson Equation
A matrix equation Ax=b is formed when the Poisson equation of the form as
represented in equation (2.32) is solved for the entire device divided into nodes. Here A is
the discretization matrix, x is the unknown potential and b is the forcing function, also
called the forcing vector (charge, in the case of Poisson equation). This form of the
equation cannot be directly used to numerically solve for the potential profile in the
device as it leads to instabilities since the RHS of the equation (2.32) has an exponential
relation to the potential φ through the carrier concentrations n and p. The center

32
coefficient E is not diagonally dominant as compared to the other coefficients B, C, D, F,
G and H in the matrix A. Fast convergence demands the matrix to be diagonally dominant
i.e. the coefficient on the diagonal is larger than the sum of the other non diagonal
elements. In order to achieve diagonal dominance for the coefficient matrix A Poisson
equation has to be linearised. To achieve the above the first update of the potential is
defined as [23]
1n n nφ φ δ+ = + (2.34)
where the potential in the next update is 1nφ + and is calculated by using the potential from
the previous iteration nφ and a correction factornδ . By substituting the above variables
in the Poisson equation we get,
( )2 1 '2
1 n n n nn
D
e e CL
φ δ φ δφ + + − −∇ = − + (2.35)
Assuming the update of potential between iterations being small i.e. for small δ
Taylor’s series can be used for the exponential function 1e δ δ± = ± . Thus the Poisson
equation becomes,
( ) ( )2 1 '2 2
1 1n n n nn n
D D
e e C e eL L
φ φ φ φφ δ+ − −∇ = − + + − (2.36)
By replacing nδ in equation (2.36) with 1nφ + and nφ by using equation (2.34) we obtain,
( ) ( ) ( )2 1 1 '2 2 2
1 1 1n n n n n nn n n
D D D
e e e e C e eL L L
φ φ φ φ φ φφ φ φ+ − + − −∇ − − = − + − − (2.37)

33
In the above equation index n represents the iteration number and not the node
number. By using central difference scheme equation (2.37) can be expressed in terms of
equation (2.32). The center coefficient E and the forcing function Q can be expressed as
[24],
( ), , , , , ,21 1 1
2 2 2 1i j k i j k i j k
i i j j k k D
E n px x y y z z L− − −
= − + + − +
( ) ( )', , , , , , , , , , , , , ,2
1i j k i j k i j k i j k i j k i j k i j k
D
Q C n p n pL
φ= + − − + (2.38)
To make the center coefficient diagonally dominant and increase the speed and
stability of the convergence the linearization of Poisson equation is done. In addition the
center coefficient is now dependent on the electron and hole carrier concentrations, thus
have to be updated for every iteration. Aφ
C. Boundary Conditions
Ohmic and artificial contacts in the device structure can be described by making
modifications to the coefficients B through H, and the forcing function Q. These
modifications are,
• Ohmic contacts are implemented by fixing the potential at these points equal to
the sum of the external bias applied Aφ and the potential due to charge
neutrality bV . This is called Dirichlet condition and is implemented as,

34
A bVφ φ= + , (2.39)
0B C D F G H= = = = = = , 1E = and A bQ Vφ= + . (2.40)
• Simulation domain is fixed in size and therefore has to be truncated. This can be
done by using artificial boundaries and the boundary condition enforced is called
Neumann condition. It is implemented by making the field across the boundary
equal to zero i.e.,
0r
φ∂ =∂� . (2.41)
Using central difference scheme equation (2.41) can be written as,
1 1 0i i
ix
φ φ+ −− = or 1 1i iφ φ+ −= , (2.42)
The same concept is also used for the other directions. Using equation (2.42) in
the discretization of the coefficients B through H we obtain,
0z = : 0B = , 2H H= , maxz z= : 2B B= , 0H = ,
0y = : 0C = , 2G G= , maxy y= : 2C C= , 0G = , (2.43)
0x = : 0D = , 2F F= , maxx x= : 2D D= , 0F = .

Chapter 3
SIMULATION RESULTS
The theory behind the simulation of the solar cells and the corresponding models
used was explained in Chapter 2. The self consistent solution of the Poisson and
continuity equations is used to simulate the potential and carrier profiles in the device. By
extracting the current densities from the simulation, open circuit voltage and short circuit
current can be evaluated to find the efficiency of the silicon solar cell.
The following Chapter is divided broadly into four parts; first part explains the
silicon solar cell structures simulated and the inputs regarding the solar radiation and
absorption coefficients of the material, second part presents the simulation results for
these structures under illumination without any shadowing or surface recombination
effects i.e. assuming transparent contacts, third part of the chapter deals with the
simulation of these structures with shadowing and surface recombination effects and the
final part explains the methodology adapted in calculation of efficiency and the plots for
the trends in efficiency with the variation in structure dimensions is presented.
I. STRUCTURES SIMULATED AND INPUTS USED FOR THE SIMULATION
Initially to inspect the effectiveness of drift-diffusion modeling for solar cells a
1D simulation for a p-n junction silicon solar cell was performed. It is a single junction
with uniformly doped layers and a single sun radiation is utilized as the energy source for
the device. The device is simulated with the assumption of transparent contact i.e. no
shadowing and surface recombination.

36
Figure 3.1 p-n junction Silicon Solar Cell
The solar radiation which is used in this simulation is the ASTM G173-03
Reference spectra derived from SMARTS v. 2.9.2 for AM1.5 one sun. The solar
spectrum used is,
Figure 3.2 Solar spectrum for AM 1.5

37
The solar spectrum in Figure 3.2 is used to input the Photon Intensity into the
simulation which is utilized to calculate the number of carrier contribution by individual
wavelengths in the solar cell. The other parameter which is required to find out the
effective number of photons absorbed i.e. the extent to which the device absorbs energy
is a material and wavelength dependent parameter called the absorption coefficient. It
thus helps in describing the energy propagation through a homogeneous system [25]. The
absorption coefficient for silicon is poor since it is an indirect band gap material i.e. the
bottom of the conduction band and the top of the valence band are not aligned at the same
wave vector. This demands change in energy as well as momentum for the photon to be
absorbed to generate carriers contributing to current thus reducing the probability for the
absorption of photons and resulting in lower values of absorption coefficients.
Figure 3.3 Absorption Coefficients Vs Wavelength for Silicon

38
The structure simulated to emulate the realistic solar cell is an n+-p-p+ structure
with the p+ region forming the bottom contact and the n+ region forming the top surface.
The structure is simulated for 25% and 50% of top metal and the rest of the window
exposed to the solar radiation and prone to surface recombination phenomenon.
Figure 3.4 Simulated n+-p-p+ Silicon Solar cell structure
The structure is simulated for various base thicknesses i.e. 2.4µm, 5.4µm and
8.4µm. The solar radiation is incident normally onto the top surface and the metal is
considered to be purely reflective in the simulation.

39
II. SIMULATION RESULTS UNDER ILLUMINATION
Initial simulations were done on a pn-junction silicon solar cell as a one
dimensional simulation to evaluate the use of drift diffusion modeling for solar cells. For
a solar cell the I-V plot is in the fourth quadrant as was explained in Chapter 2. The
current density vs. voltage plot obtained for the pn junction silicon solar cell is,
Figure 3.5 Current Density Vs Voltage for a pn junction Silicon Solar cell
In Figure 3.5 we observe that the plot has been flipped with respect to the X axis
to represent the current density as positive values. Thus we see the shift the I-V plot when
the device is illuminated and contributing to dark current. The open circuit voltage is
around 0.55V and short circuit current density of around 20 2/ cmmA .
From the simulations it is thus proved that drift diffusion modeling works fine in
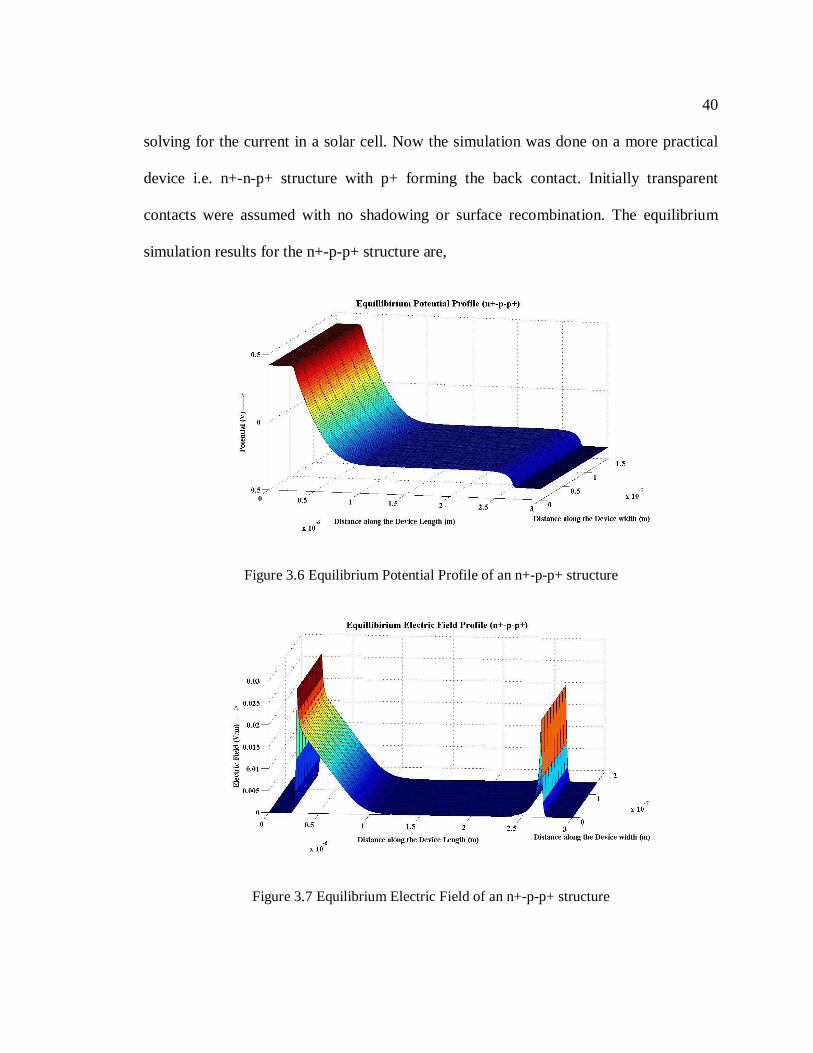
40
solving for the current in a solar cell. Now the simulation was done on a more practical
device i.e. n+-n-p+ structure with p+ forming the back contact. Initially transparent
contacts were assumed with no shadowing or surface recombination. The equilibrium
simulation results for the n+-p-p+ structure are,
Figure 3.6 Equilibrium Potential Profile of an n+-p-p+ structure
Figure 3.7 Equilibrium Electric Field of an n+-p-p+ structure

41
Figure 3.6 and 3.7 represent the Potential Profile and the Electric field
respectively at Equilibrium i.e. with no applied bias. In this case only Poisson equation is
solved to obtain the potential profile and the carrier densities related exponentially to the
potential as no transport is involved. The equilibrium carrier densities are,
Figure 3.8 Equilibrium Electron Density Profile of an n+-p-p+ structure
Figure 3.9 Equilibrium Hole Density Profile of an n+-p-p+ structure

42
Now the device is illuminated with one sun AM 1.5 and in this cases both Poisson and
drift diffusion equations have to be solved self consistently since transport of carriers is
involved leading to production of current. The generation recombination mechanisms
included in this simulation are Auger recombination, thermal generation recombination,
radiative recombination and generation due to the incoming light source. The carrier
density profile under Illumination is,
Figure 3.10 Electron Density Profile of an n+-p-p+ structure under Illumination
From Figure 3.10 we observe that there is an increase in the electron carrier
density and this is seen in the p-base region and also the p+ region as the electron
concentration in these regions are low. The generation of carriers is not high in the n+
region of the device due to high doping concentration of donors. The hole carrier density
is also altered in a similar fashion by the incoming solar radiation as it produces equal
number of electrons and holes. This can be observed in Figure 3.11,

43
Figure 3.11 Hole Density Profile of an n+-p-p+ structure under Illumination
The potential profile under illumination as shown in Figure 3.12 is not very much
visibly different from the equilibrium potential profile as simulated in Figure 3.6 i.e. it
does not show a big difference as seen in the case of the carrier concentrations since the
dependence of carrier densities on potential is exponential.
Figure 3.12 Potential Profile of an n+-p-p+ structure under Illumination

44
When solar radiation starts generating carriers in the device it tends to decrease
the electric field in the depletion region and this is observed in the simulation. In Figure
3.13 the difference between the electric field before and after the simulation is taken.
Figure 3.13 Difference in Electric field profile before and after simulation
We observe from Figure 3.13 that there is a reduction in the electric field and this
complies with the concept of working of a solar cell. As solar radiation creates large
number of carriers, these carriers tend to recombine with the charges in the depletion
region and thus reduce the field.
Simulations were also done for a p+-p-n+ structure and similar results were
extracted. Simulations were also done for varying widths of the base region for both n+-
p-p+ structures and p+-p-n+ structures.

45
Figure 3.14 Simulations of Potential, Electron and Hole Density Carrier Profiles under no light
and under Illumination
III. SIMULATION RESULTS UNDER ILLUMINATION WITH SHADOWING AND SURFACE
RECOMBINATION
The simulations presented in the previous section were under the assumption of
transparent contacts but in reality the contacts are not 100% transparent and do posses
some reflectivity. This tends to reduce the amount of solar radiation entering the device
structure leading to reduced number of carrier generation resulting in decrease in
efficiency of the solar cell. Thus, the top contacts are made to be optimally in small
percentage in comparison to the window to allow maximum incoming radiation to go
through the device. The window exposed has some defects in it and thus leads to surface

46
recombination effect. This also tends to reduce the efficiency of the solar cell as certain
numbers of carriers are lost at the surface.
Simulation has been performed for contact areas of about 25 and 50% of the top
surface. The carrier profile for a contact area of about 50% of the top surface for a base
width of 5.4 mµ is,
Figure 3.15 Hole Density Profile under Illumination with Shadowing (n+-p-p+)
We observe from Figure 3.15 that there is a gradient in the carrier density profile
under the top metal contact. This is because there are a huge number of carriers that are
generated due to the incoming solar radiation through the window and almost no
generation under the metal contact (as in this simulation the metal is assumed to have
100% reflectivity) and therefore the carriers see a concentration gradient and tend to
diffuse under the contact . Thus, Shadowing of the metal contact and surface

47
recombination phenomenon play a very important role in determining the efficiency of
the solar cell.
IV. EFFICIENCY CALCULATION AND TRENDS IN EFFICIENCY
The efficiency of the cell is calculated using the expression,
in
scoc
P
FFIV=η
where η represents the efficiency of the solar cell, ocV is the open circuit voltage, scI
represents the short circuit current, FF represents the Fill factor and inP represents the
input power of the incoming solar radiation and
FFIVP scocm =
where mP represents the maximum power [26]. The input power is calculated in the
following way,
whdPPin ))((2
1
λλλ
λ∫=
where 1λ and 2λ represent the range of wavelengths which comprises the incoming solar
radiation,w represents the width of the structure and h represents the height of the
structure. This width and height are the dimensions of the window of the structure.

48
The efficiencies are calculated for the structures for various lengths of the base
width i.e. 2.4 mµ , 5.4 mµ and 8.4 mµ . With the increase in the base width the efficiency
goes up but the trend tends to start drop down after reaching a peak. By reducing the base
thickness of the substrate the photo generated current decreases since the longer
wavelength photons corresponding to lower energy travel longer distances before getting
absorbed into the material. But by reducing the thickness of the substrate the efficiency
also increases since the ratio of diffusion length to the thickness of the substrate increases
and this enhances the collection efficiency of minority carriers [27]. Figure 3.16 shows
the trend of efficiency with the base width thickness of the device,
Figure 3.16 Efficiency Vs thickness of base (n+-p-p+)

49
The complete efficiency trend is not extracted and the simulation is done for a
maximum thickness of 8.4mµ due to extreme increase in simulation time with further
increase in thickness of the base.

Chapter 4
CONCLUSIONS AND FUTURE WORK
I. CONCLUSIONS
This chapter summarizes the key features of this research and its results. This is
followed by the plan for future research work. Summarizing the work done, a Drift-
Diffusion model has been utilized to model the working of a silicon solar cell. The self
consistent solution of the potential and carrier distribution is obtained by the coupled
solution of the Poisson equation and the continuity equations. The structures that were
simulated were a p-n diode, p+-p-n+ structure and n+-p-p+ structure. These structures
were simulated with transparent contacts and the generation of carriers was evident from
the carrier density plots and also the I-V plot presented in the previous Chapter. The
shadowing of the top contact plays a very important role as it decreases the total
photogeneration rate in the device and thus changing the efficiency of the cell. The
surface recombination phenomenon is also incorporated in the code in the exposed
window region and this also causes the loss of carriers thus reducing the efficiency. The
decrease in efficiency is observed from the transparent contact to the incorporation of
shadowing and surface recombination effects. The efficiency of the device changes with
the base region thickness since its ability to capture low energy photons (higher
wavelengths) increases and thus increasing the efficiency but the efficiency starts
decreasing after reaching a critical length. The increasing trend in efficiency was
observed in simulation but the structure thickness was not increased enough to see the
decreasing trend due to limitation of the simulation time.

51
II. FUTURE WORK
The simulations presented here have been done on a silicon solar cell
homojunction but the code is generalized to incorporate heterojunctions. Thus high
efficiency solar cells can be effectively simulated using the above model. Photon
Recycling has not been included in the present version of the code. Reverse leakage
currents due to radiative recombination play a very significant role in the performance of
a solar cell. The reduction of this current component plays a big role in increasing the
open circuit voltage of the cell and thus the efficiency. Photon recycling helps in reducing
the effective recombination rate when near band edge radiative recombination play a
dominant role in the device [28].
The model used in the simulation of the device i.e. Drift Diffusion Model which
has limitations that it is not a very good model for high field conditions and does not
include scattering mechanisms as accurately as one can do in a particle based device
simulators. The inclusion of thermal effects can also play a significant role in the working
of a solar cell when operated under concentrated sunlight and this can also be done in a
more proper way using particle based device simulation scheme as we have demonstrated
recently on the description of the operation of FD SOI Devices. Thus, our ultimate goal is
to move to a more detailed picture of transport in both single and multi-junction solar
cells by utilizing particle based device simulations of solar cells in near future.

52
References
[1] G. W. Crabtree and N. S. Lewis, "Basic research needs for solar energy utilization,"
2005.
[2] G. W. Crabtree and N. S. Lewis, "Solar Energy Conversion," Physics Today, vol. 60,
pp. 37-42, 2007.
[3] J. Hakes, "Long term world oil supply (A resource Base/Production path analysis),"
2000.
[4] T. Key, "Solar photovoltaics: Expanding electric generation options," Electric Power
Research Institute, 2007.
[5] Solar cell. http://en.wikipedia.org/wiki/Image:PVeff(rev110707)d.png#filehistory
[6] Solar cell - generations. http://en.wikipedia.org/wiki/Solar_cell#Second_Generation
[7] G. Gourdin, "Lecture notes: Solar cell technology (current state of the art)," 2007.
[8] M. A. Green, "Third generation photovoltaics: solar cells for 2020 and beyond," vol.
14, pp. 65-70, 2002.
[9] Third generation solar cell. http://en.wikipedia.org/wiki/Third_generation_solar_cell
[10] D. K. Schroder, "Lecture notes: Solar cells,"
[11] M. S. Lundstrom, "Numerical Analysis of Silicon Solar cells," 1980.

53
[12] J. L. Gray, "A computer model for the simulation of thin-film silicon-hydrogenalloy
solar cells," IEEE Transactions on Electron Devices, vol. 36, pp. 906-912, 1989.
[13] E. K. Banghart, "Physical mechanisms contributing to nonlinear responsivity in
silicon concentrator solar cells," 1989.
[14] P. D. DeMoulin and M. S. Lundstrom, "Projections of GaAs solar-cell performance
limits based ontwo-dimensional numerical simulation," IEEE Transactions on
Electron Devices, vol. 36, pp. 897-905, 1989.
[15] R. J. Schwartz, J. L. Gray and Y. J. Lee, "Design considerations for thin film
CuInSe, and other polycrystalline heterojunction solar cells," in 1991, pp. 920-923.
[16] Silvaco. http://www.silvaco.com/
[17] Crosslight. http://www.crosslight.com/
[18] Synopsys. http://www.edn.com/article/CA6591928.html
[19] D. Vasileska and S. M. Goodnick, Computational Electronics. Morgan & Claypool
Publishers, 2006,
[20] D. Vasileska. Lecture notes: Semiconductor device and process simulation.
Available: http://www.eas.asu.edu/~vasilesk/
[21] J. R. Shewchuk. (1994, An introduction to the conjugate gradient method without
the agonizing pain. Carnegie Mellon University,

54
[22] Conjugate gradient method. http://mathworld.wolfram.com/
[23] S. Selberherr, Analysis and Simulation of Semiconductor Devices. ,1st ed.Springer,
1984, pp. 308.
[24] D. Vasileska. Lecture notes : Semiconductor device and process simulation and
quantum mechanics. Available: www.eas.asu.edu/~vasilesk
[25] Absorption coeffecient. http://en.wikipedia.org/wiki/Absorption_coeffecient
[26] M. A. Green, Solar Cells. Prentice Hall, 1982,
[27] W. P. Mulligan, M. D. Carandang, De Ceuster, Denis M., C. N. Stone and R. M.
Swanson, "Reducing silicon consumption by leveraging cell efficiency," SunPower
Corporation,
[28] S. M. Durbin and J. L. Gray, "Numerical Modeling of Photon Recycling in Solar
Cells," IEEE Transactions on Electron Devices, vol. 41, 1994.
Related Documents