Model Synthesis in Frequency Analysis of Missouri Floods CIRCULAR 708 issouri State Highway Department and Federal Highway Administration

Welcome message from author
This document is posted to help you gain knowledge. Please leave a comment to let me know what you think about it! Share it to your friends and learn new things together.
Transcript
Model Synthesis in Frequency
Analysis of Missouri Floods
CIRCULAR 708
issouri State Highway Department and ---....L..L...;l.~~..~..~..~..t:...l.l...l..ll.....J..L.i;J.L.~..:>U~..LU..o;U,Iun, Federal Highway Administration ~-~


Model Synthesis in
Frequency Analysis of
Missouri Floods
By Leland D. Hauth
GEOLOGICAL SURVEY CIRCULAR 708
Prepared in cooperation with the Missouri State Highway Department and
U.S. Department of Transportation, Federal Highway Administration
1974

United States Department of the Interior ROGERS C. B. MORTON, Secretary
Geological Survey V. E. McKelvey, Director
Free on application to the U.S. Geological Survey, National Center, Reston, Va. 22092

CONTENTS
Page
Abstract ---------------------------------------------------------------- 1 Introduction ------------------------------------------------------------ 1
AcknowledgTnents --------------------------------------------------- 2 Ddodel description -------------------------------------------------------- 3 Nlethods of study -------------------------------------------------------- 4
Model calibration -------------- _ _____ ____ _________ _ ___ _ _________ _____ 4
Basic data ------------------------------------------------------ 4 Parameter evaluation _______________ ------------- __ ------------- _ 4
Synthesis of flood records -------------------------------------------- 7 Processing rainfall records --------------------------------------- 7 Processing evaporation records ----------------------------------- 7
Defining synthetic flood frequencies ------------------------------------ 8 Regional regression analysis ------------------------------------------ 9
Discus~on -------------------------------------------------------------- 12 Parameter evaluation ------------------------------------------------ 14 Record synthesis ---------------------------------------------------- 14 Regression analysis -------------------------------------------------- 15
Summary and conclusions ------------------------------------------------ 15 References -------------------------------------------------------------- 15
ILLUSTRATIONS
Page
FIGURE 1. Map showing location of gaging stations where basic rainfall-runoff and precipitation data have been collected in Mis.souri __ 6
2. Graph showing flood-frequency curves for Thompson Branch near Albany, Missouri ------------------------------------------ 10
3. Graphical solution of the 2-year equation ----------------------- 13
TABLES
Page
TABLE 1. The 10 model parameters and their applications in the modeling
process --------------------------------------------------- 3 2. Gaging stations for which the model was calibrated ------------- 5 3. Summation of mod·el parameters ------------------------------- 8 4. U.S. National Weather Service first-order precipitation stations
used in synthesis of peak-flow data -------------------------- 8 5. Station frequency data --------------------------------------- 11 6. Summary of regression analyses ------------------------------- 12
III

FACTORS FOR CONVERTING ENGLISH UNITS TO INTERNATIONAL SYSTEM (SI) UNITS
The following factors may be used to convert the English units published herein to the International System of Units (SI): Multiply English units
Feet (ft) ------------------------Square mile (mi2) -----------------Miles (mi) ----------------------Feet per mile (ft/mi) -------------Cubic feet per second (fe/s) ______ _
By
0.3048 2.590 1.609 .189 .02832
IV
To obtain Sf units
Metres (m). Square kilometres (km2
).
Kilometres (km). Metres per kilometr.e (m/km). Cubic metres per second (m3 /s).

Model Synthesis in Frequency Analysis of Missouri Floods
Bv LELAl\'D D. HAuTH
ABSTRACT
Synthetic flood records for 43 small-stream sites aided in definition of techniques for estimating the magnitude and freqeuncy of floods in Missouri. The long-term synthetic flood records were generated by use of a digital computer model of the rainfall-runoff process. A relatively short period of concurrent rainfall and runoff data observed at each of the 43 sites was used to calibrate the model, and rainfall records covering from 66 to 78 years for four Missouri sites and pan-evaporation data were used to generate the synthetic records.
Flood magnitude and frequency characteristics of both the synthetic records and observed long-term flood records available for 109 large-stream sites were used in a multiple-1egression analysis to define relations for estimating future flood characteristics at ungaged sites. That analysis indicated that drainage basin size and slope were the most useful estimating variables. It also indicated that a more complex regression model than the commonly used log-linear one was needed for the range of drainage basin sizes available in this study.
INTRODUCTION
This report describes technical aspects of a study to define methods for estimating the magnitude and frequency of future floods on Missouri streams. A significant part of the analytical procedure included using a rainfallrunoff model to extend short-term records of floods on small streams. The synthetic flood records generated by use of long-term climatic data in the model were then used with available flood records on large streams to define suggested relations for estimating future flood magnitudes at ungaged sites. A companion report by Hauth (1974) described the defined estimating relations and provided details on how to use the relations to obtain a design estimate, and two other reports by Hauth (1973a, 1973b) presented basic data. The purpose of
1
this report is to document the analytical methods used.
The economic design of drainage structures, the equitable regulation of flood-prone lands, and the establishment of realistic flood insurance rates require estimates of the magnitude and frequency of floods in the future. Many techniques have been proposed for estimating the magnitude and frequency characteristics of future floods, and the most reliable ones are based upon an assessment of past records of observed floods. In general, the longer the period of observed flood records at a site, the more reliable the future flood characteristics can be estimated at that site. To obtain estimates of future flood characteristics at ungaged sites, techniques are available for transfer of flood information from gaged sites. The accuracy of these estimates at ungaged sites also is related to the accuracy of the estimates at gaged sites and, therefore, to the length of observed flood records.
Flood magnitudes have been observed systematically in Missouri by the U.S. Geological Survey and other Federal and State agencies since 1903. A large mass of flood data has been accumulated, but these long-term data observations have been confined primarily to the large streams. A study by Sandhaus and Skelton (1968) defined methods of estimating flood magnitude and frequency, but, because of the short period of records available on small streams, the technique was considered applicable only for estimates on streams draining more than 50 mP (130 km2
). In a study of the adequacy of available Missouri streamflow records, Skelton and Homyk (1970) determined a need for a longer period of flood records on drainage areas of less than 50 mi2 (130 km2
).

One suggested alternative to awaiting the assen1bly of long-term flood records on small streams is to use available long-term climatic records in a rainfall-runoff model to estimate long-term flood records. The runoff process is a complex phenomena. A mathematical model allowing a reasonably accurate description of the process is also complex. It was not until the advent of the digital computer that the use of mathematical models describing the rainfallrunoff process became practical.
The rainfall-runoff model used in this study w~s developed by the Geological Survey specifically for the purpose of modeling floodrunoff hydrographs from small watersheds. Details of its computational routine, necessary assumptions, and reliability have been described by Dawdy, Lichty, and Bergmann (1972). Primary characteristics of this model are that it is deterministic, structure imitating, digital, and relatively simple. Only 10 parameter values must be evaluated to calibrate the model to any specific drainage site. The parameters were conceived as real and measurable characteristics of the contributing watershed, but in practice the parameters are evaluated from a period of concurrent precipitation and runoff records for each site by an internal and automated optimization routine.
Information available in Missouri offered an ideal situation for testing the use of the rainfall-runoff modeling approach to defining floodfrequency estimating relations. Observations of concurrent rainfall and runoff began on a few small-stream sites as early as 1948, and the data collection program was enlarged and continued until, at the time of this study, an average of 10 years of observations were available for 43 sites that drain from 0.10 to 10 mi~
(0.26 to 25.9 km~) located in a variety of topographic settings. Continuous-recorder charts of precipitation averaging 70 years in length have been obtained by the National Weather Service at four areally dispersed sites, and sufficient pan-evaporation data were available to provide long-term climatic inputs needed for model synthesis. Long-term flood observations on larger streams draining up to 14,000 n1i~ (32,300 km:!) were already available for analysis.
Flood-frequency characteristics defined from the 43 synthesized small-stream records and
2
the observed long-term records on large streams were used as dependent variables in a multiple-regression analysis to define relations for estimating flood characteristics at ungaged sites. The results of this analysis showed that drainage area and main-channel slope are the most effective indices for estimating floodflows in Missouri, but also indicated the inadequacy of the assumption of a simple linear relation between the logarithms of flood characteristics and the logarithms of basin characteristics. Such an assumption is commonly used nationwide and was found satisfactory for a limited range of basin sizes in Missouri. An alternate curvilinear model form suggested by Creager, Justin, and Hinds (1947) was found satisfactory for use with the broad range of basin sizes.
The study described in this report is the first operational use of the rainfall-runoff model in defining flood-frequency estimating techniques. The experiences gained are documented as an aid to others who may be planning similar investigations. This study involves three distinct operations that are described first. They are as follows: 1. Model calibration, or the evaluation of
model parameters, for each of the 43 small-stream sites.
2. Synthesis of long-term flood-peak records. 3. Regression of flood characteristics on basin
characteristics. To remain within the scope of this study, and within bounds of the time and resources available, it was sometimes necessary to choose among alternative courses and to ignore some potential useful choices. Some of those potential useful choices where additional research may be beneficial are discussed in a subsequent section.
The opinions, findings, and conclusions expressed in this report are not necessarily those of the Federal Highway Administration.
ACKNOWLEDG~IENTS
This report was prepared under the cooperative highway research program with the State of Missouri, Robert N. Hunter, Chief Engineer, and the U.S. Department of Transportation, Federal Highway Administration. Long-tern1 daily precipitation records and storm reductions to 5-nlinute increments were

obtained from the National Oceanic and Atmospheric Administration (NOAA), Environmental Data Service, National Climatic Center, at Asheville, N.C.
R. W. Lichty and P. H. Carrigan, Jr., hydrologists of the U.S. Geological Survey, provided valuable technical advice and assistance during the preparation of the report.
l\IODEL DESCRIPTION The model estimates the flood hydrograph
that a drainage basin will produce in response to a specific rainfall sequence. It utilizes a set of mathematical relations approximating the physical laws governing three components of the hydrologic cycle-antecedent soil moisture, infiltration, and surface-runoff routing.
The antecedent soil-moisture component continually assesses the changes in soil moisture as a basis for determining the portion of subsequent rainfall that becomes surface runoff. The changes in moisture storage are assessed on a daily basis during nonstorm periods and on a unit-time basis during storm periods. For each site, a unit-time increment of 5, 10, or 15 minutes is selected so that it provides a suitable degree of refinement in the computations and in the synthetic output hydrograph.
The infiltration component of the model determines the portion of a unit-time rainfall observation that becomes surface runoff. In the surface-runoff component, this rainfall excess is then distributed in time to form the outflow
hydrograph by using a modified Clark routing method.
Ten parameter values control the operation of the model and must be evaluated to calibrate the model to a specific drainage site. These parameters are constants and limits in the mathematical relations, and table 1 lists them and describes the conceptual function of each.
The model contains a trial-and-error, hillclimbing type of parameter optimization technique. The general method is that a set of assumed parameter values is first used to synthesize a flood record for a period of time when concurrent rainfall, pan-evaporation, and flood records are available. The optimization scheme compares the synthesized record with the observed flood record, then automatically changes one parameter value, repeats the computations, and compares the newly synthesized record with the observed record. The process of individually changing parameter values and computing a new synthesized record is repeated until the comparison of synthesized and observed records cannot be improved. The range of values any parameter can assume is limited by the investigator.
Synthetic and observed flood records are compared by means of an objective function. This function is the sum of squares of logarithms of differences between observed and synthesized values of the peak flows, or of the storm volumes, or of a combination of the peak and volume. Thus, the parameter-evaluation
TABLE 1.-The 10 model parameters and their applications in the modeling process
Parameter
EVC ----RR -----BMSM --DRN
PSP
KSAT ___ _
RGF ____ _
Units
Inches ----------
Inches ----------
Inches per hour _
Definition and application
Antecedent moisture component
Coefficient to convert pan evaporation to pot.ential evapotranspiration values. Proportion of daily rainfall that infilt1·ates the soil. Soil moisture storage volume at field capacity. Drainage parameter for redistributi.on of soil moisture (fraction of KSAT).
Infiltration component
Product of moisture deficit and suction at the wetted front for soil moisture at field capacity.
The minimum (saturated) hydraulic conductivity used to determine infiltration rates.
Ratio of the product of moisture deficit and suction at the wetted front for soil moisture at wilting point to that at field capacity.
Surface runoff component (routim{)
KSW ____ Hours ---------- Time characteristic for linear resorvoir routing. TC ------ Minutes ________ Lt-ngth of the ba~e of the triangular translation hydro·graph. TP/TC ___ ----------------- Ratio of time to peak to base length of the triangular translation hydrograph.
3

procedure develops a nonlinear least-square solution to the optimum set of parameter values.
Once the parameters are evaluated for a specific drainage site, a long-term record of precipitation and pan evaporation may be put into the model to synthesize a flood record.
Many assumptions are required to calibrate and use the rainfall-runoff model. Some of the more important ones are : 1. Uniform distribution of rainfall over the
drainage area. 2. Accurate input data.
3. Runoff unaffected by ice or snowmelt.
4. No changes have destroyed the homogeneity of flood records during the period used in model calibration.
5. Available long-term rainfall and evaporation records are applicable to the drainage basin.
To the extent possible, measuring techniques and operational procedures are designed to minimize the effect of deviations from these assumptions. An obvious limitation is the adequacy of a single rain gage for representing the areal distribution of rainfall on a drainage basin. Most floodflows on small drainages in Missouri and other Midwestern States are produced by localized high-intensity thunderstorms. The variability of these storm rainfalls over a drainage basin is probably a function of the ratio of storm size and movement to size of drainage basin. To limit the effects of the assumption of uniform areal rainfall distribution, the model was calibrated only for basins draining less than 10 mi2 (25.9 km2 ).
~IETHODS OF STUDY
The analysis included three distinct operations. The first was to evaluate the model parameters through a calibration process. The second was to synthesize a long series of annual flood peaks from long-term rainfall records and to define the flood-frequency curves. The last was to define by multiple-regression analysis the relations between the 2-, 5-, 10-, 25-, 50-, and 100-year flood magnitudes and drainagebasin characteristics as a basis for flood frequency estimates at ungaged sites.
4
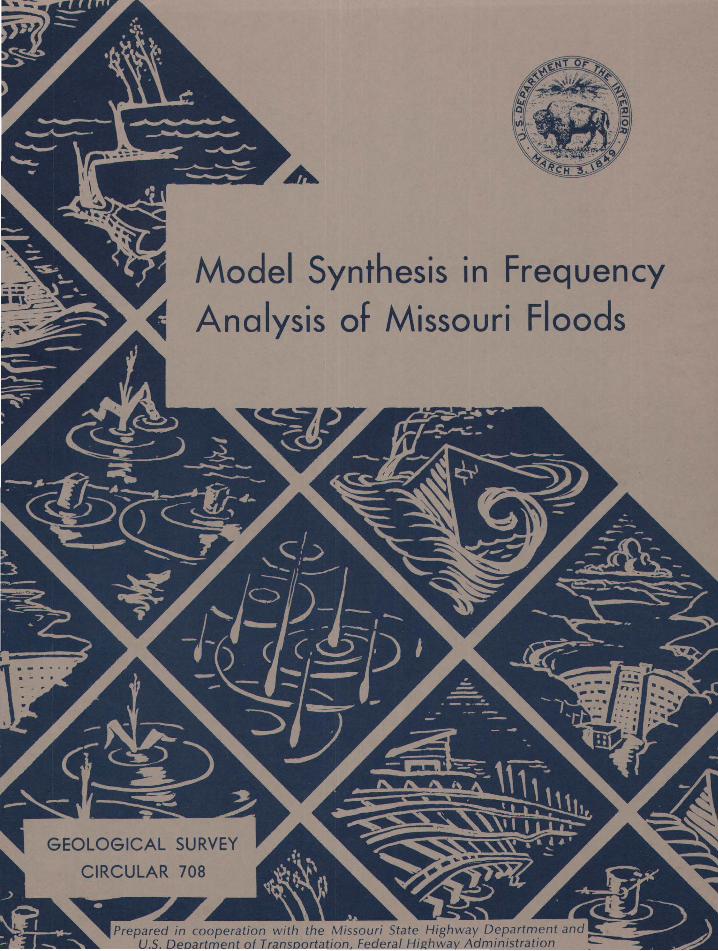
MODEL CALIBRATION BASIC DATA
Calibration of the rainfall-runoff model to any specific site requires concurrent data on streamflow, precipitation, and evaporation. Sufficient data were available for calibrating the model for 43 sites with drainage areas draining less than 10 mP (25.9 km2
). Table 2 lists in downstream order the 43 sites together with their drainage areas, caHbration period, time increment, and number of storms used in calibration, and figure 1 shows the location of the sites.
In the extreme southeast part of the State, no rainfall-runoff data have been collected because of the inability to define stage-discharge relationships of small drainage areas. However, flood-frequency estimating relations presented later in this report are based upon information from this region for drainage areas greater than 10 mi 2 (25.9 km2
) so that the estimating relationships have statewide applicability.
All stage and rainfall records used in this study were recorded on strip charts. One rain gage was located in each basin. Two types of rain-gage records were used: (1) a tippingbucket gage that recorded to the nearest 0.1 inch (2.5 mm) synchronously with the stagerecorder gage and on the same chart, and (2) a weighing-type gage placed somewhere within the basin, not necessarily at the stream gage, and recorded on a separate chart.
PARAMETER EVALUATIO~
The parameter evaluation was accomplished in three phases. During phase one, the parameters shown in table 1 as controlling the volume of runoff (PSP, KSAT, DRN, RGF, BMSM, EVC, RR) were automatically adjusted until the volumes of observed runoff were reproduced with m1n1mum variance (minimum objective function). These parameters were then held constant through phase two, in which the parameters controlling the shape of the synthetic hydrograph (KSW, TC, TP /TC) were readjusted until the observed peaks were reproduced with minimum variance. In phase three, routing parameters were held constant and volume parameters were readjusted until the best fit of observed versus
Station number
05495100 __ _ 05497700 __ _ 05502700 __ _ 05503000 __ _ 06815550 __ _ 06816000 __ _ 06820000 __ _ 06821000 __ _ 06896180 __ _ 06896500 __ _ 06897700 __ _ 06902500 __ _ 06902800 __ _ 06907200 __ _ 06908300 __ _ 06909700 __ _ 06910250 __ _ 06918700 __ _ 06919200 __ _ 06921740 __ _ 0692.2700 __ _ 06925200 __ _ 06925300 __ _ 06926200 __ _ 06927100 __ _ 06928200 __ _ 06931500 __ _ 06935800 __ _ 07011200 __ _ 07011500 __ _ 07015500 __ _ 07017500 __ _ 07019100 __ _ 07035500 __ _ 07037700 __ _ 07053950 __ _ ()7054200 __ _ 07054300 __ _ 07063200 __ _ 07064300 __ _ 07064500 __ _ 07068200 __ _ 07185500 __ _
TABLE 2.-Gaging stat-ions for which the model 'Was calibrated
Station name
Big Branch Tributary nr Wayland, Mo --------------Bridge Creek nr Baring, Mo ------------------------Easdale Branch nr Shelbyville, Mo ------------------Oak Dale Branch nr Emden, Mo ---------------------Staples Branch nr Burlington Junction, Mo - --------Mill Creek nr Oregon, Mo --------------------------White Cloud Creek near Maryville, Mo --------------Jenkins Branch nr Gower, Mo ----------------------DeMoss Branch nr 8tranberry, Mo ------------------Thompson Branch nr Albany, Mo --------------------Grand River Tributary nr Utica, Mo ----------------Hamilton Branch nr New Boston, Mo ----------------Onion Branch nr St. Catherine, Mo ------------------Shaver Creek Tributary nr Clifton City, Mo ----------Trent Branch nr Waverly, Mo -----------------------Petite Saline Creek Tributary nr Bellair, Mo __________ _ Traxler Branch nr olumbia, Mo ---------------------Oak Grove Branch nr Brighton, Mo -----------------Sac River Tributary nr Caplinger Mills, Mo ---------Brushy Creek nr Blairstown, Mo --------------------Chub Creek nr Lincoln, Mo -------------------------Starks Creek nr Preston, Mo -----------------------Prairie Branch nr Decaturville, Mo -----------------Van Cleve Branch nr Meta, Mo ---------------------Doane Branch nr Kingdom City, Mo -----------------Laguey Branch nr Hazelgreen, Mo ------------------Little Beaver Creek nr Rolla, Mo --------------------Shotwell Creek nr Ellisville, Mo ---------------------Love Creek nr Salem, Mo ---------------------------Green Acre Branch nr Rolla, Mo --------------------Lanes Fork nr Rolla, Mo ---------------------------Dry Branch nr Bonne Terre, Mo --------------------Murphy Branch nr Crystal City, Mo ----------------Barnes Greek nr Fredericktown, Mo -----------------Clark Creek nr Piedmont, Mo -----------------------Ingentron Hollow nr Forsyth, Mo -------------------Yandell Branch nr Kirbyville, Mo --------------------Gray Branch nr Lutie, Mo ---------------------- ____ _ Pike Creek Tributary nr Poplar Bluff, Mo ___________ _ Fudge Hollow nr Licking, Mo -----------------------Big Creek nr Yukon, Mo ----------------------------North Prong Little Black River nr Hunter, Mo _______ _ Stahl Creek nr Miller, Mo ---------------------------
Drainage area (mi2 )
0.70 2.54
.71 2.64
.49 4.90 6.06 2.72 .38
5.58 1.44 2.51 1.04 1.65
.97
.49
.55 1.30
.14 1.15 2.86 1.30 1.48 .75 .54
1.58 6.41 .81 .89 .62 .22
3.35 .45
4.03 4.39 .65 .42 .27 .28
1.72 8.36 1.23 3.86
Period of continuous
records (yrs)
1964-69 1961-64 1969-70 1956-69 1967-69 1951-70 1949-70 1950-70 1959-65 1955-70 1966-70 1955-70 1961-66 1961-64 1959-62 1964-69 1960-64 1956-70 1962-70 1960-70 1964-70 1956-70 1969-70 1956-70 1959-62 1958-70 1948-70 1962-70 1959-70 1947-70 1952-70 1955-70 1960-64 1955-70 1956-70 1962-66 1966-70 1959-62 1959-64 1959-70 1949-70 1964-70 1950-70
Number Unit time of storms increment used in
(min) calibration
5 5 5
15 10 15 15 15
5 15
5 15 10
5 5 5 5
10 5
10 15 15 10 10
5 15 15 10
5 5 5
15 5
15 15
5 5 5 5 5
15 5
15
16 15 18 25
8 30 28 29 12 28 24 28 11 13 15 16 14 18 12 31 24 13 18 12 13 18 14 30
9 27 19 29
8 26 23 9
12 11 11
6 29 18 25
simulated peaks was achieved. Parameters determined in phase three were used in the synthesis of long-term peak discharges.
Initial magnitudes of each parameter were selected on the basis of the watersheds' climate, geology, soil, and basin cover. Constraints were placed on the range in which some initial parameters were allowed to vary during calibration. For example, Kohler, N ordenson, and Baker (1959) computed an average panevaporation coefficient for Missouri of about 0. 7; therefore, this parameter was constrained to keep its magnitude within a range of 0.5 to 0.9. Initial magnitudes of routing parameters were determined from observed discharge hydrographs, and constraints were placed on
these magnitudes to keep them within a range consonant with experience at each location. The range in which the remaining parameters were allowed to vary during calibration was set to allow the best fit of a plot of the final observed versus simulated peak discharge.
5
An important step in the operational procedure of parameter evaluation was a screening process to identify and eliminate those storms having large errors in the recorded data. All storms were included in the first phase one and phase two computations, and the recorded storm precipitation was compared with the observed and simulated runoff hydrographs for each storm. Storms then were eliminated from subsequent calibration work if the runoff vol-

~155~0 ~6820ooo -- -- -- -------r--- -05495100
06896180 0 06896500 0 0 ~ 0 05497700
'~,, 0 06816000 .. "'- 069025000 J ',? 006821;:8977000 069028000 ;: ::
-., \ Cf.{; l w -13988 - (;:f"Co'~-,
'I 0 = ~ (F ~b ,, "=11.;____;;-J "'~~:=lf· --c> •
1-1
- 06908300 ! W-93958 •'- I
------------- o a·---... 06909700-;-- 0 06927100 •• ~ .• ~
06910250 06935800 I '
006907200
006921740 06922700
0
06919200 0
06925200 0
0 06925300
--~\ -~ --=-------= ___ .-:---"'
0069262.· .
• 07015500 07017500 06931500~ 0
)f07011500
006928200 )~ 07011200
07019100
• • 006918700 0 07064300
07035500 0
r: .o 0
~ 0 ~ f 07064500 1 07185500°"'\ Aj o ' PA,f?
0 07037700 0
1 °• _/ W-13995 °• ~ PA.Rr 7 0 0
07053950 0
07068200° 007063200
I 070542000
07054300
L-------------~----------------,
0 50 100
0 50 100 150
150 MILES
200 Kl LOM ETRES
" I
' )
[ __
EXPLANATION 0 07054200
Rainfall-runoff stations used in model calibration
0
Downstream order number
U.S. National Weather Service precipitation station Major Basin divide
35·~------~------------L-__________ _L __________ _L __________ ~-----------~-------------~
FIGURE 1.-Location of gaging stations where basic rainfall-runoff and precipitation data have been collected in Missouri.
ume exceeded the precipitation, if the precipitation exceeded the runoff by an abnormal amount, or if other obvious data problems appeared. The evaluation of parameters by phase one and phase two was then repeated as many times as necessary on the reduced set of storms. Although the screening process was somewhat
6
subjective, the elimination of these stormsfor which recorded precipitation obviously was not representative of basin precipitation-was
considered essential to establishment of the
optimum set of parameter values for model
calibration.

A final set of parameter values was determined from the screened storm data by a phase three computation (readjustment of volume parameters holding phase two routing parameters constant). A plot was then prepared of observed peaks versus synthesized peaks and was used to graphically check for possible bias in calibrated model results. The average standard deviation of differences between observed and synthesized peaks was about 35 percent.
Model calibration was completed for each station in downstream order (ascending station numbers). Experience gained early in the process allowed more efficient calibration of downstream stations and perhaps allowed parameters to be defined with more confidence and meaning. Table 3 lists the stations in downstream order and the best-fit parameter values.
SYNTHESIS OF FLOOD RECORDS
A calibrated model can be used to estimate the flood peak resulting from any selected storm rainfall and associated antecedent moisture conditions; therefore, a long record of rainfall and evaporation is needed to generate a long series of synthetic flood peaks. Four long-term, continuously recording rainfall gages have been operated in Missouri by the National Weather Service. These records provide the basic rainfall data for model input and are identified in table 4.
One relatively long record of daily pan evaporation collected at Lakeside, Mo., near Lake of the Ozarks, was processed to provide needed evaporation inputs.
PROCESSil\'G R.-\ll\'FALL RECORDS
Model synthesis requires records of daily precipitation for nonstorm periods and unit precipitation for storm periods. Daily precipitation records for each of the four sites were available from the National Climatic Data Center, Asheville, N.C., and were processed and placed in computer storage.
Unit precipitation information could be attained only by coding data from original recorder charts, a tedious, relatively time consuming, and therefore expensive, process. To provide a realistic basis for synthesizing an annual series flood record, unit data must be
7
available for all storms that might conceivably produce the largest peak flood during any water year (October 1 to September 30). To minimize costs, however, it was desirable to limit the number of storms selected. R. W. Lichty (written commun., 1973) has studfed the proble1n of identifying those storms likely to cause an annual maximun1 flood and the effect of the number of identified storms on the resulting frequency curves. For basins with lag times of about three-quarters of an hour, he concluded that three storms each year identified as the maximum daily or 2-day total rainfalls would produce a frequency curve not significantly different fron1 one based on unit data for a great many n1ore storms. For basins with lag tin1es of less than three-quarters of an hour, Lichty suggested that the number of storms identified for reduction to unit data should be increased to four or possibly five per year.
A computer program supplied dates of the storms that would possibly cause the maximum annual flood peak by identifying the five largest daily or 2-day total rain eatches in each water year in each of the dai1y precipitation records. A reduced number of dates was then selected for the reduction of rainfall recorded charts to unit data by considering for each storm the antecedent rainfalls, the comparative total rainfalls, the hourly intensities, and similar available information. Table 4 shows the number of storms in each record for which the National Climatic Data Center, NOAA, of Asheville, N.C., prepared computer inputs of 5-minute unit precipitation data.
All the information on daily and unit precipitation for each of the four long-term raingage sites was presented in a report by Hauth (1973a).
PROCESSIXG EVAPORA TIO~ RECORDS
A daily evaporation record is required for model synthesis. The longest available record in Missouri is for the LakeBide, Mo., panevaporation gage located at Lake of the Ozarks, which began operation in February 1948.
A computer program developed within the U.S. Geological Survey analyzed the available evaporation record to determine a harmonic (sine-cosine) function, which then generated a
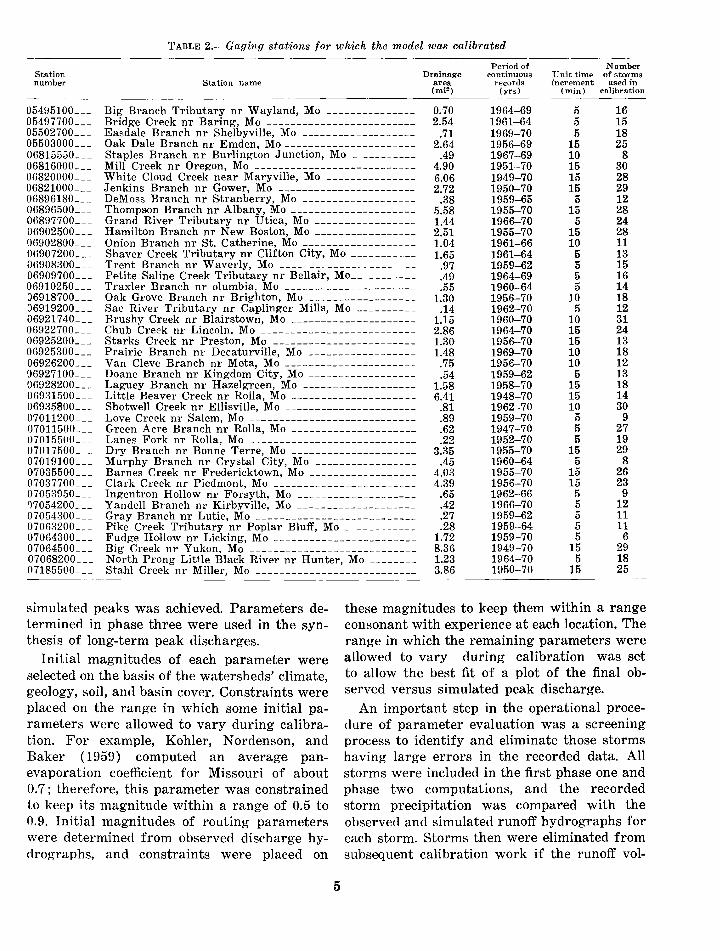
TABLE 3.-Summation of model parameters
Station Parameters (see table 1 ) number PSP KSAT DRN RGF BMSM EVC RR KSW TC TP/TC
05495100 --------- 4.17 0.051 0.63 16.6 4.73 0.70 0.84 1.22 87.5 0.51 05497700 --------- 1.45 .028 .29 17.8 6.12 .67 .88 1.50 226 .20 055027,00 --------- 1.62 .027 .16 4.86 37.8 .66 .84 .89 63.0 .93 05503000 --------- 1.39 .037 .26 18.8 2.97 .59 .70 1.92 69.6 .40 06815550 --------- 1.27 .030 .10 10.1 10.8 .67 .76 .76 42.0 .64 06816000 --------- 3.85 .096 .22 10.6 4.77 .67 .79 .74 6·6.0 .49 06820000 --------- 2.40 .050 .72 10.5 1.2·0 .76 .77 2.00 122 .55 06821000 --------- 1.46 .067 .77 13.6 5.16 .72 .70 .87 52.0 .95 06896180 --------- 2.19 .069 .96 8.50 4.84 .78 .66· .90 33.0 .20 06896500 --------- 1.15 .070 .36 9.09 2.12 .62 .83 2.50 118 .80 06897700 --------- 3.7 .040 .18 9.33 5.47 .66 .76 2.30 94.5 .74 06902500 --------- .98 .020 .09 3.84 3.59 .63 .79 2.00 94.5 .84 06902800 --------- 3.48 .030 .29 13.5 8.35 .74 .70 1.38 78.0 .98 06907200 --------- 2.56 .040 .15 2.92 2.25 .67 .84 1.27 67.0 .87 06908300 --------- 2.06 .070 .63 12.8 12.2 .71 .84 .34 54.0 .97 06909700 --------- 8.64 .21 .76 4.43 3.40 .72 .90 .60 49.0 .84 06910250 --------- 1.94 .050 .22 13.6 5.52 .71 .77 .35 55.0 .85 06918700 --------- 1.99 .060 .31 27.2 4.12 .62 .68 1.23 26.0 .78 06919200 --------- 2.52 .060 .84 14.8 2.43 .77 .84 .64 85.9 .36 06921740 --------- 1.92 .050 .33 5.67 5.13 .70 .68 .80 30.0 .80 06922700 --------- .60 .02 .17 2.62 14.8 .72 .73 1.69 19.2 .67 06925200 --------- 2.57 .05 .50 12.2 4.8 .69 .85 2.31 126 .50 06925300 --------- 4.48 .14 .51 15.8 7.14 .69 .74 1.36 34.2 .68 06926200 --------- 2.07 .10 .91 12.3 37.0 .82 .81 .24 26.6 .93 06927100 --------- 2.79 .050 .05 16.7 7.11 .70 .90 2.12 60.0 .34 06928200 --------- 2.53 .030 .24 7.07 2.82 .61 .87 1.14 37.8 .59 06931500 --------- 4.10 .050 .47 11.7 2.40 .52 .85 .84 75.0 .50 06935800 --------- 2.35 .040 .36 17.4 3.00 .74 .69 .69 44.1 .96 07011200 --------- 1.58 .030 .15 6.11 27.7 .79 .64 2.12 34.7 .75 07011500 --------- 2.22 .050 .33 11.9 3.93 .77 .87 .49 32.3 .97 07015500 --------- .68 .050 .09 5.70 8.66 .71 .94 .94 98.7 .67 07017500 --------- 1.82 .060 .82 5.55 4.07 .63 .86 1.56 26.1 .40 07019100 --------- 5.70 .12 .49 13.8 3.78 .73 .68 .40 24.3 .96 07035500 --------- .84 .060 .13 16.4 4.29 .71 .74 .77 77.0 .86 07037700 --------- 2.28 .060 .79 58.3 5.83 .64 .88 1.77 20.2 .55 07053950 --------- 2.37 .070 .91 7.90 7.29 .80 .61 .54 66.0 .81 07054200 --------- 5.81 .16 .48 6.06 3.47 .58 .51 .66 25.7 .90 07054300 --------- 3.64 .10 .82 14.3 2.92 .63 .82 1.16 41.2 .88 07063200 --------- 1.93 .060 .19 6.92 10.9 .80 .66 .63 26.1 .18 07064300 --------- .17 .050 .36 14.0 27.4 .95 .72 .66 66.0 .62 07064500 --------- 2.49 .040 .67 9.15 2.34 .63 .81 1.85 101 .62 07068200 --------- 21.2 .080 .28 16.4 3.98 .64 .58 1.09 59.4 .96 07185500 --------- 2.05 .050 .30 19.7 3.46 .71 .87 1.98 117 .72
TABLE 4.-U.S. National Weathe·r Set·vice first-ordet· p1·ecipitation stat·i()ns used in synthesis of peak-flow data
Station Period of Number number continuous of events (fig. 1) Station name record selected
VV13988 __________ Kansas City VVSO ---------------- 1893-1970 217 VV93963 __________ St. Louis vvso ------------------- 1893-1970 190 VV93958 _______ ~-- Columbia Region vvso ------------ 1902-70 222 VV13995 _______ ~-- Springfield VVSO ------------------ 1905-70 182
synthetic daily evaporation record for the 1893 to 1948 period. Experience has shown that model outputs are relatively insensitive to the clay-to-day variations in evaporation data and that an evaporation record n1ay be applicable to large regions. The partly synthesized evaporation record used in this study was considered
8
to be adequate for flood-peak synthesis at the 43 sites considered.
DEFINING SYNTHETIC FLOOD FREQUENCIES
Four series of synthetic annual peaks were generated for each of the 43 sites by putting into the calibrated model the data from each of

the four long-term rainfall gages and the evaporation gage. Each of the four series of peaks was then tested in pairs (Kansas City and St. Louis, Kansas City and Columbia, and so forth) for statistical distribution differences via the Cramer-von Mises Two-Sample Test as described by Conover (1971). In no instance could the hypothesis that the samples are identical be rejected at the 1-percent level of significance, and in only one station pairing could the hypothesis be rejected at the 5-percent level. These results indicate that there was no apparent advantage or reason to use one raingage record in preference to another and that an average of the four frequency relations would be justified.
To define the average synthesized frequency curve, four individual curves were computed by mathematically fitting a Pearson Type III distribution to the logarithms of each of the four annual peak series using techniques recommended by the U.S. Water Resources Council (1967). The 2-, 5-, 10-, 25-, 50-, and 100-year recurrence interval peak magnitudes from each curve then were averaged to form the synthetic curve for each site.
In addition to the synthesized records, the observed flood-peak record was available to aid in definition of the freqeuncy characteristics at each site. Observation and testing indicated that these relatively short records could be of value. Firstly, because the observed data are of sufficient length to define reliably the magnitude of flood peaks in the range of the 2- to 10-year recurrence intervals. Secondly, because statistical analysis of the synthetic frequency curves indicates that the variance between curves decreases with increasing recurrence interval-that is, the model defines the extreme floods with more consistency than the smaller floods. A log-Pearson Type III distribution was also fitted to the observed flood series.
A graphical weighting procedure was employed to combine the observed and synthesized frequency curves into a final curve. Both the average synthetic data curve and the observed data curve were plotted on a probability graph, and a curve was drawn from the 2-year observed value to merge smoothly with the average synthetic curve at a point generally greater than the 10-year recurrence interval. Figure 2
9
shows the relationships for Thompson Branch near Albany ( 06896500) and the final curve obtained by this graphical process. Each curve was judged individually in an effort to provide the best possible estimate of the frequency characteristics to use in the regression analysis. A summary of the flood characteristics for the 43 sites is given in table 5.
REGIONAL REGRESSION ANALYSIS
Flood data at a sample of gaged sites provide a basis for estimating flood characteristics at ungaged sites. The technique of transferring data used in this study defines from this sample some equations relating flood magnitudes to numerical indices describing characteristics of the contributing drainage basins. Separate equations are defined for selected points on the frequency relation, such as the 2-, 10-, and 50-year recurrence interval peak magnitudes. Drainage-basin indices describe the size, shape, slope, soil characteristics, vegative cover, climate, and so forth. They are indices that can be evaluated from topographic, geologic, and climatic maps and from other readily available sources, and they logically can be expected to be related to the differences in floodflows at the various gaged sites. Planners and designers may then solve the defined equation to estimate the flood characteristics of an ungaged site by evaluating appropriate basin indices.
Many recent studies throughout the Nation have defined flood-estimating equations based upon a model of the form:
where Q1 =flood magnitude having a t-year re
currence interval, A, B, .. . N =drainage-basin indices, and b, b11 b'2, •... . b11 =constants for a given t.
Constants are evaluated most easily by multiple-regression analysis when the variables are transformed to logarithms to form a linear relation: log Q,=log b+b1log A+b'2log B+ .... bn log N.
Regression analysis techniques also provide a measure of the accuracy of the equation, known as the standard error of estimate, and test the significance of the b coefficient of each independent variable. Only those independent vari-

0 z
0 0 z 100 u
LLJ 0 C/)
u LLJ 0::: C/) LLJ
0.... 0::: LLJ 2000 C/)
0.... LLJ 0:::
I- Curve recommended for use I-LLJ LLJ LLJ ~ 1..1...
S2 1000 S2
CD CD ::J
800 ::J
u u
~ 600
~
w w (!) EXPLANATION
(!)
0::: 0:::
< 400 0 <
I I u Synthesized data 10 u C/) C/)
0 ~ 0
::!C Observed data (1956-70) ::!C
< < LLJ 200
LLJ
0.... 0....
2 3 4 5 6 7 8 9 10 20 30 40 50 100
RECURRENCE INTERVAL, IN YEARS
FIGURE 2.-Flood-frequen~y curves for Thompson Branch near Albany, Missouri.
abies are retained in an estimating equation that have a coefficient that is significantly different from zero at the 95-percent confidence level.
Sandha us and Skelton ( 1968) previously used the log-linear model form to define floodestin1ating relations for Missouri streams. They provided separate relations for estimating magnitudes of floods having six selected recurrence intervals ranging from 1.2 to 50 years. They found only the coefficients of drainage-area size and main-channel slope to be significant, and they found the assumption of a linear relation between the logarithms of the variables to be acceptable. Standard errors of estimate ranged fron1 50.7 percent for the sn1aller floods to 36.9 percent for the larger floods. Because of the lin1ited data on small streams, the relation for estimating floods larger than 25-year recurrence interval was
10
not considered applicable to streams draining less than 50 mi:! (130 km:!).
In this study, data for the 43 small-stream sites were analyzed by multiple regression m~ing the log-linear model form. Separate relations were defined for recurrence intervals of 2, 5, 10, 25, 50, and 100 years. Drainage-basin indices considered as independent variables were: Drainage area C4), in square miles, as plani
metered on the best available topographic maps.
Main-channel slope (S), in feet per mile, between points 10 and 85 percent of the distance upstream from the gage to the basin border.
Main-channel length ( L) , in miles, fron1 the gaging station to the basin divide.
Mean-basin elevation (E), in feet above mean sea level.
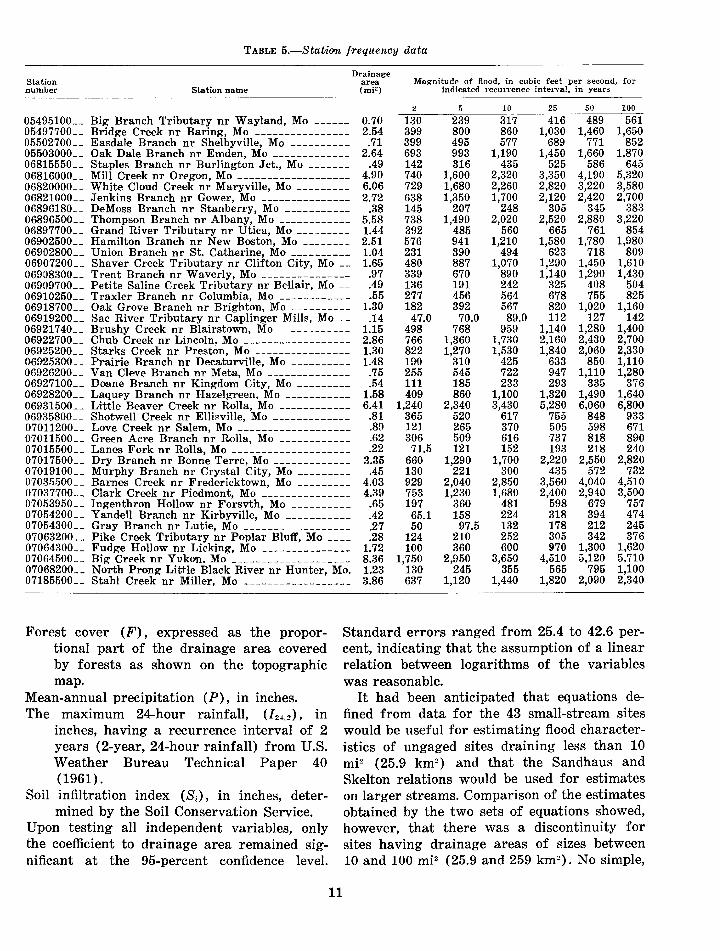
TABLE 5.-Station frequency data
Station number
05495100 __ 05497700 __ 05502700 __ 05503000 __ 06815550 __
Station name
Big Branch Tributary nr Wayland, Mo ______ Bridge Creek nr Baring, Mo ----------------Easdale Branch nr Shelbyville, Mo ----------Oak Dale Branch nr Emden, Mo -------------Staples Branch nr Burlington Jet., Mo -------
06816000 __ Mill Creek nr Oregon, Mo -------------------06820000 __ White Cloud Creek nr Maryville, Mo ---------06821000 __ Jenkins Branch nr Gower, Mo ---------------06896180 __ DeMoss Branch nr Stanberry, Mo -----------06896500 __ Thompson Branch nr Albany, Mo ------------06897700 __ Grand River Tributary nr Utica, Mo ---------06902500 __ Hamilton Branch nr New Boston, Mo --------06902800 __ Union Branch nr St. Catherine, Mo ----------069·07200 __ Shaver Creek Tributary nr Clifton City, Mo __ 06908300 __ Trent Branch nr Waverly, Mo ---------------06909700 __ Petite Saline Creek Tributary nr Bellair, Mo __ 06910250 __ Traxler Branch nr Columbia, Mo ------------06918700 __ Oak Grove Branch nr Brighton, Mo ----------06919200 __ Sac River Tributary nr Caplinger Mills, Mo __ 06921740 __ Brushy Creek nr Blairstown, Mo ------------06922700 __ Chub Creek nr Lincoln. Mo ------------------06925200 __ Starks Creek nr Preston, Mo ----------------06925300 __ Prairie Branch nr Decaturville, Mo ----------06926200 __ Van Cleve Branch nr Meta, Mo --------------06927100 __ Doone Branch nr Kingdom City, Mo ---------06928200 __ LaquE>y Branch nr Hazelgreen, Mo -----------06931500 __ Little Beaver Creek nr Rolla, Mo ------------06935800 __ Shotwell Creek nr Ellil"-ville, Mo -------------07011200 __ Love Creek nr Salem, Mo -------------------07011500 __ Green Acre Branch nr Rolla, Mo ------------07015500 __ Lanes Fork nr Rolla, Mo --------------------07017500 __ Dry Branch nr Bonne Terre, Mo -------------07019100 __ Murphy Branch nr Crystal City, Mo _________ 07035500 __ Barnes Creek nr Fredericktown, Mo ---------07037700 __ Clark Creek nr Piedmont, Mo ---------------07053950 __ Ingenthron Hollow nr Forsvth, Mo ----------07054200 __ Yandell Branch nr Kirbyville, Mo -----------07054300 __ Gray Branch nr Lutie, Mo ------------------07063200 __ Pike Creek Tributary nr Poplar Bluff, Mo ____ 07064300 __ Fudge Hollow nr Licking, Mo ---------------07064500 __ Big Creek nr Yukon, Mo --------------------07068200 __ North Prong Little Black River nr Hunter, Mo. 07185500 __ Stahl Creek nr Miller, Mo ------------------
Drainage area (mi2 )
0.70 2.54 .71
2.64 .49
4.90 6.06 2.72
.38 5.58 1.44 2.51 1.04 1.65
.97
.49 .55
1.30 .14
1.15 2.86 1.30 1.48 .75 .54
1.58 6.41 .81 .89 .62 .22
3.35 .45
4.03 4.39 .65 .42 .27 .28
1.72 8.36 1.23 3.86
Magnitude of flood, in cubic feet per second, for indicated recurrence interyaJ, in years
2 5 10 25 50 100
130 239 317 416 489 561 399 800 860 1,030 1,460 1,650 399 495 577 689 771 852 693 993 1,190 1,450 1,660 1,870 142 316 435 525 586 645 740 1,600 2,320 3,350 4,190 5,320 729 1,680 2,260 2,820 3,220 3,580 638 1,350 1,700 2,120 2,420 2,700 145 207 248 305 345 383 738 1,490 2,020 2,520 2,880 3,220 392 485 560 665 761 854 576 941 1,210 1,580 1,780 1,980 231 390 494 623 718 809 480 887 1,070 1,290 1,450 1,610 339 670 890 1,140 1,290 1,430 136 191 242 325 408 504 277 456 564 678 755 825 182 392 567 820 1,020 1,160
47.0 70.0 89.0 112 127 142 498 768 959 1,140 1,280 1,400 766 1,360 1,730 2,160 2,430 2,700 822 1,270 1,530 1,840 2,060 2,330 190 310 425 633 850 1,110 255 545 722 947 1,110 1,280 111 185 233 293 335 376 409 860 1,100 1,320 1,490 1,640
1,240 2,340 3,430 5,280 6,060 6,800 365 520 617 755 848 933 121 265 370 505 598 671 306 509 616 737 818 890
71.5 121 152 193 218 240 660 1,290 1,700 2,220 2,550 2,820 130 221 300 435 572 732 929 2,040 2,850 3,560 4,040 4,510 753 1,230 1,680 2,400 2,940 3,500 197 360 481 598 679 757
65.1 158 224 318 394 474 50 97.5 132 178 212 245
124 210 252 305 342 376 100 360 600 970 1,300 1,620
1,750 2,950 3,650 4,510 5,120 5,710 130 245 355 565 795 1,100 637 1,120 1,440 1,820 2,090 2,340
Forest cover (F), expressed as the proportional part of the drainage area covered by forests as shown on the topographic map.
Standard errors ranged from 25.4 to 42.6 percent, indicating that the assumption of a linear relation between logarithms of the variables was reasonable.
Mean-annual precipitation (P), in inches. The maximum 24-hour rainfall, (/24.2), in
inches, having a recurrence interval of 2 years (2-year, 24-hour rainfall) from U.S. Weather Bureau Technical Paper 40 (1961).
Soil infiltration index (Si), in inches, deter-mined by the Soil Conservation Service.
Upon testing all independent variables, only the coefficient to drainage area remained significant at the 95-percent confidence level.
11
It had been anticipated that equations defined from data for the 43 small-stream sites would be useful for estimating flood characteristics of ungaged sites draining less than 10 mi~ (25.9 km2 ) and that the Sandhaus and Skelton relations would be used for estimates on larger streams. Comparison of the estimates obtained by the two sets of equations showed, however, that there was a discontinuity for sites having drainage areas of sizes between 10 and 100 mP (25.9 and 259 km2
). No simple,

yet logical, system of using the two sets of equations was apparent, and their utility for obtaining design discharge estimates was rejected.
Recognizing that a continuous relation should exist between flood and basin characteristics for the complete range of basin sizes, data for a sample of large streams were included with the small-streams data for a combined analysis. Flood characteristics were evaluated for 109 large-stream sites where floodflows are considered to be virtually natural and a sufficient number of annual peaks had been recorded to adequately define the 50- to 100-year flood. Frequency then was analyzed by fitting a Pearson Type III distribution to the logarithms of annual peaks using a regional average coefficient of skew of - 0.5, as suggested by Hardison (1974). Data on the size and main-channel slope of the large-stream sites were available from the Sandhaus and Skelton study (1968).
Definition of estimating equations based upon the combined large- and small-stream data indicated that the assumption of a linear relation between the logarithms of the variables was inadequate. The defined log-linear relations tended to overestimate flood magnitudes at intermediate size sites. Alternative curvilinear models and variable transformations were therefore tested on the data.
The most satisfactory model found was one suggested by Creager, Justin, and Hinds (1947) :
b Qt = bA blA. 2Sba,
where A is drainage-basin size and S is mainchannel slope. By logarithmic transformation of the variables the model becomes :
b2 log Qt=log b + b1 A log A + b3log S.
Although the constants in this relation cannot be evaluated directly by linear multiple-regression analysis, repeated trial and error solutions indicated that when b2 = - 0.02, multiple-regression analysis to determine remaining constants provided relations having a minimum standard error of estimate.
Table 6 summarizes the final set of best-fit equations. To simplify use of these equations,
12
Hauth (1974) provided graphical solutions, one of which is shown in figure 3 as an example.
TABLE 6.-Summary of regression analyses
Standard Recurrence error of interval of estimate flood peak Equation (percent)
2-year --------- Q=53.5A o.ssu -o.02 SQ.a5s 38.6
5-year --------- Q=G4:0A o.856A. -o.02 so.4so 34.7
10-year ----------0.02
Q=67.6A o oo~A so.soo 34.5
25-year ----------0.02
Q=73. 7 A 0.9MA so.542 3.5.0
50-year ----------0.02 Q=79.8A o.926A so.5110 3.3.3
10.0-year --------- Q=85.1A o.rou -o.02 so.s76 33.3
The defined relations are considered useful for providing design flood estimates at ungaged sites in Missouri having characteristics within the range of experience in the sample datathat is, they are useful at sites where floodflow is virtually natural, where drainage areas range from 0.1 to 14,000 mi2 (0.26 to 32,300 km2
), and where main channels have slopes between 1 and 300 ft/mi (0.19 and 56.7 m/km). The relations should not be used at sites where ftoodflows are significantly affected either by the works of man, such as the development of urban centers, reservoirs, and improved channel, or by backwater of larger streams, as might be expected near the mouth on tributary channels. The relations also are not useful for main-stream sites on the Mississippi and Missouri Rivers, but alternate design estimating techniques previously have been provided for those rivers and for some regulated streams by Patterson and Gamble (1968), Patterson (1964, 1966), and Matthai (1969).
DISCUSSION
This first operational use of the rainfallrunoff model proved the practicality of record extension for use in regional frequency analysis. Valuable experience was gained, but many questions and problems arose. A general discussion of some of the more important observations is presented here. Many of the techniques used in this study were necessarily selected on an intuitive basis and perhaps will be useful in future studies, yet it is hoped that this discus-

U) w ...J
~
w a:: <( :J 0 U)
z
<i. w a:: <(
w (!J <( z <( 10 a:: Cl
EXPLANATION
2-year frequency
-002 Q = 53.5A0851A SU356
100 1000 10,000
DISCHARGE, IN CUBIC FEET PER SECOND
FIGURE 3.-Graphical solution of the 2-year equation.
13
100,000

sion also can suggest areas of beneficial future research.
PARAMETER EVALUATION
Parameter evaluation was the most complex operation in the study and the one requiring the most arbitrary judgments. Development of improved guidelines for parameter evaluation could be of significant benefit.
Information on the probable magnitude and possible range of parameter values is needed for efficiency of calibration. At first it was difficult to estimate initial parameter values, but as experience was gained the efficiency in parameter evaluation increased. The data shown in table 3 will be of value to subsequent analysts in areas near Missouri, but it would be useful to know the variation in parameter values is associated with basin characteristics. A relatively simple approach would be to use the values in table 3 as dependent variables in a multiple-regression analysis. Results would not only aid the efficiency of parameter evaluation at short-record sites, but conceivably could allow model calibration for ungaged sites.
Information on the sensitivity of output results to changes in parameter values would also assist future investigators. For example, the routing parameter TP /TC was observed during this investigation to exert little influence on output results. Although no detailed sensitivity investigation was undertaken, on the basis of experience with the earlier calibration this parameter was virtually ignored during latter parts of the study. More detailed study might indicate no need to use the parameter value TP lTC in any model calibration and might set relative priorities for calibration of other parameters.
A knowledge of the amount of information needed for effective model calibration would be of great importance to other stream flood investigations. In this study, from 8 to 31 storms were used. Research studies might test the effectiveness of lesser calibration data as a basis for knowing how long data collection progams should be operated. A related study of criteria to judge the effectiveness of individual storms and number of individual storms during the data collection period also would be helpful.
14
Lacking any technical basis, the storm screening process used in this study to include or to omit storms in the calibration process was judged necessary to obtain the most effective set of model parameters. This screening process required considerable effort in recalibration on a reduced number of storm events. It would be interesting to test how much differently the results might be if there had been no screening.
The three-phase calibration scheme in which storage and routing parameters were calibrated separately was devised for efficiency on a rational basis. Alternate schemes are available and might have been selected. They ranged in complexity from direct calibration in a single operation to calibration of parameters in multiphase operations where alternate parameter groups are identified. Research studies might suggest the most effective scheme.
RECORD SYNTHESIS
Experience in synthesizing records by using long-term climatic data in a calibrated model defined some unexpected problems.
The n1ost perplexing problem was the inability to distinguish between the frequency curves defined from the four long-term precipitation records. Additional study to define whether any significant difference exists within the rainfall records themselves would be of interest. Such a study might suggest which available longterm rainfall records in an area are effective for model synthesis and, therefore, the ones which should be reduced for model use.
Techniques of combining frequency curves should be investigated. Intuitively, observed records should have some weight in defining the middle range of an annual series frequency curve. Experience with the model-synthesized records indicates that larger floods may be more reliably estimated than the average-size floods. Some technical basis is needed for combining and weighting the observed and synthesized data in freqeuncy analysis.
One other practical problem that could benefit from additional study and could improve operational guidelines is the selection of storn1s to be reduced to unit data. Perhaps investigation of the unused unit data in the four Missouri long-tern1 rainfall-runoff records could identify criteria and thereby save the data-

reduction effort necessary in similar future studies.
REGRESSION ANALYSIS
The nonlinearity of the relation between the logarithms of the floods and basin characteristics was surprising. Perhaps alternate model forms would be as effective or more effective than the one used, but of more interest is the reality of the nonlinear model form. Is it a relation that would be defined if long-term records were available at the small-stream sites, or is it a form that results from some idiosyncrasy in the rainfall-runoff model? For example, it is conceivable that the use of a single rain-gage record with the necessary assumption of uniform areal precipitaion may tend to overestimate the flood magnitudes in the larger basins (approximately 10 miZ or 26 km2 ), thereby causing the apparent curvilinear regression.
The standard errors of estimate of the regression relations defined in this study are considerably improved over the standard errors of relations previously defined for Missouri. It must be noted, however, that these newly defined relations are based upon synthesized flood records that are highly correlated among themselves. This cross-correlation will reduce significantly the time sampling errors inherent in observed records; but it remains to be shown whether or not the improved standard errors actually indicate a more reliable estimate of future floodflows.
SUMMARY AND CONCLUSIONS
This study has demonstrated the utility and practicality of using a rainfall-runoff model of small-stream floods to define techniques of estimating flood magnitude and frequency at ungaged sites. Short-duration records of concurrent rainfall and runoff defined parameters that are used in a mathematical model and that define each basin's response to rainfall. Longterm climatic data then were put into the model to generate long-term peak-flow records. Results obtained from this process indicate that there is a rational consistency of parameter values from basin to basin throughout the State. The average standard error of estimate from all calibrations, which in general indi-
15
cates the ability to mathematically define the basin response, was about 35 percent.
Synthetic annual peak discharges were obtained at each gaging station by transferring long-term rainfall data (an average of 70 years) from four locations. Statistical tests indicated that the synthetic peaks based upon the four different rainfall records were identically distributed and that a simple averaging of synthetic frequency curves was justified. An examination of available short-term rainfall records throughout the State shows a few rainfall intensities to be greater than those from the four long-term records and demonstrates the time sampling error inherent in hydrologic data. Extreme storms such as these can cause extreme runoff, and the recurrence intervals for these floods are difficult to define within a short observed record. However, by using a longer period of rainfall with the calibrated model, a long series of annual peaks were generated as improved time samples for definition of frequency curves at each site.
Simple regression of the logarithmic transforms of streamflow characteristics versus logarithmic transforms of drainage area proved to be linear for basins used in the synthesis. However, when data for small and large basins were combined, a nonlinearity occurred. Linearity of regression was then ob-
b A-o·02 b tained by the model equation Qt = bA 1 S 3
•
A map plot of residuals suggests the statewide applicability of the equations. Equations defined in this study are based upon more data and a more rigorous analysis than those presented in the report by Sandhaus and Skelton (1968).
REFERENCES Benson, M. A., 1962, Factors influencing the occurrence
of floods in a humid region of diverse terrain: U.S. GeoL Survey Water-Supply Paper 1580-B, 64 p.
--1964, Factors affecting the occurrence of flood.s in the Southwest: U.S. Geol. Survey WaJter-Supply Paper 1580-D, 70 p.
Conover, W. J., 1971, Practical nonparametric statistics New York, John Wiley, p. 314-316.
Creager, W. P., Justin, J. D., Hinds, Julian, 1947, Engineering for dams, volume I: New York, John Wiley, Ji. 125-126.
Dawdy, D. E., Lichty, R. W., and Bergmann, J. M:, 1972 A rainfall-runoff s.imulation model for estimati~n of flood peaks for small drainage basins.: U.S. GeoL Survey Prof. Paper 506-B, 28 p.

Hardison, C. H., 1974, Generalized skew coefficients of annual floods in the United States and their application: Water Resources Re·search, v. 10, no. 4. (In press.)
Hauth, L. D., 1973a, Selected storm events in 5-minute incr·ements from Missouri rainfall stations at Kansas City, St. Louis, Springfield, and Columbia, Missouri: U.S. Geol. Survey open-file rept., 191 p., Rolla, Mo.
--- 1973b, Rainfall-runoff data for small drainage areas of Missouri: U.S. Geol. Survey open-file rept., Rolla, Mo.
--- 1974, A technique for estimating the magnitude and frequency of Missouri floods: U.S. Geol. Survey open-file rept., Rolla, Mo.
Kohler, M. A., Nordenson, T. J., and Baker, D. R., 1959, Evaporation maps for the United States: U.S. Weather Bureau Tech. Paper no. 37, 13 p.
Matthai, H. F., 1969, Magnitude and frequency of floods in the United States, Part 6B, Missouri River below Sioux City, Iowa: U.S. Geol. Survey Water-Supply Paper 1680, 491 p.
Patterson, J. L., 1966, Magnitude and frequency of floods in the United States, Part 6A, Missouri
River abo;ve Sioux City, Iowa: U.S. Geol. Survey Water-Supply Paper 1679, 471 p.
--- 1964, Magnitude and frequency of floods in the United States, Part 7, Lower Mississippi River basin: U.S. Geol. Survey Water-Supply Paper 1681, 6·36 p.
Patterson, J. L., and Gamble, C. R., 1968, Magnitude and frequency of floods in the United 8tates, Part 5, Hudson Bay and upper Mississippi River basins: U.S. Geol. Survey Wate,r-Supply Paper 1678, 546 p.
Sandhaus, E. H., and Skelton, John, 1968, Magnitude and Frequency of Missouri floods: Missouri Geol. Survey and Water Resources rept. 23, 276 p.
Searcy, J. K., 1955, Floods in Missouri, magnitude and frequency: U.S. Geol. Survey Circ. 370, 126 p.
Skelton, John, and Homyk, Anthony, 1970, A proposed streamflow data program for Missouri: U.S. Geol. Survey open-file rept., 77 p.
U.S. Water Resources Council, 1967, A uniform technique for determining flood flow frequencies: U.S. Water Resources Council Bull. 15, 15 p.
U.S. Weather Bureau, 1961, Rainfall frequency atlas of the United States: U.S. Weather Bureau Tech. Paper 40, 115 p.
*u.s. GOVERNMENT PRINTING OFFICE: 1974 0-585-468/37
16
Related Documents