CS 109A: Advanced Topics in Data Science Protopapas,Rader Model Selection & Information Criteria: Akaike Information Criterion Authors: M. Mattheakis,P.Protopapas 1 Maximum Likelihood Estimation In data analysis the statistical characterization of a data sample is usually performed through a parametric probability distribution (or mass function), where we use a distribution to fit our data. The reason that we want to fit a distribution to our data is that it is easier to work with a model rather than data, and it is also more general. There are a lot of types of distributions for different types of data. Examples include, Normal, exponential, Poisson, Gamma, etc. A distribution is completely characterized by a set of parameters which we denote in vector form as θ = (θ 1 , ..., θ k ), where k is the number of parameters. The goal is to estimate the distribution parameters in order to fit our data as best as it is possible. For instance, the method of least squares is a simple example that estimates the parameter set θ, but this is a method for a specific model. A more general and powerful method to find the optimal way to fit a distribution to data is Maximum Likelihood Estimation (MLE). This is the topic discussed in this section. We can understand the idea of MLE through a simple example. We assume that we have a set of observations shown with the red circles in Fig. 1. We observe that most of the observations are arranged around a center, so we intuitively suggest the Normal distribution to fit this dataset (red curve in Fig. 1). The normal distribution is characterized by two parameters: the mean μ and the standard deviation σ, where, θ = (μ, σ). The Figure 1: A data sample (red circles) that is represented by a normal distribution (red line). (The image was taken by "StatQuest, MLE" from youtube). question is how can we estimate the parameters θ of the normal distribution in order to maximize the likelihood of observing the data value. A straightforward way is to compute the likelihood for many values of parameters μ and σ, and find which set of θ = (μ, σ) maximizes the likelihood. This is schematically illustrated in Fig. 2. Last Modified: September 30, 2018 1

Welcome message from author
This document is posted to help you gain knowledge. Please leave a comment to let me know what you think about it! Share it to your friends and learn new things together.
Transcript

CS 109A: Advanced Topics in Data ScienceProtopapas, Rader
Model Selection & Information Criteria:Akaike Information Criterion
Authors: M. Mattheakis, P. Protopapas
1 Maximum Likelihood Estimation
In data analysis the statistical characterization of a data sample is usually performedthrough a parametric probability distribution (or mass function), where we use a distributionto fit our data. The reason that we want to fit a distribution to our data is that it is easierto work with a model rather than data, and it is also more general. There are a lot of typesof distributions for different types of data. Examples include, Normal, exponential, Poisson,Gamma, etc. A distribution is completely characterized by a set of parameters which wedenote in vector form as θ = (θ1, ..., θk), where k is the number of parameters. The goal isto estimate the distribution parameters in order to fit our data as best as it is possible. Forinstance, the method of least squares is a simple example that estimates the parameter setθ, but this is a method for a specific model. A more general and powerful method to findthe optimal way to fit a distribution to data is Maximum Likelihood Estimation (MLE). Thisis the topic discussed in this section.
We can understand the idea of MLE through a simple example. We assume that wehave a set of observations shown with the red circles in Fig. 1. We observe that mostof the observations are arranged around a center, so we intuitively suggest the Normaldistribution to fit this dataset (red curve in Fig. 1). The normal distribution is characterizedby two parameters: the mean µ and the standard deviation σ, where, θ = (µ, σ). The
Figure 1: A data sample (red circles) that is represented by a normal distribution (redline). (The image was taken by "StatQuest, MLE" from youtube).
question is how can we estimate the parameters θ of the normal distribution in order tomaximize the likelihood of observing the data value. A straightforward way is to computethe likelihood for many values of parameters µ and σ, and find which set of θ = (µ, σ)maximizes the likelihood. This is schematically illustrated in Fig. 2.
Last Modified: September 30, 2018 1

Figure 2: Maximum Likelihood Estimation (MLE): Scanning over the parameters µ and σuntil the maximum value of likelihood is obtained. (The images were taken by "StatQuest,MLE" from youtube).
A formal method for estimating the optimal distribution parameters θ is given by theMLE approach. Let us describe the main idea behind the MLE. We assume, conditionalon θ, a parametric distribution q(y|θ), where y = (y1, ..., yn)T is a vector that contains nmeasurements (or observations). The likelihood is defined by the product:
L(θ) =
n∏i=1
q(yi|θ), (1)
and gives a measure of how likely it is to observe the values of y given the parametersθ. Maximum likelihood fitting consists of choosing the distribution parameters θ thatmaximizes the L for a given set of observations y. It is easier and numerically more stableto work with the log-likelihood, since the product turns to summation as follows
`(θ) =
n∑i=1
log(q(yi|θ)
), (2)
where log here is the natural logarithm. In MLE we are able to use log-likelihood ` insteadof the likelihood L because their derivatives become zero at the same point, since
∂`∂θ
=∂∂θ
log L =1L∂L∂θ
,
hence, both L(θ) and `(θ) become maximum for the same set of parameters θ, which wewill call θMLE, and thus,
∂∂θ
L(θ)∣∣∣∣∣θ=θMLE
=∂∂θ`(θ)
∣∣∣∣∣θ=θMLE
= 0.
We present the basic idea of the MLE method through a particular distribution, theexponential. Afterwards, we present a very popular and useful workhorse algorithmthat is based on MLE, the Linear Regression model with normal error. In this model, theoptimal distribution parameters that maximize the likelihood can be calculated exactly(analytically). Unfortunately, for most distributions the analytic solution is not possible,so we use iterative methods (such as gradient descent) to estimate the parameters.
Last Modified: September 30, 2018 2

1.1 Exponential Distribution
In this section, we describe the Maximum Likelihood Estimation (MLE) method by using theexponential distribution. The exponential distribution occurs naturally in many real-worldsituations such as economic growth, the increasing growth rate of microorganisms, virusspreading, the waiting times between events (e.g. views of a streaming video in youtube),in nuclear chain reactions rates, in computer processing power (Moore’s law), and inmany other examples. Consequently, it is a very useful distribution. The exponentialdistribution is characterized by just one parameter, the so-called rate parameter λ, whichis proportional to how quickly events happen, hence θ = λ. Considering that we haven observations that are given by the vector y = (y1, ..., yn)T, and assuming that thesedata follow the exponential distribution, then they can be described by the exponentialprobability density:
f (yi|λ) =
{λe−λyi yi ≥ 00 yi < 0 . (3)
The log-likelihood that corresponds to the exponential distribution density (3) is deter-mined by the formula (2) and given by
`(λ) =
n∑i=1
log(λe−λyi
)=
n∑i=1
(log (λ) − λyi
). (4)
Since we have only one distribution parameter (λ), we are maximizing the log-likelihood(4) with respect to λ, hence
∂`∂λ
=nλ−
n∑i=1
yi = 0,
where the solution estimates the optimal parameter λMLE that maximizes the likelihoodto be:
λMLE =
1n
n∑i=1
yi
−1
. (5)
Inspecting the expression (5) we can observe that λMLE is the inverse of the mean of ourdata sample. This is a useful property of the rate parameter.
1.2 Linear Regression Model
Linear regression is a workhorse algorithm that is used in many scientific fields such asfinance, the social sciences, the natural sciences and data science. We assume a dataset withn training data-points (yi, xi), for i = 1, ...,n, where yi accounts to the i-th observation forthe input point xi. The goal of the linear regression model is to find a linear relationshipbetween the quantitative response y = (y1, ..., yn)T on the basis of the input (predictor)vector x = (x1, ..., xn)T. In Fig. 3 we illustrate the probabilistic interpretation of linearregression and the idea behind the MLE for linear regression model. In particular, weshow a sample set of points (yi, xi) (red filled circles), and the corresponding prediction of
Last Modified: September 30, 2018 3
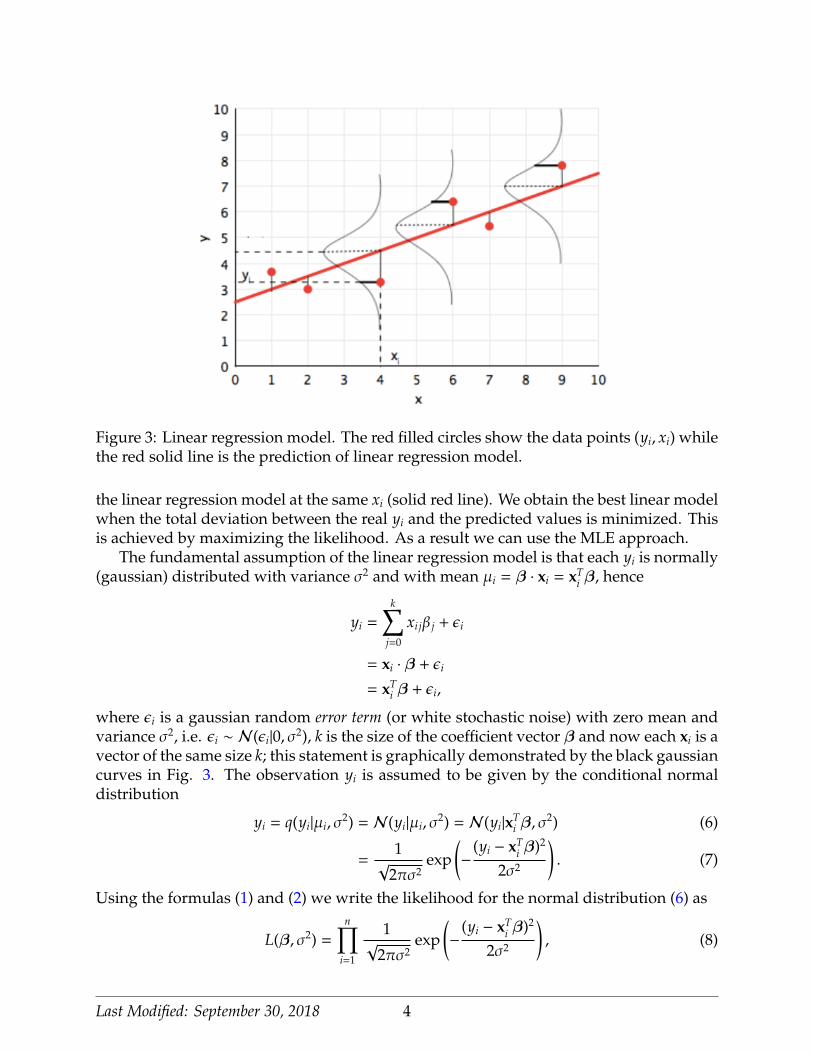
Figure 3: Linear regression model. The red filled circles show the data points (yi, xi) whilethe red solid line is the prediction of linear regression model.
the linear regression model at the same xi (solid red line). We obtain the best linear modelwhen the total deviation between the real yi and the predicted values is minimized. Thisis achieved by maximizing the likelihood. As a result we can use the MLE approach.
The fundamental assumption of the linear regression model is that each yi is normally(gaussian) distributed with variance σ2 and with mean µi = β · xi = xT
i β, hence
yi =
k∑j=0
xi jβ j + εi
= xi · β + εi
= xTi β + εi,
where εi is a gaussian random error term (or white stochastic noise) with zero mean andvariance σ2, i.e. εi ∼ N(εi|0, σ2), k is the size of the coefficient vector β and now each xi is avector of the same size k; this statement is graphically demonstrated by the black gaussiancurves in Fig. 3. The observation yi is assumed to be given by the conditional normaldistribution
yi = q(yi|µi, σ2) = N(yi|µi, σ
2) = N(yi|xTi β, σ
2) (6)
=1
√2πσ2
exp(−
(yi − xTi β)2
2σ2
). (7)
Using the formulas (1) and (2) we write the likelihood for the normal distribution (6) as
L(β, σ2) =
n∏i=1
1√
2πσ2exp
(−
(yi − xTi β)2
2σ2
), (8)
Last Modified: September 30, 2018 4

and the corresponding log-likelihood
`(β, σ2) =
n∑i=1
log(
1√
2πσ2exp
(−
(yi − xTi β)2
2σ2
))= −
n∑i=1
(12
log(2π) +12
log(σ2) +(yi − xT
i β)2
2σ2
)= −
n2
log(2π) −n2
log(σ2) −1
2σ2
n∑i=1
(yi − xTi β)2, (9)
where the last term in Eq. (9) is called loss function. The MLE method requires themaximization of likelihood, hence we differentiate Eq. (9) with respect the distributionparameters β and σ2, and set the equation to zero. Solving for the optimal parametersθMLE = (βMLE, σ2
MLE), we obtain the standard formulas for the linear regression model:
βMLE = (XTX)−1XTy (10)
and
σ2MLE =
1n
n∑i=1
(yi − xT
i βMLE
)2, (11)
where the matrix X is called the design matrix and is created by stacking rows of xi as
X =
xT
1xT
2...
xTn
=
1 x11 · · · x1ν
1 x21 · · · x2ν...
.... . .
...1 xn1 · · · xnν
. (12)
2 Information Theory & Model Selection
2.1 KL Divergence
In the previous section we used MLE to estimate the parameters of a particular distributionin order to fit a given dataset of real observations. Two crucial questions that naturallyarose regarding the learning of a model are: how good do we fit the real data and what additionaluncertainty have we introduced. In other words, we would like to know how far our modelis from "perfect accuracy". The answer to these crucial questions is given by the Kullback-Leibler divergence (KL) (also called relative entropy), which was introduced in 1951 in thecontext of information theory and shows the direct divergence between two distributions.In particular, the KL divergence is a measure of how one probability distribution isdifferent from a second reference probability distribution. The KL divergence is a non-negative quantity and approaches zero when we expect similar, if not the same, behaviorfrom two distributions.
We suppose that the data are generated by an unknown distribution p(y), the "real"distribution which we wish to model. We try to approximate p with a parametric learning
Last Modified: September 30, 2018 5

model distribution q(y|θ), which is governed by a set of adjustable parameters θ that wehave to estimate. The KL divergence is defined as:
DKL(p || q
)=
n∑i=1
p(yi) log(
p(yi)q(yi|θ)
)(13)
=
∫∞
−∞
p(y) log(
p(y)q(y|θ)
)dy, (14)
where the formula (13) accounts for discrete variables, whereas in the continuous variableslimit the KL divergence is given by (14). Note that the KL divergence is not a symmetricalquantity, that is to say DKL
(p || q
), DKL
(q || p
). In addition, we can easily check that the
KL divergence between a distribution and itself isDKL(p || p
)= 0.
We obtain another useful formula for the KL divergence by observing that the defini-tions (13) and (14) are essentially the discrete and continuous, respectively, expectation oflog(p/q) conditional on the "real" distribution p, hence:
DKL(p || q
)= Ep
[log
(p(y)
q(y|θ)
)]= Ep
[log
(p(y)
)− log
(q(y|θ)
)], (15)
where Ep [.] denotes the expectation value conditional to p. We can show now that the KLdivergence is always a non-negative quantity,
DKL(p || q
)≥ 0, (16)
with equality if, and only if, p(y) = q(y). We use Jensen’s inequality for the expectation ona convex function f (y):
E[
f (y)]≥ f
(E
[y]).
Hence, from (15) we read:
DKL(p || q
)= Ep
[log
(p(y)
q(y|θ)
)]= Ep
[− log
(q(y|θ)p(y)
)]≥ − log
(Ep
[q(y|θ)p(y)
])= 0,
where we used the fact that − log(.) is a strictly convex function. The last step of the proofabove involves the definition of the conditional expectation value and the assumption ofa normalized to one distribution q, such as:
log(Ep
[q(y|θ)p(y)
])= log
(∫y
p(y)q(y|θ)p(y)
dy)
= log(∫
yq(y|θ)dy
)= log
(∫y
dy)
= 0.
In fact, since − log(.) is a strictly convex function, the equality in Eq. (16) only happenswhen q(y|θ) = p(y) for all y.
Last Modified: September 30, 2018 6

2.2 Maximum Likelihood Justification
In section 1, we showed that the MLE is a powerful method used to estimate the optimalparameters θMLE for which a parametric model distribution q(y|θ) best fits the data thatare given by a "real" distribution p(y). Nevertheless, the MLE approach was not reallyderived, but emerged from our intuition. The KL divergence provides a way for a formaljustification of the MLE method and is what we discuss here. In particular, we are seekingthe parameters θ that provide the best fit to the real distribution p(y). In terms of KLdivergence we want to minimize the KL divergence between p(y) and q(y|θ) with respectto θ. We cannot do this directly because we do not know the real distribution p(y) andthus, we cannot evaluate the integral (14) or work with the conditional expectation of Eq.(15). We suppose, however, that we have observed a finite set of training points yi (fori = 1, ...,n) drawn from p(y). Then the true distribution p(y) can be approximated by afinite sum over these points given by the empirical distribution:
p(y) '1n
n∑i=1
δ(y − yi), (17)
where δ is the Dirac function. Using the approximation (17) into the integral (14) yields:
DKL(p || q
)'
∫∞
−∞
p(y) log(
p(y)q(y|θ)
)dy
=1n
n∑i=1
∫∞
−∞
δ(y − yi) log(
p(y)q(y|θ)
)dy =
1n
n∑i=1
log(
p(yi)q(yi|θ)
)=
1n
n∑i=1
(log p(yi) − log q(yi|θ)
), (18)
where we used the property of the delta function:∫∞
−∞δ(x − x0) f (x)dx = f (x0). We want
to minimize the Eq. (18) with respect to θ. We observe that the first term in Eq. (18) isindependent of θ and the second term is the negative log-likelihood. Thus, minimizingthe expression (18) essentially means maximizing
∑ni=1 log q(yi|θ) as the MLE states.
2.3 Model Comparison
The KL divergence can be used to compare two different model distributions q(y|θ) andr(y|θ) in order to check which model fits better to the real data given by p(y). Using Eq.(15) we have:
DKL(p || q
)−DKL
(p || r
)= Ep
[log
(p(y)
)− log
(q(y|θ)
)]− Ep
[log
(p(y)
)− log
(r(y|θ)
)]= Ep
[log
(r(y|θ)
)− log
(q(y|θ)
)]= Ep
[log
(r(y|θ)q(y|θ)
)]. (19)
We read from Eq. (19) that in order to compare two different models with distributionsq(y|θ) and r(y|θ), respectively, we just need the sample average of the logarithm of the
Last Modified: September 30, 2018 7
ratio r/q conditional to p. Moreover, we can use the approximation (18) to compare thetwo model distributions in terms of likelihood, hence:
DKL(p || q
)−DKL
(p || r
)=
1n
n∑i=1
(log p(yi) − log q(yi|θ)
)−
1n
n∑i=1
(log p(yi) − log r(yi|θ)
)=
1n
n∑i=1
(log r(yi|θ) − log q(yi|θ)
)=
1n
n∑i=1
log(
r(yi|θ)q(yi|θ)
)=
1n
log(∏n
i=1 r(yi|θ)∏ni=1 q(yi|θ)
)=
1n
log(
Lr(y|θ)Lq(y|θ)
),
where the ratio inside the brackets of the last term is the likelihood ratio for r and qdistributions, respectively, and can be used to test the goodness of fit. Let us point outthat the real distribution p has been eliminated.
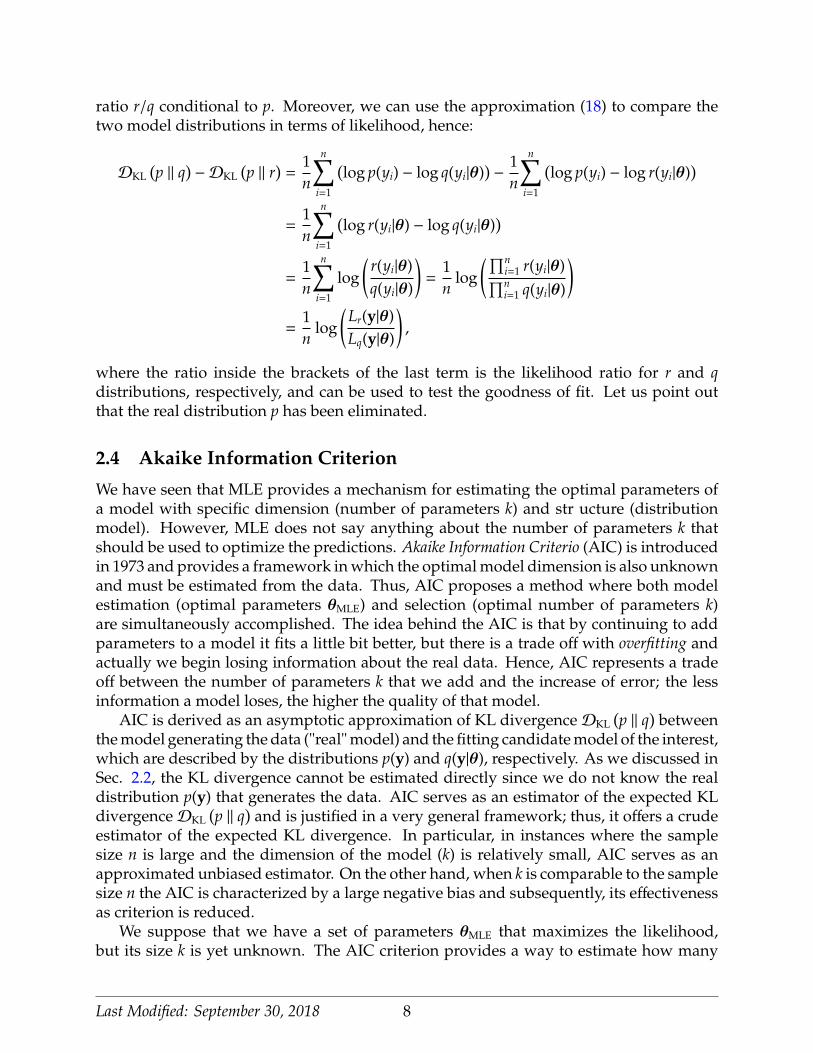
2.4 Akaike Information Criterion
We have seen that MLE provides a mechanism for estimating the optimal parameters ofa model with specific dimension (number of parameters k) and str ucture (distributionmodel). However, MLE does not say anything about the number of parameters k thatshould be used to optimize the predictions. Akaike Information Criterio (AIC) is introducedin 1973 and provides a framework in which the optimal model dimension is also unknownand must be estimated from the data. Thus, AIC proposes a method where both modelestimation (optimal parameters θMLE) and selection (optimal number of parameters k)are simultaneously accomplished. The idea behind the AIC is that by continuing to addparameters to a model it fits a little bit better, but there is a trade off with overfitting andactually we begin losing information about the real data. Hence, AIC represents a tradeoff between the number of parameters k that we add and the increase of error; the lessinformation a model loses, the higher the quality of that model.
AIC is derived as an asymptotic approximation of KL divergenceDKL(p || q
)between
the model generating the data ("real" model) and the fitting candidate model of the interest,which are described by the distributions p(y) and q(y|θ), respectively. As we discussed inSec. 2.2, the KL divergence cannot be estimated directly since we do not know the realdistribution p(y) that generates the data. AIC serves as an estimator of the expected KLdivergenceDKL
(p || q
)and is justified in a very general framework; thus, it offers a crude
estimator of the expected KL divergence. In particular, in instances where the samplesize n is large and the dimension of the model (k) is relatively small, AIC serves as anapproximated unbiased estimator. On the other hand, when k is comparable to the samplesize n the AIC is characterized by a large negative bias and subsequently, its effectivenessas criterion is reduced.
We suppose that we have a set of parameters θMLE that maximizes the likelihood,but its size k is yet unknown. The AIC criterion provides a way to estimate how many
Last Modified: September 30, 2018 8
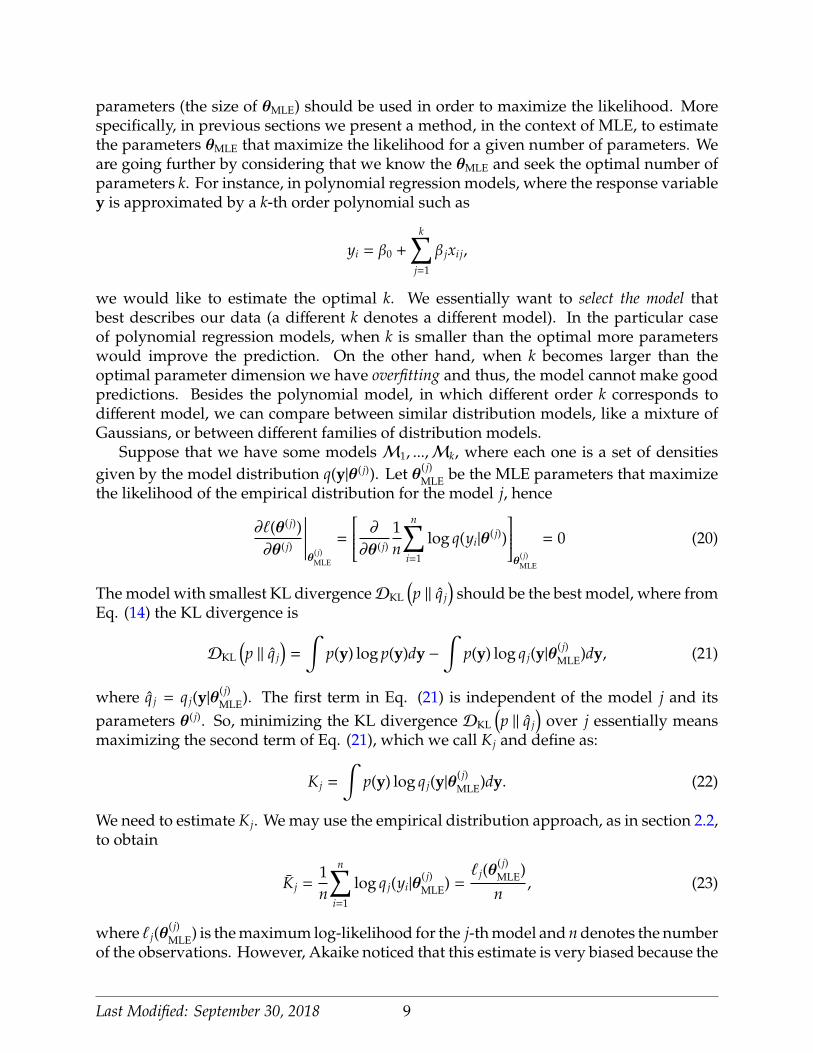
parameters (the size of θMLE) should be used in order to maximize the likelihood. Morespecifically, in previous sections we present a method, in the context of MLE, to estimatethe parameters θMLE that maximize the likelihood for a given number of parameters. Weare going further by considering that we know the θMLE and seek the optimal number ofparameters k. For instance, in polynomial regression models, where the response variabley is approximated by a k-th order polynomial such as
yi = β0 +
k∑j=1
β jxi j,
we would like to estimate the optimal k. We essentially want to select the model thatbest describes our data (a different k denotes a different model). In the particular caseof polynomial regression models, when k is smaller than the optimal more parameterswould improve the prediction. On the other hand, when k becomes larger than theoptimal parameter dimension we have overfitting and thus, the model cannot make goodpredictions. Besides the polynomial model, in which different order k corresponds todifferent model, we can compare between similar distribution models, like a mixture ofGaussians, or between different families of distribution models.
Suppose that we have some models M1, ...,Mk, where each one is a set of densitiesgiven by the model distribution q(y|θ( j)). Let θ( j)
MLE be the MLE parameters that maximizethe likelihood of the empirical distribution for the model j, hence
∂`(θ( j))∂θ( j)
∣∣∣∣∣∣θ
( j)MLE
=
∂
∂θ( j)
1n
n∑i=1
log q(yi|θ( j))
θ
( j)MLE
= 0 (20)
The model with smallest KL divergenceDKL
(p || q̂ j
)should be the best model, where from
Eq. (14) the KL divergence is
DKL
(p || q̂ j
)=
∫p(y) log p(y)dy −
∫p(y) log q j(y|θ
( j)MLE)dy, (21)
where q̂ j = q j(y|θ( j)MLE). The first term in Eq. (21) is independent of the model j and its
parameters θ( j). So, minimizing the KL divergence DKL
(p || q̂ j
)over j essentially means
maximizing the second term of Eq. (21), which we call K j and define as:
K j =
∫p(y) log q j(y|θ
( j)MLE)dy. (22)
We need to estimate K j. We may use the empirical distribution approach, as in section 2.2,to obtain
K̄ j =1n
n∑i=1
log q j(yi|θ( j)MLE) =
` j(θ( j)MLE)n
, (23)
where ` j(θ( j)MLE) is the maximum log-likelihood for the j-th model and n denotes the number
of the observations. However, Akaike noticed that this estimate is very biased because the
Last Modified: September 30, 2018 9
data are being used twice: first for the MLE to get θ( j)MLE and second to evaluate the integral.
He showed that the bias is related to the dimension of parameters and approximately givenby k j/n, where k j is the dimension of the parameters for the j-th model. As we prove inthe end of this section, the integral (22) asymptotically yields
K j = K̄ j −k j
n
=` j(θ
( j)MLE)n
−k j
n.
By using the last result, we define the Akaike information criterion as
AIC( j) = 2nK j (24)
= 2` j(θ( j)MLE) − 2k j. (25)
We notice that maximizing the AIC(j) is the same as maximizing K j over j. The multipli-cation factor 2n is introduced for historical reasons and does not actually play any role inthe maximization of the AIC. Finally, we point out a very important feature: the goal ofAIC is to select the best model for a given dataset without assuming that the "true" datasample, or the data generating process p, is in the family of the fitting models from whichare selecting. Hence, AIC is a very general and powerful selection model tool.
In the followings, we present the derivation of AIC, which is a long derivation andrequires asymptotic analysis and some further assumptions. The key point in this deriva-tion is to estimate the deviation of the empirical formula (23) from the correct (22). Forsimplicity, we focus on a single model and drop the subscript j, hence we need to estimatethe difference K̄ − K. First of all, we assume that θMLE maximize the likelihood of theempirical distribution p, but it is not the correct optimal parameters set for our modeldistribution q, in other words θMLE maximizes the K̄ of Eq. (23) but not the K of Eq.(22). Furthermore, we suppose that θ0 is a set of parameters that maximizes the modellikelihood and, in turn, the K. Since θ0 is an extrema of the log-likelihood of the modeldistribution q and θMLE is in the neighborhood of θ0, we expand the expressions (22), (23)around θ0. First of all let us define some useful formulas.The log-likelihood for the model distribution q:
`(θ) =
n∑i=1
log q(yi|θ). (26)
The score function, which is k × 1 vector distribution:
s(y|θ) =∂`(θ)∂θ
=∂∂θ
n∑i=1
log q(yi|θ). (27)
The Hessian, which is a k × k matrix of the second derivatives:
H(y|θ) = ∇∇T`(θ) =∂2
∂θµ∂θν
n∑i=1
log q(yi|θ). (28)
Last Modified: September 30, 2018 10
The Fisher Information matrix:
I(θ) = −Ep[H(y|θ)
], (29)
and the summation:
In(θ) = −1n
n∑i=1
H(yi|θ), (30)
where in the large population limit (n → ∞) the Fisher information matrix (29) andthe summation formula (30) approximately become equal, hence in this derivation weconsider:
I(θ) ' In(θ). (31)
Let us make some assumptions here regarding the "real" ideal parameter set θ0:By model construction and the central limit theorem (CLM), the score function is consid-ered to follow a normal distribution as:
Ep[s(y|θ0)
]= 0, (32)
var[s(y|θ0)
]= V. (33)
We define the sum:
Sn =1n
n∑i=1
s(yi|θ0), (34)
where by CLT we read:√
nSn = N(Sn|0,V). (35)
Since θMLE is in the neighborhood of θ0, it is reasonable to consider that (θMLE − θ0) is arandom vector obtained by a normal distribution as,
Z =√
n (θMLE − θ0) , (36)Zi = N (Zi|0,VZ)). (37)
We intuitively suspect that Z and Sn are correlated and thus, VZ can be expressed in termsof V. Along the derivation we will find an approximately relationship between V and VZ.
Furthermore, we prove two mathematical properties that we are going to use in thederivation. Assuming a constant k × k matrix A with elements ai j and a 1 × k randomcolumn vector b with mean µ and with symmetric covariant matrix Σ of elements σi j, wehave the following identities:
var [Ab] = A var [b] AT. (38)
E[bTAb
]= Tr [AΣ] + µTAµ, (39)
Last Modified: September 30, 2018 11
where Tr [.] denotes the trace. The second identity reads:Proof of Eq. (38) :
var [Ab] = E[A(b − µ) (A(b − µ))T
]= E
[A(b − µ) (b − µ)T AT
]= AE
[(b − µ) (b − µ)T
]AT
= A var [b] AT. �
Proof of Eq. (39) :
E[bTAb
]=
∑i
∑j
ai jbib j =∑
i
∑j
ai jE[bib j
]=
∑i
∑j
ai j
(σi j + µiµ j
)=
∑i
[AΣ]ii + µTAµ
= Tr [AΣ] + µTAµ,
where we used the linearity of the expectation and the covariant formula for two depen-dent variables:
E [X · Y] = Cov[X · Y] + E [X]E [Y] . �
We proceed with the expansion of "real" and empirical KL divergences K and K̄ of Eqs.(22) and (23), respectively. We first expand Eq. (22) around θ0:
K =
∫p(y) log q(y|θMLE)dy =
∫p(y)
[log q(y|θ)
]θ=θMLE
dy
'
∫p(y)
log q(y|θ0) + (θ − θ0)T
[∂∂θ
log q(y|θ)]θ0
+12
(θ − θ0)T[∇∇
T log q(y|θ)]θ0
(θ − θ0)
θMLE
dy
=
∫p(y)
(log q(y|θ0) + (θ − θ0)Ts(y|θ0) +
12
(θ − θ0)TH(y|θ0)(θ − θ0))θMLE
dy
=
∫p(y)
(log q(y|θ0) + (θMLE − θ0)Ts(y|θ0) +
12
(θMLE − θ0)TH(y|θ0)(θMLE − θ0))
dy
= Ep[log q(y|θ0)
]+
1√
nZTEp
[s(y|θ0)
]+
12n
ZTEp[H(y|θ0)
]Z
= K0 −1
2nZTI(θ0)Z, (40)
where the second term is dropped out because of Eq. (32) and K0 is defined as:
K0 = Ep[log q(y|θ0)
]=
∫p(y) log q(y|θ0)dy. (41)
Last Modified: September 30, 2018 12

We proceed with the expansion of Eq. (23) around θ0:
K̄ j =1n
n∑i=1
log q(yi|θMLE) =
1n
n∑i=1
log q(yi|θ)
θMLE
'
1n
n∑i=1
(log q(yi|θ0) + (θ − θ0)Ts(yi|θ0) +
12
(θ − θ0)TH(yi|θ0)(θ − θ0))
θMLE
=1n
n∑i=1
log q(yi|θ0) + (θMLE − θ0)T 1n
n∑i=1
s(yi|θ0) +12
(θMLE − θ0)T 1n
n∑i=1
H(yi|θ0) (θMLE − θ0)
= K0 + An +1√
nZTSn −
12n
ZTIn(θ0)Z. (42)
In the last step we used that for an arbitrary function f (y):
E[
f (y)]'
1n
∑i
f (yi),
and thus, by using the CLT the expectation can be approximately written as
E[
f (y)]
=1n
∑i
f (yi) + ξn,
where ξn is a gaussian random term with zero mean. In this sense, we define:
An =1n
n∑i=1
log q(yi|θ0) − K0,
Ep [An] = 0. (43)
Using the approximatios (31) and (43) the difference K̄ − K of Eqs. (40) and (42) reads:
K̄ − K ' An +1√
nZTSn, (44)
and its expectation
Ep[K̄ − K
]= Ep [An] +
1√
nEp
[ZTSn
]=
1√
nEp
[ZTSn
]. (45)
We are seeking for a bias term, so we interested in Eq. (45). As we mentioned when wedefine Z, there should be a correlation between Sn and Z, let us work on that by expanding
Last Modified: September 30, 2018 13
Sn around θMLE, we have:
Sn =1n
n∑i=1
s(yi|θ0) =
1n
n∑i=1
s(yi|θ)
θ0
=
1n
n∑i=1
∂∂θ
log q(yi|θ)
θ0
=
1n∂∂θ
n∑i=1
log q(yi|θ)
θ0
'
1n∂∂θ
n∑i=1
(log(yi|θMLE) + (θ − θMLE)Ts(yi|θMLE) +
12
(θ − θMLE)TH(yi|θMLE)(θ − θMLE))
θ0
=
12n
n∑i=1
∂∂θ
(θ − θMLE)TH(yi|θMLE)(θ − θMLE)
θ0
=
1n
n∑i=1
H(yi|θMLE)(θ − θMLE)
θ0
=1n
n∑i=1
H(yi|θMLE)(θ0 − θMLE)
hence,
Sn '1√
nI(θMLE)Z, (46)
where we used the the MLE property (20) to drop out the score function term. Now wecan estimate the correlation between Sn and Z by taking the variances of Eq. (46) andusing the distribution functions (35), (37) and the identity (38):
var [IZ] = var[√
nSn
]I
Tvar [Z]I = V
ITVZI = V
VZ = I−1VI−1. (47)
Getting back in the central Eq. (44) and using the relationship (46) and the identity (39),we obtain:
Ep[K̄ − K
]=
1√
nEp
[ZTSN
]=
1nEp
[ZTIZ
]=
1n
Tr [IVZ] + Ep
[ZT
]I Ep [Z]
=1n
Tr[II
−1VI−1]
+ 0
=1n
Tr[VI−1
],
Last Modified: September 30, 2018 14

which is the bias term, thus we get
K ' K̄ −1n
Tr[VI−1
]. (48)
In the last step of this long derivation we take the limit that our model is correct, i.e.θMLE = θ0. In this limit, the Fisher information matrix I is equal to the variance of thescore function, namely I = V. Subsequently, the term VI−1 is the k × k identity matrix Iwith trace equal to the parameters dimension k, hence Tr [I] = k. As a result, we obtainthe correct biased estimator of the KL divergence which is the AIC:
K ' K̄ −kn. (49)
The derivation requires many approximations and assumptions, and thus AIC is a verycrude criterion. Nevertheless, it is still a very useful tool based on a very clever idea andinspires new more efficient information criteria that demand fewer assumptions, such asthe corrected Akaike Information Criterion and the Bayesian Information Criterion.
References
[1] C. Bishop, Pattern Recognition and Machine Learning, 8th ed. Springer (2008).
[2] G. James, D. Witten, T. Hastie, and R. Tibshirani, An Introduction to Statistical Learning,8th ed., Springer (2017).
[3] A. Agresti, Foundations of Linear and Generalized Linear Models, Wiley (2015).
Last Modified: September 30, 2018 15
Related Documents