Master Limited P ar tner ship Pr imer Un derstanding an Emerging A sset Class SteelPath is a registered investment advisor that ma nages portolios ocused on midstream energy Master Limited Partnerships (MLPs) or a variety o institutional and individual clients. Te company ocuses on undamental analysis in this emerging asset class, combining a detailed, bottoms-up private equity philosophy with risk management programs designed to preserve capita l and mitig ate portolio volatility. SteelPath believes that this sector o the energy inrastructure space will continue to grow dramatically over the next decade and oers one o the most attractive risk-reward investment proles available to investors. SteelPath positions its portolios with a long-term investment horizon by ocusing on those companies with the strongest mana gement teams and most attractive investment opportunity sets in the midstream energy sector to provide downside protection with predictable distribution growth. McKinney Avenue Dallas, X steelpath.com Nothing in this document should be considered a solicitation to buy or an oer to sell shares o any SteelPath und. Tis report does not represent a recommendation to undertake transactions in MLPs, and is provided or inormational pur poses only, and may not be reproduced or redistributed. Tere is no representation that the inormation is accurate, complete or current, or that it reects the current opinion or all inormation known to SteelPath, its principals, or aliates. Past perormance is no gu arantee o uture results. Copyright; No Unauthorized Redistribution Tis research report was prepared by SteelPath in and is under protection o the copyright laws. Neither the whole nor any part o this materia l may be duplicated in any orm or by any means. Tis material may not be redistributed or disclosed to anyone without the prior SteelPath’s previous written consent.

Welcome message from author
This document is posted to help you gain knowledge. Please leave a comment to let me know what you think about it! Share it to your friends and learn new things together.
Transcript
8/6/2019 MLP Primer
http://slidepdf.com/reader/full/mlp-primer 1/31
Master Limited
Partnership PrimerUnderstanding an Emerging Asset ClassSteelPath is a registered investment advisor that manages port olios ocused onmidstream energy Master Limited Partnerships (MLPs) or a variety o institutionaland individual clients.
Te company ocuses on undamental analysis in this emerging asset class,combining a detailed, bottoms-up private equity philosophy with risk managementprograms designed to preserve capital and mitigate port olio volatility. SteelPathbelieves that this sector o the energy in rastructure space will continue to growdramatically over the next decade and o ers one o the most attractive risk-rewardinvestment pro les available to investors.
SteelPath positions its port olios with a long-term investment horizon by ocusingon those companies with the strongest management teams and most attractiveinvestment opportunity sets in the midstream energy sector to provide downsideprotection with predictable distribution growth.
McKinney AvenueDallas, X
steelpath.com
Nothing in this document should be considered a solicitation to buy or an o er to sell shares o any SteelPath und. Tis report does not represent arecommendation to undertake transactions in MLPs, and is provided or in ormational purposes only, and may not be reproduced or redistributed. Tereis no representation that the in ormation is accurate, complete or current, or that it re ects the current opinion or all in ormation known to SteelPath, itsprincipals, or a liates. Past per ormance is no guarantee o uture results.
Copyright; No Unauthorized Redistribution
Tis research report was prepared by SteelPath in and is under protection o the copyright laws. Neither the whole nor any part o this materia l maybe duplicated in any orm or by any means. Tis material may not be redistributed or disclosed to anyone without the prior SteelPath’s previous written
consent.
8/6/2019 MLP Primer
http://slidepdf.com/reader/full/mlp-primer 2/31
SteelPath Fund AdvisorsMaster Limited Partnership Primer
able o ContentsExecut ive Summary.................................................................................................................................................................................................................................
Why own Master Limited Partne rships?..............................................................................................................................................................................................Tematic Investment in US Energy In ra struc ture Growth .............................................................................................................................................Hard Asset Play Provides angible Value in a Potentially In ationary Environment...................................................................................................Better Business Models........................................................................................................................................................................................................MLPs Exhibit Insigni cant Correl ation w ith the Broader Equit ies Market...................................................................................................................
An Emerging Asset Class........................................................................................................................................................................................................................Substantial Investment Required to Meet US In rastructure Demands........................................................................................................................Te Future o MLPs is Here oday.......................................................................................................................................................................................Structural Valuation Issues Create Substantial Long- erm Upside...............................................................................................................................Flying Under the Radar – L imited Institutional Ownership o MLPs...........................................................................................................................Te Emergence o Pure-Play Public ly raded GPs............................................................................................................................................................
Te Aler ian MLP Index Series ..............................................................................................................................................................................................................
What is a Midstream Asset?.................................................................................................................................................................................................................Crude Oil/Re ned Products ranspor tation....................................................................................................................................................................Marine ranspor tation.......................................................................................................................................................................................................Crude Oil/Re ned Products ermina ls............................................................................................................................................................................Midstream Natura l Gas Indust ry......................................................................................................................................................................................
ranspor tation....................................................................................................................................................................................................................Gathering.............................................................................................................................................................................................................................Dehydration.........................................................................................................................................................................................................................
reating................................................................................................................................................................................................................................Processing............................................................................................................................................................................................................................Fractionation.......................................................................................................................................................................................................................Storage..................................................................................................................................................................................................................................LNG ranspor tation............................................................................................................................................................................................................
Valuing Midstream Energy Businesses...............................................................................................................................................................................................Popular Misconcept ion: Relat ive Yield.............................................................................................................................................................................Stable, Growing Distributions – Te De ning Characteristic o the MLP Model........................................................................................................
Distr ibution Discount Model...............................................................................................................................................................................................................Investment/Acquisition Optiona lity.................................................................................................................................................................................
Other Relat ive Price Metrics................................................................................................................................................................................................................
Te Re-Bir th o the E&P MLP...............................................................................................................................................................................................................
Fundamental Risks ................................................................................................................................................................................................................................Regu latory Risk...................................................................................................................................................................................................................Demand-Side Troughput Risks........................................................................................................................................................................................Supply Asset -Speci c Risks................................................................................................................................................................................................Macro Supply Disruptions..................................................................................................................................................................................................Environmental Accidents...................................................................................................................................................................................................
errorism.............................................................................................................................................................................................................................ax Law Changes........................................................................................................................................... .....................................................................
Financial Risks.......................................................................................................................................................................................................................................Interest Rates.......................................................................................................................................................................................................................Equity Volatilit y and Correl ation......................................................................................................................................................................................Equity Crises........................................................................................................................................................................................................................
Appendix................................................................................................................................................................................................................................................A History o the Creation o MLPs.....................................................................................................................................................................................Genera l/Limited Partner Struc ture..................................................................................................................................................................................Income ax reatment........................................................................................................................................................................................................
Disclaimers.............................................................................................................................................................................................................................................
3
45677
899
101011
12
13131415151616171717171818
202020212122 22
2323242425252525
25262627
28282930
31
8/6/2019 MLP Primer
http://slidepdf.com/reader/full/mlp-primer 3/31
Executive SummaryMaster Limited Partnerships, or MLPs, are engaged in thetransportation, storage, processing, re ning, marketing,exploration, production, and mining o minerals or naturalresources. By con ning their operations to these speci c ac-tivities, their interests, or units, are able to trade on publicsecurities exchanges exactly like the shares o a corpora-tion, without entity level taxation. O the partnershipsthat SteelPath ollows closely, two-thirds trade on the New York Stock Exchange with nearly all o those remainingon the NASDAQ. MLPs must make public lings with theSecurities and Exchange Commission and must le -Ks,
-Qs, and notices o material changes like any publiclytraded corporation. MLPs are subject to the record keepingand disclosure requirements o the Sarbanes-Oxley Act.
Since , the Alerian MLP Index (NYSE: AMZ) has gener-ated compound annual total returns o . %, under theradar o the pro essional investment community. Tesestrong returns were generated through a combination o current yield and consistent distribution growth driven bythe uniquely attractive business models a orded by thesecompanies’ regional ranchise monopolies.
Tese partnerships generate predictable and growing cashows (and there ore distributions) predicated on the ol-
lowing:• Long-lived, high-value physical assets• Producer Price Index (PPI) revenue indexing, which
provides predictable growth and a built-in in ationhedge or port olios
• Substantial barriers to entry, which generate attractiveorganic investment opportunities
• Strong operating leverage through hard assets thatmagni y inelastic demand
Te energy in rastructure MLP sector, which includes com-panies that own and operate long-lived, high-value physi-
cal assets that engage in the transportation and storage o natural resources such as re ned petroleum products andnatural gas, today represents $ billion o public marketcapitalization out o a total $ billion in MLP marketcapitalization. MLPs have traditionally been owned byUnited States retail investors (institutional MLP owner-ship is less than %). Te market capitalization o the MLPsector has grown exponentially over the last decade, drivenby asset rationalization into MLPs, which have the operat-ing expertise and the organizational structure to optimize
their use, and by demand or new energy in rastructure. In, the sector market capitalization was a mere $ bil-
lion; this gure doubled by to $ billion and doubledyet again by to $ billion. SteelPath expects MLPmarket capitalization to continue to grow rom the current$ billion level as the demand or new energy in rastruc-ture continues to drive investment.
Tematically, an investment in an energy in rastructureMLP is an investment in the build-out o US energy in-
rastructure over the next decade. Unlike US or Canadianroyalty trusts, which own depleting resource pools, theseare toll-road business models on long-li e assets. Modernpipelines bene t rom rust coatings and cathodic protec-tion that will allow these pipelines to operate withoutmajor maintenance or years or more. In act, there arepipelines that were put in the ground prior to World War IIwhich had no rust coating o any kind that are still in usetoday. Tere is much speculation today about the uturetrajectory o oil prices, the appropriate levels o storage,and the outlook or the US re ning industry. However, onething that most “experts” agree on, regardless o whetherthey are predicting $ , $ , or $ per barrel o oil, ispredictable % annualized energy demand growth in the USover the next two decades, in spite o the current economicsituation. Demographic shi ts and population growthtrends increase the demand or energy goods. As a result,long-haul pipeline MLPs are agnostic to these commodityprice orecasts, and bene t rom simple throughput gainsin a xed-cost pipeline system.
Industry estimates indicate that the US needs $ billiono new natural gas in rastructure over the next decade anda nearly equivalent amount in crude oil and re ned petro-leum products processing, storage, and transportation in-
rastructure. Additionally, there are more than $ billiono US midstream assets currently owned in both private
and public corporate structures that are being rationalizedinto the asset class through acquisition and the creation o new MLPs. Te MLP structure is also ripe or billions morein new technology in rastructure once these assets are builtand generating cash, including lique ed natural gas (LNG)terminals, gas-to-liquids technology, and coal gasi cation.SteelPath believes that this emerging asset class representsan attractive value proposition given the low-risk businesspro les o most MLPs.
SteelPath Fund AdvisorsMaster Limited Partnership Primer
8/6/2019 MLP Primer
http://slidepdf.com/reader/full/mlp-primer 4/31
MLPs are attractive, not because o their tax treatment
or structure, but because o the type o assets that havemigrated into the asset class over the last decade. Energyin rastructure is an attractive business model – regionalmonopolies with transparent ederal regulation that trans-port commodities with inelastic demand. An investmentmanager cannot take this type o pure-play exposure intohis or her port olio through any other orm o public equi-ties. I o ce buildings are to be considered a stable invest-ment in real value, the pipelines that transport the naturalgas to run the air-conditioning in the summer and heat theproperty in the winter ought to have that same permanentvalue.
Many will note, however, that the asset class is not whatit used to be, and is moving away rom the type o assetswe have described above. Tis is partly true. With a surgein initial public o erings (more than in and combined), many new types o assets have entered thestructure, and many o them do not have the same mo-nopoly ootprints or supply diversity as their predecessors.Tere has been a very strong trend closer to the wellhead ascommodity-price-sensitive businesses dominated the IPOspace over the and period. Earnings volatility isnot synonymous with lower quality but nancial leverage,distribution levels, and hedging strategies must be appro-priately conservative given such volatility. Investors mustalso be cognizant o such risks in deciding the appropriateequity price. Tat being said, SteelPath has always beenand will remain ocused, as a rm, on traditional long-haulenergy in rastructure assets.
Te core thesis that SteelPath was ounded on in and maintains today is that MLPs are on a trajectory verysimilar to that experienced by the Real Estate Investment
rusts (REI s) in the late s. On average, in a normal-ized market environment, the rm expects - initialpublic o erings each year or the oreseeable uture. High-returning organic investment projects and acquisitions
will continue to create tremendous value and demand oradditional capital in ows. Te Jobs Creation Act con-tained a codicil that largely ailed in its attempt to broadenmutual und investment in MLPs. Although private “hedge”
und participation has increased, reaching a short-termpeak in , we do not expect to see a wholesale increasein institutional (mutual und, tax-exempt) participation inthe asset class as structural barriers to entry that e ective-ly preclude widespread mutual und ownership are unlikelyto be removed without a legislative rewrite. Until this eventoccurs, the space will likely remain ine cient with a high
dispersion o returns. However, liquidity and market capi-
talizations have reached the point where MLPs could com-prise a meaning ul portion o a large institutions port olio. As the sector continues to provide superior distributionyield and growth versus other yielding equities, moderategrowth in institutional participation will likely continue.Legislative progress and meaning ul mutual und and insti-tutional adaptation will likely take some time. When such aradical shi t in institutional participation occurs we expectthe sector to experience a substantial revaluation. However,in the meantime, we believe the sector simply o ers a veryattractive risk/return pro le.
In this uncertain environment, the undamentals are genu-inely in place or MLPs to generate attractive risk-adjustedreturns, without a broader market recovery. Combining anapproximate % group-average yield with consistent dis-tribution growth, we continue to expect low-to-mid-teensannualized total returns or the sector over the next veyears.
Why own MasterLimited Partnerships?Over the past years, midstream MLPs have outper-
ormed the S&P with a cumulative gain o over %,equal to a compound annual return o . %, versus %
or the broader market, equal to a compound annual returno . %. Many investors look at the historical returns wist-
ully believing they have missed out and that it must be toolate. Or, they look at the decline in MLP prices andwonder i the story really remains the same. Te unda-mental and structural underpinnings that led to decades o outper ormance remain solidly in place. Valuation remainsstructurally inexpensive relative to other yield-orientedequity classes. Demand or investment in new energy in-
rastructure has never been greater. Te structural encum-brances that restrict wholesale institutional investmentand create exploitable ine ciencies in the market are stillin place. Tis asset class is still in its in ancy and the oppor-tunity or superior returns over the next decade still exists.
Tere has only been one period in which MLP per ormancesigni cantly lagged the S&P . Tis occurred duringthe tech boom o - , when investors became excitedabout growth and were willing to pay extraordinary mul-tiples or high-growth companies.
SteelPath Fund AdvisorsMaster Limited Partnership Primer
8/6/2019 MLP Primer
http://slidepdf.com/reader/full/mlp-primer 5/31
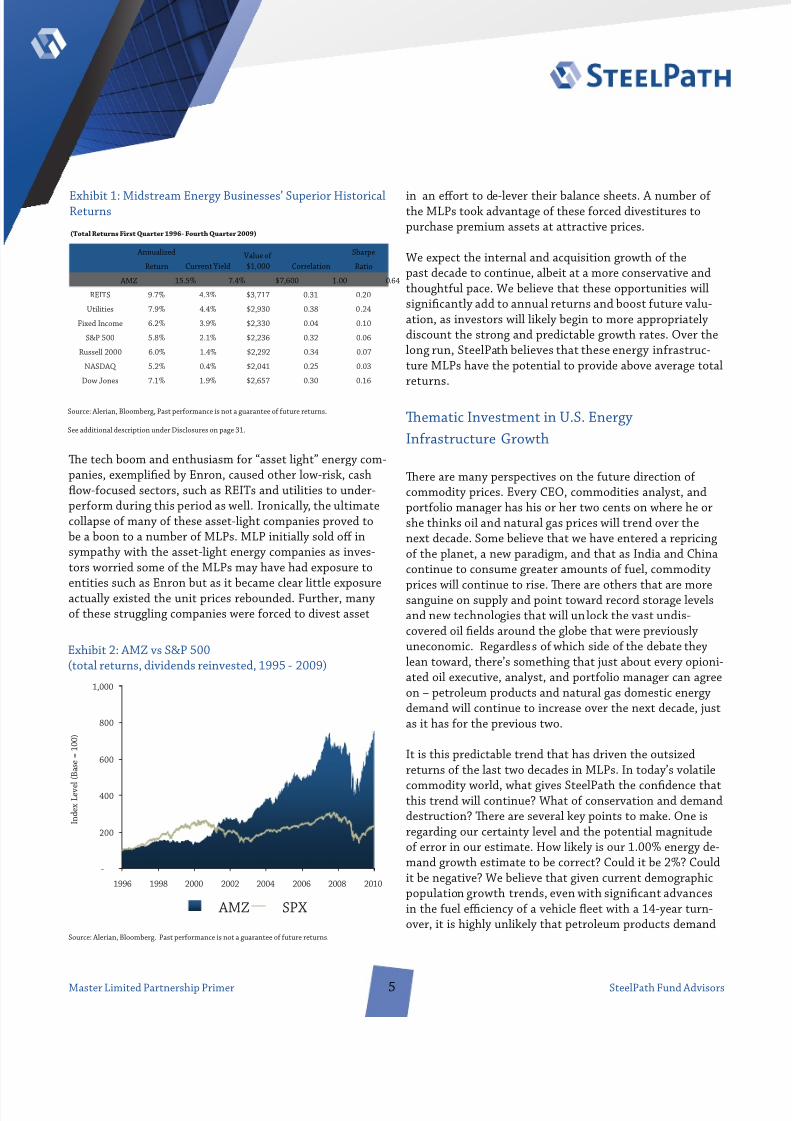
Te tech boom and enthusiasm or “asset light” energy com-panies, exempli ed by Enron, caused other low-risk, cash
ow- ocused sectors, such as REI s and utilities to under-per orm during this period as well. Ironically, the ultimatecollapse o many o these asset-light companies proved tobe a boon to a number o MLPs. MLP initially sold o insympathy with the asset-light energy companies as inves-tors worried some o the MLPs may have had exposure to
entities such as Enron but as it became clear little exposureactually existed the unit prices rebounded. Further, manyo these struggling companies were orced to divest asset
in an e ort to de-lever their balance sheets. A number o the MLPs took advantage o these orced divestitures topurchase premium assets at attractive prices.
We expect the internal and acquisition growth o thepast decade to continue, albeit at a more conservative andthought ul pace. We believe that these opportunities willsigni cantly add to annual returns and boost uture valu-ation, as investors will likely begin to more appropriatelydiscount the strong and predictable growth rates. Over thelong run, SteelPath believes that these energy in rastruc-ture MLPs have the potential to provide above average totalreturns.
Tematic Investment in U.S. EnergyIn rastructure Growth
Tere are many perspectives on the uture direction o commodity prices. Every CEO, commodities analyst, andport olio manager has his or her two cents on where he orshe thinks oil and natural gas prices will trend over thenext decade. Some believe that we have entered a repricingo the planet, a new paradigm, and that as India and Chinacontinue to consume greater amounts o uel, commodity
prices will continue to rise. Tere are others that are moresanguine on supply and point toward record storage levelsand new technologies that will unlock the vast undis-covered oil elds around the globe that were previouslyuneconomic. Regardless o which side o the debate theylean toward, there’s something that just about every opioni-ated oil executive, analyst, and port olio manager can agreeon – petroleum products and natural gas domestic energydemand will continue to increase over the next decade, justas it has or the previous two.
It is this predictable trend that has driven the outsizedreturns o the last two decades in MLPs. In today’s volatile
commodity world, what gives SteelPath the con dence thatthis trend will continue? What o conservation and demanddestruction? Tere are several key points to make. One isregarding our certainty level and the potential magnitudeo error in our estimate. How likely is our . % energy de-mand growth estimate to be correct? Could it be %? Couldit be negative? We believe that given current demographicpopulation growth trends, even with signi cant advancesin the uel e ciency o a vehicle eet with a -year turn-over, it is highly unlikely that petroleum products demand
SteelPath Fund AdvisorsMaster Limited Partnership Primer
-
200
400
600
800
1,000
1996 1998 2000 2002 2004 2006 2008 2010
I n d
e x
L e v e
l ( B
a s e =
1 0 0
)
AMZ SPX
Exhibit : AMZ vs S&P (total returns, dividends reinvested, - )
Source: Alerian, Bloomberg. Past per ormance is not a guarantee o uture returns.
Exhibit : Midstream Energy Businesses’ Superior HistoricalReturns
Annualized Sharpe
Return Ratio
AMZ 15.5% 7.4% $7,600 1.00 0.64
REITS 9.7% 4.3% $3,717 0.31 0.20
Utilities 7.9% 4.4% $2,930 0.38 0.24
Fixed Income 6.2% 3.9% $2,330 0.04 0.10
S&P 500 5.8% 2.1% $2,236 0.32 0.06
Russell 2000 6.0% 1.4% $2,292 0.34 0.07
NASDAQ 5.2% 0.4% $2,041 0.25 0.03
Dow Jones 7.1% 1.9% $2,657 0.30 0.16
(Total Returns First Quarter 1996- Fourth Quarter 2009)
Current Yield Value of $1,000 Correlation
Source: Alerian, Bloomberg, Past per ormance is not a guarantee o uture returns.
See additional description under Disclosures on page .
8/6/2019 MLP Primer
http://slidepdf.com/reader/full/mlp-primer 6/31
would not remain at least at with today, ve years, ten
years, or twenty years hence. Negative growth is certainlypossible or a period, perhaps or a ew quarters or years,but over the longer term, as the US population continuesto grow, spreads south and west, and the suburban sprawlcontinues to increase the number o drivers traveling longerdistances to reach their places o work, the rm believesthere is a very strong oor under today’s demand levels.We believe that as population growth and immigrationcontinue, overall demand will continue to grow, even i percapita growth is more muted. It is this creeping growth andthe shi ting o North America’s traditional supply sourcesthat necessitates new investment in energy in rastructure.Investors have not missed the boat on MLP per ormance
because the undamental macro actors that have driventhe asset class remain unchanged.
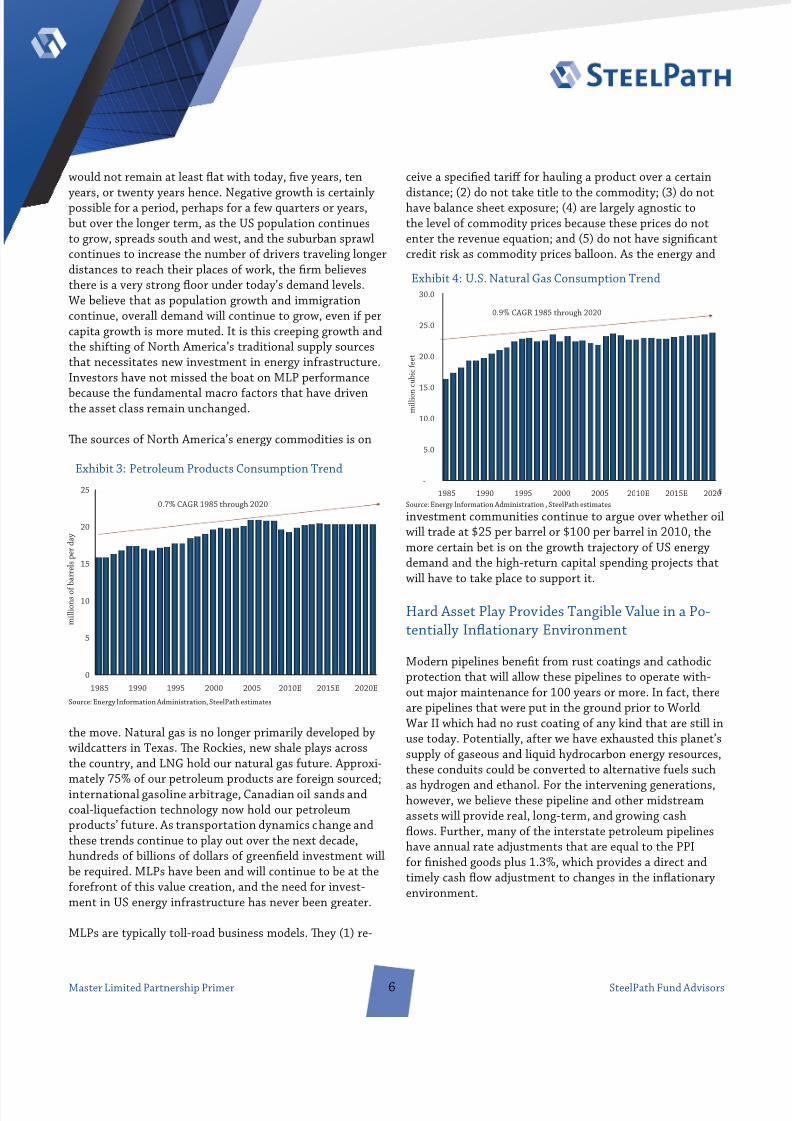
Te sources o North America’s energy commodities is on
the move. Natural gas is no longer primarily developed bywildcatters in exas. Te Rockies, new shale plays acrossthe country, and LNG hold our natural gas uture. Approxi-mately % o our petroleum products are oreign sourced;international gasoline arbitrage, Canadian oil sands andcoal-lique action technology now hold our petroleumproducts’ uture. As transportation dynamics change andthese trends continue to play out over the next decade,hundreds o billions o dollars o green eld investment willbe required. MLPs have been and will continue to be at the
ore ront o this value creation, and the need or invest-ment in US energy in rastructure has never been greater.
MLPs are typically toll-road business models. Tey ( ) re-
ceive a speci ed tari or hauling a product over a certain
distance; ( ) do not take title to the commodity; ( ) do nothave balance sheet exposure; ( ) are largely agnostic tothe level o commodity prices because these prices do notenter the revenue equation; and ( ) do not have signi cantcredit risk as commodity prices balloon. As the energy and
investment communities continue to argue over whether oilwill trade at $ per barrel or $ per barrel in , themore certain bet is on the growth trajectory o US energydemand and the high-return capital spending projects thatwill have to take place to support it.
Hard Asset Play Provides angible Value in a Po-tentially In ationary Environment
Modern pipelines bene t rom rust coatings and cathodicprotection that will allow these pipelines to operate with-out major maintenance or years or more. In act, thereare pipelines that were put in the ground prior to WorldWar II which had no rust coating o any kind that are still inuse today. Potentially, a ter we have exhausted this planet’ssupply o gaseous and liquid hydrocarbon energy resources,these conduits could be converted to alternative uels such
as hydrogen and ethanol. For the intervening generations,however, we believe these pipeline and other midstreamassets will provide real, long-term, and growing cash
ows. Further, many o the interstate petroleum pipelineshave annual rate adjustments that are equal to the PPI
or nished goods plus . %, which provides a direct andtimely cash ow adjustment to changes in the in ationaryenvironment.
SteelPath Fund AdvisorsMaster Limited Partnership Primer
0
5
10
15
20
25
1985 1990 1995 2000 2005 2010E 2015E 2020E
m i l l i o n s o f
b a r r e l s p e r
d a y
0.7% CAGR 1985 through 2020
Exhibit : Petroleum Products Consumption rend
Source: Energy In ormation Administration, SteelPath estimates
-
5.0
10.0
15.0
20.0
25.0
30.0
1985 1990 1995 2000 2005 2010E 2015E 2020
m i l l i o n
c u b i c
f e e t
0.9% CAGR 1985 through 2020
Exhibit : U.S. Natural Gas Consumption rend
Source: Energy In ormation Administration , SteelPath estimates
8/6/2019 MLP Primer
http://slidepdf.com/reader/full/mlp-primer 7/31
Better Business Models
MLPs generated . % annualized returns over the pastteen years, not because o any one-time event or change
in relative valuation, but by consistently growing theircash distributions over that period by - % per annum.Teir ability to continue to do this rests with their uniqueand superior business models. Midstream assets are typi-cally entrenched regional ranchises that in turn supportconsistent growth. Tese dominant and, in some instances,monopoly ranchises possess innate competitive advan-tages aided by regulation. Most MLP pipeline assets aregoverned by a ederal agency that protects their rights o way and provides or attractive rates o return to investors.Initial tari s are generally predicated on a cost basis andthen indexed to a measure o in ation, providing a built-inin ation hedge. Volumes have historically been and shouldcontinue to be highly predictable over the long run as theyare a unction o population growth and demographictrends.
MLPs have historically o ered more predictable earningsthan the broader market, in act, the S&P earningsvolatility is more than three times that o the MLPs that wecover. MLPs own assets with use ul lives o - years orlonger that provide consistent cash ows without the need
or substantial maintenance capital expenditures. Con-sistency is aided by airly inelastic demand as residentialand commercial consumers heat and cool their homes andbusinesses, and commuters drive to work even in the worsto times. Industrial customers can only take advantage o
uel-switching alternatives and capabilities to a certain ex-tent, and product throughput has risen over the past decadedespite the allout rom September th and the ensuing
, and indeed, the current recession. High barriers toentry exist because initial capital costs are prohibitive andthe ability to create new rights o way is very limited.
In summary, we expect midstream MLPs to generate supe-
rior risk-adjusted returns o to % or years to come,driven by the ollowing actors embedded in their businessmodel that have generated their returns in the past:
• op-line growth driven by energy demand growth andPPI indexed transportation tari s
• Mid-single digit cash ow growth as these xed-costbusiness models allow much o this predictable revenuegrowth to reach the bottom line
• Attractive organic investment opportunities resultingrom their ranchise-protected ootprint, generating
additional and o ten near-term accretion to the distri-
bution• Opportunities or additional asset acquisitions driven
by the macro trends described in detail below, creatingadditional immediate accretion to the distribution.
Importantly, these are the same actors that have allowedthese businesses to per orm well in the past and nothinghas changed in the macro environment that would suggestthat these same actors will not drive returns in the uture.
MLPs Exhibit Insigni cant Correlation with theBroader Equities Market
Te majority o equity asset classes and sectors tend to bestrongly positively correlated with the broader market.MLP returns have exhibited statistically insigni cantcorrelation with the market over nearly two decades. Tismakes undamental sense given that the demand or pe-troleum products and natural gas is highly inelastic in thenear term and is largely una ected by the vicissitudes o the economy.
For example, during , one o the sharpest recessions inUS history, petroleum products consumption remained at.In the current recession, as petroleum products prices have
stabilized, we have seen a similar inelasticity o demand.Swings in economic indicators and interest rates, which canroil the broader markets because they can both signi cantlyand rapidly a ect corporate America’s cash ows, do notmaterially impact the demographic trends underpinningthe long-term cash ow trajectory o MLPs.
Without physical product shortages, such as those experi-enced in the s, there will be very little consumptionimpact even over a period o years during times o highlyelevated prices. Tere ore, regardless o the direction o per ormance o the broader equity markets and the cyclicalstate o the economy, MLP cash ows should remain consis-
tent and ultimately provide or strong equity per ormancethat is relatively independent o these broader indicators.By adding an MLP allocation to a port olio, risk is signi -cantly reduced even as MLPs increase port olio returns.
SteelPath Fund AdvisorsMaster Limited Partnership Primer
8/6/2019 MLP Primer
http://slidepdf.com/reader/full/mlp-primer 8/31
An Emerging Asset Class
MLPs in their current orm were created by Congress in. Structured as partnerships, all income, losses, gains,
and deductions are passed on to limited partners andare only taxed at that level (i.e. no entity-level taxation),meaning that investors in MLPs avoid the double taxationo investing in corporations. Congress created this struc-ture to encourage investment in US natural resources andenergy in rastructure. Since then, as the MLP structure hasgained more widespread adoption, there has been a gradualyet quickly accelerating transition o MLP-quali ying assets
rom corporations to MLPs given the e ective tax arbitrage
o holding these assets in the partnership structure andthe value that highly specialized management teams canprovide.
Energy in rastructure assets held by oil majors, re ners,and utilities are o ten underutilized because they are notrun or pro t. In some cases, direct competitors would pre-
er not to risk divulging competitive in ormation. Exxon’sinvestors measure the company’s per ormance on explor-atory success, production growth, reserve replacement,and other ratios that do not reward the company’s stockprice or maintaining pipeline assets. Te potential pipelineearnings o such companies are dwar ed by their explora-
tion and production (E&P) cash ows. Consequently, largerenergy companies continue to ignore their midstreamassets and many remain undermanaged and underutilized.MLPs that hold these assets have the incentive, expertiseand reedom to maximize use and pro tability.
Corporations with MLP-quali y ing assets will o ten createMLPs in which they retain general partner (GP) ownershipinterests thus allowing these assets to be dropped downinto a more tax-e cient structure where stable cash owswill be ar more highly valued outside o the volatility o theparent company’s earnings stream. It makes little sense orhighly cyclical, low-P/E energy corporations to hold thesehigh-multiple assets on their balance sheets. E&P com-panies in particular are motivated to sell these businessesgiven the premium that is placed by their investors on mak-ing commodity price-sensitive investments that involveboth greater risk and greater potential reward.
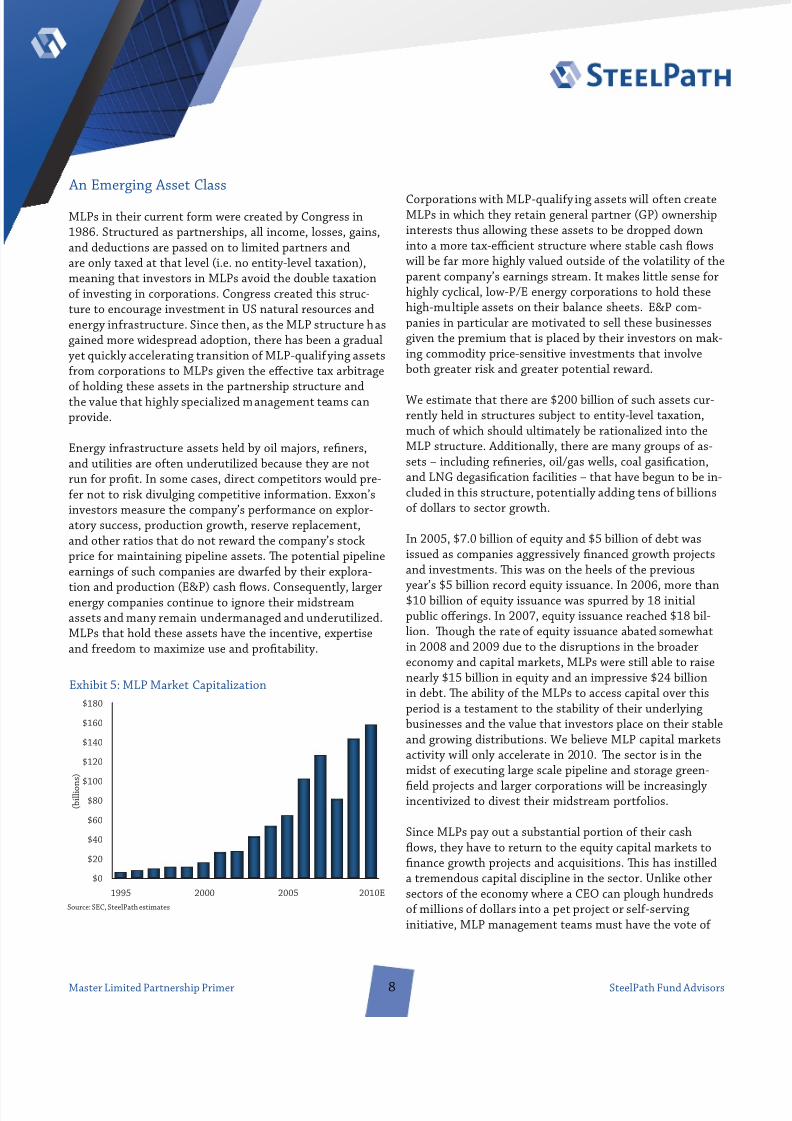
We estimate that there are $ billion o such assets cur-rently held in structures subject to entity-level taxation,much o which should ultimately be rationalized into theMLP structure. Additionally, there are many groups o as-sets – including re neries, oil/gas wells, coal gasi cation,and LNG degasi cation acilities – that have begun to be in-cluded in this structure, potentially adding tens o billionso dollars to sector growth.
In , $ . billion o equity and $ billion o debt wasissued as companies aggressively nanced growth projectsand investments. Tis was on the heels o the previous
year’s $ billion record equity issuance. In , more than$ billion o equity issuance was spurred by initialpublic o erings. In , equity issuance reached $ bil-lion. Tough the rate o equity issuance abated somewhatin and due to the disruptions in the broadereconomy and capital markets, MLPs were still able to raisenearly $ billion in equity and an impressive $ billionin debt. Te ability o the MLPs to access capital over thisperiod is a testament to the stability o their underlyingbusinesses and the value that investors place on their stableand growing distributions. We believe MLP capital marketsactivity will only accelerate in . Te sector is in themidst o executing large scale pipeline and storage green-
eld projects and larger corporations will be increasinglyincentivized to divest their midstream port olios.
Since MLPs pay out a substantial portion o their cashows, they have to return to the equity capital markets tonance growth projects and acquisitions. Tis has instilled
a tremendous capital discipline in the sector. Unlike othersectors o the economy where a CEO can plough hundredso millions o dollars into a pet project or sel -servinginitiative, MLP management teams must have the vote o
SteelPath Fund AdvisorsMaster Limited Partnership Primer
Exhibit : MLP Market Capitalization
Source: SEC, SteelPath estimates
$0
$20
$40
$60
$80
$100
$120
$140
$160
$180
1995 2000 2005 2010E
( b i l l i o n
s )
8/6/2019 MLP Primer
http://slidepdf.com/reader/full/mlp-primer 9/31
con dence rom the public markets be ore they proceed.Further, due to the sectors ocus on distributions and cash
ows per unit, projects or acquisitions that are cash owdilutive or only minimally accretive are quickly exposed.Tere is no incentive or management teams to pursuequestionable transactions to simply boost GAAP earnings.
We believe that this is the reason cash returns on cashinvested in the MLP sector have dwar ed those o its energypeers including E&P, re ning, gas utilities, and electricutilities over the past two decades. Te typical investmentpursued by a midstream MLP will provide a - % IRR,carry relatively low risk and will provide substantial cash
ow accretion to unitholders.
Substantial Investment Required to Meet U.S.In rastructure Demands
We expect more than $ billion in natural gas in rastruc-ture investment over the next decade as production romnewer unconventional plays outpaces traditional sourceso US supply. We expect substantial investment in crudeand petroleum products in rastructure as demand contin-ues its relentless and steady pace and to accommodate oilsands production. Further in rastructure will be requiredas coal-lique action and gas-to-liquids technologies cometo widespread commercial ruition. Te opportunity set orhigh-returning, stable cash- ow generating energy in ra-structure investments continues to grow.
In an October letter to the Federal Energy RegulatoryCommission (FERC), the Department o ransportation(DO ), which oversees not only the traditional networko highways and waterways, but also pipelines, expressedconcern about the capacity o underlying petroleum prod-ucts pipelines to meet the growing demands placed on it.Te letter urged the FERC to seriously consider the neces-sary nancial commitments or operators to maintain andexpand pipeline system capacity. It also suggested thatthe FERC convene a workshop or technical con erence inorder to explore regulatory mechanisms that could exhortthis critical investment. MLPs have become an increasingportion o such expansion projects and we expect organicgrowth capital investment to continue to increase over thenext decade.
Te Future o MLPs
We have been speaking to this theme since the spring o ; the types o midstream logistics assets in the MLP
asset class is only going to continue to expand. We believethat in addition to the $ billion-plus stable o mid-stream assets currently housed in public corporate struc-tures and $ billion o “traditional” midstream newbuildnecessary to expand and maintain the United States’ en-
ergy in rastructure over the next decade, alternative energysources such as LNG, coal gasi cation, and gas-to-liquidstechnology, are very real and present hundreds o billionso dollars more in xed cost, hard asset, long-term contractenergy logistics assets
In act, Cheniere Energy (NYSE: LNG) completed an initialpublic o ering o subsidiary Cheniere Energy Partners(NYSE: CQP) on March , , orming an MLP that willown the corporate parent’s LNG regasi cation terminal.In , Calumet Specialty Products Partners (NASDAQ:CLM ), a re ner o uels and specialty products completedits initial public o ering. Also in , Exterran Partners
(NASDAQ: EXLP), an owner and operator o natural gascompression assets, completed its initial public o ering.Each o these o erings introduced new business types tothe MLP space and we expect to continue to see such newentrants. In addition, the legislation de ning allowedactivities or the structure was expanded in to includeindustrial sourced carbon dioxide as a natural resource. Also in , the transportation and storage o ethanol,biodiesel, and other alternative uels was added as an allow-able activity.
SteelPath Fund AdvisorsMaster Limited Partnership Primer
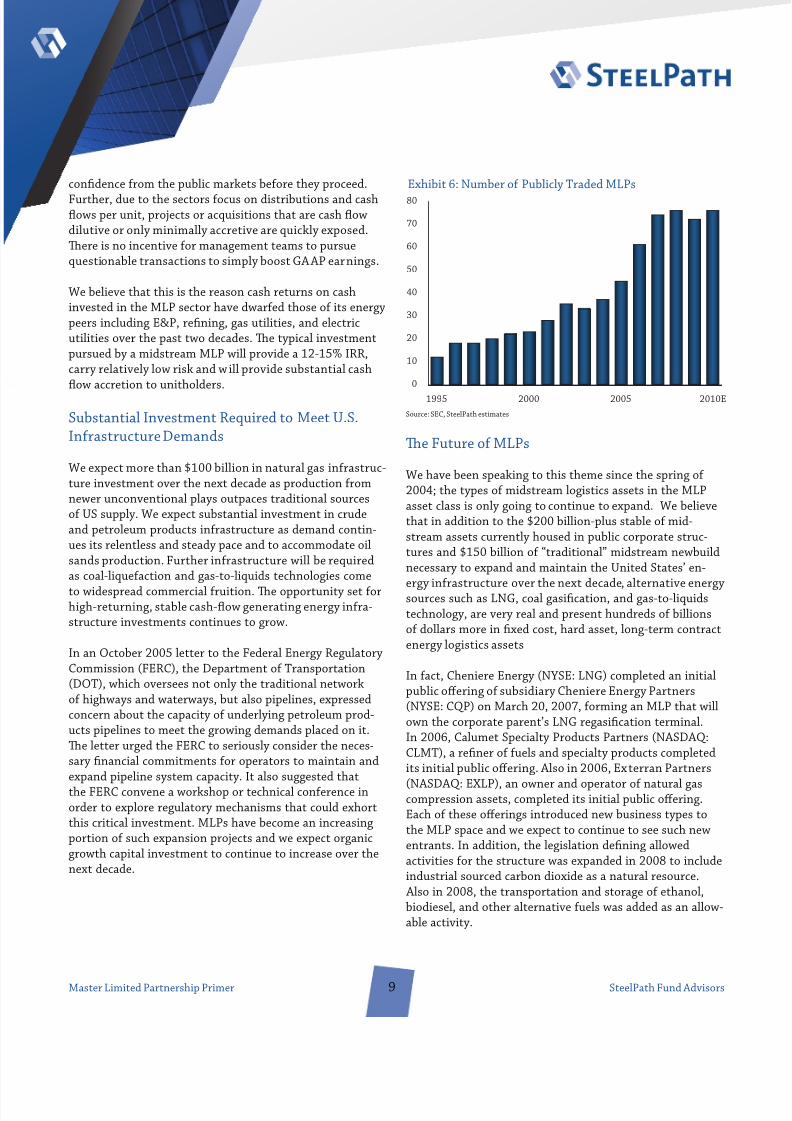
Exhibit : Number o Publicly raded MLPs
Source: SEC, SteelPath estimates
0
10
20
30
40
50
60
70
80
1995 2000 2005 2010E

8/6/2019 MLP Primer
http://slidepdf.com/reader/full/mlp-primer 10/31
Structural Valuation Issues Create SubstantialLong- erm Upside
We believe the lack o institutional participation in the as-set class has resulted in a structural under pricing o MLPsrelative to other asset classes. Institutional participationis limited due to some signi cant barriers to entry, includ-ing restrictions on mutual und ownership and UnrelatedBusiness axable Income (UB I) generation or tax-exemptinstitutions. UB I creates Unrelated Business Income ax(UBI ). Under the UBI rules, tax-exempt institutions andretirement accounts must pay tax on income rom a busi-
ness that is not related to their exempt purpose. Becauseo the pass-through nature o an MLP, or any partnership,unit holders are treated by the tax code as i they are di-rectly earning the MLP’s income. Tere ore, the tax is owedon the retirement account’s share o the MLP’s taxablebusiness income as reported on the K- . Tough there is adeduction that covers the rst $ , o unrelated businessincome rom all sources; a ter that, the retirement accountwill owe tax.
Te current growth trajectory o MLPs appears to stronglyresemble that o REI s during the s. Similar to MLPs,REI s were created as a tax-advantaged structure to en-
courage investment in that particular sector. We stronglybelieve there is a similar parallel between the emergence o REI s as a distinct asset class and the growth that we haveseen – and expect to continue to see – in MLPs. In ,there were approximately equity REI s with a combinedmarket capitalization o $ billion. oday, there are ap-proximately equity REI s representing $ billionin market capitalization (excluding hybrid and mortgageREI s). MLPs, while still in the early stages o development,have started to emerge.
During the rst years o their existence a ter Congresscreated the structure in , REI s traded at an average
basis-point premium to the -year reasury. Follow-ing the REI IPO boom o the late s and early sand the migration o institutional real estate allocationdollars rom the private to public markets, REI s havetraded on average at par with the -year reasury as inves-tors have been willing to trade o the business risk or thein ationary growth component o REI rents.
Since the creation o the modern MLP structure in ,MLPs have traded at an average basis point spread to
the -year reasury. Given the substantially similar asset
risk pro les o REI S and MLPs (we would argue MLPs havea substantially lower business risk pro le given their lowercash ow volatility, high degree o nancial transparencygiven real time ederal reporting requirements, and a con-structive ederal regulatory scheme), there is no compellingreason or this spread to exist. We believe the disparity hasbeen a unction o the restrictions that have been placed oninstitutional ownership o MLPs, and that as more sophis-ticated investors enter the space, this disparity will disap-pear. In the mean time, we believe this mispricing creates avery attractive relative risk/reward value proposition.
Flying Under the Radar – Limited InstitutionalOwnership o MLPs
Given the attractive historical per ormance track recordin the MLP sector, many investors wonder: How is it thatthere is so little institutional participation? What am Imissing? Isn’t this too good to be true i it hasn’t caught on?
o begin with, hindsight is always / . “Well o courseREI s make sense!” (Not a phrase that was said very o tenin the mid- s when there were publicly traded ve-hicles with an unimpressive $ billion o market capital-ization.) Now considered a staple o every institutional or
individual investor’s well-diversi ed port olio, REI s werenot on the institutional radar screen until the early s.REI s were created in , but it took some time be orethey were accepted.
In this case, however, there are very particular structuralreasons why MLPs have not become more popular with theinstitutional investor set. MLP distributions and income al-locations have historically been considered non-quali yingsources o income, which impedes regulated investmentcompanies (RICs) such as mutual unds rom investing. I Fidelity and Putnam cannot invest, then Goldman Sachs orMorgan Stanley can not earn a commission and, there ore,
there is no incentive or one o their salespeople to educateor pitch the investor on the asset class. In other words, WallStreet has never championed MLPs as an attractive invest-ment to their institutional customers because many o these customers were restricted rom purchasing. For thissame reason, the universe o expert analysts and port oliomanagers who understand the many nuances o the MLPspace is also limited. Tis product has always been solddirectly to retail through the private wealth managemento ces o the bulge-bracket investment banking rms.
SteelPath Fund AdvisorsMaster Limited Partnership Primer

8/6/2019 MLP Primer
http://slidepdf.com/reader/full/mlp-primer 11/31
Pursuant to Section o the American Jobs Creation Acto , MLP distributions and income allocations are nowconsidered quali ying sources as it relates to the special taxstatus o RICs. However, at least % o a RIC’s assets mustbe invested in investment vehicles that are not MLPs, and aRIC may not own more than % o any single MLP. Mutual
unds, and not their investors, will continue to receive
K- s, and will be required to le tax returns in the states inwhich the MLP operates.
As well meaning in spirit as the Jobs Act was, there arestill substantial practical hurdles to ull-scale mutual undinvestment in MLPs. First, the timing discrepancy betweenthe calculation o the RICs distributions and their s(typically November through January) and the issuance o K- s by MLPs (March) creates an administrative burden orRICs, which are orced to estimate their investors’ share o MLP income, losses, credits, and deductions without su -
cient in ormation. A mistake could result in substantialexcise taxes to the mutual und as well as a misstatement
o the s. When the K- s are ultimately issued, the undcould then be orced to adjust its s to account or thechanges. Because a restatement is such a rare event
or a mutual und, they are wary o taking on such a risk. Another administrative burden relates to state ling re-quirements. With some MLPs operating in multiple states,the mutual und itsel may consequently have to le taxreturns in each o those states. Furthermore, not all states(e.g. Massachusetts) recognize ederal statutes concern-ing quali y ing income, urther complicating the problem.
Retirement accounts and other tax-exempt investmentvehicles are also restricted in their ability to invest in thesector because MLPs generate UB I. I UB I exceeds $ ,
or a tax-exempt entity, investors may be liable to pay taxeson that income.
Another concern in the institutional investing communityis that the sector does not possess su cient liquidity orinvestment. However, this continues to improve. Te me-dian market capitalization in the space is now greater than$ . billion. Nonetheless, compared to gas utilities, whichattract substantial institutional attention, MLPs have vir-tually zero mutual und ownership. For example, Washing-ton Gas and Light (NYSE: WGL), a $ . billion gas utility,counts Barclays, American Century, Vanguard, and StateStreet among others in its top holders list. None o thesenames are present in the MLP space, which has companieswith signi cantly larger market capitalization and greatereconomic importance. Because institutional investors are
amiliar with gas utilities’ historical correlations, earningstrends, price behavior, and they are eligible or inclusion inmutual und and tax-exempt port olios, these institutionscontinue to devote substantial resources and capital invest-ment toward the gas utility sector while generally ignoringMLPs. However, as trading liquidity continues to increaseand distribution levels and growth continue to outpace
other dividend equities, we believe that institutional inter-est will continue to grow.
Te Emergence o Pure-Play Publicly raded GPs
MLPs are governed by their GPs, which are in turn alsosubject to Sarbanes-Oxley with respect to director indepen-dence. Some GPs are comprised o members o the execu-tive management team, some are nationally recognizedprivate equity groups, and still others are multinationalenergy companies. For many years, there have been publiclytraded GPs, and these have typically been corporationswhose cash ows were substantially derived rom otherenergy assets. Recently, there has been a trend toward thepure-play public GP entity and most utilize the MLP struc-ture themselves.
A ull explanation o the GP is provided in the “General/Limited Partner Structure” section below but in short thesestructures provide investors a leveraged play on the MLP’sgrowth. Trough the incentive distribution rights (IDRs)held by the GP, the GP receives an increasing share o totalcash distributed by the MLP as the distribution rate per
SteelPath Fund AdvisorsMaster Limited Partnership Primer
Exhibit : MLP Median Daily Dollar rading Volume
Source: Bloomberg, Alerian
0
100
200
300
400
500
600
1999 2000 2001 2002 2003 2004 2005 2006 2007 2008 2009
d o l l a r
t r a d i n g v o l u m e
( $ m
i l l i o n s )
8/6/2019 MLP Primer
http://slidepdf.com/reader/full/mlp-primer 12/31
unit is increased. For example, i the MLP were to make
an accretive acquisition and subsequently increased itsdistribution, the GP might receive an outsized portion o the total cash distributions associated with that distribu-tion increase. Further, i the MLP issued new units to undthe acquisition then total cash distributed would haveincreased even without a distribution rate increase due tothe additional units outstanding. Tere ore, the GP’s cashallocation would increase with the increase in total cashdistributed even though its share o that total would haveremained stagnate.
Although there is tremendous potential or distributiongrowth at the GP level due to the structure o the IDRs,that mechanism works similarly against GPs in scenarioswhere the distribution level at the LP must be reduced. O note, the IDR structure provides that i a certain minimumdistribution rate at the MLP is not achieved, then the GPreceives no cash through the IDRs. We believe this riskis o ten underappreciated by the investment communitywhich continues to accord GPs a %- % cost o equitycapital. With such a high degree o innate leverage, webelieve that GPs inherently demand a higher required rateo return. Te impacts o structural and nancial leverageand trading liquidity demand adjustments to the CAPMor any other model used to determine the cost o capital.Fundamentally, i the cost o equity capital or the underly-ing MLP were in the % to % range, the cost o capital
or the GP should be greater – substantially greater. We es-timate the appropriate required return somewhere between
- %. Under these cost o capital assumptions, a numbero the publicly traded GPs are overvalued today in all butthe most aggressive growth scenarios.
Tere is a belie that i an investor likes the LP, they mustlove the GP. We caution investors that the GP structurecarries signi cant risk and that risk must be appropriatelyweighed. In act, investors looking or leveraged exposureto a certain MLP’s cash ows might consider doing just that
by borrowing with debt and leveraging their position. Insome cases this could provide a better risk-adjusted returnthan purchasing the general partners at today’s valuations.
Te Alerian MLP Index SeriesTe Alerian MLP Index (NYSE: AMZ) measures the compos-ite per ormance o the most prominent energy masterlimited partnerships, and is calculated by real time using a
oat-adjusted, capitalization-weighted methodology. Tisindex is the industry standard benchmark or the energyMaster Limited Partnership asset class used by the compa-nies themselves in their internal corporate nance compar-isons and outside investor presentations, and by the equityresearch analyst community to track the per ormance o the asset class. Te corresponding total return index iscalculated on an end-o -day basis and will be disseminated
daily through its ticker symbol, “AMZX”.Te objective o the Alerian MLP Index is to provide inves-tors with an unbiased, comprehensive benchmark or theper ormance o the energy master limited partnershipuniverse. Using Standard & Poor’s proprietary calculationmethodology, the Alerian MLP Index was created to ll theneed or a reliable, transparent index to track this emergingasset class.
Te Alerian MLP In rastructure Index provides an en-hanced liquid subset o the Alerian MLP Index that includesonly midstream energy transportation and storage assets,
and selects those companies that are in rastructure hard-asset ocused. Te index provides greater diversi cationand speci c exposure to in rastructure investment.
New index constituents will be subject to the ollowingconditions:
. Market capitalization. Each constituent security musthave a market capitalization o at least $ million.Tis minimum requirement is reviewed rom time totime to ensure consistency with market conditions.
. Adequate trading liquidity. Each constituent securitymust maintain a ratio o annual dollar value tradedto market capitalization o . or greater. radingvolume o each component security is required to havebeen in excess o , units per month or each o the last six months.
. Public oat. Each constituent security must have apublic oat o at least % o the total outstandingunits.
. Financial viability. Each constituent security mustmaintain trailing months distributable cash owthat exceeds cash distributions paid to unitholders
SteelPath Fund AdvisorsMaster Limited Partnership Primer
8/6/2019 MLP Primer
http://slidepdf.com/reader/full/mlp-primer 13/31
Constituents o the Alerian MLP Index are oat-adjusted tore ect the number o units available to investors accordingto real time proprietary methodology. Te oat-adjustednumber o units or each stock is determined by assigningeach stock an availability actor. Tat actor represents thepercentage o units deemed available (i.e., tradable) on theopen market, and is developed by excluding certain types o holdings including: corporate cross-holdings, private con-trol block holdings, or government holdings. Subordinatedlimited partner units and any other holdings not readilyavailable to the public or investment are also excluded.
For a complete description o the Alerian MLP Indices visitthe Aler ian web site at http://alerian.com/.
What is a Midstream Asset?
raditional MLP operations can be broadly grouped intoour categories – pipelines, terminals/storage, marine
transportation and midstream services. Tese categoriescan urther be subdivided by product types, including am-monia, bulk products, carbon dioxide, coal, crude oil, heat-ing oil, re ned petroleum products, natural gas and naturalgas liquids, and propane.
Crude Oil/Re ned Products ransportation
Crude oil and re ned petroleum products are transported
by pipelines, marine transportation, railroads and trucks.Pipelines are the most e cient mode o transportation orlong-haul movement (accounting or roughly % o trans-portation), ollowed by tankers/barges (approximately %o transportation). Rail and truck usage is cost-e ectiveonly over short distances and, there ore, accounts or only asmall percentage o petroleum transportation.
Te US crude oil and petroleum products transportationsystem links oil wel ls and import terminals to re neries,which in turn are linked to end users o petroleum prod-ucts. Tis system is comprised o networks o pipelines,terminals, storage acilities, tankers, barges, rail cars,
and trucks. Generally speaking, pipelines are the lowest-cost alternative or transportation across long distances.Troughout the distribution system, terminals exist toprovide storage, distribution, blending, and other ancil-lary serv ices. Crude oil that is pumped to the sur ace romreservoir deposits is collected on gathering pipelines andbrought to longer-haul trunk pipelines to be transported tore neries, which then separate the eedstock into products.Product then originates on pipeline systems rom directconnections with re neries and interconnections withother interstate pipelines or transportation and ultimatedistribution.
Petroleum products transported, stored, and distributedthrough petroleum products pipelines and terminals in-clude:
• re ned petroleum products, which are the output romre neries and are primarily used as uels by consumers(gasoline, diesel, jet uel, kerosene, and heating oil)
• lique ed petroleum gases (LPGs), which are producedas byproducts o crude oil re ning and as part o natu-ral gas production (these include butane and propane)
SteelPath Fund AdvisorsMaster Limited Partnership Primer
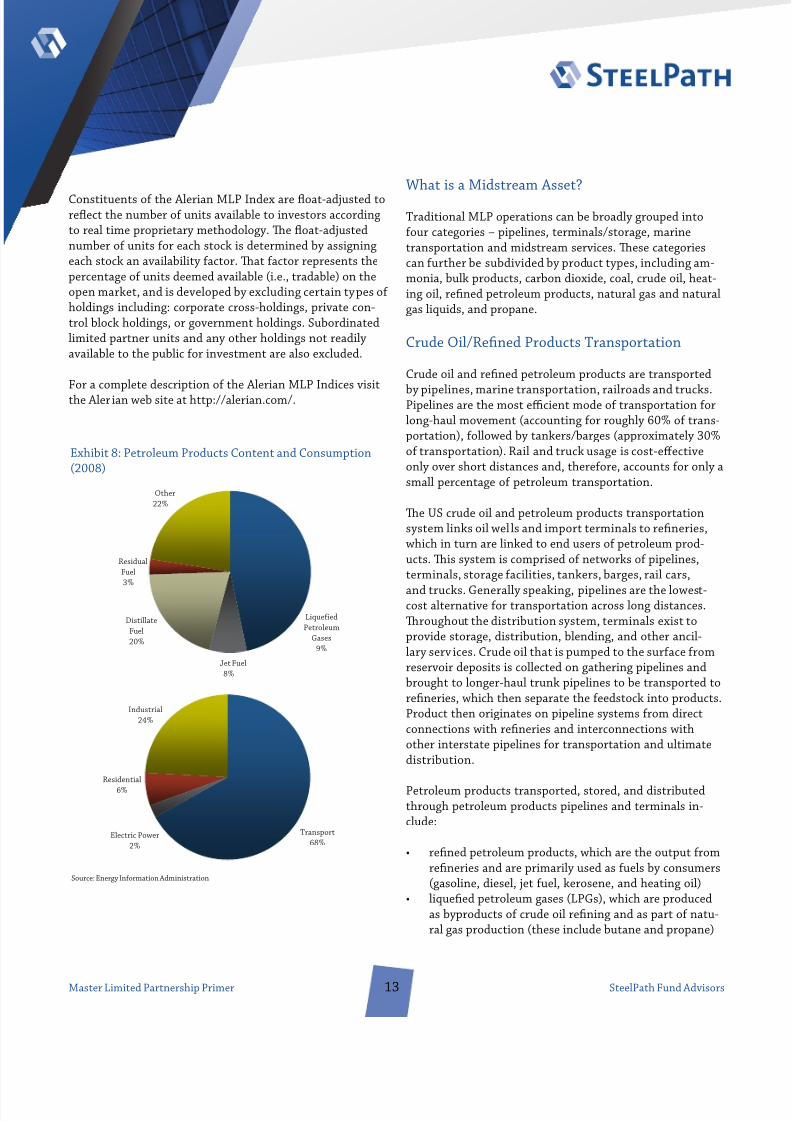
Exhibit : Petroleum Products Content and Consumption( )
Source: Energy In ormation Administration
Industrial24%
Residential6%
Electric Power2%
Transport68%
Jet Fuel8%
Other22%
DistillateFuel20%
LiquefiedPetroleum
Gases9%
ResidualFuel3%
8/6/2019 MLP Primer
http://slidepdf.com/reader/full/mlp-primer 14/31
• blendstocks, which are blended with petroleum prod-ucts to enhance various speci cations, such as raising agasoline’s octane or oxygen content
• heavy oils and eedstock or urther processing byre neries and petrochemical acilities
• crude oil and condensate, which are used as eedstockby re neries
Fungible products shipped on such systems are typicallygeneric products. Tese products meet published standardspeci cations; shippers will receive equivalent product butmay not get back the actual product shipped. Segregatedproducts are branded products or speci c blendstock ma-terials. On segregated shipments, shippers will receive thesame product that they had injected into the system.
With pipeline transportation, crude oil and re ned petro-leum products travel at roughly three to ve miles per hourin long-haul trunkline pipelines. Te greater the volumebeing transported on a given day, the aster the productgenerally moves. It can take anywhere rom two to threeweeks or a batch o petroleum products to move rom are nery tailgate in Houston, exas, to the New York harbor.
Interstate pipelines carry crude oil and re ned productsacross state boundaries and are subject to FERC regulation
on the rates charged or their services, on the terms andconditions o the services they o er, and on the location,construction, and abandonment o their acilities. Intra-state pipelines transport within a particular state and arenot subject to regulation by the FERC, but rather individualstate agencies responsible or such oversight.
Petroleum pipelines bene t rom a benign overarchingederal regulatory ramework, which provides management
teams with a strong incentive to innovate and cut costs.Unlike traditional cost-o -service, authorized rate-o -return utility rate-making, petroleum products pipelines donot have to share cost improvements with their customers.
A ter an initial rate is set, as per the CongressionalEnergy Policy Act, the tari rate structure on the pipeline isincreased by the PPI or Finished Goods plus a . % marginevery July st.
ransportation tari s vary depending on where the prod-uct originates, where ultimate delivery occurs, and anyapplicable discounts. All interstate transportation ratesand discounts are in published tari s led with the FERC.
ari s are designed to ensure appropriate rates o return
or pipeline owners, with annual tari increases o PPI +. % unctioning as an embedded cost recovery mechanism
– thus providing a built-in in ation hedge or partnershipsthat own crude oil and re ned product interstate pipelines.Published tari s serve as contracts, and shippers nominatethe volume to be shipped up to a month in advance. Inaddition, supplemental agreements are entered into withshippers that typically result in volume and/or term com-mitments by shippers in exchange or reduced tari rates.Tese agreements have terms o one to years. Productservices such as ethanol loading, additive injection, andcustom blending are per ormed as needed under monthlyor long-term agreements. Pipeline operators generally donot take title to the product they are shipping, leaving littledirect commodity exposure (inelastic demand characteris-tics or re ned petroleum products urther supports this).Competition with other pipeline systems is based mainlyon transportation charges, quality o customer service,proximity to end users, and history o individual customerrelationships. However, given the di erent supply sourceson each pipeline, pricing at either the origin or terminalpoint on a pipeline may outweigh transportation costswhen customers choose which line to use.
Marine ransportation
Although pipelines are a key component in the distributionchain, they do not reach all markets and are not capableo transporting all re ned petroleum products or eco-nomically transporting most chemical products. Marinetransportation – primarily conducted by tankers and tugbarges – lls this gap. ankers and barges transport re nedpetroleum products rom re neries to terminals and acili-ties engaged in urther processing. Customer contractsgenerally have initial terms o one to three years. Similar topipeline transportation, marine transportation providersdo not assume ownership o any o the products that aretransported on their vessels.
Te US ag coastwise marine transportation industry isguided by the Merchant Marine Act o (commonlyre erred to as the Jones Act), a set o ederal statutes thatmandates that vessels engaged in trade between US portsmust operate under the US ag, be built in the US, beat least % owned and operated by US citizens, and besta ed by a US crew. One o the principle reasons or theJones Act is to maintain a eet o vessels available or char-ter to the US government to meet national de ense needs,but it also serves to insulate the market rom direct oreign
SteelPath Fund AdvisorsMaster Limited Partnership Primer

8/6/2019 MLP Primer
http://slidepdf.com/reader/full/mlp-primer 15/31
competition.
In , we saw the rst Jones Act marine transportationIPOs in the MLP sector: K-Sea ransportation Partners LPand US Shipping Partners LP. Te coastwise vessel eet ishighly ragmented and predominantly amily owned. Webelieve there will be additional IPOs and substantial op-portunity or consolidation in the sector as capital require-ments rise due to increasingly stringent environmentalrequirements. In many cases, we view these vessels as oat-ing pipelines; these ships o ten carry products that cannotbe carried in a competing pipeline, or they service areasthat are not currently serviced by pipelines and are unlikelyto be so in the uture.
Te domestic supply o vessels is decreasing due to theJones Act and the Oil Pollution Act o (OPA ), whichmandates the phase-out o certain non-double-hulledvessels by a series o deadlines through . Given theexpected decline in available vessels due to these require-ments, oil and chemical companies are increasingly in-terested in entering into long-term charter agreementsin order to ensure shipping capacity or their products.Further, major oil and chemical companies have becomeprogressively more selective in their choice o tanker andbarge operators. Tese companies place particular emphasis
on strong environmental and sa ety records as well as op-erating per ormance. Tis pre erence will likely acceleratethe scrapping o older, lower-quality vessels. Additionally,these companies continue to concentrate more on their coreoperations by divesting vessels and securing third-partytransportation.
Crude Oil/Re ned Products erminals
erminals are large storage and distribution acilities thathandle crude oil and re ned petroleum products. ermi-nals are typically located in close proximity to re neriesand can be classi ed as either inland or marine. Inlandterminals generally consist o multiple storage tanks thatare connected to a pipeline system. Products are loadedand unloaded rom the common carrier pipeline to storagetanks and directly rom storage tanks to a truck or rail carloading rack. Marine terminals primarily receive petroleumproducts by ship and barge, short-haul pipeline connections
rom neighboring re neries, and common carrier pipelines.
erminals generate ees primarily by providing short- andlong-term storage o crude oil and re ned petroleum prod-
ucts, as well as ancillary services. Revenue is generated bycharging customers a ee based on the amount o productthat is delivered through terminals. In addition to through-put ees, revenue is generated by charging customers a ee
or providing services such as blending and additive injec-tion. erminals are unregulated and rates are market-basedas a result. erminal contracts, which typically provide orstorage or anywhere rom a ew days to several months,generally last or one year with annual renewal provisions.Most o these contracts contain a minimum throughputprovision that obligates the customer to move a minimumamount o product through a terminal or pay or termi-nal capacity reserved but not used. In general, similar topipeline operators, terminal operators do not take title tothe products that are stored in or distributed rom theirterminals.
erminal demand is greatest in a contango market, inwhich uture petroleum prices represented by the orwardcurve are higher than prevailing spot prices. In thesecircumstances, customers tend to store more product toarbitrage the higher prices expected in the uture. Whenbackwardation (the opposite o contango, i.e. uture pricesare lower than spot prices) exists, customers tend to trans-port more product to end markets to take advantage o current higher prices in lieu o storing product.
Re ners and chemical companies wil l use third-partyterminals when their acilities are insu cient due to sizeconstraints, specialized product handling requirements, orgeographic considerations.
Midstream Natural Gas Industry
Natural gas is rapidly growing as a global energy source,accounting or approximately % o world energy con-sumption today. Tis growth has been driven by plenti ulreserves, the environmental bene ts o its clean-burningnature, and the broad range o its applications.
Once natural gas is produced rom wells in areas such as theGul o Mexico, producers then seek to deliver the naturalgas and its components to nal markets. Te midstreamnatural gas industry is the link between upstream E&Pand downstream end markets. Te midstream natural gasindustry generally consists o natural gas gathering, trans-portation, storage, and processing/ ractionation activities.Te midstream segment typically involves local competitionbased on the proximity o gathering systems and process-ing plants to natural gas-producing wells.
SteelPath Fund AdvisorsMaster Limited Partnership Primer
8/6/2019 MLP Primer
http://slidepdf.com/reader/full/mlp-primer 16/31
In May , the DC Circuit Court upheld the Federal Ener-gy Regulatory Commission’s policy regarding an implied taxcomponent in the cost o service or determining allowedpipeline rates o return. Tis ruiling marks the beginningo a signi cant shi t o interstate natural gas assets into theMLP structure with multiple initial public o erings o pureplay interstate natural gas pipeline companies, and continu-ing in what could amount to the divestiture o more than$ billion o assets could eventually ollow suit.
ransportation
Te US natural gas pipeline system transports natural gasrom producing regions to customers such as local distri-
bution companies (LDCs), industrial users, and electricgeneration acilities. Similar to crude oil and re ned prod-uct pipelines, interstate pipelines carry natural gas acrossstate boundaries and are subject to FERC regulation on therates charged or their services, terms and conditions o theservices they o er, and location, construction, and aban-donment o their acilities. Intrastate pipelines, likewise,provide transportation within a particular state and are notsubject to FERC regulation, but rather governance at thestate agency level.
Te US Gul Coast is the most proli c domestic naturalgas-producing region. otal US production is insu cientto meet US demand, however. Te majority o this supplyshort all is likely to be met through natural gas imports
rom Canada as well as through LNG imports, which areexpected to be delivered predominately through Gul Coast
terminals. According to the Energy In ormation Adminis-tration (EIA), LNG’s share o total US gas supply could be ashigh as % by , compared to less than % today. How-ever, the recent success US producers have had in accessingshale gas and other non-conventional sources might resultin a much reduced role or LNG versus even these relativelyrecent expectations. Nonetheless, given the extensive pipe-line in rastructure and available gas-processing capabilityin and around the region, the Gul Coast is the target ormost o the proposed onshore LNG terminals.
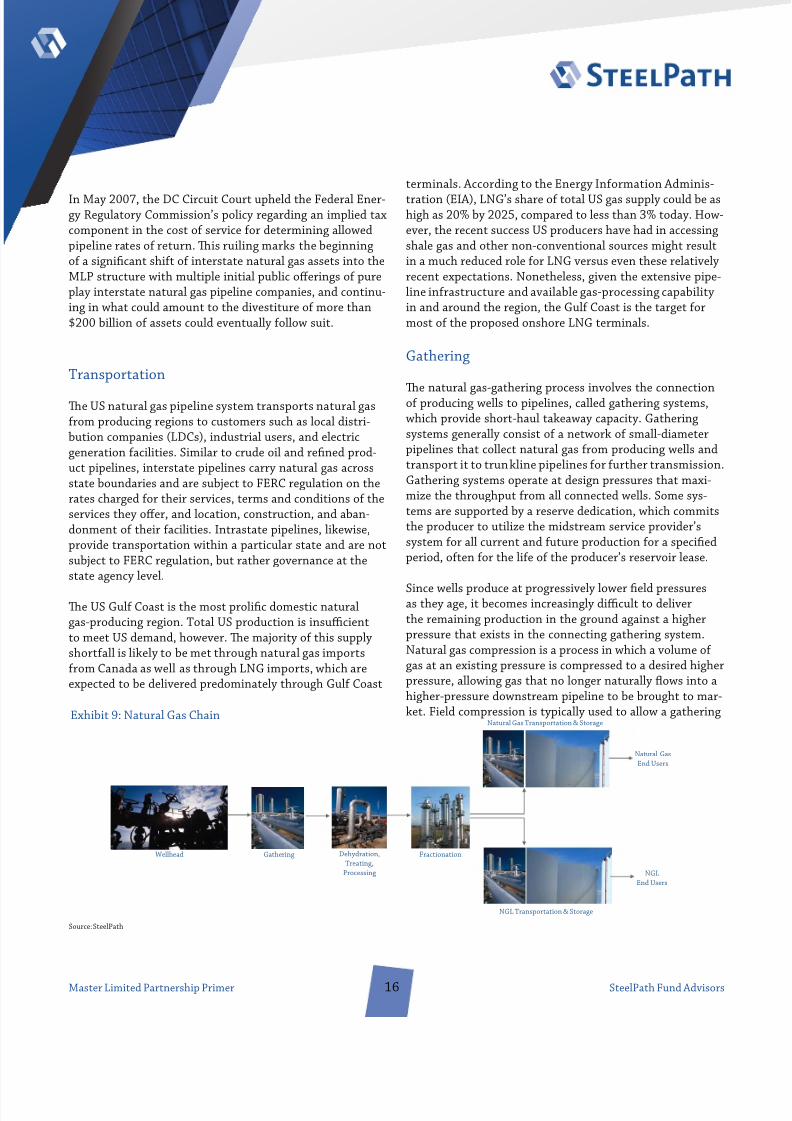
Gathering
Te natural gas-gathering process involves the connectiono producing wells to pipelines, called gathering systems,which provide short-haul takeaway capacity. Gatheringsystems generally consist o a network o small-diameterpipelines that collect natural gas rom producing wells andtransport it to trunkline pipelines or urther transmission.Gathering systems operate at design pressures that maxi-mize the throughput rom all connected wells. Some sys-tems are supported by a reserve dedication, which commitsthe producer to utilize the midstream service provider’ssystem or all current and uture production or a speci edperiod, o ten or the li e o the producer’s reservoir lease.
Since wells produce at progressively lower eld pressuresas they age, it becomes increasingly di cult to deliverthe remaining production in the ground against a higherpressure that exists in the connecting gathering system.Natural gas compression is a process in which a volume o gas at an existing pressure is compressed to a desired higherpressure, allowing gas that no longer naturally ows into ahigher-pressure downstream pipeline to be brought to mar-ket. Field compression is typically used to allow a gathering
SteelPath Fund AdvisorsMaster Limited Partnership Primer
Natural GasEnd Users
NGLEnd Users
Wellhead Gathering Dehydration,Treating,
Processing
Fractionation
NGL Transportation & Storage
Natural Gas Transportation & StorageExhibit : Natural Gas Chain
Source: SteelPath
8/6/2019 MLP Primer
http://slidepdf.com/reader/full/mlp-primer 17/31
system to operate at a lower pressure or provide su cientpressure to deliver gas into a higher-pressure downstreampipeline. I eld compression is not installed, then theremaining natural gas in the ground will not be producedbecause it cannot overcome the higher gathering systempressure. In contrast, i eld compression is installed, a wellcan continue delivering natural gas that otherwise wouldlikely not be produced.
Dehydration
Natural gas collected at the wellhead has a variety o com-ponents that typically render it unsuitable or long-haul
pipeline transportation. Produced natural gas can be satu-rated with water, which must be extracted given that natu-ral gas and water can combine to orm ice that can blockparts o the pipeline gathering and transportation system.Water can also cause corrosion when combined with carbondioxide (CO ) or hydrogen sul de (H S) in natural gas. Inaddition, condensed water in a pipeline can raise pipelinepressure. o meet downstream pipeline and end-user gasquality standards, natural gas is dehydrated to remove thesaturated water.
reating
In addition to water, natural gas collected through a gather-ing system may also contain impurities such as carbondioxide and hydrogen sul de, depending on the reservoir
rom which it is derived. Natural gas with elevated amountso carbon dioxide or hydrogen sul de can be damagingto pipelines and ail to meet end-user speci cations. As aresult, gas with impurities higher than what is permitted bypipeline quality standards is treated with liquid chemicalscalled amines at a separate plant prior to processing. Tetreating process involves a continuous circulation o amine,which has a chemical a nity or carbon dioxide and hy-drogen sul de that allows it to absorb the impurities romthe gas. A ter mixing, gas and amine are separated and theimpurities are removed rom the amine by heating. Further,to alleviate the potentially adverse e ects o these contami-nants, many pipelines regularly inject corrosion inhibitorsinto the gas stream.
Processing
Once water and other impurities are removed rom naturalgas, the gas must then be separated into its components.Natural gas processing involves the separation o naturalgas into pipeline quality natural gas and a mixed streamo natural gas liquids (NGLs). Te primary component o natural gas is methane (CH ), but most gas also containsvarying degrees o liquids including ethane (C H ), pro-pane (C H ), normal butane (C H ), isobutane (C H ),and natural gasoline. NGLs are used as heating uels and as
eedstock in the petrochemical and oil re ning industries.
Natural gas pipelines have speci cations as to the maxi-mum NGL content o the gas to be shipped. In order tomeet quality standards or pipelines, natural gas that doesnot meet these speci cations must be processed to separateliquids that can have higher values as distinct NGLs thanthey would by being kept in the natural gas stream. NGLsare typically recovered by cooling the natural gas until themixed NGLs separate through condensation. Cryogenicrecovery methods are processes where this is accomplishedat very low temperatures and provide higher NGL recoveryyields. A ter being extracted rom natural gas, the mixedNGLs are typically transported to a ractionator or separa-tion o the NGLs into their component parts.
Processing contracts can take on a number o orms includ-ing: ( ) ee-based arrangements; ( ) percentage o liquids/proceeds contracts, which e ectively give the processorlong exposure to natural gas and/or NGL prices; ( ) percent-age o index contracts, which e ectively lock in a margin
or the processor; and ( ) keep-whole contracts, which e ec-tively creates a long NGL / short natural gas position or theprocessor and exposes the processor to what is re erred toas the ractionation spread (the processor retains owner-ship o the NGLs and is required to reimburse the producer
or the value o the lost heat content rom the NGLs havingbeen stripped out, creating the short gas position).
Fractionation
Fractionation is the method by which NGLs are urtherseparated into individual components. NGL ractionation
acilities separate mixed NGL streams into discrete NGLproducts. Ethane is primarily used in the petrochemical in-dustry to produce ethylene, a key building block or a widerange o plastics and other chemical products. Propane isused in the production o ethylene and propylene and as a
SteelPath Fund AdvisorsMaster Limited Partnership Primer
8/6/2019 MLP Primer
http://slidepdf.com/reader/full/mlp-primer 18/31
heating uel, an engine uel, and an industrial uel. Isobu-tane is commonly used to enhance the octane content o motor gasoline. Normal butane is used in the production o ethylene, butadiene (an important component o syntheticrubber), motor gasoline, and isobutane. Natural gasoline,a mixture o pentanes and heavier hydrocarbons, is usedprimarily to produce motor gasoline and petrochemicals.In the US, NGLs are produced primarily by gas processingplants but also by crude oil re neries.
Fractionation isolates the di erent boiling points o theindividual NGL products. NGLs are ractionated by heatingmixed NGL streams and sending them through a series o distillation towers. As the temperature o the NGL streamis increased, the lightest (lowest boiling point) NGL productboils o the top o the tower, where it is condensed andmoved to storage. Te remaining stream is then sent tothe next tower, where the process is repeated and a di -
erent NGL product is separated and stored. Tis processcontinues until the NGL stream has been separated into itscomponents.
Natural gas processing acilities have some exibility in theextent to which they separate NGLs rom natural gas. Teactual volume o NGLs produced is o ten determined by thedegree to which NGL prices exceed natural gas prices and
the cost o separating the mixed NGLs rom the natural gasstream. When the value o extracting discrete NGL prod-ucts is less than what would be achieved by allowing themto remain in the natural gas stream, the recovery levels o certain NGL products, particularly ethane, can in some in-stances be reduced. Ethane rejection and similar processesto reduce NGL recovery are still limited by pipeline andend-user speci cations, although blending with low NGLcontent natural gas (re erred to as dry gas as opposed toNGL-rich wet gas) can sometimes be used as an alternativeto processing.
A ter NGLs are ractionated, the ractionated products are
transported to customers or stored or uture delivery. NGLproducts must be pressurized or cooled to a liquid state orstorage or transportation. Te mixed NGLs delivered to
ractionation acilities rom domestic gas processing plantsand crude oil re neries are typically transported by NGLpipelines and, to a lesser extent, by rail car and truck. Bothproducers and end users will look to store NGLs to ensurean adequate supply or their respective customers over thecourse o the year and, in particular, periods o heighteneddemand.
MLPs that own or operate natural gas processing and rac-tionation plants must manage a unique set o complex risksassociated with the basis between natural gas and variousNGL products. With the bene t o developing hedging mar-kets, most MLPs have become quite sophisticated in theirmanagement o these risks, ensuring the ability to continueproviding their unitholders with dependable distributions.
Storage
Natural gas storage acilities are used by natural gas endusers such as LDCs to ensure a reliable supply or their
customers and their marketing and trading businesses aspart o a purchase and sale strategy. Natural gas is typicallystored in underground acilities such as salt dome cavernsand depleted reservoirs. Natural gas demand is usuallygreater during the winter because it is mainly used orheating by residential and commercial customers. ypi-cally, excess natural gas delivered during summer monthsis stored to meet the increased demand during wintermonths. However, as natural gas- red electric generationcontinues as an emerging theme, demand or natural gasduring the summer months to meet cooling needs shouldrise accordingly.
Natural gas is typically stored underground in salt orma-tions and depleted reservoirs because above-ground storagetends to be uneconomical. Salt ormations are not alteredby the stored products and can contain large quantities o natural gas sa ely and in a cost-e ective manner. A saltcavern is ormed by drill ing and dissolving an undergroundcavern in a naturally existing salt ormation and installingrelated sur ace acilities. Water mixed with salt, or brine, isused to displace the stored products and to maintain pres-sure in the well as product volumes change.
LNG ransportation
As the use o natural gas continues to rise internation-ally, the gap between the expected demand by consum-ing nations and their production levels is also increasing,requiring the short all to be met with imports. A majorityo the global supply o natural gas has traditionally beenstranded given the dislocation in producing regions andend markets and the di culty in transporting gas betweenthe two. Pipeline transportation is generally the most cost-e ective means o transporting natural gas, although suchtransportation is naturally limited by distance and terrain.
SteelPath Fund AdvisorsMaster Limited Partnership Primer
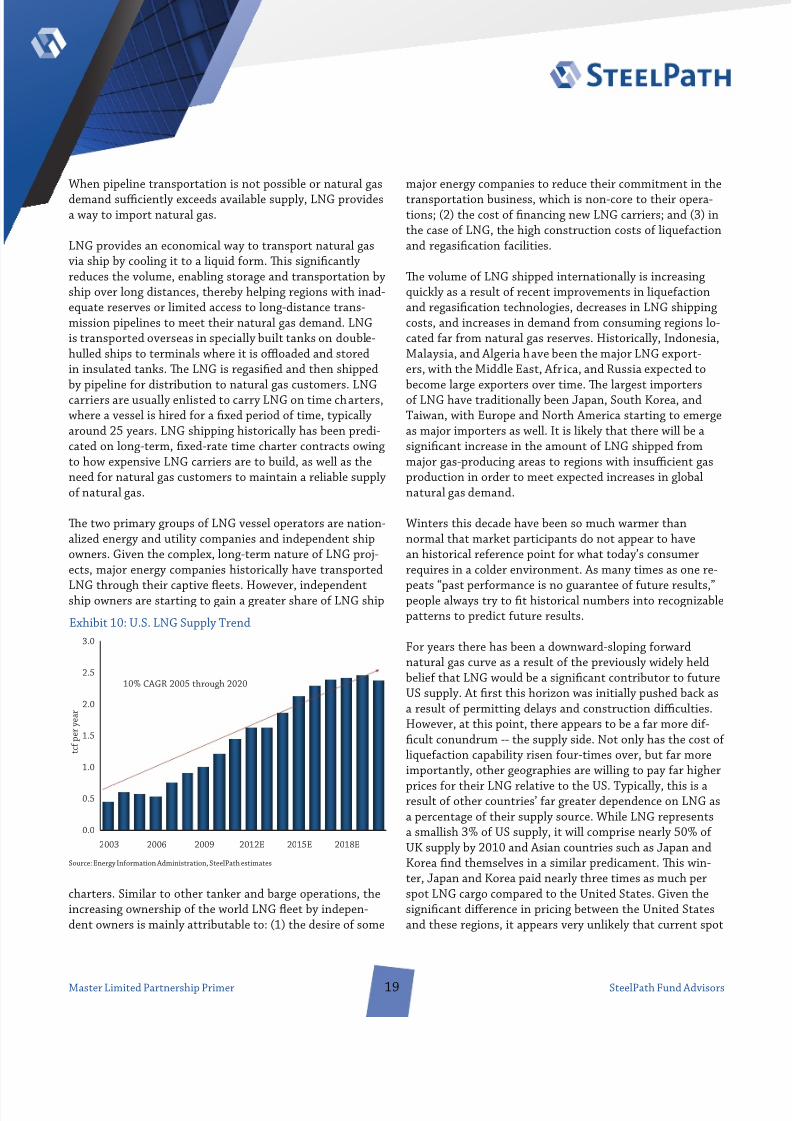
8/6/2019 MLP Primer
http://slidepdf.com/reader/full/mlp-primer 19/31
When pipeline transportation is not possible or natural gasdemand su ciently exceeds available supply, LNG providesa way to import natural gas.
LNG provides an economical way to transport natural gasvia ship by cooling it to a liquid orm. Tis signi cantlyreduces the volume, enabling storage and transportation byship over long distances, thereby helping regions with inad-equate reserves or limited access to long-distance trans-mission pipelines to meet their natural gas demand. LNGis transported overseas in specially built tanks on double-hulled ships to terminals where it is ofoaded and storedin insulated tanks. Te LNG is regasi ed and then shippedby pipeline or distribution to natural gas customers. LNGcarriers are usually enlisted to carry LNG on time charters,where a vessel is hired or a xed period o time, typicallyaround years. LNG shipping historically has been predi-cated on long-term, xed-rate time charter contracts owingto how expensive LNG carriers are to build, as well as theneed or natural gas customers to maintain a reliable supplyo natural gas.
Te two primary groups o LNG vessel operators are nation-alized energy and utility companies and independent shipowners. Given the complex, long-term nature o LNG proj-ects, major energy companies historically have transported
LNG through their captive eets. However, independentship owners are starting to gain a greater share o LNG ship
charters. Similar to other tanker and barge operations, theincreasing ownership o the world LNG eet by indepen-dent owners is mainly attributable to: ( ) the desire o some
major energy companies to reduce their commitment in thetransportation business, which is non-core to their opera-tions; ( ) the cost o nancing new LNG carriers; and ( ) inthe case o LNG, the high construction costs o lique actionand regasi cation acilities.
Te volume o LNG shipped internationally is increasingquickly as a result o recent improvements in lique actionand regasi cation technologies, decreases in LNG shippingcosts, and increases in demand rom consuming regions lo-cated ar rom natural gas reserves. Historically, Indonesia,Malaysia, and Algeria have been the major LNG export-ers, with the Middle East, A rica, and Russia expected tobecome large exporters over time. Te largest importerso LNG have traditionally been Japan, South Korea, and
aiwan, with Europe and North America starting to emergeas major importers as well. It is likely that there will be asigni cant increase in the amount o LNG shipped rommajor gas-producing areas to regions with insu cient gasproduction in order to meet expected increases in globalnatural gas demand.
Winters this decade have been so much warmer thannormal that market participants do not appear to havean historical re erence point or what today’s consumerrequires in a colder environment. As many times as one re-
peats “past per ormance is no guarantee o uture results,”people always try to t historical numbers into recognizablepatterns to predict uture results.
For years there has been a downward-sloping orwardnatural gas curve as a result o the previously widely heldbelie that LNG would be a signi cant contributor to utureUS supply. At rst this horizon was initially pushed back asa result o permitting delays and construction di culties.However, at this point, there appears to be a ar more di -
cult conundrum -- the supply side. Not only has the cost o lique action capability risen our-times over, but ar moreimportantly, other geographies are willing to pay ar higher
prices or their LNG relative to the US. ypically, this is aresult o other countries’ ar greater dependence on LNG asa percentage o their supply source. While LNG representsa smallish % o US supply, it will comprise nearly % o UK supply by and Asian countries such as Japan andKorea nd themselves in a similar predicament. Tis win-ter, Japan and Korea paid nearly three times as much perspot LNG cargo compared to the United States. Given thesigni cant di erence in pricing between the United Statesand these regions, it appears very unlikely that current spot
SteelPath Fund AdvisorsMaster Limited Partnership Primer
Exhibit : U.S. LNG Supply rend
0.0
0.5
1.0
1.5
2.0
2.5
3.0
2003 2006 2009 2012E 2015E 2018E
t c
f p e r y e a r
10% CAGR 2005 through 2020
Source: Energy In ormation Administration, SteelPath estimates
8/6/2019 MLP Primer
http://slidepdf.com/reader/full/mlp-primer 20/31
pricing in the US is going to attract very much supply.
Te other remaining issue is that the United States hasturned itsel into an LNG spot market. Whereas compet-ing nations’ utilities have been wil ling to sign long-term( -year plus) contracts, US utilities, weary a ter signinglong-term contracts post deregulation decades ago that re-sulted in paying above-market prices and hurting consum-ers or years to come, are not willing to sign such contractsa second time. Te rm has avoided any LNG-themedinvestments, whether they be in regassi cation or associ-ated pipelines or storage, and we will likely continue to doso until we see signs that this market will develop in theUnited States as we expect within the next decade.
Valuing MidstreamEnergy Businesses At the most basic level, the valuation o an MLP is no di -
erent than the valuation o any publicly traded corporateentity or private enterprise. oday’s air value should re ectthe expected uture cash ow stream to the investor, appro-priately discounted or the risk associated with the streamo payments and the time value o money. Te industrystandard or MLP valuation is relative yield, which purport-edly attempts to capture cash ow risk by taking a one-year
orward distribution estimate, dividing by a distributionyield assumption, and comparing it to that o other MLPs.We believe, however, that a bottoms-up calculation o theappropriate required rate o return is required and a longer-term outlook on cash ow generation is needed.
Popular Misconception: Relative Yield
Historically, MLPs have largely been thought o as xed-income substitutes with a ocus on the yield component,despite the lack o a strong correlation between yield
indices and MLP unit prices, and the substantial andgrowing portion o total returns generated by growth andcapital appreciation. However, many MLPs are truly growthvehicles, and given - % annualized distribution growthover the last decade as an asset class, with top per orm-ers substantially above this mean, we believe capital gainsand distribution growth will be a much larger part o totalreturns or top per ormers. Consequently, yield disper-sion metrics (relative to historical levels, the MLP group,relevant individual MLPs, reasuries, and other yield-ori-
ented investments) are increasingly sub-optimal in valuingthese yield-growth hybrid instruments. Indeed, were one tovalue MLPs by yield comparison alone in October , theentire space would have been a strong buy when it (and thebroader market) still had urther to all.
We believe that the ideal MLP valuation model incorporatestwo components: ( ) the intrinsic value o the partnership’scurrent assets; and ( ) the option value associated with
uture investments and acquisitions. Investors are increas-ingly turning to the distribution discount model, or DDM,in its various multi-stage orms to value MLPs. However,this model ails to incorporate the second a orementionedcomponent. Further, the DDM-derived air value is verysensitive to a number o assumptions, including the cost o capital and the terminal growth rate.
We believe that an MLP’s cost o capital is a unction o itsbusiness risk pro le. As such, there are two main compo-nents to consider -- cash ow volatility and cash ow sus-tainability. Volatility re ers to the quarterly uctuation inoperating cash ow. For example, the propane and heatingoil businesses are seasonal, and thus exhibit signi cantlyhigher quarterly cash ow volatility than re ned productstransportation. Sustainability o cash ows takes into con-sideration the regulatory environment in which the MLP
operates and whether or not its asset base is depleting innature. I an interstate pipeline generates stable cash ows,but is at risk to have its tari arrangements completely re-structured by the FERC, its business risk pro le is adverselya ected. Depleting assets increase the business risk pro leas well because they orce the company to make acquisi-tions to maintain its cash ow stream. Examples o deplet-ing asset businesses include E&P, gathering and processing,and mining. Canadian Royalty rusts are organized aroundthese types o assets.
Stable, Growing Distributions – Te De ningCharacteristic o the MLP Model
At a high level, midstream MLPs can be compared to otherhigh-yield equities by examining relative dividend yields.We believe it is also important to compare “distributable”cash ow (a ter maintenance capital expenditures) to recog-nize the unique characteristics o these attractive businessmodels. Unlike real estate, a pipeline never needs a new
ront lobby. Maintenance capital expenditures are relatively
SteelPath Fund AdvisorsMaster Limited Partnership Primer
8/6/2019 MLP Primer
http://slidepdf.com/reader/full/mlp-primer 21/31
low and predictable. But one act that stands out is howcheap MLPs appear relative to other yield equities.
While there is no legal requirement regarding the level o unitholder cash distributions, a precedent has largely beenset that investor interest in any given partnership is predi-cated on sa e cash distributions that are consistently paidout just as a corporate board sets a dividend policy. Distrib-utable cash ow is generally calculated as EBI DA plus non-cash losses, minus interest expense, maintenance capitalexpenditures, and non-cash gains. Growth capital expen-ditures and acquisitions are typically nanced through thecapital markets, creating a sel -regulating mechanism that
orces management teams to make smart investments.Each debt or equity o ering is essentially a voting mecha-nism on how well they have done.
MLP distribution yields currently average approximately. % or midstream energy partnerships. Depending on the
relative stability o cash ows, partnerships will typicallymaintain . - . x cash coverage o their distribution. Adistribution cut or even heightened concern over distribu-tion stability would have a signi cantly adverse impact ona partnership’s unit price, creating another sel -regulatingmechanism that in this case orces management teams tobe prudent with their distributable cash coverage. It is a
testimony to the stability o the underlying cash ows o the midstream sector (here de ned as the toll-road busi-ness models as opposed to those whose margins vary withchanges in commodity prices) that in the entire historyo midstream publicly traded MLPs, there has not been asingle distribution cut (outside one case o outright raud).
In addition to high current yields, the opportunity a ordedby acquisitions and organic growth opportunities hashelped support average per annum distribution growth o
- %, varying within a wide range by individual partner-ship. Te proper way to value an individual MLP is to actorin both the current distributable cash ow, regardless o
the payout, and the ability o the management to growthe distribution through a combination o inherent assetgrowth, organic investment opportunities, and acquisitionsprospects.
Distribution Discount Model
Tus, to arrive at the true air value o an MLP, we believeit is appropriate to begin by determining the cash value o the existing assets. Tis is done with a cash ow analysis(in this case DDM) discounted both or time value and therisk related to the degree o cash ow volatility, which iscaptured in the cost o capital calculation. We believe it isthen appropriate to ascribe some value to the investmentand acquisition optionality inherent in this structure, asnoted above, to sum with the intrinsic value o the underly-ing business and reach an accurate total air value approxi-mation or each partnership.
Investment/Acquisition Optionality
Future investment optionality arises rom a managementteam’s ability to use its regional ranchise monopoly assetsto make high-return investments within their currentlogistics ootprint. Acquisition optionality arises rom theoptimization opportunities and synergies o moving MLP-quali ying assets rom publicly traded corporations andother tax-paying entities to MLPs (as reviewed above, weestimate that there exists at least $ billion o assets thatwould be eligible or this structure). We believe that the op-tionality or each partnership is best derived by running a
multivariate Monte Carlo simulation or the division o theentire opportunity set o acquisitions among each o theMLPs, adjusting each partnership or a number o variablesincluding timing, cost o capital, management propensity
or making acquisitions, and opportunities within exist-ing businesses/geographies. Te simulation must also berun with di erent assumptions regarding what portion o MLP-quali ying assets wil l be placed in new versus existingpartnerships. We believe this multi-step valuation meth-odology provides a more tangible, consistent air value bywhich to make investment decisions.
Even with the signi cant retracement in prices, we believethat this option component has become a ar too signi -cant portion o valuation, and that stock-speci c risk inthe sector still exists with certain companies trading atpremiums to net asset value. Te MLP investment commu-nity appears to justi y this premium to intrinsic value bypointing toward acquisitions that will occur in the uturelargely via “drop downs” rom their parents. We, however,are not impressed. I a partnership’s business strategy is toacquire historically low-¬returning, commodity-sensitive,high-maintenance assets, the cost o equity capital will be
SteelPath Fund AdvisorsMaster Limited Partnership Primer
8/6/2019 MLP Primer
http://slidepdf.com/reader/full/mlp-primer 22/31
in excess o %, not the implied yield given by the securityprice.
Te majority o the investment community calculates eco-nomic bene ts by taking the spread between the security’scurrent yield and the return earned on the asset. A compa-ny’s cost o equity capital does not necessarily bear any rela-tion to its current yield (Microso t does not have a . %cost o equity capital by virtue o its yield, and neither doesa low-yielding, “high-growth” MLP), yet the investmentcommunity’s acquisition analysis continues to re ect thesenumbers. Furthermore, we believe that the acquirer’s truelong-term economic bene ts must take into account theacquired asset’s risk pro le and the commensurate requiredrate o return. I a low-risk, interstate transportationcompany purchases riskier, commodity price-sensitive gas-gathering assets, one cannot use the predecessor company’scost o capital. However, we continue to see the investmentcommunity conduct economic analysis on this basis.
Using an arti cially low and theoretically incorrect cost o equity capital leads to exorbitantly “accretive” transactionsthat o er no true economic bene t to the unitholder overthe long term. A ear we have discussed or years is thatgiven the large premiums to net asset value, a misstep atone o these partnerships could send the stock plummet-
ing more than %, thus harming the cost o capital orthe sector overall, and we have seen that occur to a certainextent in the last two years. We believe such risks place apremium on strong undamental analysis and highlight the
act that nancial “risk” metrics such as betas and leverageratios do not ully capture “port olio risk”.
Te options model approach is an inadequate substitute orselective and qualitative judgment in security selection, butwe believe it provides a strong rational check on predictionso uture growth potential. Having a detailed understand-ing o a management team’s current logistics ootprint andappraisal o its ability to maximize its opportunity set is
crucial to evaluating uture growth. Tere is no substituteor industry ocus and the deep industry relationships that
such ocus a ords when investing in this sector.
Other Relative Price Metrics
Aside rom relative yield, Enterprise Value/EBI DA (EV/EBI DA) and Price/Distributable Cash Flow (P/DCF) met-rics, among others, are also help ul in gauging what near-term market expectations are being re ected in an MLP’sunit price. However, these metrics also ail where relativeyield does, in that they are static and do not ully incorpo-rate uture growth potential nor appropriately discount
or the associated risk o current cash ows. Further, EV/EBI DA can provide very misleading results i not adjustedto account or the impact o the general partner and theIDR cash ows. Much o the analysis provided by Wall
Street ails to make these adjustments and as a result someMLPs appear to be trading at very attractive EV/EBI DAmultiples when in act they are trading at very high mul-tiples versus their peers a ter that ratio is adjust appropri-ately. Although near-term pricing ine ciencies exist due tolimited institutional participation, we believe that the mostcompelling investment theme in this space is to select part-nerships with strong management teams and assets thatare poised to grow signi cantly, and to hold these invest-ments as the growth story plays out over the long term.
Te Re-Birth o the E&P MLPGiven the rst modern day E&P MLP went public in ,this whole section o the primer appears somewhat out o date; however, we still receive many questions on the viabil-ity o the E&P MLP space, both with regard to the currentcompanies, and the prospects or the structure to move intoprominence again.
First consider the basic economic proposition o the E&PMLP. Exploration and Production (E&P) companies typi-cally trade at about - x EBI DA, with market participantsand analysts totally ocused on reserve replacement andproduction growth, which does not avor long-lived assets
with little developmental prospects. E&P MLPs trade at- x EBI DA, given their limited exploration risk and low
decline rate reserves. Tis multiple is lower than pipelineMLPs ( - x), but still creates a meaning ul arbitrageover traditional E&P companies. Te Canadian Royaltytrusts provided an example o this asset bi urcation thatworked quite well. Plus, there is intrinsic logic in an E&Pcompany ocused on its higher risk, higher reward explo-ration program selling its mature, low decline reservesinto a structure where such lower risk is rewarded to und
SteelPath Fund AdvisorsMaster Limited Partnership Primer
8/6/2019 MLP Primer
http://slidepdf.com/reader/full/mlp-primer 23/31
its exploration e orts and the cycle continues as those
reserves mature as well. Te current E&P opportunity set iscomprised o the estimated $ . trillion o value o matureproducing properties in the United States, which is substan-tially larger than the US midstream sector.
Although SteelPath ocuses its port olios on energy in ra-structure partnerships, it has always believed that the MLPstructure would eventually broaden to include a variety o assets such as upstream (E&P), downstream (re ning) andnew technologies (coal gasi cation, LNG regasi cation). In
, we welcomed the new asset diversi cation, providedit was done with higher-quality assets, disciplined man-agement teams, and responsible partnership structuring
(reduced or eliminated incentive distribution rights andhigher distribution coverage, in particular). We believedthat there would be a air amount o pressure on new part-nerships with commodity price sensitivity to hedge a major-ity o such exposure to ensure the stable, sa e distributionsthat MLP investors have come to expect. Te managementteam must also have been highly disciplined in determiningits true maintenance capital expenditures, which shouldbe de ned as the replacement cost o the reserves it isproducing (not the marginal near-term production costs todevelop any proved undeveloped reserves contiguous to itscurrent properties).
We certainly did not nor do we advocate a greater oolsroll-up game. In order or the above trade to make economicsense and create economic value added or the MLP in ques-tion, the acquired assets must be deserving o the highermultiple. Te IRR o the property being purchased mustsatis y the rate o return required by the company’s equityunitholders. Un ortunately, a number o the E&P MLPslaunched in the space over the past years have not adheredto these ideals and many per ormed very poorly.
Another concern pertaining to the E&P MLP is the inherentexposure to commodity prices. SteelPath has always takena very cautious approach to commodity price exposure inour port olios, pre erring partnerships with stable, toll roadbusiness models that provide the same level o cash owswithin extremely wide commodity price bands. Decisionsto invest outside o the in rastructure space are done witha very disciplined approach that requires a high level o duediligence to eel com ortable with uture volumes (provedreserves, long-lived, slow-declining production, new well-connect opportunities, etc.) and the level o cash owprotection (hedging, distribution coverage, subordinationetc.), among a host o other actors. However, we are ar
more concerned with commodity price-sensitive companies
masquerading as “energy in rastructure” (i.e. gas process-ing operations with % percentage-o -proceeds contractsthat are sold to investors as i they had the same risk pro leas interstate pipelines) than we are o actual explorationand production companies alling short o their distribu-tions.
Te re-birth o the E&P MLP highlights an additional risk,perhaps the biggest risk, we see in the MLP space today -- amisunderstanding o an MLP’s equity cost o capital. By thelogic shown in much o today’s sell-side equity research,and by the investors who clearly reward such transac-tions by purchasing additional units, it would appear that
an MLP’s yield is an approximation or its cost o capital. Acquisitions are measured not in terms o economic valueadded, but in terms o “accretion”, a measure o how muchcash ow can be distributed tomorrow. Accretion modelsare run using a company’s cost o debt and the company’scurrent equity yield. Tis, however, is an irrelevant metric.Te true bene t to unitholders must be measured by com-paring the cash return on the purchased asset versus thecost o equity capital measured by the unitholders’ requiredrate o return. By the logic shown in today’s marketplace,Intel (NASDAQ: IN C) should become the consolidator o choice in the midstream space, because with its . % yield,“just think o the accretion.” O course, this is absurd, butit is no less absurd to think o a low-yielding MLP as an ap-propriate acquirer or to use “accretion” as a measure o thebene t o such a transaction.
Fundamental Risks Although we rmly believe in the long-term growth trajec-tory o MLP cash ows and the overall asset class, investingin these vehicles is not without risks. Fundamental risks orMLPs include environmental incidents, terrorist attacks,regulatory changes, tax status changes, demand destruc-tion rom high commodity prices, proli eration o alterna-tive energy sources, inadequate supply o external capital to
und organic growth projects and acquisitions, and con ictso interest with the general partner.
SteelPath Fund AdvisorsMaster Limited Partnership Primer

8/6/2019 MLP Primer
http://slidepdf.com/reader/full/mlp-primer 24/31
Regulatory Risk
Despite being one o the smallest risks rom a probabilityperspective, the ar-reaching e ects o a change in regula-tion makes it one o our most closely ollowed concerns.Over the past two decades, the hallmark o this asset classhas been its tremendous - % cash returns on cashinvested. Meanwhile, gas utilities have earned . % overthe same period, E&P companies have earned . %, and re-
ners have never earned their cost o capital. It is preciselybecause o the ability to leverage their status as e ectiveregional ranchise monopolies through a benign regulatory
ramework that MLPs have been provided an incentive toinnovate and have earned such strong, stable returns com-pared to other energy companies.
Te majority o the assets in the sector are regulated bythe FERC. Tis is a highly politicized organization, and itwould be very di cult or this body to take action thatwould increase the cost o capital to investment in energyin rastructure. From the Energy Policy Act throughMarch , there have been only two substantive changesto the pipeline in ation indexing methodology, and thesehave both been positive or the pipeline owners. Previously,every July , pipeline tari s had been increased by PPIminus %; beginning in this became solely PPI. OnMarch , , this adjustment was urther increased toPPI + . % or the prospective ve years. Tis methodologyallows a partnership’s unitholders to bene t rom technol-ogy and e ciency gains and the associated cost cutting thatimproves returns, unlike a traditional utility, where returns
rom such improvements would likely be shared with cus-tomers in the next rate case.
As part o the a orementioned process this year, the DOweighed in with the FERC with the concern that there isserious under-investment in petroleum products in ra-structure and that several pipeline systems o nationalimportance lack redundancy. Because the inelastic demand
or transportation uel means that even relatively smallcapacity short alls can have disproportionately large priceimpacts, the DO intones that providing a strong return oncapital or pipeline operators and the incentive to properlymaintain excess capacity is imperative. Te FERC is a politi-cally driven organization like many government-appointedagencies, and we believe that the pervasive dynamicsthroughout the legislative and regulatory channels wouldmake any changes that increase the cost o capital politi-cally un easible under any regime.
Because o the positive e ects o the current regulatory
environment, we believe this is the single most signi cantrisk to the sector’s ongoing long-term cash ow growthtrajectory. Tat being said, we view the likelihood o such achange as inordinately small.
Demand-Side Troughput Risks
Since the oil crises o the s, re ned petroleum prod-ucts and natural gas demand have risen at a predictable
. % annual rate. Leveraging this modest “sales growth”with in ationary pricing power through a xed-cost assetis all that an MLP needs to steadily increase its cash owsat mid-single-digit rates over time. Stagnation in energydemand would substantially injure a pipeline’s ability toincrease its cash ows over time. Tere are several potentialrisks to energy demand continuing to grow at its ore-casted rate over the next two decades, including customerconservation rom rising commodity prices and emissionsconcerns, as well as the introduction o alternative energysources. Nearly % o petroleum products’ pipeline ship-ments are retail gasoline shipments, i.e. people commut-ing to work, and parents driving their children to schooland to soccer practice. Te demand or such uses is highlyinelastic. Even or signi cantly longer trips (e.g. driving the
amily to Disney World), a doubling or tripling o currentgasoline prices does not create competition between drivingand taking the train or ying. However, at some marginalpoint, this could result in certain amilies not takingsuch vacations and a corresponding drop in consumption.Demographics are a very power ul orce however, and thenumber o Americans living in the suburbs and commutingto the workplace continues to expand. As the populationcontinues to expand southward and westward, this will puta substantial number o new drivers on the road. As a resulto these demographic trends, we believe that a sustainedperiod o minimum $ per barrel oil would be needed topush demand sideways permanently, with new amilies anddrivers and their necessary driving needs o setting the
losses o more super uous driving habits.
Although hybrids are available or purchase today, andother alternative energy vehicles are currently being devel-oped, there will be a substantial period o time be ore thecost o such vehicles allows them to be manu actured ora mainstream audience. Also, we would note that we ullyexpect certain pipelines that are currently in service orpetroleum products or natural gas to be converted to hydro-gen and other alternative energy sources. Just as decades
SteelPath Fund AdvisorsMaster Limited Partnership Primer
8/6/2019 MLP Primer
http://slidepdf.com/reader/full/mlp-primer 25/31
ago many o today’s interstate and intrastate natural gaslines were previously in crude oil service, we expect bothpetroleum products and natural gas lines to be converted toother types o service over time, and believe that competi-tion rom alternative uels will not necessarily be detrimen-tal to MLP cash ows.
Supply Asset-Speci c Risks
Although concerns typically ocus on the demand side o the throughput equation, without adequate product sup-plies there will be no pipeline shipments. Te majority o pipeline products ows are highly diversi ed as supplies
are aggregated rom several re nery complexes. Tereare certain partnerships that are dependent on speci cre neries or product ows, but generally speaking thosere neries have access to a diverse group o domestic andinternational sources, whether they are by pipeline import
rom the Canadian oil sands or by tanker at the LouisianaO shore Oil Port. Te more diverse the re nery sources andthe greater the variety o imported crude oils, the lower thesupply side risk.
Natural gas sources are largely in North America, andalthough LNG is a growing actor, there are not enough im-port terminals or volumes or this to be considered a truly
diversi ed source. Te closer that the wellhead is to thenatural gas transportation system, the greater the through-put risks. ypically, large interstate pipelines have sucha diversity o supply sources across regions, e.g. onshore
exas, Louisiana, and the Gul o Mexico, that there is highvisibility to long-term supply availability as well as even-tual LNG additions. Gas-gathering systems and intrastatepipelines have signi cantly greater reservoir risk; i the ge-ology o a particular eld does not live up to expectations,volumes may su er.
Macro Supply Disruptions
Te US imports nearly three-quarters o its end-use con-sumption via crude oil and re ned petroleum products.Because throughput is one o the primary determinants toMLP cash ows regardless o the demand situation, i thereis not su cient product to place in a pipeline, MLPs will beunable to collect their toll-road revenues or transporta-tion. A substantial reduction in Middle Eastern oil supply,whether voluntarily or due to un oreseen circumstancessuch as a terrorist attack, would have the potential to harmcash ows or an extended period depending on the extent
o the damage or length o voluntary production suspen-sion.
Environmental Accidents
Nearly all MLPs carry comprehensive environmental insur-ance coverage with relatively low deductibles to cover anyproduct spills that may occur. Because they specialize in op-timizing midstream assets and understand the importanceo proper maintenance capital expenditures to asset andresulting cash ow longevity, MLPs have strong sa ety andoperating track records, and there have not been any mate-rial environmental accidents that have impacted the cash
ow and distribution-paying ability o any partnership.
errorism
Material terrorist disruption o US midstream energyin rastructure would be di cult. We make the analogyo a terrorist threat to destroy a US highway: there are somany millions o miles o road, the probability o a threatis minimal and the likely impact to the overall transporta-tion system is muted. Also, it is a relatively simple task toreplace a pipeline segment that has been damaged by anexplosion or otherwise. Tis can typically be accomplishedin a period o days. I , or example, in the case o a naturalgas pipeline explosion there were deaths involved, or in thecase o a petroleum products line a natural disaster such asa ood was involved, the restart time may stretch to a ullweek, but would still have minimal cash ow impact to acompany. Some MLPs carry terrorism insurance on certainkey assets, but most MLPs do not carry any orm o terror-ism insurance, and we believe that this is a prudent courseo action given repair costs and turnaround time relative topremiums.
We believe a more likely and detrimental terrorist threatwould actually be on downstream in rastructure, such asa re nery complex that supplies a given pipeline. However,all MLPs carry business interruption insurance (typicallye ective a ter days), and because the terrorist attackwould not be on the MLP’s asset base, this disruption inproduct ows would be covered by business interruptioninsurance, just as disruption o product ows or a naturaldisaster such as a hurricane would be similarly covered.
SteelPath Fund AdvisorsMaster Limited Partnership Primer
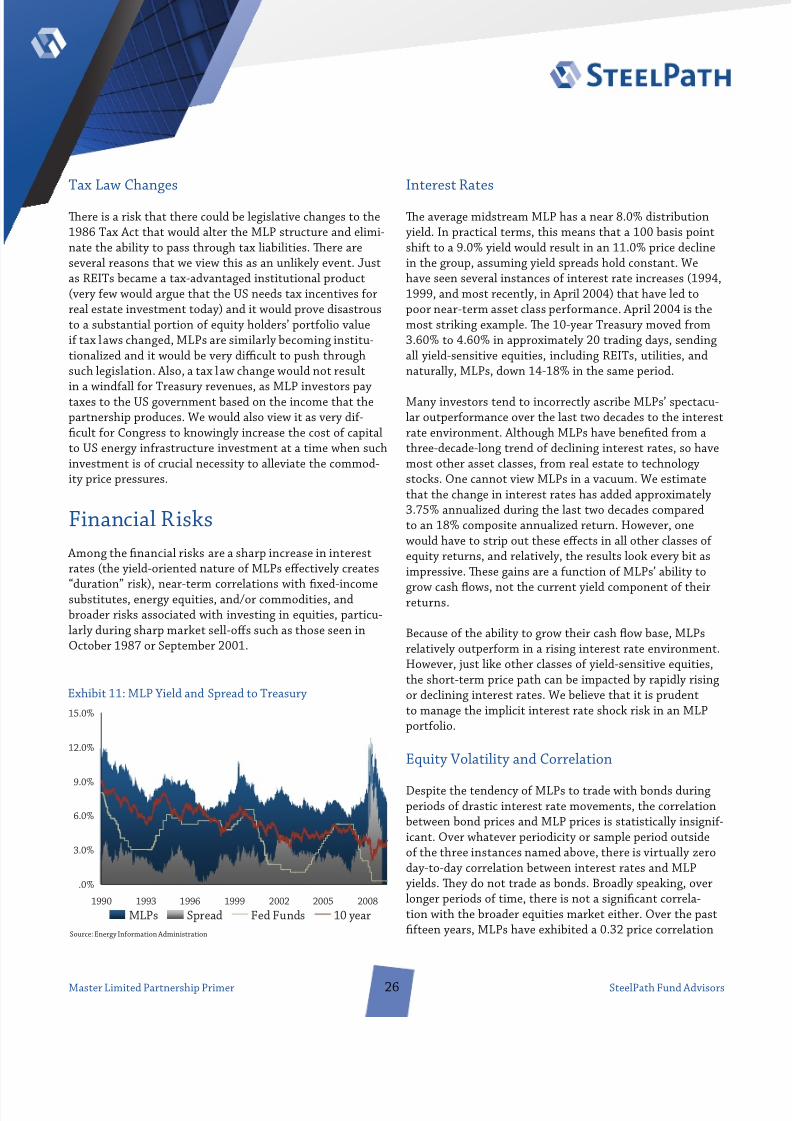
8/6/2019 MLP Primer
http://slidepdf.com/reader/full/mlp-primer 26/31
ax Law Changes
Tere is a risk that there could be legislative changes to the ax Act that would alter the MLP structure and elimi-
nate the ability to pass through tax liabilities. Tere areseveral reasons that we view this as an unlikely event. Justas REI s became a tax-advantaged institutional product(very ew would argue that the US needs tax incentives orreal estate investment today) and it would prove disastrousto a substantial portion o equity holders’ port olio valuei tax laws changed, MLPs are similarly becoming institu-tionalized and it would be very di cult to push throughsuch legislation. Also, a tax law change would not result
in a wind all or reasury revenues, as MLP investors paytaxes to the US government based on the income that thepartnership produces. We would also view it as very di -
cult or Congress to knowingly increase the cost o capitalto US energy in rastructure investment at a time when suchinvestment is o crucial necessity to alleviate the commod-ity price pressures.
Financial Risks Among the nancial risks are a sharp increase in interestrates (the yield-oriented nature o MLPs e ectively creates
“duration” risk), near-term correlations with xed-incomesubstitutes, energy equities, and/or commodities, andbroader risks associated with investing in equities, particu-larly during sharp market sell-o s such as those seen inOctober or September .
Interest Rates
Te average midstream MLP has a near . % distributionyield. In practical terms, this means that a basis pointshi t to a . % yield would result in an . % price declinein the group, assuming yield spreads hold constant. Wehave seen several instances o interest rate increases ( ,
, and most recently, in April ) that have led topoor near-term asset class per ormance. April is themost striking example. Te -year reasury moved rom
. % to . % in approximately trading days, sendingall yield-sensitive equities, including REI s, utilities, andnaturally, MLPs, down - % in the same period.
Many investors tend to incorrectly ascribe MLPs’ spectacu-lar outper ormance over the last two decades to the interestrate environment. Although MLPs have bene ted rom athree-decade-long trend o declining interest rates, so havemost other asset classes, rom real estate to technologystocks. One cannot view MLPs in a vacuum. We estimatethat the change in interest rates has added approximately
. % annualized during the last two decades comparedto an % composite annualized return. However, onewould have to strip out these e ects in all other classes o equity returns, and relatively, the results look every bit asimpressive. Tese gains are a unction o MLPs’ ability to
grow cash ows, not the current yield component o theirreturns.
Because o the ability to grow their cash ow base, MLPsrelatively outper orm in a rising interest rate environment.However, just like other classes o yield-sensitive equities,the short-term price path can be impacted by rapidly risingor declining interest rates. We believe that it is prudentto manage the implicit interest rate shock risk in an MLPport olio.
Equity Volatility and Correlation
Despite the tendency o MLPs to trade with bonds duringperiods o drastic interest rate movements, the correlationbetween bond prices and MLP prices is statistically insigni -icant. Over whatever periodicity or sample period outsideo the three instances named above, there is virtually zeroday-to-day correlation between interest rates and MLPyields. Tey do not trade as bonds. Broadly speaking, overlonger periods o time, there is not a signi cant correla-tion with the broader equities market either. Over the past
teen years, MLPs have exhibited a . price correlation
SteelPath Fund AdvisorsMaster Limited Partnership Primer
Exhibit : MLP Yield and Spread to reasury
Source: Energy In ormation Administration
.0%
3.0%
6.0%
9.0%
12.0%
15.0%
1990 1993 1996 1999 2002 2005 2008MLPs Spread Fed Funds 10 year
8/6/2019 MLP Primer
http://slidepdf.com/reader/full/mlp-primer 27/31
with the S&P Index, because their cash ows are notsensitive to the vicissitudes o the general economy and thenews that moves the broader markets. What are MLPs cor-related with on a short-term basis then?
Te most indicative measure is the hopes and ears o theretail equity investor. Te retail investor is likely to grasppassing themes in the marketplace and use these as thetrigger to increase or decrease their marginal MLP expo-sure. For example, in August , equities markets hittheir bottom o the year and investors were concerned thatgrowth had slowed and that the economy was rolling over.During that month, there was a . correlation betweenMLPs and the S&P . Over the last two years, or the rsttime in two decades, MLPs are highly correlated with oiland gas securities even though their cash ows generallyhave no direct exposure to commodity prices. Since Novem-ber , we have periodically witnessed a statistically sig-ni cant correlation between MLPs and energy stocks. On aday-to-day basis, this unds ow activity has been drivingMLP prices. Over the long-term, this day-to-day volatilitywill not a ect the cash ows and long-term price path o MLP investments, but it can cause signi cant week-to-weekand month-to-month volatility that will necessarily beincongruous with the group’s undamentals.
Equity CrisesDuring times o severe equity stress (October , Sep-tember , October -March ), MLPs historical-ly su ered similar shocks despite generating cash ows thatare unlikely to be a ected by the perceived stress that hasbeen placed on the economy that caused the shock. Despitehaving solid distributions and yields that will be movingtoward increasingly large spreads to reasuries (that typi-cally rally during periods o equity crisis) MLPs languish orperiods o time ollowing substantial allout in the broaderequities market.
SteelPath Fund AdvisorsMaster Limited Partnership Primer
8/6/2019 MLP Primer
http://slidepdf.com/reader/full/mlp-primer 28/31
A History o the Creation o MLPs
Limited partnerships (LPs), the closest predecessors toMLPs, rose to prominence ollowing the passage o the Eco-nomic ax Recovery Act o , which established a verygenerous -year cost recovery period or all real estateassets. Te new tax code provisions marked the beginningo a period o rapid growth in the number o real estate LPsdesigned as tax shelters. Tese partnerships purchased realestate properties on signi cant leverage and depreciatedtheir properties using the newly established accelerated
cost recovery system (ACRS), leading to substantial taxwrite-o s. Although these partnerships were marketedas conservative, capital-appreciating investment vehicles,their eventual allout suggests that very ew were run withlong-term economic pro tability as a motive.
High net worth individuals purchased interests in theseprivate or non-publicly traded LPs to o set taxable incomegenerated by other sources such as salaries, dividends,interest, and investment income. Tese limited partnerswere considered passive investors, because they were notinvolved in the day-to-day active management o thepartnership and assumed no personal liability beyond their
original investment.
During the same period, there were a number o E&Ppartnerships with rapidly depleting asset bases that weremarketed to high net-worth individuals who did not realizeboth the commodity price dependence nor the depletingnature o the underlying resource. Many o these E&Pcompanies went bankrupt as a result o a turn in commod-ity prices and the lack o a productive resource base. Teseearly oil and gas partnerships le t a bad taste in many inves-tors’ mouths and prejudiced them against the structure oryears to come, as they lumped any energy- ocused part-nership in the same group with these ailed enterprises.
oday’s MLP is very di erent rom these ailed commodityprice-dependent, depleting reservoir partnerships o theearly s that hurt so many investors.
Five years later, President Ronald Reagan signed into lawthe ax Re orm Act o ( RA), which cracked down onthe proli eration o real estate tax shelters and establishedthe oundation or the modern MLP. Te modi ed acceler-ated cost recovery system replaced the ACRS, and the costrecovery period was extended to . years or residential
real estate and . years or nonresidential property. RAeliminated the pre erential tax rate on capital gains andlowered overall marginal tax rates, reducing the value o the deductions taken through tax shelters.
RA Section extended the capital-at-risk limitations o the tax code to real estate tax shelters, preventing limitedpartners rom increasing their cost basis or their share o the partnership’s debt unless they were personally liable orrepayment. Since limited partners generally provided non-recourse nancing and were only liable or their investedcapital, they were no longer able to record tax losses anddeductions on their personal tax returns that signi cantlyexceeded their investment, as had been done or the pastseveral years.
But what really led to the demise o the tax shelters wasRA Section , which prohibited passive investors rom
using partnership losses to o set taxable income romother sources, i.e. the very thing that the real estate taxshelters were created to do or their high net worth inves-tors. Te only partnerships that would survive under thenew law were those with mature assets that actually gener-ated passive income.
While R A established the structural boundaries or LPs,the Revenue Act o created the business or operatingboundaries, eliminating the special tax status or all exceptthose engaged in natural resource activities. In addition,
RA speci ed that publicly traded partnerships engagedin the exploration, marketing, mining , processing, produc-tion, re ning, storage, or transportation o any mineralor natural resource would not pay ederal taxes in order toencourage investment in US energy in rastructure. General/Limited Partner Structure
MLPs have two classes o ownership – GPs and LPs. GPsmanage the partnership’s operations, receive incentivedistribution rights (IDRs), and generally maintain a %economic stake in the partnership. LPs are not involved inthe operations o the partnership and have limited liability,much like the shareholder o a publicly traded corporation.
IDRs provide GPs with the necessary incentive to growtheir MLPs’ distributions and consequently raise their ownquarterly cash distributions. Te partnership agreement
SteelPath Fund AdvisorsMaster Limited Partnership Primer
Appendix
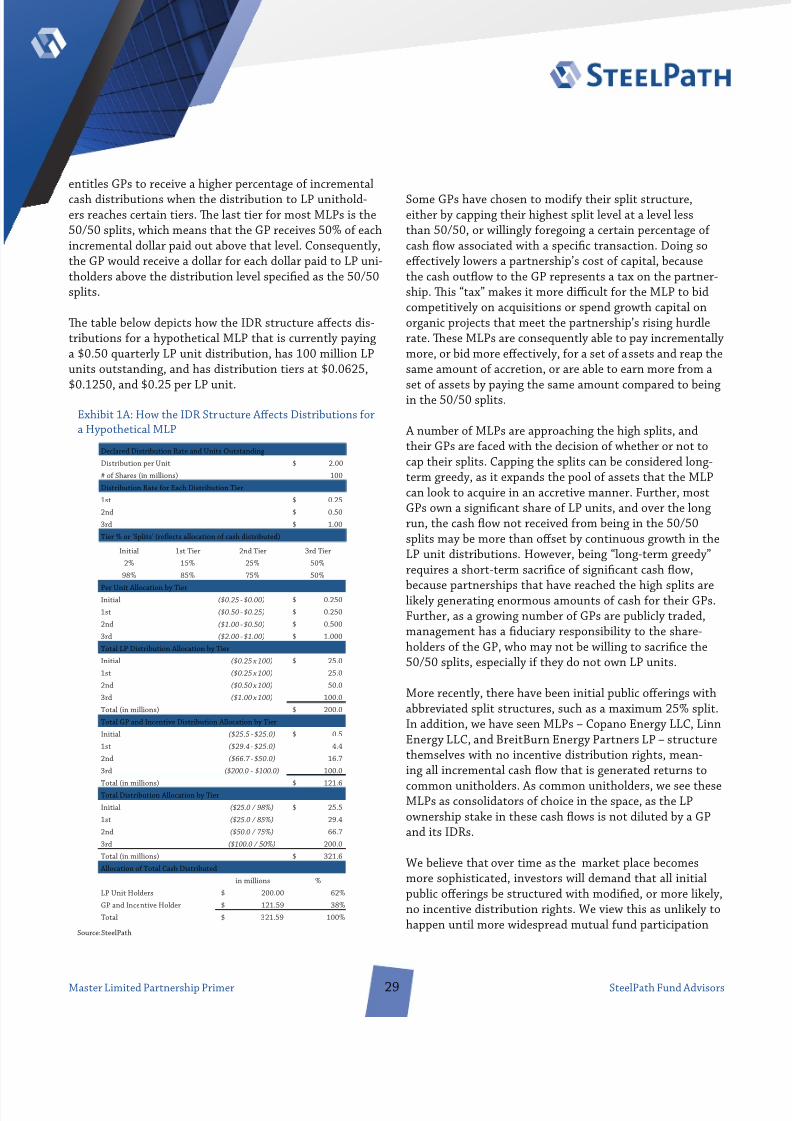
8/6/2019 MLP Primer
http://slidepdf.com/reader/full/mlp-primer 29/31
entitles GPs to receive a higher percentage o incrementalcash distributions when the distribution to LP unithold-ers reaches certain tiers. Te last tier or most MLPs is the
/ splits, which means that the GP receives % o eachincremental dollar paid out above that level. Consequently,the GP would receive a dollar or each dollar paid to LP uni-tholders above the distribution level speci ed as the /splits.
Te table below depicts how the IDR structure a ects dis-tributions or a hypothetical MLP that is currently payinga $ . quarterly LP unit distribution, has million LPunits outstanding, and has distribution tiers at $ . ,$ . , and $ . per LP unit.
Some GPs have chosen to modi y their split structure,either by capping their highest split level at a level lessthan / , or willingly oregoing a certain percentage o cash ow associated with a speci c transaction. Doing soe ectively lowers a partnership’s cost o capital, becausethe cash out ow to the GP represents a tax on the partner-ship. Tis “tax” makes it more di cult or the MLP to bidcompetitively on acquisitions or spend growth capital onorganic projects that meet the partnership’s rising hurdlerate. Tese MLPs are consequently able to pay incrementallymore, or bid more e ectively, or a set o assets and reap thesame amount o accretion, or are able to earn more rom aset o assets by paying the same amount compared to beingin the / splits.
A number o MLPs are approaching the high splits, andtheir GPs are aced with the decision o whether or not tocap their splits. Capping the splits can be considered long-term greedy, as it expands the pool o assets that the MLPcan look to acquire in an accretive manner. Further, mostGPs own a signi cant share o LP units, and over the longrun, the cash ow not received rom being in the /splits may be more than o set by continuous growth in theLP unit distributions. However, being “long-term greedy”requires a short-term sacri ce o signi cant cash ow,
because partnerships that have reached the high splits arelikely generating enormous amounts o cash or their GPs.Further, as a growing number o GPs are publicly traded,management has a duciary responsibility to the share-holders o the GP, who may not be willing to sacri ce the
/ splits, especially i they do not own LP units.
More recently, there have been initial public o erings withabbreviated split structures, such as a maximum % split.In addition, we have seen MLPs – Copano Energy LLC, LinnEnergy LLC, and BreitBurn Energy Partners LP – structurethemselves with no incentive distribution rights, mean-ing all incremental cash ow that is generated returns to
common unitholders. As common unitholders, we see theseMLPs as consolidators o choice in the space, as the LPownership stake in these cash ows is not diluted by a GPand its IDRs.
We believe that over time as the market place becomesmore sophisticated, investors will demand that all initialpublic o erings be structured with modi ed, or more likely,no incentive distribution rights. We view this as unlikely tohappen until more widespread mutual und participation
SteelPath Fund AdvisorsMaster Limited Partnership Primer
Exhibit A: How the IDR Structure A ects Distributions ora Hypothetical MLP
Source: SteelPath
Declared Distribution Rate and Units Outstanding
Distribution per Unit 2.00$
# of Shares (in millions) 100
Distribution Rate for Each Distribution Tier
1st 0.25$
2nd 0.50$
3rd 1.00$
Tier % or 'Splits' (reflects allocation of cash distributed)
Initial 1st Tier 2nd Tier 3rd Tier
2% 15% 25% 50%
98% 85% 75% 50%
Per Unit Allocation by TierInitial ($0.25 - $0.00) 0.250$
1st ($0.50 - $0.25) 0.250$
2nd ($1.00 - $0.50) 0.500$
3rd ($2.00 - $1.00) 1.000$
Total LP Distribution Allocation by Tier
Initial ($0.25 x 100) 25.0$
1st ($0.25 x 100) 25.0
2nd ($0.50 x 100) 50.0
3rd ($1.00 x 100) 100.0
Total (in millions) 200.0$
Total GP and Incentive Distribution Allocation by Tier
Initial ($25.5 - $25.0) 0.5$
1st ($29.4 - $25.0) 4.4
2nd ($66.7 - $50.0) 16.7
3rd ($200.0 - $100.0) 100.0
Total (in millions) 121.6$Total Distribution Allocation by Tier
Initial ($25.0 / 98%) 25.5$
1st ($25.0 / 85%) 29.4
2nd ($50.0 / 75%) 66.7
3rd ($100.0 / 50%) 200.0
Total (in millions) 321.6$
Allocation of Total Cash Distributed
in millions %
LP Unit Holders 200.00$ 62%
GP and Incentive Holder 121.59$ 38%
Total 321.59$ 100%
8/6/2019 MLP Primer
http://slidepdf.com/reader/full/mlp-primer 30/31
occurs, as these investment managers will demand to knowwhy they are giving up such a signi cant portion o the
uture cash ows, and price IPOs accordingly.
Income ax reatment
Given the stable cash generation o most MLP businessmodels, these partnerships are able to return a majorityo their excess cash ow back to unitholders. Tis returno capital has become the cornerstone o MLPs, as inves-tors have come to expect stable cash ows and dependableyields. In addition to stable, cash-generating assets, MLPsdo not pay corporate taxes and, consequently, are able
to pass on a greater portion o earnings to their limitedpartner unitholders. Unlike the dividends paid by corpora-tions, MLP distributions are considered % return o capital, and there ore are not taxable, and remain so untileither: ( ) the investor sells his units, or ( ) his adjustedbasis in the units reaches zero. Any capital appreciationwill be taxed at the capital gains rate (assuming the unitsare held or more than one year), but the portion resulting
rom downward basis adjustments (e.g. depreciation) willbe recaptured as ordinary income.
Instead o paying tax on the cash distributions received,the investor pays tax on his share o the partnership’s
taxable income, which is a combination o revenue earned,operating costs, and various deductions such as deprecia-tion that signi cantly reduce his tax burden. In the initialyears o ownership, because o the election that allowspartnerships to adjust their inside basis or new partners,a partnership will typically generate close to zero tax-able income or new investors. For several years, allocatedtaxable income will typically equal - % o the cashdistributions received. Tis income allocation cannot beused to o set passive losses rom other investments, butother investment expenses can be deducted rom it i thesame MLP’s passive income and loss result in a net positive,called port olio income. Net losses rom an MLP are con-sidered passive losses and cannot be deducted rom taxableincome, but can be carried orward into uture tax years toreduce an investor’s share o taxable income rom the sameMLP. Any losses remaining a ter the sale by an investor o his MLP units can be used to o set other income in thattax year. When an investor les his taxes, he will receive aSchedule K- rom the MLP, which will identi y his shareo the partnership’s income and losses. Distributions thatexceed an investor’s outside basis will be taxed at the capi-tal gains rate as return o capital. Te investor’s allocated
income will vary depending on the partnership’s operatingearnings, deductions, and credits, and generally in practicehe will continue to receive a modest “shield” relative to hisdistribution.
Every time that an MLP makes an acquisition or an invest-ment, the investor is allocated additional depreciation onthat investment, which creates a tax shield that will contin-ue as long as the MLP continues to invest new money. Tedepreciation shield has two components, the underlyingbasis o the assets, and the depreciation o the investor’sbasis in the stock, so typically the partner wil l continue toreceive depreciation to the extent that the partnership hasincome.
US tax-exempt investors, including pension unds andIRAs, generally cannot own MLPs as they will generateUB I or the investor. Foreign investors generally do notown MLPs because they are subject to FIRP A (Foreign In-vestment in Real Property ax Act), which requires them to
le a US tax return and pay income taxes on capital gains o securities bought and sold on US securities exchanges (un-like or example, buying and selling Microso t, which wouldonly be taxed in the investor’s country o origin). Troughcorporate blocker structures (e.g. a C-Corporation taxablestructure) and other more tax-e cient o shore vehicles,
both U.S. tax exempts and oreign capital can enter theMLP market place.
SteelPath Fund AdvisorsMaster Limited Partnership Primer
8/6/2019 MLP Primer
http://slidepdf.com/reader/full/mlp-primer 31/31
DisclaimersNo Investment Advisory Relationship
SteelPath is a ederally registered investment advisor. Your receipt o , or access to, this research report does not by itsel create an investmentadvisory relationship between you and SteelPath. SteelPath only o ers investment advisory services pursuant to written agreements with theFunds.
Tis report should not be construed to provide tax, legal or any other advice.
Tis Investor Letter Is not a Recommendation or Solicitation
Tis report does not represent a recommendation to undertake transactions in MLPs, and is provided as a courtesy, at no charge, and or in or-mational purposes only. Tis report is intended to provide a broad overview o MLPs, and does not contain, or purport to contain, the level o detail necessary to give su cient basis to an investment decision with respect to any speci c security by any one person. Tis report does notconstitute, and does not represent to be, an o er to buy or sell a security or a solicitation to do so, including with respect to the Funds.
Research May Not be Current; No Warranties
Tere is no representation that the in ormation is accurate, complete or current, or that it re ects the current opinion or all in ormation knownto SteelPath, its principals, or a liates.
SteelPath expressly disclaims any obligation to update the contents o this research report to re ect developments in the MLP sector, includingwith regards to industry trends or changes in the applicable tax or regulatory ramework that could have a signi cant impact on MLP securityprices or investment desirability.
Securities or Classes o Securities Discussed in Research Reports May Not Be Suitable Investments
Some or all o the securities or classes o securities discussed in this research report may be speculative or high risk or otherwise unsuitable ormany investors. Neither SteelPath nor any o its a liates makes any representation or investigation as to the suitability o any securities orindividual investors. Investors must make their own determination as to the suitability o such investments, based on actors including theirinvestment objectives, nancial position, liquidity needs, tax status, and level o risk tolerance.
Investing in equity securities involves a high degree o risk and is only suitable or persons who can a ord to sustain a signi cant loss o theirinvestment. In addition, interests in MLPs involve material income tax risks and certain other risks.
Investors should not construe the per ormance o any past investment or past returns as providing any assurances regarding the uture per or-mance o the energy MLP sector.
Copyright; No Unauthorized Redistribution
Tis research report was prepared by SteelPath and is under protection o the copyright laws. Neither the whole nor any part o this materialmay be duplicated in any orm or by any means. Tis material may not be redistributed or disclosed to anyone without the prior SteelPath’sprevious written consent.
Stated gures are third party reported statistics or certain indices and are not directly related to the Fund. It is not possible to invest di-rectly in an index. MLPs yields are represented by the published yield o the Alerian MLP Index, REI yields by the published yield o the DowJones U.S. Real Estate Index, Utility yields by the published yield o the Utilities Select Sector o the S&P Index, Municipal Bonds by thepublished yield-to-worst o the Barclays Municipal Bonds Index, and Fixed Income yields by the Barclays Aggregate Bond Index. Te S&P ® Index is an unmanaged index o stocks, bonds or mutual unds. Te Russell ® Index is an unmanaged index o stocks, bonds or mutual
unds. NASDAQ Composite Index is an unmanaged index o stocks, bonds or mutual unds. Te Dow Jones Industrial Average is an unmanagedindex o stocks, bonds or mutual unds. Index per ormance does not re ect the deduction o any ees or expenses. Yield is no assurance theMLPs will deliver a higher total return than REI S, Utilities, or Municipal Bonds.
Must be preceded or accompanied by a prospectus for the SteelPath Funds.
Te SteelPath Funds are distributed by UMB Distribution Services LLC West Michigan Street Milwaukee WI
Related Documents