CONFIDENTIAL – NOT FOR PUBLICATION OR REDISTRIBUTION This is not an offering and is provided for informational purposes only. Cushing ® MLP Asset Management, LP Swank Capital, LLC 8117 Preston Road, Suite 440 Dallas, Texas 75225 214.692.6334 www.swankcapital.com January 2012 MLP Overview Presentation for CFA Society of San Antonio Presented by: Libby F. Toudouze Partner and Portfolio Manager Adam C. Evans, CIMA Senior Vice President, Institutional Business Development

Welcome message from author
This document is posted to help you gain knowledge. Please leave a comment to let me know what you think about it! Share it to your friends and learn new things together.
Transcript
CONFIDENTIAL – NOT FOR PUBLICATION OR REDISTRIBUTION
This is not an offering and is provided for informational purposes only.
Cushing® MLP Asset Management, LPSwank Capital, LLC8117 Preston Road, Suite 440Dallas, Texas 75225214.692.6334www.swankcapital.com
January 2012
MLP Overview Presentation for CFA Society of San Antonio
Presented by:Libby F. ToudouzePartner and Portfolio Manager
Adam C. Evans, CIMASenior Vice President, Institutional Business Development
2
Disclosures
Cushing® MLP Asset Management, LP, which is an investment adviser registered with the Securities and Exchange Commission under the Investment Advisers Act of 1940 (“Cushing”) is a wholly-owned subsidiary of Swank Capital, LLC.
All information provided herein is for informational purposes only and should not be relied upon to make an investment decision. Past performance results relate only to the time periods indicated and are not at indication of, nor a reliable proxy for future performance. This presentation is being furnished on a confidential basis to the recipient, and is neither an offer to sell nor a solicitation of any offer to buy any securities, investment products or investment advisory services. The information contained in this document is the most recent information available to Cushing (except otherwise noted), however all of the information herein is subject to change without notice. Certain information included in this document is based on information obtained from sources considered to be reliable, however no representation may be made with respect to the accuracy or completeness of such data.
Certain information contained in this presentation may constitute “forward-looking” statements, which can be identified by the use of forward-looking terminology such as “may,” “will,” “should,” “expect,” “estimate,” or “believe” or other variations thereof. Due to various risks and uncertainties, actual events or results may differ materially from those reflectedor contemplated in such forward-looking statements.
This presentation is not an advertisement and is not intended for public use or distribution and is intended exclusively for theuse of the person to whom it has been delivered by Cushing®. This presentation is not to be reproduced or redistributed to any other person without the prior consent of Cushing®.
3
Table of Contents
I. Master Limited Partnership (MLP) Basics Pages 4 – 7
II. MLP Asset Class Overview Pages 8 – 12
III. The Case for MLP Investing Today Pages 13 – 17
IV. MLP Solution for Institutional Portfolios Pages 18– 23
V. Appendix Pages 24 – 28

I. Master Limited Partnership (MLP) Basics
4
55
Energy Infrastructure MLPs
What are MLPs?
« Structured as a limited partnership, not a corporation
« Own, maintain and operate the energy infrastructure of North America
« Trade on public exchanges
« Generate high free cash flow paid out quarterly to investors
« Possess the potential for growth
Why are they called MLPs?
« Energy infrastructure companies have the advantage of using the Master Limited Partnership structure instead of a corporate structure, so they pay no corporate level taxes.
« Since the majority of energy infrastructure companies are structured as MLPs, the asset class is now referred to as the MLP sector.
6
Downstream
Product Uses
Commercial
Industrial
Residential
Refining
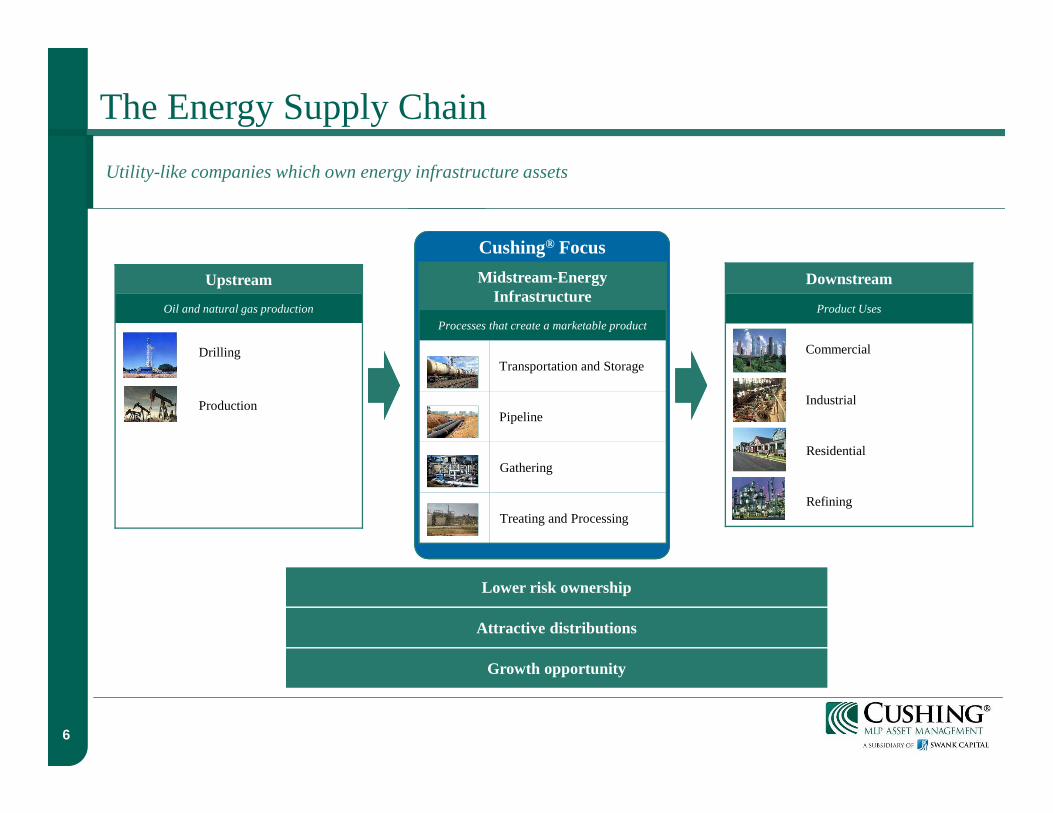
Upstream
Oil and natural gas production
Drilling
Production
Cushing® Focus
The Energy Supply Chain
Utility-like companies which own energy infrastructure assets
Midstream-Energy Infrastructure
Processes that create a marketable product
Transportation and Storage
Pipeline
Gathering
Treating and Processing
Lower risk ownership
Attractive distributions
Growth opportunity

7
MLP Subsector Descriptions
Natural Gas Gatherers and Processors
These MLPs gather and process natural gas in the field and process it by removing and separating natural gas liquids (NGLs) to make the gas acceptable to transport on gas transmission lines. Contracts range from fee based (no commodity exposure) to keep whole, which has exposure to the spread between NGLs and natural gas.
Natural Gas TransportationNatural gas transportation pipelines are generally large diameter interstate pipelines used for long-distance transportation. With stable revenues (contracts are largely “take or pay”), natural gas transportation pipelines receive natural gas from gathering systems and other pipelines and deliver it to industrial end users, utility companies, or storage facilities.
Natural Gas Storage Natural gas storage MLPs own, operate and manage natural gas storage facilities and provide interconnectivity to transportation pipelines. They primarily lease storage capacity to customers under long term contracts (3-5 years) and have minimal exposure to commodity prices.
Crude Oil TransportationCrude oil MLPs are engaged in the transportation, storage, blending, terminalling and marketing of crude oil and crude oil derivative products. They transport crude for a fee from the wellhead (supply regions) to refineries or other end users of crude oil (demand region) without taking title to the product limiting their commodity exposure.
Refined Products Pipelines and Terminals
Refined products pipelines are common carrier transporters of refined petroleum products, such as gasoline, diesel fuel and jet fuel. Primary pipeline customers are refiners and marketers of the product being shipped. End-user destinations include airports, rail yards, and terminals/truck racks, for further distribution to retail outlets.
CoalThe universe of coal MLPs consist of three coal producers and two coal royalty businesses that own, lease, and manage coal reserves. The royalty-oriented partnerships enter into long-term leases that provide the coal operators the right to mine coal reserves on the partnerships’ properties in exchange for royalty payments.
Propane Propane MLPs distribute propane via truck to residential, commercial, industrial, and agricultural customers.
UpstreamUpstream MLPs are focused on the exploitation, development, and acquisition of oil and natural gas producing properties. These partnerships produce oil and natural gas at the wellhead for sale to various third parties. Typically, upstream MLPs do not partake in exploratory drilling, but rather own and operate assets in mature basins that exhibit low decline rates and long reserve lives.
Shipping and TransportationShipping MLPs transport energy products primarily via tankers or barges. Products shipped typically include refined petroleum products and by-products such as gasoline, heating oil, diesel fuel, jet fuel, lubricants, asphalt, fuel oil, sulfur, petrochemical and commodity specialty products, liquefied natural gas, and crude oil.
“Pure-Play” General Partnerships General partnerships own and operate the assets of an underlying MLP. Generally, GPs will own a 2% general partner interest with incentive distribution rights. GPs vary on number of common units owned, levels of debt, tax structure and other considerations.
“Diversified” General Partnerships Diversified general partnerships own the GP of MLPs and are generally structured as “C-Corps”. They are involved in other business operations that are separate from those of the underlying MLP (e.g. WMB, OKE, etc).
II. MLP Asset Class Overview
8
99
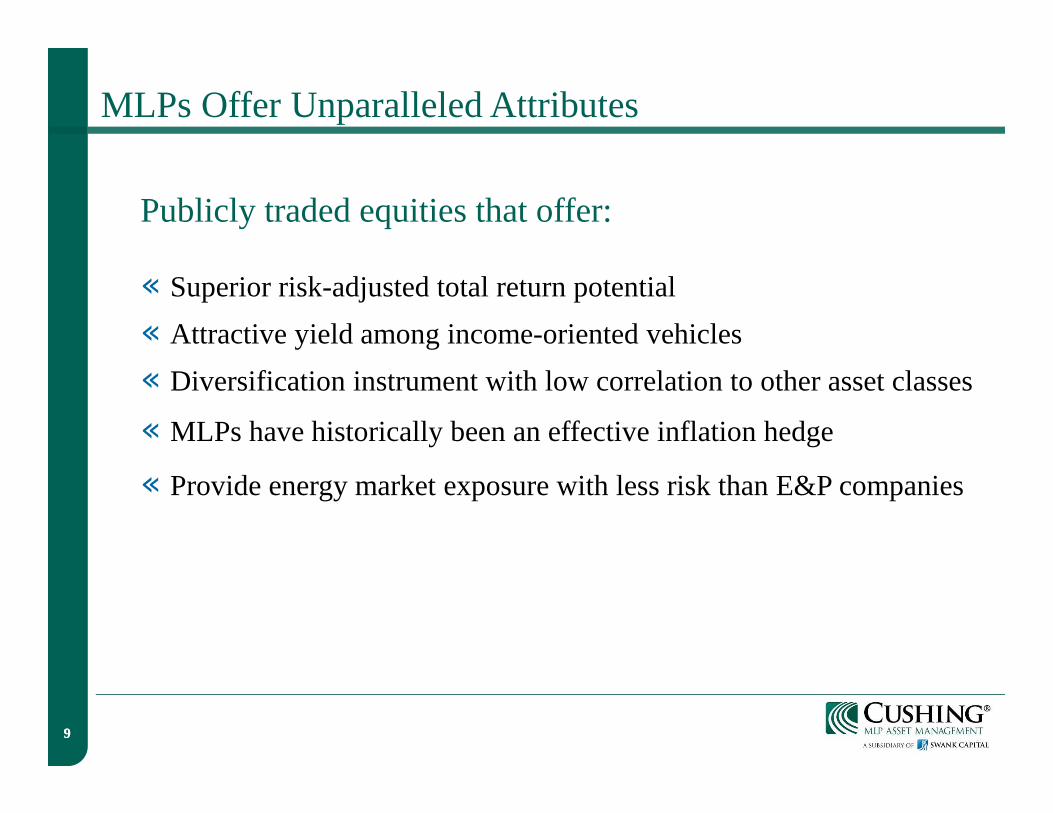
MLPs Offer Unparalleled Attributes
Publicly traded equities that offer:
« Superior risk-adjusted total return potential
« Attractive yield among income-oriented vehicles
« Diversification instrument with low correlation to other asset classes
« MLPs have historically been an effective inflation hedge
« Provide energy market exposure with less risk than E&P companies

10
MLP Current Yield Comparison
MLPs continue to be a premier source of income for investors
1) As of December 31, 2011. See Index Descriptions page for detail of indices used. 2) Cushing® 30 MLP Index (MLPX). 3) The Philadelphia Stock Exchange Utility Index4) Bloomberg North America REITs Index5) BofA Merrill Lynch US Corporate Index
Current Yield Comparison
6.4%
2.0%
4.0%3.7%
4.6%
0.0%
1.0%
2.0%
3.0%
4.0%
5.0%
6.0%
7.0%
MLPs 10 Yr Trsy Utilities REITs BBB Bonds
Yie
ld
1 2 34

11
MLP Total Return is Driven by Both Income and Growth
1) As of December 31, 2011.2) Source: Bloomberg and FactSet Research Systems.3) Represents the simple average daily yield for the indicated year. All data is annual except where indicated otherwise.4) The performance shown for the Index is not intended to be reflective of the performance of any Cushing® MLP Asset Management LP portfolio and is for illustrative purposes only.5) Past performance is not indicative of future results
Cushing® 30 MLP Index Performance
2002 2003 2004 2005 2006 2007 2008 2009 2010 2011
MLPX Total Return 2 5.3% 54.1% 29.2% 6.1% 33.9% 14.8% (37.0%) 96.1% 41.8% 11.0%
Average Annual Yield3 7.4% 7.0% 6.5% 5.9% 6.2% 5.5% 7.9% 9.3% 6.6% 6.2%
12
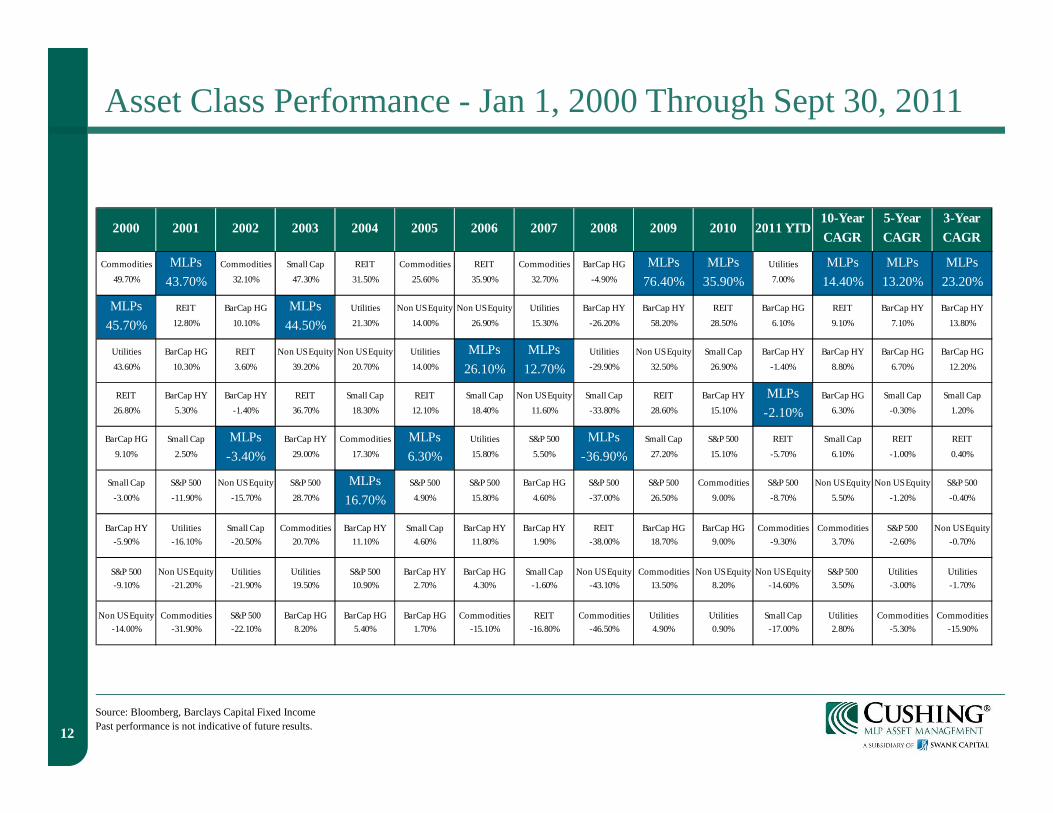
Commodities MLPs Commodities Small Cap REIT Commodities REIT Commodities BarCap HG MLPs MLPs Utilities MLPs MLPs MLPs49.70% 43.70% 32.10% 47.30% 31.50% 25.60% 35.90% 32.70% -4.90% 76.40% 35.90% 7.00% 14.40% 13.20% 23.20%
MLPs REIT BarCap HG MLPs Utilities Non US Equity Non US Equity Utilities BarCap HY BarCap HY REIT BarCap HG REIT BarCap HY BarCap HY
45.70% 12.80% 10.10% 44.50% 21.30% 14.00% 26.90% 15.30% -26.20% 58.20% 28.50% 6.10% 9.10% 7.10% 13.80%
Utilities BarCap HG REIT Non US Equity Non US Equity Utilities MLPs MLPs Utilities Non US Equity Small Cap BarCap HY BarCap HY BarCap HG BarCap HG
43.60% 10.30% 3.60% 39.20% 20.70% 14.00% 26.10% 12.70% -29.90% 32.50% 26.90% -1.40% 8.80% 6.70% 12.20%
REIT BarCap HY BarCap HY REIT Small Cap REIT Small Cap Non US Equity Small Cap REIT BarCap HY MLPs BarCap HG Small Cap Small Cap
26.80% 5.30% -1.40% 36.70% 18.30% 12.10% 18.40% 11.60% -33.80% 28.60% 15.10% -2.10% 6.30% -0.30% 1.20%
BarCap HG Small Cap MLPs BarCap HY Commodities MLPs Utilities S&P 500 MLPs Small Cap S&P 500 REIT Small Cap REIT REIT
9.10% 2.50% -3.40% 29.00% 17.30% 6.30% 15.80% 5.50% -36.90% 27.20% 15.10% -5.70% 6.10% -1.00% 0.40%
Small Cap S&P 500 Non US Equity S&P 500 MLPs S&P 500 S&P 500 BarCap HG S&P 500 S&P 500 Commodities S&P 500 Non US Equity Non US Equity S&P 500
-3.00% -11.90% -15.70% 28.70% 16.70% 4.90% 15.80% 4.60% -37.00% 26.50% 9.00% -8.70% 5.50% -1.20% -0.40%
BarCap HY Utilities Small Cap Commodities BarCap HY Small Cap BarCap HY BarCap HY REIT BarCap HG BarCap HG Commodities Commodities S&P 500 Non US Equity
-5.90% -16.10% -20.50% 20.70% 11.10% 4.60% 11.80% 1.90% -38.00% 18.70% 9.00% -9.30% 3.70% -2.60% -0.70%
S&P 500 Non US Equity Utilities Utilities S&P 500 BarCap HY BarCap HG Small Cap Non US Equity Commodities Non US Equity Non US Equity S&P 500 Utilities Utilities
-9.10% -21.20% -21.90% 19.50% 10.90% 2.70% 4.30% -1.60% -43.10% 13.50% 8.20% -14.60% 3.50% -3.00% -1.70%
Non US Equity Commodities S&P 500 BarCap HG BarCap HG BarCap HG Commodities REIT Commodities Utilities Utilities Small Cap Utilities Commodities Commodities
-14.00% -31.90% -22.10% 8.20% 5.40% 1.70% -15.10% -16.80% -46.50% 4.90% 0.90% -17.00% 2.80% -5.30% -15.90%
2005 2011 YTD2000 2001 2002 2003 20045-YearCAGR
3-YearCAGR
2006 2007 2008 2009 201010-Year CAGR
Source: Bloomberg, Barclays Capital Fixed IncomePast performance is not indicative of future results.
Asset Class Performance - Jan 1, 2000 Through Sept 30, 2011

III. The Case for MLP Investing Today
13

Emergence of MLP Asset Class Creates Opportunity
MLP asset class statistics
« Approximately $325 billion total market cap as of December 31, 2011
« 11 distinct sub-sectors
« Universe of over 100 MLP and MLP-related companies
14
1) INGAA North American Midstream Infrastructure through 2035- A Secure Energy Future Report, dated 6/27/2011.
Why now?
« According to a recent industry report, we may need over $250 billion in energy infrastructure to be built in the United States by 2035¹
« Valuations are attractive
« Investors have few choices to generate income in today’s environment
« MLPs are one of the few income alternatives not dependent on overall economic growth
15
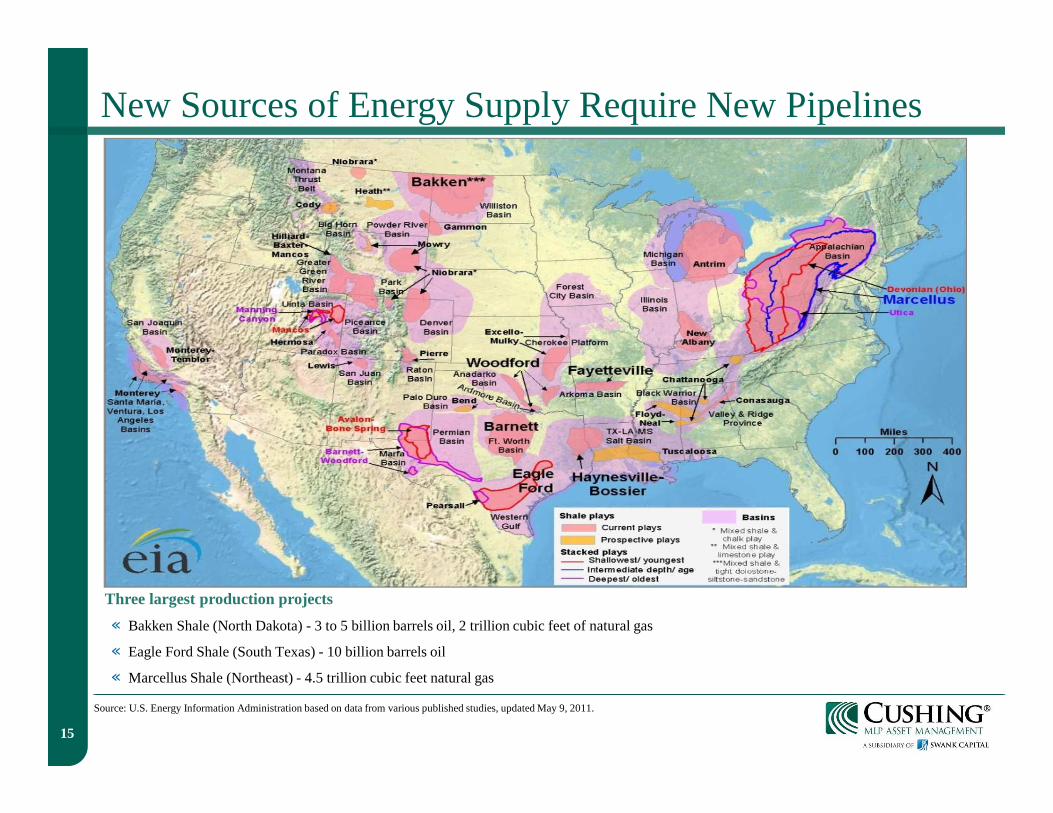
New Sources of Energy Supply Require New Pipelines
Source: U.S. Energy Information Administration based on data from various published studies, updated May 9, 2011.
Three largest production projects
« Bakken Shale (North Dakota) - 3 to 5 billion barrels oil, 2 trillion cubic feet of natural gas
« Eagle Ford Shale (South Texas) - 10 billion barrels oil
« Marcellus Shale (Northeast) - 4.5 trillion cubic feet natural gas
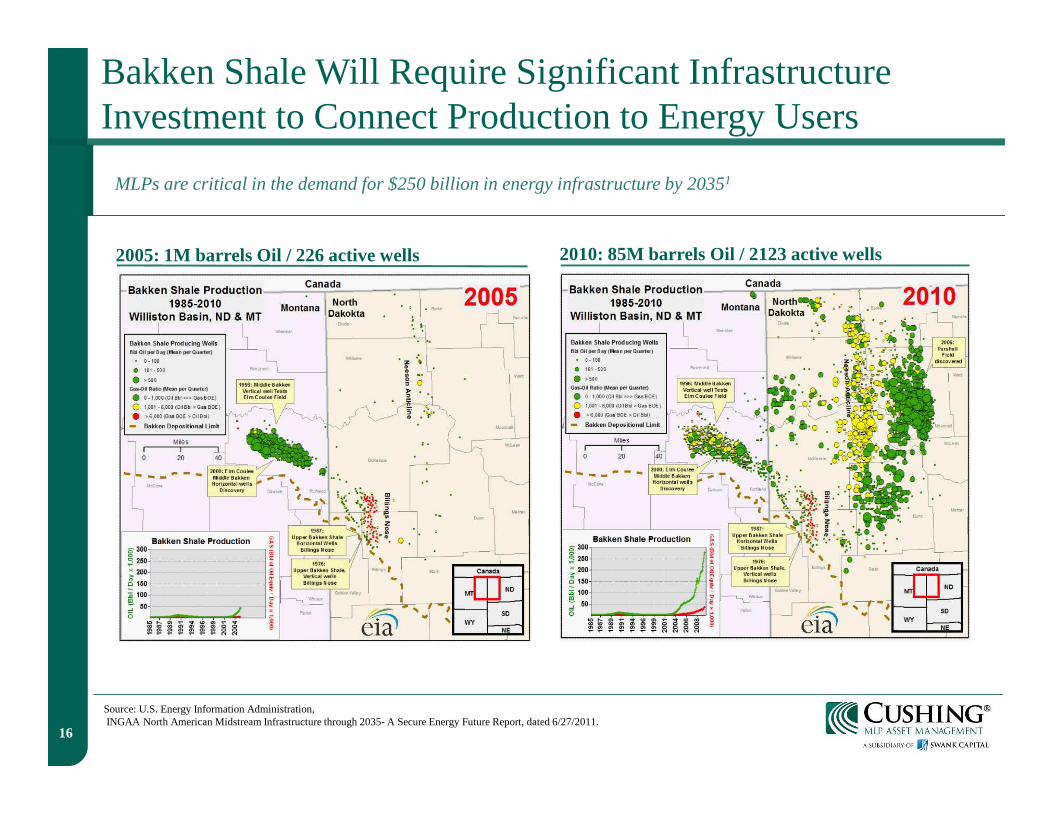
Bakken Shale Will Require Significant Infrastructure Investment to Connect Production to Energy Users
2005: 1M barrels Oil / 226 active wells 2010: 85M barrels Oil / 2123 active wells
16
Source: U.S. Energy Information Administration,INGAA North American Midstream Infrastructure through 2035- A Secure Energy Future Report, dated 6/27/2011.
MLPs are critical in the demand for $250 billion in energy infrastructure by 20351

Enterprise Product Partners (EPD)
$3,000
$3,200
$3,400
$3,600
$3,800
$4,000
$4,200
$4,400
$4,600
Sep
-10
Dec
-10
Mar
-11
Jun-
11
Sep
-11
Dec
-11
Mar
-12
Jun-
12
Sep
-12
Dec
-12
Mar
-13
Jun-
13
Sep
-13
Dec
-13
Mar
-14
Jun-
14
Sep
-14
Dec
-14
Mar
-15
Jun-
15
Sep
-15
Dec
-15
Mar
-16
Jun-
16
Sep
-16
Dec
-16
Other 2015 Projects Other 2014 ProjectsOther 2013 Projects Other 2012 ProjectsOther 2011 Projects Other 2010 ProjectsEagleFord Natural Gas Gathering, Processing & Transportation EagleFord NGL Pipeline & Fractionation ProjectsEagleFord Crude Oil Facility EagleFord Crude Oil ProjectsEagleFord Mainline Expansion - Segment 1 White Kitchen Lateral (Eagle Ford Shale)Mont Belvieu Fractionator #5 Haynesville - Chesapeake Gathering FacilityPetal Cavern Conversion to Natural gas Motiva Refinery Propane & Butane ConnectionsAnaconda Gas Pipeline Expansion Mont Belvieu Fractionator #4
Dollars in millions.Source: Cushing® MLP Asset Management, LP estimates and Company filings.
Background: Enterprise Products Partners L.P. has grown significantly since its IPO in July 1998, increasing its asset base from $715 million to $31 billion at December 31, 2010. This growth is a result of both acquisitions, as well as expansions from the organic growth opportunities listed below
Example of announced project EBITDA contribution from existing and announced projects
17

III. MLP Solution For Institutional Portfolios
18
19
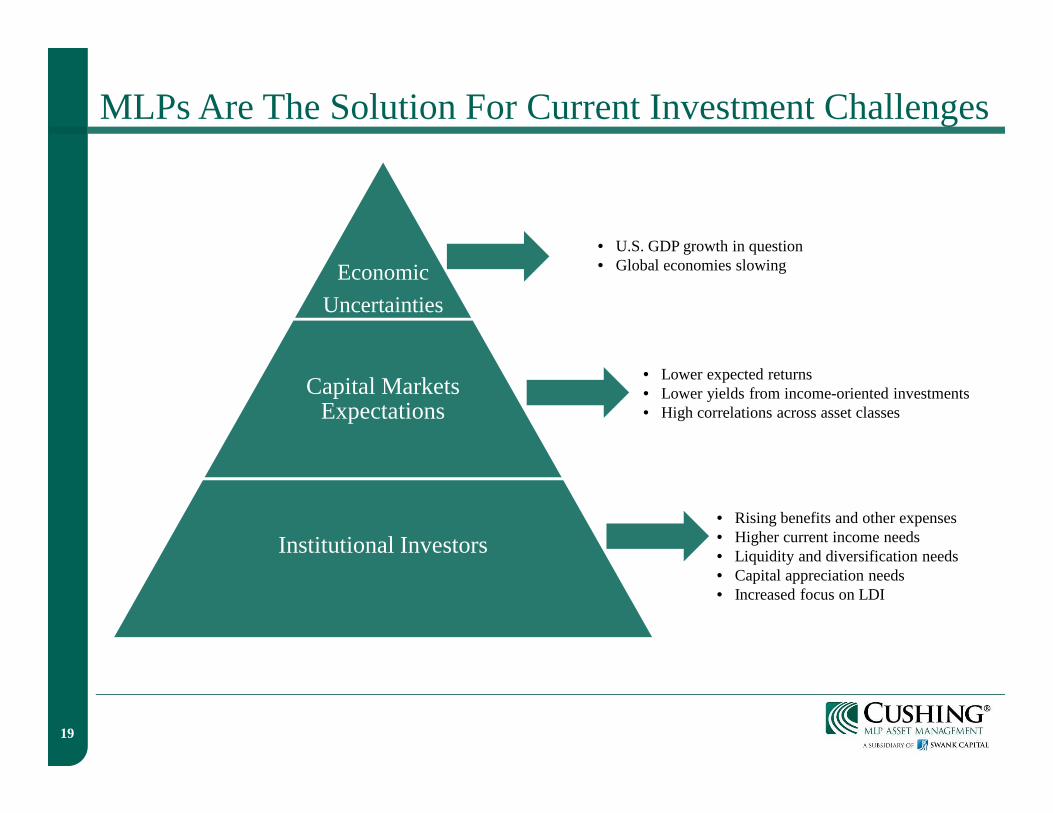
MLPs Are The Solution For Current Investment Challenges
Economic
Uncertainties
Capital Markets Expectations
Institutional Investors
• U.S. GDP growth in question• Global economies slowing
• Lower expected returns• Lower yields from income-oriented investments• High correlations across asset classes
• Rising benefits and other expenses• Higher current income needs• Liquidity and diversification needs• Capital appreciation needs• Increased focus on LDI
20
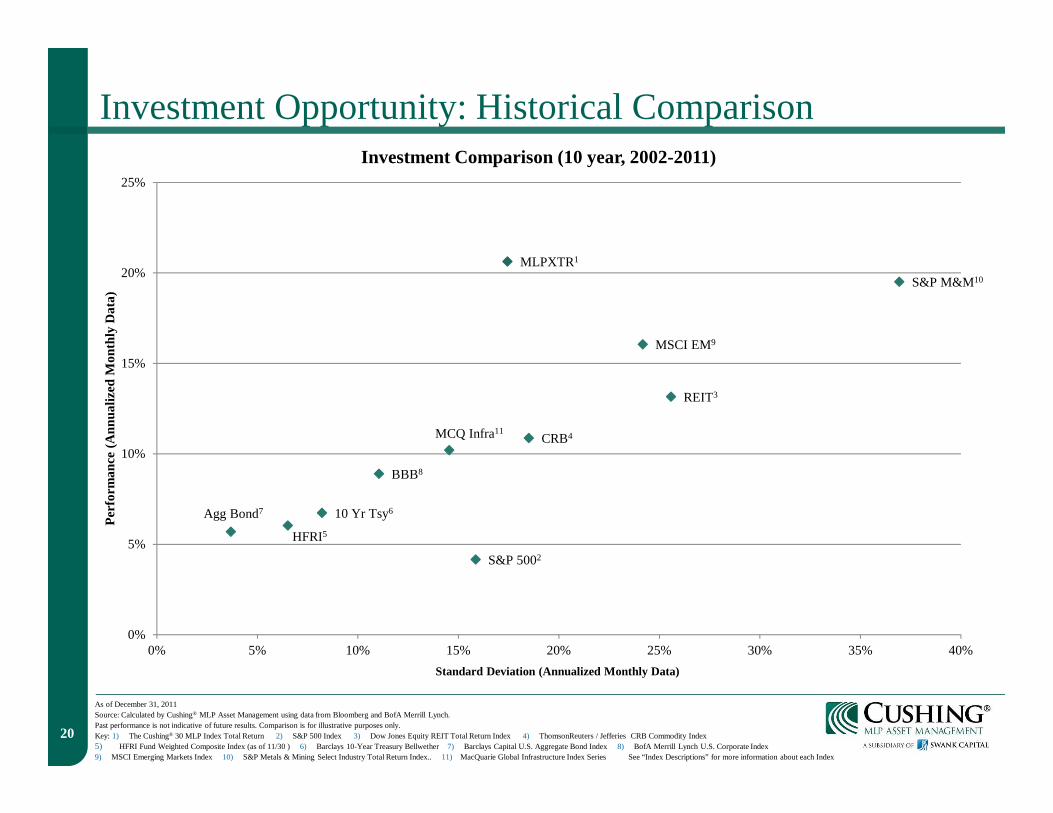
Investment Opportunity: Historical Comparison
As of December 31, 2011Source: Calculated by Cushing® MLP Asset Management using data from Bloomberg and BofA Merrill Lynch.Past performance is not indicative of future results. Comparison is for illustrative purposes only.Key: 1) The Cushing® 30 MLP Index Total Return 2) S&P 500 Index 3) Dow Jones Equity REIT Total Return Index 4) ThomsonReuters / Jefferies CRB Commodity Index 5) HFRI Fund Weighted Composite Index (as of 11/30 ) 6) Barclays 10-Year Treasury Bellwether 7) Barclays Capital U.S. Aggregate Bond Index 8) BofA Merrill Lynch U.S. Corporate Index 9) MSCI Emerging Markets Index 10) S&P Metals & Mining Select Industry Total Return Index.. 11) MacQuarie Global Infrastructure Index Series See “Index Descriptions” for more information about each Index
MLPXTR1
S&P 5002
REIT3
CRB4
HFRI5
10 Yr Tsy6Agg Bond7
BBB8
MSCI EM9
S&P M&M10
MCQ Infra11
0%
5%
10%
15%
20%
25%
0% 5% 10% 15% 20% 25% 30% 35% 40%
Per
form
ance
(A
nnua
lized
Mon
thly
Dat
a)
Standard Deviation (Annualized Monthly Data)
Investment Comparison (10 year, 2002-2011)

21
Potential Benefits of Adding MLPs to Core Portfolios
Source: Calculated by Cushing® MLP Asset Management using data from Bloomberg and Merrill Lynch. Past performance is not indicative of future results. Analysis is hypothetical and for illustrative purposes only.MLPX is The Cushing® 30 MLP Index TR. The Traditional 60/40 Portfolio = Equity/Bond is comprised of 60% S&P 500 Index TR and 40% Barclays Capital U.S. Aggregate Bond Index. The Traditional Portfolio with 5% MLPX is comprised of 95% Traditional Portfolio with 5% MLPX.
Statistical Comparison – 2002-2011
MLPXTraditional 60/40
PortfolioTraditional Portfolio
with 5% MLPX
Sharpe 1.05 0.27 0.35
Sortino 1.75 0.37 0.50
Std Dev 17.51% 9.59% 9.56%
% Up Mos 68.33% 60.83% 61.67%
CAGR 20.87% 4.40% 5.23%
Over the past several years we have strived to educate investors on the fundamental merits of the MLP space. Our recent work has focused on depicting, in a more quantitative manner, the potential impact MLPs can have on traditional, institutional long only portfolios.
The following charts and tables show the potential impact of adding a 5% allocation of MLPs to an existing traditional 60/40 stock & bond portfolio. Based on the model, MLPs would have had a very positive impact including:
« Increased returns
« Reduction in portfolio volatility
« Meaningful increase in Sharpe and Sortino ratios

22
Potential Impact of Adding the MLP Asset Class
Source: Calculated by Cushing® MLP Asset Management using data from Bloomberg and Factset. Past performance is not indicative of future results. Analysis is hypothetical and for illustrative purposes only. Equity returns are based on the returns of the S&P 500 Index TR. Bond returns are based on the returns of Barclays Capital U.S. Aggregate Bond Index. MLP returns are based on the returns of The Cushing® 30 MLP Index TR.
Efficient Frontier Scenario
23
MLP Asset Class Correlation and Statistical Comparison
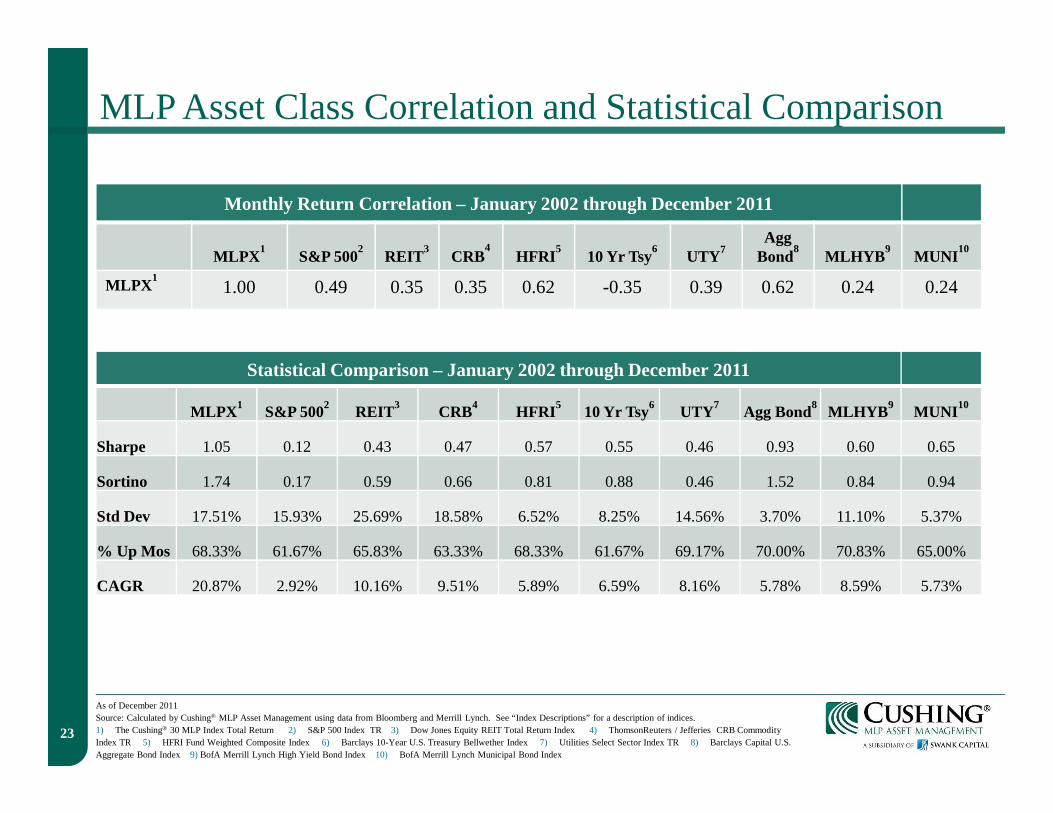
As of December 2011Source: Calculated by Cushing® MLP Asset Management using data from Bloomberg and Merrill Lynch. See “Index Descriptions” for a description of indices.1) The Cushing® 30 MLP Index Total Return 2) S&P 500 Index TR 3) Dow Jones Equity REIT Total Return Index 4) ThomsonReuters / Jefferies CRB Commodity Index TR 5) HFRI Fund Weighted Composite Index 6) Barclays 10-Year U.S. Treasury Bellwether Index 7) Utilities Select Sector Index TR 8) Barclays Capital U.S. Aggregate Bond Index 9) BofA Merrill Lynch High Yield Bond Index 10) BofA Merrill Lynch Municipal Bond Index
Monthly Return Correlation – January 2002 through December 2011
MLPX1
S&P 5002
REIT3
CRB4
HFRI5
10 Yr Tsy6
UTY7Agg
Bond8
MLHYB9
MUNI10
MLPX1
1.00 0.49 0.35 0.35 0.62 -0.35 0.39 0.62 0.24 0.24
Statistical Comparison – January 2002 through December 2011
MLPX 1 S&P 5002 REIT 3 CRB4 HFRI 5 10 Yr Tsy6 UTY7 Agg Bond8 MLHYB 9 MUNI 10
Sharpe 1.05 0.12 0.43 0.47 0.57 0.55 0.46 0.93 0.60 0.65
Sortino 1.74 0.17 0.59 0.66 0.81 0.88 0.46 1.52 0.84 0.94
Std Dev 17.51% 15.93% 25.69% 18.58% 6.52% 8.25% 14.56% 3.70% 11.10% 5.37%
% Up Mos 68.33% 61.67% 65.83% 63.33% 68.33% 61.67% 69.17% 70.00% 70.83% 65.00%
CAGR 20.87% 2.92% 10.16% 9.51% 5.89% 6.59% 8.16% 5.78% 8.59% 5.73%

V. Appendix
24

25
The Hub for Institutional Infrastructure Investors
Founded in 2003 and headquartered in Dallas, Texas
« Managing over $1.5 billion1 in AUM. Jerry Swank, a thought leader in the MLP space, created Cushing® to build on his extensive energy research and investing experience
« Dedicated team of research analysts with robust exposure to energy infrastructure investing through prior roles as energy consultants, energy engineers, investment banking underwriters and asset allocators
« Partners closely with institutionsto ensure they benefit from this emerging asset class’ high and growing income, diversification and low correlation.
1973 1981 1987 1997 2003 2006 2007 2009 Present
Jerry Swank begins career in research and investing
First MLP launches
Congress passes legislation thatredefines MLP landscape and focuses it on energy investments
Rich Kinder forms KMP and is first to utilize MLP structure to anchor infrastructure growth strategy.
Energy MLPs continue to evolve.
Cushing's parent,Swank Capital,launches the firm’s first MLP hedge fund with plans to expand into long-only as market matures
Cushing®
launches additional hedge funds and begins management of Institutional, long-only portfolios.
Cushing® launches MLP closed-end fund
The Cushing® 30 MLP Index launches – the first equally weighted benchmark option
Cushing® offers a broad range of MLP investment options built on a centralized core of MLP research.
The Evolution of the MLP industry and Cushing® MLP Asset Management
1) As of December 31, 2011
26
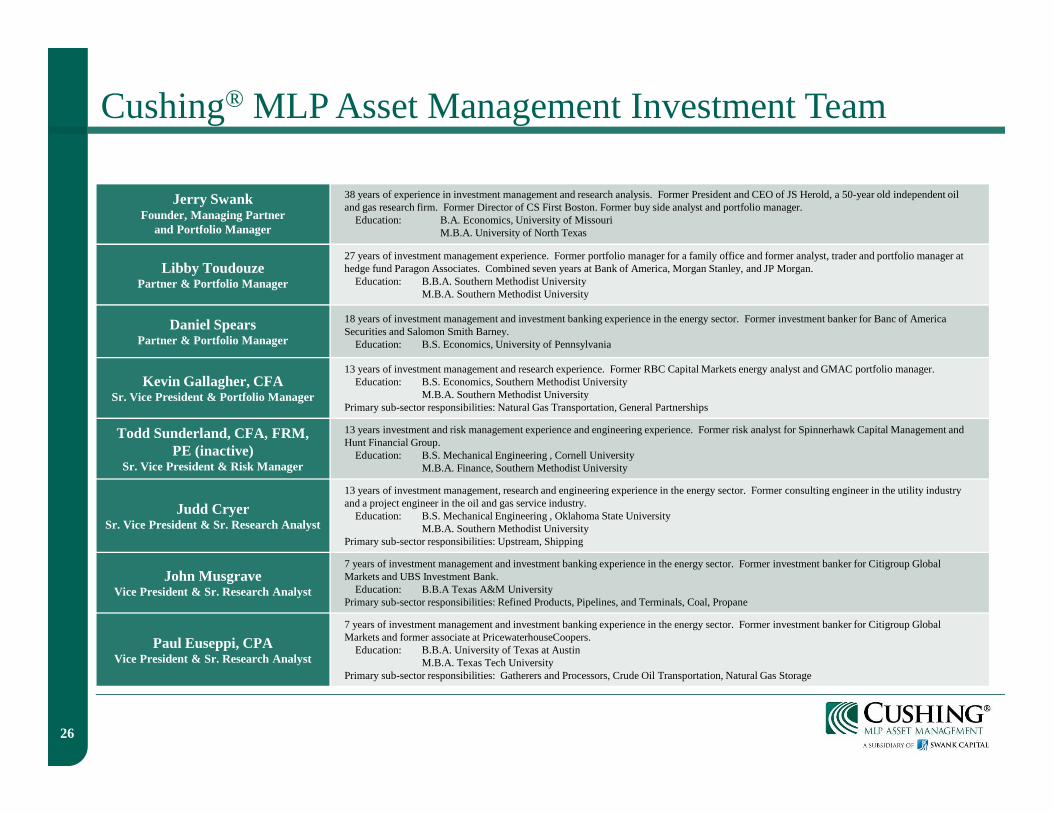
Cushing® MLP Asset Management Investment Team
Jerry Swank Founder, Managing Partner
and Portfolio Manager
38 years of experience in investment management and research analysis. Former President and CEO of JS Herold, a 50-year old independent oil and gas research firm. Former Director of CS First Boston. Former buy side analyst and portfolio manager.
Education: B.A. Economics, University of MissouriM.B.A. University of North Texas
Libby Toudouze Partner & Portfolio Manager
27 years of investment management experience. Former portfolio manager for a family office and former analyst, trader and portfolio manager at hedge fund Paragon Associates. Combined seven years at Bank of America, Morgan Stanley, and JP Morgan.
Education: B.B.A. Southern Methodist UniversityM.B.A. Southern Methodist University
Daniel SpearsPartner & Portfolio Manager
18 years of investment management and investment banking experience in the energy sector. Former investment banker for Banc of America Securities and Salomon Smith Barney.
Education: B.S. Economics, University of Pennsylvania
Kevin Gallagher, CFASr. Vice President & Portfolio Manager
13 years of investment management and research experience. Former RBC Capital Markets energy analyst and GMAC portfolio manager.Education: B.S. Economics, Southern Methodist University
M.B.A. Southern Methodist UniversityPrimary sub-sector responsibilities: Natural Gas Transportation, General Partnerships
Todd Sunderland, CFA, FRM, PE (inactive)
Sr. Vice President & Risk Manager
13 years investment and risk management experience and engineering experience. Former risk analyst for Spinnerhawk Capital Management and Hunt Financial Group.
Education: B.S. Mechanical Engineering , Cornell UniversityM.B.A. Finance, Southern Methodist University
Judd CryerSr. Vice President & Sr. Research Analyst
13 years of investment management, research and engineering experience in the energy sector. Former consulting engineer in the utility industry and a project engineer in the oil and gas service industry.
Education: B.S. Mechanical Engineering , Oklahoma State UniversityM.B.A. Southern Methodist University
Primary sub-sector responsibilities: Upstream, Shipping
John MusgraveVice President & Sr. Research Analyst
7 years of investment management and investment banking experience in the energy sector. Former investment banker for Citigroup Global Markets and UBS Investment Bank.
Education: B.B.A Texas A&M UniversityPrimary sub-sector responsibilities: Refined Products, Pipelines, and Terminals, Coal, Propane
Paul Euseppi, CPAVice President & Sr. Research Analyst
7 years of investment management and investment banking experience in the energy sector. Former investment banker for Citigroup Global Markets and former associate at PricewaterhouseCoopers.
Education: B.B.A. University of Texas at AustinM.B.A. Texas Tech University
Primary sub-sector responsibilities: Gatherers and Processors, Crude Oil Transportation, Natural Gas Storage

27
Contact InformationCushing® MLP Asset Management - 8117 Preston Rd, Suite 440 Dallas, TX 75225
214.692.6334 – www.swankcapital.com
Adam Evans, CIMA Courtney Moyer, CFA, CAIA David Blanchard
Sr. Vice President, Institutional Business Development
Institutional Sales Director of Public Funds
214.635.1675 781.367.8413 214.734.6258
[email protected] [email protected] [email protected]
Terry Beneke Parker Roy Gavin Worthy
Managing Director, Institutional Investor Relations
Sr. Managing Director, Retail SalesVice President, Sales Operations & Business Development
214.635.1664 214.635.1667 214.635.1686
28
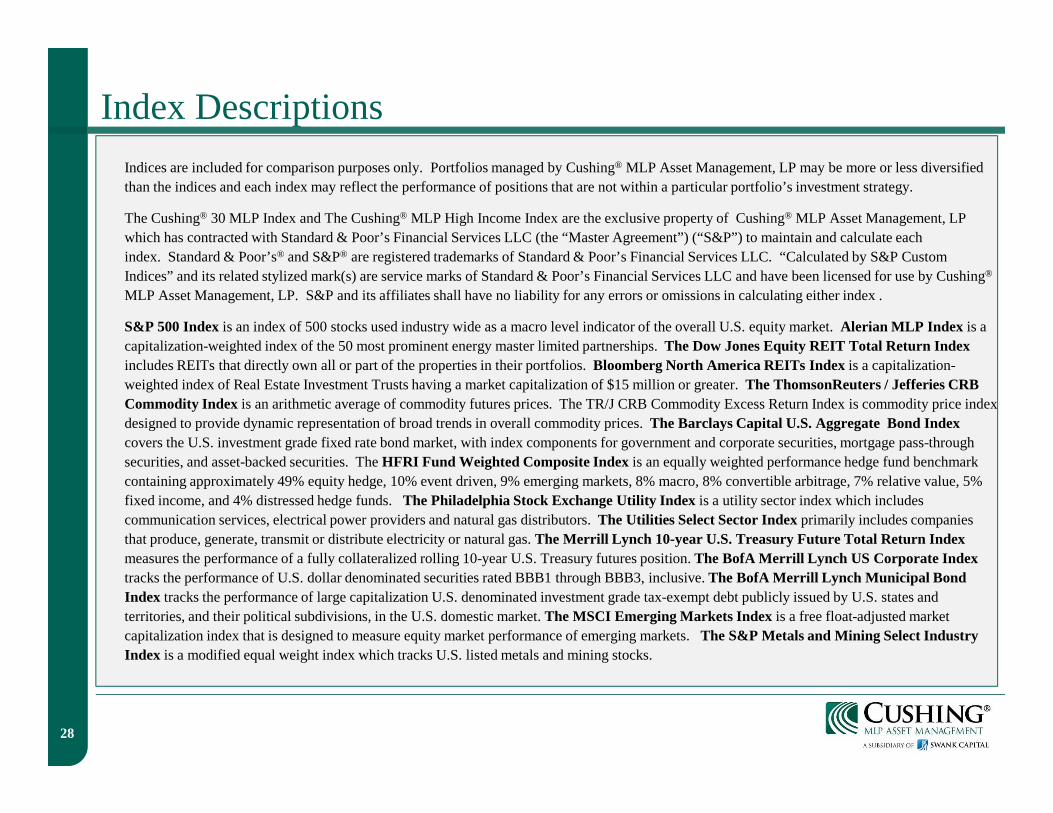
Index Descriptions
Indices are included for comparison purposes only. Portfolios managed by Cushing® MLP Asset Management, LP may be more or less diversified than the indices and each index may reflect the performance of positions that are not within a particular portfolio’s investment strategy.
The Cushing® 30 MLP Index and The Cushing® MLP High Income Index are the exclusive property of Cushing® MLP Asset Management, LP which has contracted with Standard & Poor’s Financial Services LLC (the “Master Agreement”) (“S&P”) to maintain and calculateeach index. Standard & Poor’s® and S&P® are registered trademarks of Standard & Poor’s Financial Services LLC. “Calculated by S&P Custom Indices” and its related stylized mark(s) are service marks of Standard & Poor’s Financial Services LLC and have been licensed for use by Cushing®
MLP Asset Management, LP. S&P and its affiliates shall have no liability for any errors or omissions in calculating either index .
S&P 500 Index is an index of 500 stocks used industry wide as a macro level indicator of the overall U.S. equity market. Alerian MLP Index is a capitalization-weighted index of the 50 most prominent energy master limited partnerships. The Dow Jones Equity REIT Total Return Indexincludes REITs that directly own all or part of the properties in their portfolios. Bloomberg North America REITs Index is a capitalization-weighted index of Real Estate Investment Trusts having a market capitalization of $15 million or greater. The ThomsonReuters / Jefferies CRB Commodity Index is an arithmetic average of commodity futures prices. The TR/J CRB Commodity Excess Return Index is commodity price index designed to provide dynamic representation of broad trends in overall commodity prices. The Barclays Capital U.S. Aggregate Bond Index covers the U.S. investment grade fixed rate bond market, with index components for government and corporate securities, mortgage pass-through securities, and asset-backed securities. The HFRI Fund Weighted Composite Index is an equally weighted performance hedge fund benchmark containing approximately 49% equity hedge, 10% event driven, 9% emerging markets, 8% macro, 8% convertible arbitrage, 7% relative value, 5% fixed income, and 4% distressed hedge funds. The Philadelphia Stock Exchange Utility Index is a utility sector index which includes communication services, electrical power providers and natural gas distributors. The Utilities Select Sector Index primarily includes companies that produce, generate, transmit or distribute electricity or natural gas. The Merrill Lynch 10-year U.S. Treasury Future Total Return Indexmeasures the performance of a fully collateralized rolling 10-year U.S. Treasury futures position. The BofA Merrill Lynch US Corporate Index tracks the performance of U.S. dollar denominated securities rated BBB1 through BBB3, inclusive. The BofA Merrill Lynch Municipal Bond Index tracks the performance of large capitalization U.S. denominated investment grade tax-exempt debt publicly issued by U.S. states and territories, and their political subdivisions, in the U.S. domestic market. The MSCI Emerging Markets Index is a free float-adjusted market capitalization index that is designed to measure equity market performance of emerging markets.The S&P Metals and Mining Select Industry Index is a modified equal weight index which tracks U.S. listed metals and mining stocks.
Related Documents