EID JR 12 - 039 No. MiNTS – MISR NATIONAL TRANSPORT STUDY THE COMPREHENSIVE STUDY ON THE MASTER PLAN FOR NATIONWIDE TRANSPORT SYSTEM IN THE ARAB REPUBLIC OF EGYPT FINAL REPORT TECHNICAL REPORT 10 MiNTS VISION, POLICY AND STRATEGY March 2012 JAPAN INTERNATIONAL COOPERATION AGENCY ORIENTAL CONSULTANTS CO., LTD. ALMEC CORPORATION KATAHIRA & ENGINEERS INTERNATIONAL TRANSPORT PLANNING AUTHORITY MINISTRY OF TRANSPORT THE ARAB REPUBLIC OF EGYPT

Welcome message from author
This document is posted to help you gain knowledge. Please leave a comment to let me know what you think about it! Share it to your friends and learn new things together.
Transcript
E I DJ R
12-039
No.
MiNTS – MISR NATIONAL TRANSPORT STUDY
THE COMPREHENSIVE STUDY ON THE MASTER PLAN
FOR NATIONWIDE TRANSPORT SYSTEM IN
THE ARAB REPUBLIC OF EGYPT
FINAL REPORT
TECHNICAL REPORT 10 MiNTS VISION, POLICY AND STRATEGY
March 2012
JAPAN INTERNATIONAL COOPERATION AGENCY
ORIENTAL CONSULTANTS CO., LTD. ALMEC CORPORATION
KATAHIRA & ENGINEERS INTERNATIONAL
TRANSPORT PLANNING AUTHORITY MINISTRY OF TRANSPORT THE ARAB REPUBLIC OF EGYPT

USD1.00 = EGP5.96 USD1.00 = JPY77.91
(Exchange rate of January 2012)
MiNTS: Misr National Transport Study Technical Report 10
i
TABLE OF CONTENTS
Item Page
CHAPTER 1: INTRODUCTION ..........................................................................................................................1-1
1.1 BACKGROUND...................................................................................................................................1-1 1.2 THE MINTS FRAMEWORK ................................................................................................................1-1
1.2.1 Study Scope and Objectives ........................................................................................................1-1 1.2.2 A Consultative Planning Process ..................................................................................................1-2 1.2.3 Sustainability and Human Resources Development .....................................................................1-3 1.2.4 Reporting Schedule ......................................................................................................................1-3
1.3 THE PLANNING PILLARS .................................................................................................................1-3 1.4 BENEFITS OF A NEW APPROACH ..................................................................................................1-6
CHAPTER 2: FRAMEWORK CONDITIONS......................................................................................................2-1
2.1 NATURAL ENVIRONMENT ................................................................................................................2-1 2.2 POPULATION ....................................................................................................................................2-3 2.3 EMPLOYMENT ..................................................................................................................................2-6 2.4 GROSS DOMESTIC PRODUCT ........................................................................................................2-7 2.5 PRODUCTION AND CONSUMPTION FRAMEWORK ......................................................................2-8 2.6 TRADE EXTERNALITIES ................................................................................................................. 2-11
3.4.1 The Policy Perspective ............................................................................................................... 2-11 3.4.2 The Business Perspective .......................................................................................................... 2-11 3.4.3 Implications for Egypt .................................................................................................................2-14
CHAPTER 3: VISION ON FUTURE MOBILITY .................................................................................................3-1
3.1 THE MINTS VISION FOR TRANSPORT ...........................................................................................3-1 3.2 MOBILITY PATTERNS .......................................................................................................................3-3
3.2.1 The International Perspective - Cargo ..........................................................................................3-3 3.2.2 The International Perspective - Passengers .................................................................................3-8 3.2.3 The Egyptian Experience ........................................................................................................... 3-11 3.2.4 Implications for Egypt .................................................................................................................3-13
3.3 THE REPUBLIC’S SPATIAL ASPIRATIONS .....................................................................................3-15 3.3.1 Background ................................................................................................................................3-15 3.3.2 Concept ......................................................................................................................................3-17
CHAPTER 4: TOWARDS A SUSTAINABLE TRANSPORT POLICY ................................................................4-1 4.1 CONTEXT ..........................................................................................................................................4-1 4.2 THE MINTS POLICIES FOR TRANSPORT .......................................................................................4-2 4.2 SPATIAL TRANSITION .......................................................................................................................4-3
CHAPTER 5: A STRATEGY FOR CHANGE......................................................................................................5-1
5.1 THE NEED FOR A NEW APPROACH ...............................................................................................5-1 5.2 OPPORTUNITIES AND CONSTRAINTS ...........................................................................................5-2 5.3 DEFINING SCALE AND SCOPE ........................................................................................................5-4 5.4 DEFINING THE BUILDING BLOCKS .................................................................................................5-4 5.5 DEFINING PRINCIPLES ....................................................................................................................5-5 5.6 BRINGING IT ALL TOGETHER – THE NEW TRANSPORT STRATEGY ..........................................5-6

MiNTS: Misr National Transport Study Technical Report 10
ii
APPENDIXES
2-A SOCIO-ECONOMIC FRAMEWORK ................................................................................................. A-1 2-B MEDITERRANEAN MARITIME TRADE STRUCTURE ................................................................... A-22 2-C PRODUCTION AND CONSUMPTION FRAMEWORK ................................................................... A-36 3-A EMPIRICAL FRAMEWORK FOR CARGO LOGISTIC .................................................................... A-47 3-B NATIONAL PLANS AND PROGRAMS ............................................................................................ A-56

MiNTS: Misr National Transport Study Technical Report 10
1-1
CHAPTER 1: INTRODUCTION
1.1 BACKGROUND
The Japan International Cooperation Agency (JICA) and the Transport Planning Authority of the Ministry of Transport are cooperating in the conduct of the Comprehensive Study on The Master Plan for Nationwide Transport System in the Arab Republic of Egypt (MiNTS – Misr National Transport Study), based upon agreements finalized during July, 20091. Oriental Consultants Company Limited, headquartered in Tokyo, Japan, is the designated lead consultant for the study. Associated firms are Almec Corporation, Japan and Katahira & Engineers International, Japan. Technical efforts in Egypt were initiated during December, 2009.
1.2 THE MINTS FRAMEWORK
1.2.1 Study Scope and Objectives
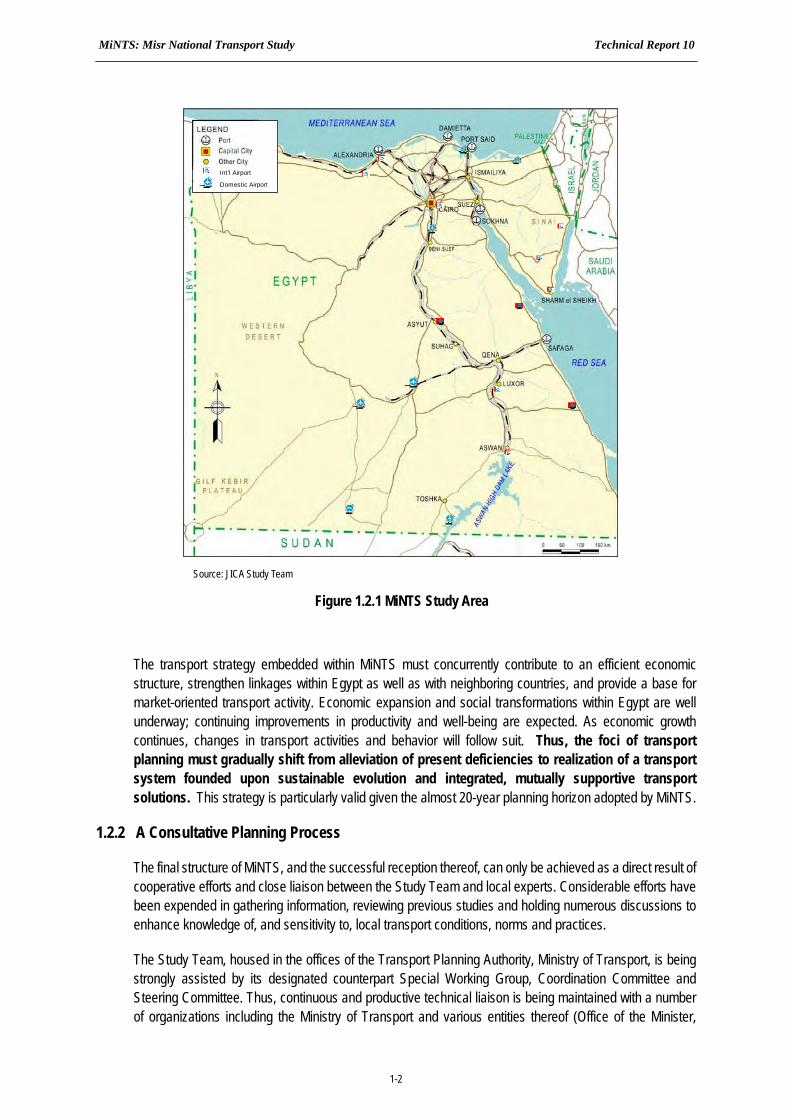
MiNTS is comprehensive in nature, that is, approaches have been designed to mitigate transport problems and contribute to the sustainable development of the nation. Investigative efforts extend over the entirety of the Republic (Figure 1.2.1), with a particular focus being major corridors of movement for both persons and cargo. All major modes of transport are addressed including road, rail, maritime, inland waterway, civil aviation and pipeline. However, the practical master planning focus falls upon those modes falling under the jurisdiction of the Ministry of Transport; that is, the road, rail, maritime and inland waterway sectors.
Five key milestones form the foundation upon which planning efforts are based:
Establish a nationwide, multi-modal database whose validity rests on a series of focused transport survey and data collection exercises;
Formulate overall strategies and policies for development of the nationwide transport fabric;
Develop an integrated, multi-modal transport master plan with years 2017, 2022 and 2027 being short, medium and ultimate planning horizons, respectively;
Identification, within the master plan framework, of high-priority projects; and,
Implementation of an effective and productive technology transfer program with Egyptian counterparts.
1 Scope of Work - Comprehensive Study on The Master Plan for Nationwide Transport System in the Arab Republic of Egypt, as mutually agreed upon
between the Japan International Cooperation Agency and the Ministry of Transport, Government of Egypt, July 16, 2009.
MiNTS: Misr National Transport Study Technical Report 10
1-2
The transport strategy embedded within MiNTS must concurrently contribute to an efficient economic structure, strengthen linkages within Egypt as well as with neighboring countries, and provide a base for market-oriented transport activity. Economic expansion and social transformations within Egypt are well underway; continuing improvements in productivity and well-being are expected. As economic growth continues, changes in transport activities and behavior will follow suit. Thus, the foci of transport planning must gradually shift from alleviation of present deficiencies to realization of a transport system founded upon sustainable evolution and integrated, mutually supportive transport solutions. This strategy is particularly valid given the almost 20-year planning horizon adopted by MiNTS.
1.2.2 A Consultative Planning Process
The final structure of MiNTS, and the successful reception thereof, can only be achieved as a direct result of cooperative efforts and close liaison between the Study Team and local experts. Considerable efforts have been expended in gathering information, reviewing previous studies and holding numerous discussions to enhance knowledge of, and sensitivity to, local transport conditions, norms and practices.
The Study Team, housed in the offices of the Transport Planning Authority, Ministry of Transport, is being strongly assisted by its designated counterpart Special Working Group, Coordination Committee and Steering Committee. Thus, continuous and productive technical liaison is being maintained with a number of organizations including the Ministry of Transport and various entities thereof (Office of the Minister,
Int’l Airport
Domestic Airport
Int’l Airport
Domestic Airport
Source: JICA Study Team
Figure 1.2.1 MiNTS Study Area
MiNTS: Misr National Transport Study Technical Report 10
1-3
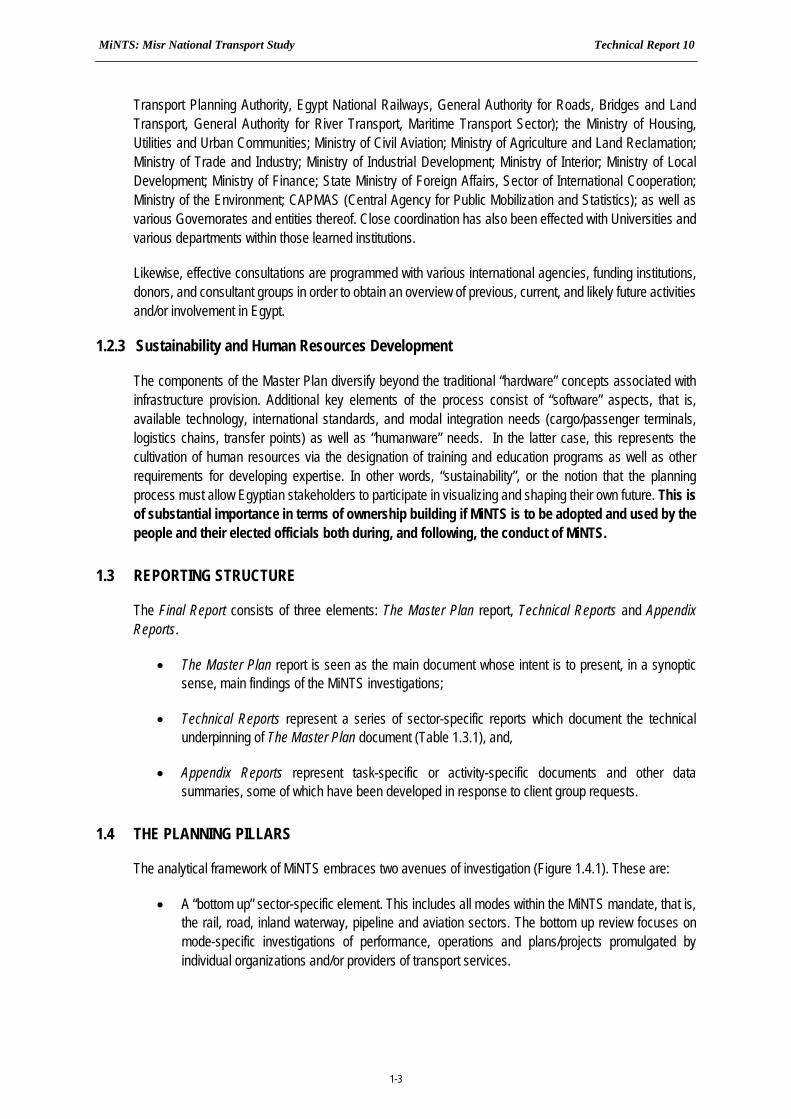
Transport Planning Authority, Egypt National Railways, General Authority for Roads, Bridges and Land Transport, General Authority for River Transport, Maritime Transport Sector); the Ministry of Housing, Utilities and Urban Communities; Ministry of Civil Aviation; Ministry of Agriculture and Land Reclamation; Ministry of Trade and Industry; Ministry of Industrial Development; Ministry of Interior; Ministry of Local Development; Ministry of Finance; State Ministry of Foreign Affairs, Sector of International Cooperation; Ministry of the Environment; CAPMAS (Central Agency for Public Mobilization and Statistics); as well as various Governorates and entities thereof. Close coordination has also been effected with Universities and various departments within those learned institutions.
Likewise, effective consultations are programmed with various international agencies, funding institutions, donors, and consultant groups in order to obtain an overview of previous, current, and likely future activities and/or involvement in Egypt.
1.2.3 Sustainability and Human Resources Development
The components of the Master Plan diversify beyond the traditional “hardware” concepts associated with infrastructure provision. Additional key elements of the process consist of “software” aspects, that is, available technology, international standards, and modal integration needs (cargo/passenger terminals, logistics chains, transfer points) as well as “humanware” needs. In the latter case, this represents the cultivation of human resources via the designation of training and education programs as well as other requirements for developing expertise. In other words, “sustainability”, or the notion that the planning process must allow Egyptian stakeholders to participate in visualizing and shaping their own future. This is of substantial importance in terms of ownership building if MiNTS is to be adopted and used by the people and their elected officials both during, and following, the conduct of MiNTS.
1.3 REPORTING STRUCTURE
The Final Report consists of three elements: The Master Plan report, Technical Reports and Appendix Reports.
The Master Plan report is seen as the main document whose intent is to present, in a synoptic sense, main findings of the MiNTS investigations;
Technical Reports represent a series of sector-specific reports which document the technical underpinning of The Master Plan document (Table 1.3.1), and,
Appendix Reports represent task-specific or activity-specific documents and other data summaries, some of which have been developed in response to client group requests.
1.4 THE PLANNING PILLARS
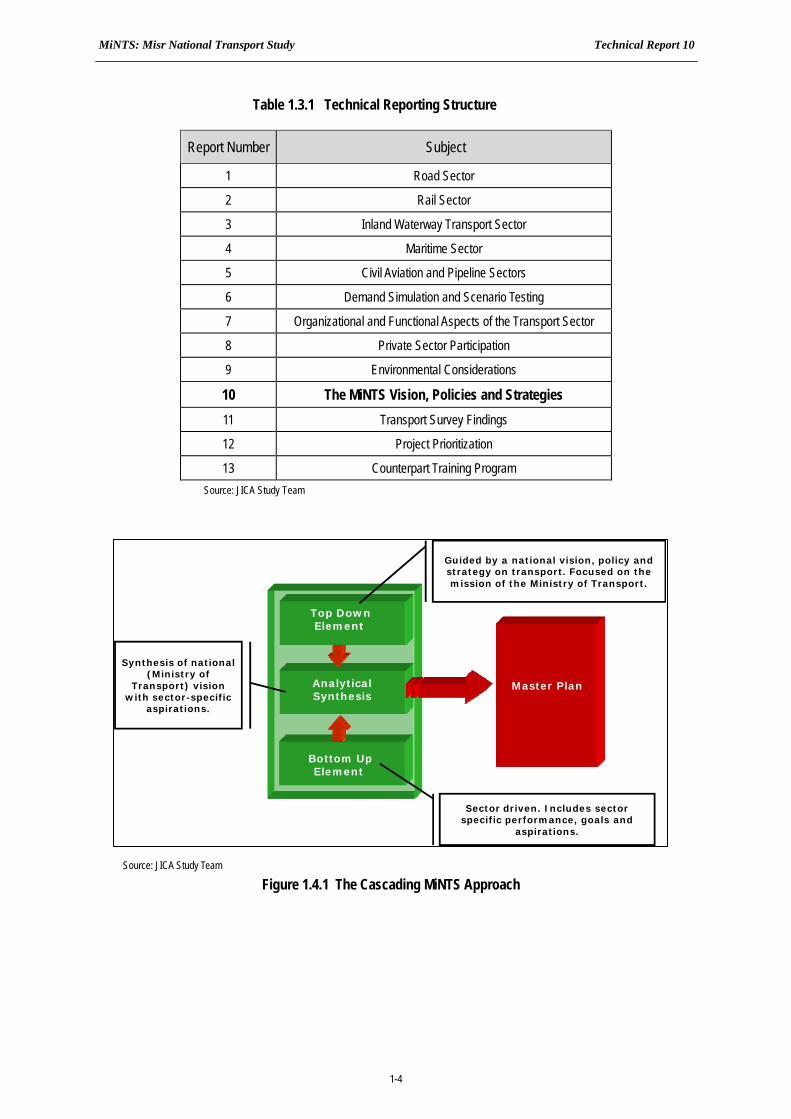
The analytical framework of MiNTS embraces two avenues of investigation (Figure 1.4.1). These are:
A “bottom up” sector-specific element. This includes all modes within the MiNTS mandate, that is, the rail, road, inland waterway, pipeline and aviation sectors. The bottom up review focuses on mode-specific investigations of performance, operations and plans/projects promulgated by individual organizations and/or providers of transport services.
MiNTS: Misr National Transport Study Technical Report 10
1-4
Table 1.3.1 Technical Reporting Structure
Report Number Subject
1 Road Sector
2 Rail Sector
3 Inland Waterway Transport Sector
4 Maritime Sector
5 Civil Aviation and Pipeline Sectors
6 Demand Simulation and Scenario Testing
7 Organizational and Functional Aspects of the Transport Sector
8 Private Sector Participation
9 Environmental Considerations
10 The MiNTS Vision, Policies and Strategies 11 Transport Survey Findings
12 Project Prioritization
13 Counterpart Training Program Source: JICA Study Team
Source: JICA Study Team
Figure 1.4.1 The Cascading MiNTS Approach
Bottom UpElement
Analytical Synthesis
Top DownElement
Guided by a national vision, policy and strategy on transport. Focused on the mission of the Ministry of Transport.
Master Plan
Sector driven. Includes sector specific performance, goals and
aspirations.
Synthesis of national (Ministry of
Transport) vision with sector-specific
aspirations.
MiNTS: Misr National Transport Study Technical Report 10
1-5
A “top-down” element focused on the broader national, specifically Ministry of Transport, mandate. In other words, the overall perception as to how a balanced functioning of the road, rail and inland waterway modes is to be achieved within key demand corridors. Considerable consultation was undertaken to ensure broad consensus with the client group in terms of the Egyptian vision for transport2.
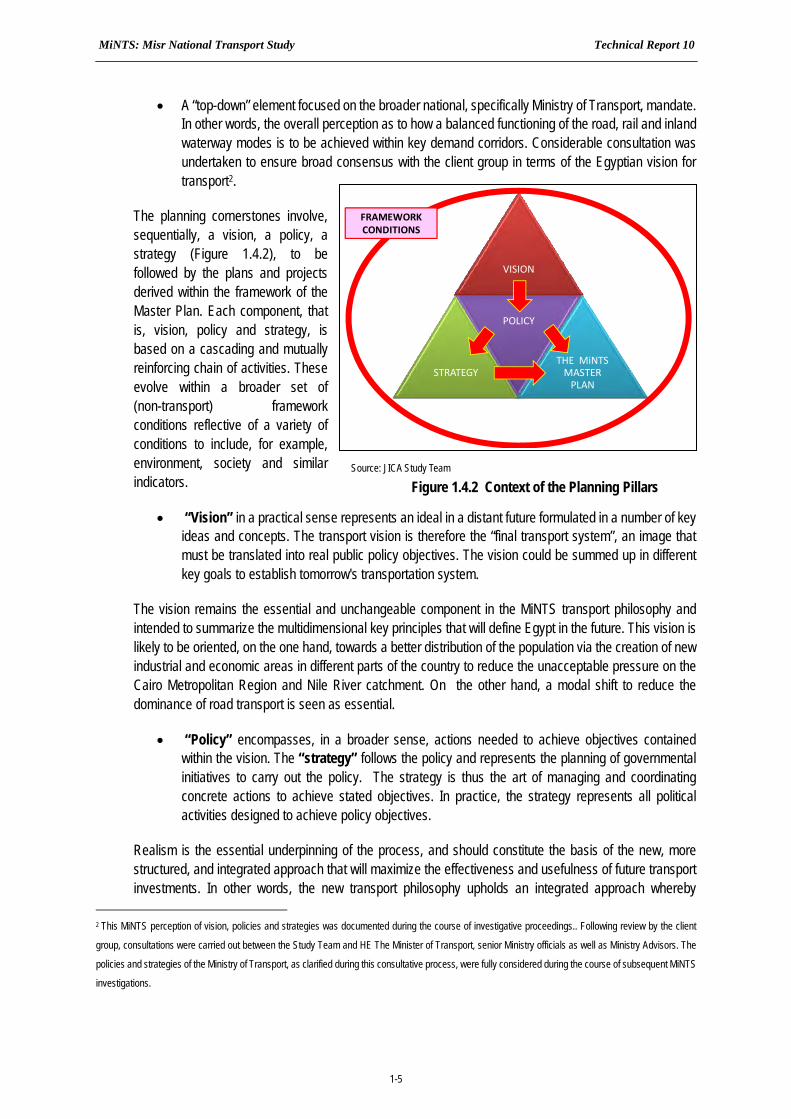
The planning cornerstones involve, sequentially, a vision, a policy, a strategy (Figure 1.4.2), to be followed by the plans and projects derived within the framework of the Master Plan. Each component, that is, vision, policy and strategy, is based on a cascading and mutually reinforcing chain of activities. These evolve within a broader set of (non-transport) framework conditions reflective of a variety of conditions to include, for example, environment, society and similar indicators.
“Vision” in a practical sense represents an ideal in a distant future formulated in a number of key ideas and concepts. The transport vision is therefore the “final transport system”, an image that must be translated into real public policy objectives. The vision could be summed up in different key goals to establish tomorrow's transportation system.
The vision remains the essential and unchangeable component in the MiNTS transport philosophy and intended to summarize the multidimensional key principles that will define Egypt in the future. This vision is likely to be oriented, on the one hand, towards a better distribution of the population via the creation of new industrial and economic areas in different parts of the country to reduce the unacceptable pressure on the Cairo Metropolitan Region and Nile River catchment. On the other hand, a modal shift to reduce the dominance of road transport is seen as essential.
“Policy” encompasses, in a broader sense, actions needed to achieve objectives contained within the vision. The “strategy” follows the policy and represents the planning of governmental initiatives to carry out the policy. The strategy is thus the art of managing and coordinating concrete actions to achieve stated objectives. In practice, the strategy represents all political activities designed to achieve policy objectives.
Realism is the essential underpinning of the process, and should constitute the basis of the new, more structured, and integrated approach that will maximize the effectiveness and usefulness of future transport investments. In other words, the new transport philosophy upholds an integrated approach whereby
2 This MiNTS perception of vision, policies and strategies was documented during the course of investigative proceedings.. Following review by the client
group, consultations were carried out between the Study Team and HE The Minister of Transport, senior Ministry officials as well as Ministry Advisors. The
policies and strategies of the Ministry of Transport, as clarified during this consultative process, were fully considered during the course of subsequent MiNTS
investigations.
Source: JICA Study Team
Figure 1.4.2 Context of the Planning Pillars
VISION
STRATEGY
POLICY
THE MiNTS MASTER PLAN
FRAMEWORK CONDITIONS

MiNTS: Misr National Transport Study Technical Report 10
1-6
different public authorities shall monitor and coordinate to ensure the efficient execution of the strategy that follows out of the new policy. It is important to emphasize that in this framework, the development of new infrastructures (hardware) will be a less dominant than in past, while priority is likely to be given to the technology (software) and management (humanware) aspects of the transport system.
The subsequent Master Plan converts policy into action using a coherent and integrated approach to cover all components relevant to the transport system of tomorrow.
1.5 BENEFITS OF A NEW APPROACH
The fact that an integrated, intermodal transport system is essential to the future mobility of Egypt cannot be understated. As economic activity continues to intensify, transport demand will likewise grow (Figure 1.5.1). However, a segmented and road-oriented infrastructure system has finite operational limitations. Thus, as capacity limitations are reached, transport demand will inevitable be constrained. An integrated and intermodal system, on the other hand, offers a much higher capacity threshold; thus, activity can, by and large, continue to evolve in an more market-responsive fashion. The economic implications are clear. While a “segregated” transport scenario for Egypt is conducive to good economic growth (as in recent years) until a capacity “ceiling” is reached (saturation of road segments, for example), economic diversion, followed by economic stagnation (generators of economic activity may actually shift to other MENA countries), can ultimately be expected. Only an integrated national transport system fully supports, in the longer term, the continued economic growth of the Republic.
T
Figure 1.5.1 Perceived Benefits of Transport System Integration

MiNTS: Misr National Transport Study Technical Report 10
1-7
This is not meant to imply that integration of systems will either be “easy” or without difficulties (technical, social, political). Although originally applied in the global private sector, integration has become quickly an inevitable need for political structures to efficiently manage financial, human and other resources that are becoming increasingly rare and hard to find. Political start recognizing that the classical method of managing different aspects of the country by many relatively autonomous departments / ministries no longer works. The globalization of the economy forces countries to position themselves in a competitive manner and create an economic and political environment in which domestic firms can be competitive and foreign firms are interested to participate / invest. This, in turn, requires coordinated actions between all decision making levels, possible only with a policy of integration.

MiNTS: Misr National Transport Study Technical Report 10
2-1
CHAPTER 2: FRAMEWORK CONDITIONS
The evolution of a national transport strategy, together with those for allied Ministries and governmental entities, will be guided by a framework consisting of societal, economic, environmental and governmental elements. The MiNTS framework conditions, to be presented in this chapter include:
The natural environment, that is, physical, terrain and environmental conditions impacting locational aspects of transport;
Population and employment, which will guide the provision of transport services as well as systems in both absolute and relative terms;
Economic development of the nation, thus setting the basis for fiscal opportunities; and,
Trade externalities influencing the direction, and scale, of Egyptian foreign trade.
Additional detail is presented in Appendix A for population, employment and national income forecasts, while Appendix B addresses Mediterranean trade practices. The analysis of national production and consumption is presented in Appendix C.
2.1 NATURAL ENVIRONMENT
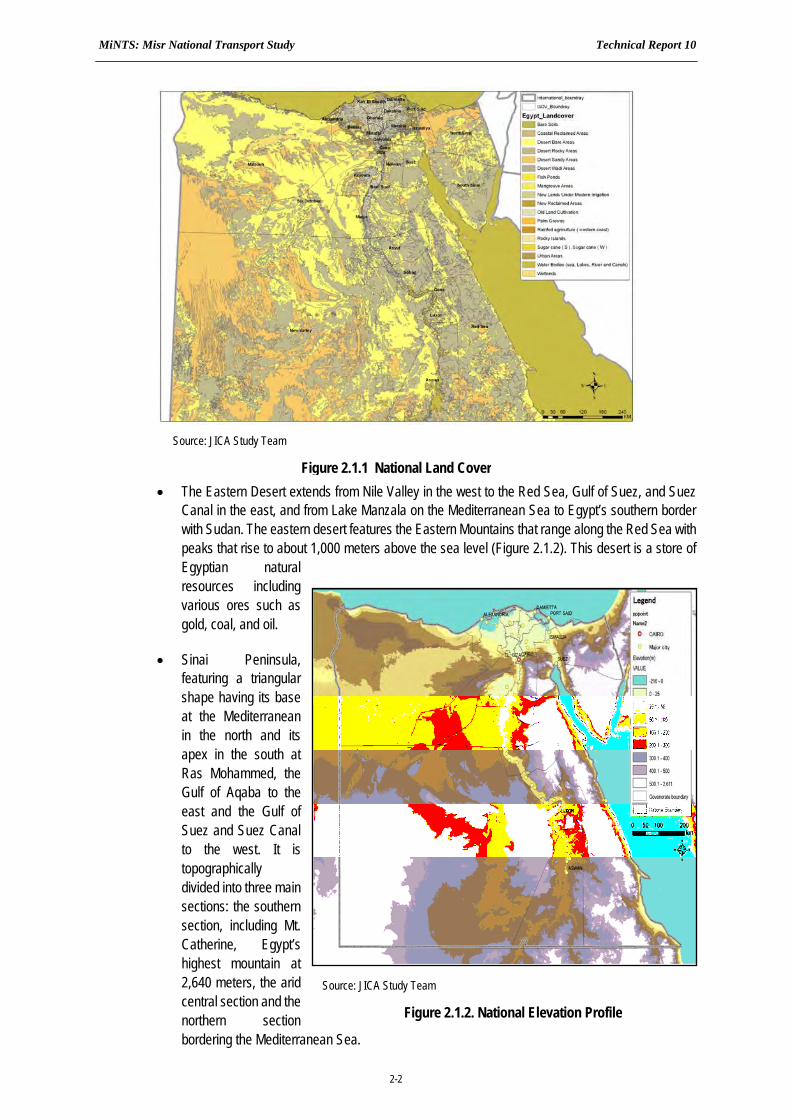
Egypt has a unique and varied natural landscape consisting of fertile crop land, cliffs, mesas, coastal areas and plains (Figure 2.1.1). The Republic boasts a large land area: the greatest distance from north to south is 1,024 kilometers, and from east to west, 1,240 kilometers. Her natural boundaries include more than 2,900 kilometers of coastline along the Mediterranean Sea, the Gulf of Suez, the Gulf of Aqaba, and the Red Sea. Egypt has land boundaries with Libya, Sudan, Palestine and Israel. The nation is divided into four main areas1:
The Nile Valley and Delta extends from the North valley to the Mediterranean Sea and is divided into Upper Egypt and Lower Egypt. The River Nile in the north is divided into two branches, (Damietta and Rachid) embracing the highly fertile agricultural lands of the Delta.
The Western Desert extends from the Nile Valley in the east to the Libyan border in the west, and from the Mediterranean Sea in the north to the Egyptian southern border. The desert is broadly divided into two precincts. The northern section includes the coastal plain, the Qattara Depression, the Natron Valley and several oases. The southern section includes Farafra, Kharga, Dakhla, and El-Owainat.
1 Refer MiNTS Interim Report 1, Chapter 9, op. cit., for a more in-depth discussion of the natural environment.
MiNTS: Misr National Transport Study Technical Report 10
2-2
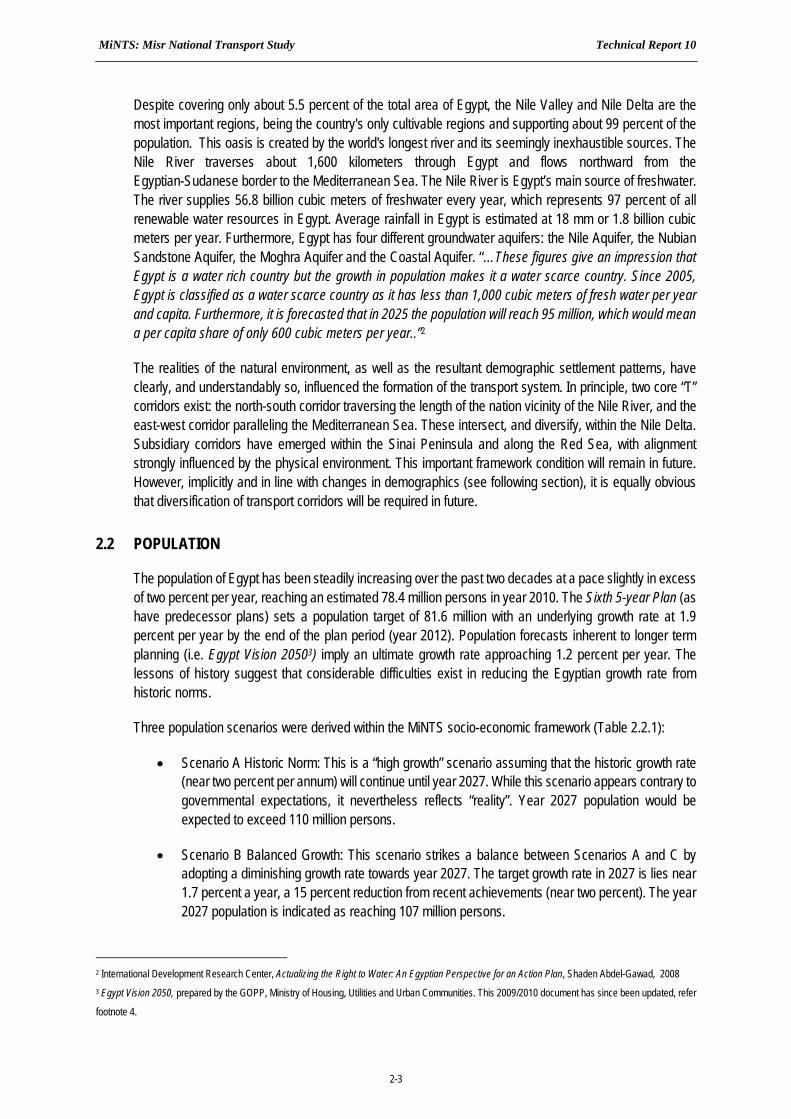
The Eastern Desert extends from Nile Valley in the west to the Red Sea, Gulf of Suez, and Suez Canal in the east, and from Lake Manzala on the Mediterranean Sea to Egypt’s southern border with Sudan. The eastern desert features the Eastern Mountains that range along the Red Sea with peaks that rise to about 1,000 meters above the sea level (Figure 2.1.2). This desert is a store of Egyptian natural resources including various ores such as gold, coal, and oil.
Sinai Peninsula, featuring a triangular shape having its base at the Mediterranean in the north and its apex in the south at Ras Mohammed, the Gulf of Aqaba to the east and the Gulf of Suez and Suez Canal to the west. It is topographically divided into three main sections: the southern section, including Mt. Catherine, Egypt’s highest mountain at 2,640 meters, the arid central section and the northern section bordering the Mediterranean Sea.
Source: JICA Study Team
Figure 2.1.2. National Elevation Profile
Source: JICA Study Team
Figure 2.1.1 National Land Cover
MiNTS: Misr National Transport Study Technical Report 10
2-3
Despite covering only about 5.5 percent of the total area of Egypt, the Nile Valley and Nile Delta are the most important regions, being the country's only cultivable regions and supporting about 99 percent of the population. This oasis is created by the world's longest river and its seemingly inexhaustible sources. The Nile River traverses about 1,600 kilometers through Egypt and flows northward from the Egyptian-Sudanese border to the Mediterranean Sea. The Nile River is Egypt’s main source of freshwater. The river supplies 56.8 billion cubic meters of freshwater every year, which represents 97 percent of all renewable water resources in Egypt. Average rainfall in Egypt is estimated at 18 mm or 1.8 billion cubic meters per year. Furthermore, Egypt has four different groundwater aquifers: the Nile Aquifer, the Nubian Sandstone Aquifer, the Moghra Aquifer and the Coastal Aquifer. “…These figures give an impression that Egypt is a water rich country but the growth in population makes it a water scarce country. Since 2005, Egypt is classified as a water scarce country as it has less than 1,000 cubic meters of fresh water per year and capita. Furthermore, it is forecasted that in 2025 the population will reach 95 million, which would mean a per capita share of only 600 cubic meters per year..”2
The realities of the natural environment, as well as the resultant demographic settlement patterns, have clearly, and understandably so, influenced the formation of the transport system. In principle, two core “T” corridors exist: the north-south corridor traversing the length of the nation vicinity of the Nile River, and the east-west corridor paralleling the Mediterranean Sea. These intersect, and diversify, within the Nile Delta. Subsidiary corridors have emerged within the Sinai Peninsula and along the Red Sea, with alignment strongly influenced by the physical environment. This important framework condition will remain in future. However, implicitly and in line with changes in demographics (see following section), it is equally obvious that diversification of transport corridors will be required in future.
2.2 POPULATION
The population of Egypt has been steadily increasing over the past two decades at a pace slightly in excess of two percent per year, reaching an estimated 78.4 million persons in year 2010. The Sixth 5-year Plan (as have predecessor plans) sets a population target of 81.6 million with an underlying growth rate at 1.9 percent per year by the end of the plan period (year 2012). Population forecasts inherent to longer term planning (i.e. Egypt Vision 20503) imply an ultimate growth rate approaching 1.2 percent per year. The lessons of history suggest that considerable difficulties exist in reducing the Egyptian growth rate from historic norms.
Three population scenarios were derived within the MiNTS socio-economic framework (Table 2.2.1):
Scenario A Historic Norm: This is a “high growth” scenario assuming that the historic growth rate (near two percent per annum) will continue until year 2027. While this scenario appears contrary to governmental expectations, it nevertheless reflects “reality”. Year 2027 population would be expected to exceed 110 million persons.
Scenario B Balanced Growth: This scenario strikes a balance between Scenarios A and C by adopting a diminishing growth rate towards year 2027. The target growth rate in 2027 is lies near 1.7 percent a year, a 15 percent reduction from recent achievements (near two percent). The year 2027 population is indicated as reaching 107 million persons.
2 International Development Research Center, Actualizing the Right to Water: An Egyptian Perspective for an Action Plan, Shaden Abdel-Gawad, 2008 3 Egypt Vision 2050, prepared by the GOPP, Ministry of Housing, Utilities and Urban Communities. This 2009/2010 document has since been updated, refer
footnote 4.

MiNTS: Misr National Transport Study Technical Report 10
2-4
Scenario C Aspiration-centric: This scenario mirrors aspirations in terms of achieving vastly reduced rates of population increase. This scenario results in the lowest total population, some 99 million persons by year 2027.
The most likely scenario, following discussions with MiNTS stakeholders, is seen as the balanced growth scenario. The underlying reductions in unit growth are seen as being achievable when coupled with intensified incentive and education programs. Still, population is expected to increase by almost 30 million persons over the MiNTS planning horizon.
Table 2.2.1 Alternative MiNTS National Population Scenarios
Scenario A (Historic Norm)
Scenario B (Balanced Growth)
Scenario C (Aspiration-centric)
Year Population
(million) Growth
Rate (%) Population
(million) Growth
Rate (%) Population
(million) Growth
Rate (%)
2010 78.4 2.03 78.4 2.03 78.4 2.03
2017 90.2 2.03 89.7 1.90 87.7 1.20
2022 99.7 2.03 98.3 1.81 93.1 1.18
2027 110.2 2.03 107.3 1.73 98.7 1.17 Source: JICA Study Team
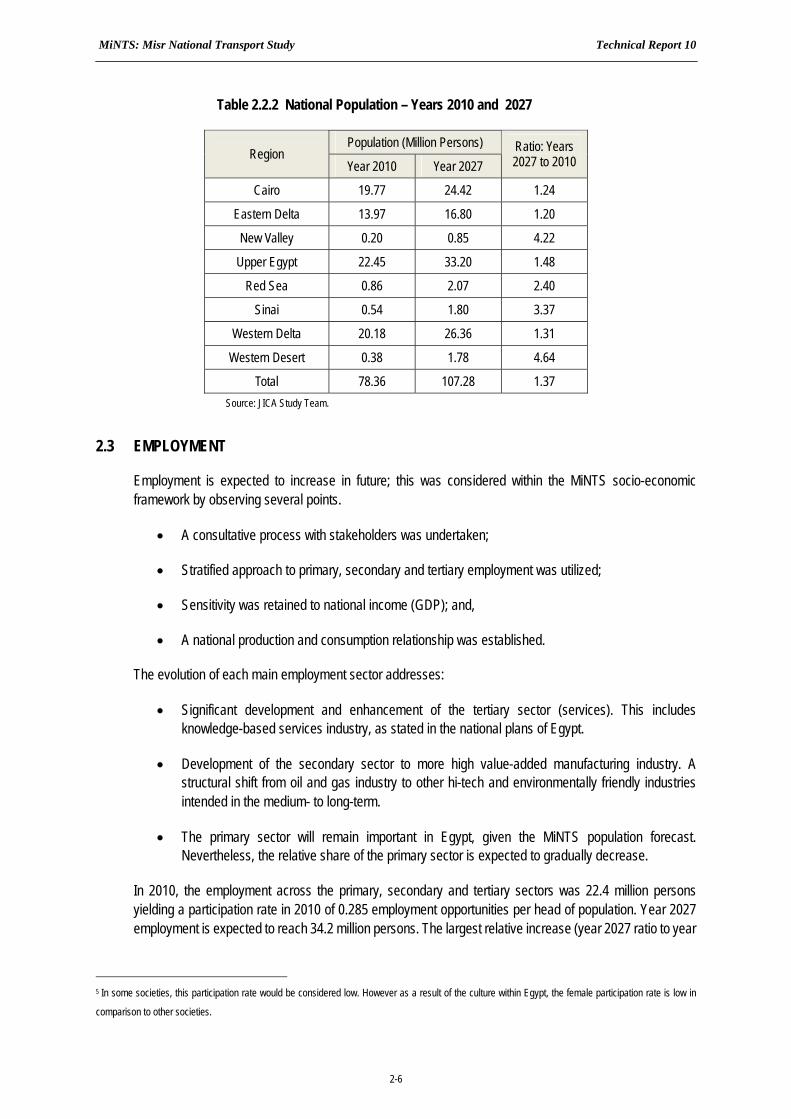
This forecast of 107.3 million persons is also in close agreement with the recent release of the Egypt Vision 2052 document which places the year 2027 national population in vicinity of 108 million persons4. The Vision document envisages a shift in the population growth of the Cairo Delta agglomeration to the Western Desert, New Valley, Sinai and Red Sea Regions. These spatial strategies have been considered in the formation of the MiNTS demographic allocations. In 2010, the Western Desert, New Valley, Sinai and Red Sea Regions housed nearly two million persons. By 2027, these regions are expected to have attracted a total additional population of 4.5 million people. (the detailed change in population across the Large Zones and Regions is shown in Figure 2.2.1). In 2010, the four above regions held 2.5 percent of the total population. By 2027, these same four regions are estimated to hold six percent of the national population. This is still a relatively small proportion of the population. As also seen in Table 2.2.2, the large majority of population is concentrated in existing development areas.
4 Egypt Vision 2052, prepared by the GOPP, Ministry of Housing, Utilities and Urban Communities, 2011 (with updates). This document represents the only
long-term plan for Egypt. The Vision is understood to have been approved by the Prime Minister and the Supreme Council for Urban Development and Planning. The GOPP has started to disseminate the document through seminars/workshops and media interviews in order to attain public consensus,
to be followed by Cabinet approval. Considerable technical elements of the document have been made available to the Study Team, which is gratefully
acknowledged.

MiNTS: Misr National Transport Study Technical Report 10
2-5
Figure 2.2.1 Distribution of National Population – Years 2010 and 2027
MiNTS: Misr National Transport Study Technical Report 10
2-6
Table 2.2.2 National Population – Years 2010 and 2027
Population (Million Persons) Region
Year 2010 Year 2027 Ratio: Years 2027 to 2010
Cairo 19.77 24.42 1.24
Eastern Delta 13.97 16.80 1.20
New Valley 0.20 0.85 4.22
Upper Egypt 22.45 33.20 1.48
Red Sea 0.86 2.07 2.40
Sinai 0.54 1.80 3.37
Western Delta 20.18 26.36 1.31
Western Desert 0.38 1.78 4.64
Total 78.36 107.28 1.37 Source: JICA Study Team.
2.3 EMPLOYMENT
Employment is expected to increase in future; this was considered within the MiNTS socio-economic framework by observing several points.
A consultative process with stakeholders was undertaken;
Stratified approach to primary, secondary and tertiary employment was utilized;
Sensitivity was retained to national income (GDP); and,
A national production and consumption relationship was established.
The evolution of each main employment sector addresses:
Significant development and enhancement of the tertiary sector (services). This includes knowledge-based services industry, as stated in the national plans of Egypt.
Development of the secondary sector to more high value-added manufacturing industry. A structural shift from oil and gas industry to other hi-tech and environmentally friendly industries intended in the medium- to long-term.
The primary sector will remain important in Egypt, given the MiNTS population forecast. Nevertheless, the relative share of the primary sector is expected to gradually decrease.
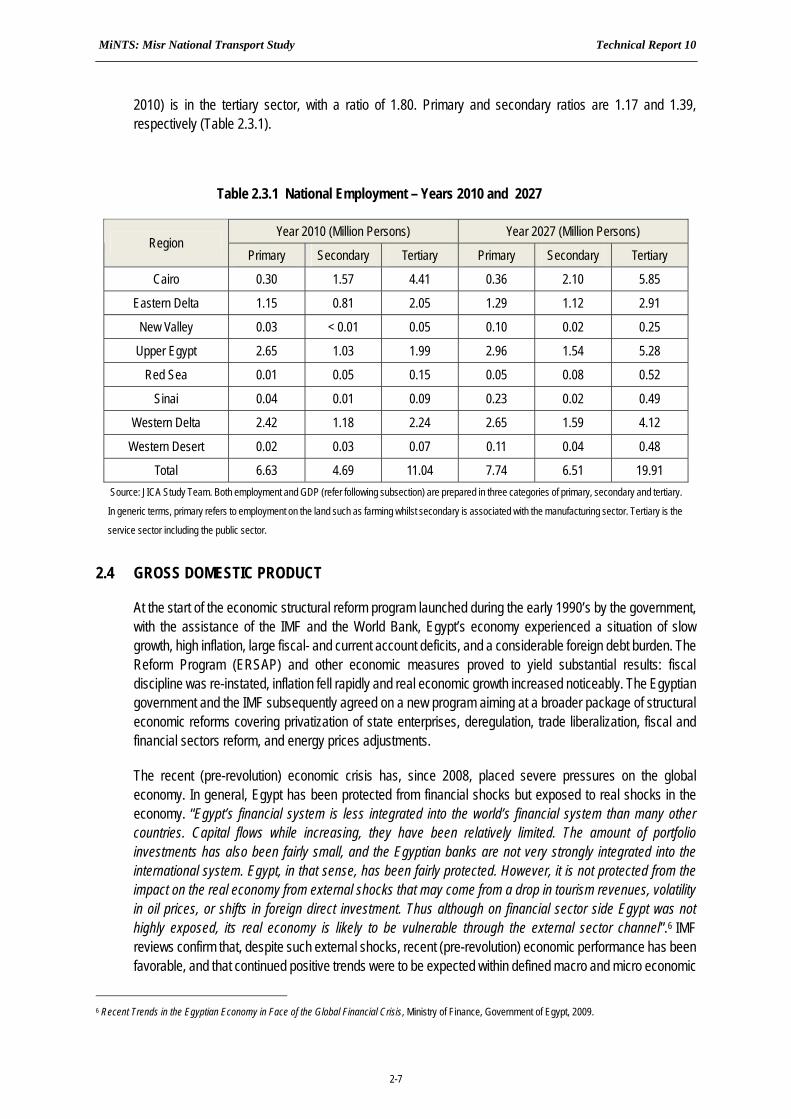
In 2010, the employment across the primary, secondary and tertiary sectors was 22.4 million persons yielding a participation rate in 2010 of 0.285 employment opportunities per head of population. Year 2027 employment is expected to reach 34.2 million persons. The largest relative increase (year 2027 ratio to year
5 In some societies, this participation rate would be considered low. However as a result of the culture within Egypt, the female participation rate is low in
comparison to other societies.
MiNTS: Misr National Transport Study Technical Report 10
2-7
2010) is in the tertiary sector, with a ratio of 1.80. Primary and secondary ratios are 1.17 and 1.39, respectively (Table 2.3.1).
Table 2.3.1 National Employment – Years 2010 and 2027
Year 2010 (Million Persons) Year 2027 (Million Persons) Region
Primary Secondary Tertiary Primary Secondary Tertiary
Cairo 0.30 1.57 4.41 0.36 2.10 5.85
Eastern Delta 1.15 0.81 2.05 1.29 1.12 2.91
New Valley 0.03 < 0.01 0.05 0.10 0.02 0.25
Upper Egypt 2.65 1.03 1.99 2.96 1.54 5.28
Red Sea 0.01 0.05 0.15 0.05 0.08 0.52
Sinai 0.04 0.01 0.09 0.23 0.02 0.49
Western Delta 2.42 1.18 2.24 2.65 1.59 4.12
Western Desert 0.02 0.03 0.07 0.11 0.04 0.48
Total 6.63 4.69 11.04 7.74 6.51 19.91 Source: JICA Study Team. Both employment and GDP (refer following subsection) are prepared in three categories of primary, secondary and tertiary.
In generic terms, primary refers to employment on the land such as farming whilst secondary is associated with the manufacturing sector. Tertiary is the
service sector including the public sector.
2.4 GROSS DOMESTIC PRODUCT
At the start of the economic structural reform program launched during the early 1990’s by the government, with the assistance of the IMF and the World Bank, Egypt’s economy experienced a situation of slow growth, high inflation, large fiscal- and current account deficits, and a considerable foreign debt burden. The Reform Program (ERSAP) and other economic measures proved to yield substantial results: fiscal discipline was re-instated, inflation fell rapidly and real economic growth increased noticeably. The Egyptian government and the IMF subsequently agreed on a new program aiming at a broader package of structural economic reforms covering privatization of state enterprises, deregulation, trade liberalization, fiscal and financial sectors reform, and energy prices adjustments.
The recent (pre-revolution) economic crisis has, since 2008, placed severe pressures on the global economy. In general, Egypt has been protected from financial shocks but exposed to real shocks in the economy. “Egypt’s financial system is less integrated into the world’s financial system than many other countries. Capital flows while increasing, they have been relatively limited. The amount of portfolio investments has also been fairly small, and the Egyptian banks are not very strongly integrated into the international system. Egypt, in that sense, has been fairly protected. However, it is not protected from the impact on the real economy from external shocks that may come from a drop in tourism revenues, volatility in oil prices, or shifts in foreign direct investment. Thus although on financial sector side Egypt was not highly exposed, its real economy is likely to be vulnerable through the external sector channel”.6 IMF reviews confirm that, despite such external shocks, recent (pre-revolution) economic performance has been favorable, and that continued positive trends were to be expected within defined macro and micro economic
6 Recent Trends in the Egyptian Economy in Face of the Global Financial Crisis, Ministry of Finance, Government of Egypt, 2009.
MiNTS: Misr National Transport Study Technical Report 10
2-8
frameworks7. Pre-revolution growth in real GDP peaked, since 1987, at slightly over 7 percent during years 2007 and 2008, with lowest growth recorded being 1.1 percent during year 1991. The average annual pre-economic crisis rate of growth from 1987 to 2008, stratified by five year periods, averaged to 3.8, 4.6, 4.1 and 5.8 percent, respectively. Pre-revolution MiNTS forecasts of GDP growth continued this trend falling, as supported by the MiNTS Steering Committee, into the five to seven percent per annum range.
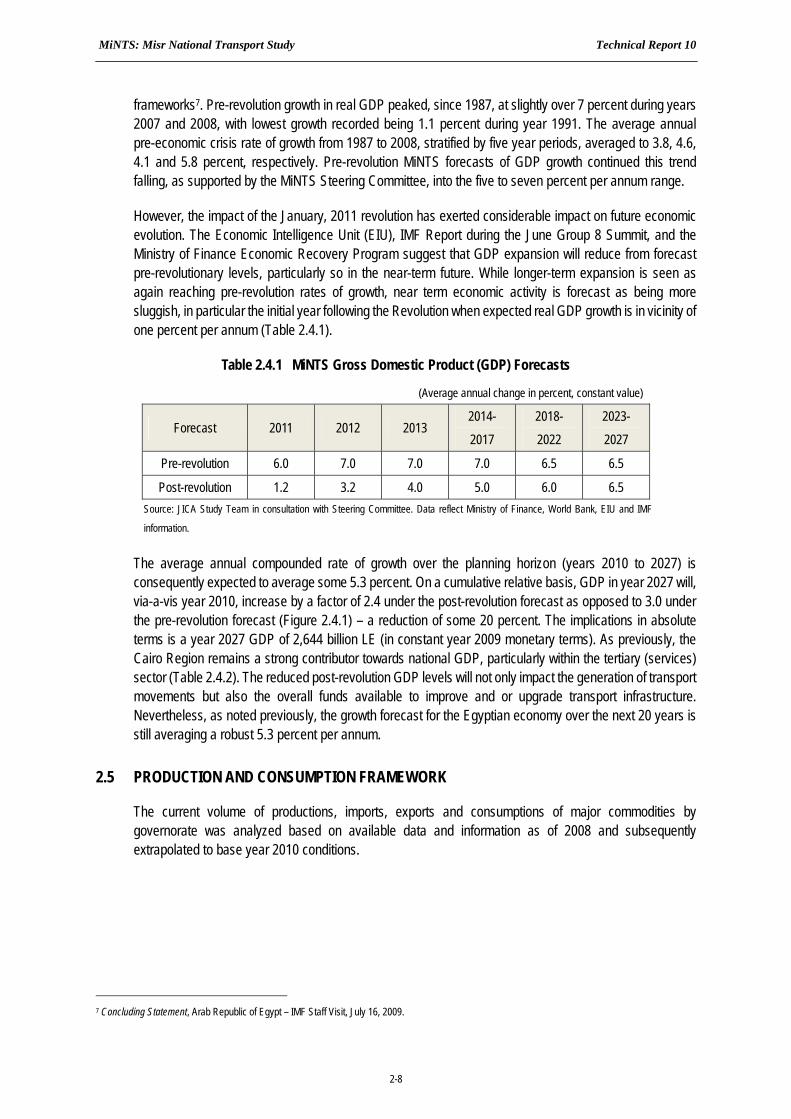
However, the impact of the January, 2011 revolution has exerted considerable impact on future economic evolution. The Economic Intelligence Unit (EIU), IMF Report during the June Group 8 Summit, and the Ministry of Finance Economic Recovery Program suggest that GDP expansion will reduce from forecast pre-revolutionary levels, particularly so in the near-term future. While longer-term expansion is seen as again reaching pre-revolution rates of growth, near term economic activity is forecast as being more sluggish, in particular the initial year following the Revolution when expected real GDP growth is in vicinity of one percent per annum (Table 2.4.1).
Table 2.4.1 MiNTS Gross Domestic Product (GDP) Forecasts
(Average annual change in percent, constant value)
Forecast 2011 2012 2013 2014-
2017
2018-
2022
2023-
2027
Pre-revolution 6.0 7.0 7.0 7.0 6.5 6.5
Post-revolution 1.2 3.2 4.0 5.0 6.0 6.5 Source: JICA Study Team in consultation with Steering Committee. Data reflect Ministry of Finance, World Bank, EIU and IMF
information.
The average annual compounded rate of growth over the planning horizon (years 2010 to 2027) is consequently expected to average some 5.3 percent. On a cumulative relative basis, GDP in year 2027 will, via-a-vis year 2010, increase by a factor of 2.4 under the post-revolution forecast as opposed to 3.0 under the pre-revolution forecast (Figure 2.4.1) – a reduction of some 20 percent. The implications in absolute terms is a year 2027 GDP of 2,644 billion LE (in constant year 2009 monetary terms). As previously, the Cairo Region remains a strong contributor towards national GDP, particularly within the tertiary (services) sector (Table 2.4.2). The reduced post-revolution GDP levels will not only impact the generation of transport movements but also the overall funds available to improve and or upgrade transport infrastructure. Nevertheless, as noted previously, the growth forecast for the Egyptian economy over the next 20 years is still averaging a robust 5.3 percent per annum.
2.5 PRODUCTION AND CONSUMPTION FRAMEWORK
The current volume of productions, imports, exports and consumptions of major commodities by governorate was analyzed based on available data and information as of 2008 and subsequently extrapolated to base year 2010 conditions.
7 Concluding Statement, Arab Republic of Egypt – IMF Staff Visit, July 16, 2009.

MiNTS: Misr National Transport Study Technical Report 10
2-9
Table 2.4.2 Gross Regional Domestic Product
Year 2010 (Thousand Constant Year 2009 LE)
Year 2027 (Thousand Constant Year 2009 LE) Region
Primary Secondary Tertiary Primary Secondary Tertiary
Cairo 7,275,560 147,694,097 240,221,310 13,070,847 310,804,700 485,393,939
Eastern Delta 24,885,787 65,726,908 93,615,215 42,760,970 145,300,056 205,933,319
New Valley 801,807 226,220 2,227,063 3,691,113 2,160,227 18,606,273
Upper Egypt 56,032,096 80,227,826 87,543,873 96,052,034 191,557,328 359,322,732
Red Sea 249,707 5,013,285 8,488,364 2,013,796 13,510,791 46,134,281
Sinai 865,060 921,421 4,452,931 8,527,213 3,237,079 37,456,613
Western Delta 51,235,597 101,119,344 105,904,226 85,977,700 219,099,687 305,429,536
Western Desert 558,305 2,951,280 3,331,316 4,224,064 5,589,168 36,428,407
Total 141,903,918 403,880,382 545,784,300 256,317,737 891,259,035 1,494,705,098 Source: JICA Study Team.
0.0
0.5
1.0
1.5
2.0
2.5
3.0
3.5C
hang
e in
Con
stan
t GD
P (Y
ear
2010
= 1
.0)
Year
Post-revolution Trend
Pre-revolution Trend
Historic Growth
Source: JICA Study Team based on World Bank, IMF, CAPMAS and Ministry of Finance data. Pre and post revolution forecasts derived in
conjunction with MiNTS Steering Committee.
Observed Forecast
Source: JICA Study Team
Figure 2.4.1 Historic and Forecast Relative Trend in National GDP
MiNTS: Misr National Transport Study Technical Report 10
2-10
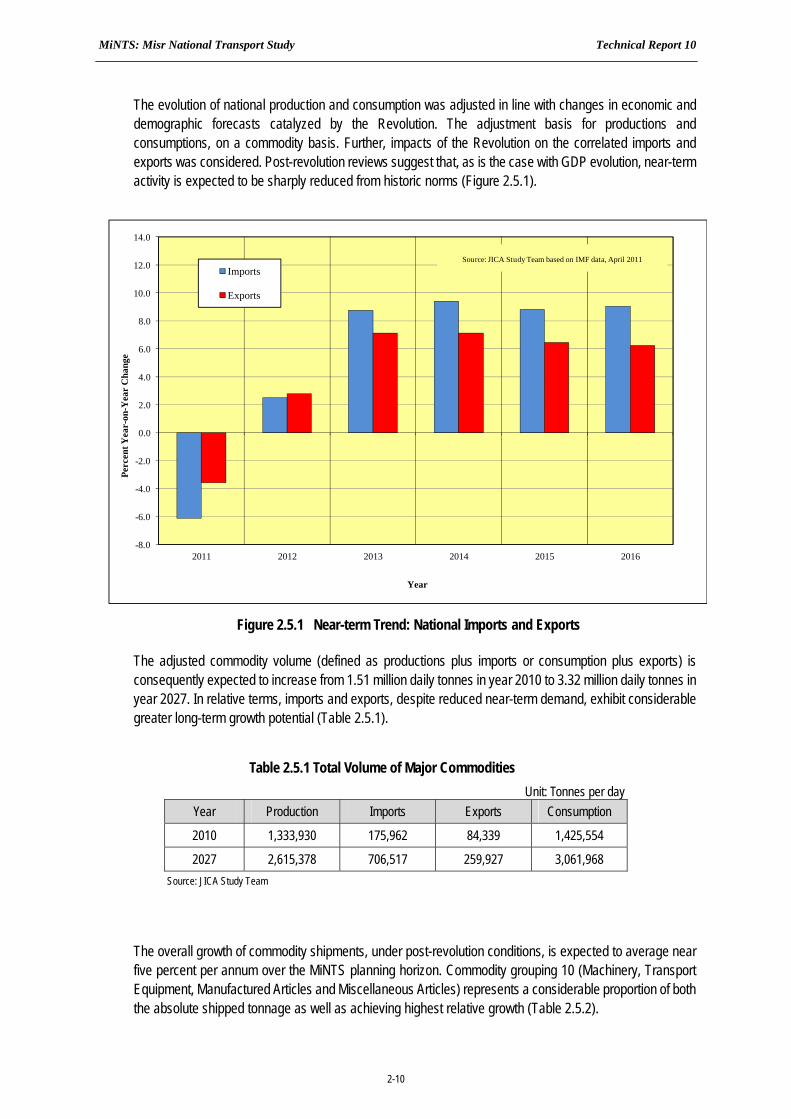
The evolution of national production and consumption was adjusted in line with changes in economic and demographic forecasts catalyzed by the Revolution. The adjustment basis for productions and consumptions, on a commodity basis. Further, impacts of the Revolution on the correlated imports and exports was considered. Post-revolution reviews suggest that, as is the case with GDP evolution, near-term activity is expected to be sharply reduced from historic norms (Figure 2.5.1).
The adjusted commodity volume (defined as productions plus imports or consumption plus exports) is consequently expected to increase from 1.51 million daily tonnes in year 2010 to 3.32 million daily tonnes in year 2027. In relative terms, imports and exports, despite reduced near-term demand, exhibit considerable greater long-term growth potential (Table 2.5.1).
Table 2.5.1 Total Volume of Major Commodities Unit: Tonnes per day
Year Production Imports Exports Consumption
2010 1,333,930 175,962 84,339 1,425,554
2027 2,615,378 706,517 259,927 3,061,968 Source: JICA Study Team
The overall growth of commodity shipments, under post-revolution conditions, is expected to average near five percent per annum over the MiNTS planning horizon. Commodity grouping 10 (Machinery, Transport Equipment, Manufactured Articles and Miscellaneous Articles) represents a considerable proportion of both the absolute shipped tonnage as well as achieving highest relative growth (Table 2.5.2).
-8.0
-6.0
-4.0
-2.0
0.0
2.0
4.0
6.0
8.0
10.0
12.0
14.0
2011 2012 2013 2014 2015 2016
Perc
ent Y
ear-
on-Y
ear
Cha
nge
Year
Imports
Exports
Source: JICA Study Team based on IMF data, April 2011
Figure 2.5.1 Near-term Trend: National Imports and Exports

MiNTS: Misr National Transport Study Technical Report 10
2-11
Table 2.5.2 Shipped Commodity Tonnage Unit: Tonnes per day
Item Product 2010 2027 Average Annual Change (%)
1 Agricultural Products 158,959 254,795 2.8
2 Food Stuffs and Animal Fodder 78,839 134,339 3.2
3 Solid Mineral Fuels 11,722 17,749 2.5
4 Petroleum Products 382,041 643,053 3.1
5 Ores and Metal Waste 50,129 87,762 3.4
6 Metal Products 9,177 33,162 7.9
7 Crude, Manufactured Minerals and Building Materials 514,601 973,335 3.8
8 Fertilizers 36,520 102,248 6.2
9 Chemicals 48,714 95,200 4.0
10 Machinery, Transport Equipment,
Manufactured Articles and Miscellaneous Articles
206,931 965,069 9.5
11 Live Animal 12,262 15,183 1.3
Total 1,509,892 3,321,895 4.8 Source: JICA Study Team. Tonnage by all modes. Defined as productions plus imports or consumption plus exports. Slightly over 80 percent of Commodity Group 4 (Petroleum Products) is shipped via pipeline.
2.6 TRADE EXTERNALITIES
Egypt has signed several important Free Trade Agreements (FTAs), among which COMESA, GAFTA, the EU-Egypt Partnership Agreement, the Agadir Free Trade Agreement, and the Egypt-EFTA Free Trade Agreement. The country also has preferential agreements with individual countries such as Syria and free trade agreements with Turkey since March 2007 and, more recently, with EFTA countries, and in the near future with the four MERCUSOR countries -- Brazil, Argentina, Uruguay and Paraguay. Quantitative reviews (refer Appendix B) confirm the EU remains the dominant trading partner of Egypt with 33% of total trade volume, a relationship unlikely to change in the short or medium term future. On the contrary, the agreement on further liberalization of bilateral trade in agricultural, processed agricultural products and fish and fishery products, signed by the two parties in October 2009, will in 2010 further increase trade relations between the two partners. Thus, the form and extent of future trade patterns will be strongly dictated by services and/or needs involving the EU.
How might the European vision for the Mediterranean impact future Egyptian trade?
2.6.1 The Policy Perspective
Public decision makers in Europe have a particular interest in the Mediterranean basin considering that several EU Member States are directly linked to this major international (maritime) transport corridor. Its importance has been amply established by the new Mediterranean partnership, endorsed in November 2008 at the Marseille Meeting of the Euro-Mediterranean Ministers of Foreign Affairs, which now includes all 27 member states of the European Union, along with 16 partners across the Southern Mediterranean and the Middle East. In other words, the EU has incorporated other group initiatives such as the Arab League under the formal “Union for the Mediterranean”.
MiNTS: Misr National Transport Study Technical Report 10
2-12
The importance is further demonstrated by the six priority projects of the EU Mediterranean initiative which are:
The de-pollution of the Mediterranean Sea;
The establishment of maritime and land highways;
Civil protection initiatives to combat natural and man-made disasters;
A Mediterranean solar energy plan;
The inauguration of the Euro-Mediterranean University in Slovenia; and
And the Mediterranean Business Development Initiative focusing on micro, small and medium-sized enterprises.
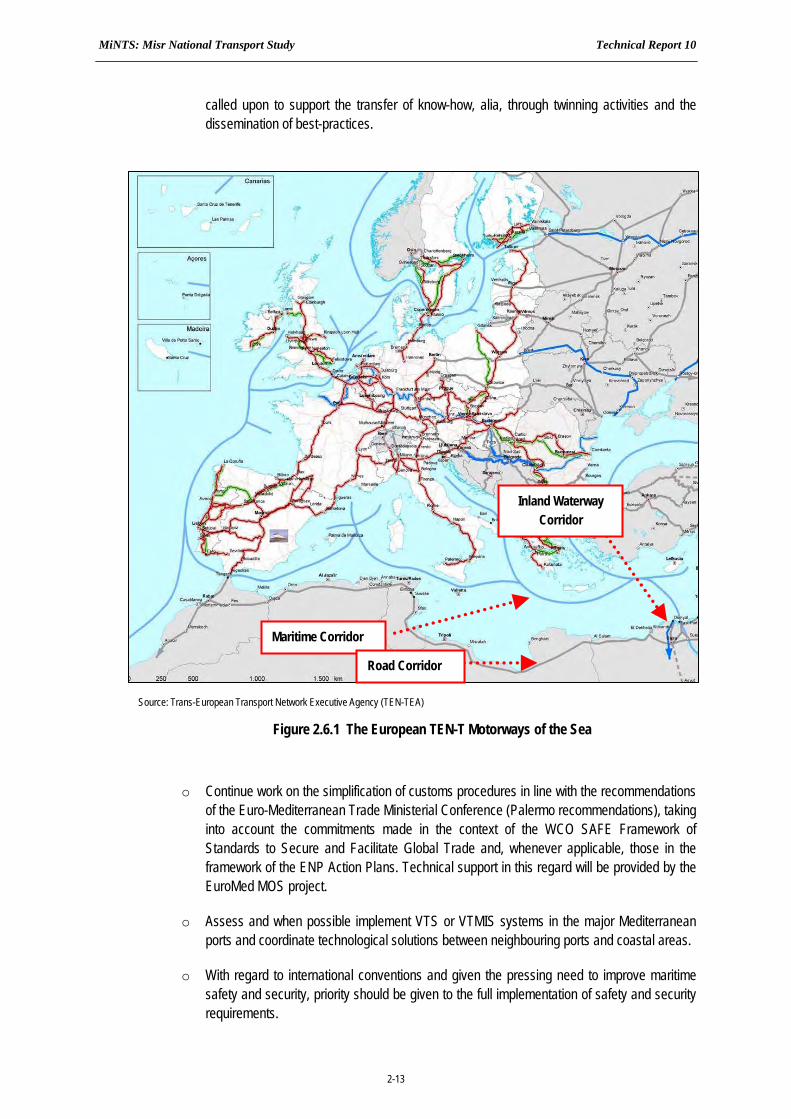
In terms of transport, the long-term EU vision, pursued with the Union for the Mediterranean, is made explicit in the Regional Transport Action Plan (RTAP) for the Mediterranean, which was approved in Brussels on 29-30 May 2007. The RTAP proposes 34 actions in a number of areas including maritime transport, road transport, railway transport, civil aviation, multimodal transport and transport infrastructure networks, as well as with respect to sustainability issues.
The RATP agreed following actions for the maritime transport8
Short-term implementation
o Elaborate national measures for the reduction of dwell times in container terminals with the support of the EuroMed Motorways of the Sea (MOS) (Figure 2.6.1) project. These measures should be used by each port management authority as a basis for their annual business plans.
o Introduce the recommendations standardizing basic reporting formalities of ships when arriving and/or departing from ports so that documentation can be accepted equivalently in all regional ports. Technical support in this respect shall be provided by the EuroMed MOS project.
o Assess the performance of competition-related reforms in national shipping sectors and produce recommendations for the removal of factors distorting competition. The working group on ‘maritime transport’ of the Euro-Mediterranean Transport Forum is called to monitor this activity. The EC should provide external expertise as required.
o The European Maritime Safety Agency is called upon to examine ways for cooperation with the Mediterranean Countries and, on this basis, define concrete areas of cooperation.
Medium-term implementation
o Work towards the assignment of the tasks of port and terminal management, on the one hand, and regulation, on the other hand, to different autonomous agencies. Port and terminal management should be decentralized, for instance through private sector concessions. The concept of port community should be installed within each port. The European Commission is
8 Source: ‘Regional Transport Action Plan for the Mediterranean Region 2007-2013. Priority actions in the transport sector for the period 2007-2013, approved
by the Mediterranean Partners; October 2007
MiNTS: Misr National Transport Study Technical Report 10
2-13
called upon to support the transfer of know-how, alia, through twinning activities and the dissemination of best-practices.
o Continue work on the simplification of customs procedures in line with the recommendations of the Euro-Mediterranean Trade Ministerial Conference (Palermo recommendations), taking into account the commitments made in the context of the WCO SAFE Framework of Standards to Secure and Facilitate Global Trade and, whenever applicable, those in the framework of the ENP Action Plans. Technical support in this regard will be provided by the EuroMed MOS project.
o Assess and when possible implement VTS or VTMIS systems in the major Mediterranean ports and coordinate technological solutions between neighbouring ports and coastal areas.
o With regard to international conventions and given the pressing need to improve maritime safety and security, priority should be given to the full implementation of safety and security requirements.
Source: Trans-European Transport Network Executive Agency (TEN-TEA)
Figure 2.6.1 The European TEN-T Motorways of the Sea
Maritime Corridor
Inland Waterway Corridor
Road Corridor

MiNTS: Misr National Transport Study Technical Report 10
2-14
2.6.2 The Business Perspective
Although the policy makers of today still look towards the establishment of EU initiatives such the Motorways of the Seas as a key part of the strategy, European and national funding systems for its development have failed to initiate real and sustainable change among private actors of the logistic chains, in particular the major shipping lines, the ultimate decision-takers. The MOS are therefore increasingly considered by the public decision makers as complex projects, depending on too many external factors over which policy makers have no control (industrial strategies, oil prices, global market evolutions, among others).
Indeed, the MOS is a concept that is subject to / depends upon the commercial evolution of maritime traffic. Corporate strategies of the major operators are not guided by policy ambitions and objectives, but by realities of the marketplace, meaning the “bottom line” determined by the return on investment and the net profit. In general, the major shipping lines increasingly look at “economies of scale” (size) and “route rationalization” (time) as prime decision factors, leading to the use of continuously larger vessels combined with a constant reduction of port calls. Consequently, it will be the relation with and integration into long-haul maritime liner routes together with the hinterland networks of key ports that will decide on the structure and efficiency of national transport systems to economic and industrial growth of nations.
Combining large size transport means with rationalized routing is likely to be the leading strategy for all (maritime) transport systems of the future. Very Large and Ultra Large Carriers are already operational for the transport of bulk, oil, cars, tourism, passengers and in growing number in container transport. The increase in vessel size is now rapidly proceeding, to include the container liner sector. Today, there are near 6,000 ships active on container liner trades, totaling 14.4 million TEU (189.9 million TDW). By 2015 but most probably even earlier, the Ultra Large Container Ships of 10,000 and 12,000 TEU will be the dominant vessel type on the arterial routes.
The capacity expansion is only beginning. With a capacity of 18,000 TEU, the Malacca Max9 might become reality in the future although most probably only on the round the world routes with highly limited calls to ports due to capacity and technical restrictions of most ports to accommodate this type of vessel. This evolution of large scale vessels and minimum calls would be imposed because these 18,000 EU vessels would be too big for the present Suez Canal. Even the planned increase of the cross-section breadth and depth of the Suez Canal would allow accommodating 18,000 TEU containerships would not benefit Mediterranean ports as these ships with a draught of 21 m cannot call any ports in the region without massive dredging. At present, only the harbours of Singapore and Rotterdam are deep enough.
The reason for the interest in this massive size vessel is because the transportation cost per container could be about 30 percent lower than that of a typical 5,000-6,000 TEU container vessel, reason why now the largest operators are operating several 10,000 TEU and are rapidly upgrading towards 12,000 TEU vessels.
2.6.3 Implications for Egypt
A large share of national revenues is generated by international trade, primarily with Europe (about 33 percent), followed by the United States (near 10 percent). This strong international orientation has direct consequences on maritime traffic to and from Egypt, principal transport mode to support international trade.
9 A draught of 21 m is the maximum permissible draught through the Malacca Strait, hence the name; See for details: Prof. Dr, Ing. T. Wijnolst et al.:
“Malacca-max, The Ultimate Container Carrier” Delft University, The Netherlands, 1999
MiNTS: Misr National Transport Study Technical Report 10
2-15
Recent reviews argue that maritime and related logistics services in Egypt can play an important role in achieving national policy objectives through their strong linkages to the Egyptian economy; to wit “... adoption of a comprehensive strategy consisting of regulatory and competition policy dimensions as well as targeted public infrastructure investments to overcome existing challenges in these sectors and contribute to the creation of an enabling environment. Additionally, reform in the maritime and related logistics sectors would increase in effectiveness through simultaneous strengthening in the closely related sector of multimodal transport.”10 According to the review, the maritime sector and related logistics services together with other production services constitute 36 percent of GDP and 16 percent of jobs in the economy.
Egypt, as do most countries in the Mediterranean region, has the firm ambition to become a regional hub for transhipments and containerized trade. The implementation of this objective is made explicit in current national planning, where a key objective is to modernize Egyptian ports11. Aiming to create independent profit-oriented, cost-based corporations to manage the ports via the “landlord port” model, most of the plan remains policy paper with its implementation lagging.
Many reasons can be put forward to explain the difficulties of Egypt (and other countries) to become a true maritime hubs. The role of global maritime operators and their (round the world and other long distance) services calling only few selected ports is undoubtedly a very deterministic factor.
The expected growth of maritime traffic in the Mediterranean region will require the further development of Egyptian ports on the international shipping routes, not only to link the Egyptian industry to the world’s economies, but also the try positioning one or more key ports in Egypt as international hubs. The role of ports, as noted in the Egypt Vision 2052 document, will undoubtedly enhance the competitiveness of foreign trade and allow access to global markets via the linking of the national transport network via the ports and some land crossings with the international transport systems. At present, the Egyptian transport system is under development and the accent on the ports and maritime sector is to upgrade port efficiency in order to improve the transit of import and export cargo as well as transit cargo through the Egyptian key ports.
10 Ahmed F. Ghoneim & Omneia A. Helmy: “Maritime Transport and Related Logistics Services in Egypt”; International Centre for Trade and Sustainable
Development (ICTSD) – Programme on Trade in Services and Sustainable Development, Issue Paper No. 8, December 2007 11 Refer MiNTS Technical Report 4, Maritime Sector for additional detail.
MiNTS: Misr National Transport Study Technical Report 10
3 - 1
CHAPTER 3: VISION ON FUTURE MOBILITY
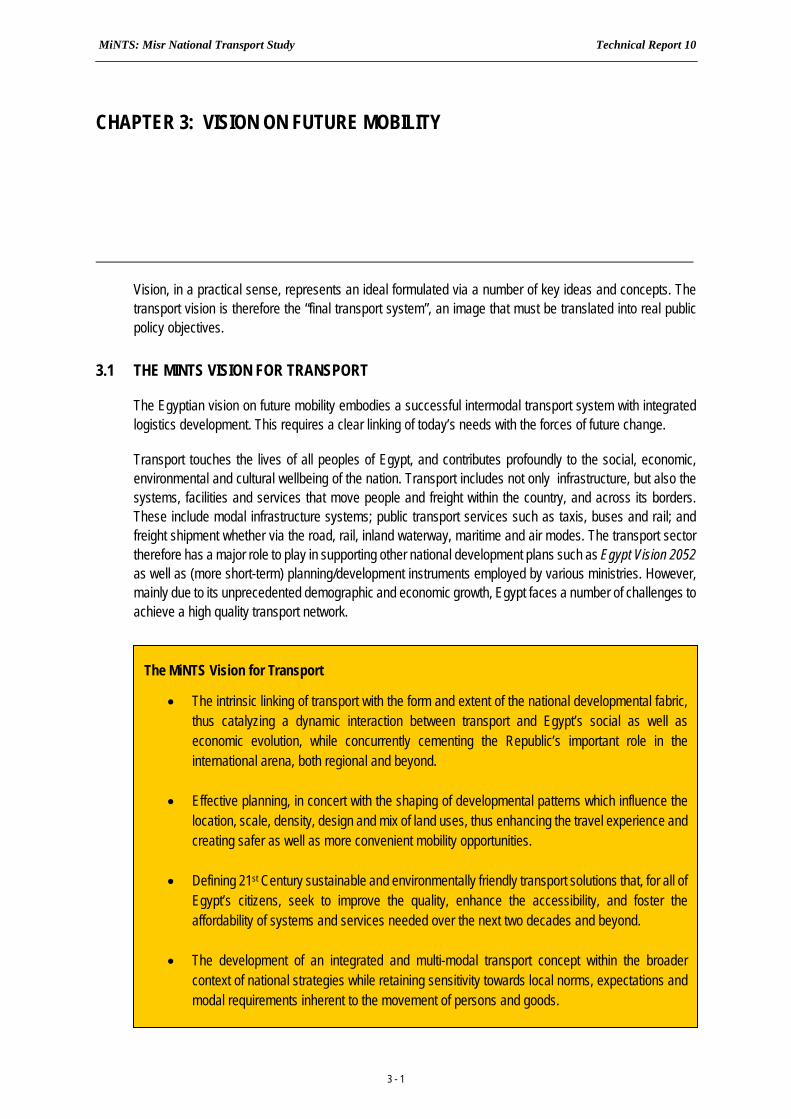
Vision, in a practical sense, represents an ideal formulated via a number of key ideas and concepts. The transport vision is therefore the “final transport system”, an image that must be translated into real public policy objectives.
3.1 THE MINTS VISION FOR TRANSPORT
The Egyptian vision on future mobility embodies a successful intermodal transport system with integrated logistics development. This requires a clear linking of today’s needs with the forces of future change.
Transport touches the lives of all peoples of Egypt, and contributes profoundly to the social, economic, environmental and cultural wellbeing of the nation. Transport includes not only infrastructure, but also the systems, facilities and services that move people and freight within the country, and across its borders. These include modal infrastructure systems; public transport services such as taxis, buses and rail; and freight shipment whether via the road, rail, inland waterway, maritime and air modes. The transport sector therefore has a major role to play in supporting other national development plans such as Egypt Vision 2052 as well as (more short-term) planning/development instruments employed by various ministries. However, mainly due to its unprecedented demographic and economic growth, Egypt faces a number of challenges to achieve a high quality transport network.
The MiNTS Vision for Transport
The intrinsic linking of transport with the form and extent of the national developmental fabric, thus catalyzing a dynamic interaction between transport and Egypt’s social as well as economic evolution, while concurrently cementing the Republic’s important role in the international arena, both regional and beyond.
Effective planning, in concert with the shaping of developmental patterns which influence the location, scale, density, design and mix of land uses, thus enhancing the travel experience and creating safer as well as more convenient mobility opportunities.
Defining 21st Century sustainable and environmentally friendly transport solutions that, for all of Egypt’s citizens, seek to improve the quality, enhance the accessibility, and foster the affordability of systems and services needed over the next two decades and beyond.
The development of an integrated and multi-modal transport concept within the broader context of national strategies while retaining sensitivity towards local norms, expectations and modal requirements inherent to the movement of persons and goods.
MiNTS: Misr National Transport Study Technical Report 10
3 - 2
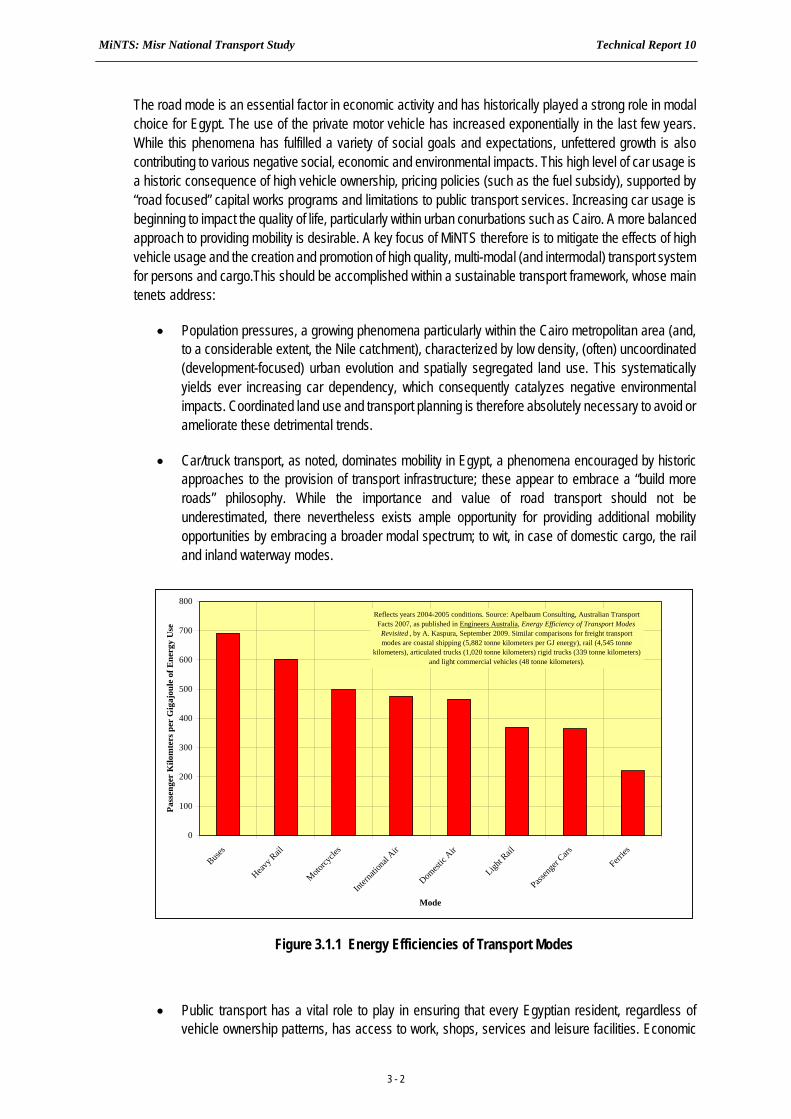
The road mode is an essential factor in economic activity and has historically played a strong role in modal choice for Egypt. The use of the private motor vehicle has increased exponentially in the last few years. While this phenomena has fulfilled a variety of social goals and expectations, unfettered growth is also contributing to various negative social, economic and environmental impacts. This high level of car usage is a historic consequence of high vehicle ownership, pricing policies (such as the fuel subsidy), supported by “road focused” capital works programs and limitations to public transport services. Increasing car usage is beginning to impact the quality of life, particularly within urban conurbations such as Cairo. A more balanced approach to providing mobility is desirable. A key focus of MiNTS therefore is to mitigate the effects of high vehicle usage and the creation and promotion of high quality, multi-modal (and intermodal) transport system for persons and cargo.This should be accomplished within a sustainable transport framework, whose main tenets address:
Population pressures, a growing phenomena particularly within the Cairo metropolitan area (and, to a considerable extent, the Nile catchment), characterized by low density, (often) uncoordinated (development-focused) urban evolution and spatially segregated land use. This systematically yields ever increasing car dependency, which consequently catalyzes negative environmental impacts. Coordinated land use and transport planning is therefore absolutely necessary to avoid or ameliorate these detrimental trends.
Car/truck transport, as noted, dominates mobility in Egypt, a phenomena encouraged by historic approaches to the provision of transport infrastructure; these appear to embrace a “build more roads” philosophy. While the importance and value of road transport should not be underestimated, there nevertheless exists ample opportunity for providing additional mobility opportunities by embracing a broader modal spectrum; to wit, in case of domestic cargo, the rail and inland waterway modes.
Public transport has a vital role to play in ensuring that every Egyptian resident, regardless of vehicle ownership patterns, has access to work, shops, services and leisure facilities. Economic
0
100
200
300
400
500
600
700
800
Buses
Heavy R
ail
Motorcy
cles
Intern
ation
al Air
Domest
ic Air
Light R
ail
Passen
ger C
ars
Ferries
Mode
Pass
enge
r K
ilom
ters
per
Gig
ajou
le o
f Ene
rgy
Use
Reflects years 2004-2005 conditions. Source: Apelbaum Consulting, Australian Transport Facts 2007, as published in Engineers Australia, Energy Efficiency of Transport Modes Revisited , by A. Kaspura, September 2009. Similar comparisons for freight transport modes are coastal shipping (5,882 tonne kilometers per GJ energy), rail (4,545 tonne
kilometers), articulated trucks (1,020 tonne kilometers) rigid trucks (339 tonne kilometers) and light commercial vehicles (48 tonne kilometers).
Figure 3.1.1 Energy Efficiencies of Transport Modes

MiNTS: Misr National Transport Study Technical Report 10
3 - 3
dynamism and social cohesion are at stake. Public transport costs the community less than cars, consumes far less road space and energy (Figure 3.1.1) and is more environmentally friendly as well as less damaging to the health.
Two core elements guide the formation of this vision:
The equitable and realistic allocation of demand, for passengers and cargo, among the various modes; and
The longer-term spatial objectives of the Republic and requisite strategic transport corridors to serve anticipated demand.
These elements are further presented in subsequent pages of this chapter.
3.2 MOBILITY PATTERNS
Mobility patterns relate to the interaction of the various modes (principally road, rail and inland waterway) in terms of meeting passenger and cargo demands.
3.2.1 The International Perspective - Cargo
The transport of cargo within the European Union has increased steadily from under 3,000 billion annual tonne kilometers in year 1995 to roughly 4,100 billion tonne kilometers in year 2007. The road sector is the principal mode accounting for, in relative terms, 44 percent of shipments in 1995 and 47 percent in 2007. The relative share of all other modes (except air), while increasing in absolute terms, has declined in relative terms. For example, in case of rail from 13 to 11 percent, and in case of inland waterway from 4.1 to 3.1 percent (Figure 3.2.1).
0
500
1,000
1,500
2,000
2,500
3,000
3,500
4,000
4,500
1995
1996
1997
1998
1999
2000
2001
2002
2003
2004
2005
2006
2007
Year
Bill
ion
Ann
ual T
onne
Kilo
met
ers
AirMaritime (Intra EU)Inland WaterwayRailRoad
Source: JICA Study Team based on data contained in European Road Statistics 2009 , Eurostat, Brussels,
Belgium. Data refer to EU-27 nations.
1995 PercentageRoad 43.7Rail 13.1IWT 4.1Maritime 39.0 Air 0.1
2007 PercentageRoad 47.0Rail 11.0IWT 3.4Maritime 38.4 Air 0.1
Figure 3.2.1 Cargo Modal Split, European Union: 1995-2007
MiNTS: Misr National Transport Study Technical Report 10
3 - 4
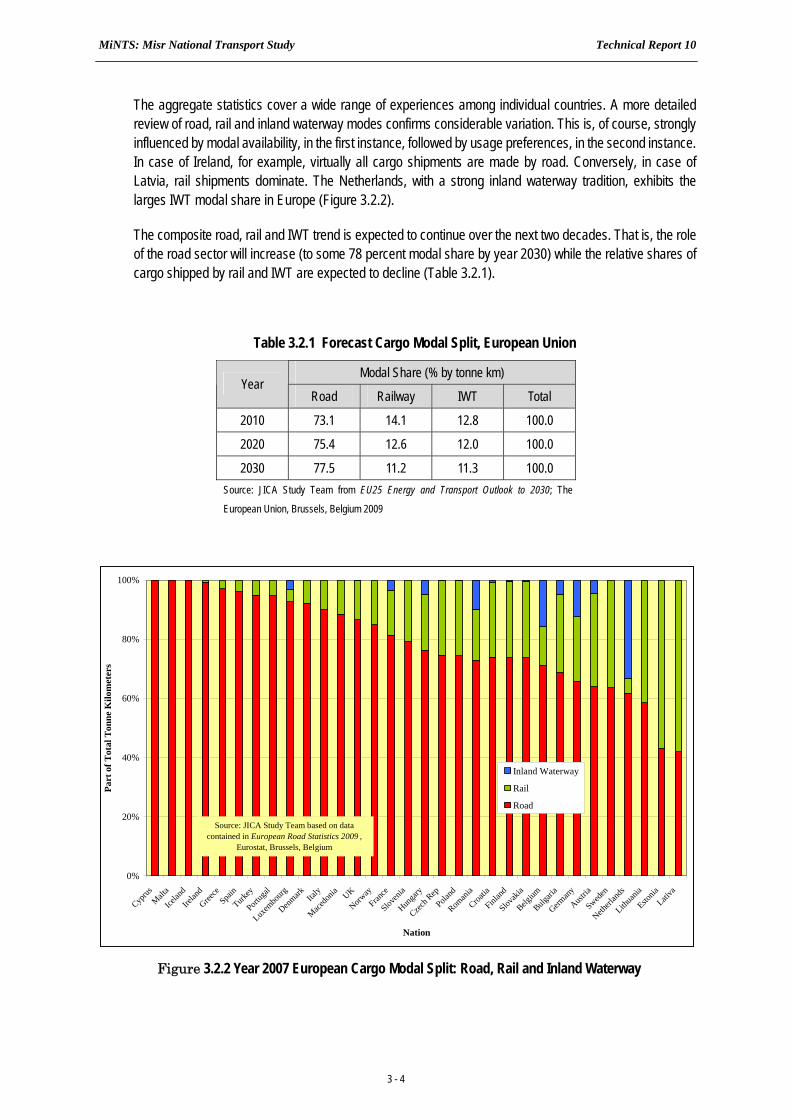
The aggregate statistics cover a wide range of experiences among individual countries. A more detailed review of road, rail and inland waterway modes confirms considerable variation. This is, of course, strongly influenced by modal availability, in the first instance, followed by usage preferences, in the second instance. In case of Ireland, for example, virtually all cargo shipments are made by road. Conversely, in case of Latvia, rail shipments dominate. The Netherlands, with a strong inland waterway tradition, exhibits the larges IWT modal share in Europe (Figure 3.2.2).
The composite road, rail and IWT trend is expected to continue over the next two decades. That is, the role of the road sector will increase (to some 78 percent modal share by year 2030) while the relative shares of cargo shipped by rail and IWT are expected to decline (Table 3.2.1).
Table 3.2.1 Forecast Cargo Modal Split, European Union
Modal Share (% by tonne km) Year
Road Railway IWT Total
2010 73.1 14.1 12.8 100.0
2020 75.4 12.6 12.0 100.0
2030 77.5 11.2 11.3 100.0 Source: JICA Study Team from EU25 Energy and Transport Outlook to 2030; The
European Union, Brussels, Belgium 2009
0%
20%
40%
60%
80%
100%
Cyprus
Malta
Icelan
d
Irelan
d
Greece
Spain
Turkey
Portug
al
Luxem
bourg
Denmark Ita
ly
Macedo
nia UK
Norway
France
Sloven
ia
Hunga
ry
Czech R
epPola
nd
Roman
ia
Croatia
Finlan
d
Slovak
ia
Belgium
Bulgari
a
German
y
Austria
Sweden
Netherl
ands
Lithua
nia
Estonia
Lativa
Nation
Part
of T
otal
Ton
ne K
ilom
eter
s
Inland Waterway
Rail
Road
Source: JICA Study Team based on data contained in European Road Statistics 2009 ,
Eurostat, Brussels, Belgium
Figure 3.2.2 Year 2007 European Cargo Modal Split: Road, Rail and Inland Waterway

MiNTS: Misr National Transport Study Technical Report 10
3 - 5
The United States, like the European Union, has experienced steady growth in cargo shipments since 1990. However, unlike the EU, the rail sector is the principal mode accounting for, in relative terms, 39 percent of year 2003 shipments1. The road mode accounts for the next largest share, approaching one-third of annual ton miles. Over the period of record, the inland waterway and pipeline modal shares are shown as declining in relative terms (Figure 3.2.3). However, caution is required when comparing modal performance between European and American data. The US data for cargo shipments via the road mode, for example, are based on longer distance (i.e. intercity or inter regional) truck trips. Thus, unavoidably, the greater geographic distances of the United States, and heavy mineral shipments (for example, coal) introduce a highly positive result for the rail mode. Inclusion of short truck trips, as is the case with European data, would surely decrease, on a relative scale, the modal share of American railways while boosting the road (truck) share.
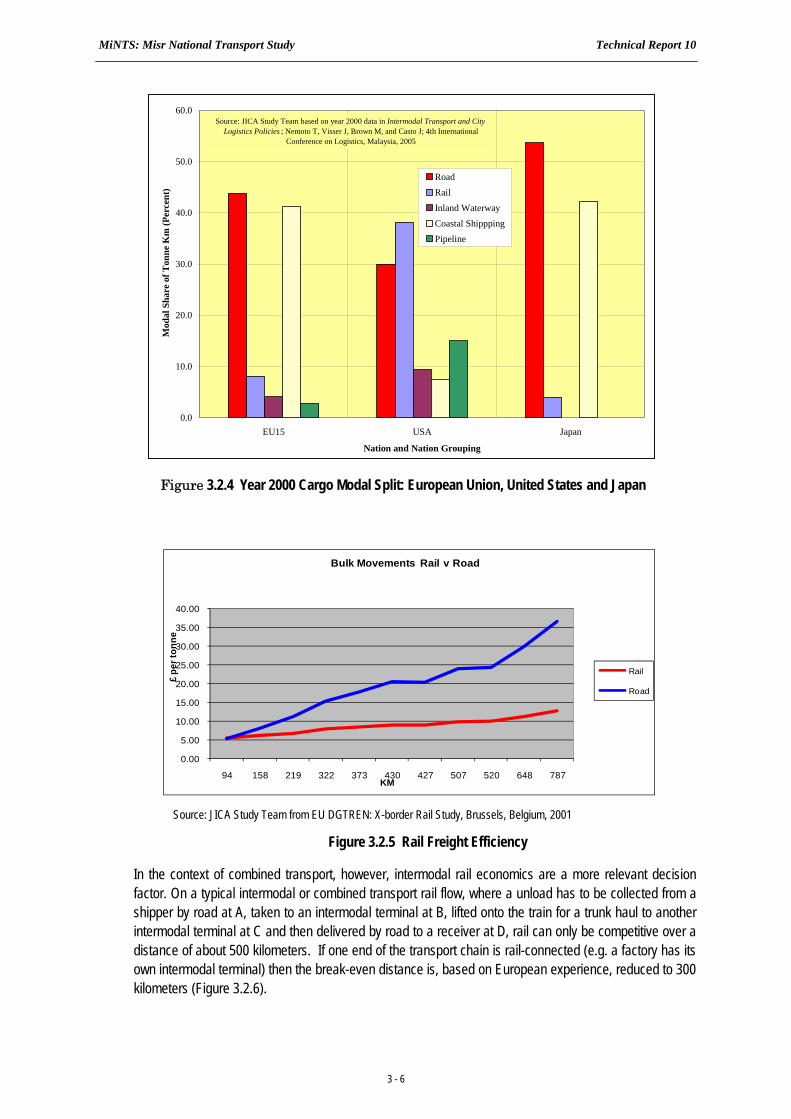
The experience of Japan is more akin to that of Europe. The road (trucks) mode carries the largest share of cargo, followed by coastal shipping (Figure 3.2.4).
Cost, distance and quality of service are important factors in the decision as to modal use. The European experience has shown that for large quantities of bulk commodities, particularly between two private sidings (such as a movement of refined petroleum product from an oil refinery to a chemical factory), rail transport can be more competitive than road, starting at distances as short as 100 kilometers (Figure 3.2.5).
1 Information for some modes only available beyond year 2003.
0
1,000
2,000
3,000
4,000
5,000
1990
1991
1992
1993
1994
1995
1996
1997
1998
1999
2000
2001
2002
2003
Year
Bill
ion
Ann
ual T
on M
iles
Domestic AirOil PipelineInland WaterwayClass I RailIntercity Truck
1990 PercentageRoad 25.8Rail 31.2IWT 25.1Pipeline 17.6 Air 0.3
2003 PercentageRoad 31.4Rail 38.5
IWT 15.1 Pipeline 14.7 Air 0.4
Source: JICA Study Team based on Bureau of Transportation Statistics , US Department of Transportation, Washington DC USA, 2009. Inland waterway
includes river, coastal, lake and intra-port shipping. Class I railroads include only largest rail operators as defined by annual operating revenue.
Figure 3.2.3 Cargo Modal Split, United States: 1990-2003
MiNTS: Misr National Transport Study Technical Report 10
3 - 6
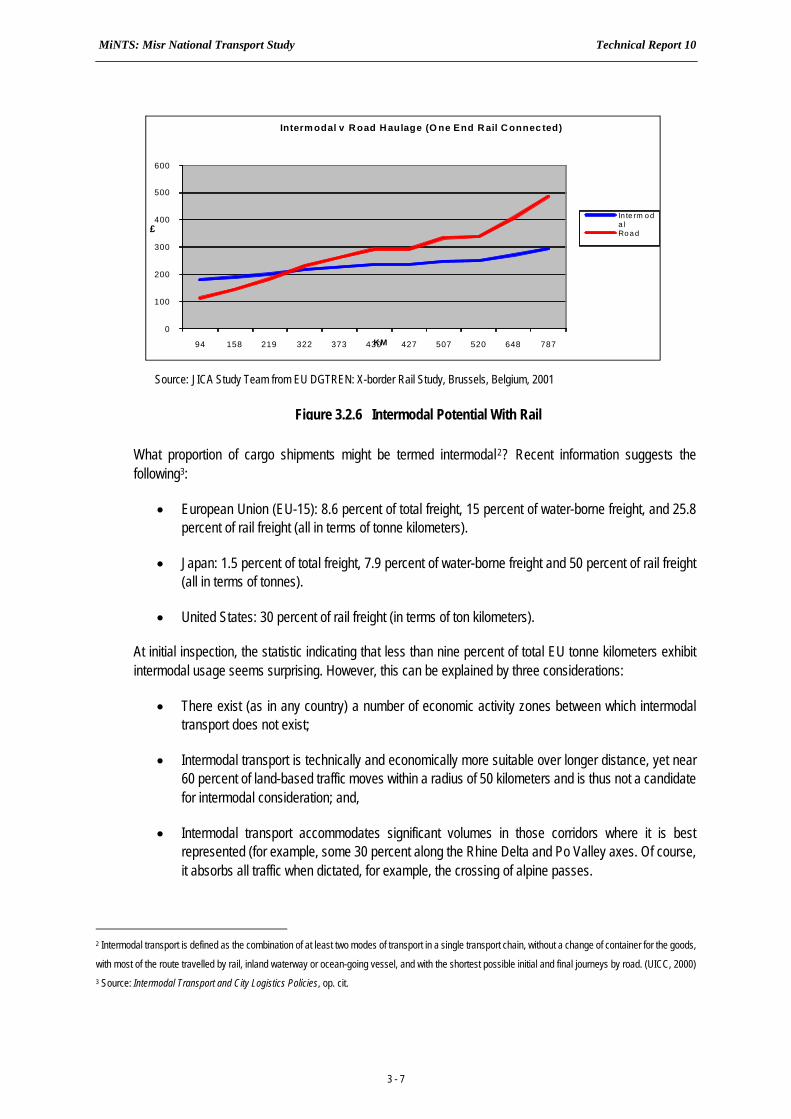
In the context of combined transport, however, intermodal rail economics are a more relevant decision factor. On a typical intermodal or combined transport rail flow, where a unload has to be collected from a shipper by road at A, taken to an intermodal terminal at B, lifted onto the train for a trunk haul to another intermodal terminal at C and then delivered by road to a receiver at D, rail can only be competitive over a distance of about 500 kilometers. If one end of the transport chain is rail-connected (e.g. a factory has its own intermodal terminal) then the break-even distance is, based on European experience, reduced to 300 kilometers (Figure 3.2.6).
0.00
5.00
10.00
15.00
20.00
25.00
30.00
35.00
40.00
94 158 219 322 373 430 427 507 520 648 787
£ pe
r ton
ne
KM
Bulk Movements Rail v Road
Rail
Road
Source: JICA Study Team from EU DGTREN: X-border Rail Study, Brussels, Belgium, 2001
Figure 3.2.5 Rail Freight Efficiency
0.0
10.0
20.0
30.0
40.0
50.0
60.0
EU15 USA Japan
Nation and Nation Grouping
Mod
al S
hare
of T
onne
Km
(Per
cent
)RoadRailInland WaterwayCoastal ShipppingPipeline
Source: JICA Study Team based on year 2000 data in Intermodal Transport and City Logistics Policies ; Nemoto T, Visser J, Brown M, and Casto J; 4th International
Conference on Logistics, Malaysia, 2005
Figure 3.2.4 Year 2000 Cargo Modal Split: European Union, United States and Japan
MiNTS: Misr National Transport Study Technical Report 10
3 - 7
What proportion of cargo shipments might be termed intermodal2? Recent information suggests the following3:
European Union (EU-15): 8.6 percent of total freight, 15 percent of water-borne freight, and 25.8 percent of rail freight (all in terms of tonne kilometers).
Japan: 1.5 percent of total freight, 7.9 percent of water-borne freight and 50 percent of rail freight (all in terms of tonnes).
United States: 30 percent of rail freight (in terms of ton kilometers).
At initial inspection, the statistic indicating that less than nine percent of total EU tonne kilometers exhibit intermodal usage seems surprising. However, this can be explained by three considerations:
There exist (as in any country) a number of economic activity zones between which intermodal transport does not exist;
Intermodal transport is technically and economically more suitable over longer distance, yet near 60 percent of land-based traffic moves within a radius of 50 kilometers and is thus not a candidate for intermodal consideration; and,
Intermodal transport accommodates significant volumes in those corridors where it is best represented (for example, some 30 percent along the Rhine Delta and Po Valley axes. Of course, it absorbs all traffic when dictated, for example, the crossing of alpine passes.
2 Intermodal transport is defined as the combination of at least two modes of transport in a single transport chain, without a change of container for the goods,
with most of the route travelled by rail, inland waterway or ocean-going vessel, and with the shortest possible initial and final journeys by road. (UICC, 2000) 3 Source: Intermodal Transport and City Logistics Policies, op. cit.
0
100
200
300
400
500
600
94 158 219 322 373 430 427 507 520 648 787
£
KM
Interm odal v R oad H aulage (O ne End R ail C onnec ted)
In te rm oda lRoad
Source: JICA Study Team from EU DGTREN: X-border Rail Study, Brussels, Belgium, 2001
Figure 3.2.6 Intermodal Potential With Rail
MiNTS: Misr National Transport Study Technical Report 10
3 - 8
Thus, the role of intermodal activity may, based on observed usage patterns, be clearly and concisely expressed: Intermodal transport, whatever the technological structure put in place, has no role to play in the general coverage of a territory. It is a market that is restricted to precise segments of the market; it has to link zones of economic activity that are sufficiently strong to generate mass transfers and sufficiently far apart that the advantages of rail, river or sea, in terms of costs per kilometer, outweigh the additional costs of terminal operations, when compared with door-to-door road transport4.
3.2.2 The International Perspective - Passengers
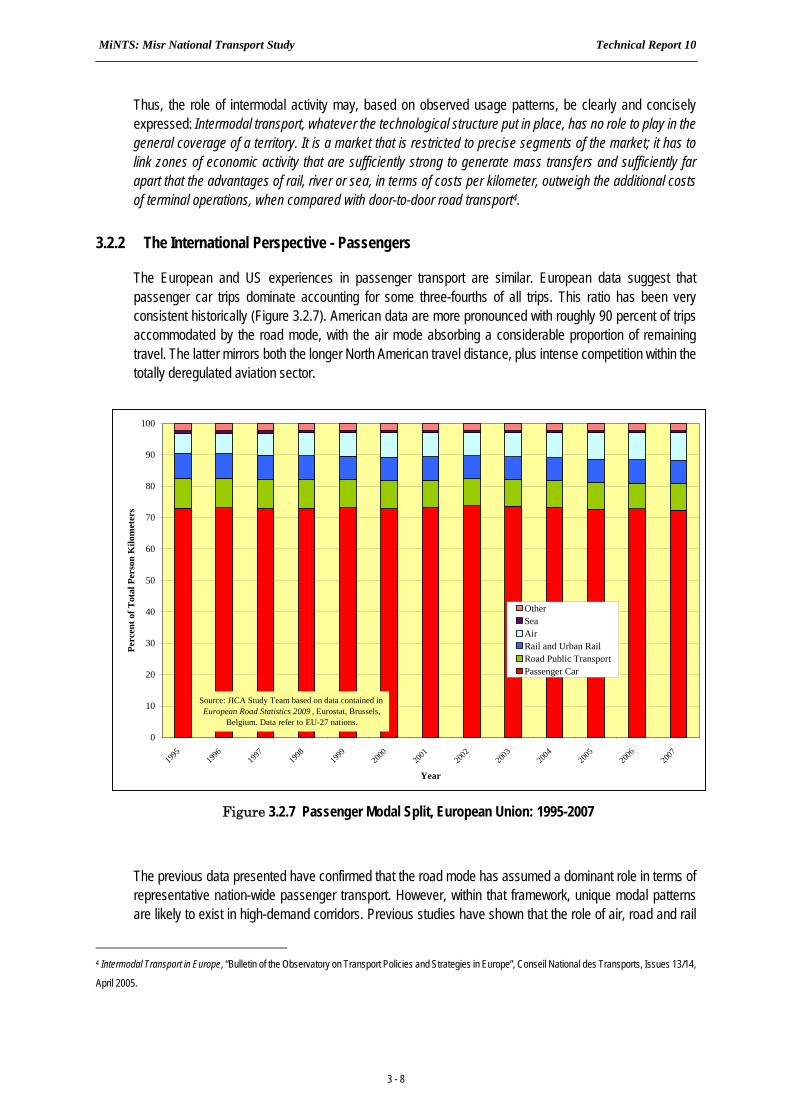
The European and US experiences in passenger transport are similar. European data suggest that passenger car trips dominate accounting for some three-fourths of all trips. This ratio has been very consistent historically (Figure 3.2.7). American data are more pronounced with roughly 90 percent of trips accommodated by the road mode, with the air mode absorbing a considerable proportion of remaining travel. The latter mirrors both the longer North American travel distance, plus intense competition within the totally deregulated aviation sector.
The previous data presented have confirmed that the road mode has assumed a dominant role in terms of representative nation-wide passenger transport. However, within that framework, unique modal patterns are likely to exist in high-demand corridors. Previous studies have shown that the role of air, road and rail
4 Intermodal Transport in Europe, “Bulletin of the Observatory on Transport Policies and Strategies in Europe”, Conseil National des Transports, Issues 13/14,
April 2005.
0
10
20
30
40
50
60
70
80
90
100
1995
1996
1997
1998
1999
2000
2001
2002
2003
2004
2005
2006
2007
Year
Perc
ent o
f Tot
al P
erso
n K
ilom
eter
s
OtherSeaAirRail and Urban RailRoad Public TransportPassenger Car
Source: JICA Study Team based on data contained in European Road Statistics 2009 , Eurostat, Brussels,
Belgium. Data refer to EU-27 nations.
Figure 3.2.7 Passenger Modal Split, European Union: 1995-2007
MiNTS: Misr National Transport Study Technical Report 10
3 - 9
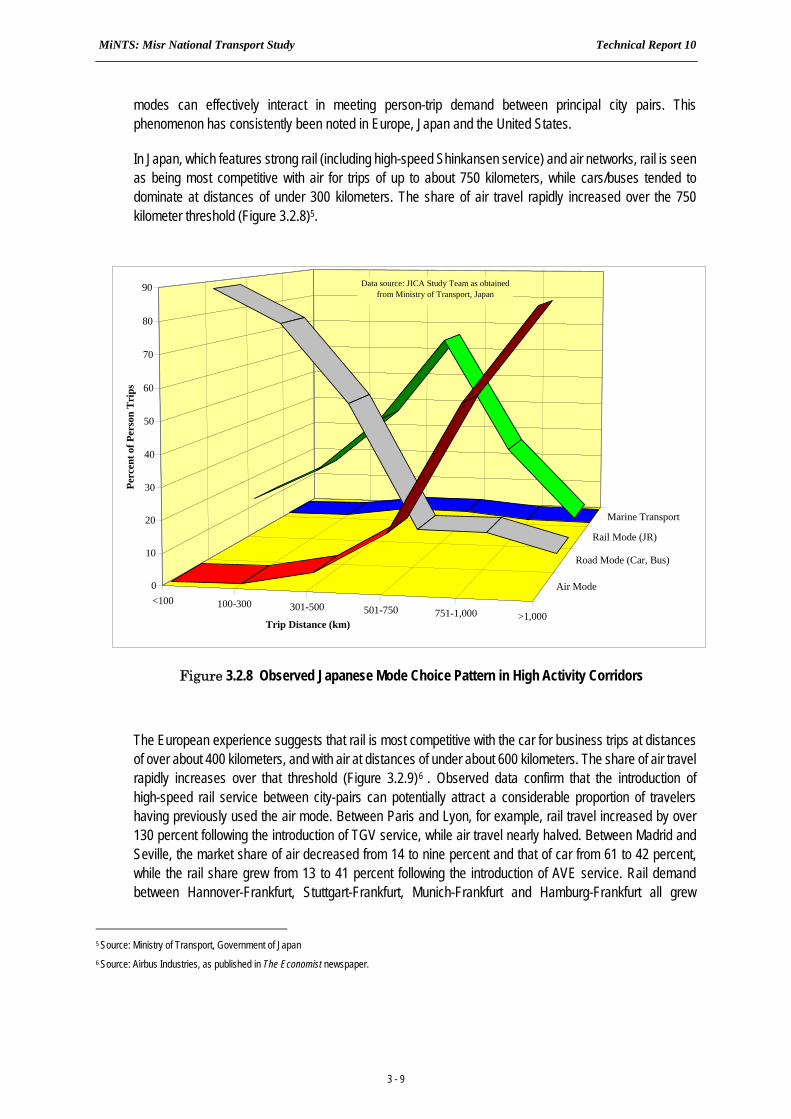
modes can effectively interact in meeting person-trip demand between principal city pairs. This phenomenon has consistently been noted in Europe, Japan and the United States.
In Japan, which features strong rail (including high-speed Shinkansen service) and air networks, rail is seen as being most competitive with air for trips of up to about 750 kilometers, while cars/buses tended to dominate at distances of under 300 kilometers. The share of air travel rapidly increased over the 750 kilometer threshold (Figure 3.2.8)5.
The European experience suggests that rail is most competitive with the car for business trips at distances of over about 400 kilometers, and with air at distances of under about 600 kilometers. The share of air travel rapidly increases over that threshold (Figure 3.2.9)6 . Observed data confirm that the introduction of high-speed rail service between city-pairs can potentially attract a considerable proportion of travelers having previously used the air mode. Between Paris and Lyon, for example, rail travel increased by over 130 percent following the introduction of TGV service, while air travel nearly halved. Between Madrid and Seville, the market share of air decreased from 14 to nine percent and that of car from 61 to 42 percent, while the rail share grew from 13 to 41 percent following the introduction of AVE service. Rail demand between Hannover-Frankfurt, Stuttgart-Frankfurt, Munich-Frankfurt and Hamburg-Frankfurt all grew
5 Source: Ministry of Transport, Government of Japan 6 Source: Airbus Industries, as published in The Economist newspaper.
Figure 3.2.8 Observed Japanese Mode Choice Pattern in High Activity Corridors
<100 100-300 301-500 501-750 751-1,000 >1,000
Air Mode
Road Mode (Car, Bus)
Rail Mode (JR)
Marine Transport
0
10
20
30
40
50
60
70
80
90
Perc
ent o
f Per
son
Tri
ps
Trip Distance (km)
Data source: JICA Study Team as obtained from Ministry of Transport, Japan
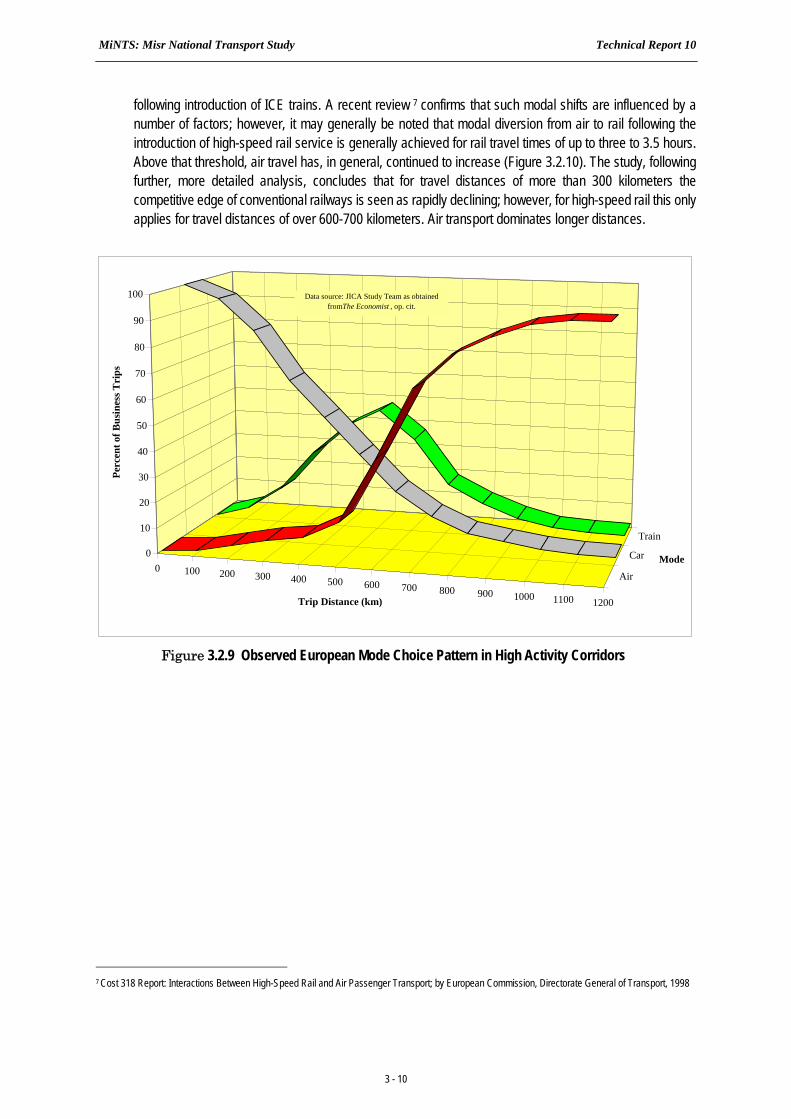
MiNTS: Misr National Transport Study Technical Report 10
3 - 10
following introduction of ICE trains. A recent review 7 confirms that such modal shifts are influenced by a number of factors; however, it may generally be noted that modal diversion from air to rail following the introduction of high-speed rail service is generally achieved for rail travel times of up to three to 3.5 hours. Above that threshold, air travel has, in general, continued to increase (Figure 3.2.10). The study, following further, more detailed analysis, concludes that for travel distances of more than 300 kilometers the competitive edge of conventional railways is seen as rapidly declining; however, for high-speed rail this only applies for travel distances of over 600-700 kilometers. Air transport dominates longer distances.
7 Cost 318 Report: Interactions Between High-Speed Rail and Air Passenger Transport; by European Commission, Directorate General of Transport, 1998
Figure 3.2.9 Observed European Mode Choice Pattern in High Activity Corridors
0 100 200 300 400 500 600 700 800 900 1000 1100 1200
Air
Car
Train
0
10
20
30
40
50
60
70
80
90
100
Perc
ent o
f Bus
ines
s Tri
ps
Trip Distance (km)
Mode
Data source: JICA Study Team as obtained fromThe Economist , op. cit.
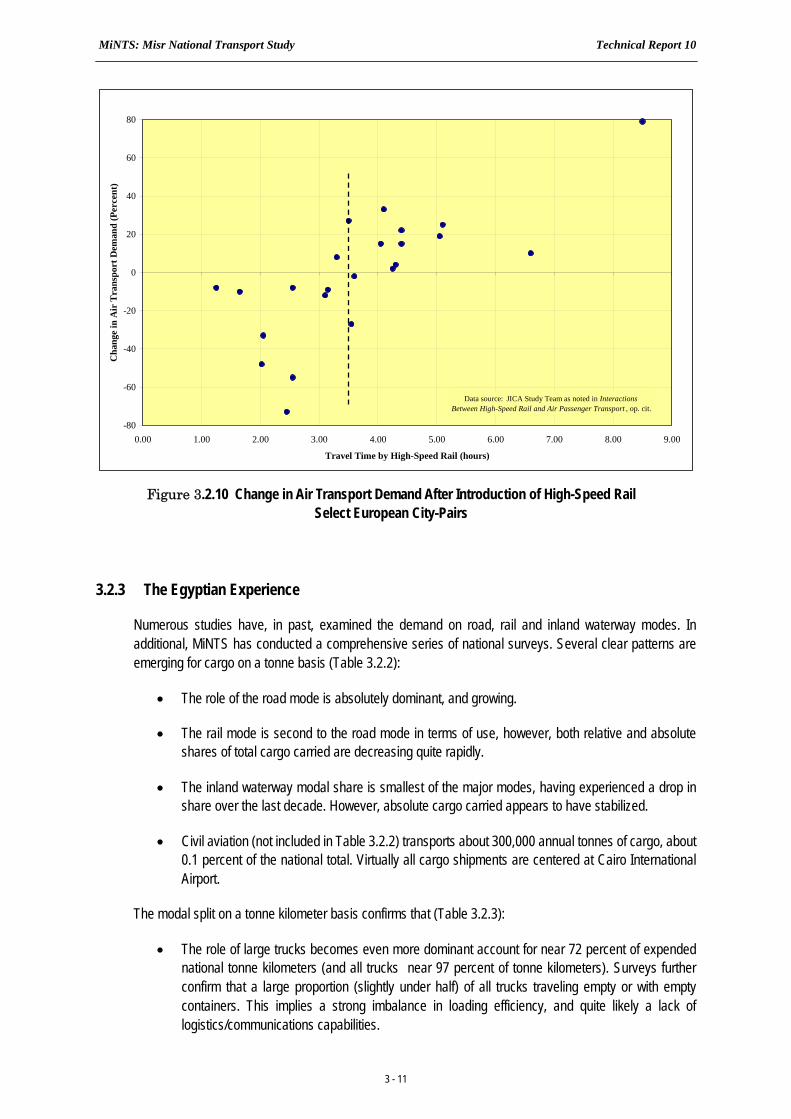
MiNTS: Misr National Transport Study Technical Report 10
3 - 11
3.2.3 The Egyptian Experience
Numerous studies have, in past, examined the demand on road, rail and inland waterway modes. In additional, MiNTS has conducted a comprehensive series of national surveys. Several clear patterns are emerging for cargo on a tonne basis (Table 3.2.2):
The role of the road mode is absolutely dominant, and growing.
The rail mode is second to the road mode in terms of use, however, both relative and absolute shares of total cargo carried are decreasing quite rapidly.
The inland waterway modal share is smallest of the major modes, having experienced a drop in share over the last decade. However, absolute cargo carried appears to have stabilized.
Civil aviation (not included in Table 3.2.2) transports about 300,000 annual tonnes of cargo, about 0.1 percent of the national total. Virtually all cargo shipments are centered at Cairo International Airport.
The modal split on a tonne kilometer basis confirms that (Table 3.2.3):
The role of large trucks becomes even more dominant account for near 72 percent of expended national tonne kilometers (and all trucks near 97 percent of tonne kilometers). Surveys further confirm that a large proportion (slightly under half) of all trucks traveling empty or with empty containers. This implies a strong imbalance in loading efficiency, and quite likely a lack of logistics/communications capabilities.
Figure 3.2.10 Change in Air Transport Demand After Introduction of High-Speed Rail Select European City-Pairs
-80
-60
-40
-20
0
20
40
60
80
0.00 1.00 2.00 3.00 4.00 5.00 6.00 7.00 8.00 9.00
Travel Time by High-Speed Rail (hours)
Cha
nge
in A
ir T
rans
port
Dem
and
(Per
cent
)
Data source: JICA Study Team as noted in Interactions Between High-Speed Rail and Air Passenger Transport , op. cit.

MiNTS: Misr National Transport Study Technical Report 10
3 - 12
Rail and inland waterway carry predominately large, bulky cargoes. Thus, the relative national tonne kilometer share increases considerably over tonne share: doubling in the case of rail, and tripling in case of inland waterway. However, the tonne kilometer share remains minor compared to the road mode given the modest absolute totals carried by those two modes.
Table 3.2.2 Trend in Modal Share: Annual National Freight Movement
Annual Cargo Volume (000 tonne) Modal Share (Percent) Year
Road Railway IWT Total Road Railway IWT Total
1979 73,700 5,000 4,300 83,000 88.7 6.1 5.2 100.0
1992 165,495 9,642 3,214 178,351 92.8 5.4 1.8 100.0
2000 242,000 11,812 2,161 256,000 94.5 4.6 0.8 100.0
2010 433,361 4,042 2,226 439,630 98.6 0.9 0.5 100.0
Source: JICA Study Team based on (a) 1979 and 1992 data from The Study on the Transportation System and the National Road Transportation Master Plan (1993), JICA (b) 2000 data from Development Study on the Inland Waterway System in the Arab Republic of Egypt, (2003), JICA; and (c) 2010 information from MiNTS data surveys. Excludes pipeline transport (115 million tonnes in year 2010). Inland water transport (IWT) excludes short distance cross-Nile ferry traffic.
Table 3.2.3 Modal Share of Year 2010 Daily Cargo Trips (Excluding Pipeline)
Major Mode Mode Number of Tonnes Percentage Tonne
Kilometers Percentage Distribution
Light Truck 213,500 17.9 22,426,200 10.6
Medium Truck 216,200 18.1 29,716,100 14.0
Heavy Truck 734,512 61.5 152,234,900 71.9
Road
Subtotal 1,164,212 97.4 204,377,200 96.5
Rail 9,080 0.8 3,963,668 1.9
IWT 21,600 1.8 3,523,204 1.7 Non Road
Subtotal 30,680 2.6 7,486,872 3.5
Total 1,194,892 100.0 211,864,072 100.0
Source: JICA Study Team. Assumes average distance for pipeline transport of 300 kilometers. Inland water transport (IWT) includes cross-Nile ferry traffic.
In case of passenger activity, the road mode is also dominant accounting for some 91 percent of passenger trips. The largest single passenger mode is shared taxi, carrying near 40 percent of all passenger trips (Table 3.2.4). The road share in terms of passenger kilometers remains dominant at some 91 percent of expended passenger kilometers.
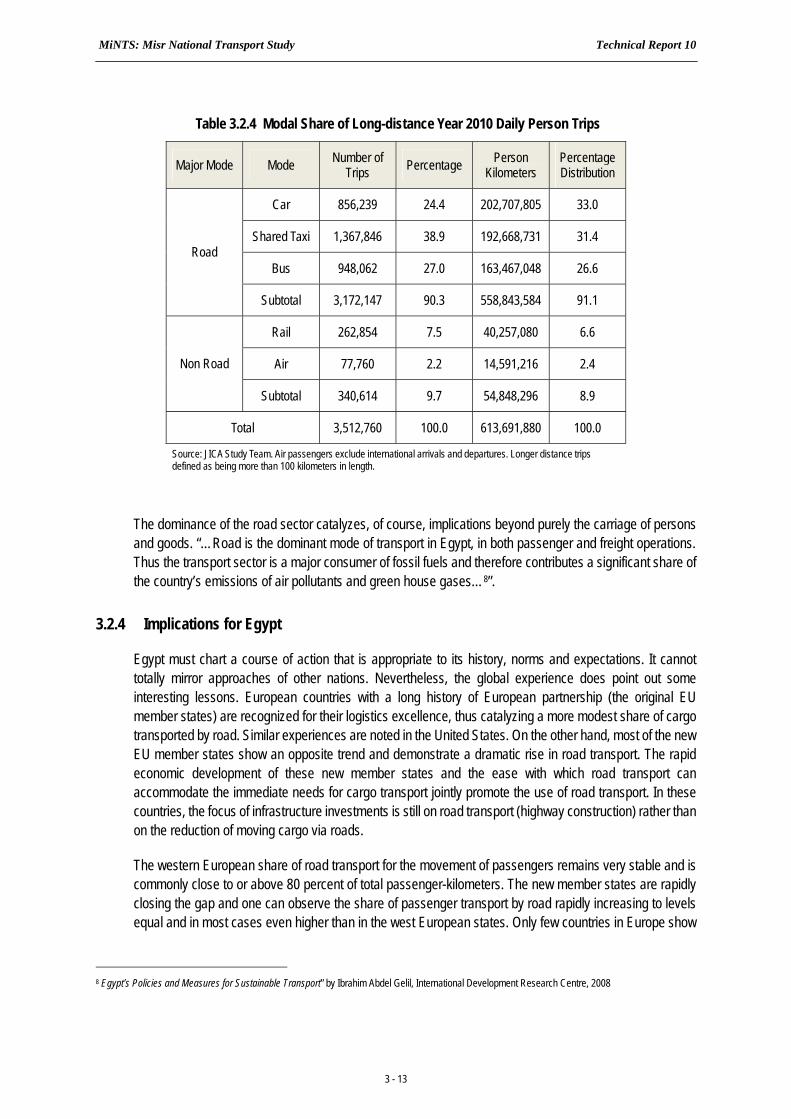
MiNTS: Misr National Transport Study Technical Report 10
3 - 13
Table 3.2.4 Modal Share of Long-distance Year 2010 Daily Person Trips
Major Mode Mode Number of Trips Percentage Person
Kilometers Percentage Distribution
Car 856,239 24.4 202,707,805 33.0
Shared Taxi 1,367,846 38.9 192,668,731 31.4
Bus 948,062 27.0 163,467,048 26.6 Road
Subtotal 3,172,147 90.3 558,843,584 91.1
Rail 262,854 7.5 40,257,080 6.6
Air 77,760 2.2 14,591,216 2.4 Non Road
Subtotal 340,614 9.7 54,848,296 8.9
Total 3,512,760 100.0 613,691,880 100.0
Source: JICA Study Team. Air passengers exclude international arrivals and departures. Longer distance trips defined as being more than 100 kilometers in length.
The dominance of the road sector catalyzes, of course, implications beyond purely the carriage of persons and goods. “…Road is the dominant mode of transport in Egypt, in both passenger and freight operations. Thus the transport sector is a major consumer of fossil fuels and therefore contributes a significant share of the country’s emissions of air pollutants and green house gases…8”.
3.2.4 Implications for Egypt
Egypt must chart a course of action that is appropriate to its history, norms and expectations. It cannot totally mirror approaches of other nations. Nevertheless, the global experience does point out some interesting lessons. European countries with a long history of European partnership (the original EU member states) are recognized for their logistics excellence, thus catalyzing a more modest share of cargo transported by road. Similar experiences are noted in the United States. On the other hand, most of the new EU member states show an opposite trend and demonstrate a dramatic rise in road transport. The rapid economic development of these new member states and the ease with which road transport can accommodate the immediate needs for cargo transport jointly promote the use of road transport. In these countries, the focus of infrastructure investments is still on road transport (highway construction) rather than on the reduction of moving cargo via roads.
The western European share of road transport for the movement of passengers remains very stable and is commonly close to or above 80 percent of total passenger-kilometers. The new member states are rapidly closing the gap and one can observe the share of passenger transport by road rapidly increasing to levels equal and in most cases even higher than in the west European states. Only few countries in Europe show
8 Egypt’s Policies and Measures for Sustainable Transport” by Ibrahim Abdel Gelil, International Development Research Centre, 2008
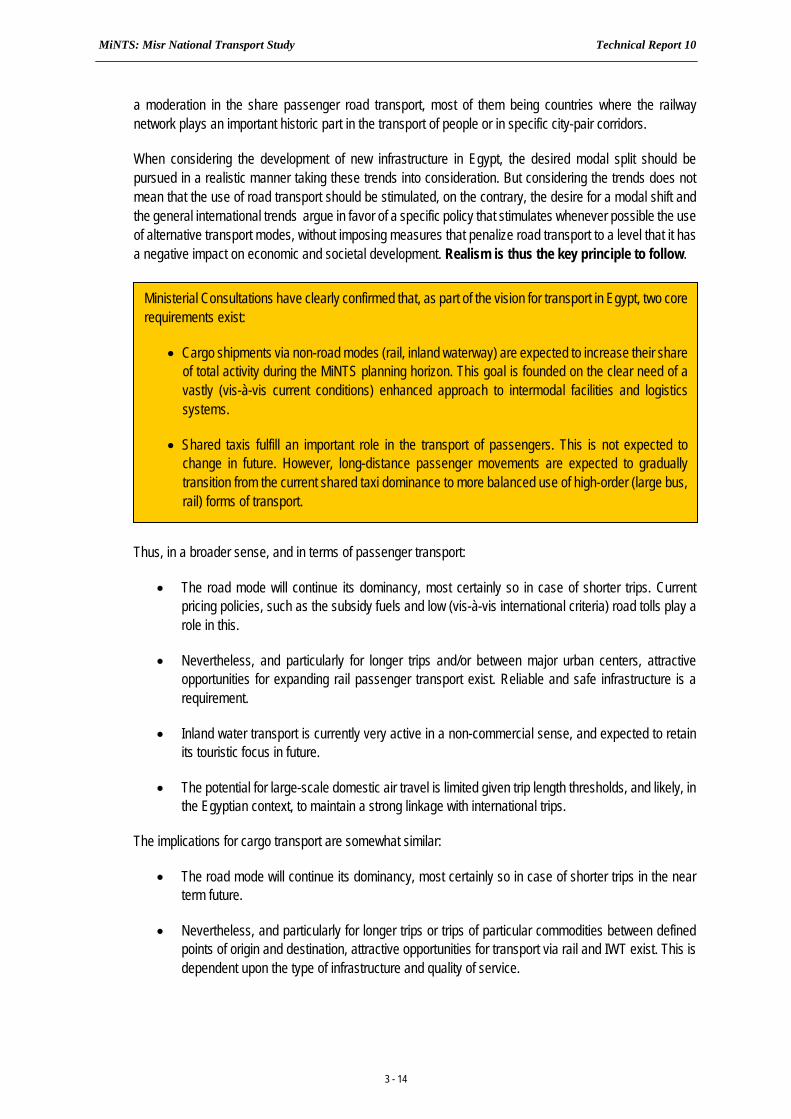
MiNTS: Misr National Transport Study Technical Report 10
3 - 14
a moderation in the share passenger road transport, most of them being countries where the railway network plays an important historic part in the transport of people or in specific city-pair corridors.
When considering the development of new infrastructure in Egypt, the desired modal split should be pursued in a realistic manner taking these trends into consideration. But considering the trends does not mean that the use of road transport should be stimulated, on the contrary, the desire for a modal shift and the general international trends argue in favor of a specific policy that stimulates whenever possible the use of alternative transport modes, without imposing measures that penalize road transport to a level that it has a negative impact on economic and societal development. Realism is thus the key principle to follow.
Thus, in a broader sense, and in terms of passenger transport:
The road mode will continue its dominancy, most certainly so in case of shorter trips. Current pricing policies, such as the subsidy fuels and low (vis-à-vis international criteria) road tolls play a role in this.
Nevertheless, and particularly for longer trips and/or between major urban centers, attractive opportunities for expanding rail passenger transport exist. Reliable and safe infrastructure is a requirement.
Inland water transport is currently very active in a non-commercial sense, and expected to retain its touristic focus in future.
The potential for large-scale domestic air travel is limited given trip length thresholds, and likely, in the Egyptian context, to maintain a strong linkage with international trips.
The implications for cargo transport are somewhat similar:
The road mode will continue its dominancy, most certainly so in case of shorter trips in the near term future.
Nevertheless, and particularly for longer trips or trips of particular commodities between defined points of origin and destination, attractive opportunities for transport via rail and IWT exist. This is dependent upon the type of infrastructure and quality of service.
Ministerial Consultations have clearly confirmed that, as part of the vision for transport in Egypt, two core requirements exist:
Cargo shipments via non-road modes (rail, inland waterway) are expected to increase their share of total activity during the MiNTS planning horizon. This goal is founded on the clear need of a vastly (vis-à-vis current conditions) enhanced approach to intermodal facilities and logistics systems.
Shared taxis fulfill an important role in the transport of passengers. This is not expected to change in future. However, long-distance passenger movements are expected to gradually transition from the current shared taxi dominance to more balanced use of high-order (large bus, rail) forms of transport.
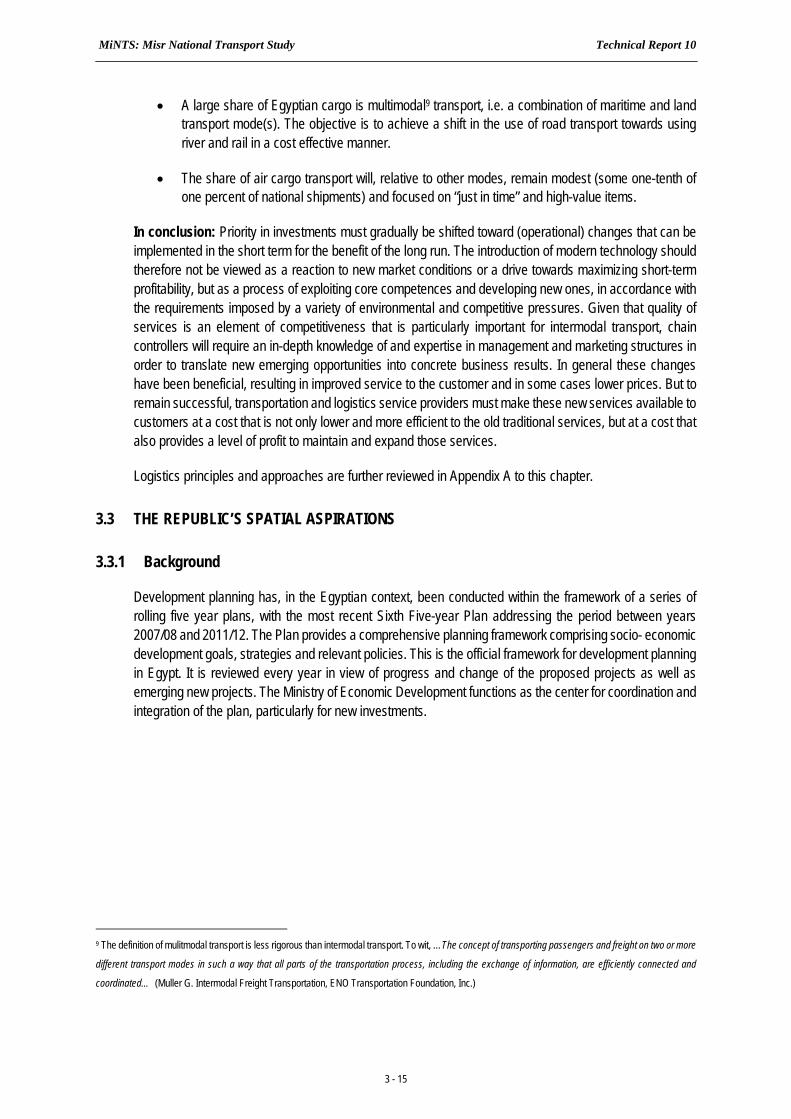
MiNTS: Misr National Transport Study Technical Report 10
3 - 15
A large share of Egyptian cargo is multimodal9 transport, i.e. a combination of maritime and land transport mode(s). The objective is to achieve a shift in the use of road transport towards using river and rail in a cost effective manner.
The share of air cargo transport will, relative to other modes, remain modest (some one-tenth of one percent of national shipments) and focused on “just in time” and high-value items.
In conclusion: Priority in investments must gradually be shifted toward (operational) changes that can be implemented in the short term for the benefit of the long run. The introduction of modern technology should therefore not be viewed as a reaction to new market conditions or a drive towards maximizing short-term profitability, but as a process of exploiting core competences and developing new ones, in accordance with the requirements imposed by a variety of environmental and competitive pressures. Given that quality of services is an element of competitiveness that is particularly important for intermodal transport, chain controllers will require an in-depth knowledge of and expertise in management and marketing structures in order to translate new emerging opportunities into concrete business results. In general these changes have been beneficial, resulting in improved service to the customer and in some cases lower prices. But to remain successful, transportation and logistics service providers must make these new services available to customers at a cost that is not only lower and more efficient to the old traditional services, but at a cost that also provides a level of profit to maintain and expand those services.
Logistics principles and approaches are further reviewed in Appendix A to this chapter.
3.3 THE REPUBLIC’S SPATIAL ASPIRATIONS
3.3.1 Background
Development planning has, in the Egyptian context, been conducted within the framework of a series of rolling five year plans, with the most recent Sixth Five-year Plan addressing the period between years 2007/08 and 2011/12. The Plan provides a comprehensive planning framework comprising socio- economic development goals, strategies and relevant policies. This is the official framework for development planning in Egypt. It is reviewed every year in view of progress and change of the proposed projects as well as emerging new projects. The Ministry of Economic Development functions as the center for coordination and integration of the plan, particularly for new investments.
9 The definition of mulitmodal transport is less rigorous than intermodal transport. To wit, …The concept of transporting passengers and freight on two or more
different transport modes in such a way that all parts of the transportation process, including the exchange of information, are efficiently connected and
coordinated… (Muller G. Intermodal Freight Transportation, ENO Transportation Foundation, Inc.)
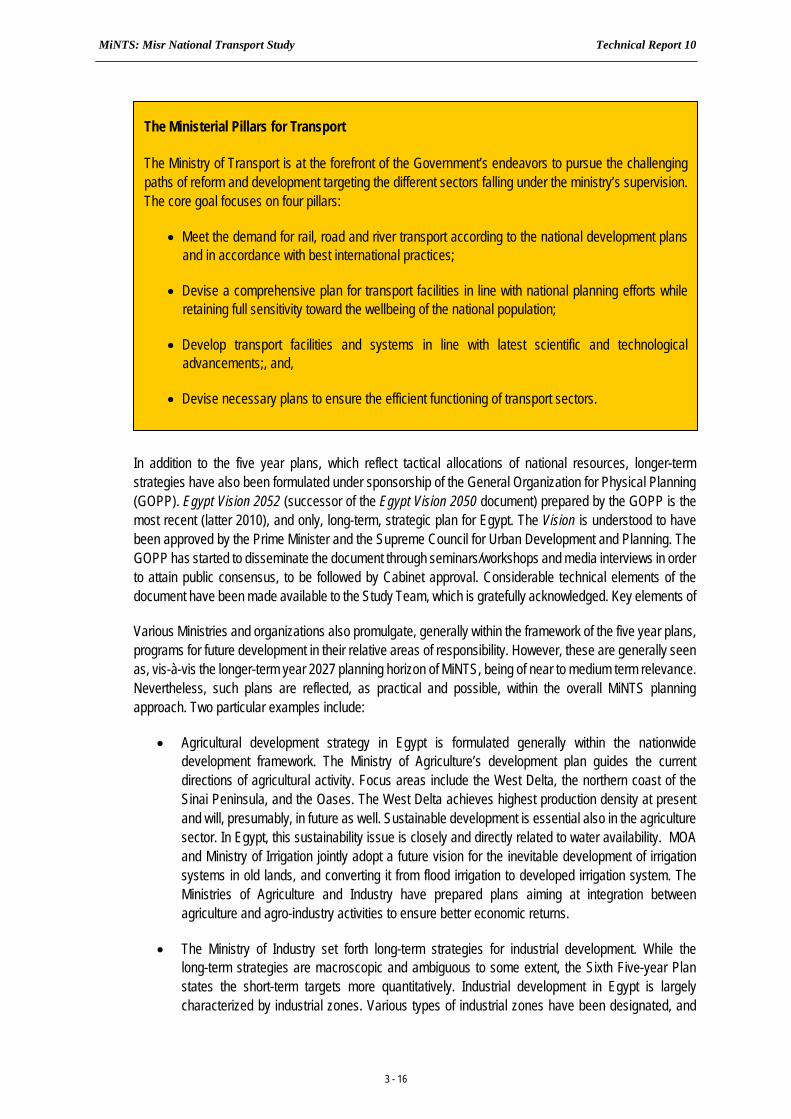
MiNTS: Misr National Transport Study Technical Report 10
3 - 16
In addition to the five year plans, which reflect tactical allocations of national resources, longer-term strategies have also been formulated under sponsorship of the General Organization for Physical Planning (GOPP). Egypt Vision 2052 (successor of the Egypt Vision 2050 document) prepared by the GOPP is the most recent (latter 2010), and only, long-term, strategic plan for Egypt. The Vision is understood to have been approved by the Prime Minister and the Supreme Council for Urban Development and Planning. The GOPP has started to disseminate the document through seminars/workshops and media interviews in order to attain public consensus, to be followed by Cabinet approval. Considerable technical elements of the document have been made available to the Study Team, which is gratefully acknowledged. Key elements of
Various Ministries and organizations also promulgate, generally within the framework of the five year plans, programs for future development in their relative areas of responsibility. However, these are generally seen as, vis-à-vis the longer-term year 2027 planning horizon of MiNTS, being of near to medium term relevance. Nevertheless, such plans are reflected, as practical and possible, within the overall MiNTS planning approach. Two particular examples include:
Agricultural development strategy in Egypt is formulated generally within the nationwide development framework. The Ministry of Agriculture’s development plan guides the current directions of agricultural activity. Focus areas include the West Delta, the northern coast of the Sinai Peninsula, and the Oases. The West Delta achieves highest production density at present and will, presumably, in future as well. Sustainable development is essential also in the agriculture sector. In Egypt, this sustainability issue is closely and directly related to water availability. MOA and Ministry of Irrigation jointly adopt a future vision for the inevitable development of irrigation systems in old lands, and converting it from flood irrigation to developed irrigation system. The Ministries of Agriculture and Industry have prepared plans aiming at integration between agriculture and agro-industry activities to ensure better economic returns.
The Ministry of Industry set forth long-term strategies for industrial development. While the long-term strategies are macroscopic and ambiguous to some extent, the Sixth Five-year Plan states the short-term targets more quantitatively. Industrial development in Egypt is largely characterized by industrial zones. Various types of industrial zones have been designated, and
The Ministerial Pillars for Transport
The Ministry of Transport is at the forefront of the Government’s endeavors to pursue the challenging paths of reform and development targeting the different sectors falling under the ministry’s supervision. The core goal focuses on four pillars:
Meet the demand for rail, road and river transport according to the national development plans and in accordance with best international practices;
Devise a comprehensive plan for transport facilities in line with national planning efforts while retaining full sensitivity toward the wellbeing of the national population;
Develop transport facilities and systems in line with latest scientific and technological advancements;, and,
Devise necessary plans to ensure the efficient functioning of transport sectors.
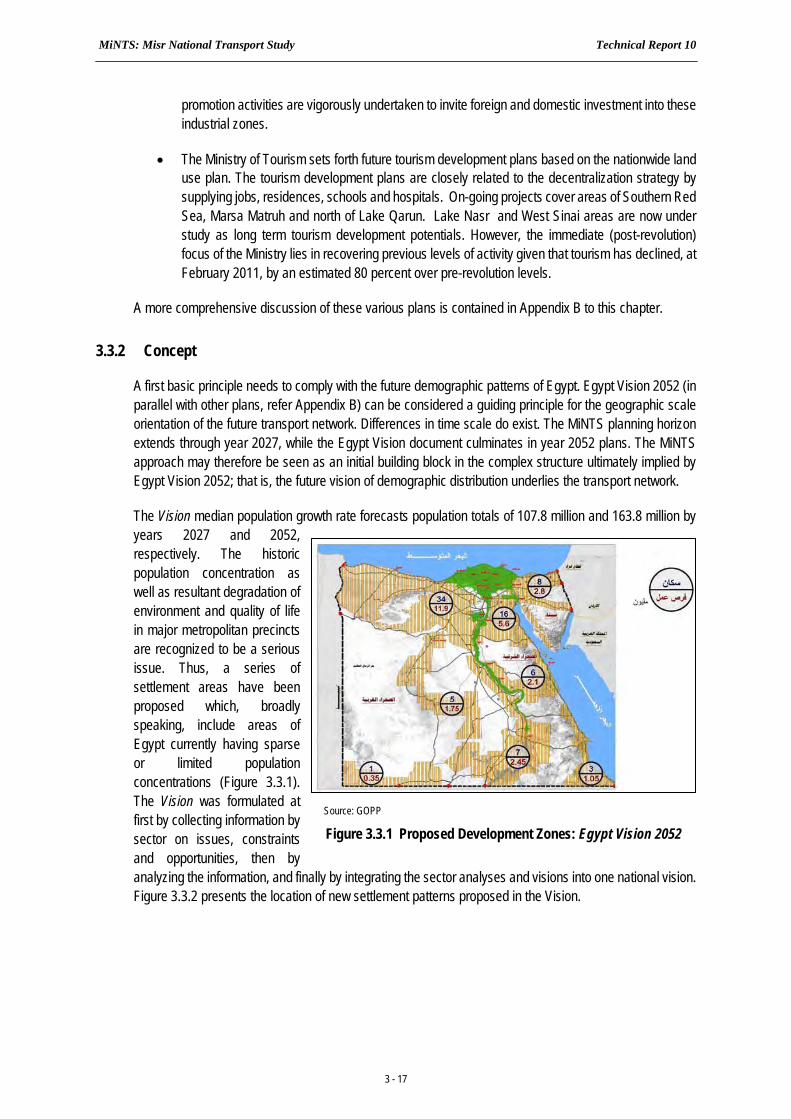
MiNTS: Misr National Transport Study Technical Report 10
3 - 17
promotion activities are vigorously undertaken to invite foreign and domestic investment into these industrial zones.
The Ministry of Tourism sets forth future tourism development plans based on the nationwide land use plan. The tourism development plans are closely related to the decentralization strategy by supplying jobs, residences, schools and hospitals. On-going projects cover areas of Southern Red Sea, Marsa Matruh and north of Lake Qarun. Lake Nasr and West Sinai areas are now under study as long term tourism development potentials. However, the immediate (post-revolution) focus of the Ministry lies in recovering previous levels of activity given that tourism has declined, at February 2011, by an estimated 80 percent over pre-revolution levels.
A more comprehensive discussion of these various plans is contained in Appendix B to this chapter.
3.3.2 Concept
A first basic principle needs to comply with the future demographic patterns of Egypt. Egypt Vision 2052 (in parallel with other plans, refer Appendix B) can be considered a guiding principle for the geographic scale orientation of the future transport network. Differences in time scale do exist. The MiNTS planning horizon extends through year 2027, while the Egypt Vision document culminates in year 2052 plans. The MiNTS approach may therefore be seen as an initial building block in the complex structure ultimately implied by Egypt Vision 2052; that is, the future vision of demographic distribution underlies the transport network.
The Vision median population growth rate forecasts population totals of 107.8 million and 163.8 million by years 2027 and 2052, respectively. The historic population concentration as well as resultant degradation of environment and quality of life in major metropolitan precincts are recognized to be a serious issue. Thus, a series of settlement areas have been proposed which, broadly speaking, include areas of Egypt currently having sparse or limited population concentrations (Figure 3.3.1). The Vision was formulated at first by collecting information by sector on issues, constraints and opportunities, then by analyzing the information, and finally by integrating the sector analyses and visions into one national vision. Figure 3.3.2 presents the location of new settlement patterns proposed in the Vision.
Source: GOPP
Figure 3.3.1 Proposed Development Zones: Egypt Vision 2052
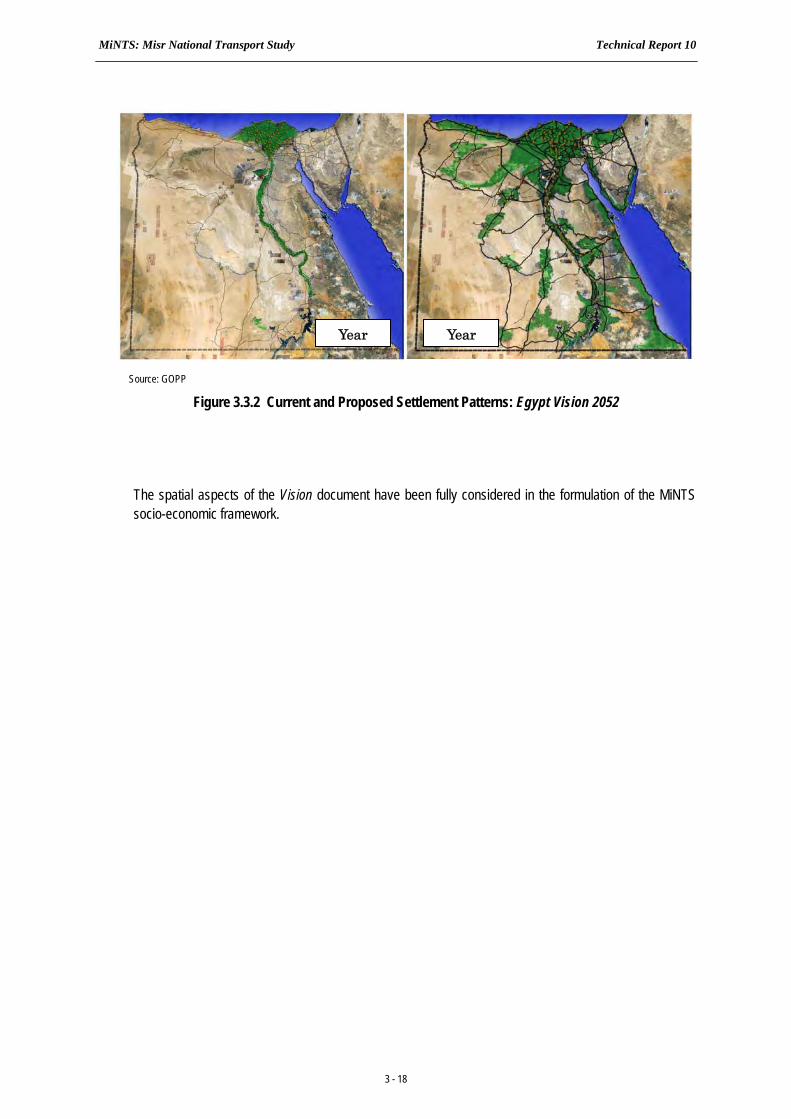
MiNTS: Misr National Transport Study Technical Report 10
3 - 18
The spatial aspects of the Vision document have been fully considered in the formulation of the MiNTS socio-economic framework.
Source: GOPP
Figure 3.3.2 Current and Proposed Settlement Patterns: Egypt Vision 2052
Year Year
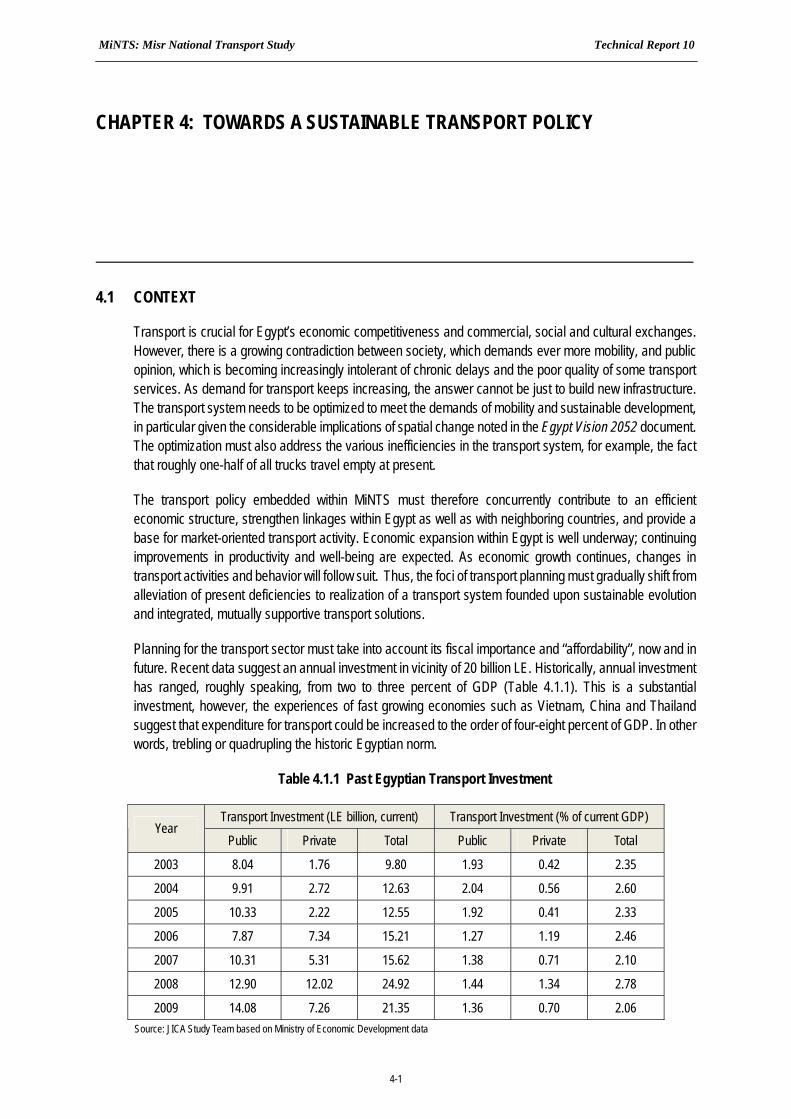
MiNTS: Misr National Transport Study Technical Report 10
4-1
CHAPTER 4: TOWARDS A SUSTAINABLE TRANSPORT POLICY
4.1 CONTEXT
Transport is crucial for Egypt’s economic competitiveness and commercial, social and cultural exchanges. However, there is a growing contradiction between society, which demands ever more mobility, and public opinion, which is becoming increasingly intolerant of chronic delays and the poor quality of some transport services. As demand for transport keeps increasing, the answer cannot be just to build new infrastructure. The transport system needs to be optimized to meet the demands of mobility and sustainable development, in particular given the considerable implications of spatial change noted in the Egypt Vision 2052 document. The optimization must also address the various inefficiencies in the transport system, for example, the fact that roughly one-half of all trucks travel empty at present.
The transport policy embedded within MiNTS must therefore concurrently contribute to an efficient economic structure, strengthen linkages within Egypt as well as with neighboring countries, and provide a base for market-oriented transport activity. Economic expansion within Egypt is well underway; continuing improvements in productivity and well-being are expected. As economic growth continues, changes in transport activities and behavior will follow suit. Thus, the foci of transport planning must gradually shift from alleviation of present deficiencies to realization of a transport system founded upon sustainable evolution and integrated, mutually supportive transport solutions.
Planning for the transport sector must take into account its fiscal importance and “affordability”, now and in future. Recent data suggest an annual investment in vicinity of 20 billion LE. Historically, annual investment has ranged, roughly speaking, from two to three percent of GDP (Table 4.1.1). This is a substantial investment, however, the experiences of fast growing economies such as Vietnam, China and Thailand suggest that expenditure for transport could be increased to the order of four-eight percent of GDP. In other words, trebling or quadrupling the historic Egyptian norm.
Table 4.1.1 Past Egyptian Transport Investment
Transport Investment (LE billion, current) Transport Investment (% of current GDP) Year
Public Private Total Public Private Total
2003 8.04 1.76 9.80 1.93 0.42 2.35
2004 9.91 2.72 12.63 2.04 0.56 2.60
2005 10.33 2.22 12.55 1.92 0.41 2.33
2006 7.87 7.34 15.21 1.27 1.19 2.46
2007 10.31 5.31 15.62 1.38 0.71 2.10
2008 12.90 12.02 24.92 1.44 1.34 2.78
2009 14.08 7.26 21.35 1.36 0.70 2.06 Source: JICA Study Team based on Ministry of Economic Development data
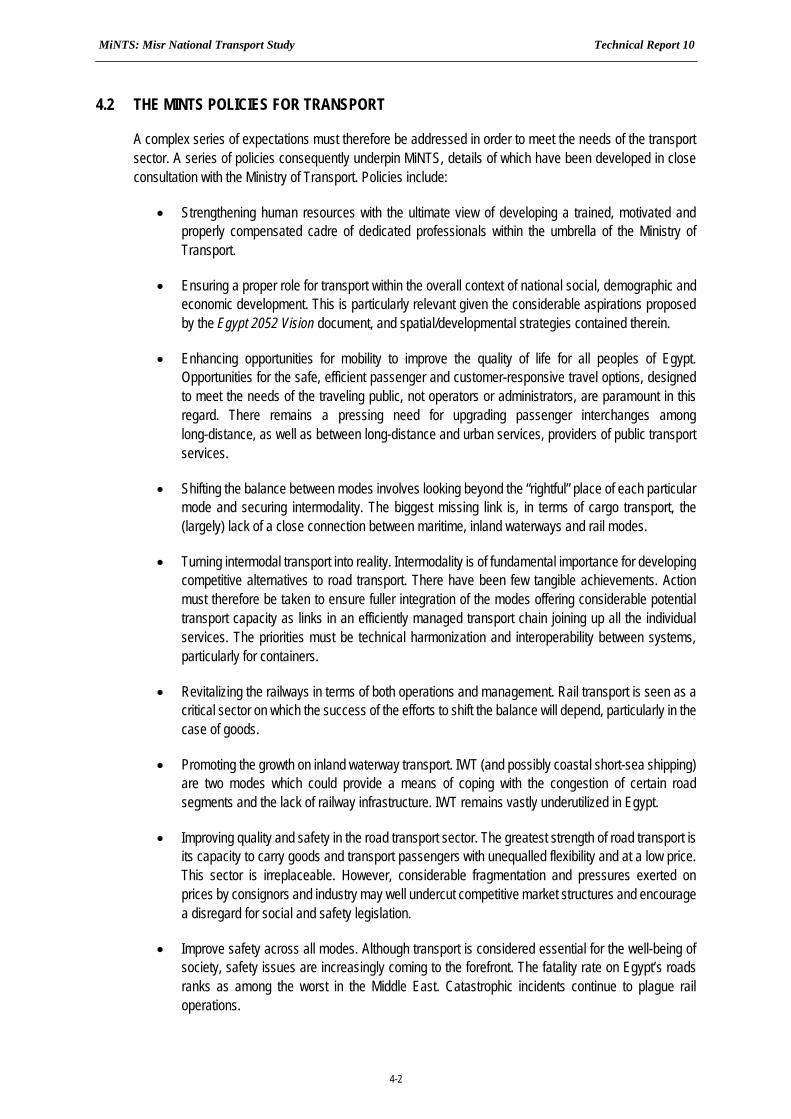
MiNTS: Misr National Transport Study Technical Report 10
4-2
4.2 THE MINTS POLICIES FOR TRANSPORT
A complex series of expectations must therefore be addressed in order to meet the needs of the transport sector. A series of policies consequently underpin MiNTS, details of which have been developed in close consultation with the Ministry of Transport. Policies include:
Strengthening human resources with the ultimate view of developing a trained, motivated and properly compensated cadre of dedicated professionals within the umbrella of the Ministry of Transport.
Ensuring a proper role for transport within the overall context of national social, demographic and economic development. This is particularly relevant given the considerable aspirations proposed by the Egypt 2052 Vision document, and spatial/developmental strategies contained therein.
Enhancing opportunities for mobility to improve the quality of life for all peoples of Egypt. Opportunities for the safe, efficient passenger and customer-responsive travel options, designed to meet the needs of the traveling public, not operators or administrators, are paramount in this regard. There remains a pressing need for upgrading passenger interchanges among long-distance, as well as between long-distance and urban services, providers of public transport services.
Shifting the balance between modes involves looking beyond the “rightful” place of each particular mode and securing intermodality. The biggest missing link is, in terms of cargo transport, the (largely) lack of a close connection between maritime, inland waterways and rail modes.
Turning intermodal transport into reality. Intermodality is of fundamental importance for developing competitive alternatives to road transport. There have been few tangible achievements. Action must therefore be taken to ensure fuller integration of the modes offering considerable potential transport capacity as links in an efficiently managed transport chain joining up all the individual services. The priorities must be technical harmonization and interoperability between systems, particularly for containers.
Revitalizing the railways in terms of both operations and management. Rail transport is seen as a critical sector on which the success of the efforts to shift the balance will depend, particularly in the case of goods.
Promoting the growth on inland waterway transport. IWT (and possibly coastal short-sea shipping) are two modes which could provide a means of coping with the congestion of certain road segments and the lack of railway infrastructure. IWT remains vastly underutilized in Egypt.
Improving quality and safety in the road transport sector. The greatest strength of road transport is its capacity to carry goods and transport passengers with unequalled flexibility and at a low price. This sector is irreplaceable. However, considerable fragmentation and pressures exerted on prices by consignors and industry may well undercut competitive market structures and encourage a disregard for social and safety legislation.
Improve safety across all modes. Although transport is considered essential for the well-being of society, safety issues are increasingly coming to the forefront. The fatality rate on Egypt’s roads ranks as among the worst in the Middle East. Catastrophic incidents continue to plague rail operations.
MiNTS: Misr National Transport Study Technical Report 10
4-3
Leveling the “playing field” via an increasing reliance on free market and “user pays” principles. It is generally acknowledged that not always and not everywhere do the individual modes of transport pay for the costs they generate. This leads to dysfunction within the internal market and distorts competition within the transport system. As a result, there is no real incentive to use the cleanest modes or the least congested networks.
Supporting the vital role of maritime transport. The ports are the lifeline of the Republic. External trade, focused on the European Union, dominates cargo activity.
Developing environmental objectives which underpin sustainable transport. In particular, air pollution, sea and river pollution, noise pollution and visual pollution.
Support the enhanced role of the private sector in the provision of transport systems, facilities and/or services. Opportunities in this regard are strongly supported by the Egyptian Government's recent approach to promote and increase the private sector involvement in the country's economic and social development plan. A PPP (public-private partnership) Central Unit was furthermore established within the Ministry of Finance.
4.3 SPATIAL TRANSITION
The policies must be addressed in both qualitative and spatial terms; that is, a building block process whose beginning point is the vision-based policies. In more precise terms, the realization of policies within a spatial context of a developmental hierarchy and transport corridors.
The schematic structure that is, spatial manifestation of policy, includes a variety of considerations. A basic premise of all investigations is that the MiNTS is comprehensive in nature, that is, adopt approaches designed to mitigate transport problems and contribute to the sustainable development of the nation.
The Ministerial Policy Framework
The Ministry of Transport is committed to pursuing the challenging path of reform targeting the different sectors falling under the ministry’s supervision. The stated policy framework includes:
Capacity building and human resources development;
Improving service quality and upgrading safety measures;
Restructuring the relevant transport authorities;
Diversification of funding by maximizing the role of the private sector;
Developing regulatory and legislative frameworks for the transport sectors;
Developing a comprehensive plan to enhance the role of rail and inland water in freight transport; and,
Conducting comprehensive technical and financial assessment for both ongoing and prospective transport projects.
MiNTS: Misr National Transport Study Technical Report 10
4-4
Investigative efforts extend over the entirety of the Republic, with a particular focus being major corridors of movement for both persons and cargo. The transport concept embedded within MiNTS thus concurrently contributes to an efficient economic structure, strengthen linkages within Egypt as well as with neighboring countries, and provide a base for market-oriented transport activity.
Transport services should, ipso facto, be provided for all socioeconomic activities at levels seen as being sufficient to support multi-sectorial demand, national vision and transport policies. For this purpose, a spatial structure encompassing the entire country-wide transport network structure, with a view to interconnecting key urban centers and/or economic activity concentrations, is depicted as a basis for corridor-specific planning efforts (Figure 4.3.1). Such centers may also be seen as agglomerations of various activities, and thus regarded as transport nodes which either generate or attract freight and passenger demands, or serve as important distribution centers for hinterland activities.
The identified centers follow a hierarchical system, taking into account several factors, among them:
Level of existing population and employment density, economic agglomerations and infrastructure;
Economic importance of major industrial centers and/or hinterland economies;
Important points of national production and consumption;
Current administrative/governmental structures;
Potential accessibility to future transportation systems and services;
Proximity of committed and planned mega projects or other major Government developments; and,
Strategic importance of locations as gateways for international trade and cross-border transport activities with neighboring economies.
Consequently, three functional levels of urban centers are proposed, namely (a) National Centers, (b) Gateway Centers; and (c) Regional Centers.
The two National Centers, Cairo and Alexandria, are the primary urban centers for Egypt. They are the focus for Government administration, retail, commercial, office, specialized personal and professional services. In addition, these centers accommodate financial, tourism, trade, cultural, entertainment, health and educational facilities of national and international significance. They contain the vast majority of Egypt’s population, now and in future. Transport facilities tend to be of pronounced importance in terms of air, dry port, seaport, logistics services, truck terminal, railway and domestic/international transport services.
Egypt’s Regional Centers serve catchments of city-wide significance and/or accommodate employment concentrations. They also serve, in some instances, business, core tourism, retail, and service uses. These centers provide a regional administrative focus. Typically, Regional Centers provide a variety of social/economic services for their hinterland. Regional centers tend to be well served by a variety of transport modes and systems, and/or are located at critical transport junction points. Regional centers are likely to also serve as anchors for tourism activities.
Gateway Centers serve a duality of purpose, and can be both, in functional terms, regional centers plus linkages to international movement of persons and cargoes (air, land and sea). The gateway
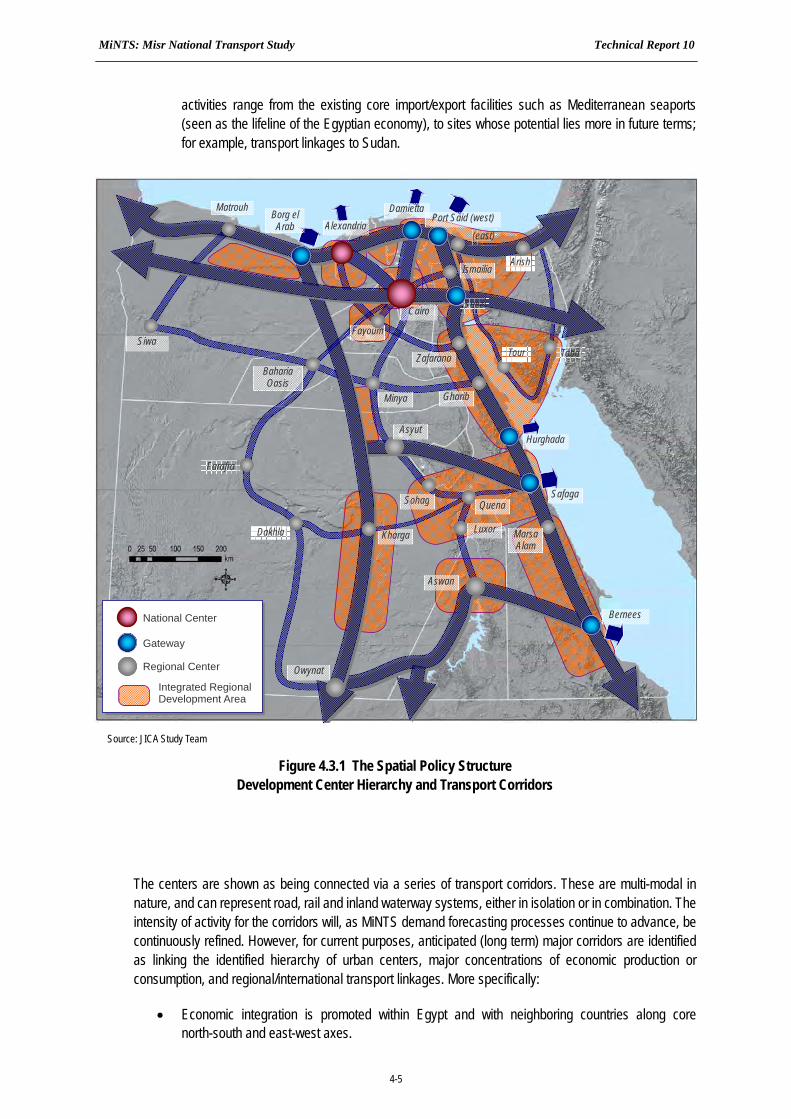
MiNTS: Misr National Transport Study Technical Report 10
4-5
activities range from the existing core import/export facilities such as Mediterranean seaports (seen as the lifeline of the Egyptian economy), to sites whose potential lies more in future terms; for example, transport linkages to Sudan.
The centers are shown as being connected via a series of transport corridors. These are multi-modal in nature, and can represent road, rail and inland waterway systems, either in isolation or in combination. The intensity of activity for the corridors will, as MiNTS demand forecasting processes continue to advance, be continuously refined. However, for current purposes, anticipated (long term) major corridors are identified as linking the identified hierarchy of urban centers, major concentrations of economic production or consumption, and regional/international transport linkages. More specifically:
Economic integration is promoted within Egypt and with neighboring countries along core north-south and east-west axes.
Source: JICA Study Team
Figure 4.3.1 The Spatial Policy Structure Development Center Hierarchy and Transport Corridors
Zafarana
National Center
Gateway
Regional Center
Integrated Regional Development Area
Asyut
Owynat
Bernees
Marsa Alam
Port Said (west) Alexandria
Borg el Arab
Matrouh
Siwa
Damietta
(east)
Arish
Taba Tour
Suez
Ismailia
Fayoum
Minya Gharib
Hurghada
Quena Safaga Sohag
Luxor
Aswan
Kharga Dakhla
Farafra
Baharia Oasis
Cairo
MiNTS: Misr National Transport Study Technical Report 10
4-6
The north-south international linkage consists of two axes. One lies west of the River Nile, passing through the Nile Valley, and linking the Mediterranean Sea with Sudan. The second axis parallels the Red Sea/Gulf of Suez between Port Said and Sudan.
The east-west international linkage consists of four axes. The first lies along the northern (Mediterranean) coast of Egypt to linking Libya with Palestine via Marsa Matrouh, El Alamein, Alexandria, Damietta, Port Said and Arish. The second axis parallels along a more southerly alignment and is intended to secure the planned development of northern Matrouh, Alexandria Urban Area, West Delta, Greater Cairo, Suez Canal-North Sinai Area continuing to Israel, Jordan and Saudi Arabia (and points beyond to include Gulf States, Syria, Iraq and Turkey).
The third east-west axis lies in the central area of Egypt connecting the two north-south axes and Asyut and Safaga (at present), maritime linkages with Saudi Arabia.
The fourth east-west axis lies in Upper Egypt, linking north-south corridors as well as Aswan and, as activity intensifies, Bernees.
The east-west international axes should be developed to strengthen the eastern gateways of Egypt as the global economic growth have moved from Europe towards Asia, especially South-East Asia.
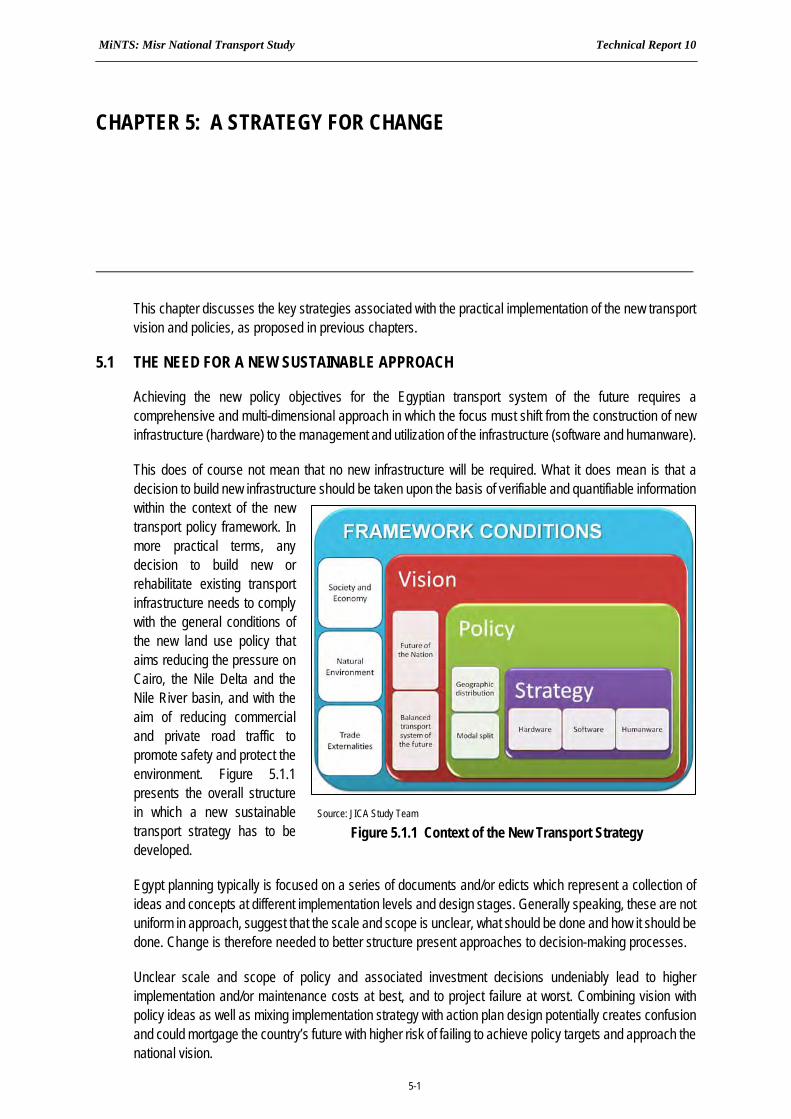
MiNTS: Misr National Transport Study Technical Report 10
5-1
CHAPTER 5: A STRATEGY FOR CHANGE
This chapter discusses the key strategies associated with the practical implementation of the new transport vision and policies, as proposed in previous chapters.
5.1 THE NEED FOR A NEW SUSTAINABLE APPROACH
Achieving the new policy objectives for the Egyptian transport system of the future requires a comprehensive and multi-dimensional approach in which the focus must shift from the construction of new infrastructure (hardware) to the management and utilization of the infrastructure (software and humanware).
This does of course not mean that no new infrastructure will be required. What it does mean is that a decision to build new infrastructure should be taken upon the basis of verifiable and quantifiable information within the context of the new transport policy framework. In more practical terms, any decision to build new or rehabilitate existing transport infrastructure needs to comply with the general conditions of the new land use policy that aims reducing the pressure on Cairo, the Nile Delta and the Nile River basin, and with the aim of reducing commercial and private road traffic to promote safety and protect the environment. Figure 5.1.1 presents the overall structure in which a new sustainable transport strategy has to be developed.
Egypt planning typically is focused on a series of documents and/or edicts which represent a collection of ideas and concepts at different implementation levels and design stages. Generally speaking, these are not uniform in approach, suggest that the scale and scope is unclear, what should be done and how it should be done. Change is therefore needed to better structure present approaches to decision-making processes.
Unclear scale and scope of policy and associated investment decisions undeniably lead to higher implementation and/or maintenance costs at best, and to project failure at worst. Combining vision with policy ideas as well as mixing implementation strategy with action plan design potentially creates confusion and could mortgage the country’s future with higher risk of failing to achieve policy targets and approach the national vision.
Source: JICA Study Team
Figure 5.1.1 Context of the New Transport Strategy
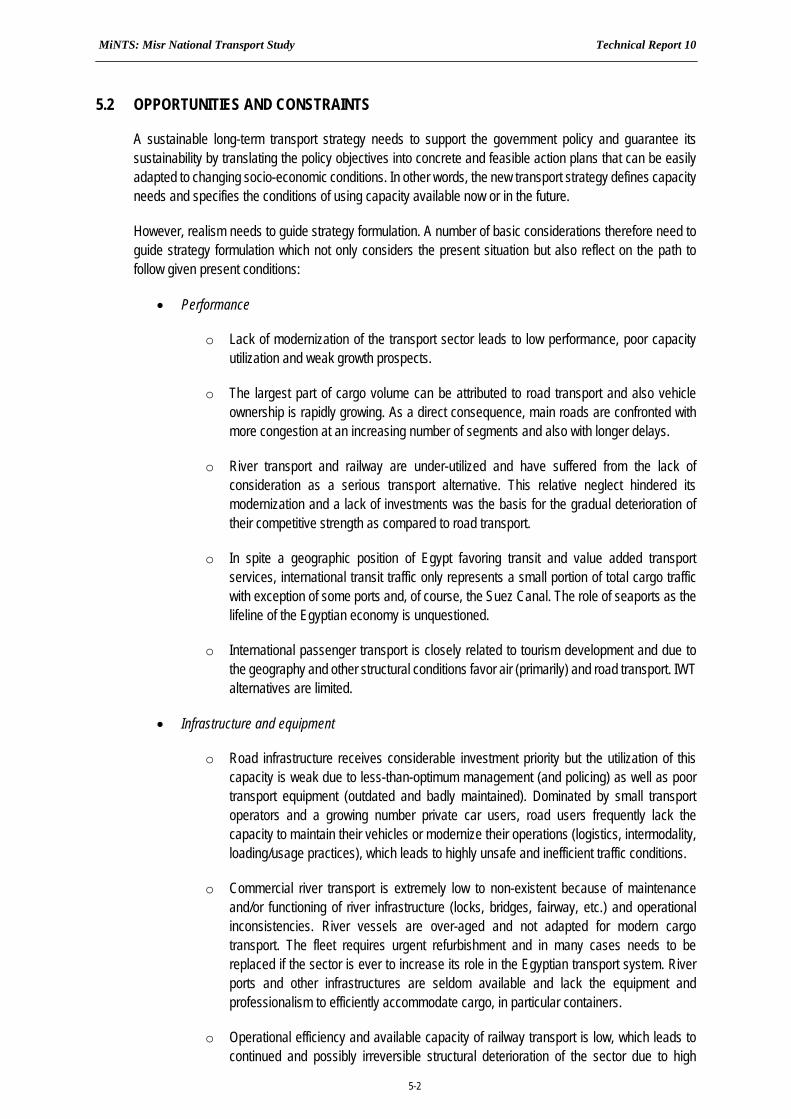
MiNTS: Misr National Transport Study Technical Report 10
5-2
5.2 OPPORTUNITIES AND CONSTRAINTS
A sustainable long-term transport strategy needs to support the government policy and guarantee its sustainability by translating the policy objectives into concrete and feasible action plans that can be easily adapted to changing socio-economic conditions. In other words, the new transport strategy defines capacity needs and specifies the conditions of using capacity available now or in the future.
However, realism needs to guide strategy formulation. A number of basic considerations therefore need to guide strategy formulation which not only considers the present situation but also reflect on the path to follow given present conditions:
Performance
o Lack of modernization of the transport sector leads to low performance, poor capacity utilization and weak growth prospects.
o The largest part of cargo volume can be attributed to road transport and also vehicle ownership is rapidly growing. As a direct consequence, main roads are confronted with more congestion at an increasing number of segments and also with longer delays.
o River transport and railway are under-utilized and have suffered from the lack of consideration as a serious transport alternative. This relative neglect hindered its modernization and a lack of investments was the basis for the gradual deterioration of their competitive strength as compared to road transport.
o In spite a geographic position of Egypt favoring transit and value added transport services, international transit traffic only represents a small portion of total cargo traffic with exception of some ports and, of course, the Suez Canal. The role of seaports as the lifeline of the Egyptian economy is unquestioned.
o International passenger transport is closely related to tourism development and due to the geography and other structural conditions favor air (primarily) and road transport. IWT alternatives are limited.
Infrastructure and equipment
o Road infrastructure receives considerable investment priority but the utilization of this capacity is weak due to less-than-optimum management (and policing) as well as poor transport equipment (outdated and badly maintained). Dominated by small transport operators and a growing number private car users, road users frequently lack the capacity to maintain their vehicles or modernize their operations (logistics, intermodality, loading/usage practices), which leads to highly unsafe and inefficient traffic conditions.
o Commercial river transport is extremely low to non-existent because of maintenance and/or functioning of river infrastructure (locks, bridges, fairway, etc.) and operational inconsistencies. River vessels are over-aged and not adapted for modern cargo transport. The fleet requires urgent refurbishment and in many cases needs to be replaced if the sector is ever to increase its role in the Egyptian transport system. River ports and other infrastructures are seldom available and lack the equipment and professionalism to efficiently accommodate cargo, in particular containers.
o Operational efficiency and available capacity of railway transport is low, which leads to continued and possibly irreversible structural deterioration of the sector due to high
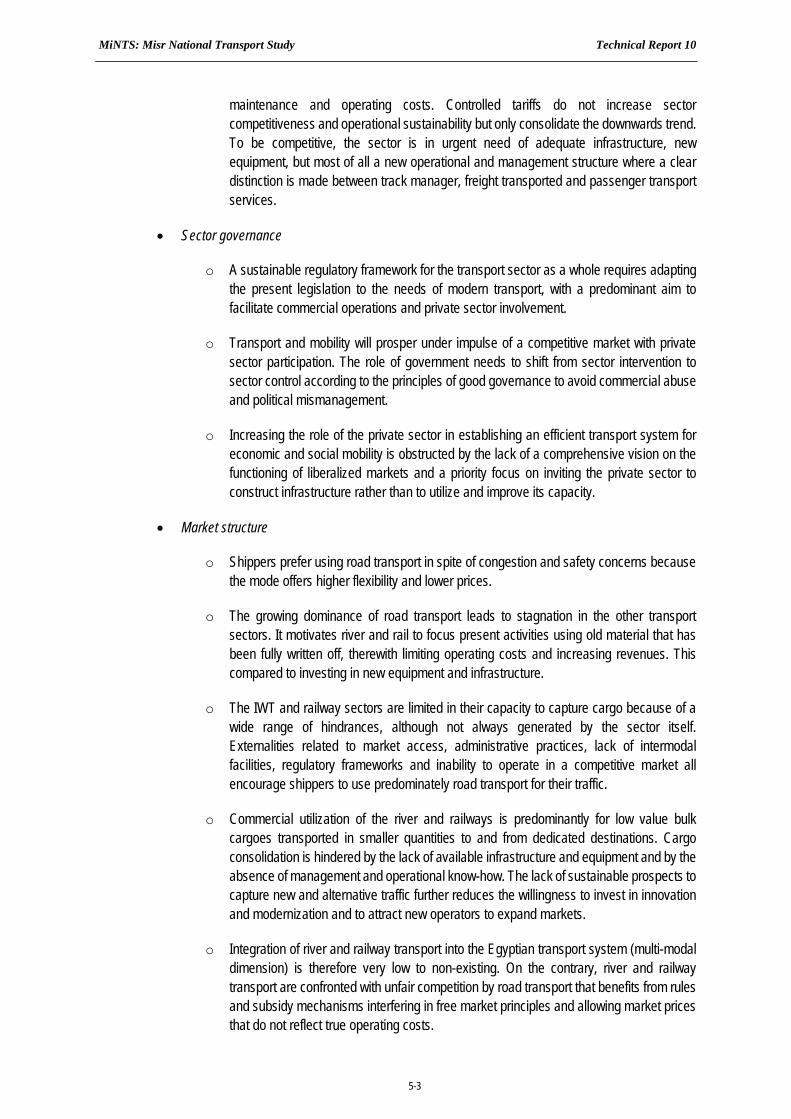
MiNTS: Misr National Transport Study Technical Report 10
5-3
maintenance and operating costs. Controlled tariffs do not increase sector competitiveness and operational sustainability but only consolidate the downwards trend. To be competitive, the sector is in urgent need of adequate infrastructure, new equipment, but most of all a new operational and management structure where a clear distinction is made between track manager, freight transported and passenger transport services.
Sector governance
o A sustainable regulatory framework for the transport sector as a whole requires adapting the present legislation to the needs of modern transport, with a predominant aim to facilitate commercial operations and private sector involvement.
o Transport and mobility will prosper under impulse of a competitive market with private sector participation. The role of government needs to shift from sector intervention to sector control according to the principles of good governance to avoid commercial abuse and political mismanagement.
o Increasing the role of the private sector in establishing an efficient transport system for economic and social mobility is obstructed by the lack of a comprehensive vision on the functioning of liberalized markets and a priority focus on inviting the private sector to construct infrastructure rather than to utilize and improve its capacity.
Market structure
o Shippers prefer using road transport in spite of congestion and safety concerns because the mode offers higher flexibility and lower prices.
o The growing dominance of road transport leads to stagnation in the other transport sectors. It motivates river and rail to focus present activities using old material that has been fully written off, therewith limiting operating costs and increasing revenues. This compared to investing in new equipment and infrastructure.
o The IWT and railway sectors are limited in their capacity to capture cargo because of a wide range of hindrances, although not always generated by the sector itself. Externalities related to market access, administrative practices, lack of intermodal facilities, regulatory frameworks and inability to operate in a competitive market all encourage shippers to use predominately road transport for their traffic.
o Commercial utilization of the river and railways is predominantly for low value bulk cargoes transported in smaller quantities to and from dedicated destinations. Cargo consolidation is hindered by the lack of available infrastructure and equipment and by the absence of management and operational know-how. The lack of sustainable prospects to capture new and alternative traffic further reduces the willingness to invest in innovation and modernization and to attract new operators to expand markets.
o Integration of river and railway transport into the Egyptian transport system (multi-modal dimension) is therefore very low to non-existing. On the contrary, river and railway transport are confronted with unfair competition by road transport that benefits from rules and subsidy mechanisms interfering in free market principles and allowing market prices that do not reflect true operating costs.
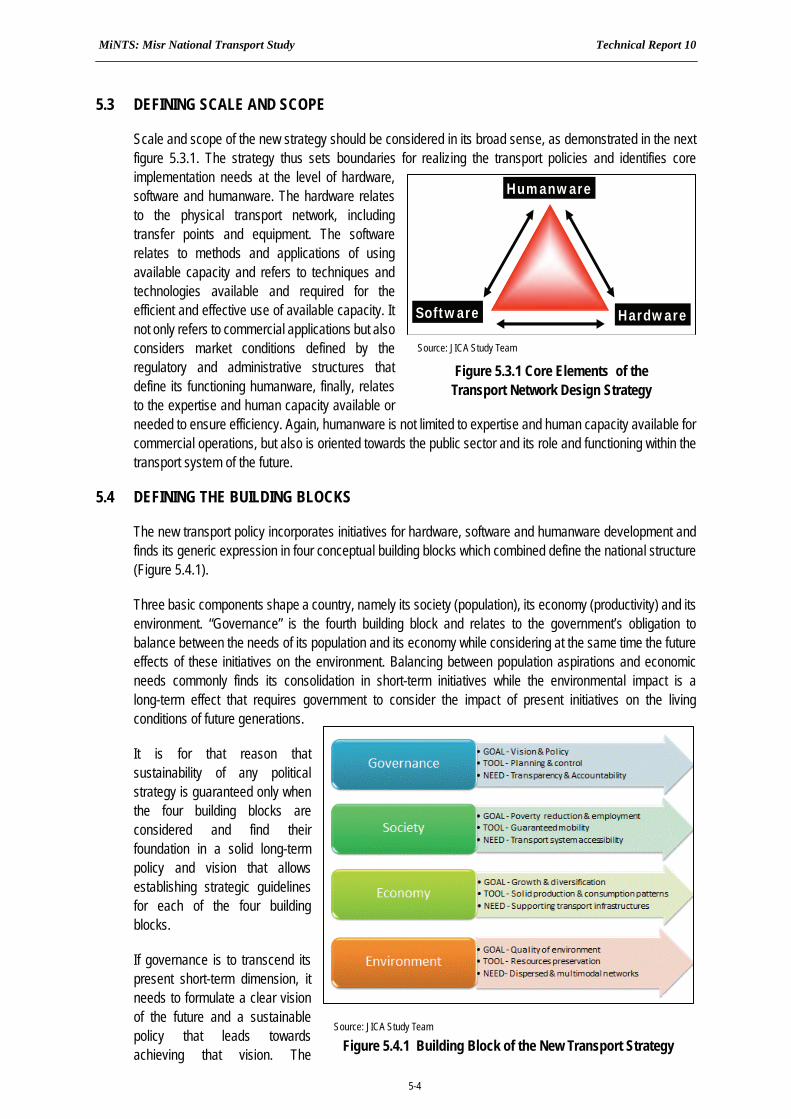
MiNTS: Misr National Transport Study Technical Report 10
5-4
5.3 DEFINING SCALE AND SCOPE
Scale and scope of the new strategy should be considered in its broad sense, as demonstrated in the next figure 5.3.1. The strategy thus sets boundaries for realizing the transport policies and identifies core implementation needs at the level of hardware, software and humanware. The hardware relates to the physical transport network, including transfer points and equipment. The software relates to methods and applications of using available capacity and refers to techniques and technologies available and required for the efficient and effective use of available capacity. It not only refers to commercial applications but also considers market conditions defined by the regulatory and administrative structures that define its functioning humanware, finally, relates to the expertise and human capacity available or needed to ensure efficiency. Again, humanware is not limited to expertise and human capacity available for commercial operations, but also is oriented towards the public sector and its role and functioning within the transport system of the future.
5.4 DEFINING THE BUILDING BLOCKS
The new transport policy incorporates initiatives for hardware, software and humanware development and finds its generic expression in four conceptual building blocks which combined define the national structure (Figure 5.4.1).
Three basic components shape a country, namely its society (population), its economy (productivity) and its environment. “Governance” is the fourth building block and relates to the government’s obligation to balance between the needs of its population and its economy while considering at the same time the future effects of these initiatives on the environment. Balancing between population aspirations and economic needs commonly finds its consolidation in short-term initiatives while the environmental impact is a long-term effect that requires government to consider the impact of present initiatives on the living conditions of future generations.
It is for that reason that sustainability of any political strategy is guaranteed only when the four building blocks are considered and find their foundation in a solid long-term policy and vision that allows establishing strategic guidelines for each of the four building blocks.
If governance is to transcend its present short-term dimension, it needs to formulate a clear vision of the future and a sustainable policy that leads towards achieving that vision. The
Humanware
Software Hardware
Source: JICA Study Team
Figure 5.3.1 Core Elements of the Transport Network Design Strategy
Source: JICA Study Team
Figure 5.4.1 Building Block of the New Transport Strategy
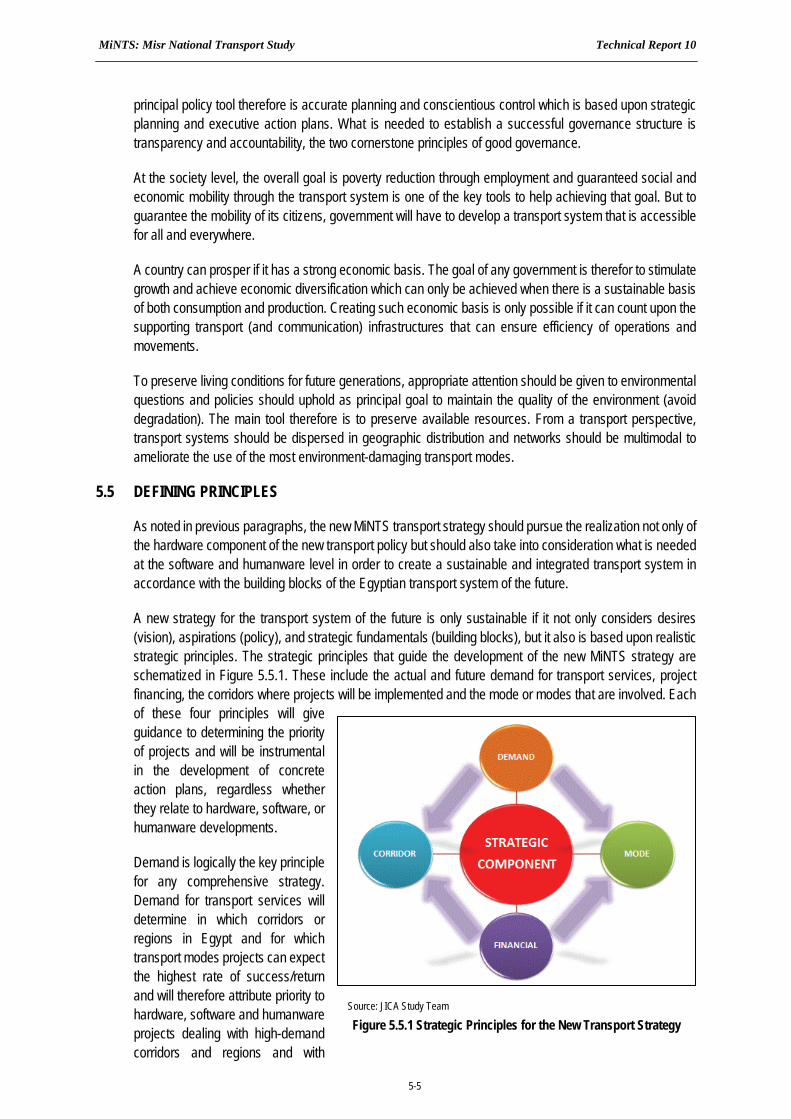
MiNTS: Misr National Transport Study Technical Report 10
5-5
principal policy tool therefore is accurate planning and conscientious control which is based upon strategic planning and executive action plans. What is needed to establish a successful governance structure is transparency and accountability, the two cornerstone principles of good governance.
At the society level, the overall goal is poverty reduction through employment and guaranteed social and economic mobility through the transport system is one of the key tools to help achieving that goal. But to guarantee the mobility of its citizens, government will have to develop a transport system that is accessible for all and everywhere.
A country can prosper if it has a strong economic basis. The goal of any government is therefor to stimulate growth and achieve economic diversification which can only be achieved when there is a sustainable basis of both consumption and production. Creating such economic basis is only possible if it can count upon the supporting transport (and communication) infrastructures that can ensure efficiency of operations and movements.
To preserve living conditions for future generations, appropriate attention should be given to environmental questions and policies should uphold as principal goal to maintain the quality of the environment (avoid degradation). The main tool therefore is to preserve available resources. From a transport perspective, transport systems should be dispersed in geographic distribution and networks should be multimodal to ameliorate the use of the most environment-damaging transport modes.
5.5 DEFINING PRINCIPLES
As noted in previous paragraphs, the new MiNTS transport strategy should pursue the realization not only of the hardware component of the new transport policy but should also take into consideration what is needed at the software and humanware level in order to create a sustainable and integrated transport system in accordance with the building blocks of the Egyptian transport system of the future.
A new strategy for the transport system of the future is only sustainable if it not only considers desires (vision), aspirations (policy), and strategic fundamentals (building blocks), but it also is based upon realistic strategic principles. The strategic principles that guide the development of the new MiNTS strategy are schematized in Figure 5.5.1. These include the actual and future demand for transport services, project financing, the corridors where projects will be implemented and the mode or modes that are involved. Each of these four principles will give guidance to determining the priority of projects and will be instrumental in the development of concrete action plans, regardless whether they relate to hardware, software, or humanware developments.
Demand is logically the key principle for any comprehensive strategy. Demand for transport services will determine in which corridors or regions in Egypt and for which transport modes projects can expect the highest rate of success/return and will therefore attribute priority to hardware, software and humanware projects dealing with high-demand corridors and regions and with
Source: JICA Study Team
Figure 5.5.1 Strategic Principles for the New Transport Strategy
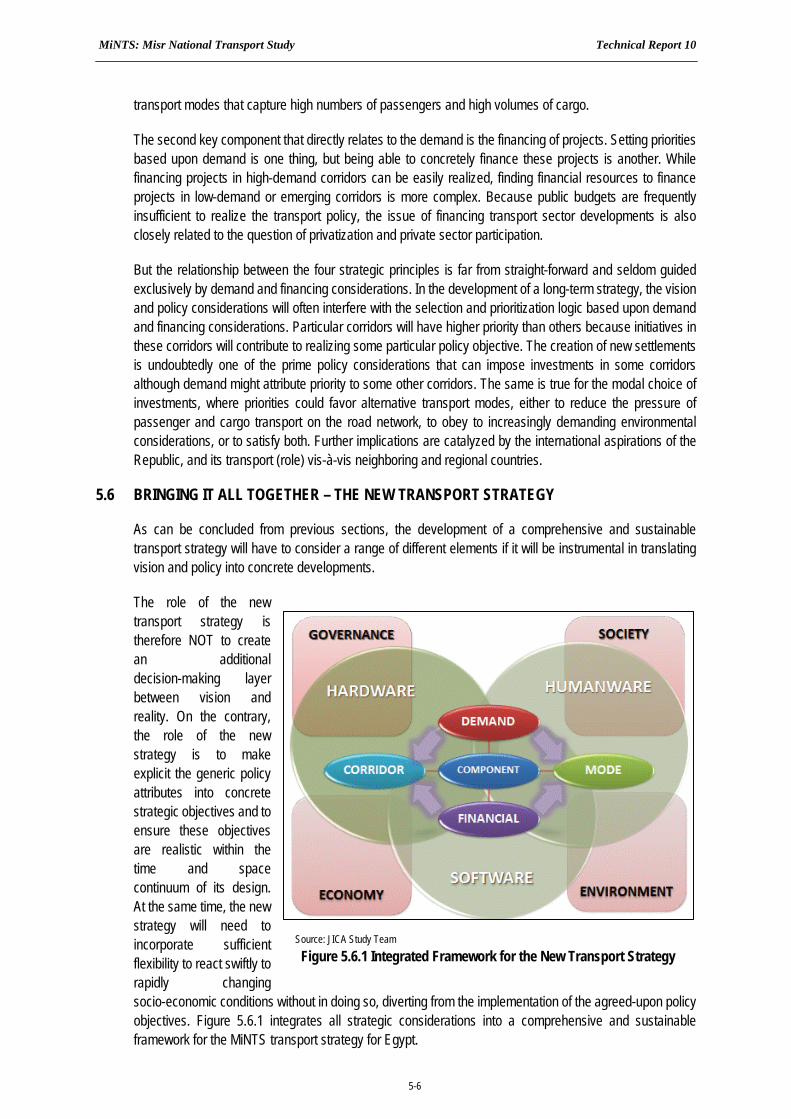
MiNTS: Misr National Transport Study Technical Report 10
5-6
transport modes that capture high numbers of passengers and high volumes of cargo.
The second key component that directly relates to the demand is the financing of projects. Setting priorities based upon demand is one thing, but being able to concretely finance these projects is another. While financing projects in high-demand corridors can be easily realized, finding financial resources to finance projects in low-demand or emerging corridors is more complex. Because public budgets are frequently insufficient to realize the transport policy, the issue of financing transport sector developments is also closely related to the question of privatization and private sector participation.
But the relationship between the four strategic principles is far from straight-forward and seldom guided exclusively by demand and financing considerations. In the development of a long-term strategy, the vision and policy considerations will often interfere with the selection and prioritization logic based upon demand and financing considerations. Particular corridors will have higher priority than others because initiatives in these corridors will contribute to realizing some particular policy objective. The creation of new settlements is undoubtedly one of the prime policy considerations that can impose investments in some corridors although demand might attribute priority to some other corridors. The same is true for the modal choice of investments, where priorities could favor alternative transport modes, either to reduce the pressure of passenger and cargo transport on the road network, to obey to increasingly demanding environmental considerations, or to satisfy both. Further implications are catalyzed by the international aspirations of the Republic, and its transport (role) vis-à-vis neighboring and regional countries.
5.6 BRINGING IT ALL TOGETHER – THE NEW TRANSPORT STRATEGY
As can be concluded from previous sections, the development of a comprehensive and sustainable transport strategy will have to consider a range of different elements if it will be instrumental in translating vision and policy into concrete developments.
The role of the new transport strategy is therefore NOT to create an additional decision-making layer between vision and reality. On the contrary, the role of the new strategy is to make explicit the generic policy attributes into concrete strategic objectives and to ensure these objectives are realistic within the time and space continuum of its design. At the same time, the new strategy will need to incorporate sufficient flexibility to react swiftly to rapidly changing socio-economic conditions without in doing so, diverting from the implementation of the agreed-upon policy objectives. Figure 5.6.1 integrates all strategic considerations into a comprehensive and sustainable framework for the MiNTS transport strategy for Egypt.
Source: JICA Study Team Figure 5.6.1 Integrated Framework for the New Transport Strategy
MiNTS: Misr National Transport Study Technical Report 10
5-7
A first obligation of the new strategy is that it promotes good governance, balances the needs of society with those of the economy while it finally considers the long-term implications on the environment. The proposed new transport strategy therefore can only be validated if and when it complies with the conditions and specifications of its four fundamental building blocks.
Within that context, the new strategy should not only consider the creation of new infrastructure, but should on the contrary shift its focus from infrastructure building to transport system management and efficiency, focusing software and humanware projects to improve and optimize the utilization of existing capacity. New infrastructure should be carefully considered in the new transport strategy and should prioritize projects that directly relate to strengthening at least one but preferably more than one of the four strategic building blocks.
But the new transport strategy cannot remain at the generic level and needs to be specific as it is the only direct link between policy objectives and concrete policy initiatives. It therefore needs to be realistic and requires confirmation at two principal levels, namely the level of response to concrete (present and future) demand and the availability of (public and/or private) financial resources.
Demand and/or financial considerations not always are the sole decision-factors. The demand for realism will sometimes need balancing against the needs defined by the long-term vision for (the transport system of) Egypt and the therewith related (transport) policy priorities. Sometimes, realism has to be waivered to policy decisions that prioritize projects that have no strong financial or demand justification but find validation in the role they play in achieving vision and policy.
APPENDIXES
2-A SOCIO-ECONOMIC FRAMEWORK 2-B MEDITERRANEAN MARITIME TRADE STRUCTURE 2-C PRODUCTION AND CONSUMPTION FRAMEWORK 3-A EMPIRICAL FRAMEWORK FOR CARGO LOGISTIC 3-B NATIONAL PLANS AND PROGRAMS
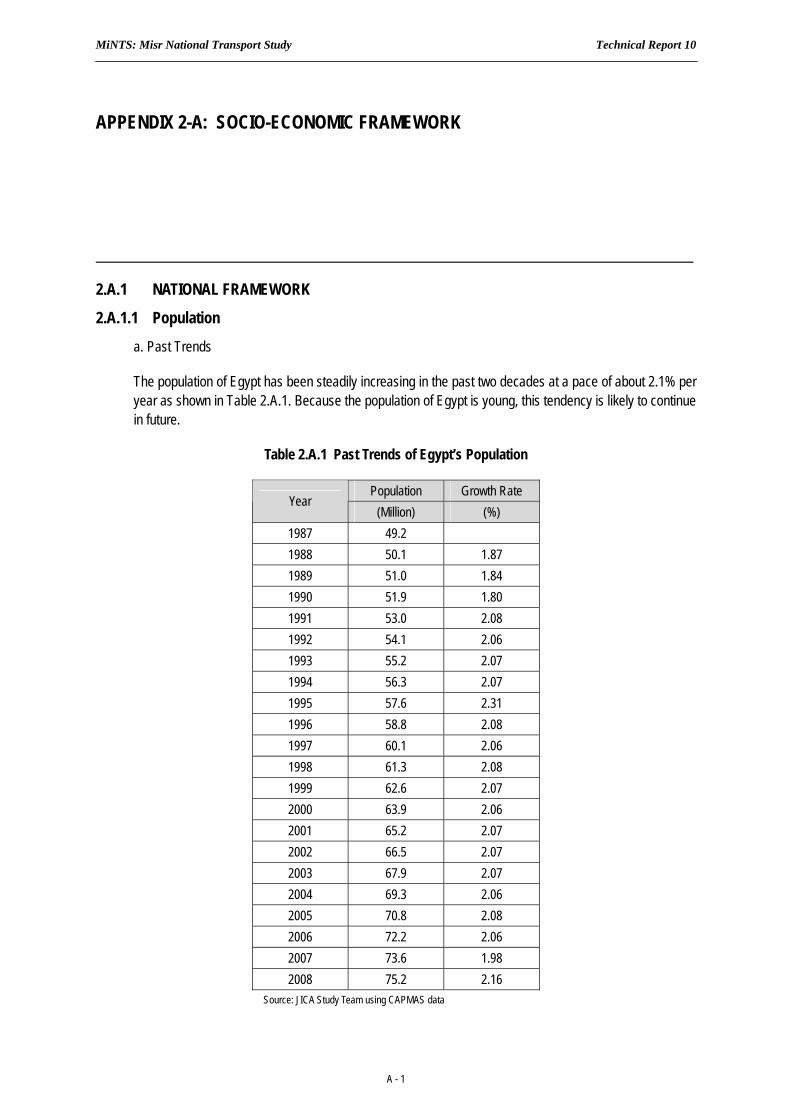
MiNTS: Misr National Transport Study Technical Report 10
A - 1
APPENDIX 2-A: SOCIO-ECONOMIC FRAMEWORK
2.A.1 NATIONAL FRAMEWORK
2.A.1.1 Population
a. Past Trends
The population of Egypt has been steadily increasing in the past two decades at a pace of about 2.1% per year as shown in Table 2.A.1. Because the population of Egypt is young, this tendency is likely to continue in future.
Table 2.A.1 Past Trends of Egypt’s Population
Population Growth Rate Year
(Million) (%) 1987 49.2 1988 50.1 1.87 1989 51.0 1.84 1990 51.9 1.80 1991 53.0 2.08 1992 54.1 2.06 1993 55.2 2.07 1994 56.3 2.07 1995 57.6 2.31 1996 58.8 2.08 1997 60.1 2.06 1998 61.3 2.08 1999 62.6 2.07 2000 63.9 2.06 2001 65.2 2.07 2002 66.5 2.07 2003 67.9 2.07 2004 69.3 2.06 2005 70.8 2.08 2006 72.2 2.06 2007 73.6 1.98 2008 75.2 2.16
Source: JICA Study Team using CAPMAS data
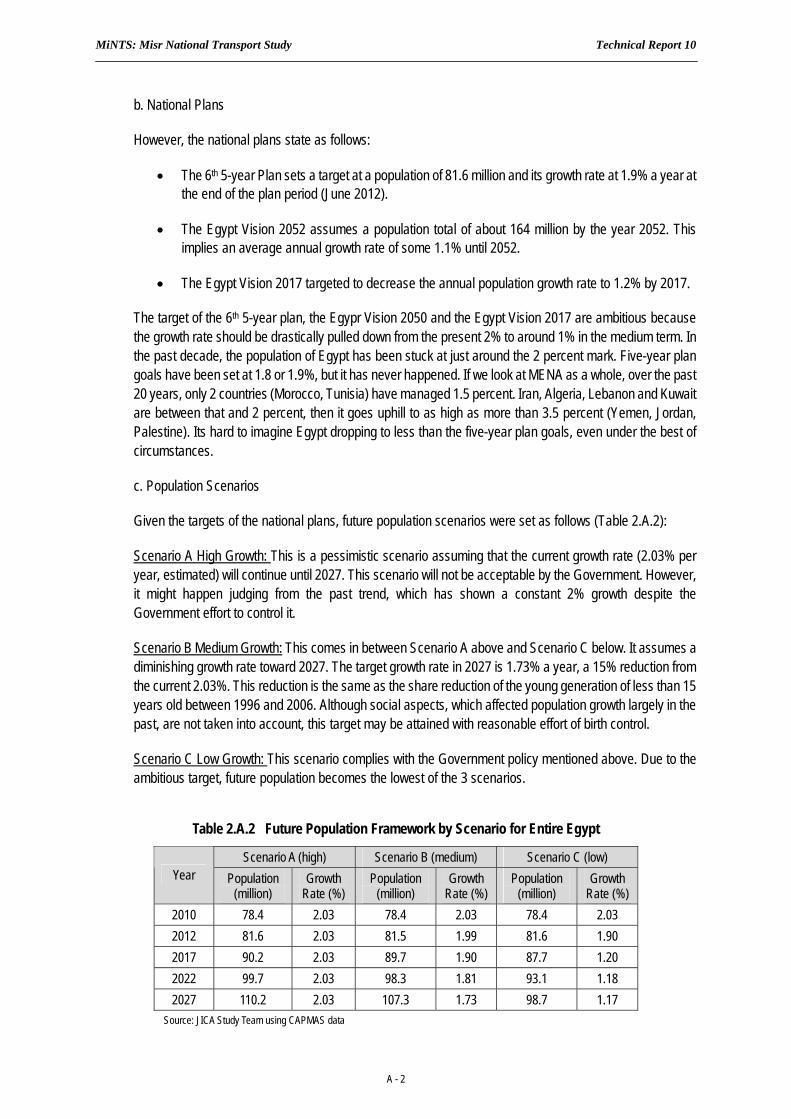
MiNTS: Misr National Transport Study Technical Report 10
A - 2
b. National Plans
However, the national plans state as follows:
• The 6th 5-year Plan sets a target at a population of 81.6 million and its growth rate at 1.9% a year at the end of the plan period (June 2012).
• The Egypt Vision 2052 assumes a population total of about 164 million by the year 2052. This implies an average annual growth rate of some 1.1% until 2052.
• The Egypt Vision 2017 targeted to decrease the annual population growth rate to 1.2% by 2017.
The target of the 6th 5-year plan, the Egypr Vision 2050 and the Egypt Vision 2017 are ambitious because the growth rate should be drastically pulled down from the present 2% to around 1% in the medium term. In the past decade, the population of Egypt has been stuck at just around the 2 percent mark. Five-year plan goals have been set at 1.8 or 1.9%, but it has never happened. If we look at MENA as a whole, over the past 20 years, only 2 countries (Morocco, Tunisia) have managed 1.5 percent. Iran, Algeria, Lebanon and Kuwait are between that and 2 percent, then it goes uphill to as high as more than 3.5 percent (Yemen, Jordan, Palestine). Its hard to imagine Egypt dropping to less than the five-year plan goals, even under the best of circumstances.
c. Population Scenarios
Given the targets of the national plans, future population scenarios were set as follows (Table 2.A.2):
Scenario A High Growth: This is a pessimistic scenario assuming that the current growth rate (2.03% per year, estimated) will continue until 2027. This scenario will not be acceptable by the Government. However, it might happen judging from the past trend, which has shown a constant 2% growth despite the Government effort to control it.
Scenario B Medium Growth: This comes in between Scenario A above and Scenario C below. It assumes a diminishing growth rate toward 2027. The target growth rate in 2027 is 1.73% a year, a 15% reduction from the current 2.03%. This reduction is the same as the share reduction of the young generation of less than 15 years old between 1996 and 2006. Although social aspects, which affected population growth largely in the past, are not taken into account, this target may be attained with reasonable effort of birth control.
Scenario C Low Growth: This scenario complies with the Government policy mentioned above. Due to the ambitious target, future population becomes the lowest of the 3 scenarios.
Table 2.A.2 Future Population Framework by Scenario for Entire Egypt
Scenario A (high) Scenario B (medium) Scenario C (low) Year Population
(million) Growth
Rate (%) Population
(million) Growth
Rate (%) Population
(million) Growth
Rate (%) 2010 78.4 2.03 78.4 2.03 78.4 2.03 2012 81.6 2.03 81.5 1.99 81.6 1.90 2017 90.2 2.03 89.7 1.90 87.7 1.20 2022 99.7 2.03 98.3 1.81 93.1 1.18 2027 110.2 2.03 107.3 1.73 98.7 1.17
Source: JICA Study Team using CAPMAS data
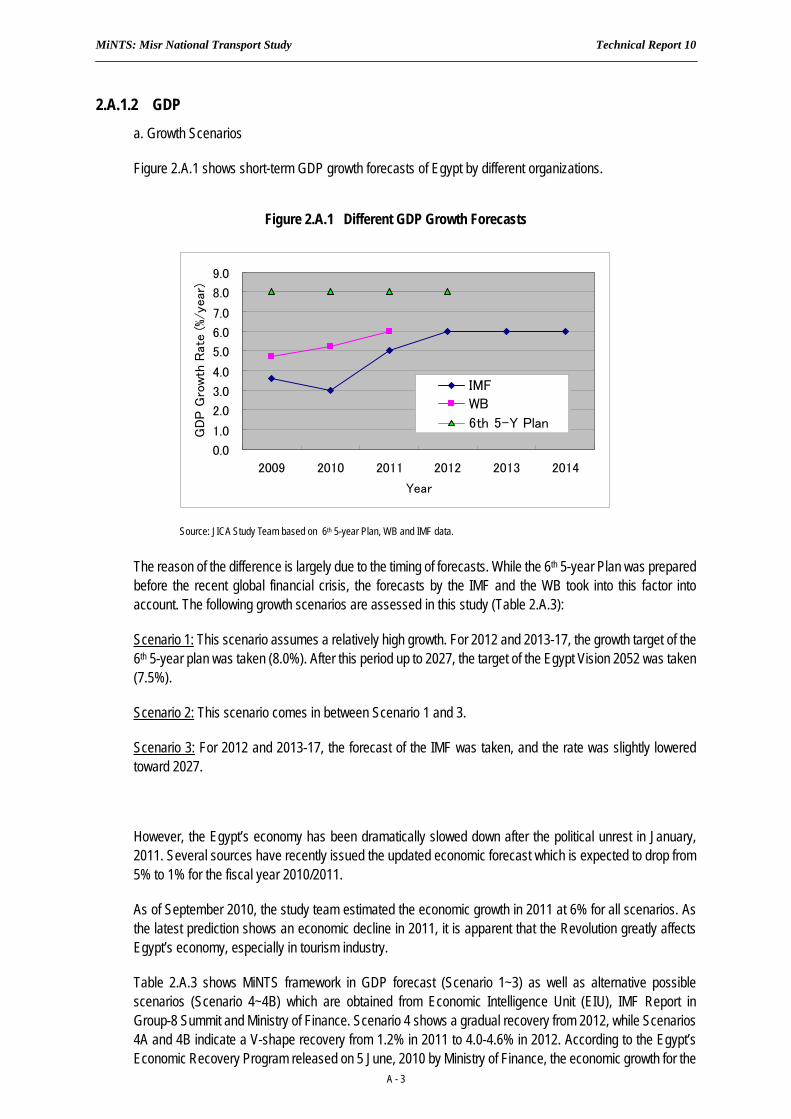
MiNTS: Misr National Transport Study Technical Report 10
A - 3
2.A.1.2 GDP a. Growth Scenarios
Figure 2.A.1 shows short-term GDP growth forecasts of Egypt by different organizations.
Figure 2.A.1 Different GDP Growth Forecasts
Source: JICA Study Team based on 6th 5-year Plan, WB and IMF data.
The reason of the difference is largely due to the timing of forecasts. While the 6th 5-year Plan was prepared before the recent global financial crisis, the forecasts by the IMF and the WB took into this factor into account. The following growth scenarios are assessed in this study (Table 2.A.3):
Scenario 1: This scenario assumes a relatively high growth. For 2012 and 2013-17, the growth target of the 6th 5-year plan was taken (8.0%). After this period up to 2027, the target of the Egypt Vision 2052 was taken (7.5%).
Scenario 2: This scenario comes in between Scenario 1 and 3.
Scenario 3: For 2012 and 2013-17, the forecast of the IMF was taken, and the rate was slightly lowered toward 2027.
However, the Egypt’s economy has been dramatically slowed down after the political unrest in January, 2011. Several sources have recently issued the updated economic forecast which is expected to drop from 5% to 1% for the fiscal year 2010/2011.
As of September 2010, the study team estimated the economic growth in 2011 at 6% for all scenarios. As the latest prediction shows an economic decline in 2011, it is apparent that the Revolution greatly affects Egypt’s economy, especially in tourism industry.
Table 2.A.3 shows MiNTS framework in GDP forecast (Scenario 1~3) as well as alternative possible scenarios (Scenario 4~4B) which are obtained from Economic Intelligence Unit (EIU), IMF Report in Group-8 Summit and Ministry of Finance. Scenario 4 shows a gradual recovery from 2012, while Scenarios 4A and 4B indicate a V-shape recovery from 1.2% in 2011 to 4.0-4.6% in 2012. According to the Egypt’s Economic Recovery Program released on 5 June, 2010 by Ministry of Finance, the economic growth for the
0.0
1.0
2.0
3.0
4.0
5.0
6.0
7.0
8.0
9.0
2009 2010 2011 2012 2013 2014
Year
GD
P G
row
th R
ate
(%/ye
ar)
IMF
WB
6th 5-Y Plan
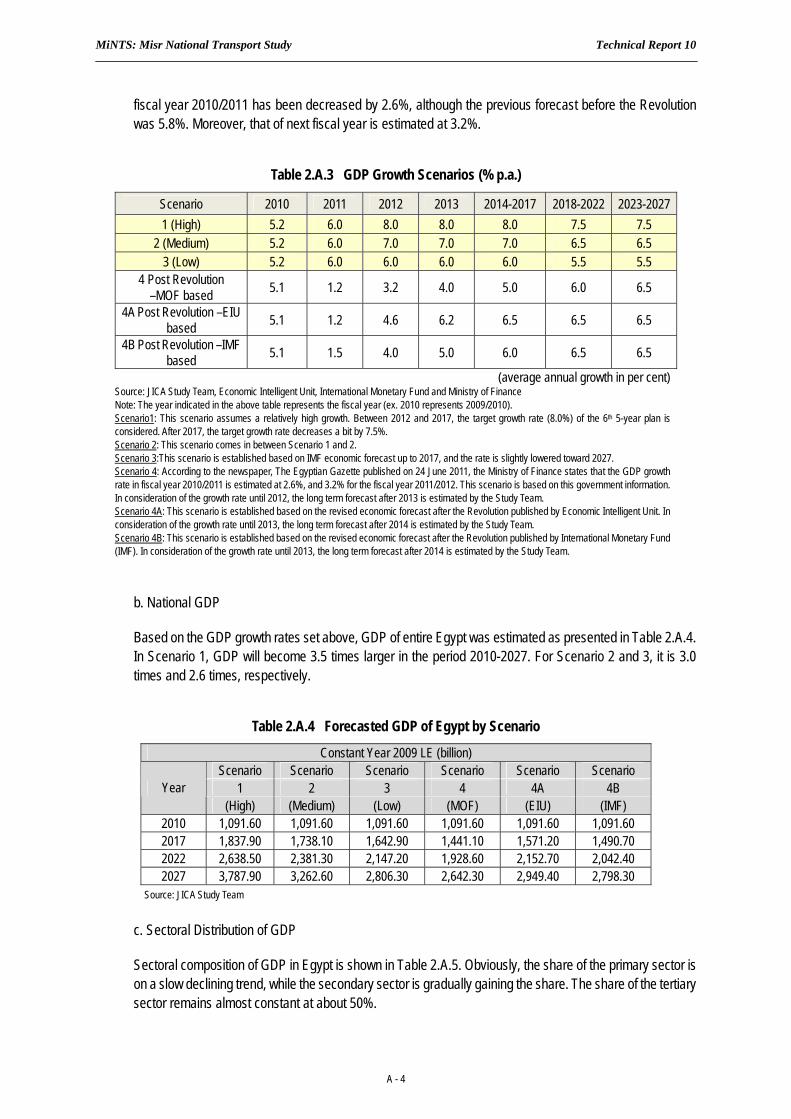
MiNTS: Misr National Transport Study Technical Report 10
A - 4
fiscal year 2010/2011 has been decreased by 2.6%, although the previous forecast before the Revolution was 5.8%. Moreover, that of next fiscal year is estimated at 3.2%.
Table 2.A.3 GDP Growth Scenarios (% p.a.)
Scenario 2010 2011 2012 2013 2014-2017 2018-2022 2023-2027 1 (High) 5.2 6.0 8.0 8.0 8.0 7.5 7.5
2 (Medium) 5.2 6.0 7.0 7.0 7.0 6.5 6.5 3 (Low) 5.2 6.0 6.0 6.0 6.0 5.5 5.5
4 Post Revolution –MOF based 5.1 1.2 3.2 4.0 5.0 6.0 6.5
4A Post Revolution –EIU based 5.1 1.2 4.6 6.2 6.5 6.5 6.5
4B Post Revolution –IMF based 5.1 1.5 4.0 5.0 6.0 6.5 6.5
(average annual growth in per cent) Source: JICA Study Team, Economic Intelligent Unit, International Monetary Fund and Ministry of Finance Note: The year indicated in the above table represents the fiscal year (ex. 2010 represents 2009/2010). Scenario1: This scenario assumes a relatively high growth. Between 2012 and 2017, the target growth rate (8.0%) of the 6th 5-year plan is considered. After 2017, the target growth rate decreases a bit by 7.5%. Scenario 2: This scenario comes in between Scenario 1 and 2. Scenario 3:This scenario is established based on IMF economic forecast up to 2017, and the rate is slightly lowered toward 2027. Scenario 4: According to the newspaper, The Egyptian Gazette published on 24 June 2011, the Ministry of Finance states that the GDP growth rate in fiscal year 2010/2011 is estimated at 2.6%, and 3.2% for the fiscal year 2011/2012. This scenario is based on this government information. In consideration of the growth rate until 2012, the long term forecast after 2013 is estimated by the Study Team. Scenario 4A: This scenario is established based on the revised economic forecast after the Revolution published by Economic Intelligent Unit. In consideration of the growth rate until 2013, the long term forecast after 2014 is estimated by the Study Team. Scenario 4B: This scenario is established based on the revised economic forecast after the Revolution published by International Monetary Fund (IMF). In consideration of the growth rate until 2013, the long term forecast after 2014 is estimated by the Study Team.
b. National GDP
Based on the GDP growth rates set above, GDP of entire Egypt was estimated as presented in Table 2.A.4. In Scenario 1, GDP will become 3.5 times larger in the period 2010-2027. For Scenario 2 and 3, it is 3.0 times and 2.6 times, respectively.
Table 2.A.4 Forecasted GDP of Egypt by Scenario
Constant Year 2009 LE (billion) Scenario Scenario Scenario Scenario Scenario Scenario
1 2 3 4 4A 4B Year (High) (Medium) (Low) (MOF) (EIU) (IMF)
2010 1,091.60 1,091.60 1,091.60 1,091.60 1,091.60 1,091.60 2017 1,837.90 1,738.10 1,642.90 1,441.10 1,571.20 1,490.70 2022 2,638.50 2,381.30 2,147.20 1,928.60 2,152.70 2,042.40 2027 3,787.90 3,262.60 2,806.30 2,642.30 2,949.40 2,798.30
Source: JICA Study Team
c. Sectoral Distribution of GDP
Sectoral composition of GDP in Egypt is shown in Table 2.A.5. Obviously, the share of the primary sector is on a slow declining trend, while the secondary sector is gradually gaining the share. The share of the tertiary sector remains almost constant at about 50%.
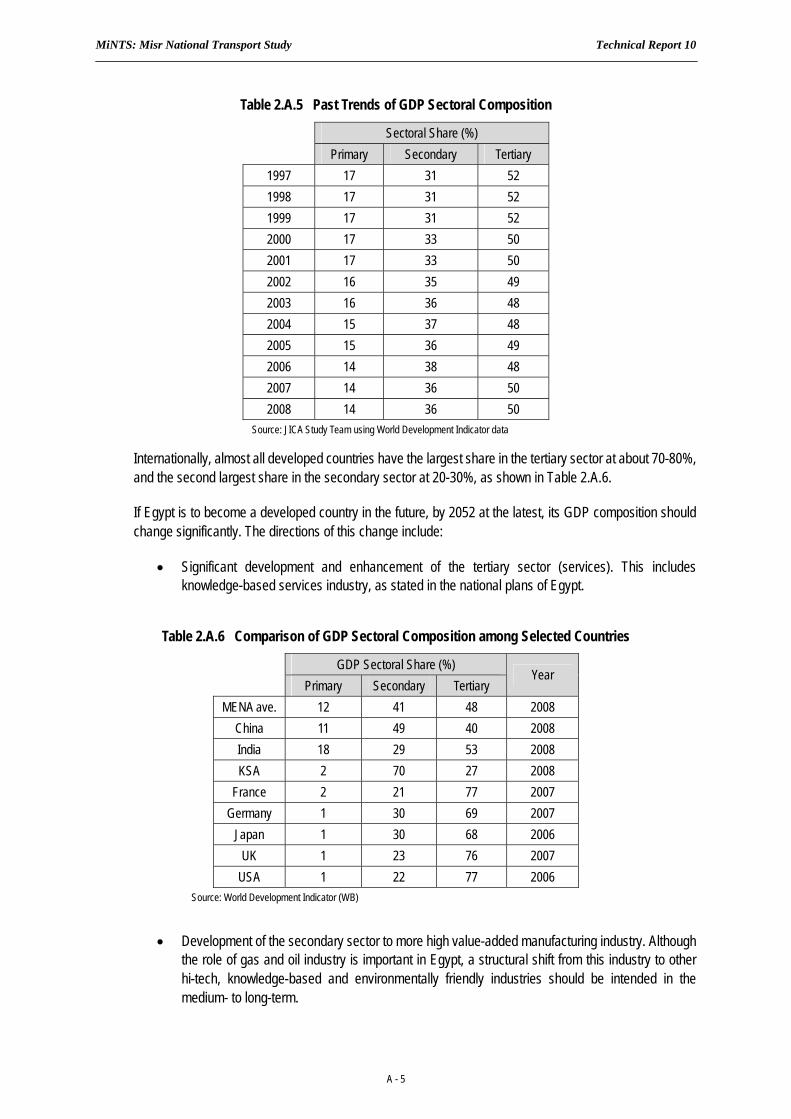
MiNTS: Misr National Transport Study Technical Report 10
A - 5
Table 2.A.5 Past Trends of GDP Sectoral Composition
Sectoral Share (%) Primary Secondary Tertiary
1997 17 31 52 1998 17 31 52 1999 17 31 52 2000 17 33 50 2001 17 33 50 2002 16 35 49 2003 16 36 48 2004 15 37 48 2005 15 36 49 2006 14 38 48 2007 14 36 50 2008 14 36 50
Source: JICA Study Team using World Development Indicator data
Internationally, almost all developed countries have the largest share in the tertiary sector at about 70-80%, and the second largest share in the secondary sector at 20-30%, as shown in Table 2.A.6.
If Egypt is to become a developed country in the future, by 2052 at the latest, its GDP composition should change significantly. The directions of this change include:
• Significant development and enhancement of the tertiary sector (services). This includes knowledge-based services industry, as stated in the national plans of Egypt.
Table 2.A.6 Comparison of GDP Sectoral Composition among Selected Countries
GDP Sectoral Share (%) Primary Secondary Tertiary
Year
MENA ave. 12 41 48 2008 China 11 49 40 2008 India 18 29 53 2008 KSA 2 70 27 2008
France 2 21 77 2007 Germany 1 30 69 2007
Japan 1 30 68 2006 UK 1 23 76 2007
USA 1 22 77 2006 Source: World Development Indicator (WB)
• Development of the secondary sector to more high value-added manufacturing industry. Although the role of gas and oil industry is important in Egypt, a structural shift from this industry to other hi-tech, knowledge-based and environmentally friendly industries should be intended in the medium- to long-term.
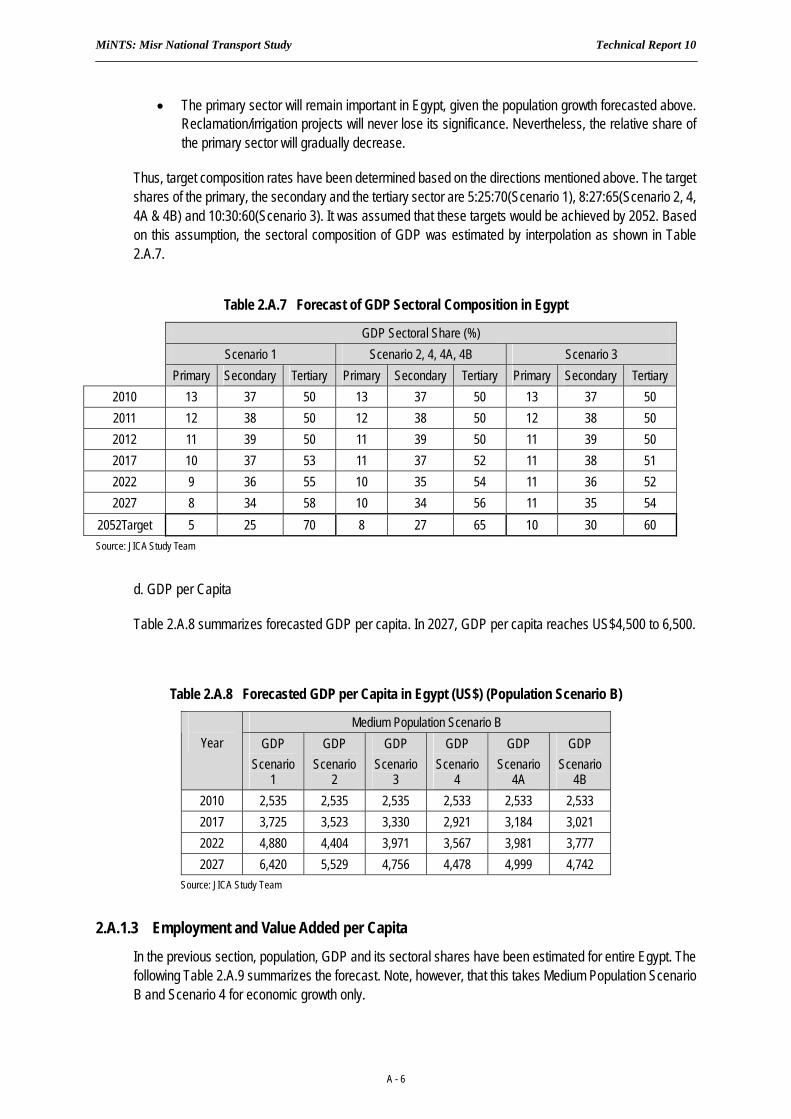
MiNTS: Misr National Transport Study Technical Report 10
A - 6
• The primary sector will remain important in Egypt, given the population growth forecasted above. Reclamation/irrigation projects will never lose its significance. Nevertheless, the relative share of the primary sector will gradually decrease.
Thus, target composition rates have been determined based on the directions mentioned above. The target shares of the primary, the secondary and the tertiary sector are 5:25:70(Scenario 1), 8:27:65(Scenario 2, 4, 4A & 4B) and 10:30:60(Scenario 3). It was assumed that these targets would be achieved by 2052. Based on this assumption, the sectoral composition of GDP was estimated by interpolation as shown in Table 2.A.7.
Table 2.A.7 Forecast of GDP Sectoral Composition in Egypt
GDP Sectoral Share (%) Scenario 1 Scenario 2, 4, 4A, 4B Scenario 3 Primary Secondary Tertiary Primary Secondary Tertiary Primary Secondary Tertiary
2010 13 37 50 13 37 50 13 37 50 2011 12 38 50 12 38 50 12 38 50 2012 11 39 50 11 39 50 11 39 50 2017 10 37 53 11 37 52 11 38 51 2022 9 36 55 10 35 54 11 36 52 2027 8 34 58 10 34 56 11 35 54
2052Target 5 25 70 8 27 65 10 30 60 Source: JICA Study Team
d. GDP per Capita
Table 2.A.8 summarizes forecasted GDP per capita. In 2027, GDP per capita reaches US$4,500 to 6,500.
Table 2.A.8 Forecasted GDP per Capita in Egypt (US$) (Population Scenario B)
Medium Population Scenario B Year GDP
Scenario 1
GDP Scenario
2
GDP Scenario
3
GDP Scenario
4
GDP Scenario
4A
GDP Scenario
4B 2010 2,535 2,535 2,535 2,533 2,533 2,533 2017 3,725 3,523 3,330 2,921 3,184 3,021 2022 4,880 4,404 3,971 3,567 3,981 3,777 2027 6,420 5,529 4,756 4,478 4,999 4,742
Source: JICA Study Team
2.A.1.3 Employment and Value Added per Capita
In the previous section, population, GDP and its sectoral shares have been estimated for entire Egypt. The following Table 2.A.9 summarizes the forecast. Note, however, that this takes Medium Population Scenario B and Scenario 4 for economic growth only.
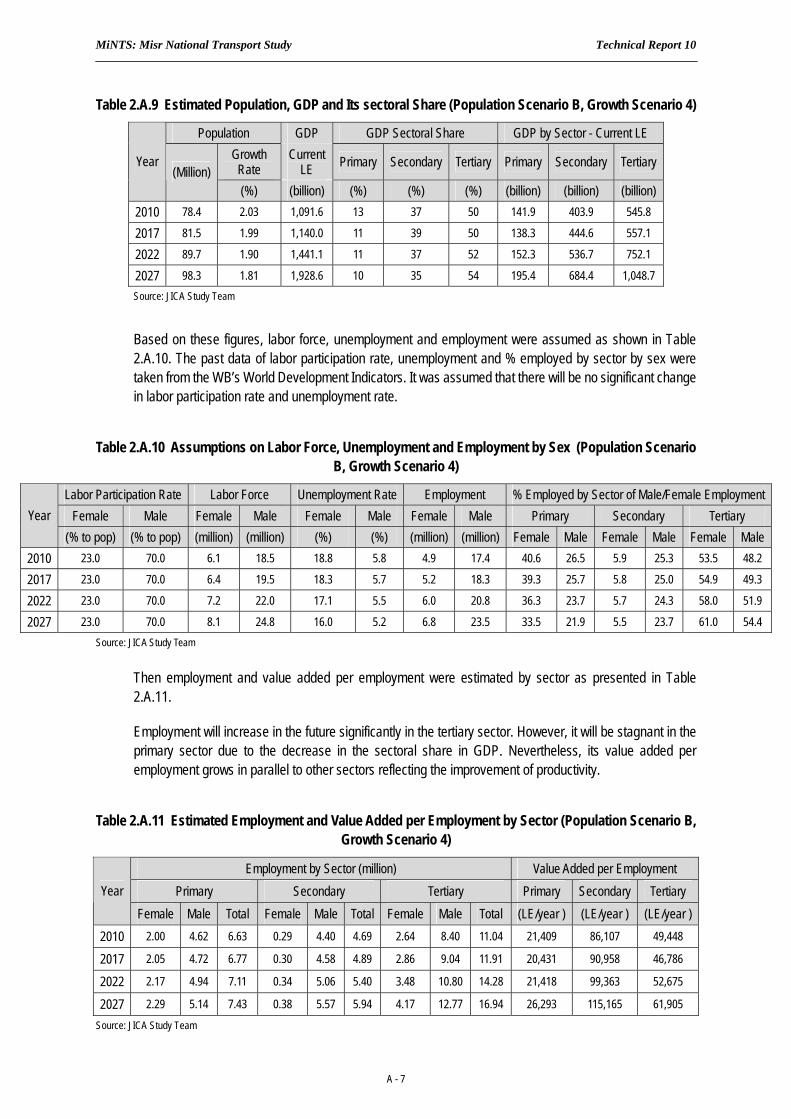
MiNTS: Misr National Transport Study Technical Report 10
A - 7
Table 2.A.9 Estimated Population, GDP and Its sectoral Share (Population Scenario B, Growth Scenario 4)
Population GDP GDP Sectoral Share GDP by Sector - Current LE Growth Rate
Current LE Primary Secondary Tertiary Primary Secondary Tertiary Year
(Million) (%) (billion) (%) (%) (%) (billion) (billion) (billion)
2010 78.4 2.03 1,091.6 13 37 50 141.9 403.9 545.8
2017 81.5 1.99 1,140.0 11 39 50 138.3 444.6 557.1
2022 89.7 1.90 1,441.1 11 37 52 152.3 536.7 752.1
2027 98.3 1.81 1,928.6 10 35 54 195.4 684.4 1,048.7 Source: JICA Study Team
Based on these figures, labor force, unemployment and employment were assumed as shown in Table 2.A.10. The past data of labor participation rate, unemployment and % employed by sector by sex were taken from the WB’s World Development Indicators. It was assumed that there will be no significant change in labor participation rate and unemployment rate.
Table 2.A.10 Assumptions on Labor Force, Unemployment and Employment by Sex (Population Scenario B, Growth Scenario 4)
Labor Participation Rate Labor Force Unemployment Rate Employment % Employed by Sector of Male/Female Employment Female Male Female Male Female Male Female Male Primary Secondary Tertiary Year
(% to pop) (% to pop) (million) (million) (%) (%) (million) (million) Female Male Female Male Female Male 2010 23.0 70.0 6.1 18.5 18.8 5.8 4.9 17.4 40.6 26.5 5.9 25.3 53.5 48.2
2017 23.0 70.0 6.4 19.5 18.3 5.7 5.2 18.3 39.3 25.7 5.8 25.0 54.9 49.3
2022 23.0 70.0 7.2 22.0 17.1 5.5 6.0 20.8 36.3 23.7 5.7 24.3 58.0 51.9
2027 23.0 70.0 8.1 24.8 16.0 5.2 6.8 23.5 33.5 21.9 5.5 23.7 61.0 54.4 Source: JICA Study Team
Then employment and value added per employment were estimated by sector as presented in Table 2.A.11.
Employment will increase in the future significantly in the tertiary sector. However, it will be stagnant in the primary sector due to the decrease in the sectoral share in GDP. Nevertheless, its value added per employment grows in parallel to other sectors reflecting the improvement of productivity.
Table 2.A.11 Estimated Employment and Value Added per Employment by Sector (Population Scenario B, Growth Scenario 4)
Employment by Sector (million) Value Added per Employment Primary Secondary Tertiary Primary Secondary Tertiary Year
Female Male Total Female Male Total Female Male Total (LE/year ) (LE/year ) (LE/year ) 2010 2.00 4.62 6.63 0.29 4.40 4.69 2.64 8.40 11.04 21,409 86,107 49,448
2017 2.05 4.72 6.77 0.30 4.58 4.89 2.86 9.04 11.91 20,431 90,958 46,786
2022 2.17 4.94 7.11 0.34 5.06 5.40 3.48 10.80 14.28 21,418 99,363 52,675
2027 2.29 5.14 7.43 0.38 5.57 5.94 4.17 12.77 16.94 26,293 115,165 61,905 Source: JICA Study Team
MiNTS: Misr National Transport Study Technical Report 10
A - 8
2.A.2. ZONAL LEVEL OF DETAIL
The breakdown of the national framework to the governorate/large zone and small zone level of detail is summarized for the Medium Population Scenario B and GDP Growth Scenario 4. Full numeric detail is available in underlying spreadsheet data. A background discussion of MiNTS zone hierarchy is contained in Section 1.4.
2.A.2.1 Governorate/Large Zone a. Population
In order to alleviate over-concentration of population and the resultant degradation of environment and quality of life in Cairo, new urban development is proposed across Egypt. The Egypt Vision 2052 states that, as a whole, an incremental population of 52 million are to scatter to: Red Sea (5 million), Suez Canal and North Sinai (7 million), Upper Egypt (3 million), North-west Upper Egypt (3 million), West Delta (4 million), North-west Coast (6 million), Greater Cairo (5 million), Alexandria Urban (4 million) and the rest of Egypt (15 million). That is, more than 70% of increased population should be accommodated in newly developed areas while about 30% be absorbed in existing urban areas.
To attain or at least to take into account this drastic policy target, all necessary infrastructure including water, electricity, transport, etc. should be developed in addition to housing facilities prior to actual movement of the people. In this study, this target has been moderated and the following assumptions were set:
1. 50% of increased population is absorbed in newly developed areas, while the remaining 50% is distributed to existing urban areas in proportion to the size of existing population.
2. Till 2017, “newly developed areas” means the area of “Reclamation by 2017”, and, till 2027, the area of “Reclamation by 2050” shown in the Egypt Vision 2050 (see Figure 3.A.2).
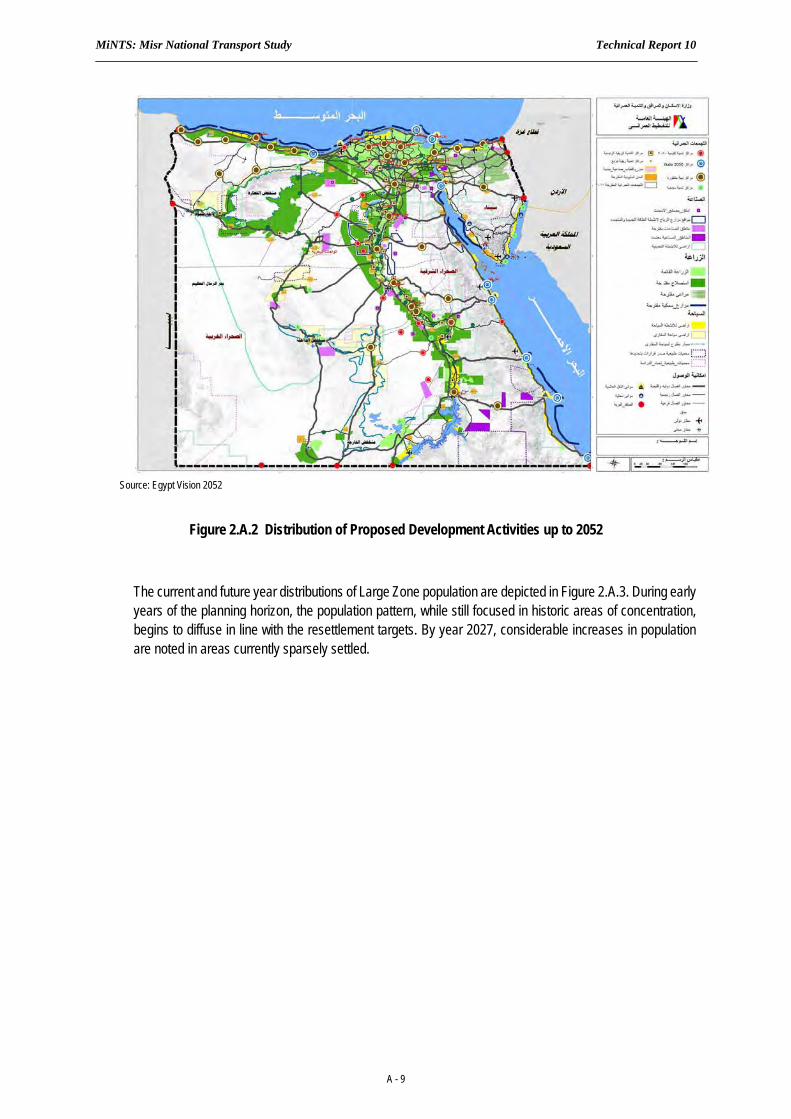
MiNTS: Misr National Transport Study Technical Report 10
A - 9
Source: Egypt Vision 2052
Figure 2.A.2 Distribution of Proposed Development Activities up to 2052
The current and future year distributions of Large Zone population are depicted in Figure 2.A.3. During early years of the planning horizon, the population pattern, while still focused in historic areas of concentration, begins to diffuse in line with the resettlement targets. By year 2027, considerable increases in population are noted in areas currently sparsely settled.
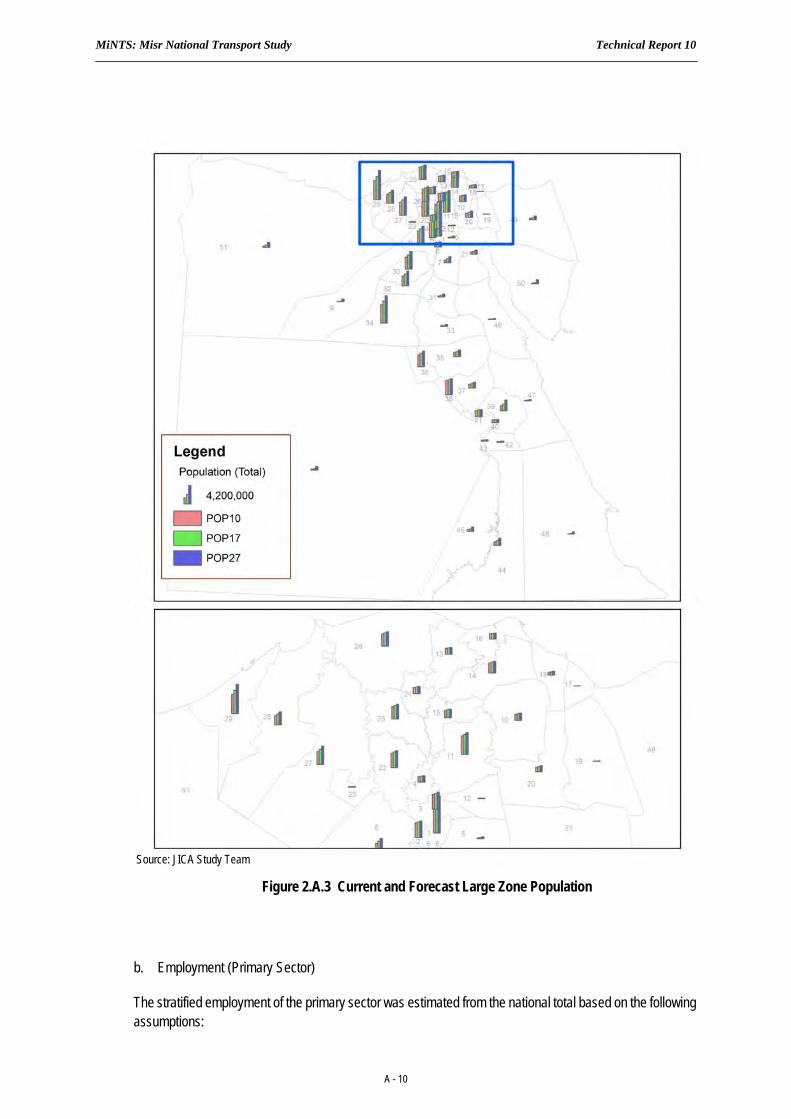
MiNTS: Misr National Transport Study Technical Report 10
A - 10
b. Employment (Primary Sector)
The stratified employment of the primary sector was estimated from the national total based on the following assumptions:
Source: JICA Study Team
Figure 2.A.3 Current and Forecast Large Zone Population
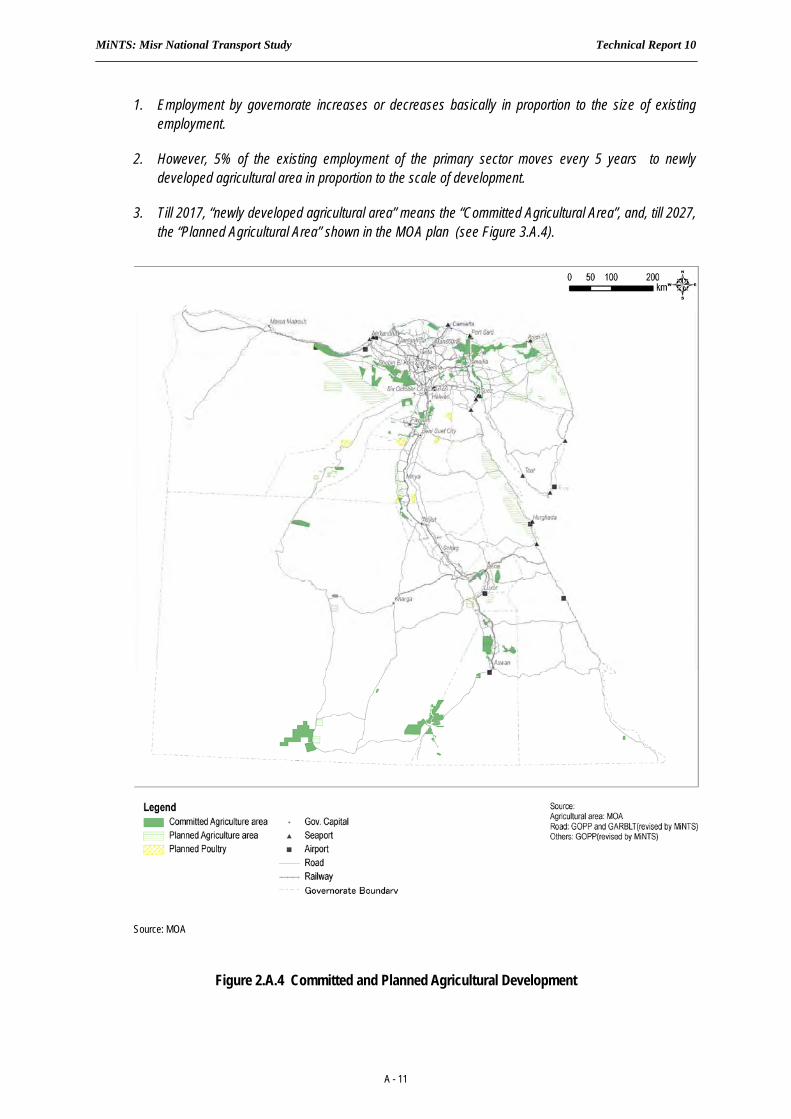
MiNTS: Misr National Transport Study Technical Report 10
A - 11
1. Employment by governorate increases or decreases basically in proportion to the size of existing employment.
2. However, 5% of the existing employment of the primary sector moves every 5 years to newly developed agricultural area in proportion to the scale of development.
3. Till 2017, “newly developed agricultural area” means the “Committed Agricultural Area”, and, till 2027, the “Planned Agricultural Area” shown in the MOA plan (see Figure 3.A.4).
Source: MOA
Figure 2.A.4 Committed and Planned Agricultural Development
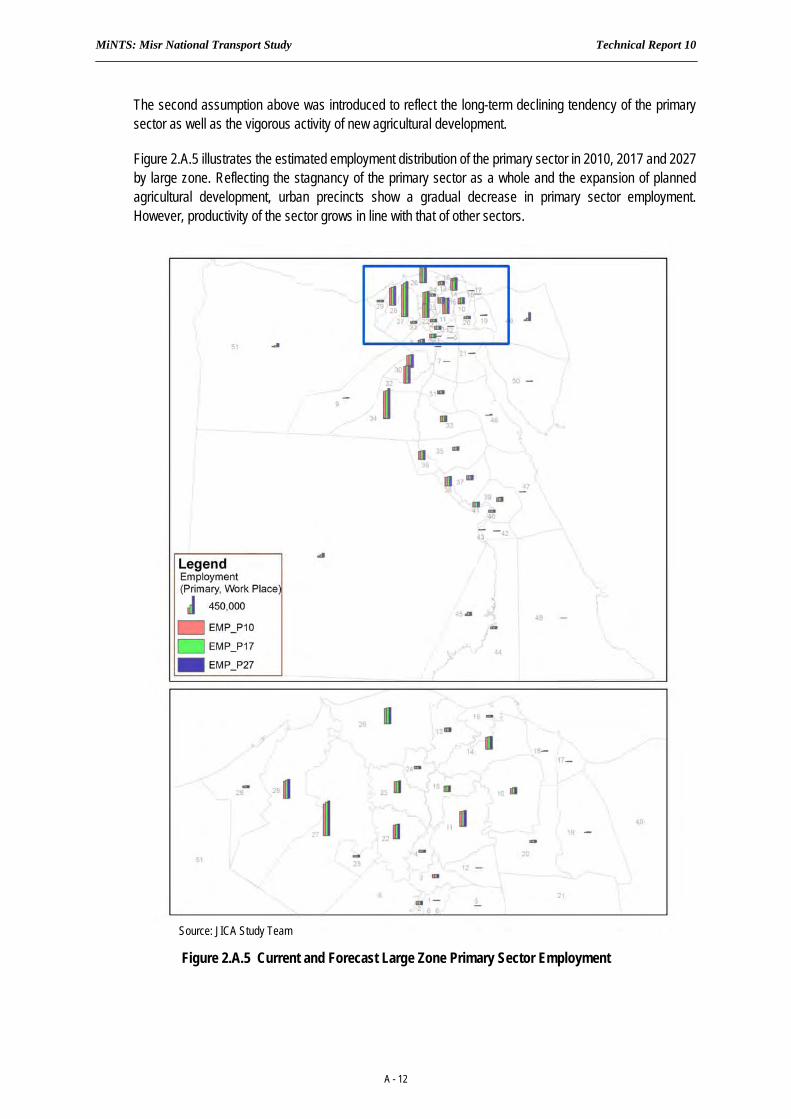
MiNTS: Misr National Transport Study Technical Report 10
A - 12
The second assumption above was introduced to reflect the long-term declining tendency of the primary sector as well as the vigorous activity of new agricultural development.
Figure 2.A.5 illustrates the estimated employment distribution of the primary sector in 2010, 2017 and 2027 by large zone. Reflecting the stagnancy of the primary sector as a whole and the expansion of planned agricultural development, urban precincts show a gradual decrease in primary sector employment. However, productivity of the sector grows in line with that of other sectors.
Source: JICA Study Team
Figure 2.A.5 Current and Forecast Large Zone Primary Sector Employment
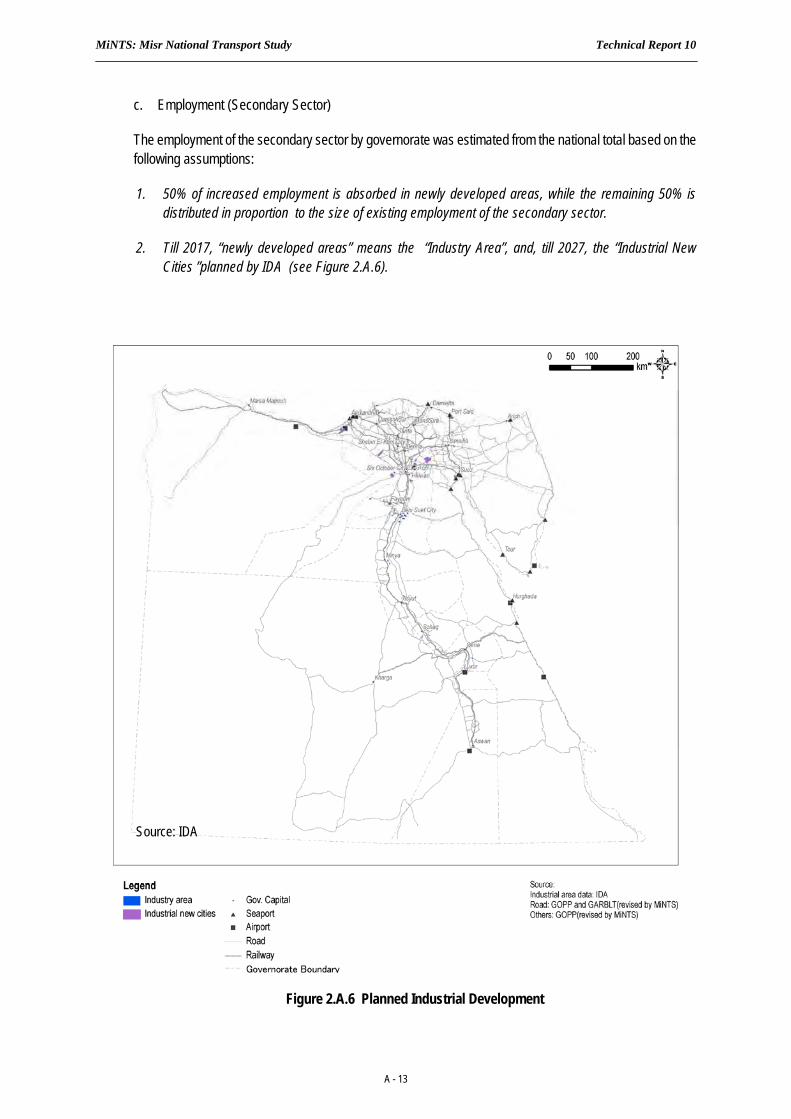
MiNTS: Misr National Transport Study Technical Report 10
A - 13
c. Employment (Secondary Sector)
The employment of the secondary sector by governorate was estimated from the national total based on the following assumptions:
1. 50% of increased employment is absorbed in newly developed areas, while the remaining 50% is distributed in proportion to the size of existing employment of the secondary sector.
2. Till 2017, “newly developed areas” means the “Industry Area”, and, till 2027, the “Industrial New Cities ”planned by IDA (see Figure 2.A.6).
Figure 2.A.6 Planned Industrial Development
Source: IDA
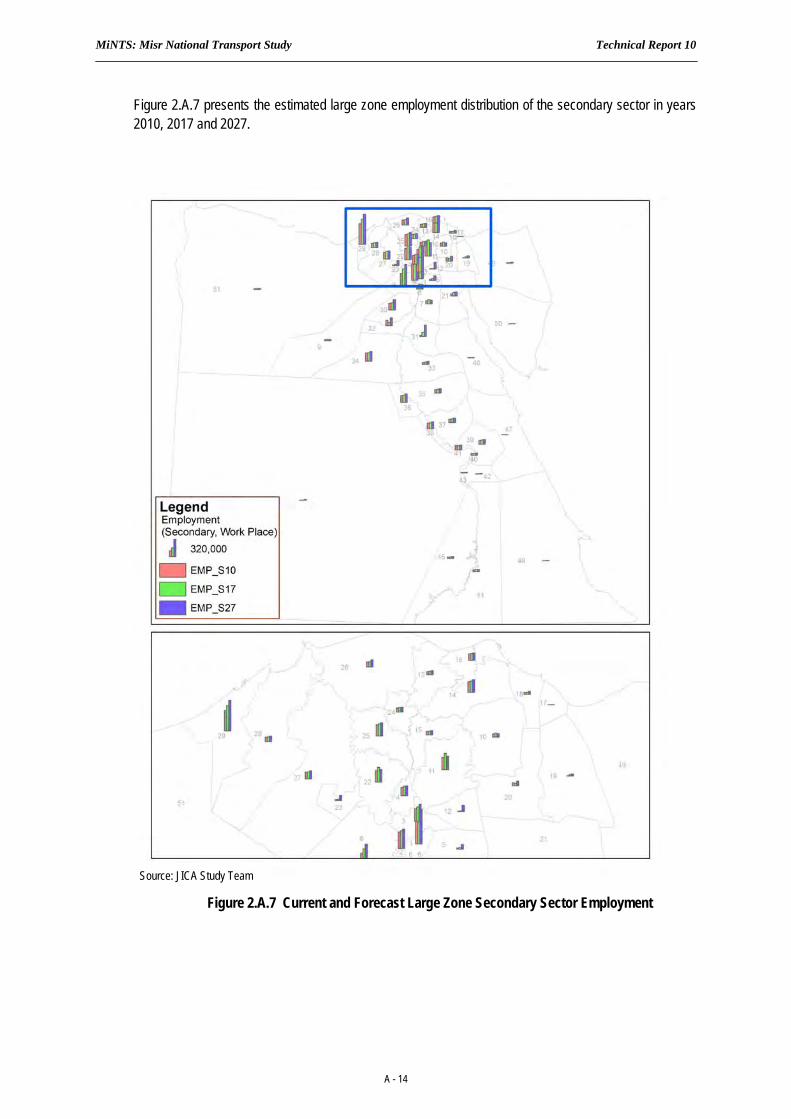
MiNTS: Misr National Transport Study Technical Report 10
A - 14
Figure 2.A.7 presents the estimated large zone employment distribution of the secondary sector in years 2010, 2017 and 2027.
Source: JICA Study Team
Figure 2.A.7 Current and Forecast Large Zone Secondary Sector Employment
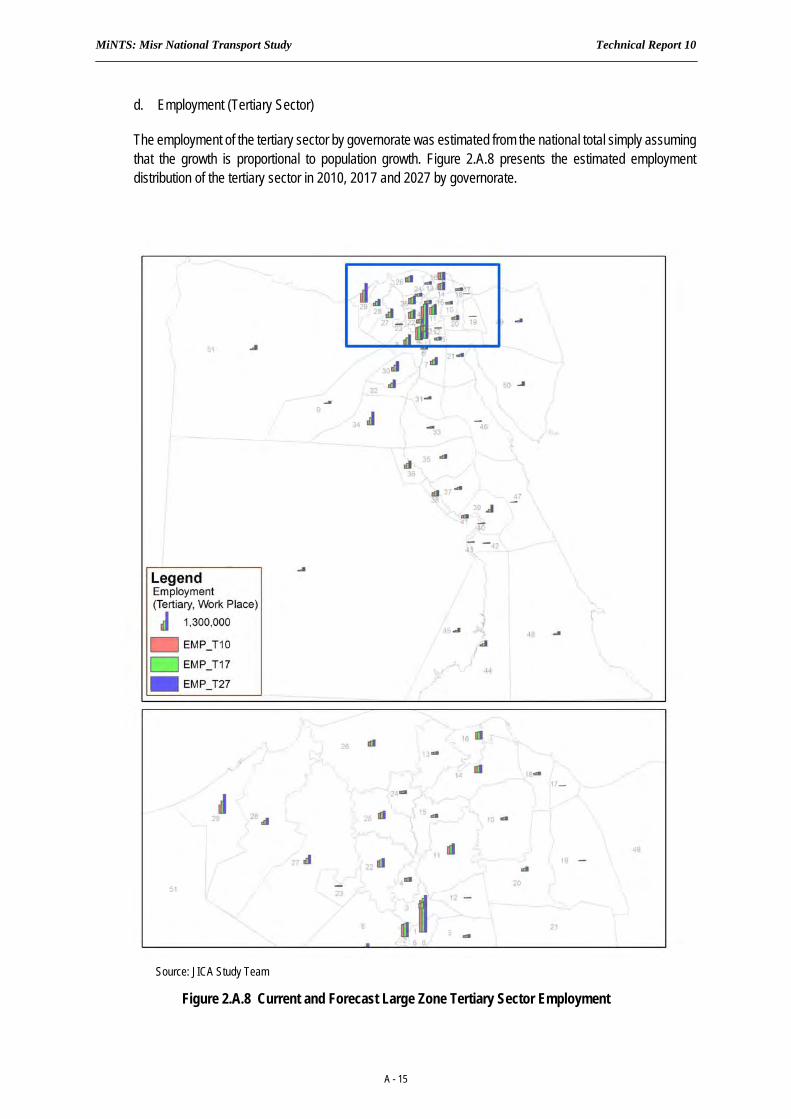
MiNTS: Misr National Transport Study Technical Report 10
A - 15
d. Employment (Tertiary Sector)
The employment of the tertiary sector by governorate was estimated from the national total simply assuming that the growth is proportional to population growth. Figure 2.A.8 presents the estimated employment distribution of the tertiary sector in 2010, 2017 and 2027 by governorate.
Source: JICA Study Team
Figure 2.A.8 Current and Forecast Large Zone Tertiary Sector Employment
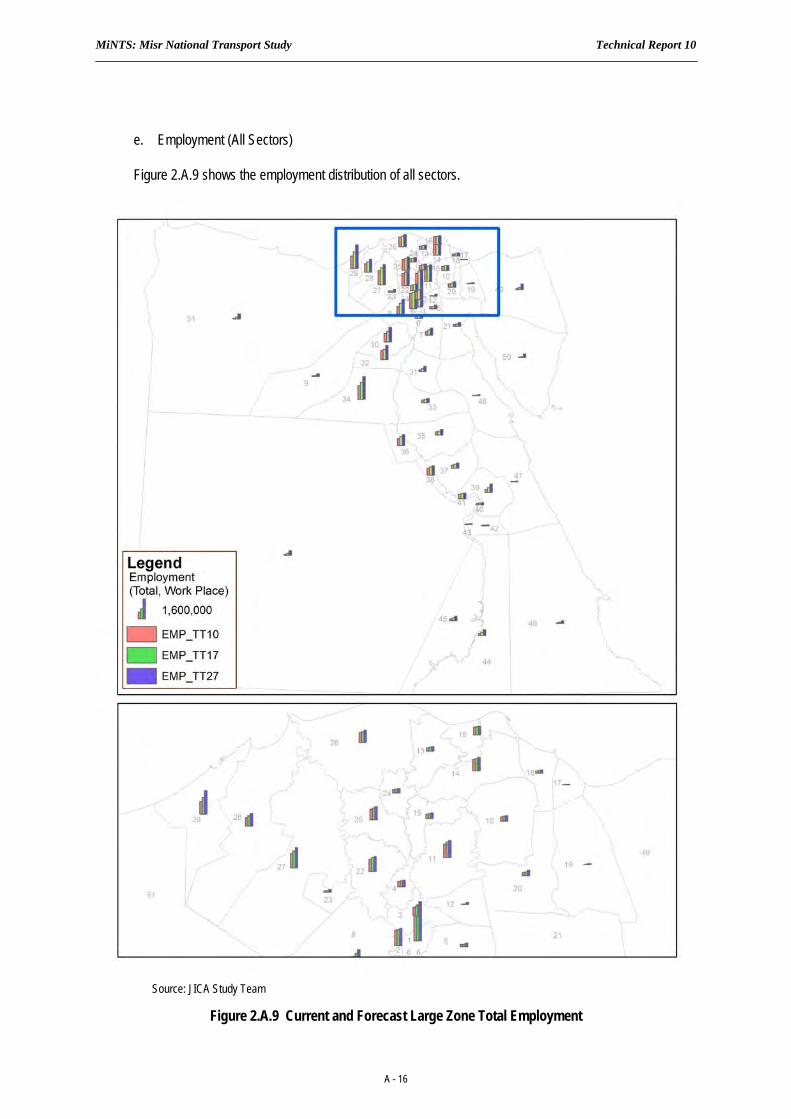
MiNTS: Misr National Transport Study Technical Report 10
A - 16
e. Employment (All Sectors)
Figure 2.A.9 shows the employment distribution of all sectors.
Source: JICA Study Team
Figure 2.A.9 Current and Forecast Large Zone Total Employment
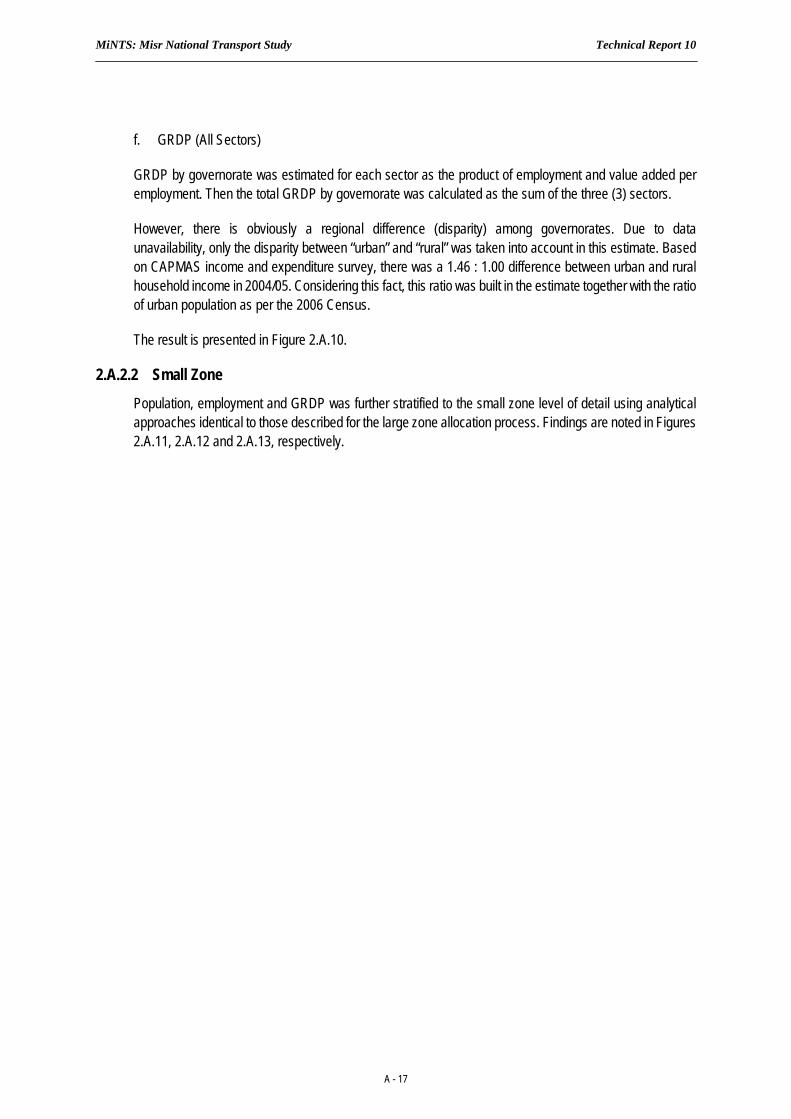
MiNTS: Misr National Transport Study Technical Report 10
A - 17
f. GRDP (All Sectors)
GRDP by governorate was estimated for each sector as the product of employment and value added per employment. Then the total GRDP by governorate was calculated as the sum of the three (3) sectors.
However, there is obviously a regional difference (disparity) among governorates. Due to data unavailability, only the disparity between “urban” and “rural” was taken into account in this estimate. Based on CAPMAS income and expenditure survey, there was a 1.46 : 1.00 difference between urban and rural household income in 2004/05. Considering this fact, this ratio was built in the estimate together with the ratio of urban population as per the 2006 Census.
The result is presented in Figure 2.A.10.
2.A.2.2 Small Zone
Population, employment and GRDP was further stratified to the small zone level of detail using analytical approaches identical to those described for the large zone allocation process. Findings are noted in Figures 2.A.11, 2.A.12 and 2.A.13, respectively.
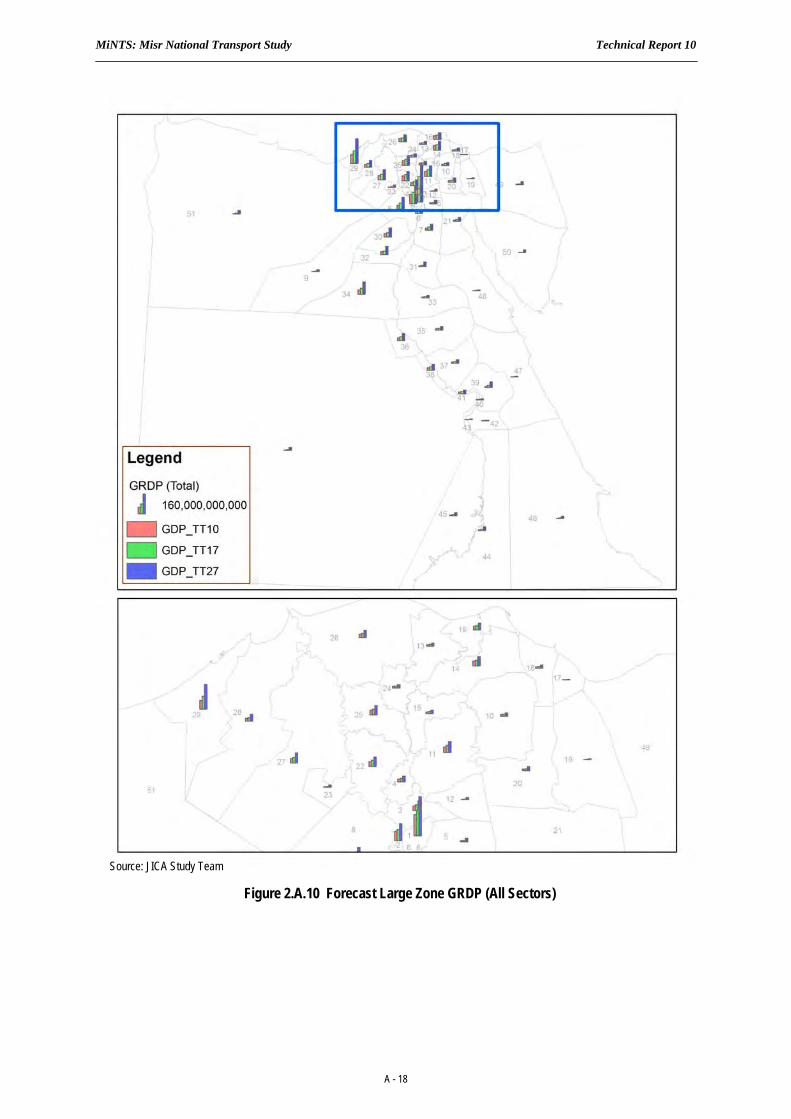
MiNTS: Misr National Transport Study Technical Report 10
A - 18
Source: JICA Study Team
Figure 2.A.10 Forecast Large Zone GRDP (All Sectors)
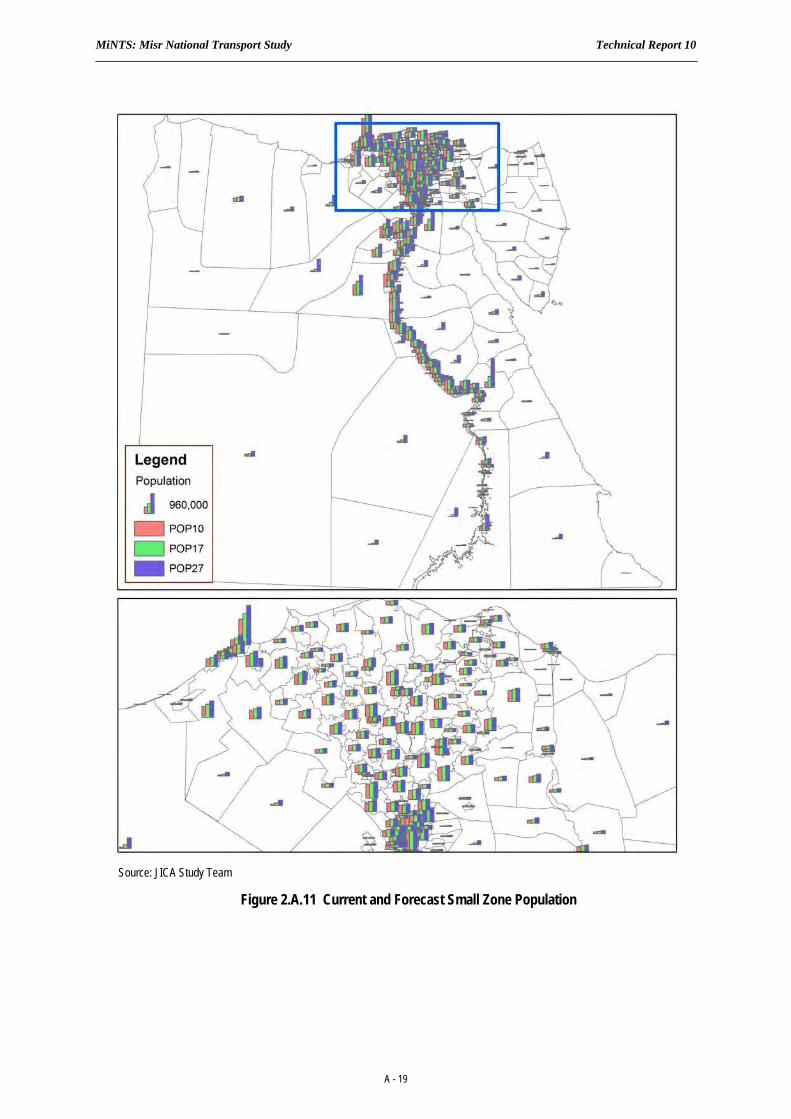
MiNTS: Misr National Transport Study Technical Report 10
A - 19
Source: JICA Study Team
Figure 2.A.11 Current and Forecast Small Zone Population
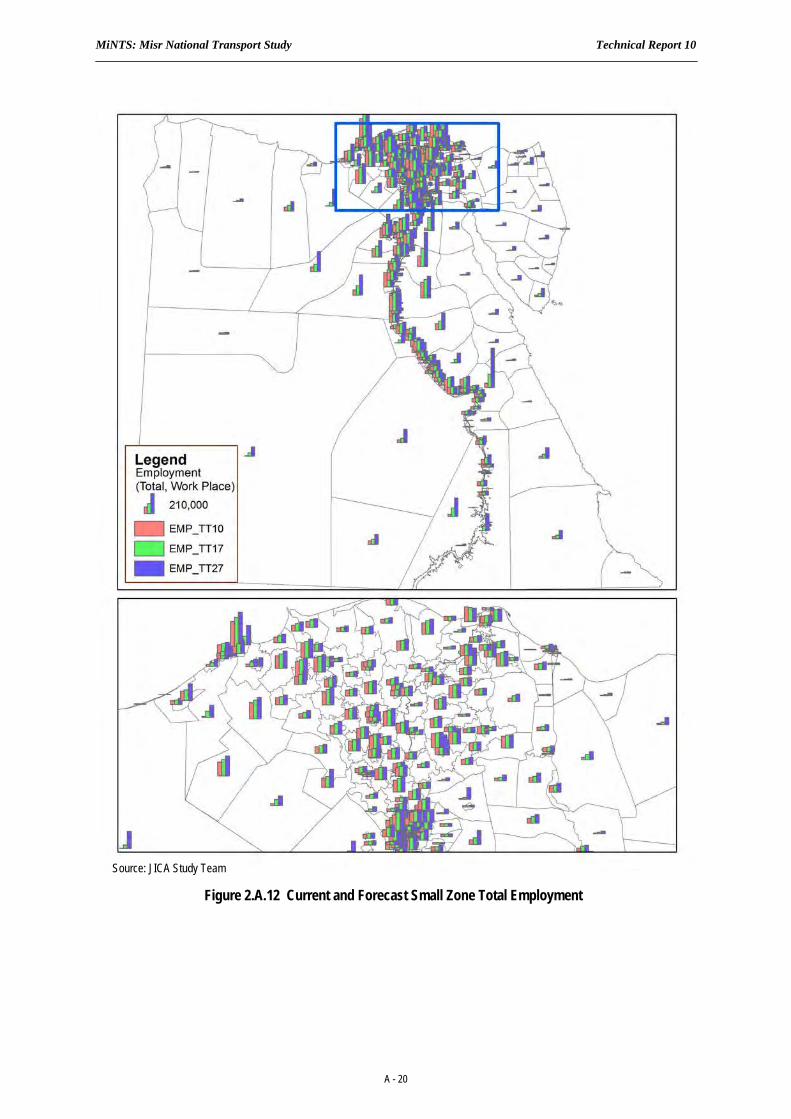
MiNTS: Misr National Transport Study Technical Report 10
A - 20
Source: JICA Study Team
Figure 2.A.12 Current and Forecast Small Zone Total Employment

MiNTS: Misr National Transport Study Technical Report 10
A - 21
Source: JICA Study Team
Figure 2.A.13 Forecast Small Zone GRDP (All Sectors)

MiNTS: Misr National Transport Study Technical Report 10
A-22
APPENDIX 2-B: MEDITERRANEAN MARITIME TRADE STRUCTURE
MiNTS Technical Report 4 provides considerable detail regarding the maritime sector. Furthermore, an overview was presented of regional international entities having an impact on Egyptian external trade. The purpose of the current document is not to obviate and/or duplicate these considerable previous data; indeed, the interested reader is urged to consult relevant chapters in Technical Report 4 for additional information.
2-B.1 FACILITIES OVERVIEW
The maritime industry in the Mediterranean is representative of worldwide practices where the main ports and terminals are dominated by major shipping companies, supported by the local / regional shipping industry made up of smaller operators. Services by the latter focus on inter-regional and specialized traffic.
The restructuring of maritime traffic in the Mediterranean region since the nineties created a dual maritime traffic/port system where the biggest shipping companies incorporated few Mediterranean hub ports (such as Gioia Tauro, Italy) or specialized transhipment ports (such as Algeciras, Spain) into their oceanic routes. Concurrently, many existing commercial ports (such as the large ports of Genoa, Italy; Barcelona, Spain, or Marseille, France) were modernized to capture the more traditional direct services systems and the new regional network systems.
The Egyptian ports in the Mediterranean basin are included in the list of hub ports, as can be observed in Figure 2.B.1. The role of Egyptian ports vis-à-vis Mediterranean services is central, considering that economics and capacity combined force the major liner services to call upon increasingly fewer key hub ports in the Mediterranean, with Gioia Tauro and Masaxllok (Malta) remaining the prime locations.
Hub ports are selected by carriers in consideration of a geographical advantage, service quality, and total costs for feeder networks. In the Eastern Mediterranean area, Port Said, Gioia Tauro and Marsaxlokk are
Source: lga D. Foschi: The maritime container transport structure in the Mediterranean and Italy University of Piza Discussion Papers, Nr 24, 2003
Figure 2.B.1 Main Hub Ports in the Mediterranean Basin
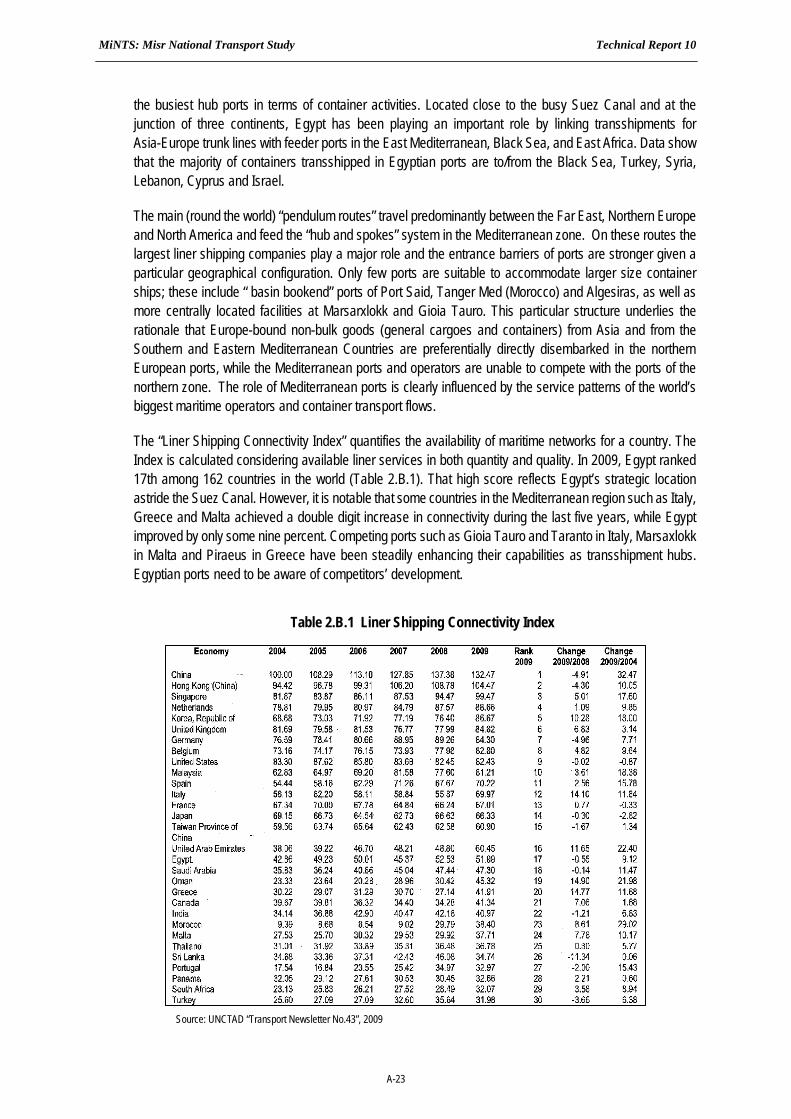
MiNTS: Misr National Transport Study Technical Report 10
A-23
the busiest hub ports in terms of container activities. Located close to the busy Suez Canal and at the junction of three continents, Egypt has been playing an important role by linking transshipments for Asia-Europe trunk lines with feeder ports in the East Mediterranean, Black Sea, and East Africa. Data show that the majority of containers transshipped in Egyptian ports are to/from the Black Sea, Turkey, Syria, Lebanon, Cyprus and Israel.
The main (round the world) “pendulum routes” travel predominantly between the Far East, Northern Europe and North America and feed the “hub and spokes” system in the Mediterranean zone. On these routes the largest liner shipping companies play a major role and the entrance barriers of ports are stronger given a particular geographical configuration. Only few ports are suitable to accommodate larger size container ships; these include “ basin bookend” ports of Port Said, Tanger Med (Morocco) and Algesiras, as well as more centrally located facilities at Marsarxlokk and Gioia Tauro. This particular structure underlies the rationale that Europe-bound non-bulk goods (general cargoes and containers) from Asia and from the Southern and Eastern Mediterranean Countries are preferentially directly disembarked in the northern European ports, while the Mediterranean ports and operators are unable to compete with the ports of the northern zone. The role of Mediterranean ports is clearly influenced by the service patterns of the world’s biggest maritime operators and container transport flows.
The “Liner Shipping Connectivity Index” quantifies the availability of maritime networks for a country. The Index is calculated considering available liner services in both quantity and quality. In 2009, Egypt ranked 17th among 162 countries in the world (Table 2.B.1). That high score reflects Egypt’s strategic location astride the Suez Canal. However, it is notable that some countries in the Mediterranean region such as Italy, Greece and Malta achieved a double digit increase in connectivity during the last five years, while Egypt improved by only some nine percent. Competing ports such as Gioia Tauro and Taranto in Italy, Marsaxlokk in Malta and Piraeus in Greece have been steadily enhancing their capabilities as transshipment hubs. Egyptian ports need to be aware of competitors’ development.
Table 2.B.1 Liner Shipping Connectivity Index
Source: UNCTAD “Transport Newsletter No.43”, 2009
MiNTS: Misr National Transport Study Technical Report 10
A-24
The number of service candidate ports is decreasing due to the economics of port calls in the Mediterranean. These tend to be extremely complex and based on highly competitive tariff setting. In terms of economics of port calls, for example, the port of Gioia Tauro is at present a leader in the Mediterranean but might lose its dominance to Malta due to competitive differences in terms of economics. Gioia Tauro is centrally situated and offers a draught of about 15 meters, allowing for the mooring of ships the size of the Sovereign Maersk (8,400 TEU), that require a draught of 14 meters. But the port deviates 66 nautical miles from the main route connecting Gibraltar with the Suez Canal, causing a rise in navigation costs as compared to Malta. Because of these two facts, there will also be difficulties for Gioia Tauro to accommodate the mega ships of the future like Suezmax (11,989 TEU) which need a little over 17 meters draught and the largest ships imagined so far, the Malacca–max (18,154 TEU) which need 21 meters draught.
Another example is Algeciras, for a long time the first transhipment port in the Mediterranean but now rapidly losing attractiveness due to geographic position and capacity limitations. The port’s characteristics are decided by Maersk, its owner for transhipment, and are oriented to suite the long routes along Africa and the European Atlantic rather than Asian trade which is rapidly becoming dominant in the Mediterranean basin. Its competitive strength, although apparently high, is limited compared to many other Mediterranean ports because its location is too decentralized to be an efficient hub port and has insufficient depth to accommodate the container vessels continuously growing in size and now regularly surpassing 12,000 TEU. Massive investments are planned to manage mega ship containers and with the realization of existing plans for the creation of an 18 meters deep quay, ships reaching the size of Sovereign Maersk and of the Suezmax will be able to moor while the Malacca–max is so far excluded. It seems that these investments are needed to maintain its position as EU-Africa hub rather than an effort to enter the Asian trade. In that respect, the rapid rise of Tanger-Med, a direct competitor for Algeciras and its trade, might even put question marks on the success of this objective.
2-B.2 STRUCTURE OF SERVICES
The world containership fleet in January 2010 has over 4,700 vessels with total capacity of about 13 million TEUs. The top 20 container transport companies are listed in Table 2.B.2.
There is naturally maritime trade between all Mediterranean countries and the rest of the world, but traffic is in particular shaped by trade that takes place between the EU, Asia and the Middle East i.e. maritime traffic that transits via the Mediterranean Sea. This traffic essentially consists of ‘non-bulk’ transported in containers, for which the rate of containerization is estimated greater than 80 and even 90% of total traffic. Hence the major importance of the long haul liner services with Asia passing via the Mediterranean basin.
Trade between South Mediterranean Countries and the rest of the world apart from Europe consisted (before the 2008 economic crisis) of approximately 280 million tonnes, 200 million tonnes bulk cargo including oil and only some 80 million tonnes transport of ‘non-bulk’ most often containerized products. One third of this traffic involved Turkey’s trade with CIS, the Middle East, and North America. Trade by South Mediterranean Countries with Asia, consisting of non-bulk products, was around 12 million tonnes, a limited volume and nearly 40% consisting of imports by Turkey and Egypt1.
1 Christian Reynaud “The Components of Maritime Transport in the Mediterranean”; in MED 2009 Panorama, Economy and Territory | Territory and Transport;
Nouveaux Espaces de Transport en Europe Applications de Recherche (NESTEAR), Paris.

MiNTS: Misr National Transport Study Technical Report 10
A-25
Table 2.B.2 Top Twenty Maritime Transport Companies
Rank Total
Operators TEU Ships
1 APM-Maersk 2,052,270 540 2 MSC 1,498,296 390 3 CMA CGM Group 1,034,255 356 4 Evergreen Line 557,444 150 5 APL 543,609 137 6 Hapag-Lloyd 463,457 112 7 COSCO Container L. 453,876 135 8 CSCL 450,337 124 9 Hanjin Shipping 434,852 98 10 NYK 409,137 107 11 CSAV Group 343,776 98 12 K Line 342,299 90 13 OOCL 340,439 73 14 MOL 339,673 90 15 Yang Ming Line 312,962 77 16 Hamburg Süd Group 309,570 103 17 Zim 305,538 94 18 Hyundai M.M. 274,529 53 19 UASC 196,237 49 20 PIL (Pacific Int. Line) 193,965 110
Source: JICA Study Team from AXS Alphaliner year 2010 data
Traffic passing the Mediterranean basin can be divided into three categories: Transit traffic, (south) European countries traffic and traffic between Mediterranean countries, concentrated in particular as was demonstrated in previous chapter, in the long haul liner services focusing containerized traffic (Figure 2.B.2). Traffic in the south Mediterranean region is dominated jointly by Turkish trade and the long-haul liner services servicing in particular Europe. Much of this traffic passes through the Suez Channel and represents therewith an important contribution to Egyptian GDP although this traffic only rarely transits via the Egyptian ports.
But Egypt is the second largest economic force in the region and therefore represents a notable share in total maritime traffic to service the import and export needs of the country’s economy.

MiNTS: Misr National Transport Study Technical Report 10
A-26
When looking at the limited number of round the world liner services, the number of calls in the Mediterranean basin remains limited to two or three, principally the ports of Gioia Tauro, Masaxllok, and Algeciras. Although seldom part of a major liner service, the Egyptian ports Damietta, Port Said and Alexandria remain ports of call for Mediterranean oriented maritime services (Figure 2.B.3).
Maersk North America -
Middle East and Indian
Subcontinent (MECL service)
APL MED-Service
CMA CGM East MED service
Source: Christian Reynaud “The Components of Maritime Transport in the Mediterranean”; in MED 2009 Panorama
Figure 2.B.2 Mediterranean Basin Maritime Traffic Patterns
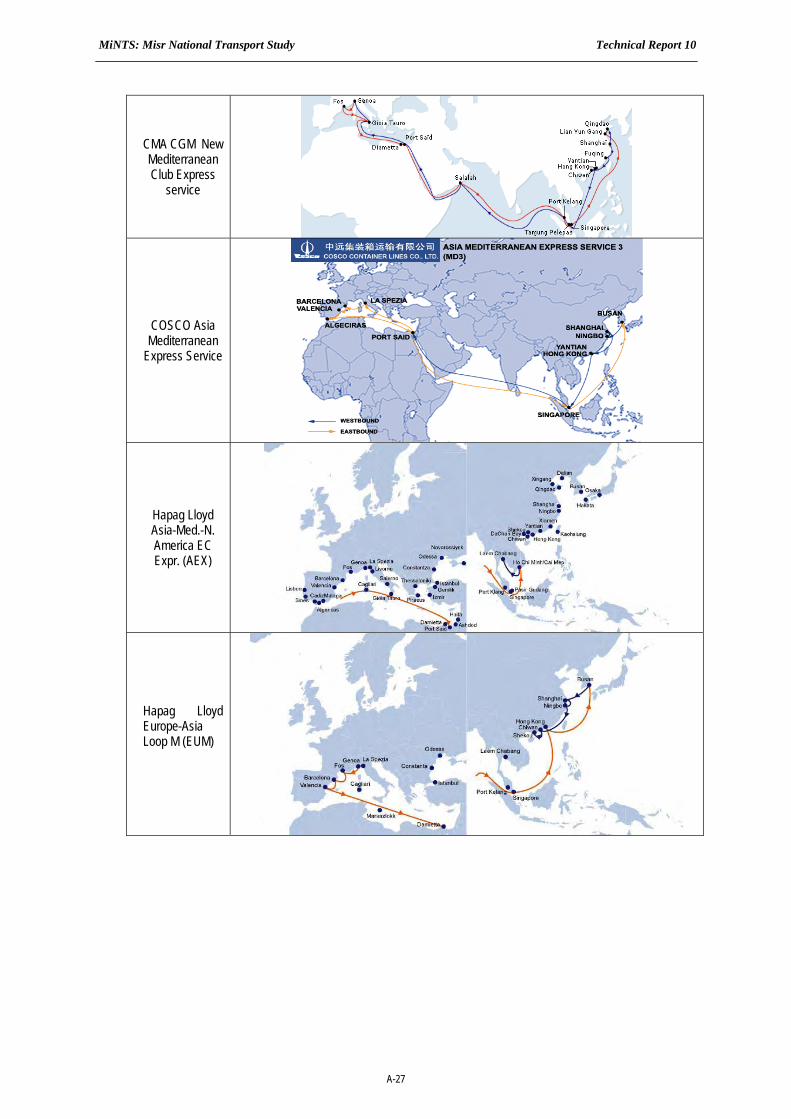
MiNTS: Misr National Transport Study Technical Report 10
A-27
CMA CGM New Mediterranean Club Express
service
COSCO Asia Mediterranean
Express Service
Hapag Lloyd Asia-Med.-N. America EC Expr. (AEX)
Hapag Lloyd Europe-Asia Loop M (EUM)
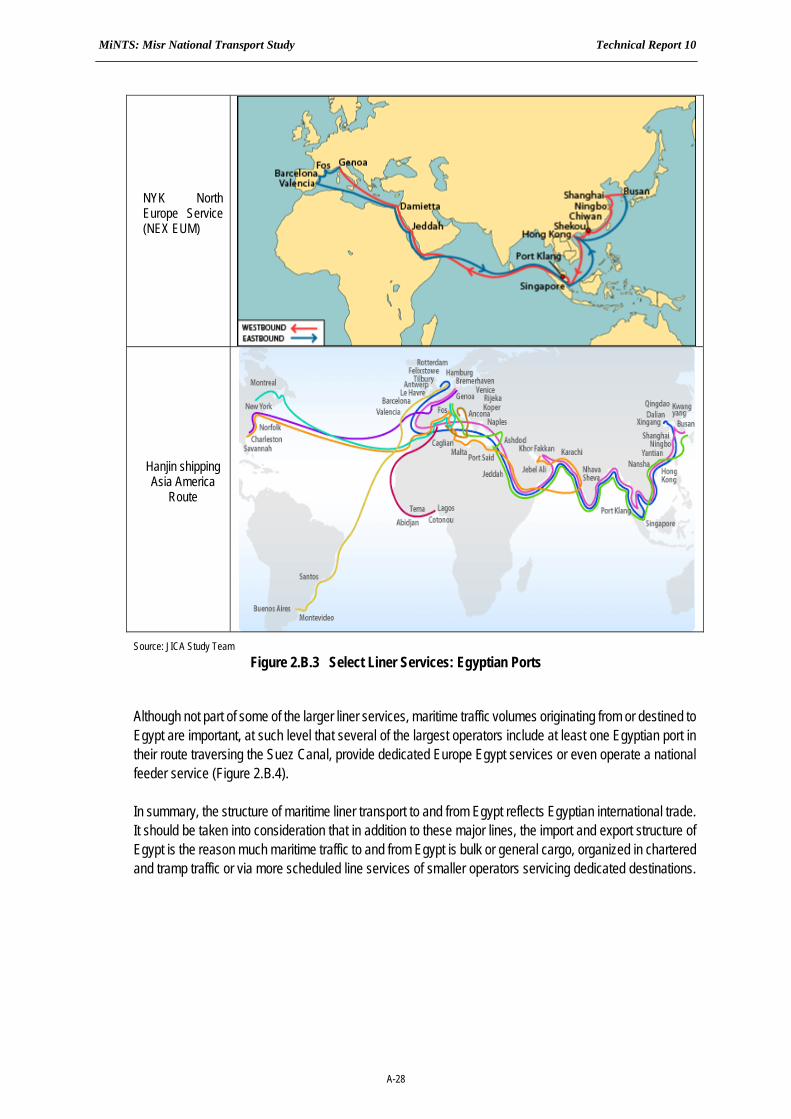
MiNTS: Misr National Transport Study Technical Report 10
A-28
NYK North Europe Service (NEX EUM)
Hanjin shipping Asia America
Route
Source: JICA Study Team
Figure 2.B.3 Select Liner Services: Egyptian Ports
Although not part of some of the larger liner services, maritime traffic volumes originating from or destined to Egypt are important, at such level that several of the largest operators include at least one Egyptian port in their route traversing the Suez Canal, provide dedicated Europe Egypt services or even operate a national feeder service (Figure 2.B.4). In summary, the structure of maritime liner transport to and from Egypt reflects Egyptian international trade. It should be taken into consideration that in addition to these major lines, the import and export structure of Egypt is the reason much maritime traffic to and from Egypt is bulk or general cargo, organized in chartered and tramp traffic or via more scheduled line services of smaller operators servicing dedicated destinations.
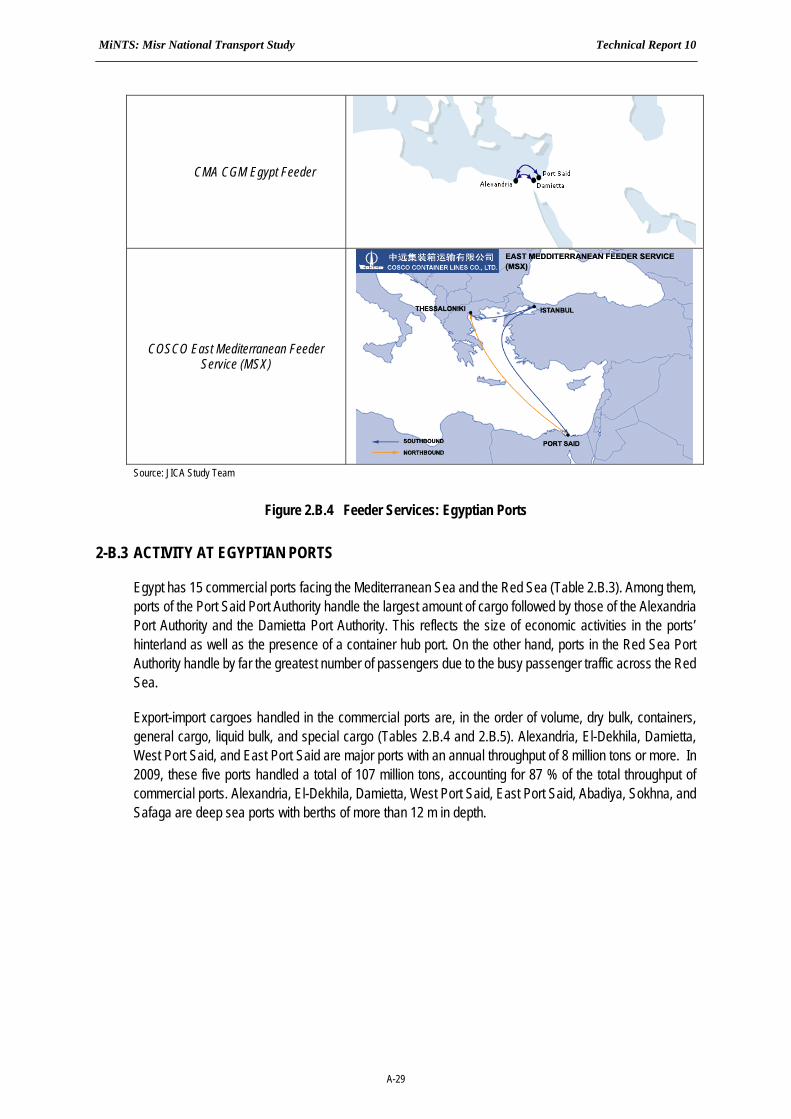
MiNTS: Misr National Transport Study Technical Report 10
A-29
CMA CGM Egypt Feeder
COSCO East Mediterranean Feeder Service (MSX)
Source: JICA Study Team
Figure 2.B.4 Feeder Services: Egyptian Ports
2-B.3 ACTIVITY AT EGYPTIAN PORTS
Egypt has 15 commercial ports facing the Mediterranean Sea and the Red Sea (Table 2.B.3). Among them, ports of the Port Said Port Authority handle the largest amount of cargo followed by those of the Alexandria Port Authority and the Damietta Port Authority. This reflects the size of economic activities in the ports’ hinterland as well as the presence of a container hub port. On the other hand, ports in the Red Sea Port Authority handle by far the greatest number of passengers due to the busy passenger traffic across the Red Sea.
Export-import cargoes handled in the commercial ports are, in the order of volume, dry bulk, containers, general cargo, liquid bulk, and special cargo (Tables 2.B.4 and 2.B.5). Alexandria, El-Dekhila, Damietta, West Port Said, and East Port Said are major ports with an annual throughput of 8 million tons or more. In 2009, these five ports handled a total of 107 million tons, accounting for 87 % of the total throughput of commercial ports. Alexandria, El-Dekhila, Damietta, West Port Said, East Port Said, Abadiya, Sokhna, and Safaga are deep sea ports with berths of more than 12 m in depth.
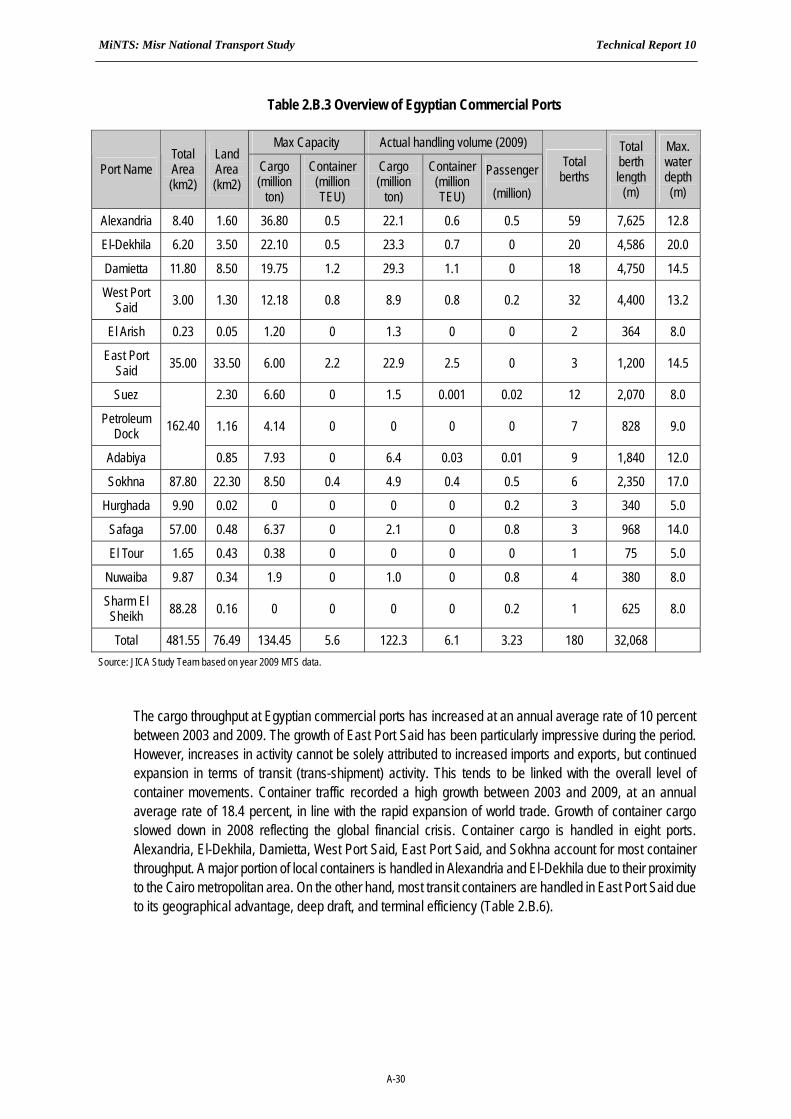
MiNTS: Misr National Transport Study Technical Report 10
A-30
Table 2.B.3 Overview of Egyptian Commercial Ports
Max Capacity Actual handling volume (2009)
Port Name Total Area (km2)
Land Area (km2)
Cargo (million
ton)
Container (million TEU)
Cargo (million
ton)
Container (million TEU)
Passenger
(million)
Total berths
Total berth length
(m)
Max. water depth (m)
Alexandria 8.40 1.60 36.80 0.5 22.1 0.6 0.5 59 7,625 12.8
El-Dekhila 6.20 3.50 22.10 0.5 23.3 0.7 0 20 4,586 20.0
Damietta 11.80 8.50 19.75 1.2 29.3 1.1 0 18 4,750 14.5
West Port Said 3.00 1.30 12.18 0.8 8.9 0.8 0.2 32 4,400 13.2
El Arish 0.23 0.05 1.20 0 1.3 0 0 2 364 8.0
East Port Said 35.00 33.50 6.00 2.2 22.9 2.5 0 3 1,200 14.5
Suez 2.30 6.60 0 1.5 0.001 0.02 12 2,070 8.0
Petroleum Dock 1.16 4.14 0 0 0 0 7 828 9.0
Adabiya
162.40
0.85 7.93 0 6.4 0.03 0.01 9 1,840 12.0
Sokhna 87.80 22.30 8.50 0.4 4.9 0.4 0.5 6 2,350 17.0
Hurghada 9.90 0.02 0 0 0 0 0.2 3 340 5.0
Safaga 57.00 0.48 6.37 0 2.1 0 0.8 3 968 14.0
El Tour 1.65 0.43 0.38 0 0 0 0 1 75 5.0
Nuwaiba 9.87 0.34 1.9 0 1.0 0 0.8 4 380 8.0
Sharm El Sheikh 88.28 0.16 0 0 0 0 0.2 1 625 8.0
Total 481.55 76.49 134.45 5.6 122.3 6.1 3.23 180 32,068 Source: JICA Study Team based on year 2009 MTS data.
The cargo throughput at Egyptian commercial ports has increased at an annual average rate of 10 percent between 2003 and 2009. The growth of East Port Said has been particularly impressive during the period. However, increases in activity cannot be solely attributed to increased imports and exports, but continued expansion in terms of transit (trans-shipment) activity. This tends to be linked with the overall level of container movements. Container traffic recorded a high growth between 2003 and 2009, at an annual average rate of 18.4 percent, in line with the rapid expansion of world trade. Growth of container cargo slowed down in 2008 reflecting the global financial crisis. Container cargo is handled in eight ports. Alexandria, El-Dekhila, Damietta, West Port Said, East Port Said, and Sokhna account for most container throughput. A major portion of local containers is handled in Alexandria and El-Dekhila due to their proximity to the Cairo metropolitan area. On the other hand, most transit containers are handled in East Port Said due to its geographical advantage, deep draft, and terminal efficiency (Table 2.B.6).
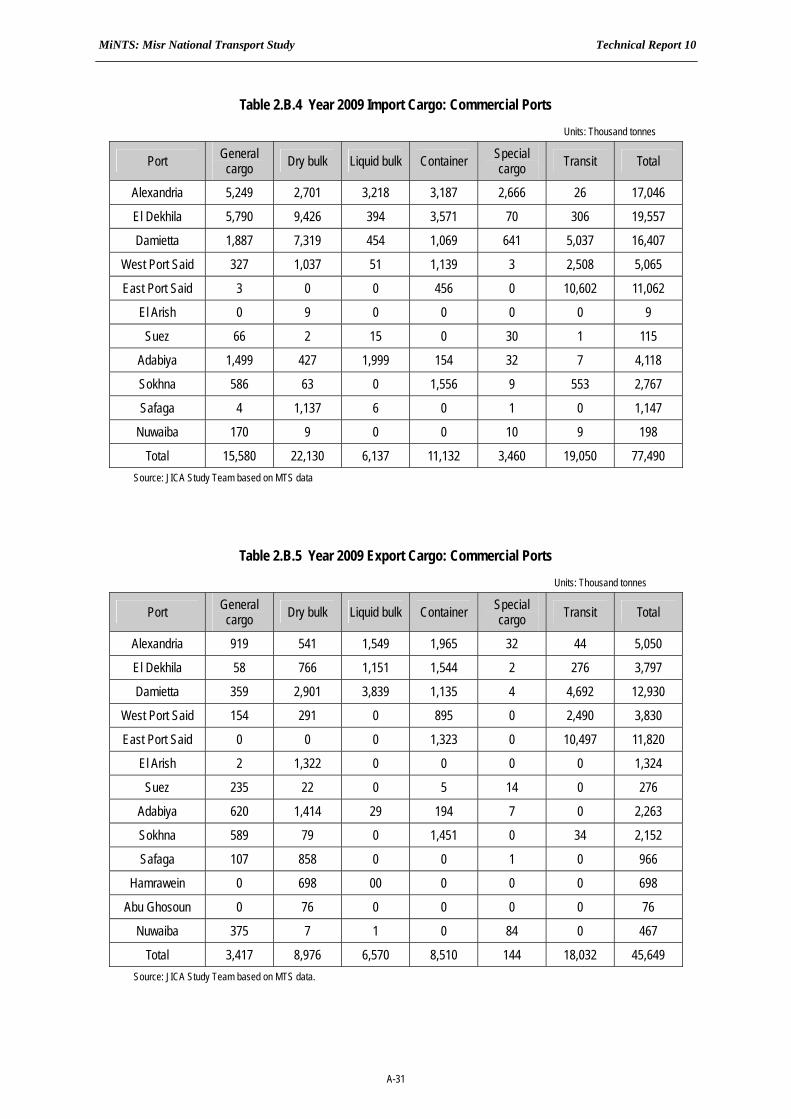
MiNTS: Misr National Transport Study Technical Report 10
A-31
Table 2.B.4 Year 2009 Import Cargo: Commercial Ports Units: Thousand tonnes
Port General cargo Dry bulk Liquid bulk Container Special
cargo Transit Total
Alexandria 5,249 2,701 3,218 3,187 2,666 26 17,046
El Dekhila 5,790 9,426 394 3,571 70 306 19,557
Damietta 1,887 7,319 454 1,069 641 5,037 16,407
West Port Said 327 1,037 51 1,139 3 2,508 5,065
East Port Said 3 0 0 456 0 10,602 11,062
El Arish 0 9 0 0 0 0 9
Suez 66 2 15 0 30 1 115
Adabiya 1,499 427 1,999 154 32 7 4,118
Sokhna 586 63 0 1,556 9 553 2,767
Safaga 4 1,137 6 0 1 0 1,147
Nuwaiba 170 9 0 0 10 9 198
Total 15,580 22,130 6,137 11,132 3,460 19,050 77,490 Source: JICA Study Team based on MTS data
Table 2.B.5 Year 2009 Export Cargo: Commercial Ports Units: Thousand tonnes
Port General cargo Dry bulk Liquid bulk Container Special
cargo Transit Total
Alexandria 919 541 1,549 1,965 32 44 5,050
El Dekhila 58 766 1,151 1,544 2 276 3,797
Damietta 359 2,901 3,839 1,135 4 4,692 12,930
West Port Said 154 291 0 895 0 2,490 3,830
East Port Said 0 0 0 1,323 0 10,497 11,820
El Arish 2 1,322 0 0 0 0 1,324
Suez 235 22 0 5 14 0 276
Adabiya 620 1,414 29 194 7 0 2,263
Sokhna 589 79 0 1,451 0 34 2,152
Safaga 107 858 0 0 1 0 966
Hamrawein 0 698 00 0 0 0 698
Abu Ghosoun 0 76 0 0 0 0 76
Nuwaiba 375 7 1 0 84 0 467
Total 3,417 8,976 6,570 8,510 144 18,032 45,649 Source: JICA Study Team based on MTS data.
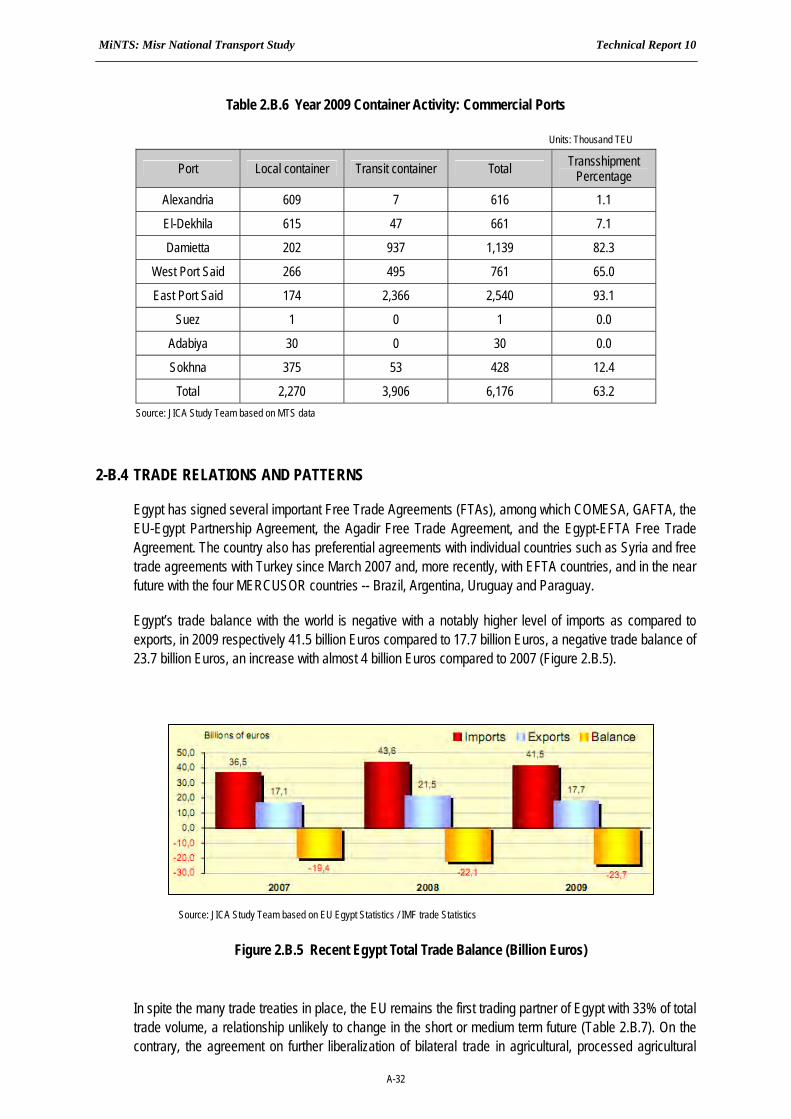
MiNTS: Misr National Transport Study Technical Report 10
A-32
Table 2.B.6 Year 2009 Container Activity: Commercial Ports
Units: Thousand TEU
Port Local container Transit container Total Transshipment Percentage
Alexandria 609 7 616 1.1
El-Dekhila 615 47 661 7.1
Damietta 202 937 1,139 82.3
West Port Said 266 495 761 65.0
East Port Said 174 2,366 2,540 93.1
Suez 1 0 1 0.0
Adabiya 30 0 30 0.0
Sokhna 375 53 428 12.4
Total 2,270 3,906 6,176 63.2 Source: JICA Study Team based on MTS data
2-B.4 TRADE RELATIONS AND PATTERNS
Egypt has signed several important Free Trade Agreements (FTAs), among which COMESA, GAFTA, the EU-Egypt Partnership Agreement, the Agadir Free Trade Agreement, and the Egypt-EFTA Free Trade Agreement. The country also has preferential agreements with individual countries such as Syria and free trade agreements with Turkey since March 2007 and, more recently, with EFTA countries, and in the near future with the four MERCUSOR countries -- Brazil, Argentina, Uruguay and Paraguay.
Egypt’s trade balance with the world is negative with a notably higher level of imports as compared to exports, in 2009 respectively 41.5 billion Euros compared to 17.7 billion Euros, a negative trade balance of 23.7 billion Euros, an increase with almost 4 billion Euros compared to 2007 (Figure 2.B.5).
In spite the many trade treaties in place, the EU remains the first trading partner of Egypt with 33% of total trade volume, a relationship unlikely to change in the short or medium term future (Table 2.B.7). On the contrary, the agreement on further liberalization of bilateral trade in agricultural, processed agricultural
Source: JICA Study Team based on EU Egypt Statistics / IMF trade Statistics
Figure 2.B.5 Recent Egypt Total Trade Balance (Billion Euros)
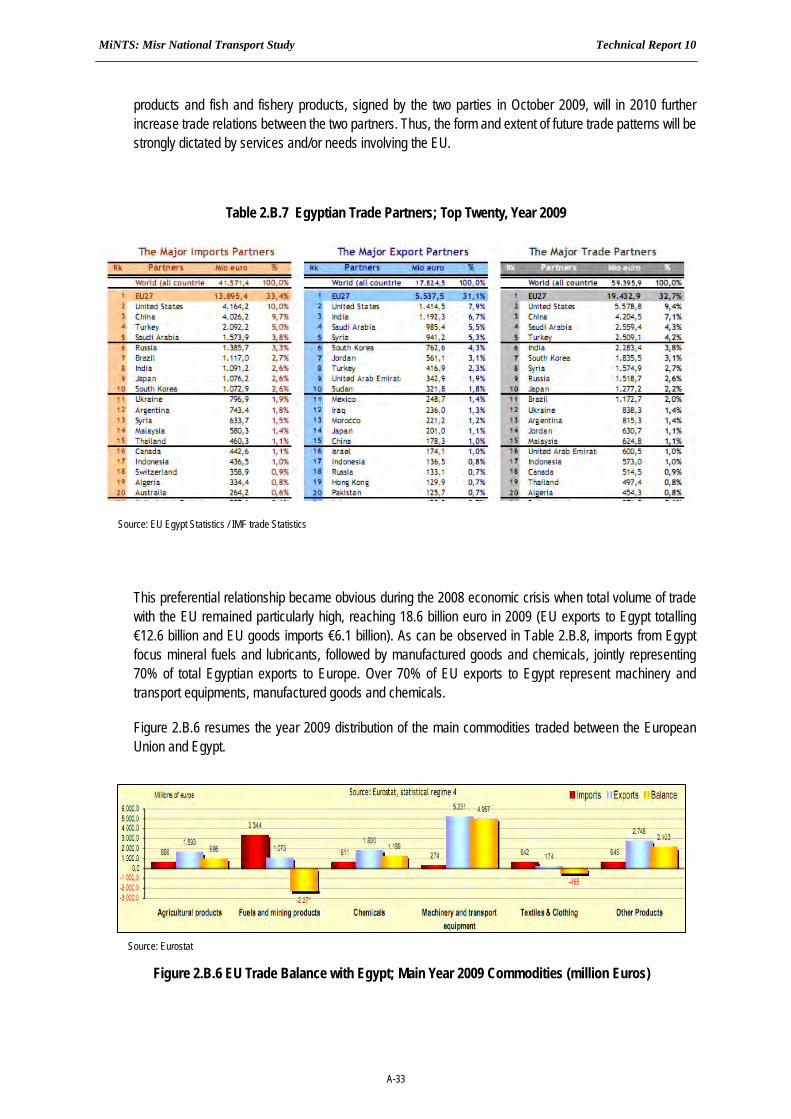
MiNTS: Misr National Transport Study Technical Report 10
A-33
products and fish and fishery products, signed by the two parties in October 2009, will in 2010 further increase trade relations between the two partners. Thus, the form and extent of future trade patterns will be strongly dictated by services and/or needs involving the EU.
Table 2.B.7 Egyptian Trade Partners; Top Twenty, Year 2009
This preferential relationship became obvious during the 2008 economic crisis when total volume of trade with the EU remained particularly high, reaching 18.6 billion euro in 2009 (EU exports to Egypt totalling €12.6 billion and EU goods imports €6.1 billion). As can be observed in Table 2.B.8, imports from Egypt focus mineral fuels and lubricants, followed by manufactured goods and chemicals, jointly representing 70% of total Egyptian exports to Europe. Over 70% of EU exports to Egypt represent machinery and transport equipments, manufactured goods and chemicals.
Figure 2.B.6 resumes the year 2009 distribution of the main commodities traded between the European Union and Egypt.
Source: EU Egypt Statistics / IMF trade Statistics
Source: Eurostat
Figure 2.B.6 EU Trade Balance with Egypt; Main Year 2009 Commodities (million Euros)

MiNTS: Misr National Transport Study Technical Report 10
A-34
Table 2.B.8 Generalized EU-Egypt Year 2009 Trade Pattern
IMPORTS EXPORTS
SITC Sections volume % SITC sections volume share %
Total million EURO 6,111 100.0 Total million EURO 12,618 100.0
3 Mineral fuels, lubricants and related materials 3,120 51.1 7 Machinery and transport
equipment 5,231 41.5
6 Manufactured goods classified chiefly by material 635 10.4 6 Manufactured goods classified
chiefly by material 1,901 15.1
5 Chemicals and related prod, n.e.s. 611 10.0 5 Chemicals and related prod,
n.e.s. 1,800 14.3
8 Miscellaneous manufactured articles 586 9.6 0 Food and live animals 876 6.9
0 Food and live animals 518 8.5 2 Crude materials, inedible, except fuels 768 6.1
7 Machinery and transport equipment 274 4.5 8 Miscellaneous manufactured
articles 739 5.9
2 Crude materials, inedible, except fuels 144 2.4 3 Mineral fuels, lubricants and
related materials 537 4.3
9 Commodities and transactions n.c.e. 46 0.8 9 Commodities and transactions
n.c.e. 143 1.1
1 Beverages and tobacco 6 0.1 1 Beverages and tobacco 116 0.9
4 Animal and vegetable oils, fats and waxes 1 0.0 4 Animal and vegetable oils, fats
and waxes 19 0.2
Source: JICA Study Team from EU Egypt Statistics / IMF trade Statistics
In 2008, EU-Egypt trade increased significantly compared to 2007 totalling €20.66 billion with Egypt’s exports to the EU increasing 13.1% and EU exports to Egypt rising with 22.2%. In 2009, in account of the impact of the global crisis, the trend reversed in comparison to 2008 and EU imports from Egypt decreased by 26%, while exports by 0.9%. Global trade decreased by almost 10% (€18.6 billion) (Figure 2.B.7).
Source: Eurostat
Figure 2.B.7 Changes in Recent Egypt – EU Trade Balance (percent)

MiNTS: Misr National Transport Study Technical Report 10
A-35
The preferential relationship is also reflected in the investment pattern. In 2008, EU direct investment in Egypt (stocks) amounted to €20.2 billion, out of the EU total stock of €43.3 billion in the Maghreb and Mashrek area, almost 40% more than the €12.3 billion invested in 2007.
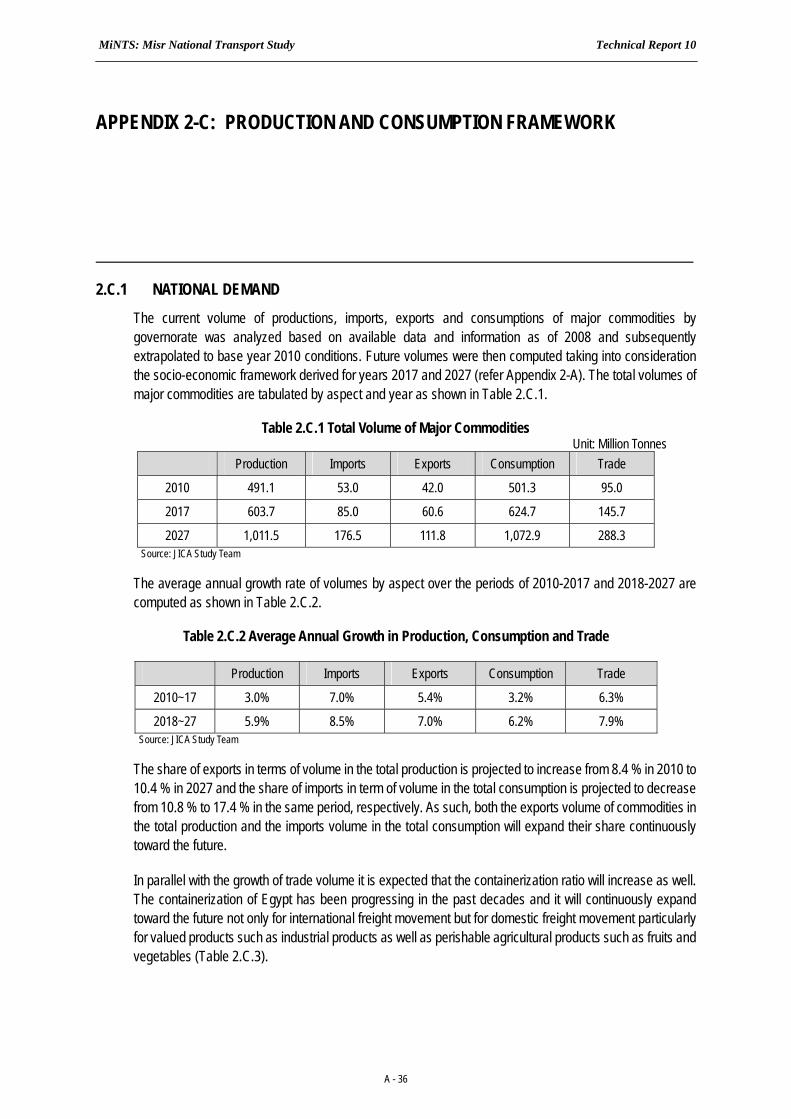
MiNTS: Misr National Transport Study Technical Report 10
A - 36
APPENDIX 2-C: PRODUCTION AND CONSUMPTION FRAMEWORK
2.C.1 NATIONAL DEMAND The current volume of productions, imports, exports and consumptions of major commodities by governorate was analyzed based on available data and information as of 2008 and subsequently extrapolated to base year 2010 conditions. Future volumes were then computed taking into consideration the socio-economic framework derived for years 2017 and 2027 (refer Appendix 2-A). The total volumes of major commodities are tabulated by aspect and year as shown in Table 2.C.1.
Table 2.C.1 Total Volume of Major Commodities Unit: Million Tonnes
Production Imports Exports Consumption Trade
2010 491.1 53.0 42.0 501.3 95.0
2017 603.7 85.0 60.6 624.7 145.7
2027 1,011.5 176.5 111.8 1,072.9 288.3 Source: JICA Study Team
The average annual growth rate of volumes by aspect over the periods of 2010-2017 and 2018-2027 are computed as shown in Table 2.C.2.
Table 2.C.2 Average Annual Growth in Production, Consumption and Trade
Production Imports Exports Consumption Trade
2010~17 3.0% 7.0% 5.4% 3.2% 6.3%
2018~27 5.9% 8.5% 7.0% 6.2% 7.9% Source: JICA Study Team
The share of exports in terms of volume in the total production is projected to increase from 8.4 % in 2010 to 10.4 % in 2027 and the share of imports in term of volume in the total consumption is projected to decrease from 10.8 % to 17.4 % in the same period, respectively. As such, both the exports volume of commodities in the total production and the imports volume in the total consumption will expand their share continuously toward the future.
In parallel with the growth of trade volume it is expected that the containerization ratio will increase as well. The containerization of Egypt has been progressing in the past decades and it will continuously expand toward the future not only for international freight movement but for domestic freight movement particularly for valued products such as industrial products as well as perishable agricultural products such as fruits and vegetables (Table 2.C.3).
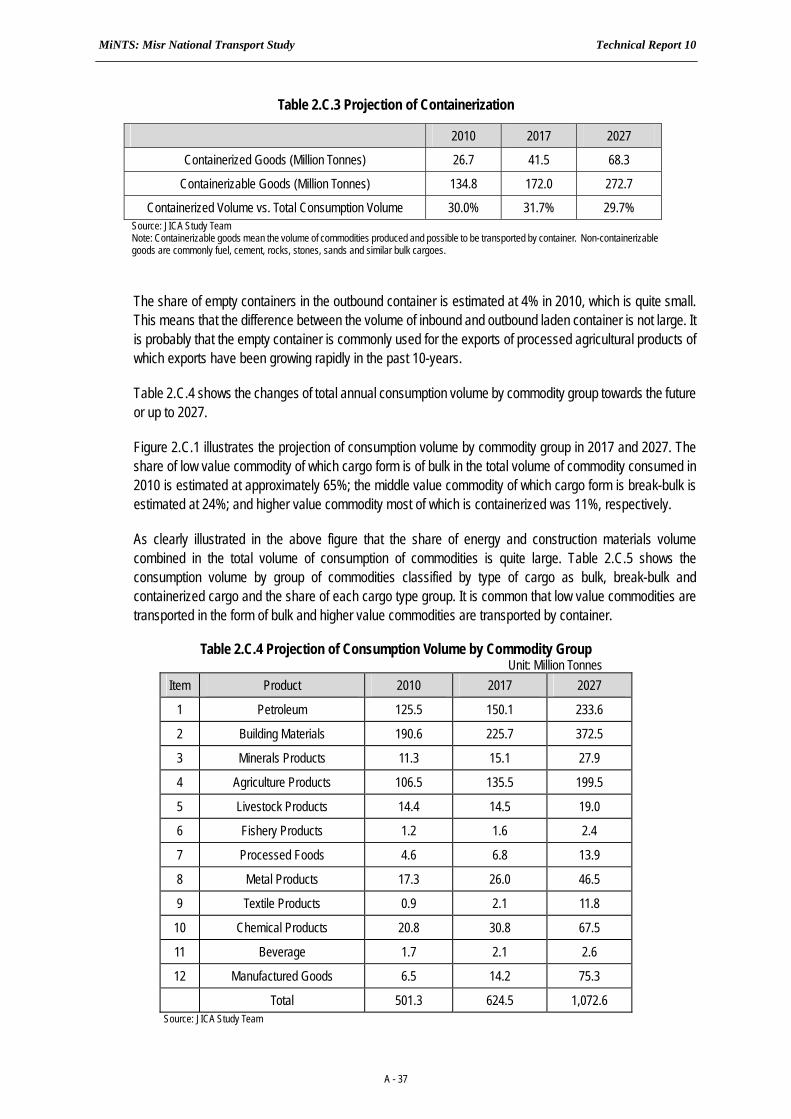
MiNTS: Misr National Transport Study Technical Report 10
A - 37
Table 2.C.3 Projection of Containerization
2010 2017 2027
Containerized Goods (Million Tonnes) 26.7 41.5 68.3
Containerizable Goods (Million Tonnes) 134.8 172.0 272.7
Containerized Volume vs. Total Consumption Volume 30.0% 31.7% 29.7% Source: JICA Study Team Note: Containerizable goods mean the volume of commodities produced and possible to be transported by container. Non-containerizable goods are commonly fuel, cement, rocks, stones, sands and similar bulk cargoes.
The share of empty containers in the outbound container is estimated at 4% in 2010, which is quite small. This means that the difference between the volume of inbound and outbound laden container is not large. It is probably that the empty container is commonly used for the exports of processed agricultural products of which exports have been growing rapidly in the past 10-years.
Table 2.C.4 shows the changes of total annual consumption volume by commodity group towards the future or up to 2027.
Figure 2.C.1 illustrates the projection of consumption volume by commodity group in 2017 and 2027. The share of low value commodity of which cargo form is of bulk in the total volume of commodity consumed in 2010 is estimated at approximately 65%; the middle value commodity of which cargo form is break-bulk is estimated at 24%; and higher value commodity most of which is containerized was 11%, respectively.
As clearly illustrated in the above figure that the share of energy and construction materials volume combined in the total volume of consumption of commodities is quite large. Table 2.C.5 shows the consumption volume by group of commodities classified by type of cargo as bulk, break-bulk and containerized cargo and the share of each cargo type group. It is common that low value commodities are transported in the form of bulk and higher value commodities are transported by container.
Table 2.C.4 Projection of Consumption Volume by Commodity Group Unit: Million Tonnes
Item Product 2010 2017 2027
1 Petroleum 125.5 150.1 233.6
2 Building Materials 190.6 225.7 372.5
3 Minerals Products 11.3 15.1 27.9
4 Agriculture Products 106.5 135.5 199.5
5 Livestock Products 14.4 14.5 19.0
6 Fishery Products 1.2 1.6 2.4
7 Processed Foods 4.6 6.8 13.9
8 Metal Products 17.3 26.0 46.5
9 Textile Products 0.9 2.1 11.8
10 Chemical Products 20.8 30.8 67.5
11 Beverage 1.7 2.1 2.6
12 Manufactured Goods 6.5 14.2 75.3
Total 501.3 624.5 1,072.6 Source: JICA Study Team
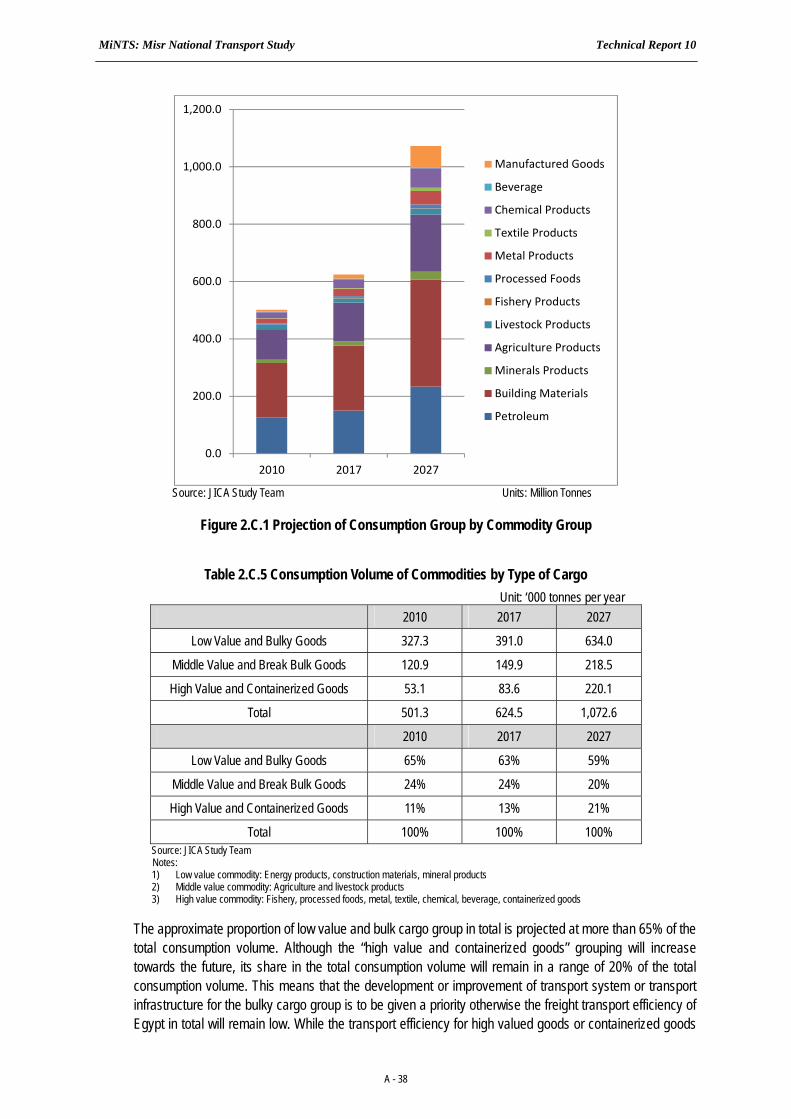
MiNTS: Misr National Transport Study Technical Report 10
A - 38
0.0
200.0
400.0
600.0
800.0
1,000.0
1,200.0
2010 2017 2027
Manufactured Goods
Beverage
Chemical Products
Textile Products
Metal Products
Processed Foods
Fishery Products
Livestock Products
Agriculture Products
Minerals Products
Building Materials
Petroleum
Source: JICA Study Team Units: Million Tonnes
Figure 2.C.1 Projection of Consumption Group by Commodity Group
Table 2.C.5 Consumption Volume of Commodities by Type of Cargo Unit: ‘000 tonnes per year
2010 2017 2027
Low Value and Bulky Goods 327.3 391.0 634.0
Middle Value and Break Bulk Goods 120.9 149.9 218.5
High Value and Containerized Goods 53.1 83.6 220.1
Total 501.3 624.5 1,072.6
2010 2017 2027
Low Value and Bulky Goods 65% 63% 59%
Middle Value and Break Bulk Goods 24% 24% 20%
High Value and Containerized Goods 11% 13% 21%
Total 100% 100% 100% Source: JICA Study Team Notes:
1) Low value commodity: Energy products, construction materials, mineral products 2) Middle value commodity: Agriculture and livestock products 3) High value commodity: Fishery, processed foods, metal, textile, chemical, beverage, containerized goods
The approximate proportion of low value and bulk cargo group in total is projected at more than 65% of the total consumption volume. Although the “high value and containerized goods” grouping will increase towards the future, its share in the total consumption volume will remain in a range of 20% of the total consumption volume. This means that the development or improvement of transport system or transport infrastructure for the bulky cargo group is to be given a priority otherwise the freight transport efficiency of Egypt in total will remain low. While the transport efficiency for high valued goods or containerized goods
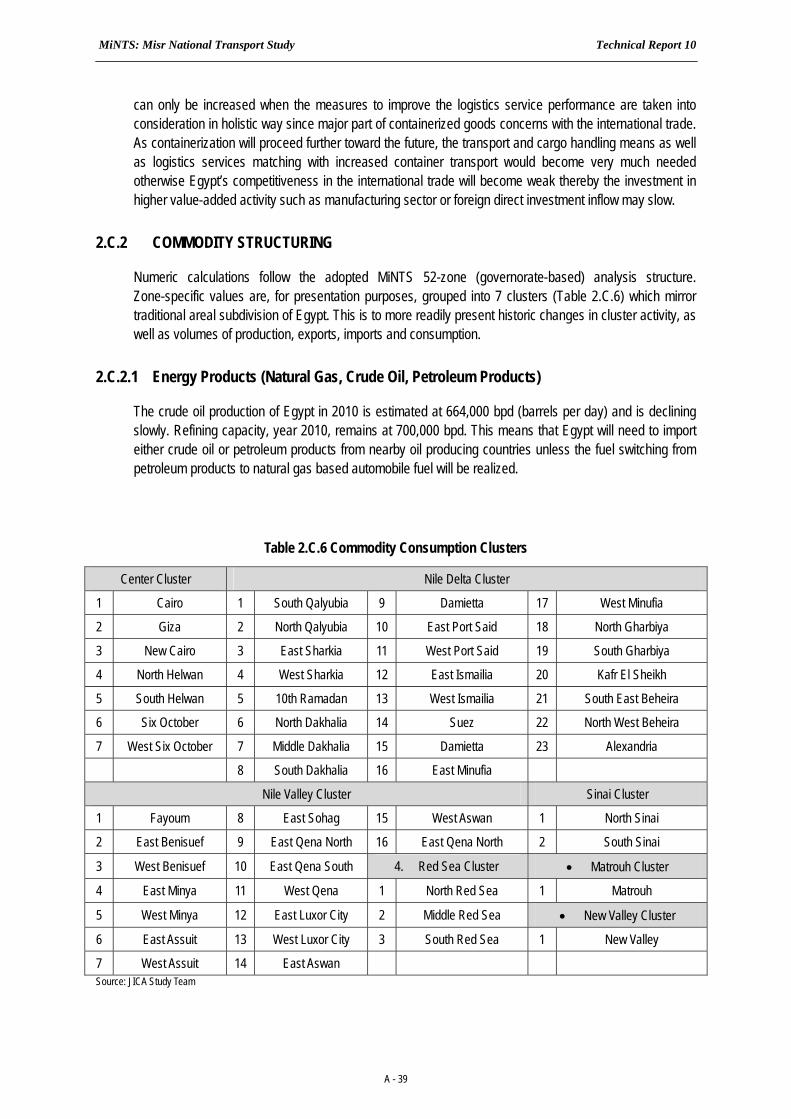
MiNTS: Misr National Transport Study Technical Report 10
A - 39
can only be increased when the measures to improve the logistics service performance are taken into consideration in holistic way since major part of containerized goods concerns with the international trade. As containerization will proceed further toward the future, the transport and cargo handling means as well as logistics services matching with increased container transport would become very much needed otherwise Egypt’s competitiveness in the international trade will become weak thereby the investment in higher value-added activity such as manufacturing sector or foreign direct investment inflow may slow.
2.C.2 COMMODITY STRUCTURING
Numeric calculations follow the adopted MiNTS 52-zone (governorate-based) analysis structure. Zone-specific values are, for presentation purposes, grouped into 7 clusters (Table 2.C.6) which mirror traditional areal subdivision of Egypt. This is to more readily present historic changes in cluster activity, as well as volumes of production, exports, imports and consumption.
2.C.2.1 Energy Products (Natural Gas, Crude Oil, Petroleum Products)
The crude oil production of Egypt in 2010 is estimated at 664,000 bpd (barrels per day) and is declining slowly. Refining capacity, year 2010, remains at 700,000 bpd. This means that Egypt will need to import either crude oil or petroleum products from nearby oil producing countries unless the fuel switching from petroleum products to natural gas based automobile fuel will be realized.
Table 2.C.6 Commodity Consumption Clusters
Center Cluster Nile Delta Cluster
1 Cairo 1 South Qalyubia 9 Damietta 17 West Minufia
2 Giza 2 North Qalyubia 10 East Port Said 18 North Gharbiya
3 New Cairo 3 East Sharkia 11 West Port Said 19 South Gharbiya
4 North Helwan 4 West Sharkia 12 East Ismailia 20 Kafr El Sheikh
5 South Helwan 5 10th Ramadan 13 West Ismailia 21 South East Beheira
6 Six October 6 North Dakhalia 14 Suez 22 North West Beheira
7 West Six October 7 Middle Dakhalia 15 Damietta 23 Alexandria
8 South Dakhalia 16 East Minufia
Nile Valley Cluster Sinai Cluster
1 Fayoum 8 East Sohag 15 West Aswan 1 North Sinai
2 East Benisuef 9 East Qena North 16 East Qena North 2 South Sinai
3 West Benisuef 10 East Qena South 4. Red Sea Cluster • Matrouh Cluster
4 East Minya 11 West Qena 1 North Red Sea 1 Matrouh
5 West Minya 12 East Luxor City 2 Middle Red Sea • New Valley Cluster
6 East Assuit 13 West Luxor City 3 South Red Sea 1 New Valley
7 West Assuit 14 East Aswan Source: JICA Study Team
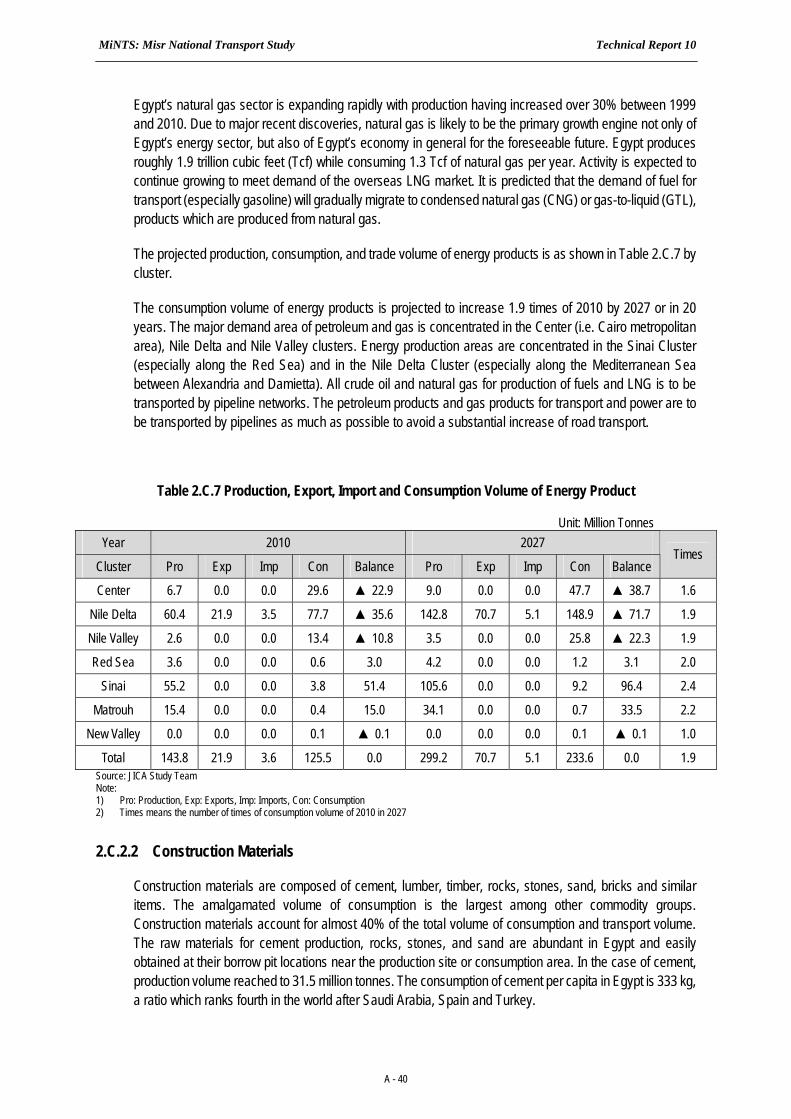
MiNTS: Misr National Transport Study Technical Report 10
A - 40
Egypt’s natural gas sector is expanding rapidly with production having increased over 30% between 1999 and 2010. Due to major recent discoveries, natural gas is likely to be the primary growth engine not only of Egypt’s energy sector, but also of Egypt’s economy in general for the foreseeable future. Egypt produces roughly 1.9 trillion cubic feet (Tcf) while consuming 1.3 Tcf of natural gas per year. Activity is expected to continue growing to meet demand of the overseas LNG market. It is predicted that the demand of fuel for transport (especially gasoline) will gradually migrate to condensed natural gas (CNG) or gas-to-liquid (GTL), products which are produced from natural gas.
The projected production, consumption, and trade volume of energy products is as shown in Table 2.C.7 by cluster.
The consumption volume of energy products is projected to increase 1.9 times of 2010 by 2027 or in 20 years. The major demand area of petroleum and gas is concentrated in the Center (i.e. Cairo metropolitan area), Nile Delta and Nile Valley clusters. Energy production areas are concentrated in the Sinai Cluster (especially along the Red Sea) and in the Nile Delta Cluster (especially along the Mediterranean Sea between Alexandria and Damietta). All crude oil and natural gas for production of fuels and LNG is to be transported by pipeline networks. The petroleum products and gas products for transport and power are to be transported by pipelines as much as possible to avoid a substantial increase of road transport.
Table 2.C.7 Production, Export, Import and Consumption Volume of Energy Product
Unit: Million Tonnes Year 2010 2027
Cluster Pro Exp Imp Con Balance Pro Exp Imp Con Balance Times
Center 6.7 0.0 0.0 29.6 ▲ 22.9 9.0 0.0 0.0 47.7 ▲ 38.7 1.6
Nile Delta 60.4 21.9 3.5 77.7 ▲ 35.6 142.8 70.7 5.1 148.9 ▲ 71.7 1.9
Nile Valley 2.6 0.0 0.0 13.4 ▲ 10.8 3.5 0.0 0.0 25.8 ▲ 22.3 1.9
Red Sea 3.6 0.0 0.0 0.6 3.0 4.2 0.0 0.0 1.2 3.1 2.0
Sinai 55.2 0.0 0.0 3.8 51.4 105.6 0.0 0.0 9.2 96.4 2.4
Matrouh 15.4 0.0 0.0 0.4 15.0 34.1 0.0 0.0 0.7 33.5 2.2
New Valley 0.0 0.0 0.0 0.1 ▲ 0.1 0.0 0.0 0.0 0.1 ▲ 0.1 1.0
Total 143.8 21.9 3.6 125.5 0.0 299.2 70.7 5.1 233.6 0.0 1.9 Source: JICA Study Team Note: 1) Pro: Production, Exp: Exports, Imp: Imports, Con: Consumption 2) Times means the number of times of consumption volume of 2010 in 2027
2.C.2.2 Construction Materials
Construction materials are composed of cement, lumber, timber, rocks, stones, sand, bricks and similar items. The amalgamated volume of consumption is the largest among other commodity groups. Construction materials account for almost 40% of the total volume of consumption and transport volume. The raw materials for cement production, rocks, stones, and sand are abundant in Egypt and easily obtained at their borrow pit locations near the production site or consumption area. In the case of cement, production volume reached to 31.5 million tonnes. The consumption of cement per capita in Egypt is 333 kg, a ratio which ranks fourth in the world after Saudi Arabia, Spain and Turkey.
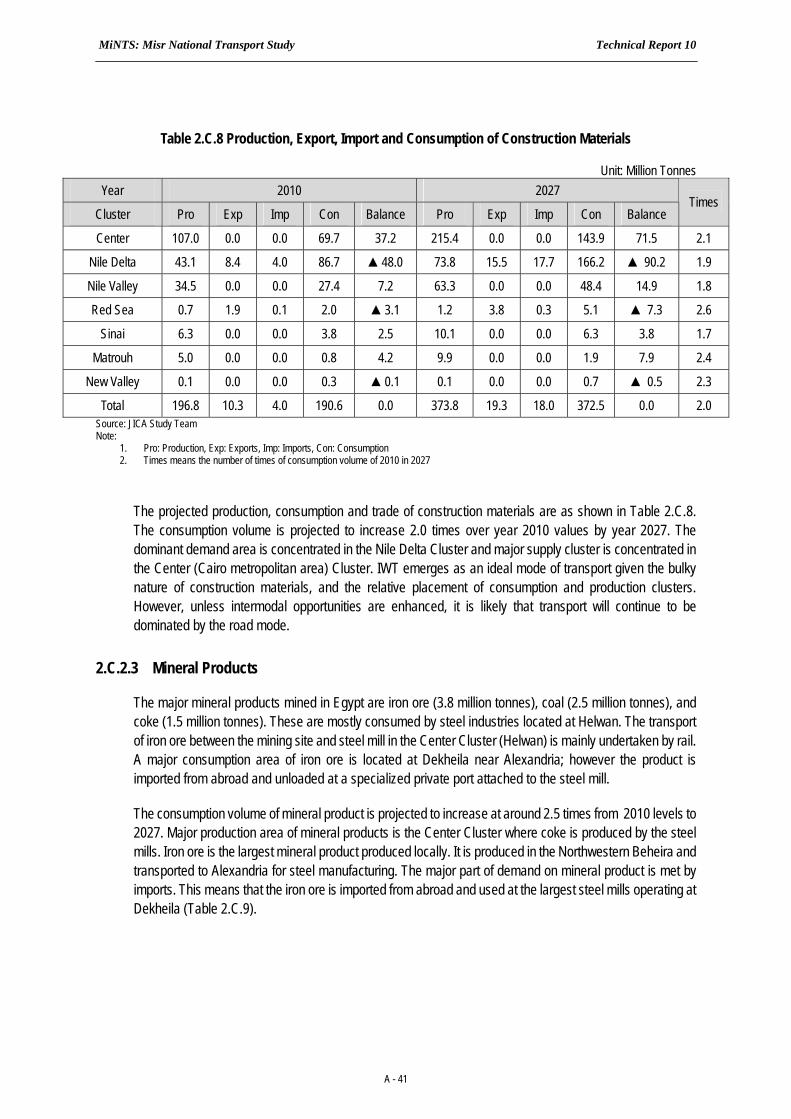
MiNTS: Misr National Transport Study Technical Report 10
A - 41
Table 2.C.8 Production, Export, Import and Consumption of Construction Materials
Unit: Million Tonnes Year 2010 2027
Cluster Pro Exp Imp Con Balance Pro Exp Imp Con Balance Times
Center 107.0 0.0 0.0 69.7 37.2 215.4 0.0 0.0 143.9 71.5 2.1
Nile Delta 43.1 8.4 4.0 86.7 ▲48.0 73.8 15.5 17.7 166.2 ▲ 90.2 1.9
Nile Valley 34.5 0.0 0.0 27.4 7.2 63.3 0.0 0.0 48.4 14.9 1.8
Red Sea 0.7 1.9 0.1 2.0 ▲3.1 1.2 3.8 0.3 5.1 ▲ 7.3 2.6
Sinai 6.3 0.0 0.0 3.8 2.5 10.1 0.0 0.0 6.3 3.8 1.7
Matrouh 5.0 0.0 0.0 0.8 4.2 9.9 0.0 0.0 1.9 7.9 2.4
New Valley 0.1 0.0 0.0 0.3 ▲0.1 0.1 0.0 0.0 0.7 ▲ 0.5 2.3
Total 196.8 10.3 4.0 190.6 0.0 373.8 19.3 18.0 372.5 0.0 2.0 Source: JICA Study Team Note:
1. Pro: Production, Exp: Exports, Imp: Imports, Con: Consumption 2. Times means the number of times of consumption volume of 2010 in 2027
The projected production, consumption and trade of construction materials are as shown in Table 2.C.8. The consumption volume is projected to increase 2.0 times over year 2010 values by year 2027. The dominant demand area is concentrated in the Nile Delta Cluster and major supply cluster is concentrated in the Center (Cairo metropolitan area) Cluster. IWT emerges as an ideal mode of transport given the bulky nature of construction materials, and the relative placement of consumption and production clusters. However, unless intermodal opportunities are enhanced, it is likely that transport will continue to be dominated by the road mode.
2.C.2.3 Mineral Products
The major mineral products mined in Egypt are iron ore (3.8 million tonnes), coal (2.5 million tonnes), and coke (1.5 million tonnes). These are mostly consumed by steel industries located at Helwan. The transport of iron ore between the mining site and steel mill in the Center Cluster (Helwan) is mainly undertaken by rail. A major consumption area of iron ore is located at Dekheila near Alexandria; however the product is imported from abroad and unloaded at a specialized private port attached to the steel mill.
The consumption volume of mineral product is projected to increase at around 2.5 times from 2010 levels to 2027. Major production area of mineral products is the Center Cluster where coke is produced by the steel mills. Iron ore is the largest mineral product produced locally. It is produced in the Northwestern Beheira and transported to Alexandria for steel manufacturing. The major part of demand on mineral product is met by imports. This means that the iron ore is imported from abroad and used at the largest steel mills operating at Dekheila (Table 2.C.9).

MiNTS: Misr National Transport Study Technical Report 10
A - 42
Table 2.C.9 Production, Export, Import and Consumption of Mineral Products
Unit: Million Tonnes Year 2010 2027
Cluster Pro Exp Imp Con Balance Pro Exp Imp Con Balance Times
Center 1.6 0.0 0.0 4.2 ▲ 2.6 3.0 0.0 0.0 9.2 ▲ 6.2 2.4
Nile Delta 2.2 0.0 6.7 7.1 1.8 5.5 0.0 16.8 18.7 3.6 2.6
Nile Valley 0.7 0.0 0.0 0.0 0.7 1.7 0.0 0.0 0.0 1.7 0.0
Red Sea 0.0 0.0 0.1 0.0 0.1 0.0 0.0 0.3 0.0 0.3 0.0
Sinai 0.4 0.0 0.0 0.0 0.4 0.7 0.0 0.0 0.0 0.7 0.0
Matrouh 0.0 0.0 0.0 0.0 0.0 0.0 0.0 0.0 0.0 0.0 0.0
New Valley 0.0 0.0 0.0 0.0 0.0 0.0 0.0 0.0 0.0 0.0 0.0
Total 4.8 0.0 6.8 11.3 0.3 10.9 0.0 17.0 27.9 0.0 2.5 Source: JICA Study Team Note:
1- Pro: Production, Exp: Exports, Imp: Imports, Con: Consumption 2- Times means the number of times of consumption volume of 2010 in 2027
Bulky and low value products are to be transported either by IWT or railway as much as possible as is being done at present. Given that the production volume of iron ore will increase almost 1.8 times, additional railway transport capacity is needed.
2.C.2.4 Agriculture Products
Agriculture products are composed of wheat, maize, rice, barely, corn, fruits and vegetables, sugar cane, sugar beet, fiber crops, broad beans, animal feeds, oil crops, animal products, fishery, refined sugar and edible oil. The total consumption volume of agriculture products in 2010 is estimated at around 127 million tonnes of which 15.6 million tonnes is wheat. Around 1.8 million tonnes of agriculture products composed of mainly fruits and vegetable are exported, largely to neighboring countries.
Wheat is the major food staple of Egypt. However, the volume of locally produced wheat has been far from achieving self sufficiency for some three decades. The wheat consumption volume has been increasing steadily in parallel with the population growth and economic growth, reaching 15.6 million tonnes of which 8.3 million tonnes are locally produced. .
The projected production, consumption and trade are as shown in Table 2.C.10. The consumption volume of agricultural product is projected to increase around 1.7 times over the coming 20 years to meet the demands of an increasing population. The role of the Nile Delta Cluster as the source of agricultural products will become increasingly important. The import of wheat will likewise continue to expand, thus requiring increasing distribution logistics from sea ports (especially Alexandria). As most agricultural products are considered a “low value and bulky” cargo, the expanded use of railway and IWT is encouraged given the structure of long-distance unit transport cost. However, such an expanded role for non-road transport can only be realized once a focus on intermodal logistics is realized.
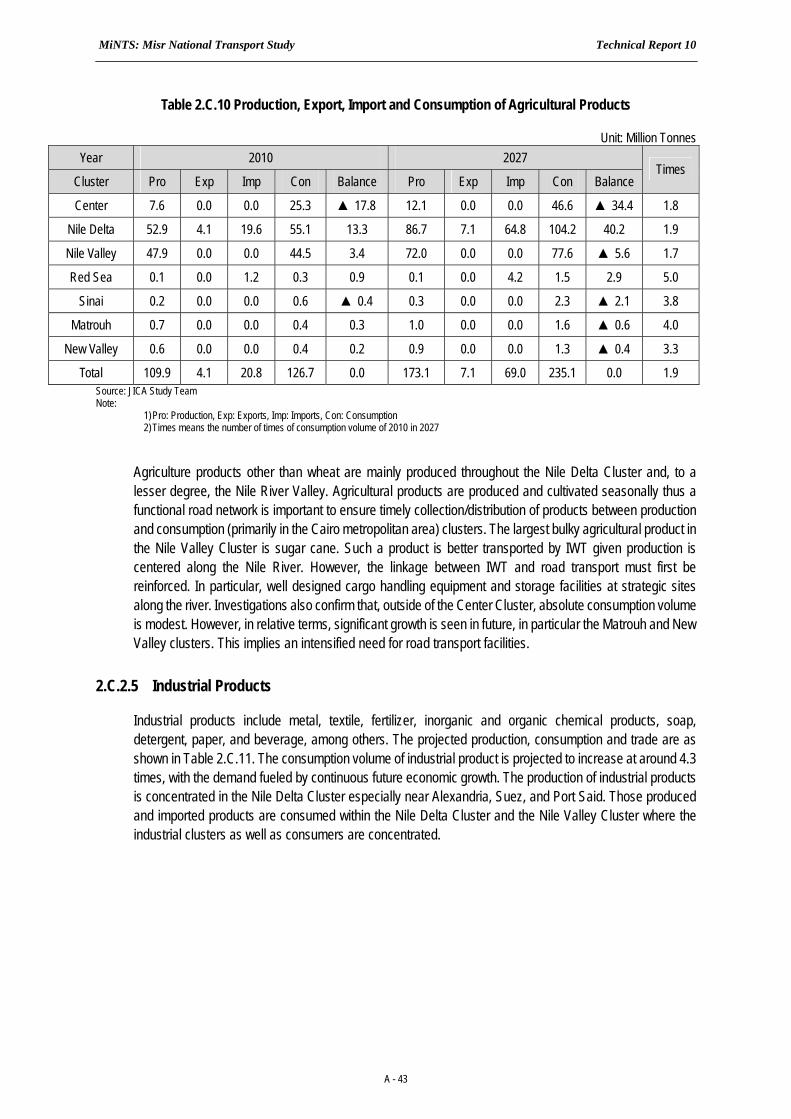
MiNTS: Misr National Transport Study Technical Report 10
A - 43
Table 2.C.10 Production, Export, Import and Consumption of Agricultural Products
Unit: Million Tonnes Year 2010 2027
Cluster Pro Exp Imp Con Balance Pro Exp Imp Con Balance Times
Center 7.6 0.0 0.0 25.3 ▲ 17.8 12.1 0.0 0.0 46.6 ▲ 34.4 1.8
Nile Delta 52.9 4.1 19.6 55.1 13.3 86.7 7.1 64.8 104.2 40.2 1.9
Nile Valley 47.9 0.0 0.0 44.5 3.4 72.0 0.0 0.0 77.6 ▲ 5.6 1.7
Red Sea 0.1 0.0 1.2 0.3 0.9 0.1 0.0 4.2 1.5 2.9 5.0
Sinai 0.2 0.0 0.0 0.6 ▲ 0.4 0.3 0.0 0.0 2.3 ▲ 2.1 3.8
Matrouh 0.7 0.0 0.0 0.4 0.3 1.0 0.0 0.0 1.6 ▲ 0.6 4.0
New Valley 0.6 0.0 0.0 0.4 0.2 0.9 0.0 0.0 1.3 ▲ 0.4 3.3
Total 109.9 4.1 20.8 126.7 0.0 173.1 7.1 69.0 235.1 0.0 1.9 Source: JICA Study Team Note:
1) Pro: Production, Exp: Exports, Imp: Imports, Con: Consumption 2) Times means the number of times of consumption volume of 2010 in 2027
Agriculture products other than wheat are mainly produced throughout the Nile Delta Cluster and, to a lesser degree, the Nile River Valley. Agricultural products are produced and cultivated seasonally thus a functional road network is important to ensure timely collection/distribution of products between production and consumption (primarily in the Cairo metropolitan area) clusters. The largest bulky agricultural product in the Nile Valley Cluster is sugar cane. Such a product is better transported by IWT given production is centered along the Nile River. However, the linkage between IWT and road transport must first be reinforced. In particular, well designed cargo handling equipment and storage facilities at strategic sites along the river. Investigations also confirm that, outside of the Center Cluster, absolute consumption volume is modest. However, in relative terms, significant growth is seen in future, in particular the Matrouh and New Valley clusters. This implies an intensified need for road transport facilities.
2.C.2.5 Industrial Products
Industrial products include metal, textile, fertilizer, inorganic and organic chemical products, soap, detergent, paper, and beverage, among others. The projected production, consumption and trade are as shown in Table 2.C.11. The consumption volume of industrial product is projected to increase at around 4.3 times, with the demand fueled by continuous future economic growth. The production of industrial products is concentrated in the Nile Delta Cluster especially near Alexandria, Suez, and Port Said. Those produced and imported products are consumed within the Nile Delta Cluster and the Nile Valley Cluster where the industrial clusters as well as consumers are concentrated.
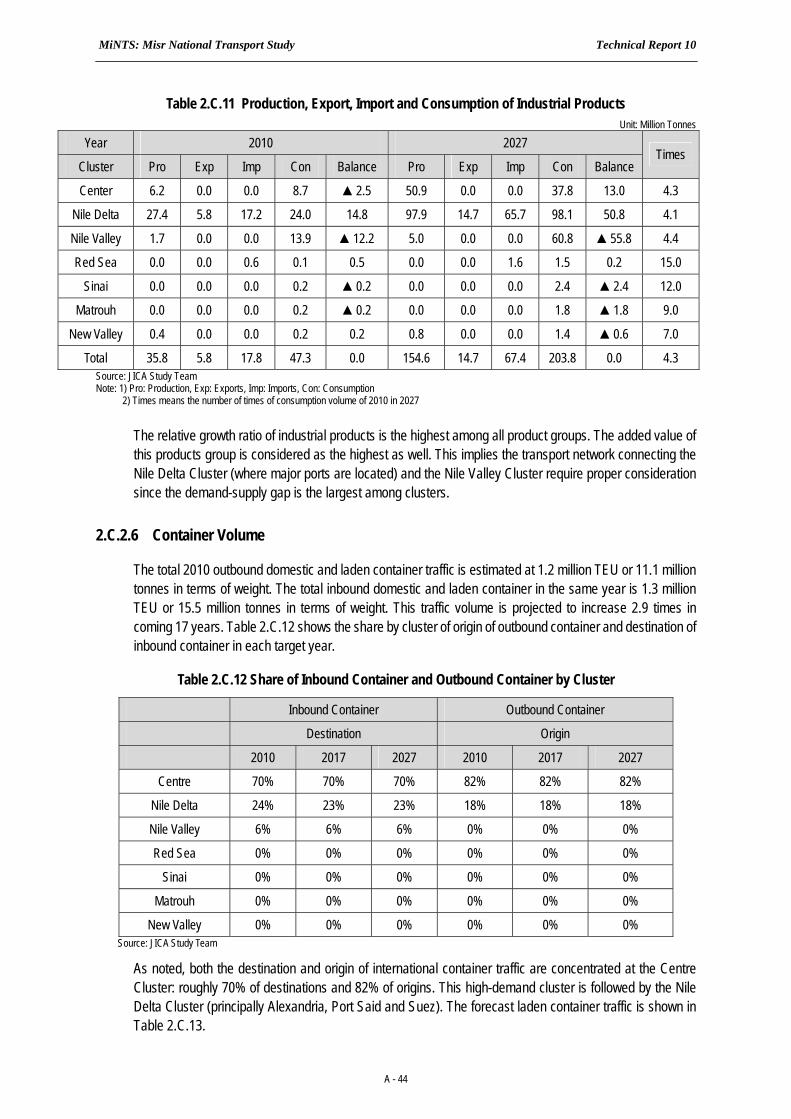
MiNTS: Misr National Transport Study Technical Report 10
A - 44
Table 2.C.11 Production, Export, Import and Consumption of Industrial Products Unit: Million Tonnes
Year 2010 2027
Cluster Pro Exp Imp Con Balance Pro Exp Imp Con Balance Times
Center 6.2 0.0 0.0 8.7 ▲2.5 50.9 0.0 0.0 37.8 13.0 4.3
Nile Delta 27.4 5.8 17.2 24.0 14.8 97.9 14.7 65.7 98.1 50.8 4.1
Nile Valley 1.7 0.0 0.0 13.9 ▲12.2 5.0 0.0 0.0 60.8 ▲55.8 4.4
Red Sea 0.0 0.0 0.6 0.1 0.5 0.0 0.0 1.6 1.5 0.2 15.0
Sinai 0.0 0.0 0.0 0.2 ▲0.2 0.0 0.0 0.0 2.4 ▲2.4 12.0
Matrouh 0.0 0.0 0.0 0.2 ▲0.2 0.0 0.0 0.0 1.8 ▲1.8 9.0
New Valley 0.4 0.0 0.0 0.2 0.2 0.8 0.0 0.0 1.4 ▲0.6 7.0
Total 35.8 5.8 17.8 47.3 0.0 154.6 14.7 67.4 203.8 0.0 4.3 Source: JICA Study Team Note: 1) Pro: Production, Exp: Exports, Imp: Imports, Con: Consumption
2) Times means the number of times of consumption volume of 2010 in 2027 The relative growth ratio of industrial products is the highest among all product groups. The added value of this products group is considered as the highest as well. This implies the transport network connecting the Nile Delta Cluster (where major ports are located) and the Nile Valley Cluster require proper consideration since the demand-supply gap is the largest among clusters.
2.C.2.6 Container Volume
The total 2010 outbound domestic and laden container traffic is estimated at 1.2 million TEU or 11.1 million tonnes in terms of weight. The total inbound domestic and laden container in the same year is 1.3 million TEU or 15.5 million tonnes in terms of weight. This traffic volume is projected to increase 2.9 times in coming 17 years. Table 2.C.12 shows the share by cluster of origin of outbound container and destination of inbound container in each target year.
Table 2.C.12 Share of Inbound Container and Outbound Container by Cluster
Inbound Container Outbound Container
Destination Origin
2010 2017 2027 2010 2017 2027
Centre 70% 70% 70% 82% 82% 82%
Nile Delta 24% 23% 23% 18% 18% 18%
Nile Valley 6% 6% 6% 0% 0% 0%
Red Sea 0% 0% 0% 0% 0% 0%
Sinai 0% 0% 0% 0% 0% 0%
Matrouh 0% 0% 0% 0% 0% 0%
New Valley 0% 0% 0% 0% 0% 0% Source: JICA Study Team
As noted, both the destination and origin of international container traffic are concentrated at the Centre Cluster: roughly 70% of destinations and 82% of origins. This high-demand cluster is followed by the Nile Delta Cluster (principally Alexandria, Port Said and Suez). The forecast laden container traffic is shown in Table 2.C.13.

MiNTS: Misr National Transport Study Technical Report 10
A - 45
Table 2.C.13 Container Traffic Volume Projection by Port
Unit: ‘000 TEU per year 2010 2027
Inbound Outbound Total Inbound Outbound Total
Port Total 1,125 1,071 2,196 2,152 2,168 4,320
Port Said Nile Delta 139 260 399 409 527 936
Suez Nile Delta 0 0 0 0 0 0
Damietta Nile Delta 108 147 254 317 296 614
Alexandria Nile Delta 699 495 1,193 898 1,001 1,899
El-Sohna Suez 169 152 320 497 307 804
Adabiya Suez 11 18 29 31 36 68
Safaga Red Sea 0 0 0 0 0 0 Source: JICA Study Team
Container traffic between the Mediterranean ports and Center Cluster will increase almost 2.6 times over the MiNTS planning horizon, accounting for almost 80% of the total container traffic volume. It is noted that the total volume of inbound containers is roughly the same as outbound containers. The difference between both is considered as the volume of empty containers. Although the freight volume of empty containers is counted as zero, their impact on road traffic (particularly heavy commercial vehicles) is nevertheless pronounced.
It is predicted that the future volume of inbound containers (import) will grow faster than that of outbound containers. This implies an increase in the number of empty containers moving mainly between the Centre Cluster direction Nile Delta (coastal) cluster.
Containerized goods are the most valuable of transported goods. Thus, transport choice is highly sensitive to externalities such as unit rates, quality of service and transport efficiency. In the case of re-export products in outbound container transport efficiency may be considered as the determining factor of competitiveness and profit of the shipper.
2.C.2.7 Summary of Cargo Volume Growth Rate by Cluster
Table 2.C.14 summarizes the annual growth of the total cargo volume by cargo type and by cluster.
Table 2.C.14 Growth of Cargo Volume by Cluster in CAGR
Average Annual Rate of Growth 2010-2027 Cluster Production Export Import Consumption
Center 4.9% 0.0% 0.0% 4.4%
Nile Delta 4.7% 6.0% 7.3% 4.6%
Nile Valley 3.0% 0.0% 0.0% 4.6%
Red Sea 1.4% 4.2% 7.1% 6.7%
Sinai 3.8% 0.0% 0.0% 5.3%
Matrouh 4.6% 0.0% 0.0% 7.4%
New Valley 2.8% 0.0% 0.0% 8.4%
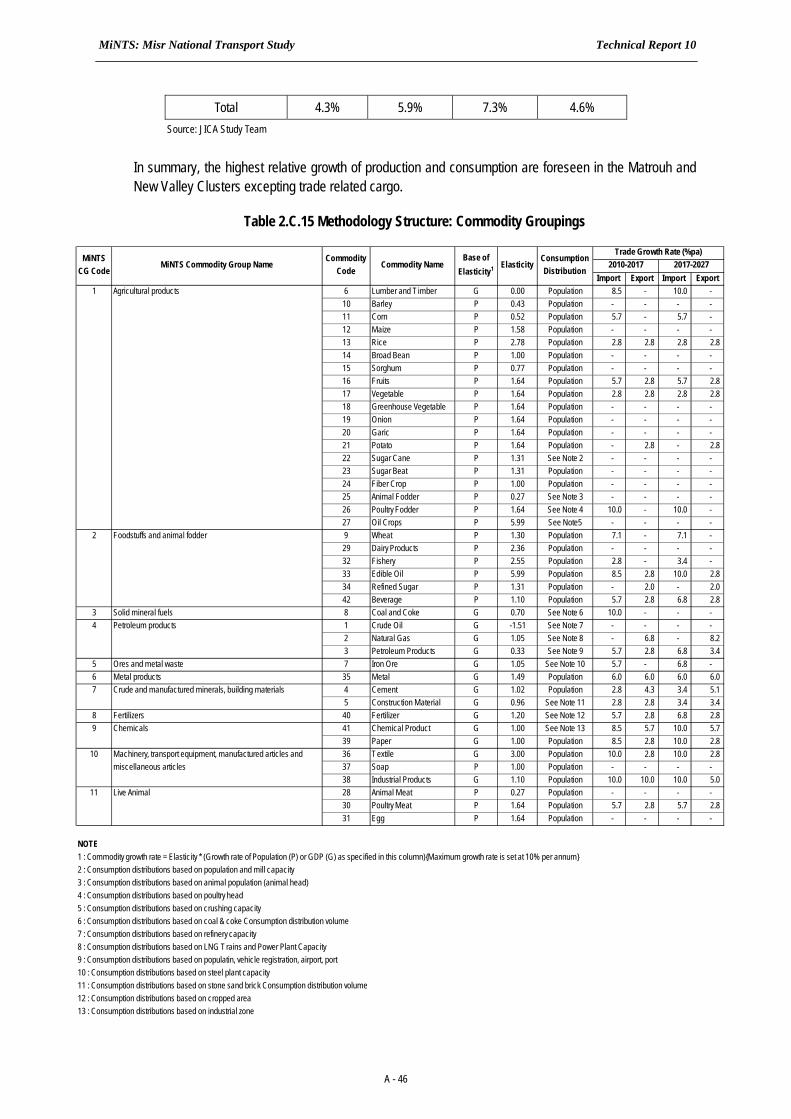
MiNTS: Misr National Transport Study Technical Report 10
A - 46
Total 4.3% 5.9% 7.3% 4.6% Source: JICA Study Team
In summary, the highest relative growth of production and consumption are foreseen in the Matrouh and New Valley Clusters excepting trade related cargo.
Table 2.C.15 Methodology Structure: Commodity Groupings
Import Export Import Export6 Lumber and T imber G 0.00 Population 8.5 - 10.0 - 10 Barley P 0.43 Population - - - - 11 Corn P 0.52 Population 5.7 - 5.7 - 12 Maize P 1.58 Population - - - - 13 Rice P 2.78 Population 2.8 2.8 2.8 2.8 14 Broad Bean P 1.00 Population - - - - 15 Sorghum P 0.77 Population - - - - 16 Fruits P 1.64 Population 5.7 2.8 5.7 2.8 17 Vegetable P 1.64 Population 2.8 2.8 2.8 2.8 18 Greenhouse Vegetable P 1.64 Population - - - - 19 Onion P 1.64 Population - - - - 20 Garic P 1.64 Population - - - - 21 Potato P 1.64 Population - 2.8 - 2.8 22 Sugar Cane P 1.31 See Note 2 - - - - 23 Sugar Beat P 1.31 Population - - - - 24 Fiber Crop P 1.00 Population - - - - 25 Animal Fodder P 0.27 See Note 3 - - - - 26 Poultry Fodder P 1.64 See Note 4 10.0 - 10.0 - 27 Oil Crops P 5.99 See Note5 - - - - 9 Wheat P 1.30 Population 7.1 - 7.1 - 29 Dairy Products P 2.36 Population - - - - 32 Fishery P 2.55 Population 2.8 - 3.4 - 33 Edible Oil P 5.99 Population 8.5 2.8 10.0 2.8 34 Refined Sugar P 1.31 Population - 2.0 - 2.0 42 Beverage P 1.10 Population 5.7 2.8 6.8 2.8
3 Solid mineral fuels 8 Coal and Coke G 0.70 See Note 6 10.0 - - - 1 Crude Oil G -1.51 See Note 7 - - - - 2 Natural Gas G 1.05 See Note 8 - 6.8 - 8.2 3 Petroleum Products G 0.33 See Note 9 5.7 2.8 6.8 3.4
5 Ores and metal waste 7 Iron Ore G 1.05 See Note 10 5.7 - 6.8 - 6 Metal products 35 Metal G 1.49 Population 6.0 6.0 6.0 6.0
4 Cement G 1.02 Population 2.8 4.3 3.4 5.1 5 Construction Material G 0.96 See Note 11 2.8 2.8 3.4 3.4
8 Fertilizers 40 Fertilizer G 1.20 See Note 12 5.7 2.8 6.8 2.8 41 Chemical Product G 1.00 See Note 13 8.5 5.7 10.0 5.7 39 Paper G 1.00 Population 8.5 2.8 10.0 2.8 36 Textile G 3.00 Population 10.0 2.8 10.0 2.8 37 Soap P 1.00 Population - - - - 38 Industrial Products G 1.10 Population 10.0 10.0 10.0 5.0 28 Animal Meat P 0.27 Population - - - - 30 Poultry Meat P 1.64 Population 5.7 2.8 5.7 2.8 31 Egg P 1.64 Population - - - -
NOTE1 : Commodity growth rate = Elasticity * (Growth rate of Population (P) or GDP (G) as specified in this column){Maximum growth rate is set at 10% per annum}2 : Consumption distributions based on population and mill capacity3 : Consumption distributions based on animal population (animal head)4 : Consumption distributions based on poultry head5 : Consumption distributions based on crushing capacity6 : Consumption distributions based on coal & coke Consumption distribution volume7 : Consumption distributions based on refinery capacity8 : Consumption distributions based on LNG Trains and Power Plant Capacity9 : Consumption distributions based on populatin, vehicle registration, airport, port10 : Consumption distributions based on steel plant capacity11 : Consumption distributions based on stone sand brick Consumption distribution volume12 : Consumption distributions based on cropped area13 : Consumption distributions based on industrial zone
11 Live Animal
7 Crude and manufactured minerals, building materials
9 Chemicals
10 Machinery, transport equipment, manufactured articles andmiscellaneous articles
Agricultural products1
2 Foodstuffs and animal fodder
4 Petroleum products
MiNTSCG Code
MiNTS Commodity Group NameCommodity
CodeCommodity Name
ConsumptionDistribution
Trade Growth Rate (%pa)2010-2017 2017-2027
Base ofElasticity1 Elasticity
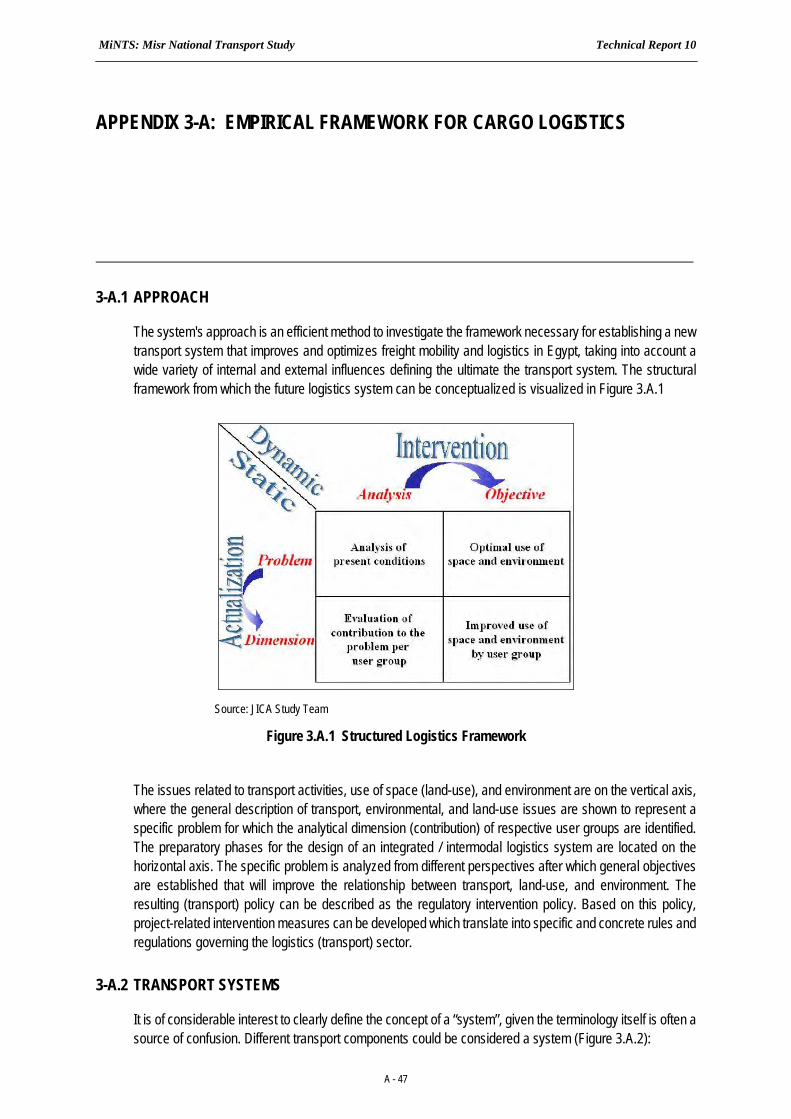
MiNTS: Misr National Transport Study Technical Report 10
A - 47
APPENDIX 3-A: EMPIRICAL FRAMEWORK FOR CARGO LOGISTICS
3-A.1 APPROACH
The system's approach is an efficient method to investigate the framework necessary for establishing a new transport system that improves and optimizes freight mobility and logistics in Egypt, taking into account a wide variety of internal and external influences defining the ultimate the transport system. The structural framework from which the future logistics system can be conceptualized is visualized in Figure 3.A.1
Source: JICA Study Team
Figure 3.A.1 Structured Logistics Framework
The issues related to transport activities, use of space (land-use), and environment are on the vertical axis, where the general description of transport, environmental, and land-use issues are shown to represent a specific problem for which the analytical dimension (contribution) of respective user groups are identified. The preparatory phases for the design of an integrated / intermodal logistics system are located on the horizontal axis. The specific problem is analyzed from different perspectives after which general objectives are established that will improve the relationship between transport, land-use, and environment. The resulting (transport) policy can be described as the regulatory intervention policy. Based on this policy, project-related intervention measures can be developed which translate into specific and concrete rules and regulations governing the logistics (transport) sector.
3-A.2 TRANSPORT SYSTEMS
It is of considerable interest to clearly define the concept of a “system”, given the terminology itself is often a source of confusion. Different transport components could be considered a system (Figure 3.A.2):

MiNTS: Misr National Transport Study Technical Report 10
A - 48
Source: JICA Study Team
Figure 3.A.2 Transport Systems and Networks
• The transport system relates to the transport network and the way vehicles are running on the network. It is the overall combination of infrastructure hardware and the way it is used by a variety of users;
• The user system is the way each individual transport user utilizes the transport system. These users can be the private sector, public authorities or the population;
• The applied system specifically refers to the way the users manage their logistics and mobility needs, and includes two sub-systems: (a) the management system is the way interaction with the other users are managed; and, (b) the operational system which represents the total set of transport actions that are necessary to move freight from origin to destination; and,
• The information system refers to the technical, technological, and working conditions of the exchange of information, both internal and external to the applied system.
These systems interact and influence each other at different levels and with different intensities. Consequently, there are interactions among more than one transport system, and for each transport system there exist more than one sub-system that inter-relate internally and externally.
Given the existence of different interacting transport systems, it is imperative to assimilate freight transport into the global transport framework to further structure the "freight transport system" to a set of transport interactions and inter-relations. A useful approach to conceptualize and structure in a comprehensive manner interactions and inter-relations is visualized in Figure 3.A.3.
The overall transport system is defined according to two dimensions:
• The geographical dimension (international and domestic; city and intercity); and,
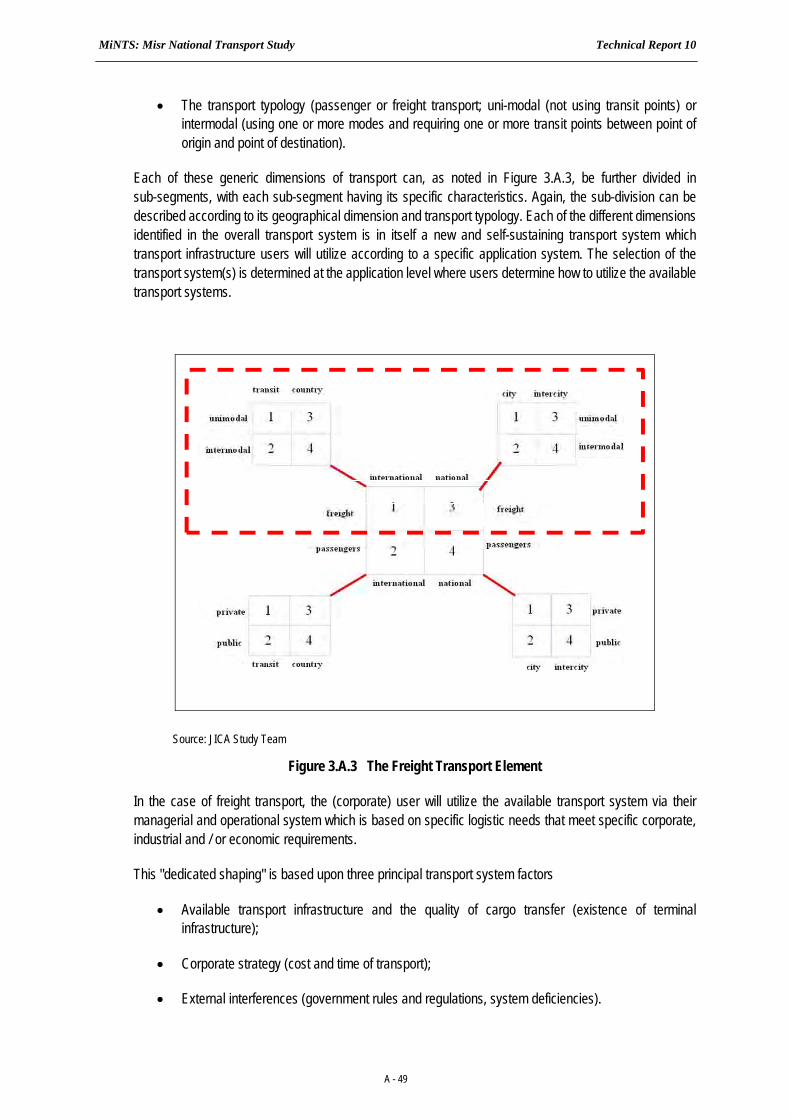
MiNTS: Misr National Transport Study Technical Report 10
A - 49
• The transport typology (passenger or freight transport; uni-modal (not using transit points) or intermodal (using one or more modes and requiring one or more transit points between point of origin and point of destination).
Each of these generic dimensions of transport can, as noted in Figure 3.A.3, be further divided in sub-segments, with each sub-segment having its specific characteristics. Again, the sub-division can be described according to its geographical dimension and transport typology. Each of the different dimensions identified in the overall transport system is in itself a new and self-sustaining transport system which transport infrastructure users will utilize according to a specific application system. The selection of the transport system(s) is determined at the application level where users determine how to utilize the available transport systems.
Source: JICA Study Team
Figure 3.A.3 The Freight Transport Element
In the case of freight transport, the (corporate) user will utilize the available transport system via their managerial and operational system which is based on specific logistic needs that meet specific corporate, industrial and / or economic requirements.
This "dedicated shaping" is based upon three principal transport system factors
• Available transport infrastructure and the quality of cargo transfer (existence of terminal infrastructure);
• Corporate strategy (cost and time of transport);
• External interferences (government rules and regulations, system deficiencies).
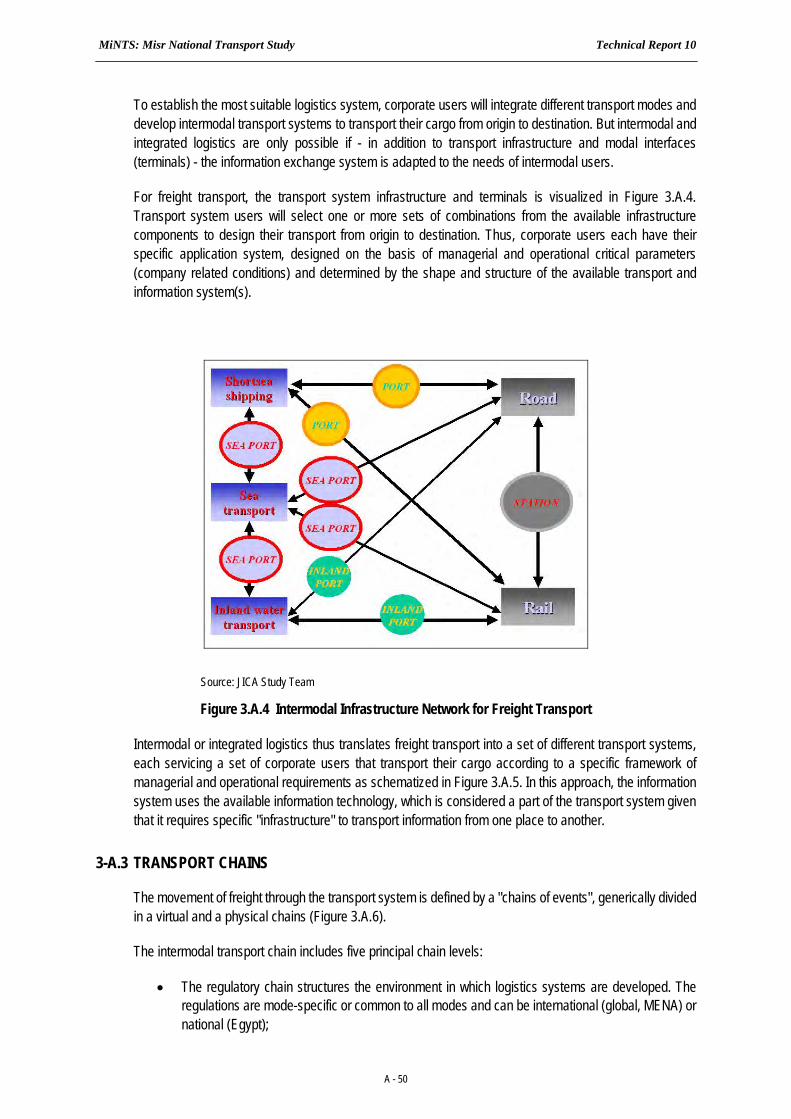
MiNTS: Misr National Transport Study Technical Report 10
A - 50
To establish the most suitable logistics system, corporate users will integrate different transport modes and develop intermodal transport systems to transport their cargo from origin to destination. But intermodal and integrated logistics are only possible if - in addition to transport infrastructure and modal interfaces (terminals) - the information exchange system is adapted to the needs of intermodal users.
For freight transport, the transport system infrastructure and terminals is visualized in Figure 3.A.4. Transport system users will select one or more sets of combinations from the available infrastructure components to design their transport from origin to destination. Thus, corporate users each have their specific application system, designed on the basis of managerial and operational critical parameters (company related conditions) and determined by the shape and structure of the available transport and information system(s).
Source: JICA Study Team
Figure 3.A.4 Intermodal Infrastructure Network for Freight Transport
Intermodal or integrated logistics thus translates freight transport into a set of different transport systems, each servicing a set of corporate users that transport their cargo according to a specific framework of managerial and operational requirements as schematized in Figure 3.A.5. In this approach, the information system uses the available information technology, which is considered a part of the transport system given that it requires specific "infrastructure" to transport information from one place to another.
3-A.3 TRANSPORT CHAINS
The movement of freight through the transport system is defined by a "chains of events", generically divided in a virtual and a physical chains (Figure 3.A.6).
The intermodal transport chain includes five principal chain levels:
• The regulatory chain structures the environment in which logistics systems are developed. The regulations are mode-specific or common to all modes and can be international (global, MENA) or national (Egypt);
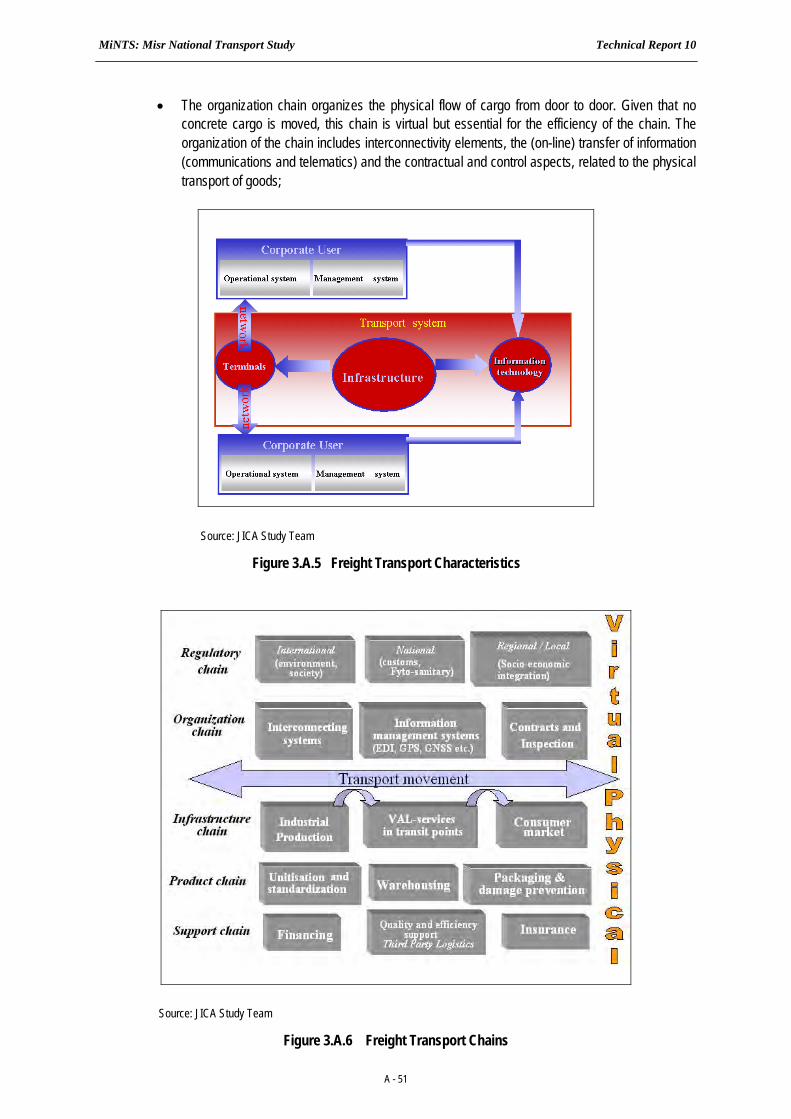
MiNTS: Misr National Transport Study Technical Report 10
A - 51
• The organization chain organizes the physical flow of cargo from door to door. Given that no concrete cargo is moved, this chain is virtual but essential for the efficiency of the chain. The organization of the chain includes interconnectivity elements, the (on-line) transfer of information (communications and telematics) and the contractual and control aspects, related to the physical transport of goods;
Source: JICA Study Team
Figure 3.A.5 Freight Transport Characteristics
Source: JICA Study Team
Figure 3.A.6 Freight Transport Chains

MiNTS: Misr National Transport Study Technical Report 10
A - 52
• The physical chain is the level where the cargo is transported. The chain originates at the production level (supply chain transport) and leads to the final destination (final distribution). The transport can be uni-modal or intermodal. To enable the physical transport of goods, there is a concrete need for infrastructure related to both the physical transport of goods and the virtual transport of the accompanying information;
• The product handling and control chain is an important aspect of intermodal logistics efficiency. Increased efforts towards standardization and unitization as well as more complex requirements of the packaging material, including the prevention of damage make this an important aspect of logistics; and,
• The service chain, supporting the concrete realization of the physical transport. On the one hand, there is the financing and assurance sector where complex logistics requirements generate the need for innovative techniques and concepts. On the other hand, there is the continuous expansion of logistics integration in the industrial processes (outsourcing non-core business) that created a new sector of third party logistics.
In general, the virtual chain relates to what could be described as controlling events in which information and management systems play an important role. The physical chain relates to the infrastructure and all unit and cargo handling activities that enable the physical movement of cargo through the transport system. One particular chain is the support chain, which is a mixture of the virtual chain (financing and insurance) and the physical chain (third party logistics). Although in its most pure form, the freight movement chain could be conceptualized without considering this chain of events, it can also be included to integrate in the evaluation the increasing importance of these elements to execute transport activities.
3-A.4 SERVICE PRINCIPLES
Analyzing intermodal transport from a commercial perspective offers the best opportunity to evaluate the needs and requirements for developing intermodal transport. Seen from a commercial perspective, achieving efficient (intermodal) transport is a complex process of integration and cooperation. The intermodal transport and integrated logistics trends in the freight transport market generate new opportunities for increasing competitiveness, but new attitudes and organizational changes are required to be successful (Figure 3.A.7). This shift in attitude is also needed to meet the new trends in manufacturing industry and changes in the attitudes of multi-national manufacturing firms (the globalization trend). A shift can be identified towards more complicated and tailor-made transport concepts where the emphasis is on value added services rather than the physical transport component. If intermodal transport is to be successful, it must develop structures that meet not only the requirements of the customer, but also take into account a continuously changing transport environment.

MiNTS: Misr National Transport Study Technical Report 10
A - 53
In order to provide an attractive transport service, competitive to the flexible and “reliable” road haulage service, intermodal transport needs to concentrate on four structural elements: managerial, operational, technological and marketing (Figure 3.A.8).
CUSTOMER REQUIREMENTS
MANAGERIALSTRUCTURE
OPERATIONALSTRUCTURE
MARKETINGSTRUCTURE
TECHNOLOGICALSTRUCTURE
Source: JICA Study Team
Figure 3.A.8 Commercial Elements for Intermodal Network Development
The fact that intermodal transport chains do not have the flexibility of road haulage, the available operational structure in the network should be adapted in such a way that a wide variety of customer-oriented (value added) services could be provided that compensate the need for additional handling operations. The required operational structure of intermodal networks should simultaneously provide in-time-services (to compete with the time advantage of road haulage) and storage / commodity treatment facilities (to provide value added services).
Intermodal
Unimodal
Focus on individuallinkages
Focus on door-to-door transportchains
Source: JICA Study Team
Figure 3.A.7 Requirements of Increased Competitiveness
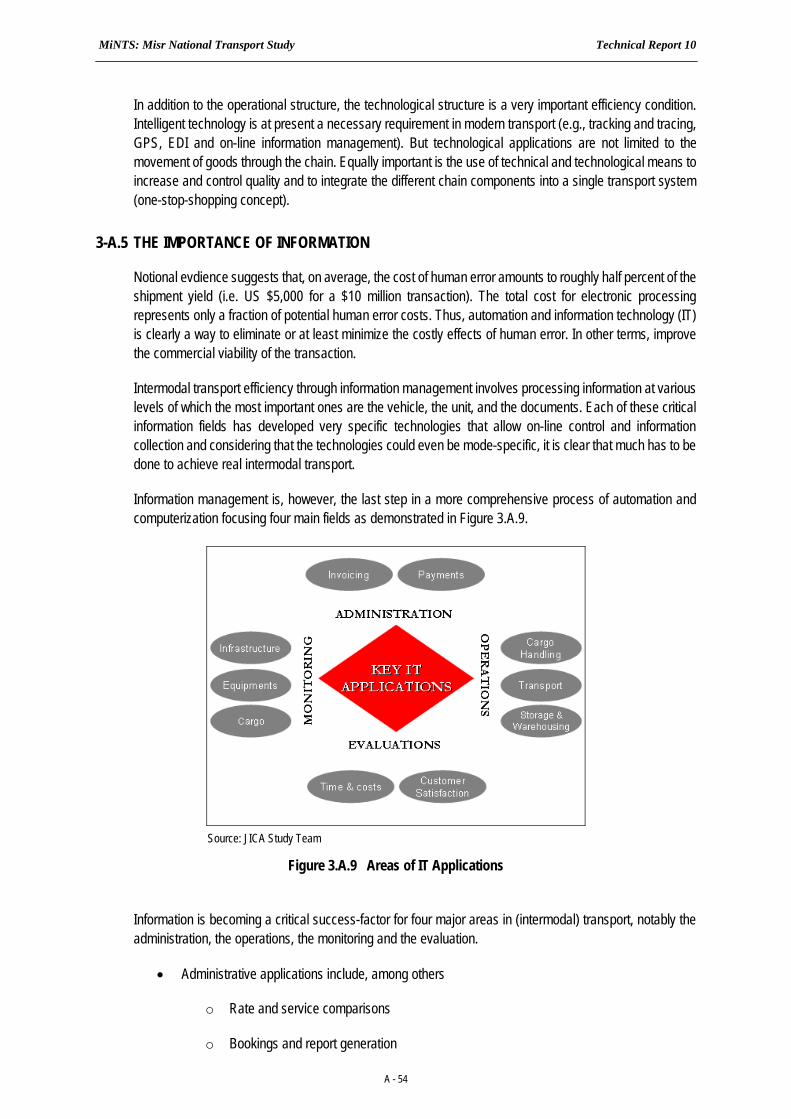
MiNTS: Misr National Transport Study Technical Report 10
A - 54
In addition to the operational structure, the technological structure is a very important efficiency condition. Intelligent technology is at present a necessary requirement in modern transport (e.g., tracking and tracing, GPS, EDI and on-line information management). But technological applications are not limited to the movement of goods through the chain. Equally important is the use of technical and technological means to increase and control quality and to integrate the different chain components into a single transport system (one-stop-shopping concept).
3-A.5 THE IMPORTANCE OF INFORMATION
Notional evdience suggests that, on average, the cost of human error amounts to roughly half percent of the shipment yield (i.e. US $5,000 for a $10 million transaction). The total cost for electronic processing represents only a fraction of potential human error costs. Thus, automation and information technology (IT) is clearly a way to eliminate or at least minimize the costly effects of human error. In other terms, improve the commercial viability of the transaction.
Intermodal transport efficiency through information management involves processing information at various levels of which the most important ones are the vehicle, the unit, and the documents. Each of these critical information fields has developed very specific technologies that allow on-line control and information collection and considering that the technologies could even be mode-specific, it is clear that much has to be done to achieve real intermodal transport.
Information management is, however, the last step in a more comprehensive process of automation and computerization focusing four main fields as demonstrated in Figure 3.A.9.
Source: JICA Study Team
Figure 3.A.9 Areas of IT Applications
Information is becoming a critical success-factor for four major areas in (intermodal) transport, notably the administration, the operations, the monitoring and the evaluation.
• Administrative applications include, among others
o Rate and service comparisons
o Bookings and report generation
MiNTS: Misr National Transport Study Technical Report 10
A - 55
o Documentation management
o Budgeting and cost management
o Customs and other controls
• Operational applications are, among others
o Optimal routing (road)
o Cargo control and protection against theft (containers)
o Temperature control and picking orders (warehousing)
o Container positioning (terminals)
o Sequence control (terminals)
• Monitoring applications include
o Tracking and tracing of cargo and transportation units (all modes, ULIs, etc… via GPS)
o Asset management (identification and positioning of railcars)
o Gate control (terminals)
• Evaluations include
o Throughput of cargo in terminals
o Dwell time of cargo in warehouses
o Loading and discharging time of cargo
o Transportation times and costs
IT and automation thus have many application fields and the list is constantly growing. This ensures that IT is embedded as a cornerstone of commercial multimodal operations.

MiNTS: Misr National Transport Study Technical Report 10
A - 56
APPENDIX 3-B: NATIONAL PLANS AND PROGRAMS
Development planning has, in the Egyptian context, been conducted within the framework of a series of rolling five year plans, with the most recent 6th five-year plan addressing the period between years 2007/08 and 2011/12. In addition to the five year plans, which reflect tactical allocations of national resources, a longer-term strategy has also been formulated.
The General Organization for Physical Planning (GOPP) was established in 1973 as the national organization under the Ministry of Housing, Utilities and New Communities responsible for physical planning in Egypt at the regional, provincial, urban and rural levels. The GOPP has a key mission to propose physical and urban development policies and supervise the implementation in coordination with all relevant authorities at the national, regional and local levels. The GOPP is also mandated to establish norms and standards for industrial and urban agglomerations and develop sustained technical advice, training and human resource management to local governments.
3-B.1 EGYPT VISION 2017
As a legislative framework for the regional development planning in Egypt, the Physical Planning Law No. 3/1982 was established to stipulate the contents, presentation procedures and accreditation of general and detailed plans, land subdivisions and district renewals, as well as expropriations and penalties for violations. Based on the legal framework, the GOPP launched a number of regional development plans with the target year at 2017 such as: 1) Development Map of Egypt 2017; 2) Development Strategy of Sinai 2017; 3) Delta Region Development Plan; 4) Development Strategy of Upper Egypt Region; 5) Suez Canal Regional Development Plan; 6) Development Strategy of Assiut Region; 7) Establishment of a National Hazardous Waste management System; and 8) Greater Cairo Master Plan.
The Egyptian government’s Vision 2017 document outlines its longer term development goals to be achieved over a period of two decades beginning in 1997. These goals focus on economic growth, reduction of poverty, full employment, the enhanced well-being of the population (with emphasis on education), access to family planning, improved maternal and child health care, population redistribution, environmental protection and management of natural resources. The Government of Egypt's programmatic approach includes, for example:
• Accelerated and steady economic growth led by the private sector: GDP average annual growth rates were targeted at 6.8 % during the period 1997-2002, and 7.6 % during the years 2003-2017; total GDP is expected to increase 4.3 times from LE 256 billion in 1996 to LE 1,100 billion by 2017. Growth of the private sector would be enhanced through accelerated investments and increased privatization of state-owned enterprises and government services.
• Population growth was targeted to decrease from the current level of 1.8 % to 1.2 % per year in 2017, or an average annual rate of 1.53 %; hence, Egypt’s total population is expected to increase from 59 million in 1996 to 80 million in 2017.
The main indicators and targets, proposed by the Egyptian government, are shown in Table 3.B.1.
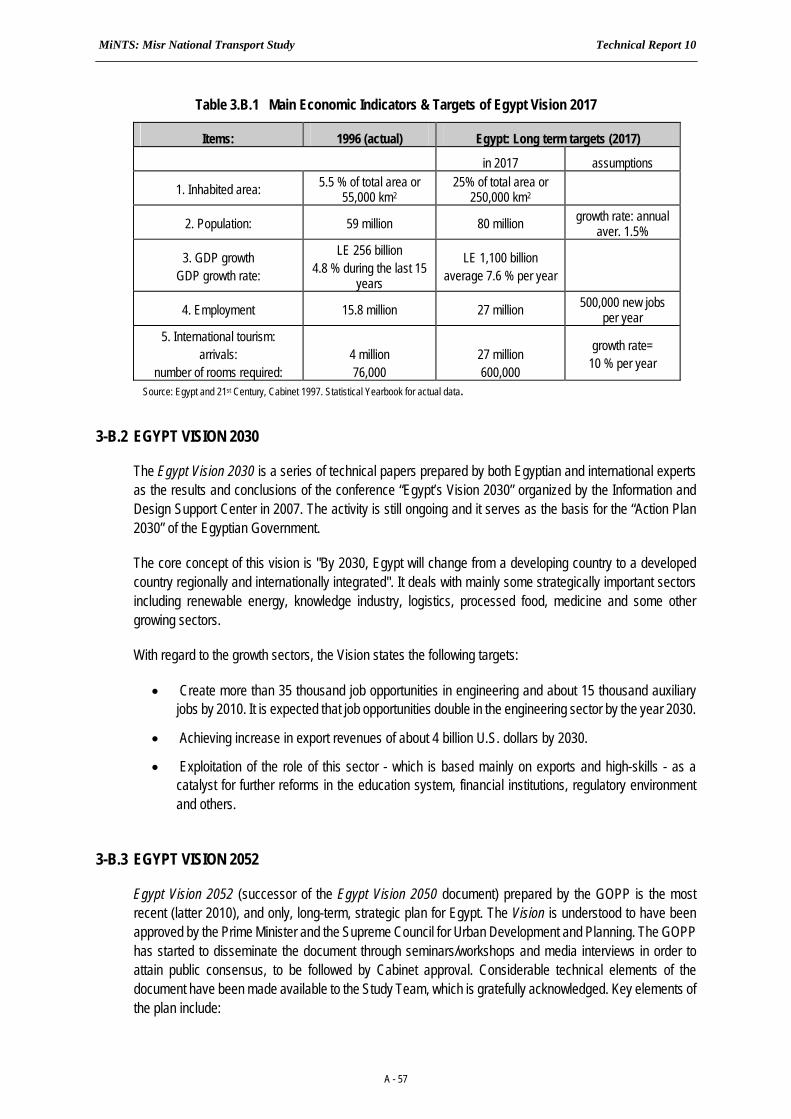
MiNTS: Misr National Transport Study Technical Report 10
A - 57
Table 3.B.1 Main Economic Indicators & Targets of Egypt Vision 2017
Items: 1996 (actual) Egypt: Long term targets (2017)
in 2017 assumptions
1. Inhabited area: 5.5 % of total area or 55,000 km2
25% of total area or 250,000 km2
2. Population: 59 million 80 million growth rate: annual aver. 1.5%
3. GDP growth GDP growth rate:
LE 256 billion 4.8 % during the last 15
years
LE 1,100 billion average 7.6 % per year
4. Employment 15.8 million 27 million 500,000 new jobs per year
5. International tourism: arrivals:
number of rooms required:
4 million 76,000
27 million 600,000
growth rate= 10 % per year
Source: Egypt and 21st Century, Cabinet 1997. Statistical Yearbook for actual data.
3-B.2 EGYPT VISION 2030
The Egypt Vision 2030 is a series of technical papers prepared by both Egyptian and international experts as the results and conclusions of the conference “Egypt’s Vision 2030” organized by the Information and Design Support Center in 2007. The activity is still ongoing and it serves as the basis for the “Action Plan 2030” of the Egyptian Government.
The core concept of this vision is "By 2030, Egypt will change from a developing country to a developed country regionally and internationally integrated". It deals with mainly some strategically important sectors including renewable energy, knowledge industry, logistics, processed food, medicine and some other growing sectors.
With regard to the growth sectors, the Vision states the following targets:
• Create more than 35 thousand job opportunities in engineering and about 15 thousand auxiliary jobs by 2010. It is expected that job opportunities double in the engineering sector by the year 2030.
• Achieving increase in export revenues of about 4 billion U.S. dollars by 2030.
• Exploitation of the role of this sector - which is based mainly on exports and high-skills - as a catalyst for further reforms in the education system, financial institutions, regulatory environment and others.
3-B.3 EGYPT VISION 2052
Egypt Vision 2052 (successor of the Egypt Vision 2050 document) prepared by the GOPP is the most recent (latter 2010), and only, long-term, strategic plan for Egypt. The Vision is understood to have been approved by the Prime Minister and the Supreme Council for Urban Development and Planning. The GOPP has started to disseminate the document through seminars/workshops and media interviews in order to attain public consensus, to be followed by Cabinet approval. Considerable technical elements of the document have been made available to the Study Team, which is gratefully acknowledged. Key elements of the plan include:
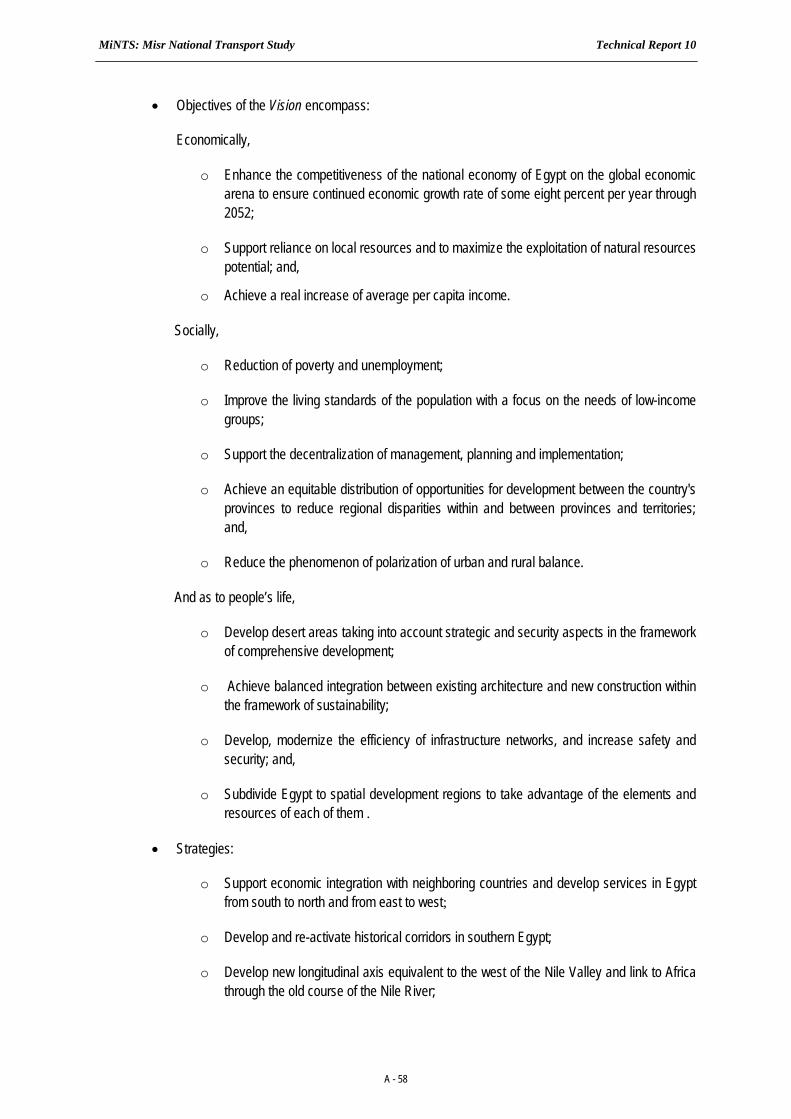
MiNTS: Misr National Transport Study Technical Report 10
A - 58
• Objectives of the Vision encompass:
Economically,
o Enhance the competitiveness of the national economy of Egypt on the global economic arena to ensure continued economic growth rate of some eight percent per year through 2052;
o Support reliance on local resources and to maximize the exploitation of natural resources potential; and,
o Achieve a real increase of average per capita income.
Socially,
o Reduction of poverty and unemployment;
o Improve the living standards of the population with a focus on the needs of low-income groups;
o Support the decentralization of management, planning and implementation;
o Achieve an equitable distribution of opportunities for development between the country's provinces to reduce regional disparities within and between provinces and territories; and,
o Reduce the phenomenon of polarization of urban and rural balance.
And as to people’s life,
o Develop desert areas taking into account strategic and security aspects in the framework of comprehensive development;
o Achieve balanced integration between existing architecture and new construction within the framework of sustainability;
o Develop, modernize the efficiency of infrastructure networks, and increase safety and security; and,
o Subdivide Egypt to spatial development regions to take advantage of the elements and resources of each of them .
• Strategies:
o Support economic integration with neighboring countries and develop services in Egypt from south to north and from east to west;
o Develop and re-activate historical corridors in southern Egypt;
o Develop new longitudinal axis equivalent to the west of the Nile Valley and link to Africa through the old course of the Nile River;
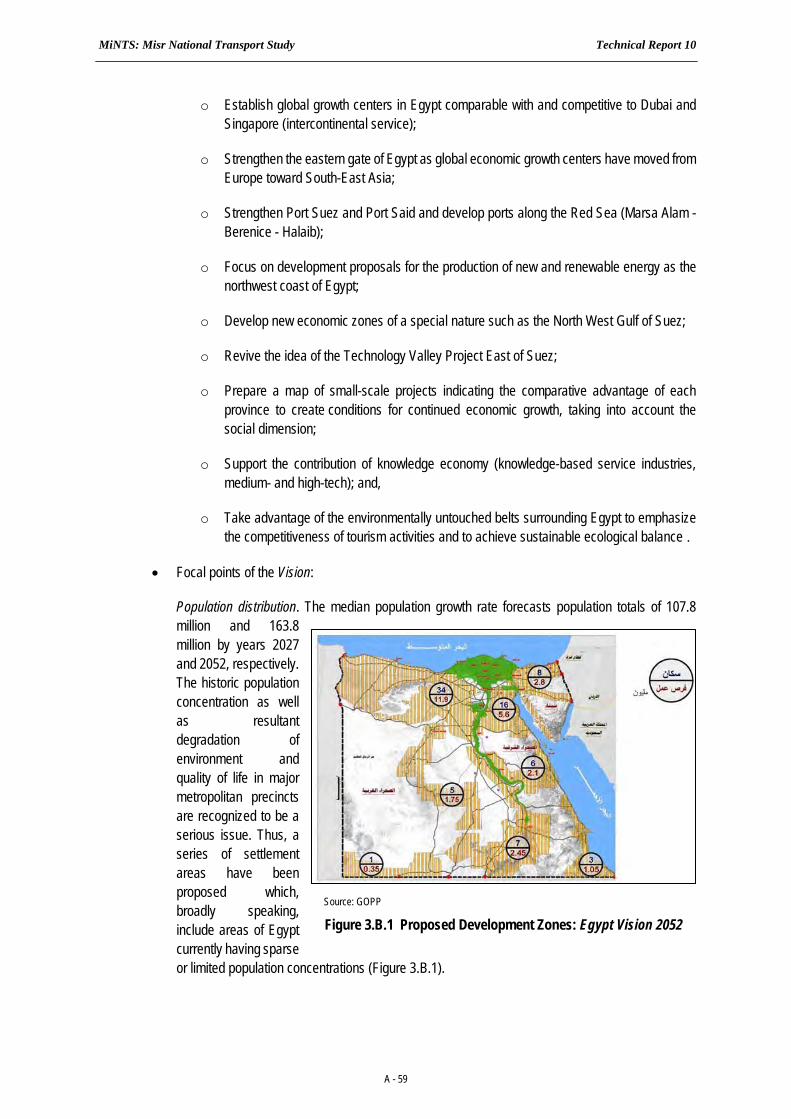
MiNTS: Misr National Transport Study Technical Report 10
A - 59
o Establish global growth centers in Egypt comparable with and competitive to Dubai and Singapore (intercontinental service);
o Strengthen the eastern gate of Egypt as global economic growth centers have moved from Europe toward South-East Asia;
o Strengthen Port Suez and Port Said and develop ports along the Red Sea (Marsa Alam - Berenice - Halaib);
o Focus on development proposals for the production of new and renewable energy as the northwest coast of Egypt;
o Develop new economic zones of a special nature such as the North West Gulf of Suez;
o Revive the idea of the Technology Valley Project East of Suez;
o Prepare a map of small-scale projects indicating the comparative advantage of each province to create conditions for continued economic growth, taking into account the social dimension;
o Support the contribution of knowledge economy (knowledge-based service industries, medium- and high-tech); and,
o Take advantage of the environmentally untouched belts surrounding Egypt to emphasize the competitiveness of tourism activities and to achieve sustainable ecological balance .
• Focal points of the Vision:
Population distribution. The median population growth rate forecasts population totals of 107.8 million and 163.8 million by years 2027 and 2052, respectively. The historic population concentration as well as resultant degradation of environment and quality of life in major metropolitan precincts are recognized to be a serious issue. Thus, a series of settlement areas have been proposed which, broadly speaking, include areas of Egypt currently having sparse or limited population concentrations (Figure 3.B.1).
Source: GOPP
Figure 3.B.1 Proposed Development Zones: Egypt Vision 2052
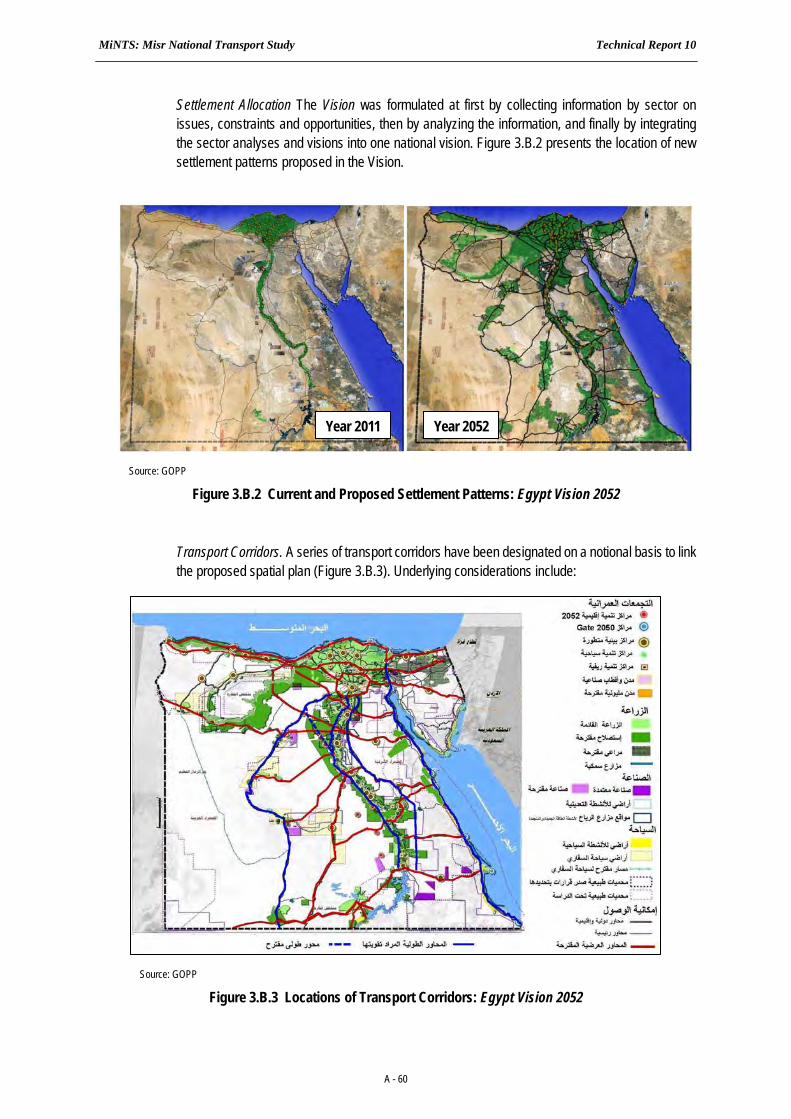
MiNTS: Misr National Transport Study Technical Report 10
A - 60
Settlement Allocation The Vision was formulated at first by collecting information by sector on issues, constraints and opportunities, then by analyzing the information, and finally by integrating the sector analyses and visions into one national vision. Figure 3.B.2 presents the location of new settlement patterns proposed in the Vision.
Transport Corridors. A series of transport corridors have been designated on a notional basis to link the proposed spatial plan (Figure 3.B.3). Underlying considerations include:
Source: GOPP
Figure 3.B.2 Current and Proposed Settlement Patterns: Egypt Vision 2052
Year 2011 Year 2052
Source: GOPP
Figure 3.B.3 Locations of Transport Corridors: Egypt Vision 2052
MiNTS: Misr National Transport Study Technical Report 10
A - 61
• Roads
o Revival of the historic linkages through Western desert;
o Linking the provinces of Upper Egypt and the Red Sea with a network of cross roads;
o Transport facilities across the Gulf of Suez and the Gulf of Aqaba to revive the land movement between the eastern and western parts; and,
o Provide a secure and advanced facilities for the movement of passengers and goods, and the development of new urban communities.
• Railway
o Update the national network of railways and the introduction of high-speed trains;
o Linking Egypt to North Africa by fast rail;
o Revival of the Orient Express after the settlement of the Palestinian issue;
o Increase private sector participation in the field of services of the railway; and,
o Raise the efficiency of the infrastructure of the railway network, and improve trains with new specifications to extend services to international transportation .
• Air Transport
o Development of domestic airports and increase of operation efficiency;
o Encourage the private sector to invest in air transport (airport services); and,
o Airports to increase the share of transit traffic .
• River Transport
o Raise efficiency of the waterway network and invest on the channels of the River Nile and its branches taking advantage of the natural condition in an economical way .
• Maritime Transport
o Expansion of seaport facilities such as storage, refrigeration, loading and unloading;
o Enhance competitiveness of the Suez Canal to accommodate the growth in world trade;
o Development of Red Sea and the Mediterranean Sea, and the establishment of new ports for accommodating new activities; and,
o Development of Egyptian ports on the international shipping routes in order to enhance the competitiveness of foreign trade and access to global markets.
3-B.4 PREVIOUS 5TH 5-YEAR PLAN (2002/03 – 2006/07)
The previous 5th 5-Year Plan (2002/02 – 2006/07) projected an average annual growth rate of 6.2% for the national economy. However, the economic performance did not follow a steady trend due to unfavorable economic and political circumstances in the early years, and the realized rate was 5.5% for the entire 5-year planning period. Even in this period, some sectors achieved higher growth rates than the planned goals; tourism (19.8% actual vs 9.0% planned), natural gas (15.8% vs 4.8%), Suez Canal (15.4% vs 2.7%), communication & IT (10.8% vs 6.0%), construction & building (8.7% vs 6.7%), and so on.

MiNTS: Misr National Transport Study Technical Report 10
A - 62
With regard to transportation, actual investment has reached more than LE 14 billion exceeding the initially planned investment of about LE 8 billion. This is, however, due to the implementation of extra works and cost overrun. The major achievements of this sector are summarized in Table 3.B.2. It is noted that a vast investment was made in this period for water transport (river + maritime). The amount was about LE 6 billion, exceeding land transport (road, bridge + railway).
Table 3.B.2 Investment in Transport Sector during the 5th 5-Year Plan
Subsector A. Targeted B. Achieved
B/A
(%)
Road and Bridge
- construction of main/regional road network (km) 2,500 2,691 108
- improvement of existing roads (km) 914 1,214 133
- development of city/urban roads (km) 12,000 11,082 92
- construction of high bridges for car (no.) 21 15 71
Bridge over the Nile
- construction of new bridge (no.) 7 phased 30
- completion of new bridge (no.) 3 3 100
Railway
- renovation of track (km) 1,000 600 60
- upgrading passenger car (no.) 300 300 100
- upgrading station (no.) 40 31 78
- completion of Suez – Al Adabia line (no.) 1 1 100
- completion of Ismailia – Rafah line (km) 225 37 16
River Transport
- upgrading navigation channels of the Nile (km) 1,200 783 65
Maritime Transport
- expansion of maritime port capacity (million tons) 75 73 97
Air Transport
- expansion of passenger terminal capacity of int’l airports (000 pax) - 16 -
- expansion of aircraft fleet (no.) - 14 -
Suez Canal
- deepening of navigation canal (from 62 to 66 feet) - - 100
- berth development - - -
Underground Transport
- completion of the 5th phase of the second metro line - - 100
- completion of 2 Al Azhar tunnels - - 100
- car tunnel (no.) 3 3 100
- new Cairo tunnel (no.) 3 3 100
- 1st phase of Alexandria metro regional line (21.5km) - postponed - Source: 6th 5-year Plan
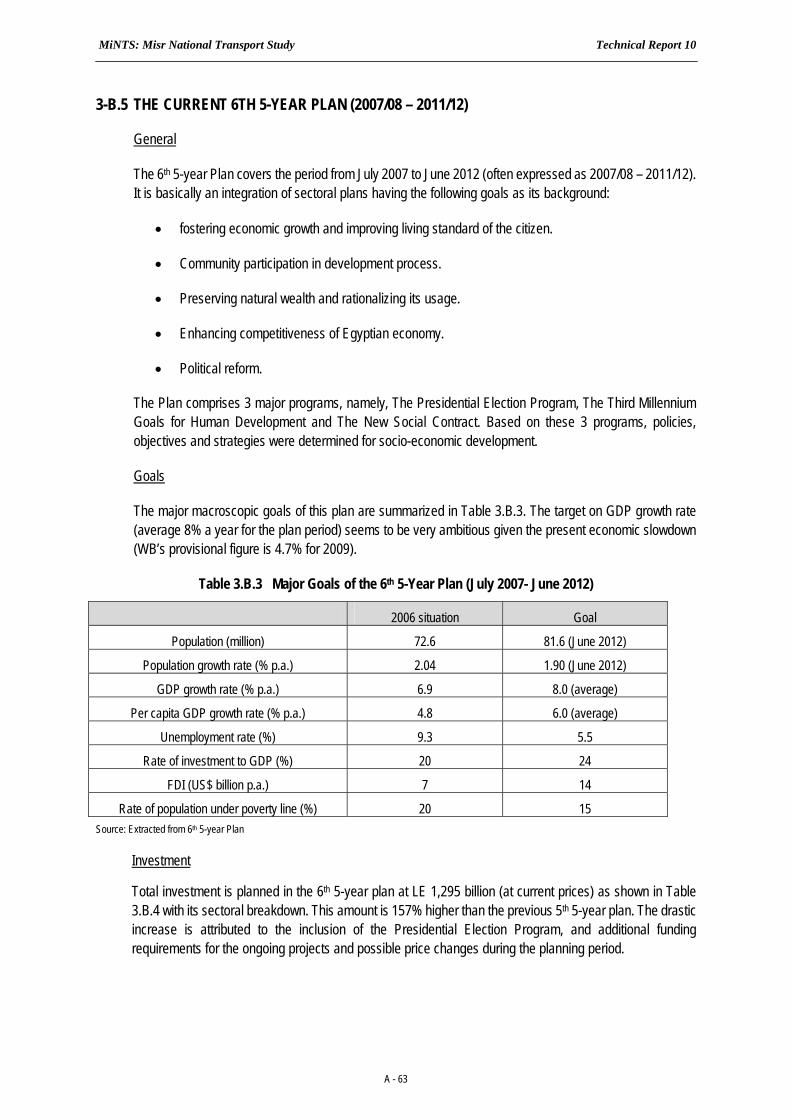
MiNTS: Misr National Transport Study Technical Report 10
A - 63
3-B.5 THE CURRENT 6TH 5-YEAR PLAN (2007/08 – 2011/12)
General
The 6th 5-year Plan covers the period from July 2007 to June 2012 (often expressed as 2007/08 – 2011/12). It is basically an integration of sectoral plans having the following goals as its background:
• fostering economic growth and improving living standard of the citizen.
• Community participation in development process.
• Preserving natural wealth and rationalizing its usage.
• Enhancing competitiveness of Egyptian economy.
• Political reform.
The Plan comprises 3 major programs, namely, The Presidential Election Program, The Third Millennium Goals for Human Development and The New Social Contract. Based on these 3 programs, policies, objectives and strategies were determined for socio-economic development.
Goals
The major macroscopic goals of this plan are summarized in Table 3.B.3. The target on GDP growth rate (average 8% a year for the plan period) seems to be very ambitious given the present economic slowdown (WB’s provisional figure is 4.7% for 2009).
Table 3.B.3 Major Goals of the 6th 5-Year Plan (July 2007- June 2012)
2006 situation Goal
Population (million) 72.6 81.6 (June 2012)
Population growth rate (% p.a.) 2.04 1.90 (June 2012)
GDP growth rate (% p.a.) 6.9 8.0 (average)
Per capita GDP growth rate (% p.a.) 4.8 6.0 (average)
Unemployment rate (%) 9.3 5.5
Rate of investment to GDP (%) 20 24
FDI (US$ billion p.a.) 7 14
Rate of population under poverty line (%) 20 15 Source: Extracted from 6th 5-year Plan
Investment
Total investment is planned in the 6th 5-year plan at LE 1,295 billion (at current prices) as shown in Table 3.B.4 with its sectoral breakdown. This amount is 157% higher than the previous 5th 5-year plan. The drastic increase is attributed to the inclusion of the Presidential Election Program, and additional funding requirements for the ongoing projects and possible price changes during the planning period.
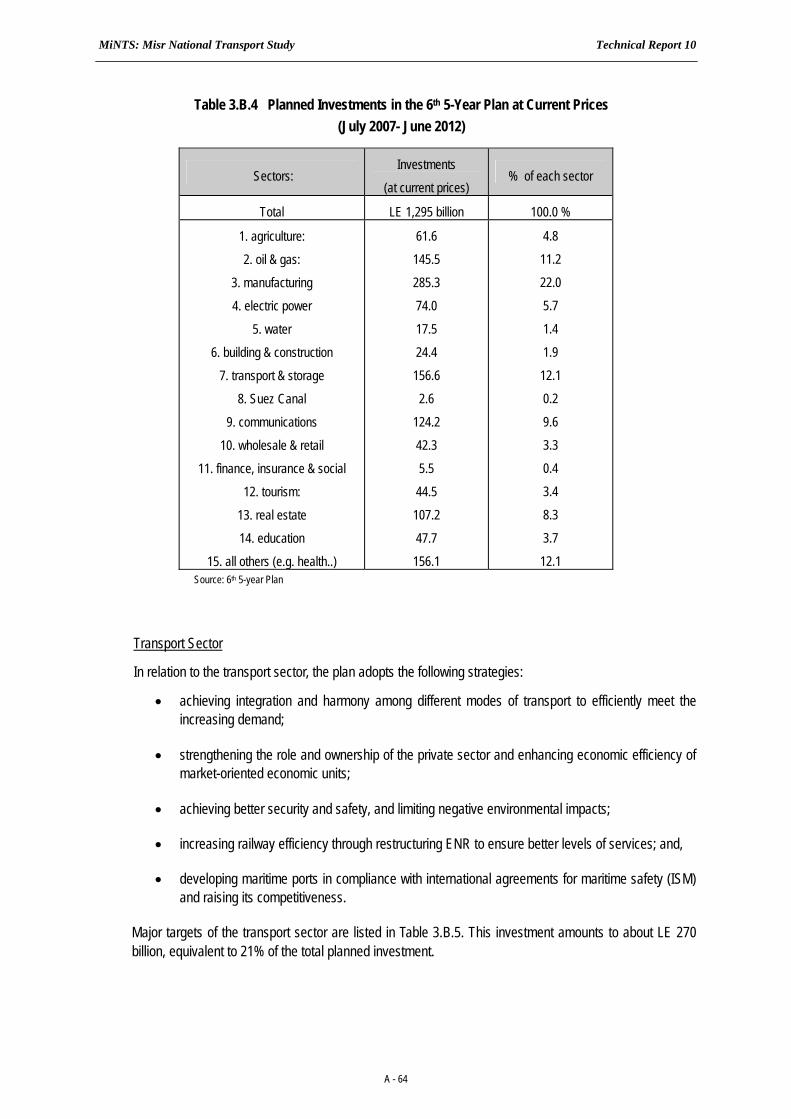
MiNTS: Misr National Transport Study Technical Report 10
A - 64
Table 3.B.4 Planned Investments in the 6th 5-Year Plan at Current Prices (July 2007- June 2012)
Sectors: Investments
(at current prices) % of each sector
Total LE 1,295 billion 100.0 %
1. agriculture:
2. oil & gas:
3. manufacturing
4. electric power
5. water
6. building & construction
7. transport & storage
8. Suez Canal
9. communications
10. wholesale & retail
11. finance, insurance & social
12. tourism:
13. real estate
14. education
15. all others (e.g. health..)
61.6
145.5
285.3
74.0
17.5
24.4
156.6
2.6
124.2
42.3
5.5
44.5
107.2
47.7
156.1
4.8
11.2
22.0
5.7
1.4
1.9
12.1
0.2
9.6
3.3
0.4
3.4
8.3
3.7
12.1 Source: 6th 5-year Plan
Transport Sector
In relation to the transport sector, the plan adopts the following strategies:
• achieving integration and harmony among different modes of transport to efficiently meet the increasing demand;
• strengthening the role and ownership of the private sector and enhancing economic efficiency of market-oriented economic units;
• achieving better security and safety, and limiting negative environmental impacts;
• increasing railway efficiency through restructuring ENR to ensure better levels of services; and,
• developing maritime ports in compliance with international agreements for maritime safety (ISM) and raising its competitiveness.
Major targets of the transport sector are listed in Table 3.B.5. This investment amounts to about LE 270 billion, equivalent to 21% of the total planned investment.
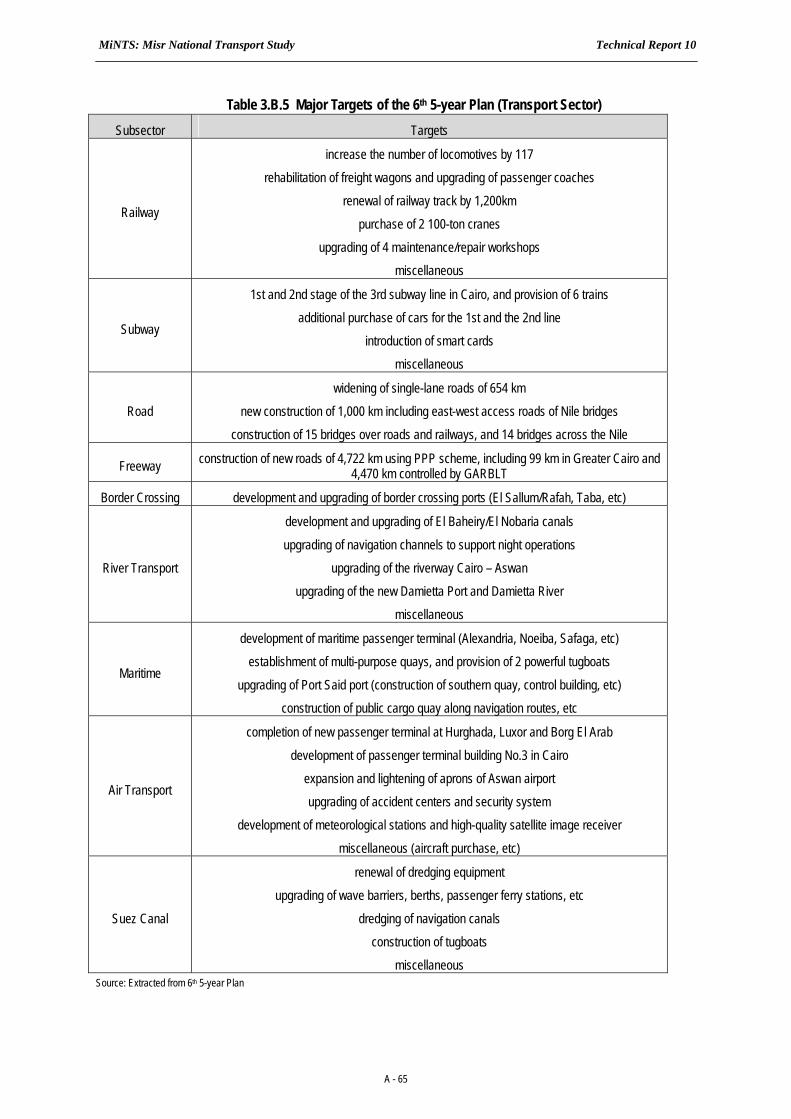
MiNTS: Misr National Transport Study Technical Report 10
A - 65
Table 3.B.5 Major Targets of the 6th 5-year Plan (Transport Sector) Subsector Targets
Railway
increase the number of locomotives by 117
rehabilitation of freight wagons and upgrading of passenger coaches
renewal of railway track by 1,200km
purchase of 2 100-ton cranes
upgrading of 4 maintenance/repair workshops
miscellaneous
Subway
1st and 2nd stage of the 3rd subway line in Cairo, and provision of 6 trains
additional purchase of cars for the 1st and the 2nd line
introduction of smart cards
miscellaneous
Road
widening of single-lane roads of 654 km
new construction of 1,000 km including east-west access roads of Nile bridges
construction of 15 bridges over roads and railways, and 14 bridges across the Nile
Freeway construction of new roads of 4,722 km using PPP scheme, including 99 km in Greater Cairo and 4,470 km controlled by GARBLT
Border Crossing development and upgrading of border crossing ports (El Sallum/Rafah, Taba, etc)
River Transport
development and upgrading of El Baheiry/El Nobaria canals
upgrading of navigation channels to support night operations
upgrading of the riverway Cairo – Aswan
upgrading of the new Damietta Port and Damietta River
miscellaneous
Maritime
development of maritime passenger terminal (Alexandria, Noeiba, Safaga, etc)
establishment of multi-purpose quays, and provision of 2 powerful tugboats
upgrading of Port Said port (construction of southern quay, control building, etc)
construction of public cargo quay along navigation routes, etc
Air Transport
completion of new passenger terminal at Hurghada, Luxor and Borg El Arab
development of passenger terminal building No.3 in Cairo
expansion and lightening of aprons of Aswan airport
upgrading of accident centers and security system
development of meteorological stations and high-quality satellite image receiver
miscellaneous (aircraft purchase, etc)
Suez Canal
renewal of dredging equipment
upgrading of wave barriers, berths, passenger ferry stations, etc
dredging of navigation canals
construction of tugboats
miscellaneous Source: Extracted from 6th 5-year Plan
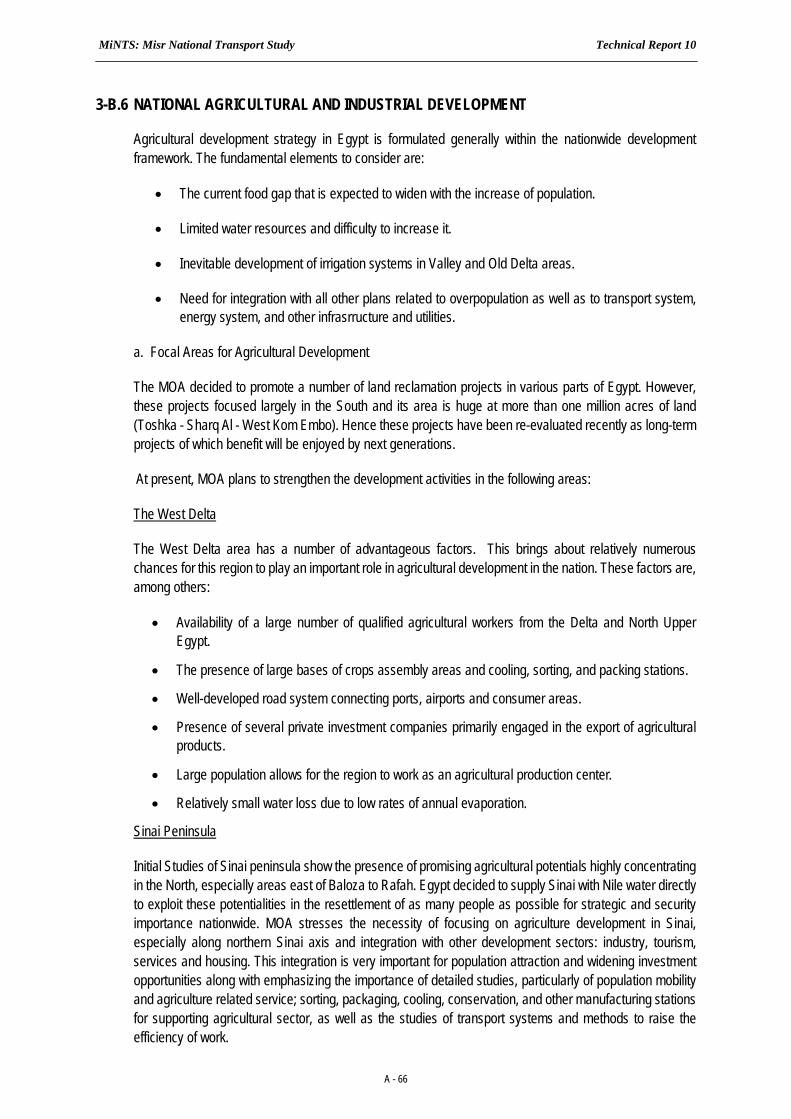
MiNTS: Misr National Transport Study Technical Report 10
A - 66
3-B.6 NATIONAL AGRICULTURAL AND INDUSTRIAL DEVELOPMENT
Agricultural development strategy in Egypt is formulated generally within the nationwide development framework. The fundamental elements to consider are:
• The current food gap that is expected to widen with the increase of population.
• Limited water resources and difficulty to increase it.
• Inevitable development of irrigation systems in Valley and Old Delta areas.
• Need for integration with all other plans related to overpopulation as well as to transport system, energy system, and other infrasrructure and utilities.
a. Focal Areas for Agricultural Development
The MOA decided to promote a number of land reclamation projects in various parts of Egypt. However, these projects focused largely in the South and its area is huge at more than one million acres of land (Toshka - Sharq Al - West Kom Embo). Hence these projects have been re-evaluated recently as long-term projects of which benefit will be enjoyed by next generations.
At present, MOA plans to strengthen the development activities in the following areas:
The West Delta
The West Delta area has a number of advantageous factors. This brings about relatively numerous chances for this region to play an important role in agricultural development in the nation. These factors are, among others:
• Availability of a large number of qualified agricultural workers from the Delta and North Upper Egypt.
• The presence of large bases of crops assembly areas and cooling, sorting, and packing stations.
• Well-developed road system connecting ports, airports and consumer areas.
• Presence of several private investment companies primarily engaged in the export of agricultural products.
• Large population allows for the region to work as an agricultural production center.
• Relatively small water loss due to low rates of annual evaporation.
Sinai Peninsula
Initial Studies of Sinai peninsula show the presence of promising agricultural potentials highly concentrating in the North, especially areas east of Baloza to Rafah. Egypt decided to supply Sinai with Nile water directly to exploit these potentialities in the resettlement of as many people as possible for strategic and security importance nationwide. MOA stresses the necessity of focusing on agriculture development in Sinai, especially along northern Sinai axis and integration with other development sectors: industry, tourism, services and housing. This integration is very important for population attraction and widening investment opportunities along with emphasizing the importance of detailed studies, particularly of population mobility and agriculture related service; sorting, packaging, cooling, conservation, and other manufacturing stations for supporting agricultural sector, as well as the studies of transport systems and methods to raise the efficiency of work.

MiNTS: Misr National Transport Study Technical Report 10
A - 67
The Oases
The Oases are promising areas. It should be pointed out that these areas are very distinguished in terms of agricultural due to fresh significant water availability in addition to its climate and being qualified to relatively early production than other areas. Moreover, these areas have significant advantage of having unspoiled land, water or air which qualify it for organic cultivation and production of basic crops for export to European countries in particular. These oases vary significantly in their relative advantages due to its wide geographical distribution and varying characteristics, which can be used to diversify crops and to expand export throughout the year.
East Owaynat and Toshka
Area of east Owaynat is one of the promising areas for agriculture due to the similarity to the Oases like water abundance. Furthermore, the area is characterized by clean air and excellent soil of early production leading to export opportunities. However, the area lacks population, manpower and supporting facilities.
As for Toshka, the project must be fully studied in detail to overcome obstacles hindering the project and to accelerate the successful implementation. Some of the points that need attention are:
• Study how to provide manpower for the project.
• Provide means of access directly to the project area.
• Provide support to agriculture; sorting, packing, and cooling stations as well as establishing a base for agriculture industry.
• Strengthen soil studies to efficiently implement the project.
a. Current Development Directions
Figure 3.B.5 shows the current agricultural development plan of MOA.
As illustrated clearly, the current directions of agricultural development are: the West Delta, the northern coast of the Sinai Peninsula, the Oases and so on. In terms of production density, the West Delta would be the focus of agricultural development at present and, presumably, in the near future.
b. Future Vision
Sustainable development is essential also in the agriculture sector. In Egypt, this sustainability issue is closely and directly related to water availability. The key points are:
• Egypt's share of Nile water is 55.5 billion cubic meters and this will not increase in the near future.
• Aquifers available in the West Delta and the Oases are non-renewable. These aquifers will run out some time which threatens the continuity of development in these areas.
• Therefore the MOA decided to initiate irrigation development project in the West Delta to preserve what has been done to reclaim the lands of this region. It is needed to improve irrigation in the rest of the West Delta up to the north at what is known as Hamam Canal as well as Nubariya and Bostan on Cairo-Alexandria Desert Road.
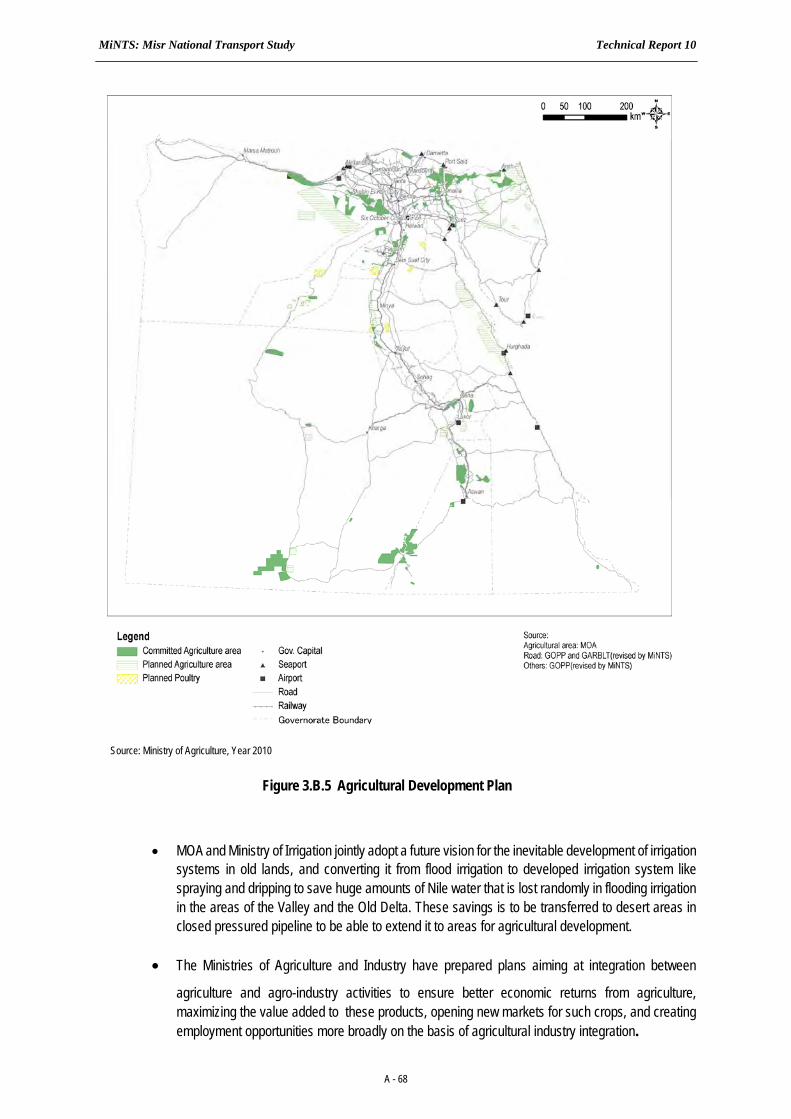
MiNTS: Misr National Transport Study Technical Report 10
A - 68
• MOA and Ministry of Irrigation jointly adopt a future vision for the inevitable development of irrigation systems in old lands, and converting it from flood irrigation to developed irrigation system like spraying and dripping to save huge amounts of Nile water that is lost randomly in flooding irrigation in the areas of the Valley and the Old Delta. These savings is to be transferred to desert areas in closed pressured pipeline to be able to extend it to areas for agricultural development.
• The Ministries of Agriculture and Industry have prepared plans aiming at integration between
agriculture and agro-industry activities to ensure better economic returns from agriculture, maximizing the value added to these products, opening new markets for such crops, and creating employment opportunities more broadly on the basis of agricultural industry integration.
Source: Ministry of Agriculture, Year 2010
Figure 3.B.5 Agricultural Development Plan
MiNTS: Misr National Transport Study Technical Report 10
A - 69
3-B.7 INDUSTRIAL DEVELOPMENT
a. Long-Term Industrial Development Strategy
The Ministry of Industry set forth the following strategies:
• Focusing on promising activities, mainly engineering, electrical, food processing, chemicals, pharmaceuticals, textiles, wood and building materials.
• Enhancing new industries, such as motor-feeding industries, electronic industries, medical equipment, generic engineering and bio-technology.
• Adopting new industrial development approaches based on developing industrial parks and clusters.
• Provision of industrial regions equipped with utilities and services for industrial investments in Upper Egypt governorates and new desert regions in particular.
• Encouraging investment in the field of industry by creating a proper investment climate to attract capital in various activities, through increased incentives and reduced financial burden.
• Spatial re-distribution of industries by motivating locating in new cities, and making use of capabilities of new regions in Upper Egypt, New Valley, North-eastern Coast and Sinai.
• Increasing industrial export competitiveness by providing thorough studies on external markets and export incentives.
• Continued restructuring of Egyptian industry, giving due attention to intermediate industries linked to large establishments.
• Developing specialized training and education systems in line with labor market requirements, through establishing the Education Quality Assurance Authority and improving current training centers and technology transfer centers.
• Activating industrial modernization programs and enhancing the role of the General Authority for Industrial Development.
• Establishing local technology base to achieve Industrial Renaissance, improving research centers to create national technology and adapting imported techniques to domestic conditions, and attracting transnational corporations to invest in Egypt.
• Deepening local manufacturing of capital goods, modernizing databases, improving systems of engineering designs, and consolidating R & D centers.
b. Targets of the 6th 5-Year Plan
While the long-term strategies listed above are macroscopic and ambiguous to some extent, the 6th 5-Year Plan states the short-term targets more quantitatively, viz:
• Establishing 885 large factories, constructing and expanding 1850 medium-size factories in accordance with the Presidential Election Program.
• Increasing manufacturing output at a real growth rate of 7.9% during the 2007/08 plan, and at a real compound growth rate of 8.8% during the Plan period.
• Providing 530 thousand job opportunities, of which 150 thousand within the first year, reaching a total of 3 million workers by the end of the Plan.
• Increasing industrial exports by 20% annually, to reach an absolute value of LE 42 billion by the

MiNTS: Misr National Transport Study Technical Report 10
A - 70
end of the Plan period.
• Achieving spatial balanced industrial development by directing investments toward Upper Egypt governorates.
c. Current Development Directions
Industrial development in Egypt is largely characterized by industrial zones. Various types of industrial zones have been designated, and promotion activities are vigorously undertaken to invite foreign and domestic investment into these industrial zones (Figure 3.B.6). Twelve heavy industrial areas were established under Presidential Decree No. 358 in 2008. Since the location of these areas is far from urban communities, infrastructure is not generally available, although proximity to raw materials is an advantage. The area is about 1.87 million acres representing some 91% of the area of industrial zones in Egypt.
Industrial zones affiliated to governorates Economic zones in Suez
Industrial zones affiliated to new cities East Port Said industrial zone
Industrial free zones affiliated to investment authority
Heavy industries zones
Source: IDA
Figure 3.B.6 Distribution of Industrial Zones
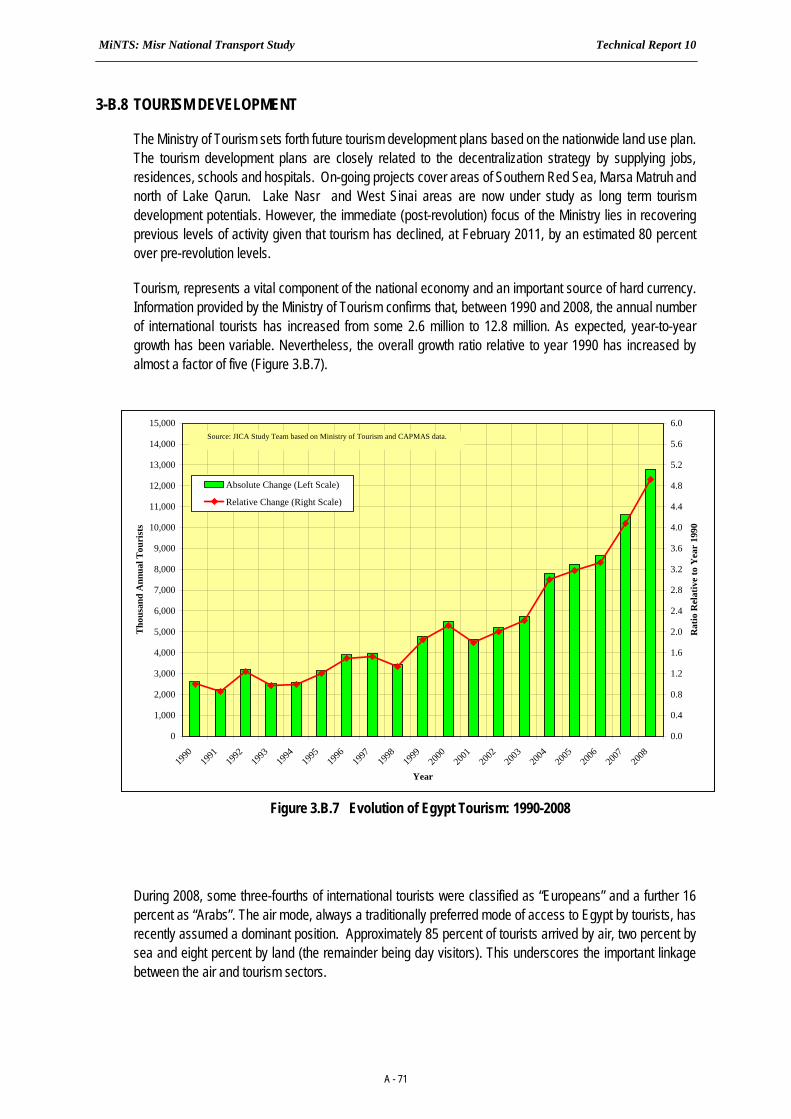
MiNTS: Misr National Transport Study Technical Report 10
A - 71
3-B.8 TOURISM DEVELOPMENT
The Ministry of Tourism sets forth future tourism development plans based on the nationwide land use plan. The tourism development plans are closely related to the decentralization strategy by supplying jobs, residences, schools and hospitals. On-going projects cover areas of Southern Red Sea, Marsa Matruh and north of Lake Qarun. Lake Nasr and West Sinai areas are now under study as long term tourism development potentials. However, the immediate (post-revolution) focus of the Ministry lies in recovering previous levels of activity given that tourism has declined, at February 2011, by an estimated 80 percent over pre-revolution levels.
Tourism, represents a vital component of the national economy and an important source of hard currency. Information provided by the Ministry of Tourism confirms that, between 1990 and 2008, the annual number of international tourists has increased from some 2.6 million to 12.8 million. As expected, year-to-year growth has been variable. Nevertheless, the overall growth ratio relative to year 1990 has increased by almost a factor of five (Figure 3.B.7).
During 2008, some three-fourths of international tourists were classified as “Europeans” and a further 16 percent as “Arabs”. The air mode, always a traditionally preferred mode of access to Egypt by tourists, has recently assumed a dominant position. Approximately 85 percent of tourists arrived by air, two percent by sea and eight percent by land (the remainder being day visitors). This underscores the important linkage between the air and tourism sectors.
0
1,000
2,000
3,000
4,000
5,000
6,000
7,000
8,000
9,000
10,000
11,000
12,000
13,000
14,000
15,000
1990
1991
1992
1993
1994
1995
1996
1997
1998
1999
2000
2001
2002
2003
2004
2005
2006
2007
2008
Year
Tho
usan
d A
nnua
l Tou
rist
s
0.0
0.4
0.8
1.2
1.6
2.0
2.4
2.8
3.2
3.6
4.0
4.4
4.8
5.2
5.6
6.0
Rat
io R
elat
ive
to Y
ear
1990
Absolute Change (Left Scale)
Relative Change (Right Scale)
Source: JICA Study Team based on Ministry of Tourism and CAPMAS data.
Figure 3.B.7 Evolution of Egypt Tourism: 1990-2008
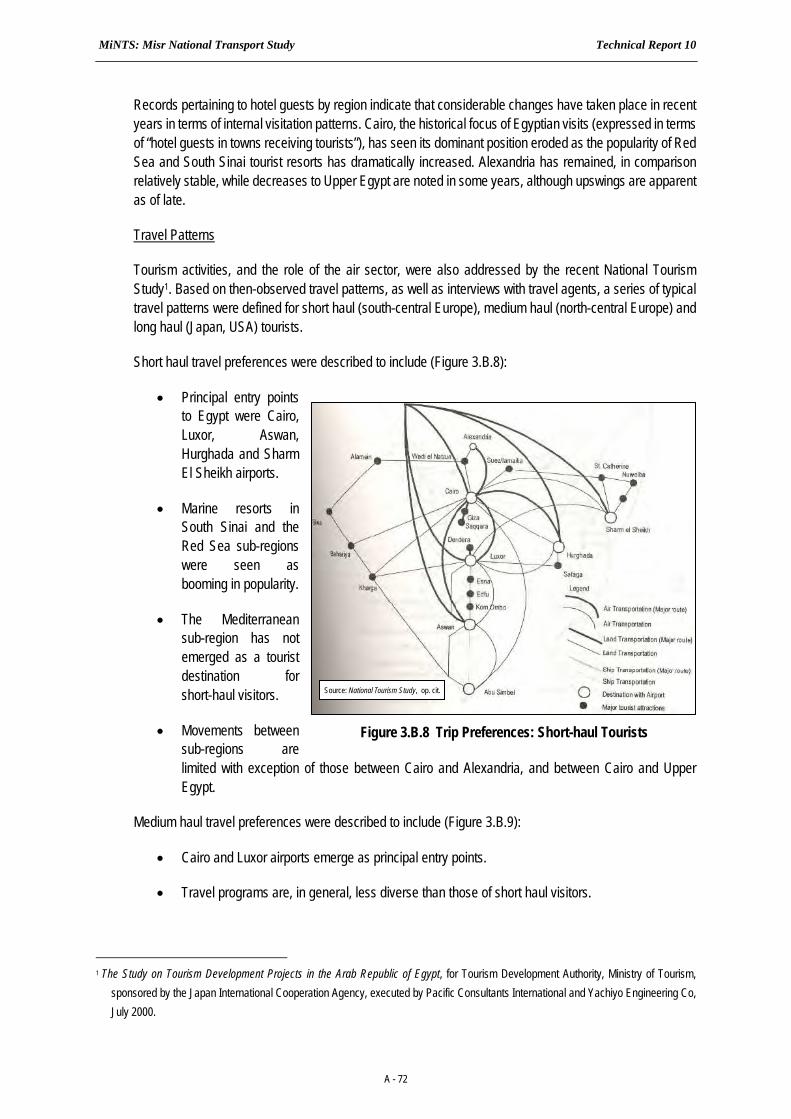
MiNTS: Misr National Transport Study Technical Report 10
A - 72
Records pertaining to hotel guests by region indicate that considerable changes have taken place in recent years in terms of internal visitation patterns. Cairo, the historical focus of Egyptian visits (expressed in terms of “hotel guests in towns receiving tourists”), has seen its dominant position eroded as the popularity of Red Sea and South Sinai tourist resorts has dramatically increased. Alexandria has remained, in comparison relatively stable, while decreases to Upper Egypt are noted in some years, although upswings are apparent as of late.
Travel Patterns
Tourism activities, and the role of the air sector, were also addressed by the recent National Tourism Study1. Based on then-observed travel patterns, as well as interviews with travel agents, a series of typical travel patterns were defined for short haul (south-central Europe), medium haul (north-central Europe) and long haul (Japan, USA) tourists.
Short haul travel preferences were described to include (Figure 3.B.8):
• Principal entry points to Egypt were Cairo, Luxor, Aswan, Hurghada and Sharm El Sheikh airports.
• Marine resorts in South Sinai and the Red Sea sub-regions were seen as booming in popularity.
• The Mediterranean sub-region has not emerged as a tourist destination for short-haul visitors.
• Movements between sub-regions are limited with exception of those between Cairo and Alexandria, and between Cairo and Upper Egypt.
Medium haul travel preferences were described to include (Figure 3.B.9):
• Cairo and Luxor airports emerge as principal entry points.
• Travel programs are, in general, less diverse than those of short haul visitors.
1 The Study on Tourism Development Projects in the Arab Republic of Egypt, for Tourism Development Authority, Ministry of Tourism,
sponsored by the Japan International Cooperation Agency, executed by Pacific Consultants International and Yachiyo Engineering Co, July 2000.
Source: National Tourism Study, op. cit.
Figure 3.B.8 Trip Preferences: Short-haul Tourists
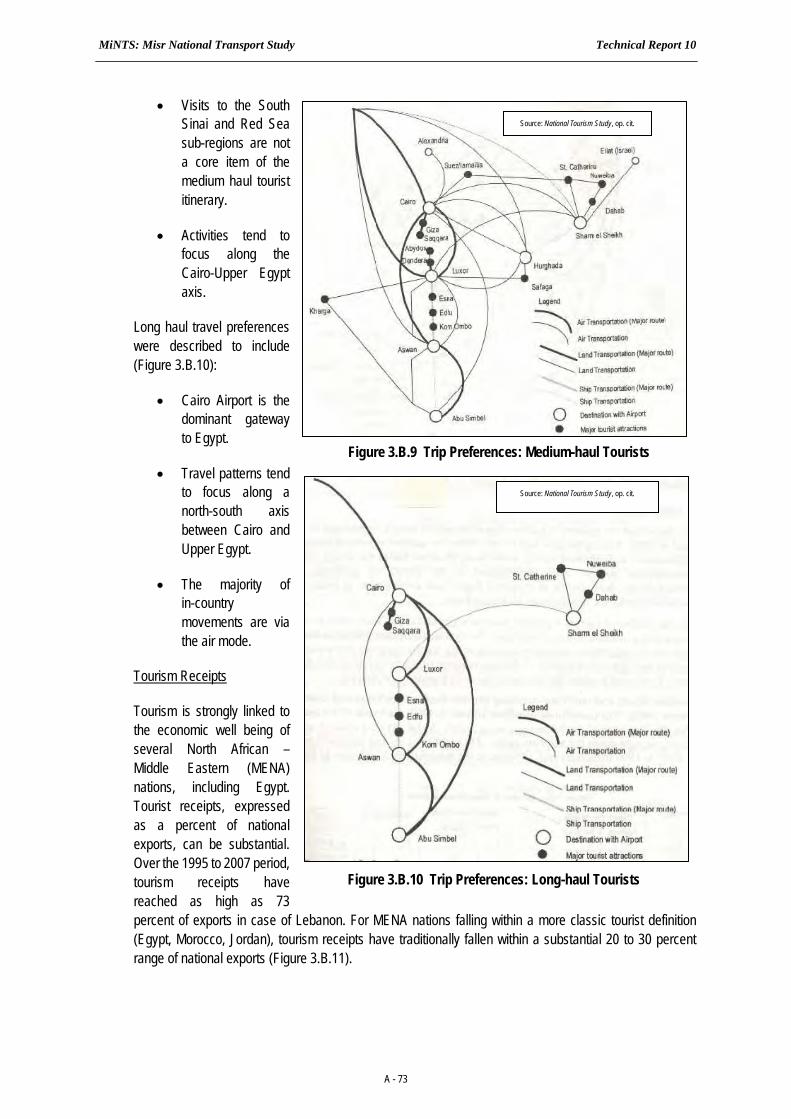
MiNTS: Misr National Transport Study Technical Report 10
A - 73
• Visits to the South Sinai and Red Sea sub-regions are not a core item of the medium haul tourist itinerary.
• Activities tend to focus along the Cairo-Upper Egypt axis.
Long haul travel preferences were described to include (Figure 3.B.10):
• Cairo Airport is the dominant gateway to Egypt.
• Travel patterns tend to focus along a north-south axis between Cairo and Upper Egypt.
• The majority of in-country movements are via the air mode.
Tourism Receipts
Tourism is strongly linked to the economic well being of several North African – Middle Eastern (MENA) nations, including Egypt. Tourist receipts, expressed as a percent of national exports, can be substantial. Over the 1995 to 2007 period, tourism receipts have reached as high as 73 percent of exports in case of Lebanon. For MENA nations falling within a more classic tourist definition (Egypt, Morocco, Jordan), tourism receipts have traditionally fallen within a substantial 20 to 30 percent range of national exports (Figure 3.B.11).
Figure 3.B.10 Trip Preferences: Long-haul Tourists
Source: National Tourism Study, op. cit.
Figure 3.B.9 Trip Preferences: Medium-haul Tourists
Source: National Tourism Study, op. cit.
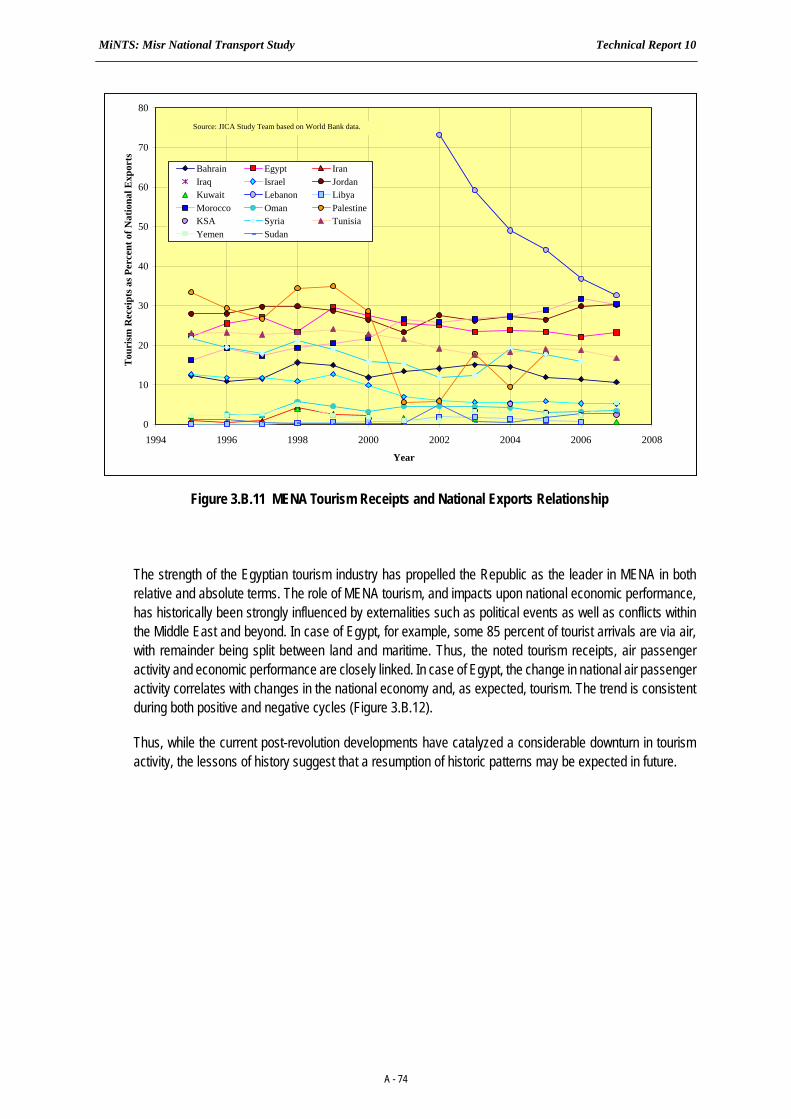
MiNTS: Misr National Transport Study Technical Report 10
A - 74
The strength of the Egyptian tourism industry has propelled the Republic as the leader in MENA in both relative and absolute terms. The role of MENA tourism, and impacts upon national economic performance, has historically been strongly influenced by externalities such as political events as well as conflicts within the Middle East and beyond. In case of Egypt, for example, some 85 percent of tourist arrivals are via air, with remainder being split between land and maritime. Thus, the noted tourism receipts, air passenger activity and economic performance are closely linked. In case of Egypt, the change in national air passenger activity correlates with changes in the national economy and, as expected, tourism. The trend is consistent during both positive and negative cycles (Figure 3.B.12).
Thus, while the current post-revolution developments have catalyzed a considerable downturn in tourism activity, the lessons of history suggest that a resumption of historic patterns may be expected in future.
0
10
20
30
40
50
60
70
80
1994 1996 1998 2000 2002 2004 2006 2008
Year
Tou
rism
Rec
eipt
s as P
erce
nt o
f Nat
iona
l Exp
orts
Bahrain Egypt IranIraq Israel JordanKuwait Lebanon LibyaMorocco Oman PalestineKSA Syria TunisiaYemen Sudan
Source: JICA Study Team based on World Bank data.
Figure 3.B.11 MENA Tourism Receipts and National Exports Relationship
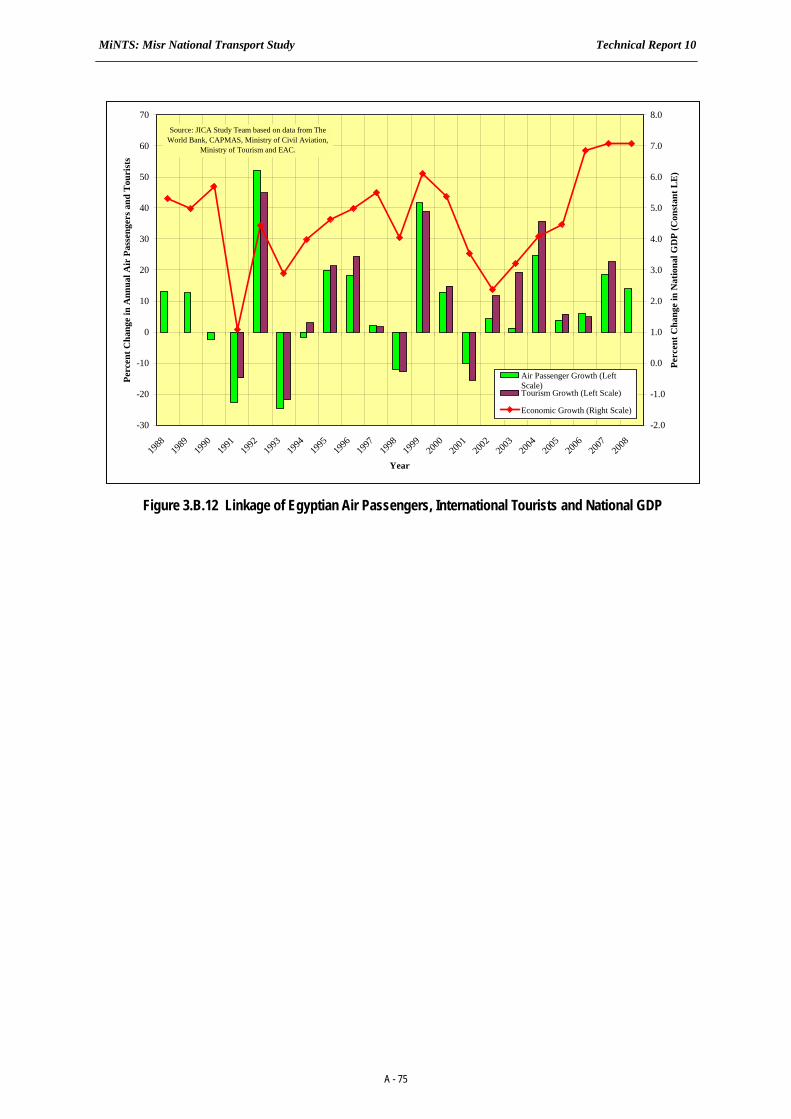
MiNTS: Misr National Transport Study Technical Report 10
A - 75
-30
-20
-10
0
10
20
30
40
50
60
70
1988
1989
1990
1991
1992
1993
1994
1995
1996
1997
1998
1999
2000
2001
2002
2003
2004
2005
2006
2007
2008
Year
Perc
ent C
hang
e in
Ann
ual A
ir P
asse
nger
s and
Tou
rist
s
-2.0
-1.0
0.0
1.0
2.0
3.0
4.0
5.0
6.0
7.0
8.0
Perc
ent C
hang
e in
Nat
iona
l GD
P (C
onst
ant L
E)
Air Passenger Growth (LeftScale)Tourism Growth (Left Scale)
Economic Growth (Right Scale)
Source: JICA Study Team based on data from The World Bank, CAPMAS, Ministry of Civil Aviation,
Ministry of Tourism and EAC.
Figure 3.B.12 Linkage of Egyptian Air Passengers, International Tourists and National GDP
Related Documents


