Welcome message from author
This document is posted to help you gain knowledge. Please leave a comment to let me know what you think about it! Share it to your friends and learn new things together.
Transcript


Thanks Great Lakes for being a lovely host…
• Premier Management Institute
• PGPBA• Brochures & pads provided
• WiFi Connectivity
About Analytics Vidhya
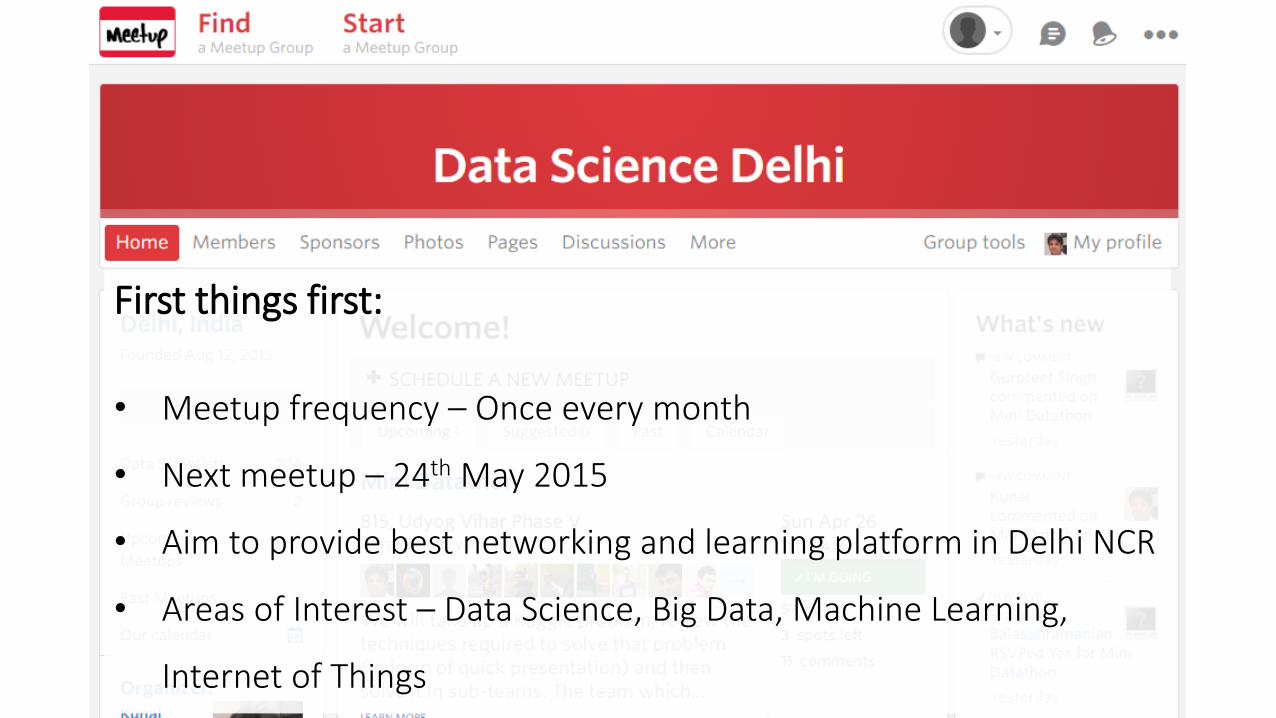
First things first:
• Meetup frequency – Once every month
• Next meetup – 24th May 2015
• Aim to provide best networking and learning platform in Delhi NCR
• Areas of Interest – Data Science, Big Data, Machine Learning,
Internet of Things
Meet Your Volunteers
KunalData Science Evangelist,
(Growth) Hacker, Blogger, Husband, Father
SunilBlogger, Problem solver,
data scientist, Fitness enthu
ManishAvid learner, explorer,
startup guy!
Agenda
• Introduction
• Model building – life cycle
• Data Exploration and Feature Engineering methods
• Talk about modelling Techniques like
• Logistic Regression
• Decision Tree
• Random Forest
• SVM
• Predict the survival on the Titanic
Introduction
• Name
• Experience in Data Science
• Current Company
• Are you proficient with (SAS/ R/ Python)?

Team creation
• Look for diversity in experience
• Hopefully common toolset, but complementary can also work
• Competing against each other

Team Formation
A few ground rules for today
• This is not a tutorial – you are expected to solve this problem yourself
• We are here to help you, organize your thoughts and to make sure you are going in the right direction.
• Good question to ask: • While trying Logistic regression in R, I am facing following error?
• Bad question to ask:• Help me understand what is Logistic Regression!


• Register on DataHack.io
• One login for each participant
• Password would be mailed upon registration
• Registration on Kaggle.com

Model building – life cycle

Problem for the day
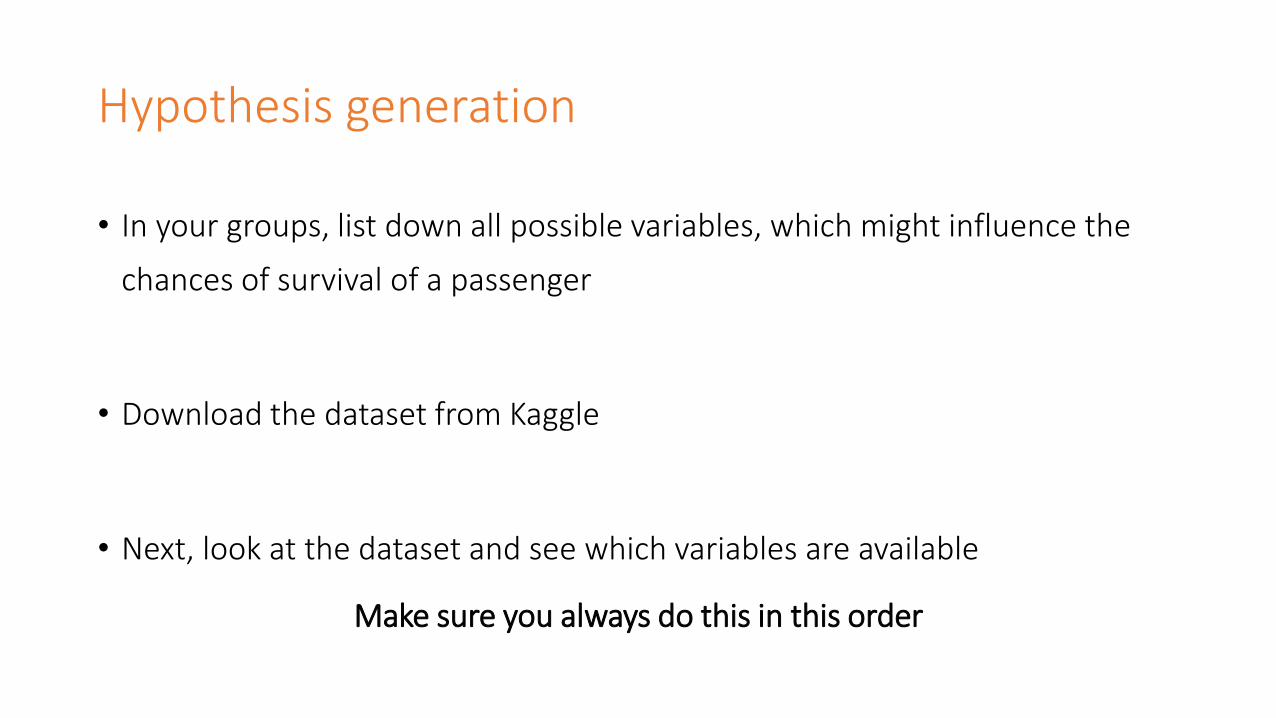
Hypothesis generation
• In your groups, list down all possible variables, which might influence the
chances of survival of a passenger
• Download the dataset from Kaggle
• Next, look at the dataset and see which variables are available
Make sure you always do this in this order

Data Exploration & Feature Engineering
• Import data set
• Variable identification
• Univariate, Bivariate and Multivariate analysis
• Identify and Treat missing and outlier values
• Create new variables or transform existing variables

Dataset Detail
• PassengerId :- Unique ID to every passenger
• Survived :- Survival (0=No, 1=Yes)
• Pclass:- Passenger Class (1=1st, 2=2nd, 3=3rd )
• Name :- Name
• Sex :- Male/ Female
• Age :- Age
• SibSp :- Number of Siblings / Spouses Aboard
• Parch :- Number of Parents / Children Abroad
• Ticket :- Ticket Number
• Fare :- Passenger Fare
• Cabin :- Cabin
• Embarked :- Port of Embarkation (C=Cherbourg, Q=Queenstown, S=Southampton)
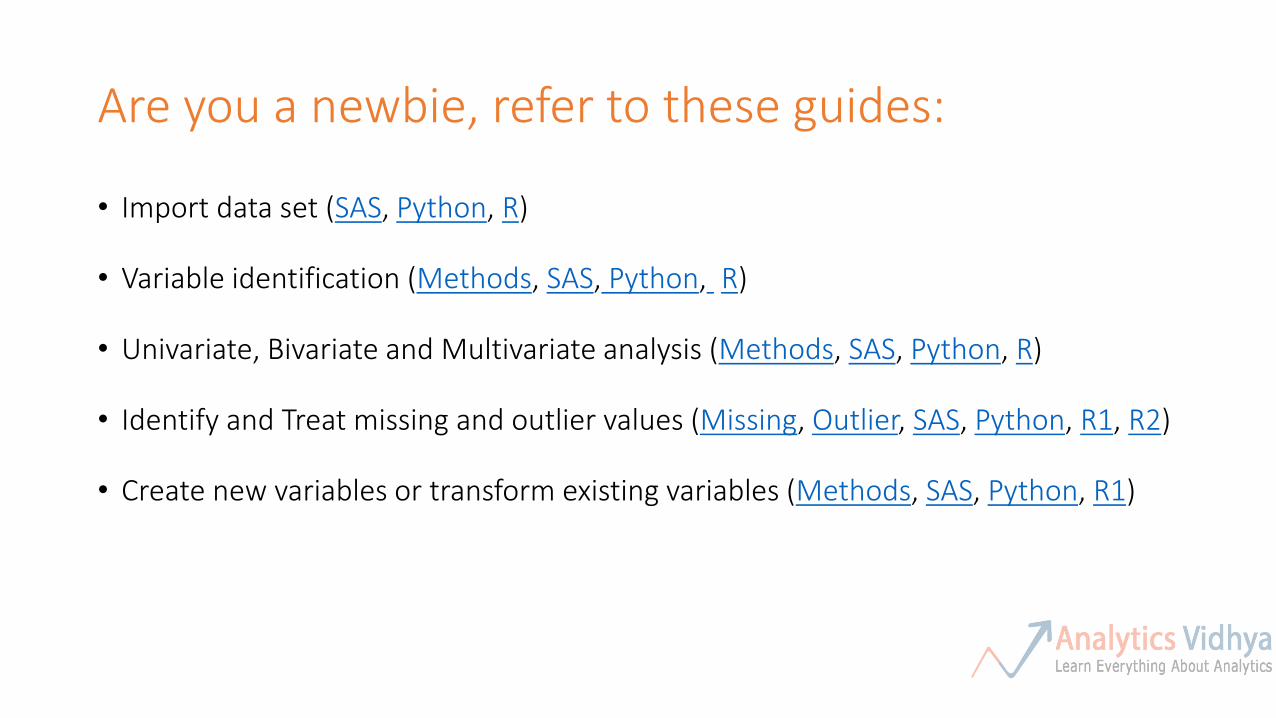
Are you a newbie, refer to these guides:
• Import data set (SAS, Python, R)
• Variable identification (Methods, SAS, Python, R)
• Univariate, Bivariate and Multivariate analysis (Methods, SAS, Python, R)
• Identify and Treat missing and outlier values (Missing, Outlier, SAS, Python, R1, R2)
• Create new variables or transform existing variables (Methods, SAS, Python, R1)

Practice
Explore the Titanic data set and share your inferences with the group

Break
Modelling Techniques – Logistic Regression
• Logistic regression is a form of regression analysis in which the outcome variable is binary or
dichotomous
• Used when the focus on whether or not an event occurred, rather than when it occurred
• Here, Instead of modelling the outcome, Y, directly, the method models the log odds(Y) using the
logistic function
• Analysis of variance (ANOVA) and logistic regression all are special cases of General Linear Model
(GLM)
• The probability of success falls between 0 and 1 for all possible values of X

Linear & Logistic Regression
20 30 40 50 60 70
Age
0.0
0.2
0.4
0.6
0.8
1.0
CH
DP
robab
ilit
y (
p)
Predictor (x)0 20 40 60 80
Age (yrs.)
0
20
40
60
80
100
Le
ng
th o
f S
tay (
da
ys)
Predictor(X)
YY=aX+b
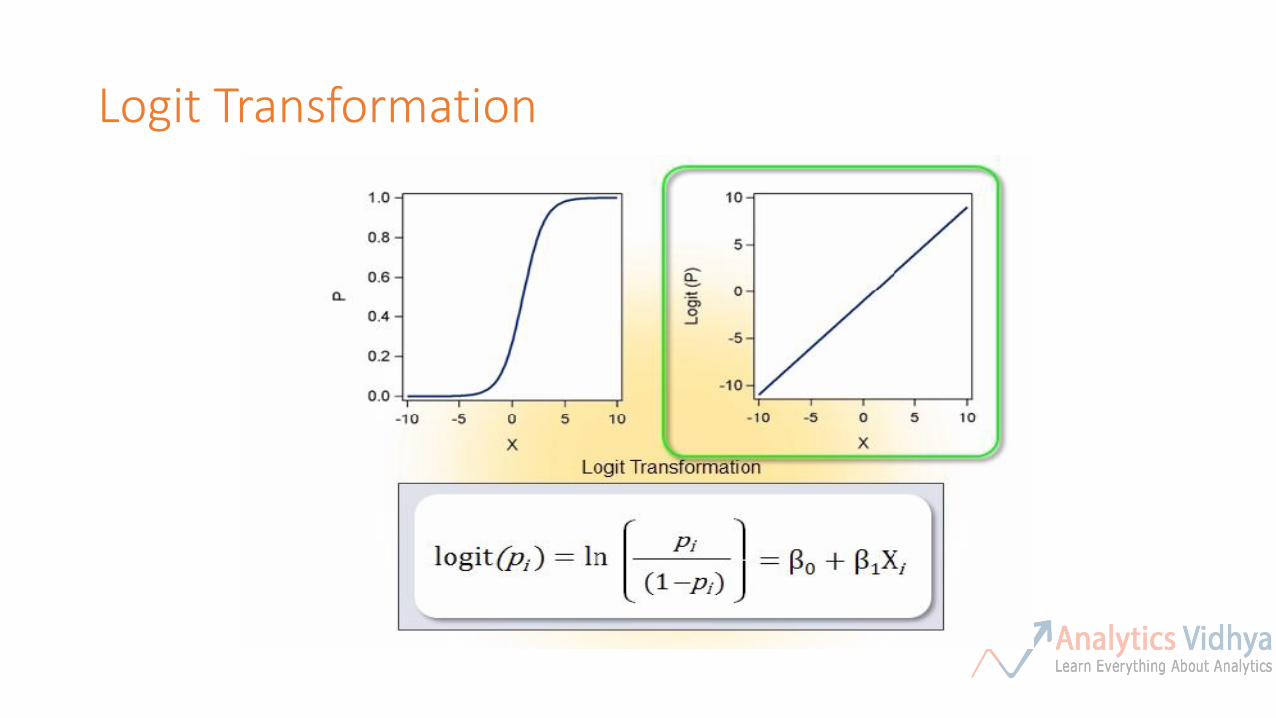
Logit Transformation

Logit is Directly related to Odds
• The logistic model can be written as:
• This implies that the odds for success can be expressed as:
• This relationship is the key to interpreting the coefficients in a logistic regression model !!
XoeP
P1
1

Modelling Techniques – Decision Tree
• Decision tree is a type of supervised learning algorithm
• It works for both categorical and continuous input and output variables
• It is a classification technique that split the population or sample into two or more homogeneous
sets (or sub-populations) based on most significant splitter / differentiator in input variables

Decision Tree - Example
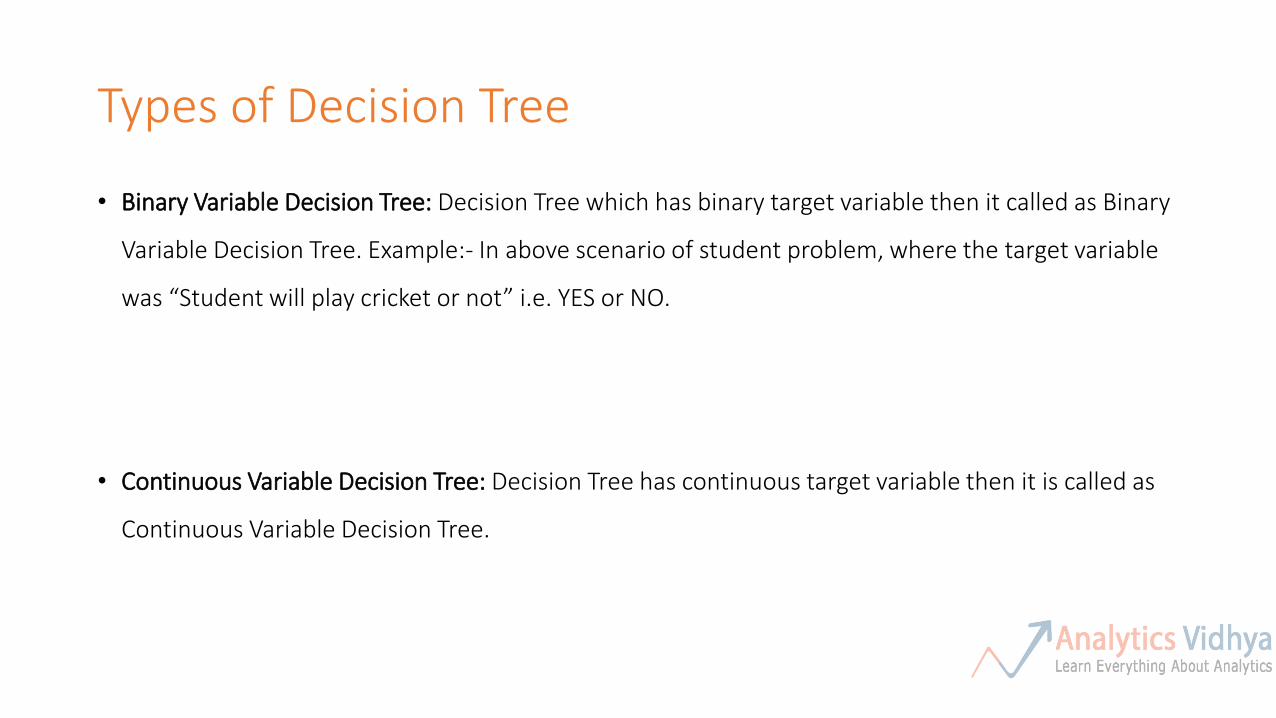
Types of Decision Tree
• Binary Variable Decision Tree: Decision Tree which has binary target variable then it called as Binary
Variable Decision Tree. Example:- In above scenario of student problem, where the target variable
was “Student will play cricket or not” i.e. YES or NO.
• Continuous Variable Decision Tree: Decision Tree has continuous target variable then it is called as
Continuous Variable Decision Tree.
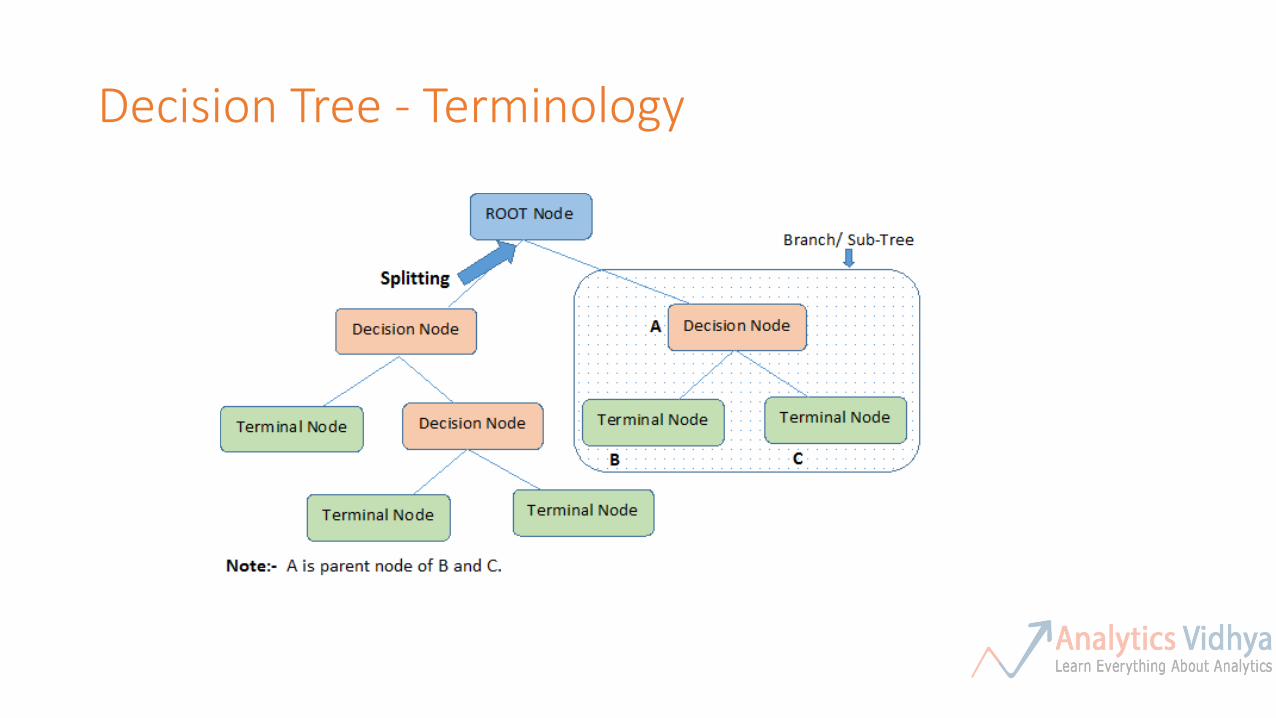
Decision Tree - Terminology

Decision Tree – Advantages/ Disadvantages
Advantages:
• Easy to understand• Useful in data exploration• Less Data Cleaning required• Data type is not a constraint
Disadvantages:
• Overfit• Not fit for continuous variables• Not Sensitive to Skewed distributions
Modelling Techniques – Random Forest
• “Random Forest“ is an algorithm to perform very intensive calculations.
• Random forest is like a bootstrapping algorithm with Decision tree (CART) model.
• Random forest gives much more accurate predictions when compared to simple CART/CHAID or
regression models in many scenarios.
• It captures the variance of several input variables at the same time and enables high number of
observations to participate in the prediction.
• A different subset of the training data and subset of variables are selected for each tree
• Remaining training data are used to estimate error and variable importance
Random Forest – Advantages/ Disadvantages
Advantages:
• No need for pruning trees• Accuracy and variable importance generated automatically• Not very sensitive to outliers in training data• Easy to set parameters
Disadvantages:
• Over fitting is not a problem• It is black box, rules behind model building can not be explained

Modelling Techniques – SVM
33
• It is a classification technique.
• Support Vectors are simply the co-ordinates of individual observation
• Support Vector Machine is a frontier which best segregates the one
class from other
• Solving SVMs is a quadratic programming problem
• Seen by many as the most successful current text classification
method
Sec. 15.1
Support vectors
Case Study
34
Sec. 15.1
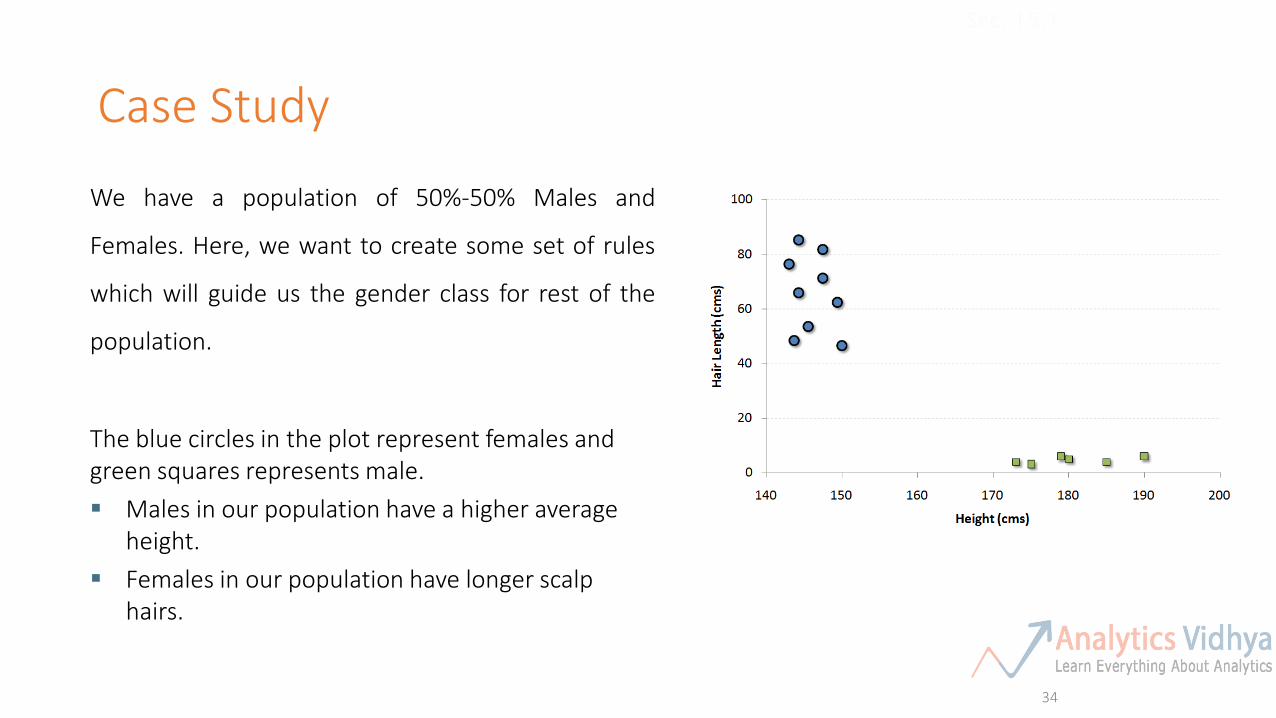
We have a population of 50%-50% Males and
Females. Here, we want to create some set of rules
which will guide us the gender class for rest of the
population.
The blue circles in the plot represent females and green squares represents male.
Males in our population have a higher average height.
Females in our population have longer scalp hairs.

Case Study – How to find right SVM
35
Sec. 15.1
Here we have three possible frontiers. Decide which
one is best.
Methods:
• Find the minimum distance of the frontier from closest support vector (this can belong to any class).
• Choose the frontier with the maximum distance from the closest support vector. In this case, it is black frontier with 15 unit distance.
Predict survival on the Titanic
Perform prediction for survival on the Titanic
Python Resources:
Python:
• http://www.bigdataexaminer.com/dealing-with-unbalanced-classes-svm-random-forests-and-
decision-trees-in-python/
• http://nbviewer.ipython.org/github/justmarkham/gadsdc1/blob/master/logistic_assignment/kevin
_logistic_sklearn.ipynb
• http://scikit-learn.org/stable/modules/svm.html
• http://scikit-learn.org/stable/modules/tree.html
• http://blog.yhathq.com/posts/random-forests-in-python.html

R Resources:
R:
• http://www.ats.ucla.edu/stat/r/dae/logit.htm
• http://www.cookbook-r.com/Statistical_analysis/Logistic_regression/
• http://www.rdatamining.com/examples/decision-tree
• http://www.statmethods.net/advstats/cart.html
• http://www.cair.org/conferences/cair2013/pres/58_Headstrom.pdf
• http://blog.yhathq.com/posts/comparing-random-forests-in-python-and-r.html
• http://www.louisaslett.com/Courses/Data_Mining/ST4003-Lab7-Introduction_to_Support_Vector_Machines.pdf
• http://thinktostart.com/build-a-spam-filter-with-r/
• http://cbio.ensmp.fr/~jvert/svn/tutorials/practical/svmbasic/svmbasic_notes.pdf

Thanks
Related Documents