15 Minamata Disease and Water Pollution Control Location: Minamata City, Kumamoto Prefecture, Japan Time Frame: 1956-1990 Programme/Project Status: completed Background: In 1959, at Minamata City, where the key industry was fishery, many unknown symptom cases with central nerve system disorder were reported. This disease was caused by methyl mercury and other toxic substance, contained in effluent to Minamata Bay from Chisso Co. Ltd. (chemical products industry, e.g. for acetaldehyde, ammonium etc.) when they were taken into human body through seafood and concentrated by the way of food chains. Although many serious cases were found, due to the lack of scientific information and technological capacity, as well as legal, administrative and social arrangements, as being the first major pollution-related disease in Japan, the counter-efforts including environmental recovery, remedies for patients were delayed. After 40 years it was finally completed to get rid of pollutant substance from the area. However, the case of Minamata Disease and Water Pollution Control may be an example for those environmental recovery efforts without any pre-existing arrangements. Also, the development of environment recovery technology and concurring tremendous investment should be emphasized, as well as notional and local government supports. Measures taken: Although the counter-measures were taken at late stage after tremendous tragedy, along with national legislation and administration development, many efforts were made. The measures taken in this case can be divided into 5 categories: a) research activities, b) regulatory, administrative, and legal arrangements, c) medical remedies for those suffered from disease, d) improvement of mercury emission system, and f) environment recovery efforts.

Welcome message from author
This document is posted to help you gain knowledge. Please leave a comment to let me know what you think about it! Share it to your friends and learn new things together.
Transcript
15
Minamata Disease and Water Pollution Control
Location: Minamata City, Kumamoto Prefecture, Japan
Time Frame: 1956-1990
Programme/Project Status: completed
Background:
In 1959, at Minamata City, where the key industry was fishery, many unknown symptom
cases with central nerve system disorder were reported. This disease was caused by methyl
mercury and other toxic substance, contained in effluent to Minamata Bay from Chisso Co.
Ltd. (chemical products industry, e.g. for acetaldehyde, ammonium etc.) when they were
taken into human body through seafood and concentrated by the way of food chains.
Although many serious cases were found, due to the lack of scientific information and
technological capacity, as well as legal, administrative and social arrangements, as being the
first major pollution-related disease in Japan, the counter-efforts including environmental
recovery, remedies for patients were delayed. After 40 years it was finally completed to get
rid of pollutant substance from the area. However, the case of Minamata Disease and Water
Pollution Control may be an example for those environmental recovery efforts without any
pre-existing arrangements. Also, the development of environment recovery technology and
concurring tremendous investment should be emphasized, as well as notional and local
government supports.
Measures taken:
Although the counter -measures were taken at late stage after tremendous tragedy, along
with national legislation and administration development, many efforts were made. The
measures taken in this case can be divided into 5 categories: a) research activities, b)
regulatory, administrative, and legal arrangements, c) medical remedies for those suffered
from disease, d) improvement of mercury emission system, and f) environment recovery
efforts.
16
As seen in other cases, the first initiative taken was the research activities by an academic
institution. Also national and local governments conducted fact-finding survey (however they
could not recognize the strong connection between the mercury pollution and Chisso’s
operation).
Under the pressure by social opinion, Chisso reluctantly introduced improved effluent
processing system by times. In 1968 it stopped producing acetaldehyde, whose production
process caused mercury discharge.
The amount of mercury discharged and sedimented in Minamata bay was estimated to be 70 -
150 tons. Since it was feared that mercury would continue to endanger marine environment
as well as human health, the Bottom Sludge Programme was launched in 1976. The bottom
sludge in Minamata bay seabed was scooped and fed into reclamation sited using a pump
specially designed to prevent turbidity in the dredging site. After this process, the
reclamation site was covered with non-contaminated mountain soil carefully.
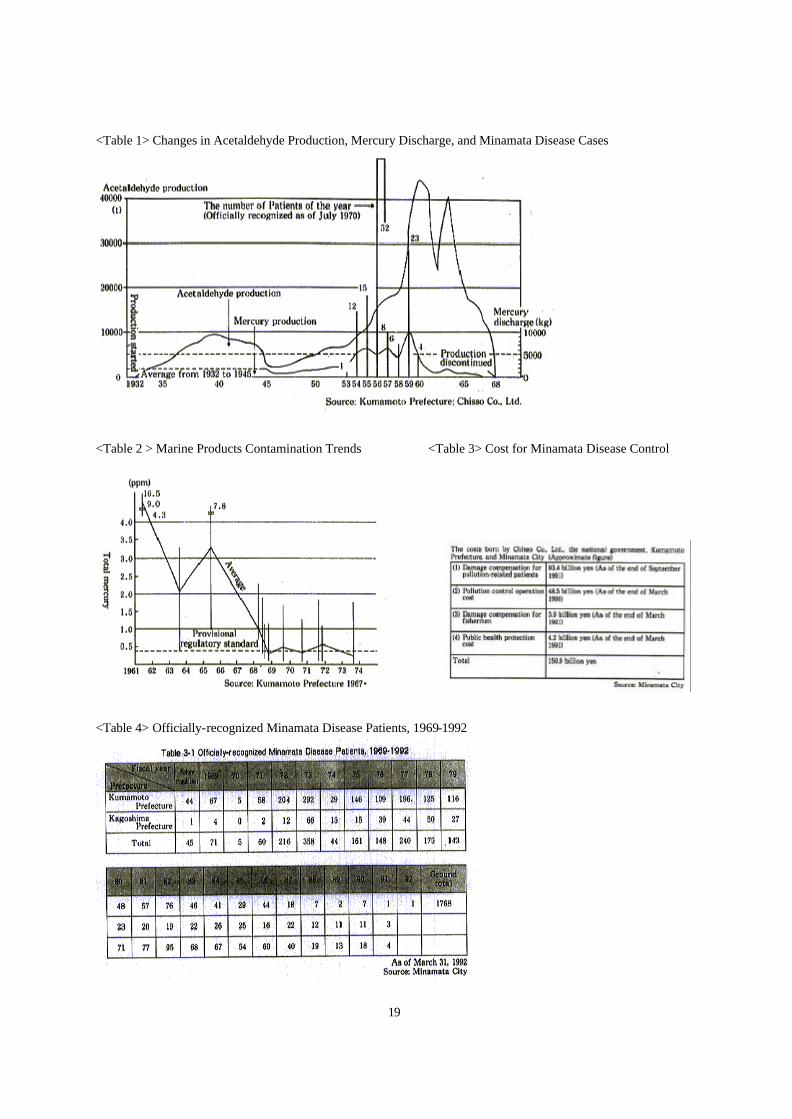
Investment:
48.5 billion JPY (Bottom Sludge Treatment Programme/14 years) borne by Chisso (60%) and
the National Government (40%). Also, compensation to those suffered from disease and
fishery industry was made by Chisso, Kumamoto Prefecture and the national government.
(see Table 3)
Impact:
Effluent-processing system improved by Chisso by several times curbed the amount of
mercury discharged into the bay. However, the decisive measure to stop the discharge was to
close the acetaldehyde plant in 1968. (see table 1 and 2).
As to the environment recovery effort, mercury contained in the sludge decreased from
25ppm (1977) to 4.69ppm (1990), by the Bottom Sludge Programme.
Changes in the number of Minamata disease patients do not correspond to the time when
the abovementioned measures were taken. This seems to be because the time differences
17
between the intake of mercury into human body and birth of babies with symptom. (See table
4)
Essential Arrangement for the Programme Implementation:
In particular, national and local governments legislation, and administrative and financial
arrangement in 1970’s supported Chisso’s compensation to those suffered and the
environmental recovery efforts. Also, law suits conclusion affected to the case positively to
some extent. Although they did not directly affected to the mercury emission control itself as
envisaged (since they were mainly introduced after Chisso stopped discharging toxic effluent),
it should be rather pointed out the Minamata case itself had great impact on the introduction
of those legal and administrative efforts.
It is noted that the main reason of delayed control and recovery-efforts was until 1970 the
principle of ‘burden of proof’ was strictly applied in law cases as well as administrative
decision, and the concept of ‘environmental reversibility’ and ‘pre-caution’ were immature.
Information Source:
http://www.icett.or.jp/lpca_jp.nsf/
18
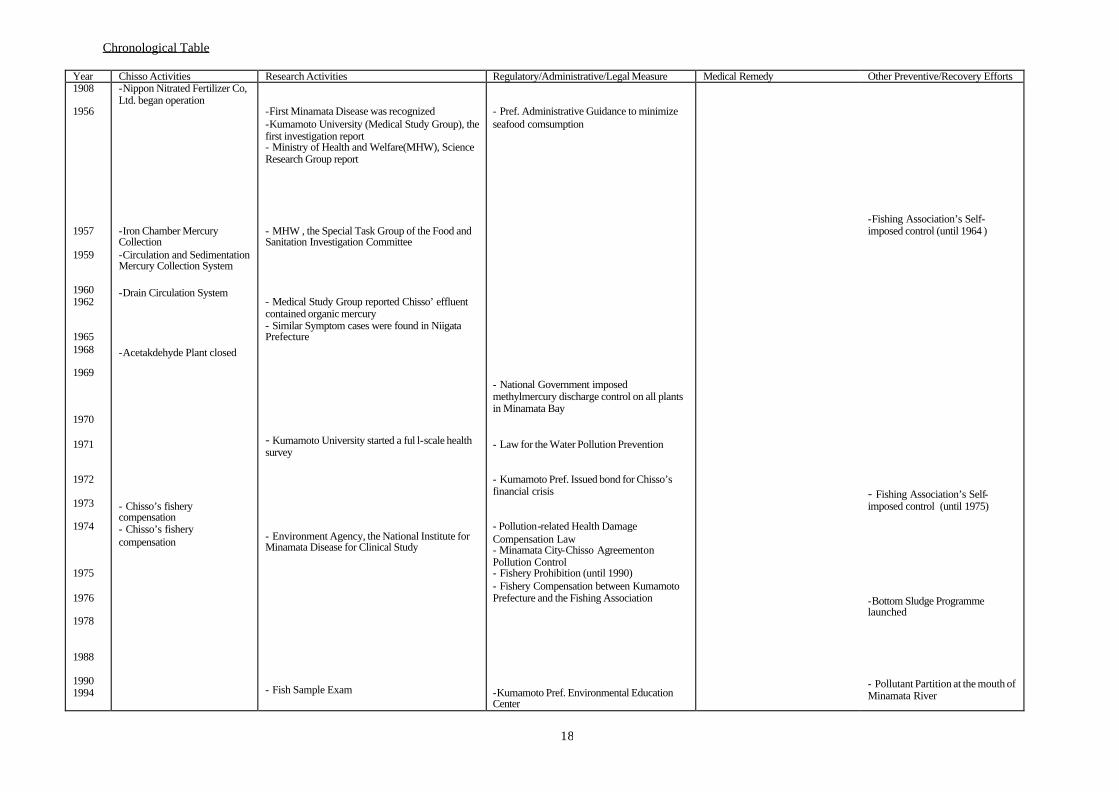
Chronological Table
Year Chisso Activities Research Activities Regulatory/Administrative/Legal Measure Medical Remedy Other Preventive/Recovery Efforts 1908 1956 1957 1959 1960 1962 1965 1968 1969 1970 1971 1972 1973 1974 1975 1976 1978 1988 1990 1994
-Nippon Nitrated Fertilizer Co, Ltd. began operation -Iron Chamber Mercury Collection -Circulation and Sedimentation Mercury Collection System -Drain Circulation System -Acetakdehyde Plant closed - Chisso’s fishery compensation - Chisso’s fishery compensation
-First Minamata Disease was recognized -Kumamoto University (Medical Study Group), the first investigation report - Ministry of Health and Welfare(MHW), Science Research Group report - MHW , the Special Task Group of the Food and Sanitation Investigation Committee - Medical Study Group reported Chisso’ effluent contained organic mercury - Similar Symptom cases were found in Niigata Prefecture - Kumamoto University started a ful l-scale health survey - Environment Agency, the National Institute for Minamata Disease for Clinical Study - Fish Sample Exam
- Pref. Administrative Guidance to minimize seafood comsumption - National Government imposed methylmercury discharge control on all plants in Minamata Bay - Law for the Water Pollution Prevention - Kumamoto Pref. Issued bond for Chisso’s financial crisis - Pollution-related Health Damage Compensation Law - Minamata City-Chisso Agreement on Pollution Control - Fishery Prohibition (until 1990) - Fishery Compensation between Kumamoto Prefecture and the Fishing Association -Kumamoto Pref. Environmental Education Center
-Fishing Association’s Self-imposed control (until 1964 )
- Fishing Association’s Self-imposed control (until 1975) -Bottom Sludge Programme launched - Pollutant Partition at the mouth of Minamata River
19
<Table 1> Changes in Acetaldehyde Production, Mercury Discharge, and Minamata Disease Cases
<Table 2 > Marine Products Contamination Trends <Table 3> Cost for Minamata Disease Control
<Table 4> Officially-recognized Minamata Disease Patients, 1969-1992
20
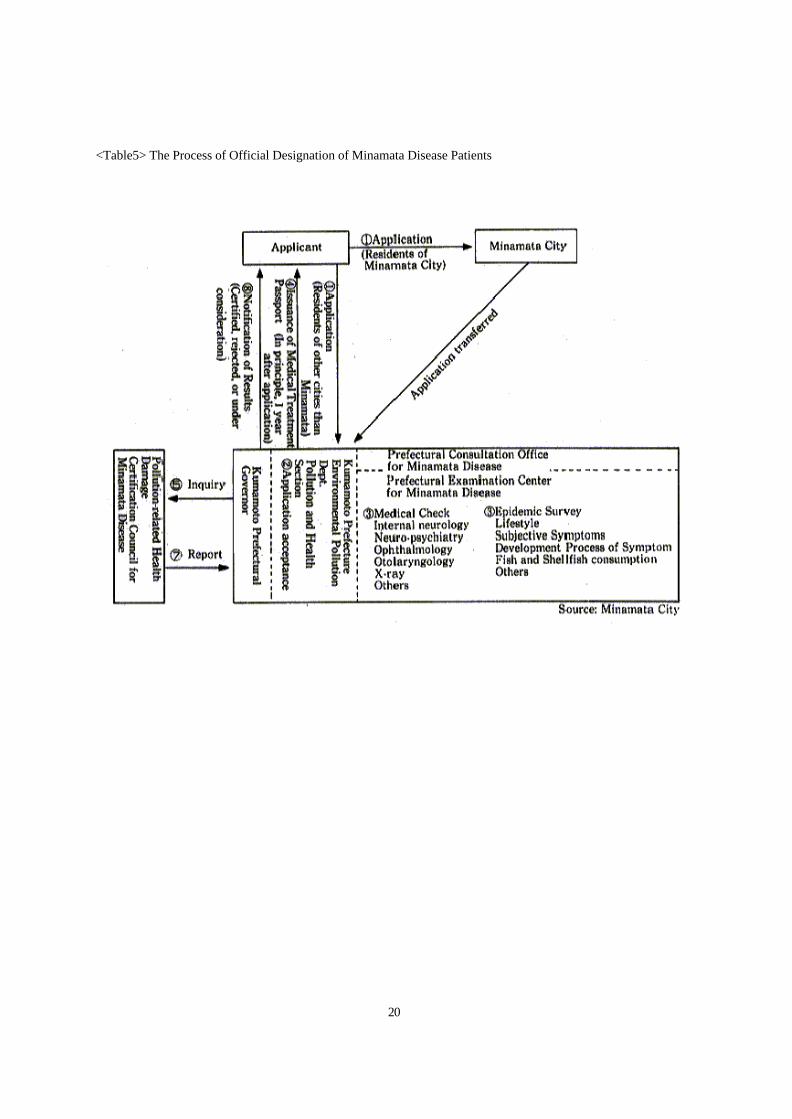
<Table5> The Process of Official Designation of Minamata Disease Patients
21
T he Ecology: A ‘Natural Kidney ’ for Urban Wastewater in Calcutta
Location: Calcutta, India
Time Frame: 1980(when an official research conducted)- onwards
Programme/Project Status: ongoing (midterm evaluation available)
Background:
An ideal wastewater treatment system, as in cities in developed countries, has facilities for the whole
process from wastewater collection from each household to automated water treatment, before it
release collected waster to surrounding natural water bodies. Although such a system is, without any
doubt, the best way to avoid water quality of local environment, it is always a serious issue to
establish and maintain expensive facilities, especially in the context of cities in developing countries.
Under such a difficult financial circumstances, wastewater treatment issue of many developing cities
are stagnant, or in some case, in a dead-rock situation*. The case of Calcutta Metropolitan Authority
may provide a unique perspective to solve these issues, when a given local government has financial
constraints in introducing a modern wastewater treatment system.
* Providing foreign financial aids may be an option to introduce or upgrade modern wastewater treatment
facilities. However, it should be noted that this method may be very expensive and, when considering
sustainability, suitable only for local governments without not so serious financial constraints in the maintenance
of the provided facilities and personnel .
Measures taken:
Calcutta has a huge marshland in its east part. The Government of West Bengal and the Calcutta
Metropolitan Authority developed a three-part strategy for the reuse of waste-water: vegetables are
grown on garbage substrata with treated sewage used to irrigate the garbage farms; next, 3,000
hectares of fish ponds integrate sewage treatment with fish farming - the sun destroys most harmful
22
bacteria and the fish feed from the ponds; finally, the treated sewage is used to grow crops. Through
this process, all the sewage from Calcutta is treated, the garbage fields produce 150 tons of vegetables
per day, the fishponds produce approximately 8,000 tons of fish per year, and the paddy fields produce
16,000 tons of winter paddies. The project is managed by community groups, utilizes appropriate
technology, with entrepreneurs taking away all sales proceeds in return for rental of land and water.
Impact:
Since the region is suitable for using solar radiation and improving wastewater quality, each hectare
of a shallow water body can remove about 237 kg of BOD per day. In winter, the clearness of the sky is
satisfactory (about 90 per cent) for carrying out biochemical activities in water purification. While
sewage entering the ponds contains, for example, up to 10 million E.coli bacteria per milliliter, in the
water released from ponds this figure is a low 10 to 100 per milliliter. Local residents use the released
water for bathing and cooking, yet when a 1984 epidemic of shigella dysentery swept the region, not a
single case was reported from East Calcutta.
It is also recognized that as a consequence of water purification process, in conjunction with fish
farming, many of local residents are befitted finically.
Essential Arrangement for the Programme Implementation:
Although Calcutta case may be applicable only to those cities with huge water bodies surrounding
them, it is often pointed out many Indian local governments are interested in it. Also it should be
pointed out, in this case wastewater included only organic matters basically*, so that waste subst ance
decomposition can be done in the ‘organic process,’ such as bacteria biochemical activities and fish
farming.
* In most South Asian cities, wastewater from households do not contain chemical substance, in contrast those in
East, and Southeast Asian cities.
Information Source:
http://www.oneworld.org/patp/index.html
http://www.bestpractice.org
23
Fuyan Chemical General Works Cleaner Production
Location: Fuyan City, Anhui Province, China
Time Frame: 1996-onwards
Programme/ Project Status: ongoing (midterm evaluation available)
Background:
The Fuyan General Works was selected as a demonstration for the China-Canadian
Cooperation in Cleaner Production, initiated in October 1996 with financial support from
the Canadian International Development Agency (CIDA). As is typical of fertilizer plants in
China, the facilities generated large amount of water pollution substance, especially
ammonia and sulphur. This project presents a prototype of successful environmental
practice in the field of Cleaner Production, conducted under the strong partnership between
the two countries. Project bodies include CIDA (Canadian side), the State Economic and
Trade Commission (SETC), the State Environmental Protection Administration (SEPA), the
Anhui Provincial Economic and Trade Commission (AHETC), the State Administration of
Petroleum and Chemical Industries (SAPCI), the State Bureau for Light industry (SBLI)
(Chinese side), PricewaterhouseCoopers, Lavalin and ESSA Technologies (consultants),
Measures taken:
The project team (Chinese and Canadian Technical Team) sent engineer and process
specialist from the consultants to undertake an on-site CP audit* with full participation of
plant and manufacturing staff. Under this research activity some process flow diagrams
were formulated, including the following recommended steps to be taken;
* (The audit found 60% of pollution was due to the loss of ammonia to the air and to the
sewer)
- Engineering and equipment specification in a joint work by the Canadian and
Chinese Technical Teams.
- Cost estimating for equipment, civil, structural and electrical by the Chinese
Technical Team.
- Preparation and issuing of tender documents for the fabrication of equipment.
- Selection of bids and purchasing of equipment
- Civil, structural and electrical work at the plant personnel.
24
Also, in order to further facilitate the substantive activities under the partnership between
two countries, a guideline was prepared based on the Technical Team Recommendation.
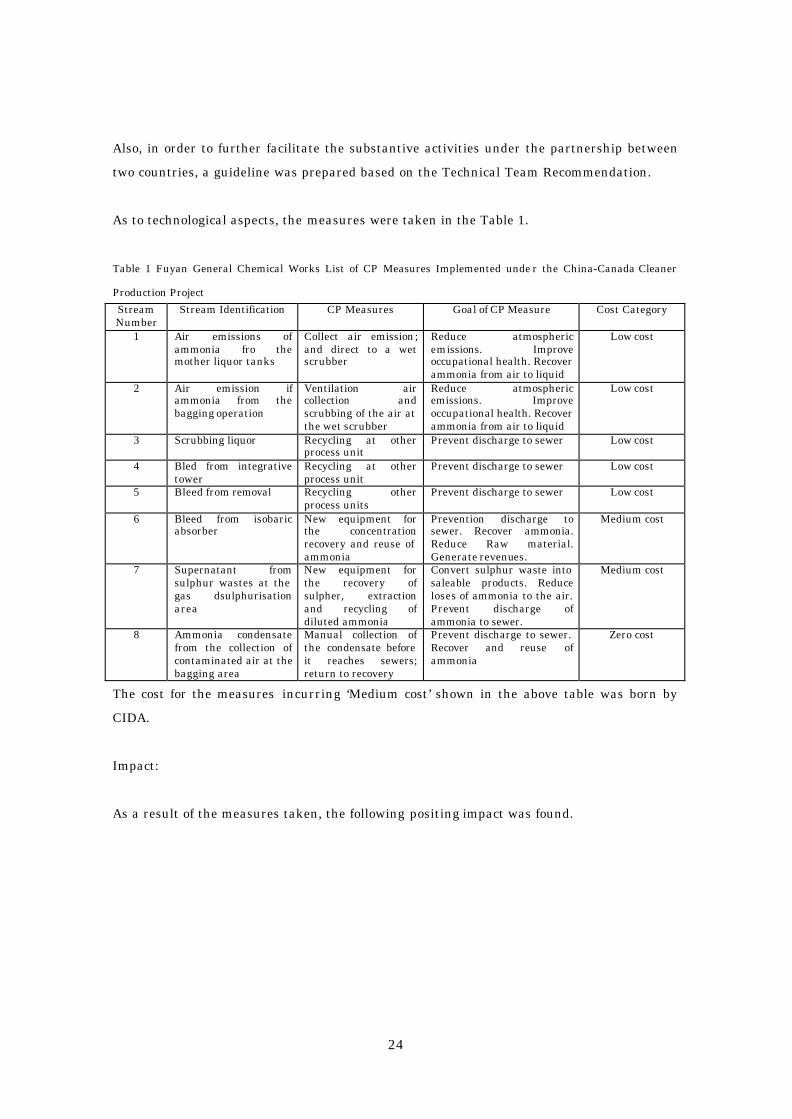
As to technological aspects, the measures were taken in the Table 1.
Table 1 Fuyan General Chemical Works List of CP Measures Implemented unde r the China-Canada Cleaner
Production Project
Stream Number
Stream Identification CP Measures Goal of CP Measure Cost Category
1 Air emissions of ammonia fro the mother liquor tanks
Collect air emission; and direct to a wet scrubber
Reduce atmospheric emissions. Improve occupational health. Recover ammonia from air to liquid
Low cost
2 Air emission if ammonia from the bagging operation
Ventilation air collection and scrubbing of the air at the wet scrubber
Reduce atmospheric emissions. Improve occupational health. Recover ammonia from air to liquid
Low cost
3 Scrubbing liquor Recycling at other process unit
Prevent discharge to sewer Low cost
4 Bled from integrative tower
Recycling at other process unit
Prevent discharge to sewer Low cost
5 Bleed from removal Recycling other process units
Prevent discharge to sewer Low cost
6 Bleed from isobaric absorber
New equipment for the concentration recovery and reuse of ammonia
Prevention discharge to sewer. Recover ammonia. Reduce Raw material. Generate revenues.
Medium cost
7 Supernatant from sulphur wastes at the gas dsulphurisation area
New equipment for the recovery of sulpher, extraction and recycling of diluted ammonia
Convert sulphur waste into saleable products. Reduce loses of ammonia to the air. Prevent discharge of ammonia to sewer.
Medium cost
8 Ammonia condensate from the collection of contaminated air at the bagging area
Manual collection of the condensate before it reaches sewers; return to recovery
Prevent discharge to sewer. Recover and reuse of ammonia
Zero cost
The cost for the measures incurring ‘Medium cost’ shown in the above table was born by
CIDA.
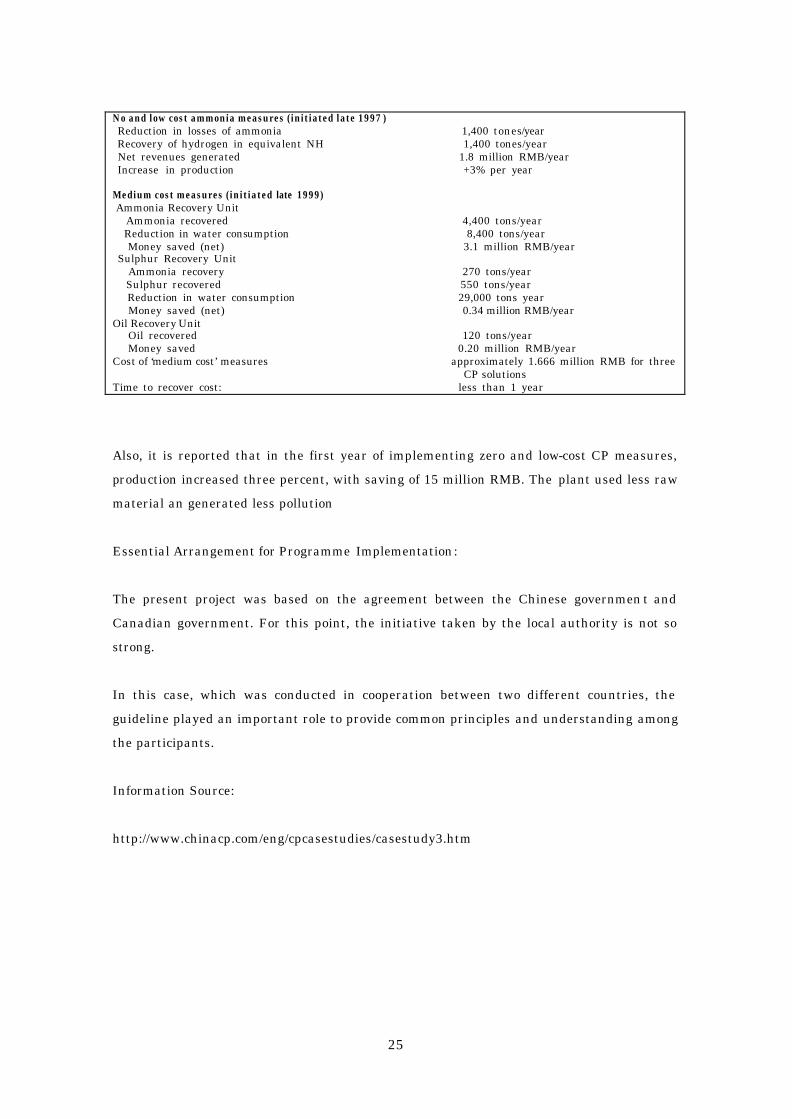
Impact:
As a result of the measures taken, the following positing impact was found.
25
No and low cost ammonia measures (initiated late 1997 ) Reduction in losses of ammonia 1,400 tones/year Recovery of hydrogen in equivalent NH 1,400 tones/year Net revenues generated 1.8 million RMB/year Increase in production +3% per year Medium cost measures (initiated late 1999) Ammonia Recovery Unit Ammonia recovered 4,400 tons/year Reduction in water consumption 8,400 tons/year Money saved (net) 3.1 million RMB/year Sulphur Recovery Unit Ammonia recovery 270 tons/year Sulphur recovered 550 tons/year Reduction in water consumption 29,000 tons year Money saved (net) 0.34 million RMB/year Oil Recovery Unit Oil recovered 120 tons/year Money saved 0.20 million RMB/year Cost of ‘medium cost’ measures approximately 1.666 million RMB for three
CP solutions Time to recover cost: less than 1 year
Also, it is reported that in the first year of implementing zero and low-cost CP measures,
production increased three percent, with saving of 15 million RMB. The plant used less raw
material an generated less pollution
Essential Arrangement for Programme Implementation:
The present project was based on the agreement between the Chinese governmen t and
Canadian government. For this point, the initiative taken by the local authority is not so
strong.
In this case, which was conducted in cooperation between two different countries, the
guideline played an important role to provide common principles and understanding among
the participants.
Information Source:
http://www.chinacp.com/eng/cpcasestudies/casestudy3.htm
26
Taiyuan Chemical Plant
Location: Taiyuan City, Shanxi Province, China
Time Frame: 1994-onwards
Programme/Project Status: ongoing (midterm evaluation available)
Background:
Taiyuan is the capital of Shanxi Province in the north-central part of China, with the
population of around 2 million. Being a center of major heavy industry of the country,
Taiyan has suffered from severe pollution. In 1998, Taiyuan was designated as the first
pilot city by SETC and SEPA project of ‘Promotion Production Demonstrative Provinces’
and since it has actively led in this field, by adjusting its economic structure, by it ‘blue sky
and clear water initiatives. The present case is under the umbrella of the China-Canada
Cooperation Project in Cleaner Production
The Taiyuan Chemical Plant produces chlor-alkali, phenor, chlorobenzene, cyclohexane, and
hexane acid. It has been using processes and technologies dating from the 1950s –1960s
and thus is very inefficient in terms of raw material use and energy consumption.
Measures taken and its impact:
In 1994, with support of CIDA, China-Canada joint project team conducted environmental
audit in view of streamlining production process.
Implementation has been based on the no-cost, low-cost and medium cost recommendations
from the CP audits, in that order. Investments have been made and modest and benefits
have been substantial, with short-term returns on investments. For instance, in the hexane
di-acid plant, 784,400 RMB was invested for a process improvement, and the cost is
estimated to return in 1.37 years. In another example, 877,00 RMB was used for water
recycling in the chlorobenzene plant. In one year, more than one million tons of water was
saved, (which accounts more than 1,300,00 RMB at net saving).
27
With regard to the administrative aspect of the plant, it has established a ‘special task
force’ system for environmental production supervision. This structure includes two
inspectors and one monitoring personnel for each of the eight hour shifts. Inspector assume
responsibility overseeing production controls, environmental control facilities, and
discharge while monitoring personnel bear responsibilities for issuing orders to correct
deficiencies. They have the additional mandate to issue fines and penalties in case situation
is not corrected within a specified time.
Essential Arrangement for the Programme Implementation:
The present case is in the context of the series of Taiyuan’s environmental efforts. The city
government has been active to encourage industrial sector to improve CP methods, with
support of the national and foreign assistance. The supportive measures range from
promotional to prohibitive ones. In 2000, Taiyuan became the first Chinese city to introduce
CP production regulation to guide investment in the city. These regulations provide a
framework for Taiyuan to carry our cleaner production, as well as a model for other Chinese
cities and provinces.
Information Source:
http://www.chinacp.com/eng/cpcasestudies/casestudy4.html
28
Chicago Public Housing Buy-Back Program
Location: Chicago City, Illinois State, United States
Time Frame: 1995-onwards
Programme/Project Status: ongoing (midterm evaluation available)
Background:
As is often the case with big cities in the United States, management of increasing amount
of solid waste produced by households is a serious issue. This has been particularly a
growing concern, compared with the amount of solid waste produced by business, since the
economic growth in past 10 years has accelerated the high resource consuming behavior
among consumers. To change such trends, and mitigate its counter effect (i.e.environmental
burden), the City of Chicago has launched ‘Chicago Public Housing Buy-Back Recycling
Programme’ in conjunction with other solid waste management programmes.
Measures taken :
The Department of Environment (DOE), the City of Chicago launched the programme for
public housing recycling, in cooperation with other organizations* including those from
private sectors. The programme, working with local resident organizations, provide direct
payment to CHA residents for recyclable materials collected in their homes and
neighborhoods, by recycling trucks on designated days each week.
The programme was late expanded to include all family developments and most senior
citizen buildings, involving 10 local youth organizations. This is intended to raise
awareness inside households (by families of those children), as well as to provide children
with environment education through activities of the youth organizations.
In addition to providing a short-term investment in the Chicago Housing Authority (CHA)
developments through the voucher payments, the recycling programme also makes
long-term investments in the communities by hiring programme, to integrate low-income
group in to the society.
29
*Public Sector: Chicago Housing Authority (CHA)
Private Sector: Americorps, VISTA, Resource Center (a local nonprofit recycler)
Impact:
By the end of the first year (1995) the programme collected over 60,000 pounds recyclables,
which had been automatically disposed as garbage formerly (USD 5,000 were paid by
coupons). In 1999, residents from the family units received USD 119,589.04 and senior
building were paid over USD 18,000, which represents over 560 tons of paper waste, saving
more than nine and a half thousand trees.
Essential Arrangement for Programme Implementation:
The present initiative was primarily take by the DOE, the City of Chicago, with provision of
miscellaneous support, including financial measure. But the significance of the present
programme lies in the partnership between public and private sectors. Since the technique
of handling recyclable material was provided by the participating private sector, the
recycling activities were able to connect to business activities smoothly.
In case of US cities, those residing in public residence in urban areas often belong to a
minority group, socially disadvantaged in terms of educational, vocational as well as
financial aspects. In view of this fact, such programmes are being used as an administrative
tool to promote their social integration, while seeking for environmental effects.
Information Source:
http://www.cityofchicago.org/Environment/SolidWsate/CHA-ByBackRecycling.htm
30
Semi-aerobic Landfill / Fukuoka Method
Location: Fukuoka City, Japan
Time Frame: 1967- onwards
Programme/Project Status: ongoing (midterm evaluation available)
Background:
As in many Japanese large cities, solid waste management has been a major environmental
issue in Fukuoka City. Being the largest commercial center of Kyushu island, the
population has been continuously growing, which caused increasing amount of solid waste
produced and shortage of landfill sites. Also, the administrative cost for solid waste
management has become growing pressure to its budget, thus, it was necessary for
Fukuoka City to introduce the measure to provide new landfill sites to manage solid waste
efficiently well as in cost effective manner. To this end, Fukuoka city launched a joint
project in cooperation with Fukuoka University.
Until the invention of Fukuoka Method, either of aerobic method or anaerobic method was
used as major landfill process; The former is environmentally friendly but expensive, while
the latter was less expensive but more harmful due to the emission of methane gas. In this
regard, Fukuoka Method (semi-aerobic landfill method) is significant in reducing cost,
while maintaining environmental friendly aspects to some extent.
Measures taken:
In 1967, at the request of Fukuoka City, Fukuoka University has began research on landfill
technology to improve the quality of leachate produced, which later demonstrated that
decomposition and stabilization of waste in landfill were enhanced by providing oxygen
(air) due to microbial activity. Based upon the studies, including one conducted as a pilot
project in Shin-Kamata Landfill site, Fukuoka City introduced Semi-aerobic landfill
method, as a main solid waste management system, using the following technology
invented by the university.
31
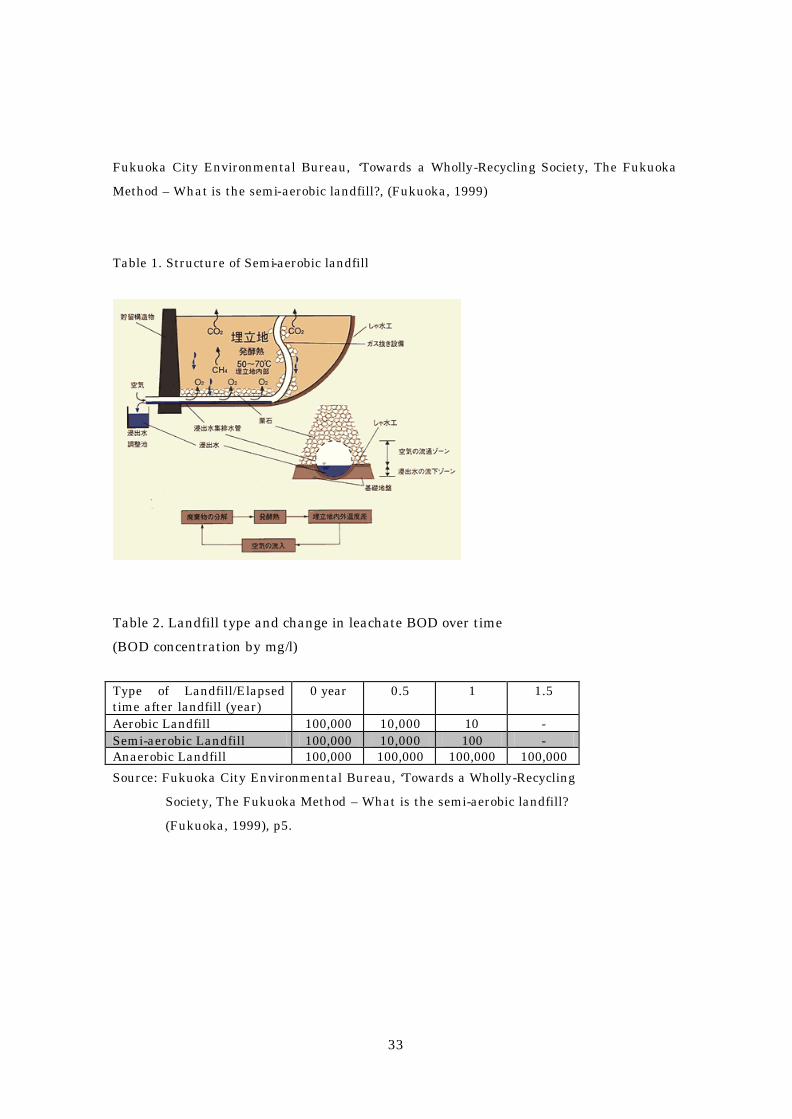
(Technological aspect of the Semi-aerobic landfill method) *see Table 1 below.
Leachate is collected in a leachate collection pond through properly sized pipes embedded in
graded boulders. As the outlet of the main leachate collection pipe is always open to air,
fresh air is drawn into the layers thereby introducing an aerobic condition around the pipes
(in case of aerobic landfill, in addition to the leachate collection pipes, air pipes are
constructed to pump in air into the waste lyers to maximize internal aerobic activities).
Since leachate is removed as quickly as it is formed, the internal waste layers have lower
water content.
The effects of leachate collection pipes in the semi-aerobic landfill are:
(a) Leachate is drained out as quickly as possible, preventing in the waste material and
making it easier for fresh air to penetrate, thereby promoting aerobic condition in the
waste layers,
(b) By promoting aerobic conditions, microbial activity is enhanced and the decomposition
of waste is accelerated.
(c) By embedding the collection pipes in the boulders, the collection pipes are protected
from clogging and damage during operation.
(d) By rapidly draining out the leachate, water pressure on the liner is prevented from
building up, reducing the danger of seepage.
For further information in detail on the technology aspect of the method, see Fukuoka City
Environmental Bureau, ‘Towards a Wholly-Recycling Society, The Fukuoka Method – What
is the semi-aerobic landfill?, (Fukuoka, 1999).
Impact:
As presented in the basic research by Fukuoka University as well as a pilot project in
Shin-Kamata Landfill site, waste decomposition and land stabilization speed was relatively
high (see table 2), which made it possible to return the completed landfill sites to other uses
in a shorter period. Also, as predicted, the generation of methane gas was reduced
(indicator not available) compared with anaerobic method, while the carbon dioxide amount
was bigger than aerobic method.
With regard to the financial aspect, since the structure of Fukuoka Method landfill is quite
simple and does not require to use special equipment other than leachate collection pipes,
32
the total cost is relatively small compared with aerobic landfill.
Essential Arrangement for the Programme Implementation:
The essential element of the project success is the technology support provided by Fukuoka
University. The cooperation between university and the city government was effectively
conducted to operationalize the newly invented technology, maintaining a practical
perspective to the environmental administration. Also, the cost-effectiveness of the
method may be the distinctive character of the programmes. From the point of view of
environmental protection, the method is not the best way (especially when compared with
aerobic method), but can be the better way and provide a practical choice for those with
financial constraints to manage solid waste issues. This aspect is also related with the
essential elements for the successful replication in other project sites (see below).
Replication Practice in other programme/project sites:
Since the Ministry of Health and Welfare Final Waste Disposal Guidelines includes
Fukuoka Method Semi-aerobic landfill as recommendation, the method has been widely
adopted by many local governments throughout Japan.
Also, Fukuoka City has been conducted international cooperation jointly with Fukuoka
University in transferring the technology of the semi-aerobic landfill to Asian cities. In
particular, the City of Tehran, Islamic Republic of Iran (in cooperation with UNCHS),
Seberang Perai, Malaysia (in cooperation with JICA), Ipoh, Malaysia, and Guangzhou,
China successfully replicated the Fukuoka Method. Again, although Fukuoka Method has a
shortcoming in the rapidly bigger amount of carbon dioxide through its decomposition
process, it is more practical than total aerobic landfill method in cost effectiveness, and
more environmentally friendly than anaerobic landfill in smaller amount of methane gas as
well as the speed of the decomposition process. Furthermore, the method does not require
any complicated material or maintenance technique. These are the main reasons why the
method has been widely accepted by other local governments.
Information Source:
http://kankyo.city.fukuoka.jp/gomi/shisetsu/saisyu3.htm (Japanese only)
33
Fukuoka City Environmental Bureau, ‘Towards a Wholly-Recycling Society, The Fukuoka
Method – What is the semi-aerobic landfill?, (Fukuoka, 1999)
Table 1. Structure of Semi-aerobic landfill
Table 2. Landfill type and change in leachate BOD over time
(BOD concentration by mg/l)
Type of Landfill/Elapsed time after landfill (year)
0 year 0.5 1 1.5
Aerobic Landfill 100,000 10,000 10 - Semi-aerobic Landfill 100,000 10,000 100 - Anaerobic Landfill 100,000 100,000 100,000 100,000
Source: Fukuoka City Environmental Bureau, ‘Towards a Wholly-Recycling
Society, The Fukuoka Method – What is the semi-aerobic landfill?
(Fukuoka, 1999), p5.

34
Volume-based Collection Fee System of Solid Waste
Location: Inchon City, Republic of Korea
Time Frame: 1995-onwards
Programme/Project Status: ongoing (midterm evaluation available)
Background:
Inchon Metropolitan Area is and international trading port located in the middle-west coast of the Korean
Peninsula. Being a growing center of land and maritime transportation in Korea, the population of the city
rapidly increased from 1.4 million to 2.2 million during the period of 1985-1994 (59% increase). Although the
city has the largest land area in major Korean cities (954 km2) and a possible option for building new landfill
sites to meet the management need for concurring solid waste increase, the reduction of its amount became an
essential measure to be taken for the solution of the root causes.
Measures taken:
‘Volume -based Collection Fee System of Solid Waste’ was a measure taken as a part of the ‘Green Inchon 21
Programme : Making Inchon Clean.’ According to this programme, the overall timeframe was set, consisting
three stages; a ground pitting stage (1995-1997), a development stage (1998-2000) and a maturing stage
(2001 onwards). To reduce the waste amount produced by household, the city introduced the obligatory use of
standardized plastic bags for solid waste collection.
To support the reducing waste amount produced by each household, additional component measures were
conducted. 16 high speed fermentation processor were installed and 2,065 fermentation processors were
distributed for household use. Also, seven centers for the treatment of reusable waste were established.
35
Impact:
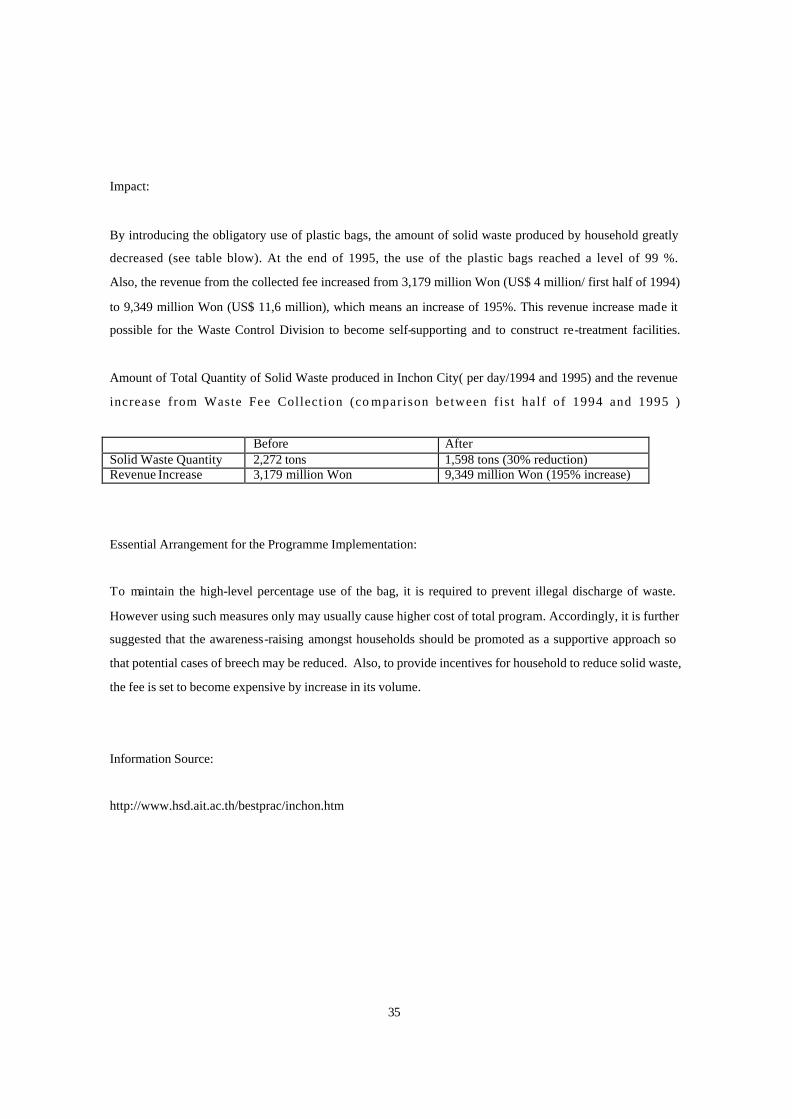
By introducing the obligatory use of plastic bags, the amount of solid waste produced by household greatly
decreased (see table blow). At the end of 1995, the use of the plastic bags reached a level of 99 %.
Also, the revenue from the collected fee increased from 3,179 million Won (US$ 4 million/ first half of 1994)
to 9,349 million Won (US$ 11,6 million), which means an increase of 195%. This revenue increase made it
possible for the Waste Control Division to become self-supporting and to construct re-treatment facilities.
Amount of Total Quantity of Solid Waste produced in Inchon City( per day/1994 and 1995) and the revenue
increase from Waste Fee Collection (co mparison between f is t half of 1994 and 1995 )
Before After
Solid Waste Quantity 2,272 tons 1,598 tons (30% reduction) Revenue Increase 3,179 million Won 9,349 million Won (195% increase)
Essential Arrangement for the Programme Implementation:
To maintain the high-level percentage use of the bag, it is required to prevent illegal discharge of waste.
However using such measures only may usually cause higher cost of total program. Accordingly, it is further
suggested that the awareness-raising amongst households should be promoted as a supportive approach so
that potential cases of breech may be reduced. Also, to provide incentives for household to reduce solid waste,
the fee is set to become expensive by increase in its volume.
Information Source:
http://www.hsd.ait.ac.th/bestprac/inchon.htm
36
JBIC Assistance Project for Metro Manila Traffic Improvement
Location: Metro Manila, Philippines
Time Frame: 1982-onwards
Programme/Project Status: ongoing (midterm evaluation available)
Background:
Compared with other mega cities in South East Asia, such as Singapore, or Kuala Lumpur,
or Bangkok, Metro Manila’s traffic network was less developed. Since the city’s only means
for transportation is automobile (light rail transit system is yet to be introduced), avoiding
traffic congestion is of paramount importance for its economy as well as environmental
issue. In view of these points, the Japan Bank for International Cooperation (JBIC) has
provided financial and technical support with the government of the Philippines and
municipal authorities of Metro Manila, in construction of roads to further enhance its
traffic situation.
Measures taken:
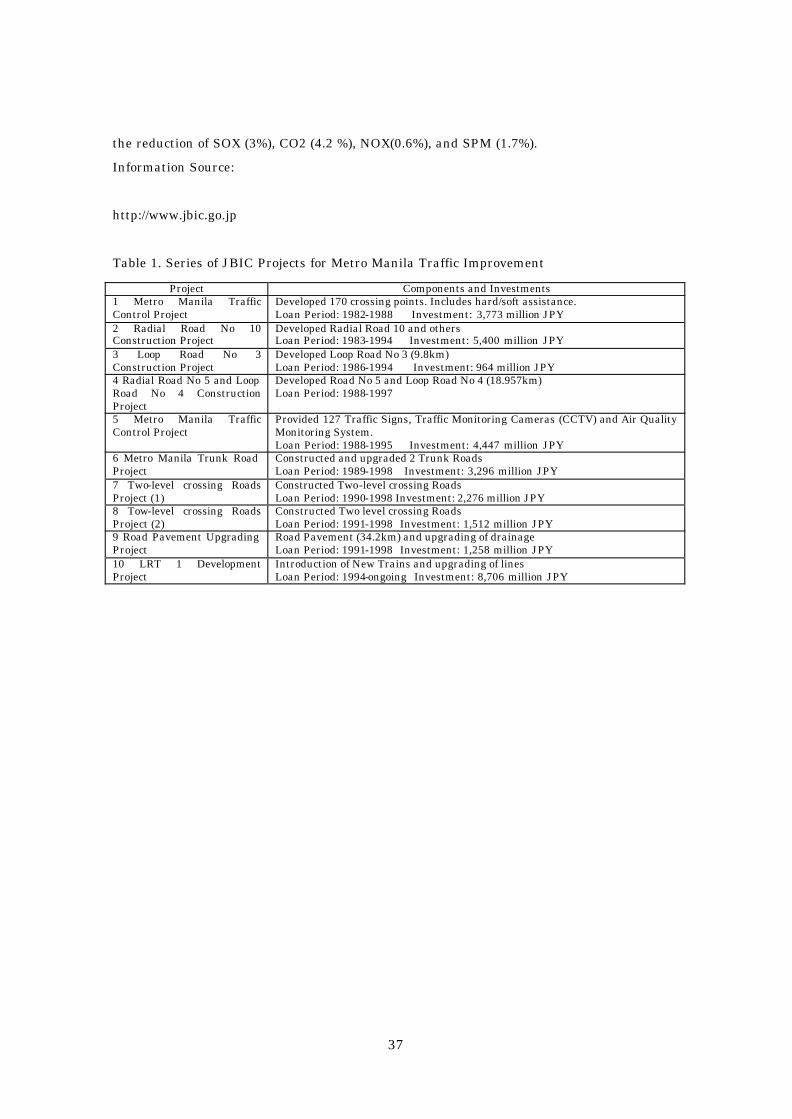
A series of yen loan projects were conducted in the Metro Manila area as shown in Table 1.
Except Project No.10 (Light Rail Transit Construction), all project components were
development of roads. It should be noted that in Project No. 5, the Air Pollution Monitoring
System was introduced, which enable the authority to comprehend the environmental
impact of traffic.
Impact:
According to JBIC Impact Evaluation on Metro Manila Traffic Network (conducted by the
third party) Economic Impact (EIRR) was 33% in average (Road construction/ upgrading;
48% and Two-level road construction; 24). Compared with the situation before the project
(before 1982) traffic congestion was reduced by 10%. Also it is estimated that the series of
projects had a positive impact on mitigating air pollution caused by traffic congestion, with
37
the reduction of SOX (3%), CO2 (4.2 %), NOX(0.6%), and SPM (1.7%).
Information Source:
http://www.jbic.go.jp
Table 1. Series of JBIC Projects for Metro Manila Traffic Improvement
Project Components and Investments 1 Metro Manila Traffic Control Project
Developed 170 crossing points. Includes hard/soft assistance. Loan Period: 1982-1988 Investment: 3,773 million JPY
2 Radial Road No 10 Construction Project
Developed Radial Road 10 and others Loan Period: 1983-1994 Investment: 5,400 million JPY
3 Loop Road No 3 Construction Project
Developed Loop Road No 3 (9.8km) Loan Period: 1986-1994 Investment: 964 million JPY
4 Radial Road No 5 and Loop Road No 4 Construction Project
Developed Road No 5 and Loop Road No 4 (18.957km) Loan Period: 1988-1997
5 Metro Manila Traffic Control Project
Provided 127 Traffic Signs, Traffic Monitoring Cameras (CCTV) and Air Quality Monitoring System. Loan Period: 1988-1995 Investment: 4,447 million JPY
6 Metro Manila Trunk Road Project
Constructed and upgraded 2 Trunk Roads Loan Period: 1989-1998 Investment: 3,296 million JPY
7 Two-level crossing Roads Project (1)
Constructed Two-level crossing Roads Loan Period: 1990-1998 Investment: 2,276 million JPY
8 Tow-level crossing Roads Project (2)
Constructed Two level crossing Roads Loan Period: 1991-1998 Investment: 1,512 million JPY
9 Road Pavement Upgrading Project
Road Pavement (34.2km) and upgrading of drainage Loan Period: 1991-1998 Investment: 1,258 million JPY
10 LRT 1 Development Project
Introduction of New Trains and upgrading of lines Loan Period: 1994-ongoing Investment: 8,706 million JPY
38
Singapore ’s Transportation Policy
Location: Singapore
Time Frame: 1970’s - onwards
Programme/Project Status: ongoing (midterm evaluation available)
Background:
Singapore has a total land of 645.5 square kilometers and populated 3.15 million. When it
was independent in 1965, as other Asian big cities today, traffic congestion was severe,
causing a big economic and ecological damage. Under this circumstance, providing effective
land-use and transportation system has always been a priority issue for the country’s
economy. Furthermore, due to the limited space, building new roads was not a possible
option (15% of total land has already in use for roads). As a consequence, the government
has taken miscellaneous measures to manage to provide excellent mass transportation, and
restrict the car possession, which have successfully avoided traffic congestion.
Measures taken:
(1) Provision of Public Transportation System
The government’s transportation policy* has conducted in conjunction with the Master Plan
for Land-use established in 1971, which articulated the provision of Mass Rapid Transit
(MRT). Currently Singapore has 2 lines of MRT (83 km, 48 stations), 1 line of Light Rapid
Transit (7.8km, 14 stations) for suburban area, 3,600 buses (3 companies) and 18,000 taxies
(4 companies). Since most population of the city (86%) resides in public housing complex
provided by the governments, the flow of population between those residence and working
places is effectively controlled, and the above transportation system plays the vital role to
support the mass transit.
* in 1960’s the government established the Road and Transportation Action Committee
(RTAC) as a cross-cutting committee to effectively tackle the severe traffic issue in concert.
(2) Car Licensing System
39
Although Singaporean purchasing power is quite higher, compared with other ASEAN
nations, the possession of a vehicle is controlled by the Car Licensing System. Those who
wish to purchase a car are required to obtain permission and meet the criteria set by the
government. In addition to the administrative permission, possession of a car is usually not
a practical option due to the high cost of maintenance
(3) Road Pricing Scheme
One of the unique but significant components of the government’s transportation policy is
the Road Pricing Scheme (RPS). In 1975, it has firstly introduced Area Licensing System
(ALS) for preventing traffic congestions in the Central Business District. The ALS set
Restricted Zones (RZ), where licensed driver are only permitted to enter, by purchasing
permission in advance. In 1995, the government also imposed road pricing in 3 major urban
highways, where congestion was severe.
Although these systems were quite effective, it had a shortcoming in the administrative
cost in regulation enforcements (for avoiding illegal drivers). Also, it was sought to improve
the system to set prices by the degree of traffic congestion. For this reason, the
governments newly introduced Electric Road Pricing System (ERP). In this system drivers
are to pay fee by an IC cash card when entering Restricted Zones. ERP fee changes every 30
minutes by the condition of traffic congestion.
Impact:
As a consequence of tremendous efforts in comprehensive manner, Singapore has been
managed to control traffic congestion, while maintaining easy transportation access of
residents. According to a survey by the government, traffic speed is 20-30 km/h in
commercial centers all day and 45-60 km in highways in rush hours. Energy use rate for
private / public vehicles seems to be quite low, especially compared with those in other
South East Asian mega cities, such as Bangkok, Jakarta, and Metro Manila (data not
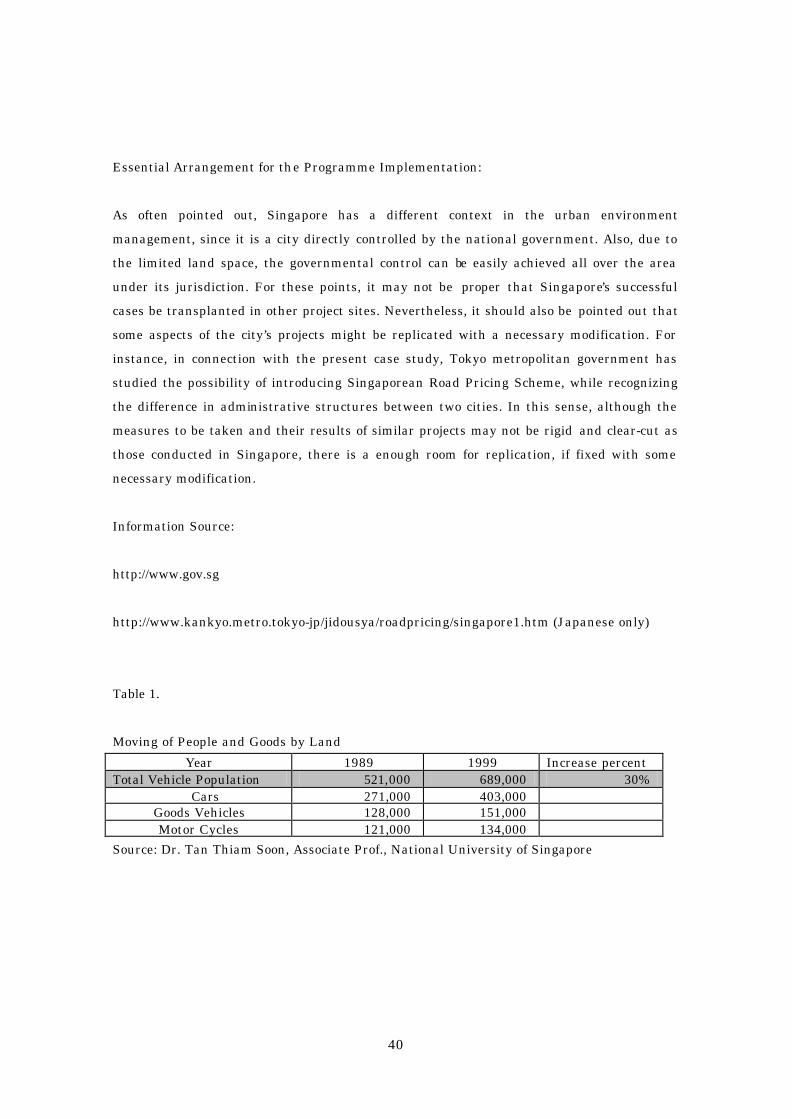
available). The table below shows the comparison in the number of vehicles registered in
Singapore. According to the survey, the total number of vehicle marked only 30% increase
in these 10 years, due to the abovementioned government policy. This is also unique
amongst South East Asian cities, where the motorization is in trend.
40
Essential Arrangement for the Programme Implementation:
As often pointed out, Singapore has a different context in the urban environment
management, since it is a city directly controlled by the national government. Also, due to
the limited land space, the governmental control can be easily achieved all over the area
under its jurisdiction. For these points, it may not be proper that Singapore’s successful
cases be transplanted in other project sites. Nevertheless, it should also be pointed out that
some aspects of the city’s projects might be replicated with a necessary modification. For
instance, in connection with the present case study, Tokyo metropolitan government has
studied the possibility of introducing Singaporean Road Pricing Scheme, while recognizing
the difference in administrative structures between two cities. In this sense, although the
measures to be taken and their results of similar projects may not be rigid and clear-cut as
those conducted in Singapore, there is a enough room for replication, if fixed with some
necessary modification.
Information Source:
http://www.gov.sg
http://www.kankyo.metro.tokyo-jp/jidousya/roadpricing/singapore1.htm (Japanese only)
Table 1.
Moving of People and Goods by Land
Year 1989 1999 Increase percent Total Vehicle Population 521,000 689,000 30%
Cars 271,000 403,000 Goods Vehicles 128,000 151,000 Motor Cycles 121,000 134,000
Source: Dr. Tan Thiam Soon, Associate Prof., National University of Singapore
41
Jakarta ’s Kampung Improvement Programme (KIP)
Location: Jakarta, Republic of Indonesia
Time Frame: 1970-1980
Programme/Project Status: completed
Background:
‘Kampungs’ are the informal, unplanned and, in many cases, unserviced housing area,
which can roughly be understood as illegal squatters areas or slums in the context of the
present case. In 1960-1990’s, inspired by the rapid economic growth of Indonesian economy
under the strong leadership of the President Suharto, Jakarta experienced a massive influx
of population from rural areas, and squatters formed kampungs around the city. Due to the
lack of public service in sewages, garbage collection, and other hygiene-related matters,
residents’ health and living condition were in extremely bad situation. Also such kampungs
themselves gave harmful effect to the urban environment, as in solid waste management,
waste water treatment etc. Such is the case in other cities in Indonesia as well as in many
Asian Pacific cities, accordingly it may be interesting to take up the present successful case,
taking into account of possible replication in future.
Measures taken:
Traditionally, a rigid measure was taken to solve slum issues in Asia and Pacific cities, by
‘forced removal’ or evacuation. However, such a measure is now understood to be ineffective,
merely causing squatters to move to other kampungs. The city government of Jakarta, in
cooperation with the national government, and World Bank, sought to tackle a root causes
-poverty-, thus made efforts to upgrade residents living standards.
Since ‘kampungs’ were formed illegally, the city government was unable to support those
illegal residents theoretically. Therefore the ‘legalization’ of such residents was the primary
access by the government. In view of this situation, national law introduced a new concept,
under which a continuous occupation of a land for certain period would result ‘entitlements’
for the relevant resident to reside in a given place.
42
In addition to the legalization measure, the city government financial support residents to
upgrade living infrastructure inside kampungs, by ensuring residents ownership (the city
government sought financial resource from World Bank loan). Upgraded facilities include
roads, footpaths, drainage canals, water supply, sanitation, solid waste disposal, schools
and clinics. In this method, community group in kampungs took initiatives in formulating a
development plan as well as maintaining the public services.
Impact:
As a major impacts of the programme, kampungs houses were greatly improved.
Residence, , now have brick/cement walls, tile/terrazzo and cement floors, and tile and zinc
roofs, which is less vulnerable to floods or storms than those build with bamboo or wood. In
conjunction with housing construction raw sewage/sanitary toilet system was introduced,
which contributed to hygiene of the residents.
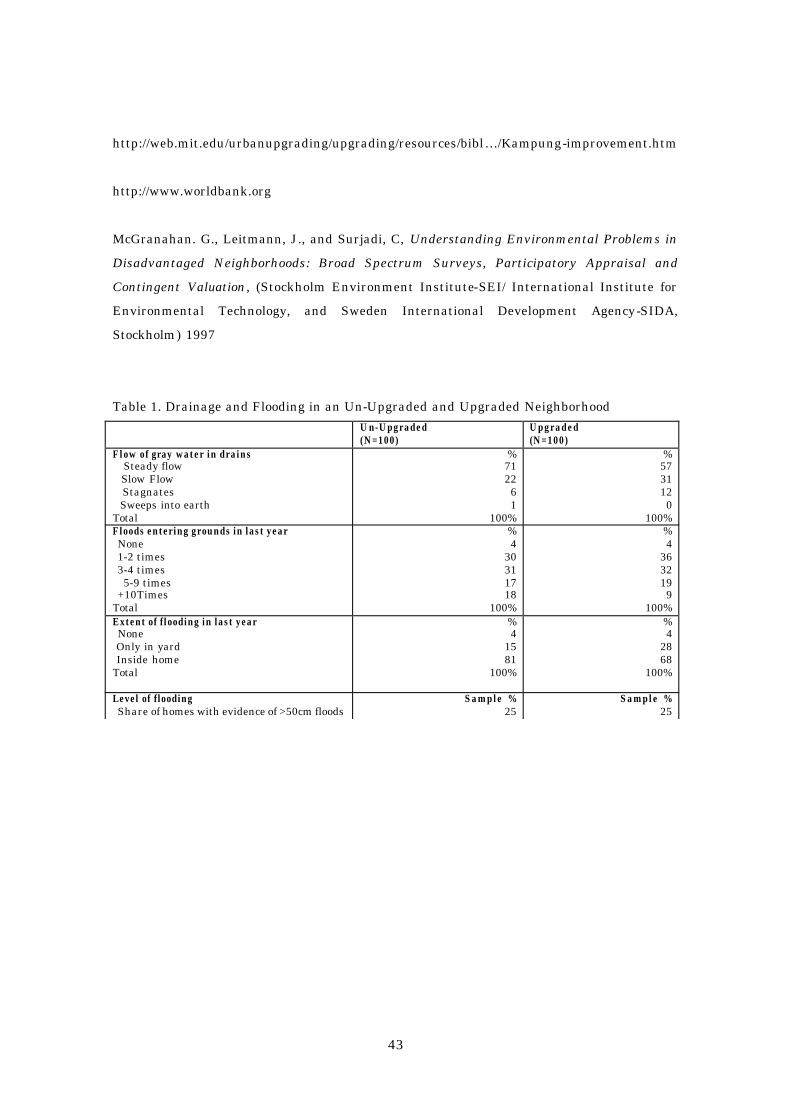
Swedish SIDA surveyshows miscellaneous improvements in comparison between ‘pre-KIP’
neighborhood and nearby ‘post-KIP’ neighborhood. Here, in particular, environment and
health-related data are cited as tables below. *
*cited from McGranahan. G., Leitmann, J., and Surjadi, C, Understanding Environmental Problems in
Disadvantaged Neighborhoods: Broad Spectrum Surveys, Participatory Appraisal and Contingent Valuation,
(Stockholm Environment Institute-SEI/ International Institute for Environmental Technology, and Sweden
International Development Agency-SIDA, Stockholm) 1997
Essential Arrangement for the Programme Implementation:
The most unique aspect of the present case is the legal measure taken by the national
government, which helped the city government taking an initiative to solve the problem,
which had been in ‘deadlock ’ situation for long time. Another distinctive feature is the
involvement and ownership of the kampung residents. Since such residents belong to the
lowest income group of the city population, who newly flew from rural areas, their social
integration is a crucial problem. In this sense, the impact of the programme represents
environmental, social and economic aspects. This programme has already been replicated
in other cities in the country, such as Surabaya and Denpasar.
Information Source:
http://www.nic-nagoya.or.jp/nicaradar0010.htm (Japanese only)
43
http://web.mit.edu/urbanupgrading/upgrading/resources/bibl…/Kampung-improvement.htm
http://www.worldbank.org
McGranahan. G., Leitmann, J., and Surjadi, C, Understanding Environmental Problems in
Disadvantaged Neighborhoods: Broad Spectrum Surveys, Participatory Appraisal and
Contingent Valuation, (Stockholm Environment Institute-SEI/ International Institute for
Environmental Technology, and Sweden International Development Agency-SIDA,
Stockholm) 1997
Table 1. Drainage and Flooding in an Un-Upgraded and Upgraded Neighborhood U n-Upgraded
(N=100) Upgraded (N=100)
Flow of gray water in drains Steady flow
Slow Flow Stagnates Sweeps into earth Total
% 71 22 6 1
100%
% 57 31 12 0
100% Floods entering grounds in last year None 1-2 times 3-4 times
5-9 times +10Times Total
% 4
30 31 17 18
100%
% 4
36 32 19 9
100% Extent of flooding in last year None Only in yard Inside home Total
% 4
15 81
100%
% 4
28 68
100%
Level of flooding Share of homes with evidence of >50cm floods
Sample % 25
Sample % 25
44
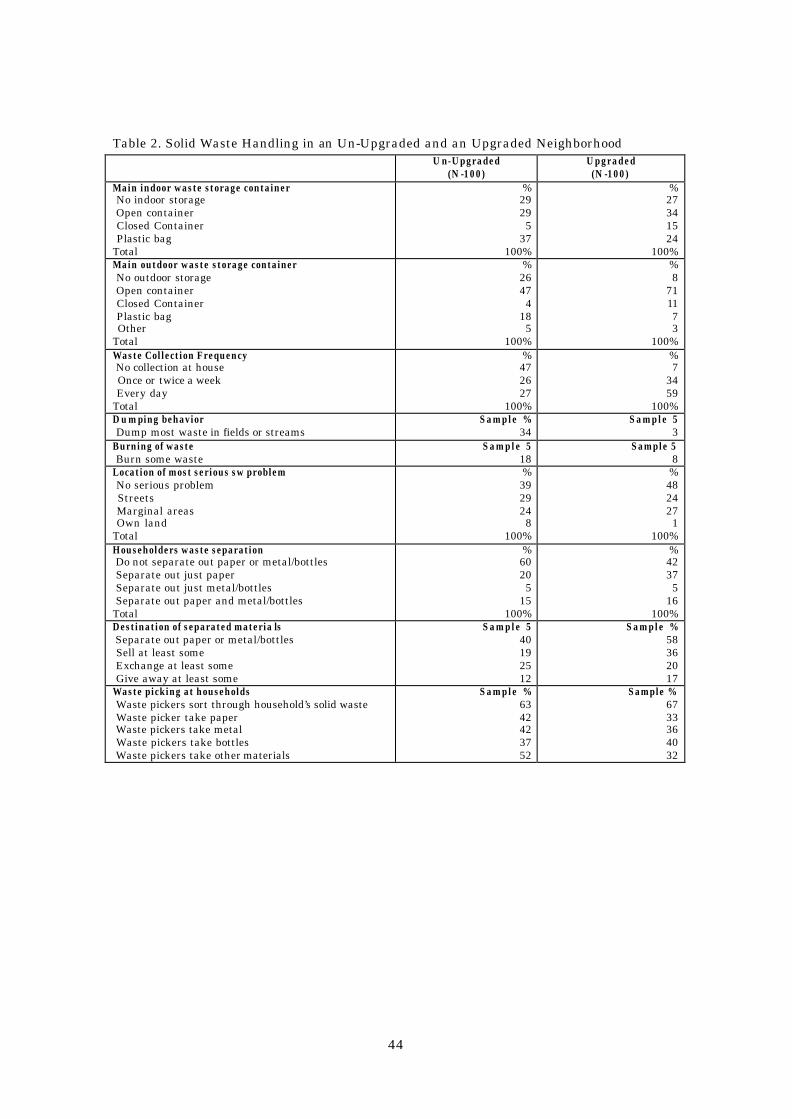
Table 2. Solid Waste Handling in an Un-Upgraded and an Upgraded Neighborhood U n-Upgraded
(N -100) Upgraded (N -100)
Main indoor waste storage container No indoor storage Open container Closed Container Plastic bag Total
% 29 29 5
37 100%
% 27 34 15 24
100% Main outdoor waste storage container No outdoor storage Open container Closed Container Plastic bag Other Total
% 26 47 4
18 5
100%
% 8
71 11 7 3
100% Waste Collection Frequency No collection at house Once or twice a week Every day Total
% 47 26 27
100%
% 7
34 59
100% D u m ping behavior Dump most waste in fields or streams
Sample % 34
S a m p l e 5 3
Burning of waste Burn some waste
S a m p l e 5 18
Sample 5 8
Location of most serious sw problem No serious problem Streets Marginal areas Own land Total
% 39 29 24 8
100%
% 48 24 27 1
100% Householders waste separation Do not separate out paper or metal/bottles Separate out just paper Separate out just metal/bottles Separate out paper and metal/bottles Total
% 60 20 5
15 100%
% 42 37 5
16 100%
Destination of separated materia ls Separate out paper or metal/bottles Sell at least some Exchange at least some Give away at least some
S a m p l e 5 40 19 25 12
Sample % 58 36 20 17
Waste picking at households Waste pickers sort through household’s solid waste Waste picker take paper Waste pickers take metal Waste pickers take bottles Waste pickers take other materials
Sample % 63 42 42 37 52
Sample % 67 33 36 40 32
45
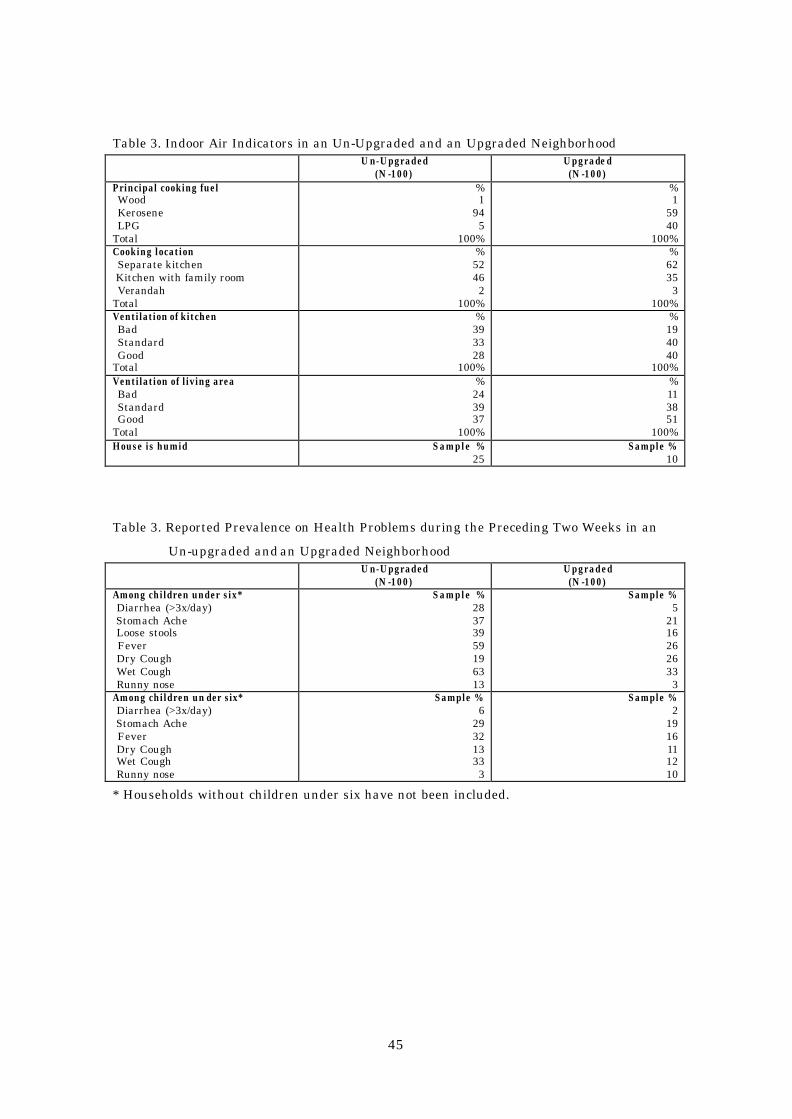
Table 3. Indoor Air Indicators in an Un-Upgraded and an Upgraded Neighborhood U n-Upgraded
(N -100) Upgrade d (N -100)
Principal cooking fuel Wood Kerosene LPG Total
% 1
94 5
100%
% 1
59 40
100% Cooking location Separate kitchen Kitchen with family room Verandah Total
% 52 46 2
100%
% 62 35 3
100% Ventilation of kitchen Bad Standard Good Total
% 39 33 28
100%
% 19 40 40
100% Ventilation of living area Bad Standard Good Total
% 24 39 37
100%
% 11 38 51
100% House is humid Sample %
25 Sample %
10
Table 3. Reported Prevalence on Health Problems during the Preceding Two Weeks in an
Un-upgraded and an Upgraded Neighborhood U n-Upgraded
(N -100) Upgraded (N -100)
Among children under six* Diarrhea (>3x/day) Stomach Ache Loose stools Fever Dry Cough Wet Cough Runny nose
Sample % 28 37 39 59 19 63 13
Sample % 5
21 16 26 26 33 3
Among children un der six* Diarrhea (>3x/day) Stomach Ache Fever Dry Cough Wet Cough Runny nose
Sample % 6
29 32 13 33 3
Sample % 2
19 16 11 12 10
* Households without children under six have not been included.
46
Orangi Pilot Project
Location: Orangi Quarter, Karachi, Pakistan
Time Frame: 1980-1993
Programme/Project Status: Completed
Background:
In Karachi, government sponsored initiatives to regularize squatter settlements failed because
of landowners. While the continuous population influx into Karachi from rural areas has
enlarged squatters of low-income group, hardly any adequate sanitation service was provided
by the public sectors. Frustrated by this situation, Orangi Pilot Project (hereinafter referred to
as OPP), a community-based organization/research institute, began replacing open drainage
and installation of underground raw sewage, without which the Orangi quarter suffered from
the deteriorating human health environment. Although the project itself is not initiated by the
local government nor the central government, rather for the purpose of filling their void, it was
later replicated in other project sites involving local governments. For this point, this case may
provide some significant insight for dealing with wastewater management in urban areas.
Measures Taken:
Being a research institute, not a funding or project executing agency, OPP itself did not provide
any subsidy nor labor input. OPP only provided the community with consultancy in awareness-
raising, basic research, planning, monitoring/evaluation (and their concurring costs),
supporting documentation and other technical matters. The distinctive features of OPP are
based upon its discipline that (1) the project’s final beneficiaries must have a strong ownership
for its implementation as well as post-project maintenance, (2) provision of subsidy tends to
lead community’s dependence upon donors and other assistance agencies (cost for building raw
swage facilities must be borne by and collected from each household), and for this reason, (3) it
47
should take time and energy to mobilize and organize the community through seminars,
negotiation and frequent communications.
Along this discipline, through active community members, OPP support them to form a
consensus that they themselves pay for the building cost. Since the community consists of low-
income households, OPP assisted them in minimizing the construction cost, by simplifying
facilities to be introduced. This also contributed to making the maintenance process easier.
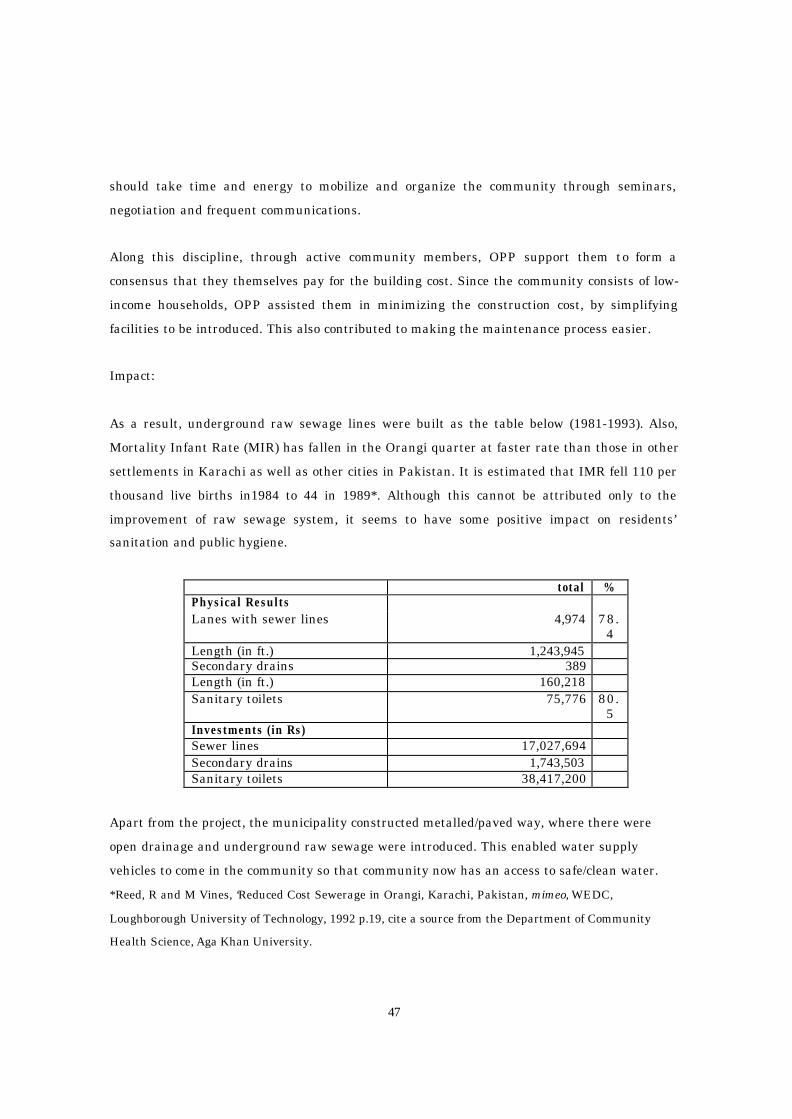
Impact:
As a result, underground raw sewage lines were built as the table below (1981-1993). Also,
Mortality Infant Rate (MIR) has fallen in the Orangi quarter at faster rate than those in other
settlements in Karachi as well as other cities in Pakistan. It is estimated that IMR fell 110 per
thousand live births in1984 to 44 in 1989*. Although this cannot be attributed only to the
improvement of raw sewage system, it seems to have some positive impact on residents’
sanitation and public hygiene.
total % Physical Results Lanes with sewer lines 4,974 78.
4 Length (in ft.) 1,243,945 Secondary drains 389 Length (in ft.) 160,218 Sanitary toilets 75,776 80.
5 Investments (in Rs) Sewer lines 17,027,694 Secondary drains 1,743,503 Sanitary toilets 38,417,200
Apart from the project, the municipality constructed metalled/paved way, where there were
open drainage and underground raw sewage were introduced. This enabled water supply
vehicles to come in the community so that community now has an access to safe/clean water.
*Reed, R and M Vines, ‘Reduced Cost Sewerage in Orangi, Karachi, Pakistan, mimeo, WEDC,
Loughborough University of Technology, 1992 p.19, cite a source from the Department of Community
Health Science, Aga Khan University.

48
Essential Arrangements for the Programme Implementation:
As mentioned, physical and financial parts of project were conducted by the community, while
OPP only provided technical, research or knowledge-based assistance. Therefore the consensus
and ownership-consciousness of the community were strongly emphasized. Also, it is pointed
out that avoiding external funding made it possible to reduce the total cost of the facility
construction, as well as community’s overly dependence to donor agencies.
Orangi model has been replicated in several project sites in Pakistan, such as Lahore.
Inforamtion Sources:
http://www.unescap.org/drpad/vc/conference/ex_pk5_opp.htm
http://www.hsd.ait.ac.th/bestprac/orangi.htm
Zaidi, S Akbar, ‘ Transforming Urban Settlements: The Orangi Pilot Project’s Low-Cost
Sanitation Model’, (City Press, Karachi) 2000.
49
Urban Slum Improvement in Visakhapatnam
Location: Visakhapatnam, India
Time Frame: 1988-1995
Programme/Project Status: Completed
Background:
Visakhapatnam lies on the east coast of India, midway between Calcutta and Madras.
Between 1971 and 1991 its population trebled from 360 000 to 1.05 million. This rapid
increase reflected the city’s industrial growth as a major naval base and manufacturing
center, the poverty of surrounding rural areas from which many migrate and the high birth
rate. However there is an acute shortage of land in the city, which is bounded by hills and
sea. Population density is high, with 30 000 persons per square kilometer over much of the
city. Despite some industrial prosperity over 200 000 people (40 000 households) live in
nearly 200 officially designated slums.
In 1988, the Municipal Corporation of Visakhapatnam, supported by the UK Overseas
Development Administration (UKODA), started a major program to improve 170 slums
(subsequently expanded to cover 200). This programme included physical infrastructure
improvements, improved water supply, public toilets, community centers, primary health
care services and educational and vocational training.
Measures taken:
The slum upgrading programmes comprises in the following components.
Land Reform
The land reforms were designated to give slum inhabitants security of tenure and a stake
in the slum improvements, and to provide and organized layout of each slum. The MCV
purchased land in about 20 slums then in private ownership, planned the 170 slums,
allowing 60 square yards per plot, and provided legal tenure, pattas (permanent free land
50
lease) to the plots.
Upgrading and Maintenance of Facilities
Since basic infrastructure for solid waste and waste water were not existed in the slum, in
conjunction with the land reform measures, the drainage, public toilets etc. were
introduced.
Maintenance of infrastructure is shared between the MCV ad the slum communities. The
MCV is responsible for replacing worn-out asphalt roads, waste collection and maintaining
drains. The slum communities are responsible for cleaning drains and sewers, patching
roads, replacing inspection chambers and manhole covers, repairing linkages in pipelines
and maintaining community centers.
Education and Vocational Training
As a support measure of the slum upgrading programme, education and vocational training
course were provided with the slum residents. Although this component is not directly
relevant with environmental improvement of the slum, from the point of view of social
integration of the residents, which has a vital step to access the issue of and maintain
efforts for environmental improvement, education and vocational training course was
implemented.
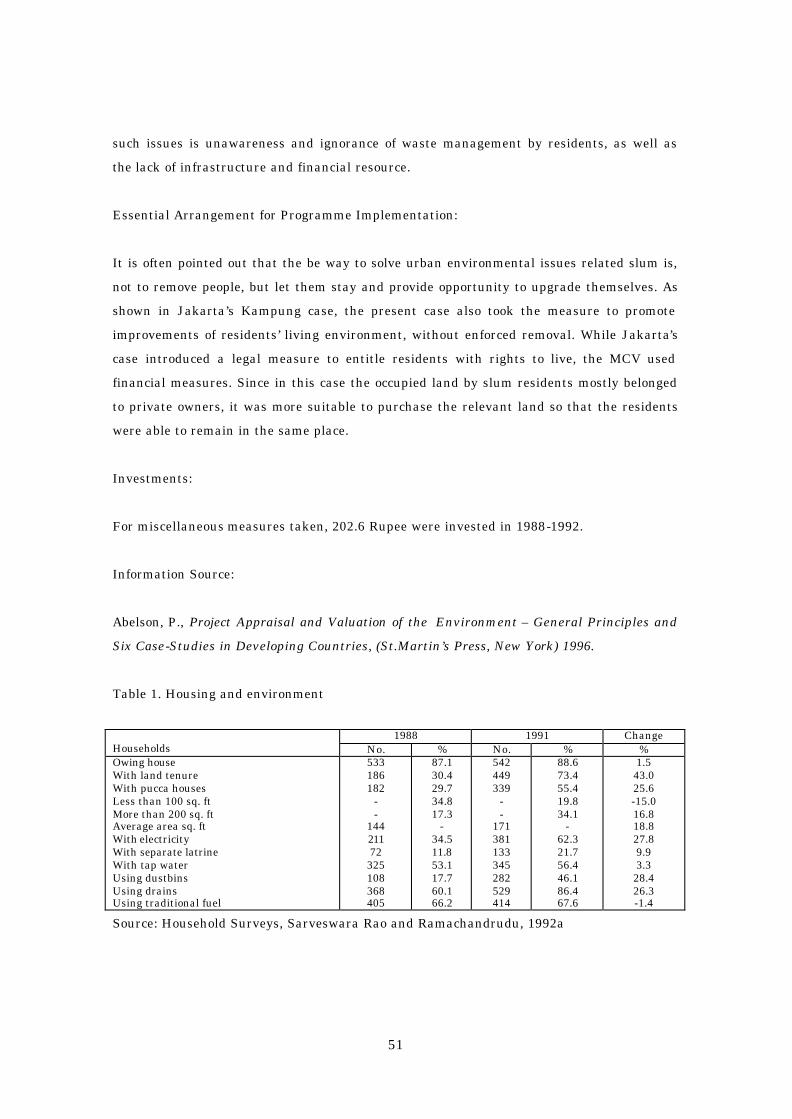
Impact:
As shown in Table 1, many more households had secure land tenure in 1991 than in 1988.
Waste disposal practices improved, with greater use of dustbins for solid wastes and drains
(instead of roads or paths) for wastewater. The risk of flood and fire was reduced.
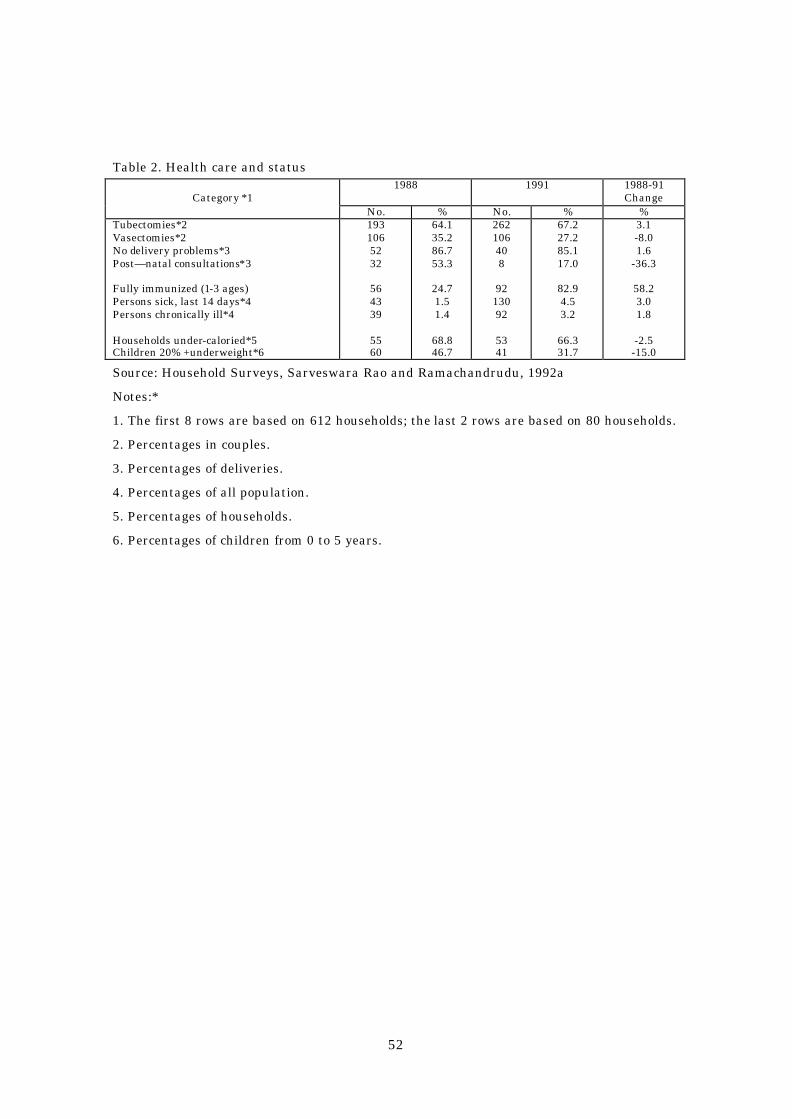
Such solid waste/wastewater –related practice improvement was also reflected in the
residents’ health condition. As shown Table 2., through the programme, the number of
immunized residents increased. Some items in the table did not show a remarkable
improvement or even some negative results, but this is thought to be due to an increased
tendency to report disease.
Apart from the impacts substantially related with environment and residents’ health
condition, other co-benefits can be found in improvement of employment and literacy rate.
As is the case with programmes for environmental improvement by slum upgrading,
education components is especially important, since one of the most serious root causes of
51
such issues is unawareness and ignorance of waste management by residents, as well as
the lack of infrastructure and financial resource.
Essential Arrangement for Programme Implementation:
It is often pointed out that the be way to solve urban environmental issues related slum is,
not to remove people, but let them stay and provide opportunity to upgrade themselves. As
shown in Jakarta’s Kampung case, the present case also took the measure to promote
improvements of residents’ living environment, without enforced removal. While Jakarta’s
case introduced a legal measure to entitle residents with rights to live, the MCV used
financial measures. Since in this case the occupied land by slum residents mostly belonged
to private owners, it was more suitable to purchase the relevant land so that the residents
were able to remain in the same place.
Investments:
For miscellaneous measures taken, 202.6 Rupee were invested in 1988-1992.
Information Source:
Abelson, P., Project Appraisal and Valuation of the Environment – General Principles and
Six Case-Studies in Developing Countries, (St.Martin’s Press, New York) 1996.
Table 1. Housing and environment
1988 1991 Change
Households No. % No. % % Owing house With land tenure With pucca houses Less than 100 sq. ft More than 200 sq. ft Average area sq. ft With electricity With separate latrine With tap water Using dustbins Using drains Using traditional fuel
533 186 182
- -
144 211 72 325 108 368 405
87.1 30.4 29.7 34.8 17.3
- 34.5 11.8 53.1 17.7 60.1 66.2
542 449 339
- -
171 381 133 345 282 529 414
88.6 73.4 55.4 19.8 34.1
- 62.3 21.7 56.4 46.1 86.4 67.6
1.5 43.0 25.6 -15.0 16.8 18.8 27.8 9.9 3.3 28.4 26.3 -1.4
Source: Household Surveys, Sarveswara Rao and Ramachandrudu, 1992a
52
Table 2. Health care and status 1988 1991 1988-91
Change
Category *1 No. % No. % %
Tubectomies*2 Vasectomies*2 No delivery problems*3 Post—natal consultations*3 Fully immunized (1-3 ages) Persons sick, last 14 days*4 Persons chronically ill*4 Households under-caloried*5 Children 20% +underweight*6
193 106 52 32
56 43 39
55 60
64.1 35.2 86.7 53.3
24.7 1.5 1.4
68.8 46.7
262 106 40 8
92 130 92
53 41
67.2 27.2 85.1 17.0
82.9 4.5 3.2
66.3 31.7
3.1 -8.0 1.6
-36.3
58.2 3.0 1.8
-2.5 -15.0
Source: Household Surveys, Sarveswara Rao and Ramachandrudu, 1992a
Notes:*
1. The first 8 rows are based on 612 households; the last 2 rows are based on 80 households.
2. Percentages in couples.
3. Percentages of deliveries.
4. Percentages of all population.
5. Percentages of households.
6. Percentages of children from 0 to 5 years.
Related Documents


