ARTICLES PUBLISHED ONLINE: 1 DECEMBER 2013 | DOI:10.1038/NCLIMATE2055 Mid-latitude westerlies as a driver of glacier variability in monsoonal High Asia Thomas Mölg * , Fabien Maussion and Dieter Scherer Glaciers in High Asia store large amounts of water and are affected by climate change. Efforts to determine decadal-scale glacier change are therefore increasing, predicated on the concept that glaciers outside the northwest of the mountain system are controlled by the tropical monsoon. Here we show that the mass balance of Zhadang Glacier on the southern Tibetan Plateau, 2001–2011, was driven by mid-latitude climate as well, on the basis of high-altitude measurements and combined atmospheric–glacier modelling. Results reveal that precipitation conditions in May–June largely determine the annual mass-balance, but they are shaped by both the intensity of Indian summer monsoon onset and mid-latitude dynamics. In particular, large-scale westerly waves control the tropospheric flow strength over the Tibetan Plateau remotely. This strength alone explains 73% of interannual mass-balance variability of Zhadang Glacier, and affects May–June precipitation and summer air temperatures in many parts of High Asia’s zone of monsoon influence. Thus, mid-latitude climate should be considered as a possible driver of past and future glacier changes in this zone. G laciers in High Asia have great potential to modify the regional hydrology 1 and to trigger natural hazards 2 , and they contribute to sea-level change 3 . Moreover, they are valuable indicators of variability in the Asian monsoon 4 , a major component of the global climate system. Given this importance, a number of recent studies have quantified glacier change in High Asia 2,5–8 and documented widespread glacier loss in recent decades. Only in some northwestern parts have glaciers been stable in the past decade, a behaviour termed the Pamir/Karakoram anomaly 7,8 . The typical framework used to interpret the regionally variable changes is to assume a dominant influence of the mid-latitude westerlies in the northwest of the mountain system through winter precipitation, and monsoon dominance elsewhere through summer precipitation and temperature (for example, refs 5,6). However, physically based studies that evaluate possible contributions from various large-scale circulation systems to local mass-balance controls do not yet exist. Here we test the hypothesis that 11 years of mass-balance variability on Zhadang Glacier, located on the southern Tibetan Plateau (30 ◦ N) in the reach of monsoon influence 6 , can be explained consistently by monsoon activity. The glacier is known to be affected by the Indian summer monsoon 4 (ISM), has shrunk in concert with other glaciers in the region over recent decades 9 , and has been the subject of an intensive field program in recent years (Fig. 1a). It thus provides a unique case study opportunity. We focus on large-scale circulation effects, because local meteorological influences on the mass-balance (temperature and precipitation sensitivity) were investigated in a previous study 4 , and were also presented in other studies of local-scale mass-balance and underlying processes in Tibet 10,11 . The data basis Our work builds on the High Asia Reanalysis (HAR), in which a low-resolution global meteorological data set is dynamically downscaled using a numerical atmospheric model (Methods). The resultant high-resolution data are available at 30 km horizontal resolution over southern and central Asia, and at 10 km resolution over High Asia (Fig. 1a) for the period 2001–2011. HAR altitude Chair of Climatology, Technische Universität Berlin, 12165 Berlin, Germany. *e-mail: [email protected] of the grid cell containing Zhadang Glacier (5,611 m) represents the glaciated elevations, which span the range 5,516–5,983 m (Fig. 1a, inset). Therefore, we use 2-m air temperature, 2-m relative humidity, 10-m wind speed, air pressure, precipitation and cloud cover of this HAR grid cell (Supplementary Fig. 1) as direct input to a physically based glacier model 4,12 , which computes the climatic mass-balance of a glacier from various mass and energy fluxes at hourly intervals (Methods). Thus, the strategy to obtain glacier-wide mass-balance on Zhadang for 2001–2011 follows the new approach of ‘explicit atmospheric/mass-balance modelling’: a mesoscale atmospheric model (with whatever forcing technique) is employed to model high-resolution meteorological conditions over a mountain glacier that do not require further statistical downscaling for use in a mass-balance model 13,14 (summarized in Supplementary Methods). Figure 2a–c shows that the model calculations are in very good agreement with the available measurements on Zhadang Glacier. This is discussed further in Supplementary Discussion and makes our combined HAR–mass- balance modelling system suitable for the analysis of processes that affect glacier mass. To put the calculated mass-balance (Fig. 2d) into an indepen- dent context, global and large-scale gridded meteorological data, which are not a part of the HAR product, are area-averaged for various regions (Fig. 1a). The time series of these area-averages can be used as climate indices, which are discussed below in connection with the results. As a starting point, it is important to note that the typical ISM circulation is established between 25 May and 24 June (Fig. 1b), henceforth the ‘ISM onset period’. A strong (weak) intensity of the ISM onset, that is, high (low) precipitation in the ISM region, does not always coincide with early (late) onset of the circulation (Fig. 1b), but such cases can be expected owing to internal climate variability 15 . The ‘main ISM season’ lasts from 25 June to as late as 19 October (Fig. 1b). Influences of large-scale climate dynamics The characteristics of monsoon onset are one appreciable driver of Zhadang’s mass-balance. Figure 3 illustrates that strong ISM NATURE CLIMATE CHANGE | ADVANCE ONLINE PUBLICATION | www.nature.com/natureclimatechange 1 © 2013 Macmillan Publishers Limited. All rights reserved.

Welcome message from author
This document is posted to help you gain knowledge. Please leave a comment to let me know what you think about it! Share it to your friends and learn new things together.
Transcript
ARTICLESPUBLISHED ONLINE: 1 DECEMBER 2013 | DOI: 10.1038/NCLIMATE2055
Mid-latitude westerlies as a driver of glaciervariability in monsoonal High AsiaThomas Mölg*, Fabien Maussion and Dieter Scherer
Glaciers in High Asia store large amounts of water and are affected by climate change. Efforts to determine decadal-scaleglacier change are therefore increasing, predicated on the concept that glaciers outside the northwest of the mountainsystem are controlled by the tropical monsoon. Here we show that the mass balance of Zhadang Glacier on the southernTibetan Plateau, 2001–2011, was driven by mid-latitude climate as well, on the basis of high-altitude measurements andcombined atmospheric–glacier modelling. Results reveal that precipitation conditions in May–June largely determine theannual mass-balance, but they are shaped by both the intensity of Indian summer monsoon onset and mid-latitude dynamics. Inparticular, large-scale westerly waves control the tropospheric flow strength over the Tibetan Plateau remotely. This strengthalone explains 73% of interannual mass-balance variability of Zhadang Glacier, and affects May–June precipitation and summerair temperatures in many parts of High Asia’s zone of monsoon influence. Thus, mid-latitude climate should be considered as apossible driver of past and future glacier changes in this zone.
Glaciers in High Asia have great potential to modify theregional hydrology1 and to trigger natural hazards2, and theycontribute to sea-level change3. Moreover, they are valuable
indicators of variability in the Asianmonsoon4, a major componentof the global climate system. Given this importance, a number ofrecent studies have quantified glacier change in High Asia2,5–8 anddocumentedwidespread glacier loss in recent decades. Only in somenorthwestern parts have glaciers been stable in the past decade,a behaviour termed the Pamir/Karakoram anomaly7,8. The typicalframework used to interpret the regionally variable changes is toassume a dominant influence of the mid-latitude westerlies in thenorthwest of the mountain system through winter precipitation,and monsoon dominance elsewhere through summer precipitationand temperature (for example, refs 5,6). However, physically basedstudies that evaluate possible contributions from various large-scalecirculation systems to localmass-balance controls do not yet exist.
Here we test the hypothesis that 11 years of mass-balancevariability on Zhadang Glacier, located on the southern TibetanPlateau (30◦N) in the reach of monsoon influence6, can beexplained consistently by monsoon activity. The glacier is knownto be affected by the Indian summer monsoon4 (ISM), hasshrunk in concert with other glaciers in the region over recentdecades9, and has been the subject of an intensive field programin recent years (Fig. 1a). It thus provides a unique case studyopportunity. We focus on large-scale circulation effects, becauselocal meteorological influences on the mass-balance (temperatureand precipitation sensitivity) were investigated in a previous study4,and were also presented in other studies of local-scale mass-balanceand underlying processes in Tibet10,11.
The data basisOur work builds on the High Asia Reanalysis (HAR), in whicha low-resolution global meteorological data set is dynamicallydownscaled using a numerical atmospheric model (Methods). Theresultant high-resolution data are available at 30 km horizontalresolution over southern and central Asia, and at 10 km resolutionover High Asia (Fig. 1a) for the period 2001–2011. HAR altitude
Chair of Climatology, Technische Universität Berlin, 12165 Berlin, Germany. *e-mail: [email protected]
of the grid cell containing Zhadang Glacier (5,611m) representsthe glaciated elevations, which span the range 5,516–5,983m(Fig. 1a, inset). Therefore, we use 2-m air temperature, 2-m relativehumidity, 10-m wind speed, air pressure, precipitation and cloudcover of this HAR grid cell (Supplementary Fig. 1) as directinput to a physically based glacier model4,12, which computes theclimatic mass-balance of a glacier from various mass and energyfluxes at hourly intervals (Methods). Thus, the strategy to obtainglacier-wide mass-balance on Zhadang for 2001–2011 follows thenew approach of ‘explicit atmospheric/mass-balance modelling’: amesoscale atmospheric model (with whatever forcing technique)is employed to model high-resolution meteorological conditionsover a mountain glacier that do not require further statisticaldownscaling for use in a mass-balance model13,14 (summarizedin Supplementary Methods). Figure 2a–c shows that the modelcalculations are in very good agreement with the availablemeasurements on Zhadang Glacier. This is discussed further inSupplementary Discussion and makes our combined HAR–mass-balance modelling system suitable for the analysis of processes thataffect glacier mass.
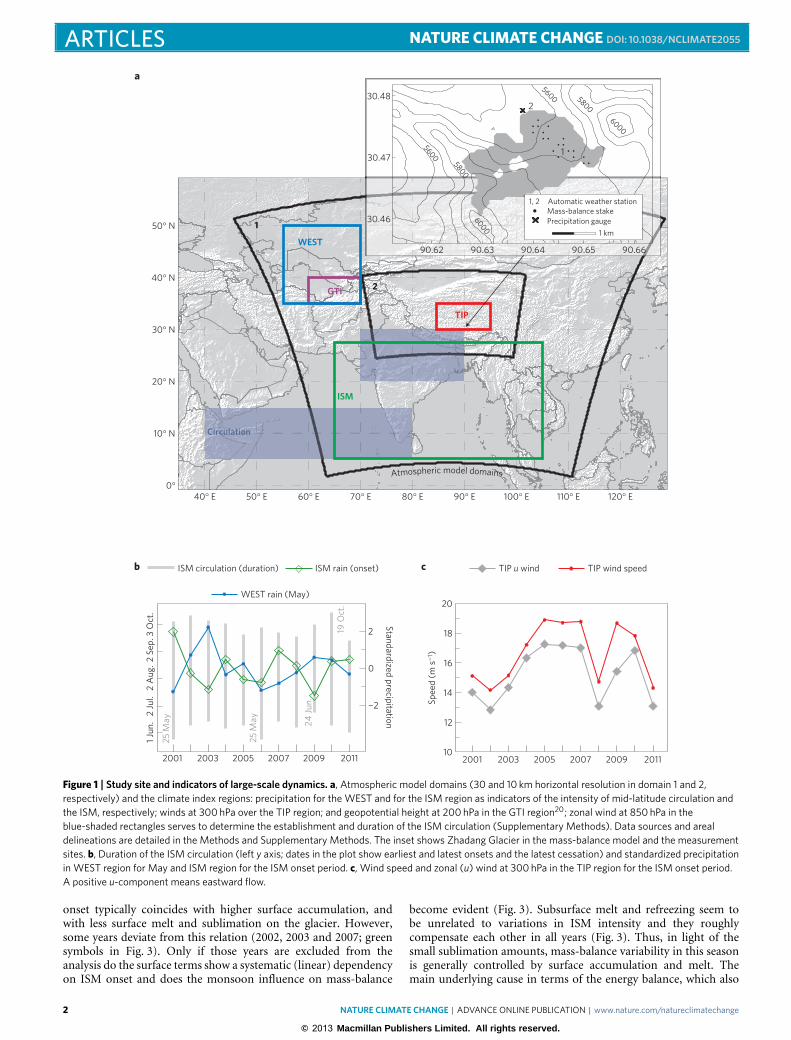
To put the calculated mass-balance (Fig. 2d) into an indepen-dent context, global and large-scale gridded meteorological data,which are not a part of the HAR product, are area-averaged forvarious regions (Fig. 1a). The time series of these area-averages canbe used as climate indices, which are discussed below in connectionwith the results. As a starting point, it is important to note thatthe typical ISM circulation is established between 25 May and24 June (Fig. 1b), henceforth the ‘ISM onset period’. A strong(weak) intensity of the ISM onset, that is, high (low) precipitationin the ISM region, does not always coincide with early (late) onsetof the circulation (Fig. 1b), but such cases can be expected owingto internal climate variability15. The ‘main ISM season’ lasts from25 June to as late as 19 October (Fig. 1b).
Influences of large-scale climate dynamicsThe characteristics of monsoon onset are one appreciable driverof Zhadang’s mass-balance. Figure 3 illustrates that strong ISM
NATURE CLIMATE CHANGE | ADVANCE ONLINE PUBLICATION | www.nature.com/natureclimatechange 1
© 2013 Macmillan Publishers Limited. All rights reserved.
ARTICLES NATURE CLIMATE CHANGE DOI: 10.1038/NCLIMATE2055
40° E 50° E 60° E 70° E 80° E 90° E 100° E 110° E 120° E0°
10° N
20° N
30° N
40° N
50° N
ISM
TIP
WEST
GTI
Circulation
90.62 90.63 90.64 90.65 90.66
30.46
30.47
30.48
1
2
5600
5600
5800
6000
5800
6000
1, 2 Automatic weather stationMass-balance stakePrecipitation gauge
1 km
a
1
2
2001 2003 2005 2007 2009 201110
12
14
16
18
20
2001 2003 2005 2007 2009 2011
¬2
0
2
b c
25 M
ay
25 M
ay 24 J
un.
19 O
ct.
WEST rain (May)
1 Ju
n.2
Jul.
2 A
ug.
2 Se
p.3
Oct
.
Standardized precipitation
TIP u wind TIP wind speed
Spee
d (m
s¬
1 )
Atmospheric model domains
ISM circulation (duration) ISM rain (onset)
Figure 1 | Study site and indicators of large-scale dynamics. a, Atmospheric model domains (30 and 10 km horizontal resolution in domain 1 and 2,respectively) and the climate index regions: precipitation for the WEST and for the ISM region as indicators of the intensity of mid-latitude circulation andthe ISM, respectively; winds at 300 hPa over the TIP region; and geopotential height at 200 hPa in the GTI region20; zonal wind at 850 hPa in theblue-shaded rectangles serves to determine the establishment and duration of the ISM circulation (Supplementary Methods). Data sources and arealdelineations are detailed in the Methods and Supplementary Methods. The inset shows Zhadang Glacier in the mass-balance model and the measurementsites. b, Duration of the ISM circulation (left y axis; dates in the plot show earliest and latest onsets and the latest cessation) and standardized precipitationin WEST region for May and ISM region for the ISM onset period. c, Wind speed and zonal (u) wind at 300 hPa in the TIP region for the ISM onset period.A positive u-component means eastward flow.
onset typically coincides with higher surface accumulation, andwith less surface melt and sublimation on the glacier. However,some years deviate from this relation (2002, 2003 and 2007; greensymbols in Fig. 3). Only if those years are excluded from theanalysis do the surface terms show a systematic (linear) dependencyon ISM onset and does the monsoon influence on mass-balance
become evident (Fig. 3). Subsurface melt and refreezing seem tobe unrelated to variations in ISM intensity and they roughlycompensate each other in all years (Fig. 3). Thus, in light of thesmall sublimation amounts, mass-balance variability in this seasonis generally controlled by surface accumulation and melt. Themain underlying cause in terms of the energy balance, which also
2 NATURE CLIMATE CHANGE | ADVANCE ONLINE PUBLICATION | www.nature.com/natureclimatechange
© 2013 Macmillan Publishers Limited. All rights reserved.

NATURE CLIMATE CHANGE DOI: 10.1038/NCLIMATE2055 ARTICLES
1 May 09 1 Sep. 09 2 Jan. 10 5 May 10 5 Sep. 10 6 Jan. 11 9 May 11 9 Sep. 11¬300
¬200
¬100
0
1 May 09 1 Sep. 09 2 Jan. 10 5 May 10 5 Sep. 10 6 Jan. 11 9 May 11 9 Sep. 11
250
260
270
a
b
¬3,000 ¬2,000 ¬1,000 0
¬3,000
¬2,000
¬1,000
0
¬3,000
¬2,000
¬1,000
0
¬800
¬400
0
2001 2003 2005 2007 2009 2011
c
d
Surf
ace
heig
ht (
cm)
Measurement
Model
Tem
pera
ture
(K
)
Mod
elle
d m
ass–
bala
nce
(kg
m¬
2 ) 3 Sep. 09 to 17 May 10
2 Jun. to 13 Jul. 09
17 May to 28 Sep. 10
Measured mass-balance (kg m¬2)
Mas
s-ba
lanc
e (k
g m
¬2 )
Mass-balance (kg m
¬2)
ISM onset
Annual
r = 0.89
Figure 2 | In situ measurements and model results. a, Surface height change at AWS1 (r=0.98;RMSD= 15.6 cm). b, Daily glacier surface temperature atAWS1 (r=0.96;RMSD= 2.1 K). c, Mass balance for three periods at the stake locations (r=0.97;RMSD= 3.1 kg m−2 d−1). See inset of Fig. 1a formeasurements sites. d, Modelled glacier-wide mass balance for the calendar year (left y axis) and the ISM onset period (right y axis). Error bars reflectmodel uncertainty as described in the Methods. All correlation coefficients are significant (p < 0.01).
6 8 10 6 8 10 6 8 10 6 8 10 6 8 100
2
4
6
8Surface accumulation Surface melt Surface sublimation Internal refreezing Subsurface melt
0
5
10
15
20
25
0
1
2
3
0
5
10
0
5
10r = 0.70r = 0.96
r = ¬0.90 r = ¬0.79
2001
2002
2003
2004
20052006
2007
2008
2009
2010
2011
Onset intensity
Mas
s flu
x (k
g m
¬2
d¬1 )
ISM intensity (mm d¬1)
StrongA
verageW
eak
Figure 3 | Mass-balance processes and monsoon onset. Precipitation in the ISM region versus glacier-wide mass-balance components during the ISMonset period. Normal (italics) font signifies mass gain (mass loss) terms; error bars as described in the Methods. Surface deposition is very small4 and thusnot shown. The legend identifies the years and provides the order of the ISM onset intensity. Correlations are shown for all years (black) and without 2002,2003 and 2007 (grey) if the coefficient is significant (p < 0.05). Note the different scaling of the y axes.
reflects the accumulation–albedo–melt linkage, is the variability inabsorbed solar radiation (Supplementary Fig. S2). In the main ISMseason, a systematic component as in Fig. 3 is not evident becauseintra-seasonal monsoon variability, that is, the active/break periodcycle4, does not seem to affect the local mass-balance processes.This was found for 2009–2011 previously4 and also holds for the2001–2011 results presented here (Supplementary Fig. 3).
The absence of a monsoon footprint on the glacier in themain ISM season may have two explanations. First, and regardingatmospheric drivers, local weather on the Tibetan Plateau beginsto ‘decouple’ from the large-scale ISM dynamics in this season,which is discussed in detail elsewhere4. For example, two separateconvective centres develop over the Indian Ocean and High Asia inthe course of the ISM (ref. 16). Second, and from a mass-balanceperspective, the conditions in the ISM onset period also leavea strong and probably dominant memory effect in the surfacealbedo and, thus, subsequent surface melt evolution on Zhadang(Supplementary Fig. 4). This affirms that atmospheric conditions inlate spring/early summer, whatever large-scale influences operate,are pivotal for shaping the annual mass-balance. So far thiswas evident only for single years4, but the high correlation in
Fig. 2d corroborates this point for the decade scale. ISM dynamicsclearly influence late spring–early summer climate and mass-balance response (Fig. 3), yet they cannot explain the mass-balancevariability at Zhadang in all years.
Hence, what large-scale systems other than the ISM candetermine local atmospheric conditions in the early monsoonseason? We observe an anti-correlation of precipitation variabilityin the western Tien Shan (WEST) and ISM region (Fig. 1a) duringspring/early summer, which indicates a ‘competition’ betweenmonsoon and mid-latitude circulation. This anti-correlation issignificant only if WEST leads ISM precipitation, for example by∼1 month as in Fig. 1b (r =−0.62; p< 0.05). Including this leadtime makes sense, because WEST intensity is better captured inMay when seasonal precipitation peaks in the WEST region17.An out-of-phase relationship between WEST and ISM moistureclimate is also indicated by proxy records18 and by climate dynamicsstudies, which recently focused on the mid-latitude circumpolarwave train19,20 and on the interaction/bridging mechanisms20,21.The region of the global train index (GTI) in Fig. 1a, for example,captures such a bridge21 (Supplementary Methods). On a largerscale, many of the dynamics studies identified the high-level
NATURE CLIMATE CHANGE | ADVANCE ONLINE PUBLICATION | www.nature.com/natureclimatechange 3
© 2013 Macmillan Publishers Limited. All rights reserved.
ARTICLES NATURE CLIMATE CHANGE DOI: 10.1038/NCLIMATE2055
westerly jet22 with its core at 200–300 hPa as a crucial elementconnecting mid-latitude and monsoon dynamics19–21. Here wefind implications of the jet position in the ISM onset period forZhadang’s annual glacier mass-balance (Fig. 2d and SupplementaryFig. 5): above-average mass-balance is favoured by maximum jetactivity well to the north of the Tibetan Plateau (2001–2004,2008, 2011), whereas clearly negative mass-balances coincide withfrequent jet occurrences over the plateau (2007, 2010) or a curvedjet axis that stretches into the western plateau (2005, 2009). Only2006 differs from this pattern (discussed further below), so ingeneral the jet position seems able to modify the monsoon–mass-balance relation.
First, average/weak ISM onsets (as in 2002/2003) can stillcoincide with high accumulation and little melt (Fig. 3), and thusabove-average glacier mass-balance (Fig. 2d). High precipitationupstream in the WEST region (Fig. 1b), in combination with anortherly jet location and intensified moisture advection from themid-latitudes (Supplementary Fig. 6), provide the likely reasons.Similar ISM and WEST conditions in 2005/2009, however, leadto negative mass-balances because the jet axis was far southover the western plateau, reducing the north–south pressuregradient and moisture import from WEST (Supplementary Fig.7). Second, jet activity over much of the plateau as in 2007(Supplementary Fig. 5) also seems able to limit the northwardmonsoon progression despite a strong ISM onset case. Hence,low glacier accumulation, abundant melt and a negative mass-balance developed in 2007 (Figs 2d and 3). Third, average WESTand ISM circulation intensities as in 2008 (Fig. 1b) may still lead toabove-average mass-balance if the jet is clearly north of the plateau(Supplementary Fig. 5).
These considerations imply that the strength of the regionalatmospheric flow over the Tibetan Plateau must be importantfor glacier mass-balance. Indeed, 300 hPa wind speed during ISMonset over the Tibetan Plateau’s central part (TIP; Fig. 1c) emergesas an excellent predictor for the annual mass-balance, r =−0.86(p < 0.01) and r2 = 0.73. The relation also holds for 2006 (highwind speed, low mass-balance) despite few jet occurrences overTIP in this year (Supplementary Discussion). An understandablephysical basis of the strong negative correlation is provided bycloud-resolving modelling, which showed that a weak flow favoursconvective cell growth23,24. Furthermore, the relationship of lowwind speeds promoting precipitation was measured on highmountain summits25. This raises the question of the controls of TIPwind speed during the ISM onset period.
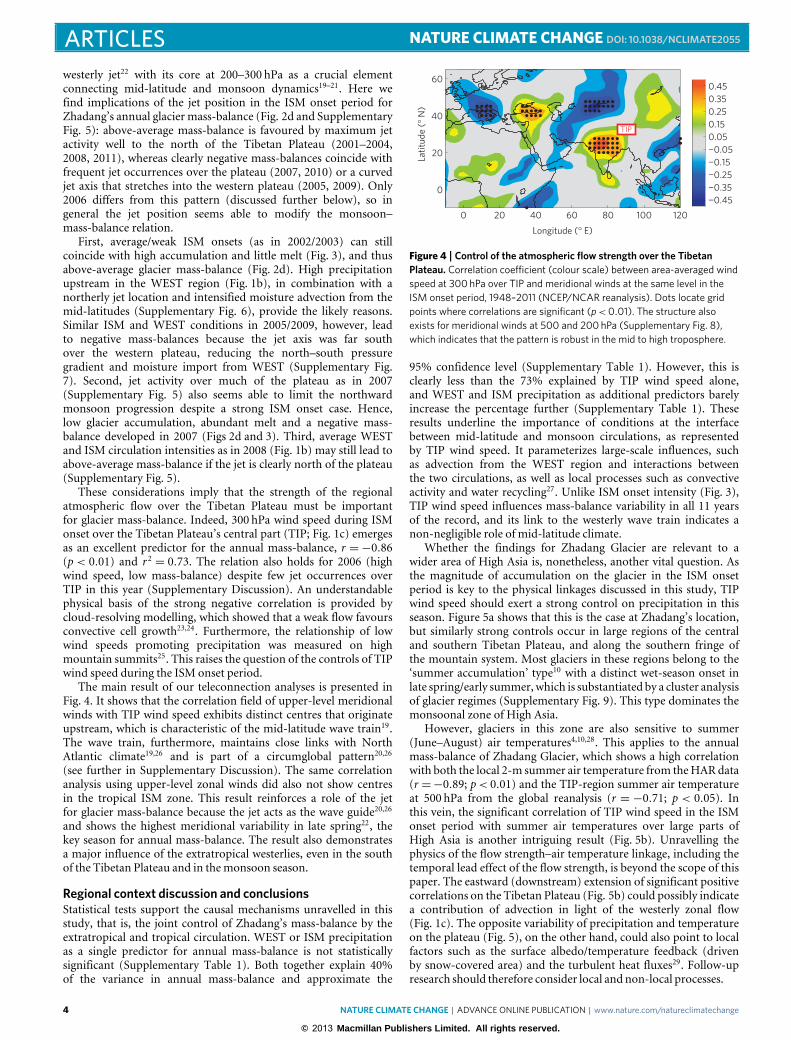
The main result of our teleconnection analyses is presented inFig. 4. It shows that the correlation field of upper-level meridionalwinds with TIP wind speed exhibits distinct centres that originateupstream, which is characteristic of the mid-latitude wave train19.The wave train, furthermore, maintains close links with NorthAtlantic climate19,26 and is part of a circumglobal pattern20,26
(see further in Supplementary Discussion). The same correlationanalysis using upper-level zonal winds did also not show centresin the tropical ISM zone. This result reinforces a role of the jetfor glacier mass-balance because the jet acts as the wave guide20,26and shows the highest meridional variability in late spring22, thekey season for annual mass-balance. The result also demonstratesa major influence of the extratropical westerlies, even in the southof the Tibetan Plateau and in themonsoon season.
Regional context discussion and conclusionsStatistical tests support the causal mechanisms unravelled in thisstudy, that is, the joint control of Zhadang’s mass-balance by theextratropical and tropical circulation. WEST or ISM precipitationas a single predictor for annual mass-balance is not statisticallysignificant (Supplementary Table 1). Both together explain 40%of the variance in annual mass-balance and approximate the
¬0.45¬0.35¬0.25¬0.15¬0.050.050.150.250.350.45
0 20 40 60 80 100 120
0
20
40
60
Latit
ude
(° N
)
TIP
Longitude (° E)
Figure 4 | Control of the atmospheric flow strength over the TibetanPlateau. Correlation coefficient (colour scale) between area-averaged windspeed at 300 hPa over TIP and meridional winds at the same level in theISM onset period, 1948–2011 (NCEP/NCAR reanalysis). Dots locate gridpoints where correlations are significant (p < 0.01). The structure alsoexists for meridional winds at 500 and 200 hPa (Supplementary Fig. 8),which indicates that the pattern is robust in the mid to high troposphere.
95% confidence level (Supplementary Table 1). However, this isclearly less than the 73% explained by TIP wind speed alone,and WEST and ISM precipitation as additional predictors barelyincrease the percentage further (Supplementary Table 1). Theseresults underline the importance of conditions at the interfacebetween mid-latitude and monsoon circulations, as representedby TIP wind speed. It parameterizes large-scale influences, suchas advection from the WEST region and interactions betweenthe two circulations, as well as local processes such as convectiveactivity and water recycling27. Unlike ISM onset intensity (Fig. 3),TIP wind speed influences mass-balance variability in all 11 yearsof the record, and its link to the westerly wave train indicates anon-negligible role of mid-latitude climate.
Whether the findings for Zhadang Glacier are relevant to awider area of High Asia is, nonetheless, another vital question. Asthe magnitude of accumulation on the glacier in the ISM onsetperiod is key to the physical linkages discussed in this study, TIPwind speed should exert a strong control on precipitation in thisseason. Figure 5a shows that this is the case at Zhadang’s location,but similarly strong controls occur in large regions of the centraland southern Tibetan Plateau, and along the southern fringe ofthe mountain system. Most glaciers in these regions belong to the‘summer accumulation’ type10 with a distinct wet-season onset inlate spring/early summer,which is substantiated by a cluster analysisof glacier regimes (Supplementary Fig. 9). This type dominates themonsoonal zone of High Asia.
However, glaciers in this zone are also sensitive to summer(June–August) air temperatures4,10,28. This applies to the annualmass-balance of Zhadang Glacier, which shows a high correlationwith both the local 2-m summer air temperature from theHARdata(r =−0.89; p< 0.01) and the TIP-region summer air temperatureat 500 hPa from the global reanalysis (r = −0.71; p < 0.05). Inthis vein, the significant correlation of TIP wind speed in the ISMonset period with summer air temperatures over large parts ofHigh Asia is another intriguing result (Fig. 5b). Unravelling thephysics of the flow strength–air temperature linkage, including thetemporal lead effect of the flow strength, is beyond the scope of thispaper. The eastward (downstream) extension of significant positivecorrelations on the Tibetan Plateau (Fig. 5b) could possibly indicatea contribution of advection in light of the westerly zonal flow(Fig. 1c). The opposite variability of precipitation and temperatureon the plateau (Fig. 5), on the other hand, could also point to localfactors such as the surface albedo/temperature feedback (drivenby snow-covered area) and the turbulent heat fluxes29. Follow-upresearch should therefore consider local and non-local processes.
4 NATURE CLIMATE CHANGE | ADVANCE ONLINE PUBLICATION | www.nature.com/natureclimatechange
© 2013 Macmillan Publishers Limited. All rights reserved.
NATURE CLIMATE CHANGE DOI: 10.1038/NCLIMATE2055 ARTICLES
¬0.8
¬0.6
¬0.4
¬0.2
0.2
0.4
0.6
0.8
¬0.8
¬0.6
¬0.4
¬0.2
0.2
0.4
0.6
0.8a b
14 16 18 14 16 18¬3,000
¬2,000
¬1,000
0
14 16 18
¬1,000
¬500
0
500
14 16 18
¬1,000
¬500
0
500
1,000
¬1,000
¬500
0
500
TIP wind speed (m s¬1)
Gurenhekou Zhadang Zhongxi XiaodongkemadiM
ass–
bala
nce
(kg
m¬
2 yr
¬1 )
Precipitation (ISM onset period)
30° N
80° E 90° E
Air temperature (summer)
80° E
30° N
90° E
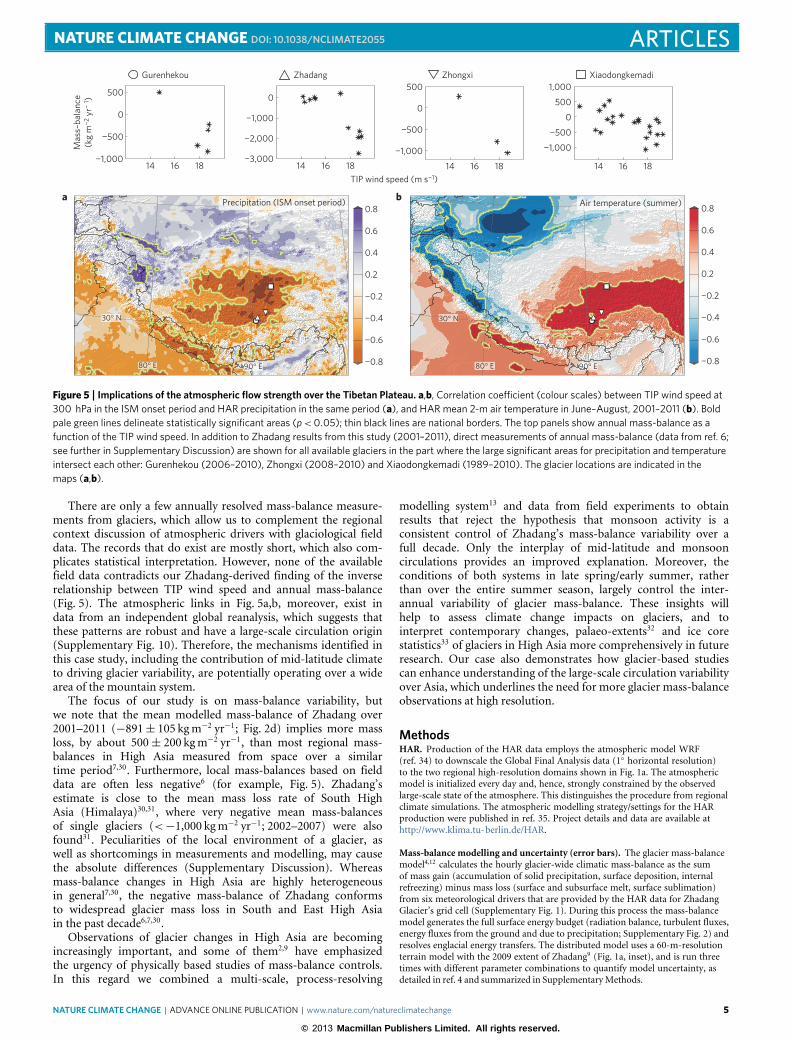
Figure 5 | Implications of the atmospheric flow strength over the Tibetan Plateau. a,b, Correlation coefficient (colour scales) between TIP wind speed at300 hPa in the ISM onset period and HAR precipitation in the same period (a), and HAR mean 2-m air temperature in June–August, 2001–2011 (b). Boldpale green lines delineate statistically significant areas (p < 0.05); thin black lines are national borders. The top panels show annual mass-balance as afunction of the TIP wind speed. In addition to Zhadang results from this study (2001–2011), direct measurements of annual mass-balance (data from ref. 6;see further in Supplementary Discussion) are shown for all available glaciers in the part where the large significant areas for precipitation and temperatureintersect each other: Gurenhekou (2006–2010), Zhongxi (2008–2010) and Xiaodongkemadi (1989–2010). The glacier locations are indicated in themaps (a,b).
There are only a few annually resolved mass-balance measure-ments from glaciers, which allow us to complement the regionalcontext discussion of atmospheric drivers with glaciological fielddata. The records that do exist are mostly short, which also com-plicates statistical interpretation. However, none of the availablefield data contradicts our Zhadang-derived finding of the inverserelationship between TIP wind speed and annual mass-balance(Fig. 5). The atmospheric links in Fig. 5a,b, moreover, exist indata from an independent global reanalysis, which suggests thatthese patterns are robust and have a large-scale circulation origin(Supplementary Fig. 10). Therefore, the mechanisms identified inthis case study, including the contribution of mid-latitude climateto driving glacier variability, are potentially operating over a widearea of the mountain system.
The focus of our study is on mass-balance variability, butwe note that the mean modelled mass-balance of Zhadang over2001–2011 (−891± 105 kgm−2 yr−1; Fig. 2d) implies more massloss, by about 500± 200 kgm−2 yr−1, than most regional mass-balances in High Asia measured from space over a similartime period7,30. Furthermore, local mass-balances based on fielddata are often less negative6 (for example, Fig. 5). Zhadang’sestimate is close to the mean mass loss rate of South HighAsia (Himalaya)30,31, where very negative mean mass-balancesof single glaciers (<−1,000 kgm−2 yr−1; 2002–2007) were alsofound31. Peculiarities of the local environment of a glacier, aswell as shortcomings in measurements and modelling, may causethe absolute differences (Supplementary Discussion). Whereasmass-balance changes in High Asia are highly heterogeneousin general7,30, the negative mass-balance of Zhadang conformsto widespread glacier mass loss in South and East High Asiain the past decade6,7,30.
Observations of glacier changes in High Asia are becomingincreasingly important, and some of them2,9 have emphasizedthe urgency of physically based studies of mass-balance controls.In this regard we combined a multi-scale, process-resolving
modelling system13 and data from field experiments to obtainresults that reject the hypothesis that monsoon activity is aconsistent control of Zhadang’s mass-balance variability over afull decade. Only the interplay of mid-latitude and monsooncirculations provides an improved explanation. Moreover, theconditions of both systems in late spring/early summer, ratherthan over the entire summer season, largely control the inter-annual variability of glacier mass-balance. These insights willhelp to assess climate change impacts on glaciers, and tointerpret contemporary changes, palaeo-extents32 and ice corestatistics33 of glaciers in High Asia more comprehensively in futureresearch. Our case also demonstrates how glacier-based studiescan enhance understanding of the large-scale circulation variabilityover Asia, which underlines the need for more glacier mass-balanceobservations at high resolution.
MethodsHAR. Production of the HAR data employs the atmospheric model WRF(ref. 34) to downscale the Global Final Analysis data (1◦ horizontal resolution)to the two regional high-resolution domains shown in Fig. 1a. The atmosphericmodel is initialized every day and, hence, strongly constrained by the observedlarge-scale state of the atmosphere. This distinguishes the procedure from regionalclimate simulations. The atmospheric modelling strategy/settings for the HARproduction were published in ref. 35. Project details and data are available athttp://www.klima.tu-berlin.de/HAR.
Mass-balance modelling and uncertainty (error bars). The glacier mass-balancemodel4,12 calculates the hourly glacier-wide climatic mass-balance as the sumof mass gain (accumulation of solid precipitation, surface deposition, internalrefreezing) minus mass loss (surface and subsurface melt, surface sublimation)from six meteorological drivers that are provided by the HAR data for ZhadangGlacier’s grid cell (Supplementary Fig. 1). During this process the mass-balancemodel generates the full surface energy budget (radiation balance, turbulent fluxes,energy fluxes from the ground and due to precipitation; Supplementary Fig. 2) andresolves englacial energy transfers. The distributed model uses a 60-m-resolutionterrain model with the 2009 extent of Zhadang9 (Fig. 1a, inset), and is run threetimes with different parameter combinations to quantify model uncertainty, asdetailed in ref. 4 and summarized in SupplementaryMethods.
NATURE CLIMATE CHANGE | ADVANCE ONLINE PUBLICATION | www.nature.com/natureclimatechange 5
© 2013 Macmillan Publishers Limited. All rights reserved.
ARTICLES NATURE CLIMATE CHANGE DOI: 10.1038/NCLIMATE2055
On-site measurements. Field measurements on Zhadang (Fig. 1a, inset) aredetailed in ref. 4. The first data from automatic weather station (AWS) 1 areavailable on 27 April 2009, and two data gaps exist afterwards (Fig. 2a,b) due toinstrument failure in the harsh environment. Ablation stake readings (Fig. 2c) wereperformed by Institute of Tibetan Plateau Research personnel.
Circumglobal climatedata and statistical significance. Daily TRMMprecipitationat 0.25◦ resolution, and the global NCEP/NCAR reanalysis (2.5◦) for wind variables,geopotential height, and air temperature. ERA-Interim reanalysis (1◦) was usedfor robustness checks of wind speed linkages with precipitation and temperature(Supplementary Fig. 10) and the duration of the ISM circulation (SupplementaryFig. 11). See Supplementary Methods for data sources. All significance levelsreported for any data are based on a t -test.
Received 25 June 2013; accepted 23 October 2013;published online 1 December 2013
References1. Kaser, G., Großhauser, M. & Marzeion, B. Contribution potential of glaciers to
water availability in different climate regimes. Proc. Natl Acad. Sci. USA 107,20223–20227 (2010).
2. Bolch, T. et al. The state and fate of Himalayan glaciers. Science 336,310–314 (2012).
3. Marzeion, B., Jarosch, A. H. & Hofer, M. Past and future sea-level change fromthe surface mass balance of glaciers. Cryosphere 6, 1295–1322 (2012).
4. Mölg, T., Maussion, F., Yang,W. & Scherer, D. The footprint of Asianmonsoondynamics in the mass and energy balance of a Tibetan glacier. Cryosphere 6,1445–1461 (2012).
5. Scherler, D., Bookhagen, B. & Strecker, M. R. Spatially variable response ofHimalayan glaciers to climate change affected by debris cover. Nature Geosci.4, 156–159 (2011).
6. Yao, T. et al. Different glacier status with atmospheric circulations in TibetanPlateau and surroundings. Nature Clim. Change 2, 663–667 (2012).
7. Gardelle, J., Berthier, E., Arnaud, Y. & Kääb, A. Region-wide glacier massbalances over the Pamir–Karakoram–Himalaya during 1999–2011. Cryosphere7, 1263–1286 (2013).
8. Kääb, A., Berthier, E., Nuth, C., Gardelle, J. & Arnaud, Y. Contrasting patternsof early twenty-first-century glacier mass change in the Himalayas.Nature 488,495–498 (2012).
9. Bolch, T. et al. A glacier inventory for the western Nyainqentanglha Rangeand the Nam Co Basin, Tibet, and glacier changes 1976–2009. Cryosphere 4,419–433 (2010).
10. Fujita, K. & Ageta, Y. Effect of summer accumulation on glacier mass balanceon the Tibetan Plateau revealed by mass-balance model. J. Glaciol. 46,244–252 (2000).
11. Zhang, G. et al. Energy and mass balance of the Zhadang Glacier surface,central Tibetan Plateau. J. Glaciol. 59, 137–148 (2013).
12. Mölg, T., Cullen, N. J., Hardy, D. R., Winkler, M. & Kaser, G. Quantifyingclimate change in the tropical mid-troposphere over East Africa from glaciershrinkage on Kilimanjaro. J. Clim. 22, 4162–4181 (2009).
13. Mölg, T. & Kaser, G. A new approach to resolving climate-cryosphere relations:Downscaling climate dynamics to glacier-scale mass and energy balancewithout statistical scale linking. J. Geophys. Res. 116, D16101 (2011).
14. Mölg, T., Großhauser, M., Hemp, A., Hofer, M. &Marzeion, B. Limited forcingof glacier loss through land-cover change on Kilimanjaro.Nature Clim. Change2, 254–258 (2012).
15. Park, H. S., Chiang, J. C. H., Lintner, B. & Zhang, G. J. The delayed effect ofmajor El Nino events on IndianMonsoon Rainfall. J. Clim. 23, 932–946 (2010).
16. Wu, G. et al. Thermal controls on the Asian summer monsoon. Sci. Rep. 2,404 (2012).
17. Aizen, V. B., Aizen, E. M., Melack, J. M. & Dozier, J. Climatic andhydrologic changes in the Tien Shan, Central Asia. J. Clim. 10,1393–1404 (1997).
18. Chen, F. et al. Holocene moisture evolution in arid central Asia and itsout-of-phase relationship with Asian monsoon history. Quat. Sci. Rev. 27,351–364 (2008).
19. Bothe, O., Fraedrich, K. & Zhu, X. Large-scale circulations and TibetanPlateau summer drought and wetness in a high-resolution climate model.Int. J. Climatol. 31, 832–846 (2011).
20. Ding, Q. & Wang, B. Circumglobal teleconnection in the northern hemispheresummer. J. Clim. 18, 3483–3505 (2005).
21. Saeed, S., Müller, W. A., Hagemann, S. & Jacob, D. Circumglobal wave trainand the summer monsoon over northwestern India and Pakistan: The explicitrole of the surface heat low. Clim. Dynam. 37, 1045–1060 (2011).
22. Schiemann, R., Lüthi, D. & Schär, C. Seasonality and interannual variability ofthe westerly jet in the Tibetan Plateau region. J. Clim. 22, 2940–2957 (2009).
23. Kirshbaum, D. J. & Durran, D. R. Factors governing cellular convection inorographic precipitation. J. Atmos. Sci. 61, 682–698 (2004).
24. Fuhrer, O. & Schär, C. Embedded cellular convection in moist flow pasttopography. J. Atmos. Sci. 62, 2810–2828 (2005).
25. Mölg, T., Chiang, J. H. C., Gohm, A. & Cullen, N. J. Temporal precipitationvariability versus altitude on a tropical high mountain: Observations andmesoscale atmosphericmodeling.Q. J. R.Meteorol. Soc. 135, 1439–1455 (2009).
26. Branstator, G. Circumglobal teleconnections, the jet stream waveguide, andthe North Atlantic Oscillation. J. Clim. 15, 1893–1910 (2002).
27. Chen, B., Xu, X. D., Yang, S. & Zhang, W. On the origin and destination ofatmospheric moisture and air mass over the Tibetan Plateau. Theoret. Appl.Climatol. 110, 423–435 (2012).
28. Caidong, C. & Sorteberg, A. Modelled mass balance of Xibu glacier, TibetanPlateau: Sensitivity to climate change. J. Glaciol. 56, 235–248 (2010).
29. Qian, Y., Flanner, M. G., Leung, L. R. & Wang, W. Sensitivity studies on theimpacts of Tibetan Plateau snowpack pollution on the Asian hydrological cycleand monsoon climate. Atmos. Chem. Phys. 11, 1929–1948 (2011).
30. Gardner, A. S. et al. A reconciled estimate of glacier contributions to sea levelrise: 2003 to 2009. Science 340, 852–857 (2013).
31. Bolch, T., Pieczonka, T. & Benn, D. I. Multi-decadal mass loss of glaciers inthe Everest area (Nepal Himalaya) derived from stereo imagery. Cryosphere 5,349–358 (2011).
32. Benn, D. I. & Owen, L. A. The role of the Indian summer monsoon andthe mid-latitude westerlies in Himalayan glaciation: Review and speculativediscussion. J. Geol. Soc. Lond. 155, 353–363 (1998).
33. Joswiak, D. R., Yao, T., Wu, G., Tian, L. & Xu, B. Ice-core evidence of westerlyand monsoon moisture contributions in the central Tibetan Plateau. J. Glaciol.59, 56–66 (2013).
34. Skamarock, W. C. & Klemp, J. B. A time-split nonhydrostatic atmosphericmodel for weather research and forecasting applications. J. Comput. Phys. 227,3465–3485 (2008).
35. Maussion, F. et al. WRF simulation of a precipitation event over the TibetanPlateau, China: An assessment using remote sensing and ground observations.Hydrol. Earth Syst. Sci. 15, 1795–1817 (2011).
AcknowledgementsThis work was supported by the Alexander von Humboldt Foundation and the GermanNational Academy of Sciences (T.M.), by the German Research Foundation (DFG)Priority Programme 1372, ‘Tibetan Plateau: Formation–Climate–Ecosystems’ withinthe DynRG-TiP (‘Dynamic Response of Glaciers on the Tibetan Plateau to ClimateChange’) project under the codes SCHE 750/4-1, SCHE 750/4-2 and SCHE 750/4-3,and by the German Federal Ministry of Education and Research (BMBF) Programme‘Central Asia–Monsoon Dynamics and Geo-Ecosystems’ (CAME) within the WETproject ‘Variability and Trends in Water Balance Components of Benchmark DrainageBasins on the Tibetan Plateau’ under the code 03G0804A. We thank M. Buchroithner,J. Curio, N. Holzer, E. Huintjes, O. Käsmacher, J. Kropáček, T. Pieczonka, J. Richters,T. Sauter, C. Schneider, B. Schröter, M. Spieß, W. Wang and the local Tibetan peoplefor their participation in field work. We also thank T. Yao, S. Kang, W. Yang, G. Zhangand the staff of the Nam Co monitoring station from the Institute of Tibetan PlateauResearch, Chinese Academy of Sciences, for leading the glaciological measurements onZhadang and for providing ablation stake data.
Author contributionsT.M. designed the study and wrote the paper. F.M. and D.S. developed HARand participated in field work, T.M. and F.M. conducted the numerical modelling. Allauthors continuously discussed the results and developed the analysis further.
Additional informationSupplementary information is available in the online version of the paper. Reprints andpermissions information is available online at www.nature.com/reprints. Correspondenceand requests for materials should be addressed to T.M.
Competing financial interestsThe authors declare no competing financial interests.
6 NATURE CLIMATE CHANGE | ADVANCE ONLINE PUBLICATION | www.nature.com/natureclimatechange
© 2013 Macmillan Publishers Limited. All rights reserved.
Related Documents