1 Dr. Terrance M. Rengarasu 1 MS Excel MS Word MS PowerPoint MS PowerPoint Adobe Photoshop MS Access 2

Microsoft Excel Beginner (1)
Dec 29, 2015
For Beginers
Welcome message from author
This document is posted to help you gain knowledge. Please leave a comment to let me know what you think about it! Share it to your friends and learn new things together.
Transcript
1
Dr. Terrance M. Rengarasu
1
MS ExcelMS WordMS PowerPointMS PowerPoint Adobe PhotoshopMS Access
2
2
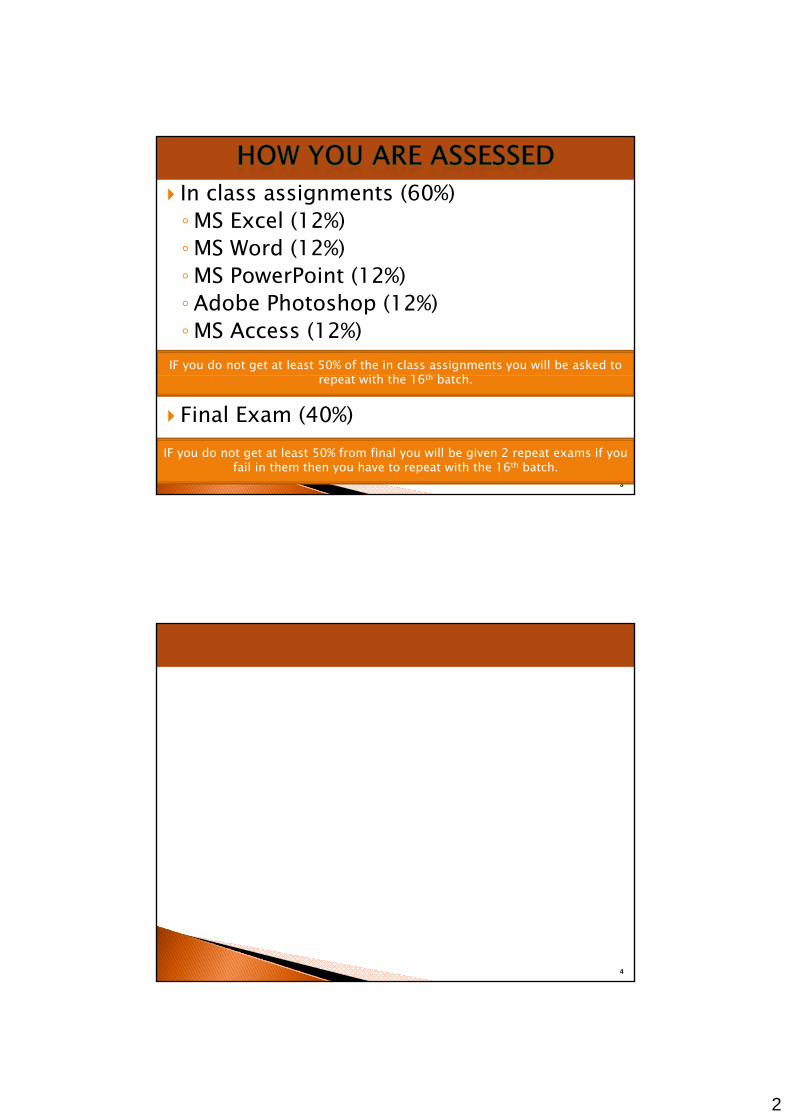
In class assignments (60%)◦MS Excel (12%)◦MS Word (12%)S o d ( %)◦MS PowerPoint (12%)◦ Adobe Photoshop (12%)◦MS Access (12%)
IF you do not get at least 50% of the in class assignments you will be asked to i h h 16th b h
Final Exam (40%)
3
repeat with the 16th batch.
IF you do not get at least 50% from final you will be given 2 repeat exams if you fail in them then you have to repeat with the 16th batch.
4
3
The BasicsDr. Terrance M. Rengarasu
Department of Civil and Environmental Engineering
5
A type of application program whichmanipulates numerical and string data in
d l f llrows and columns of cells.
6
4
A spread sheet “document” is called aworkbook.
7
A space inside a spreadsheet with multiplecolumns
8
5
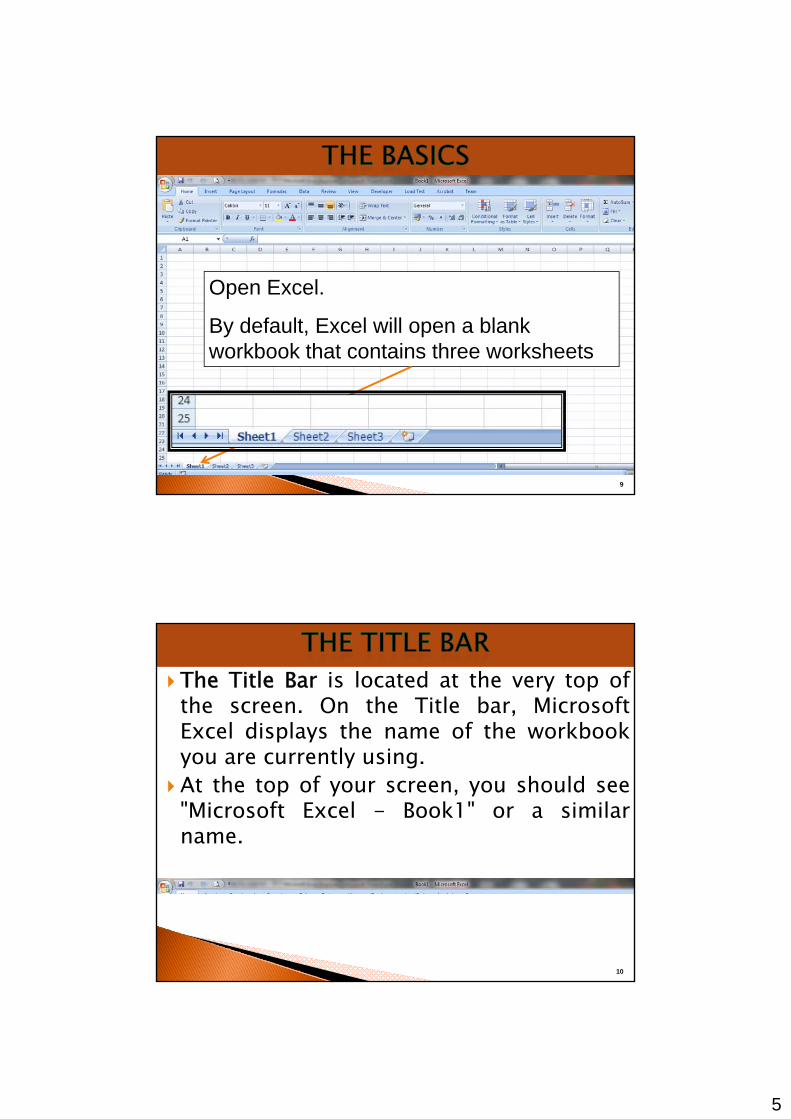
Open Excel.
By default, Excel will open a blank workbook that contains three worksheets
9
The Title Bar is located at the very top ofthe screen. On the Title bar, MicrosoftExcel displays the name of the workbookyou are currently using.
At the top of your screen, you should see"Microsoft Excel - Book1" or a similarname.
10
6
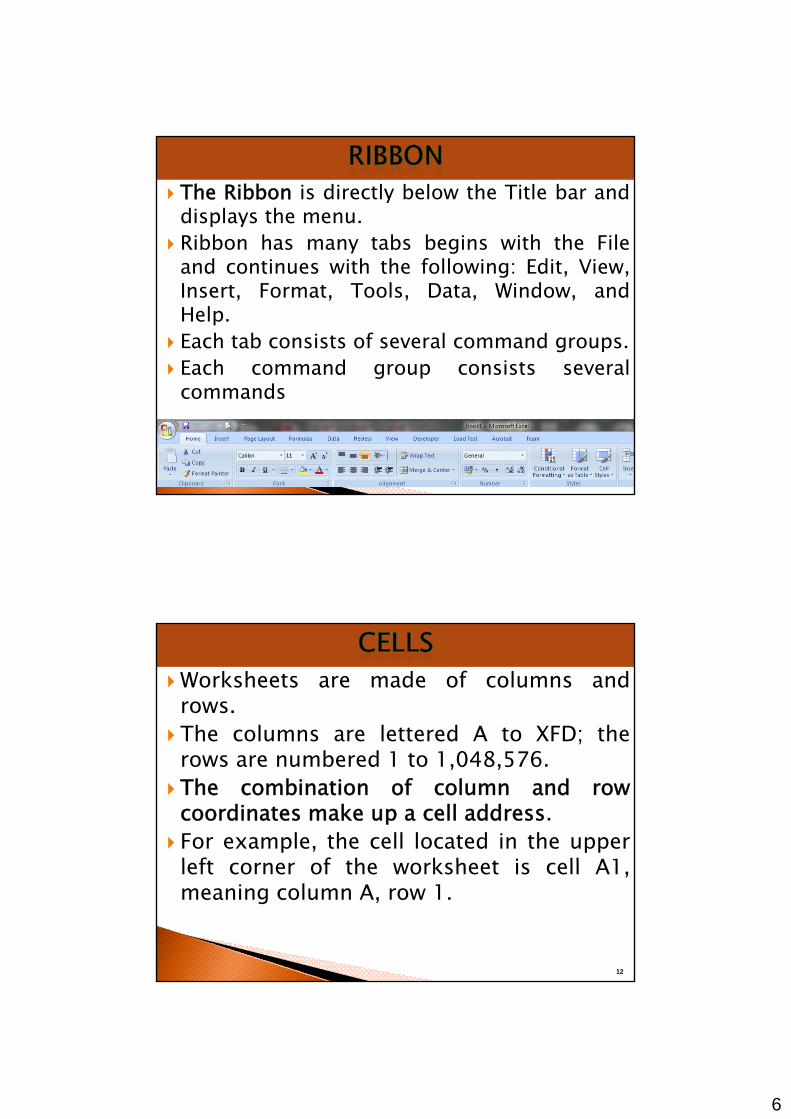
The Ribbon is directly below the Title bar anddisplays the menu.
Ribbon has many tabs begins with the Fileand continues with the following: Edit, View,Insert, Format, Tools, Data, Window, andHelp.
Each tab consists of several command groups. Each command group consists severalg p
commands
11
Worksheets are made of columns androws.
The columns are lettered A to XFD; the;rows are numbered 1 to 1,048,576.
The combination of column and rowcoordinates make up a cell address.
For example, the cell located in the upperl ft f th k h t i ll A1left corner of the worksheet is cell A1,meaning column A, row 1.
12
7
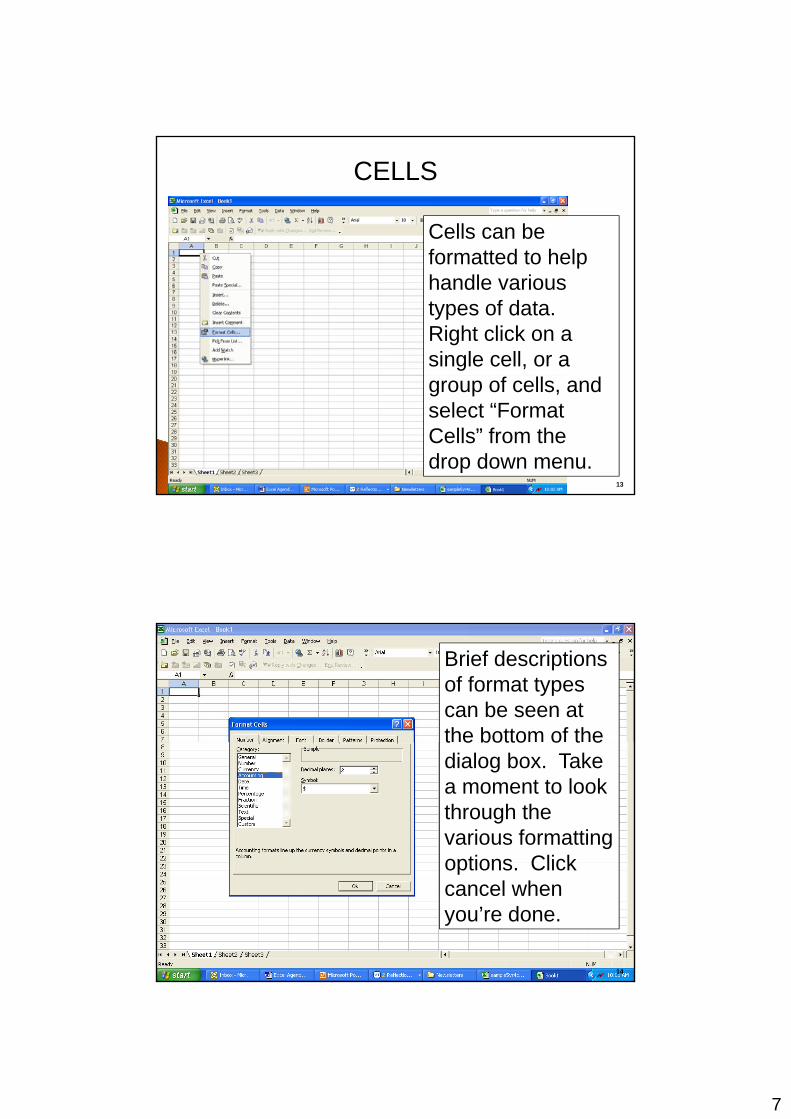
Cells can be formatted to help
CELLS
formatted to help handle various types of data. Right click on a single cell, or a group of cells, and select “Format Cells” from the drop down menu.
13
Brief descriptions of format types can be seen at the bottom of the t e botto o t edialog box. Take a moment to look through the various formatting options Clickoptions. Click cancel when you’re done.
14
8
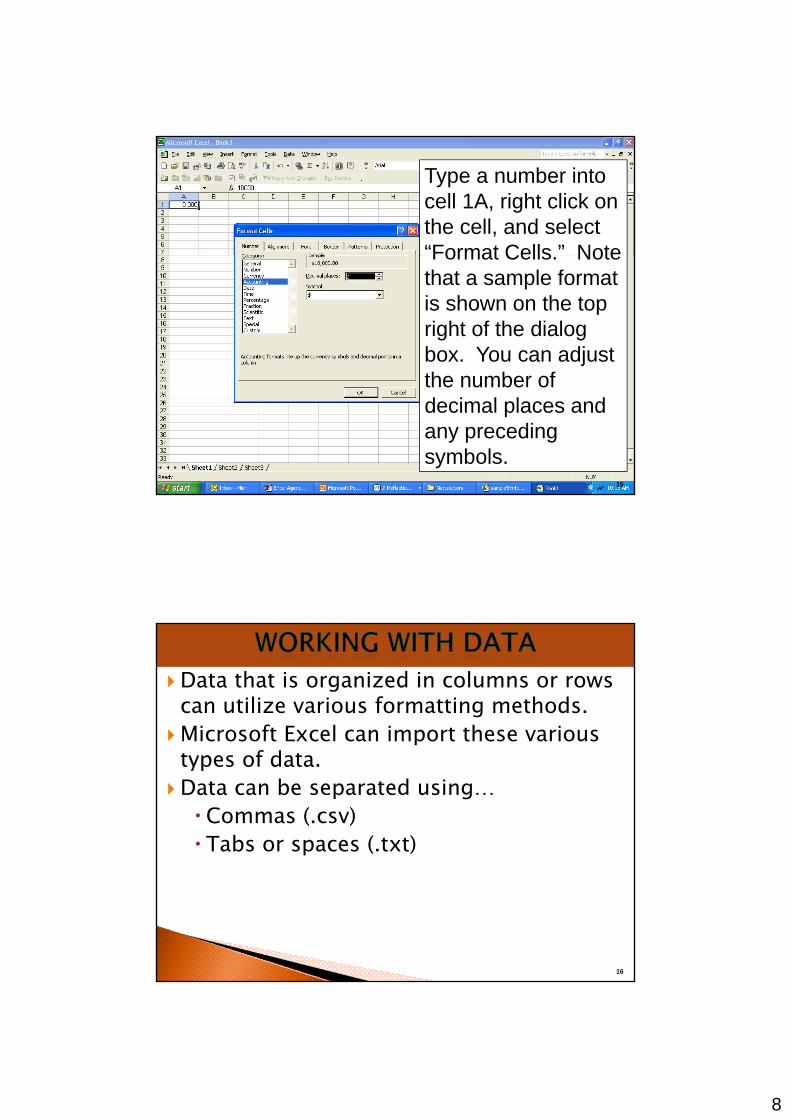
Type a number into cell 1A, right click on the cell, and select “Format Cells ” NoteFormat Cells. Note that a sample format is shown on the top right of the dialog box. You can adjust th b fthe number of decimal places and any preceding symbols.
15
Data that is organized in columns or rows can utilize various formatting methods.
Microsoft Excel can import these various ptypes of data.
Data can be separated using…Commas (.csv) Tabs or spaces (.txt)
16
9
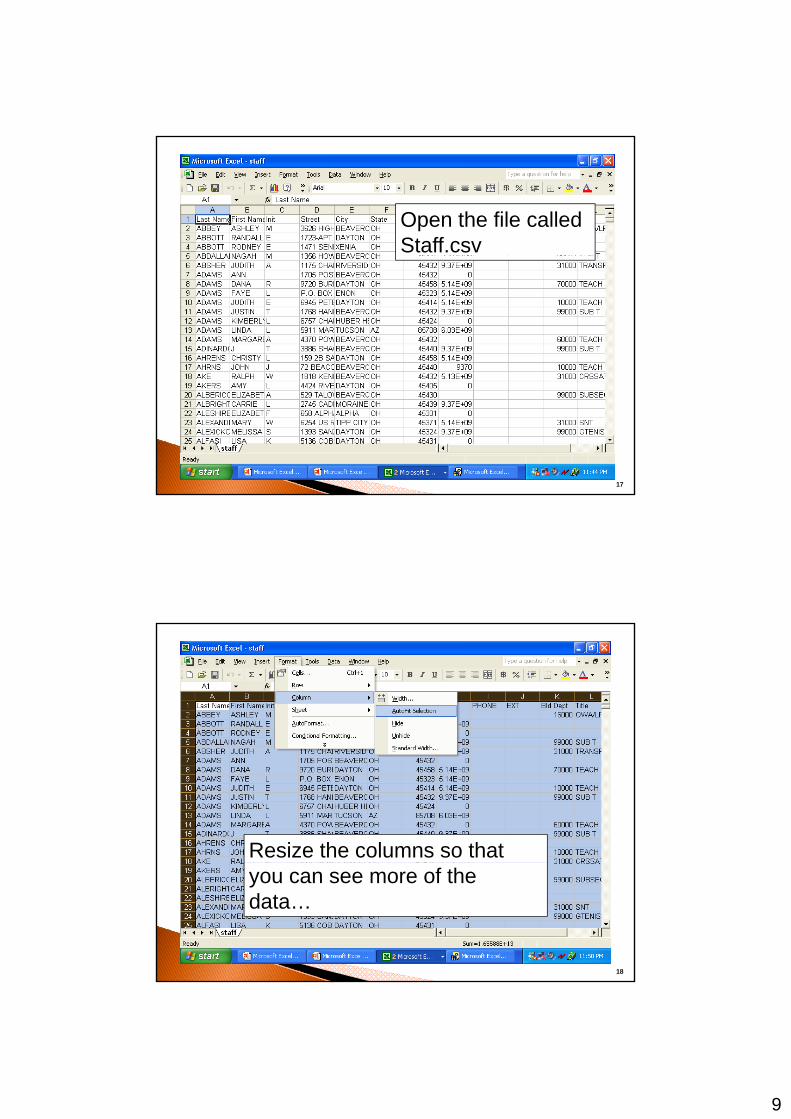
Open the file called Staff.csv
17
Resize the columns so that you can see more of the data…
18
10
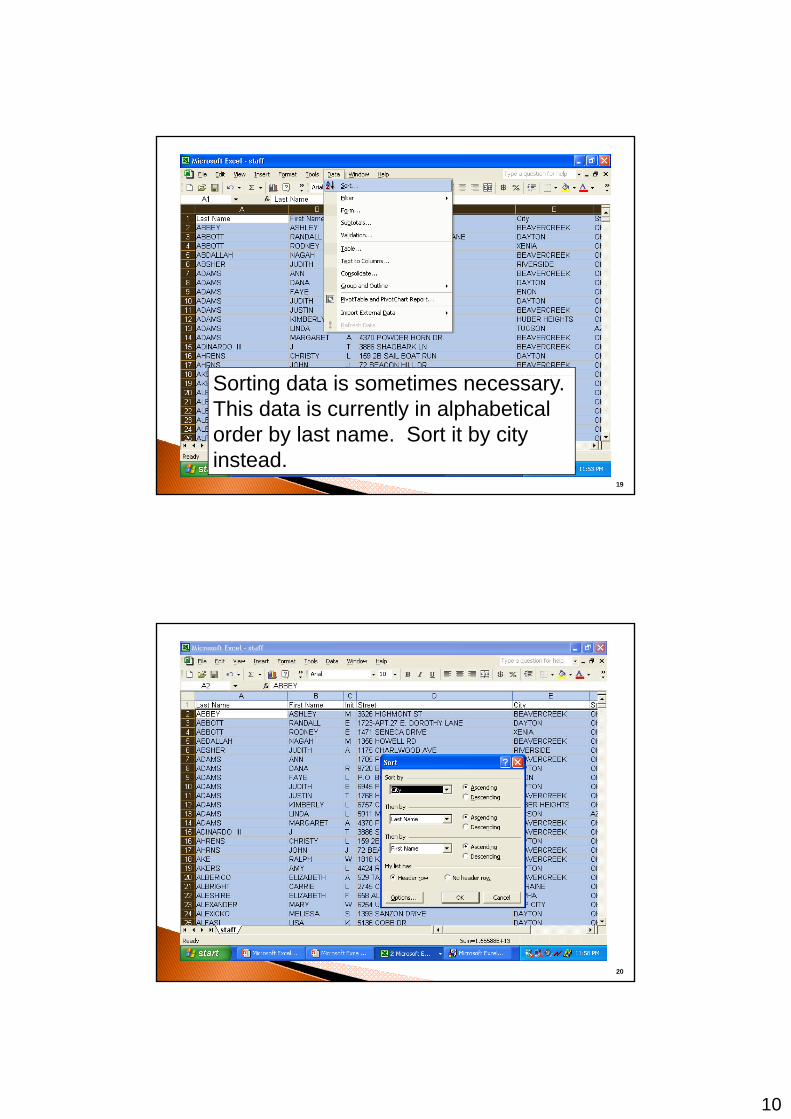
S i d i iSorting data is sometimes necessary. This data is currently in alphabetical order by last name. Sort it by city instead.
19
20
11
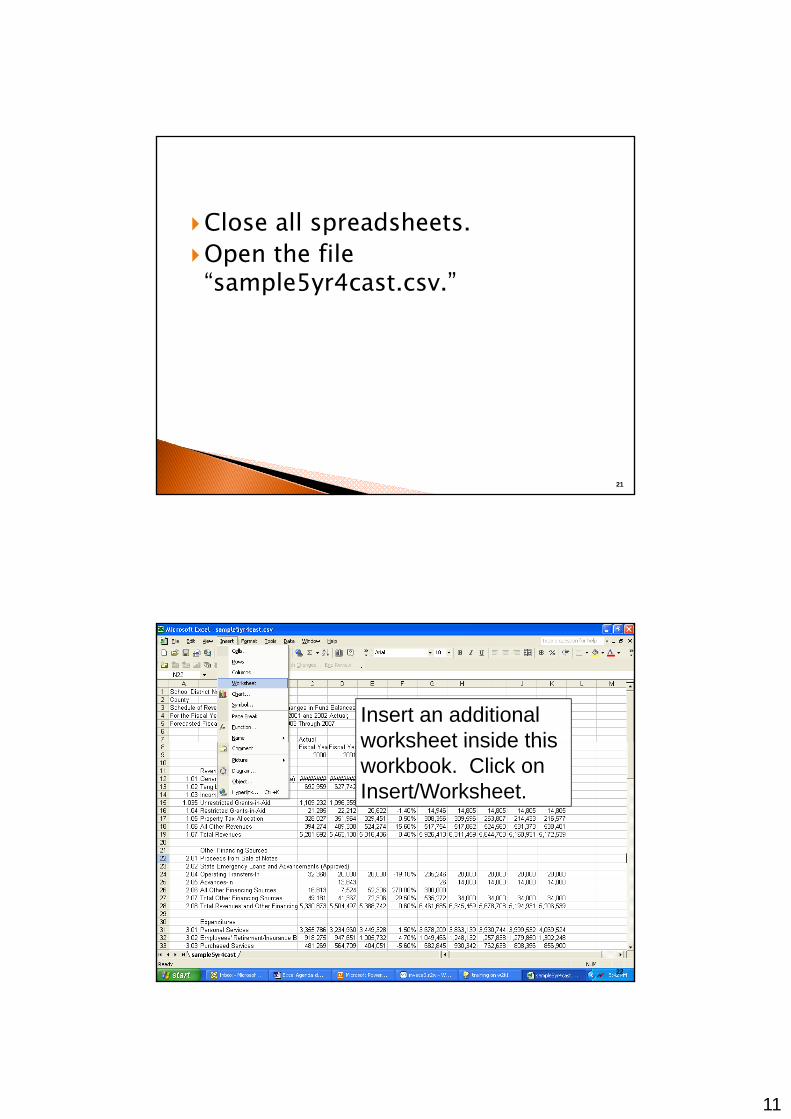
Close all spreadsheets.Open the fileOpen the file “sample5yr4cast.csv.”
21
Insert an additional worksheet inside thisworksheet inside this workbook. Click on Insert/Worksheet.
22
12
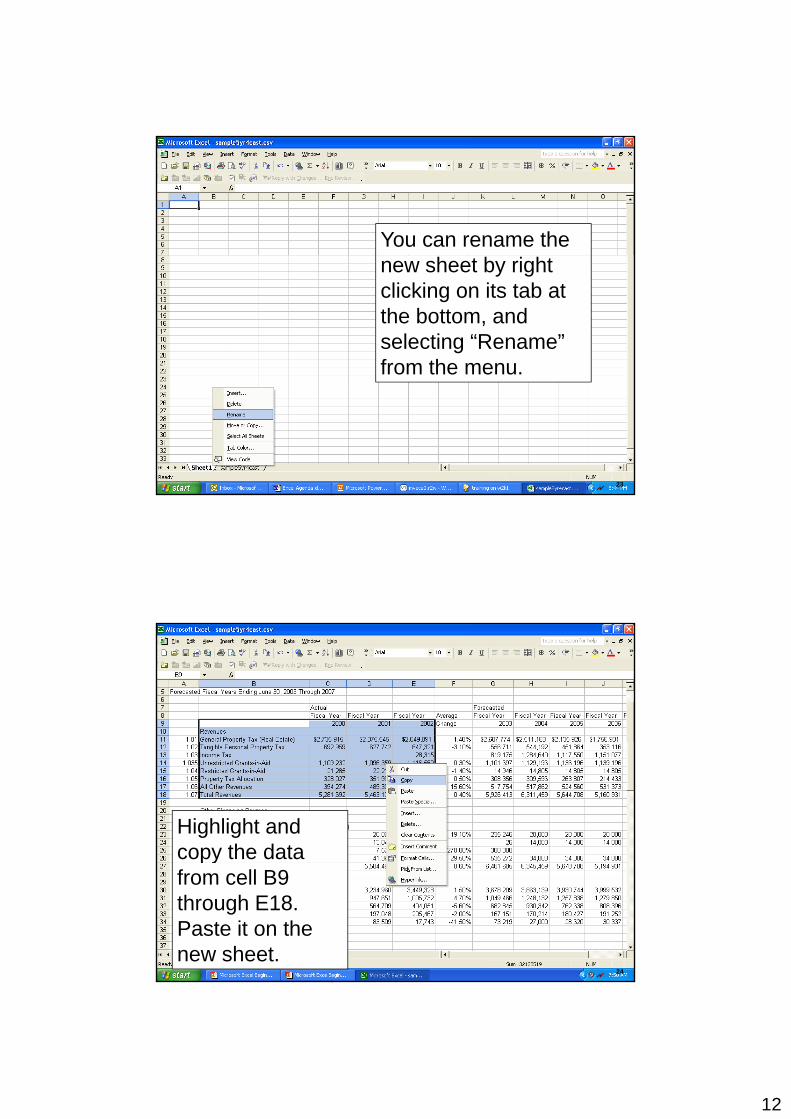
You can rename the new sheet by right clicking on its tab at the bottom, and selecting “Rename” from the menu.
23
Highlight and copy the data pyfrom cell B9 through E18. Paste it on the new sheet.
24
13
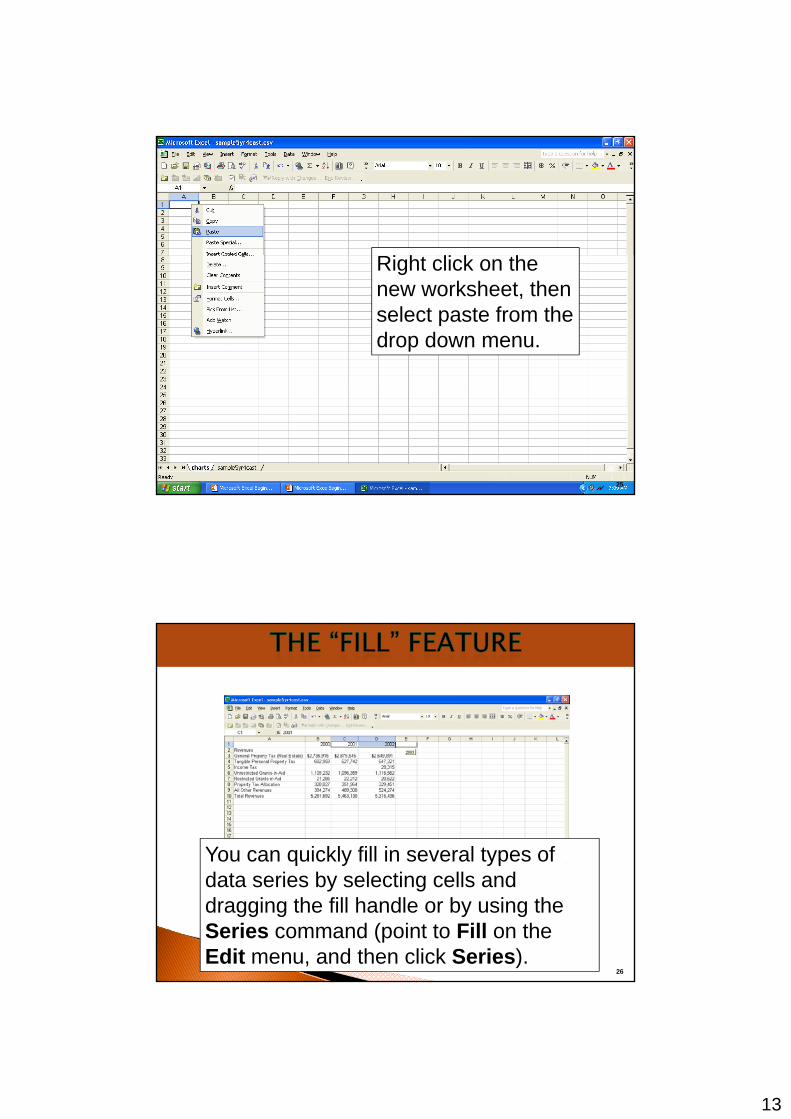
Ri h li k hRight click on the new worksheet, then select paste from the drop down menu.
25
You can quickly fill in several types of q y ypdata series by selecting cells and dragging the fill handle or by using the Series command (point to Fill on the Edit menu, and then click Series).
26
14
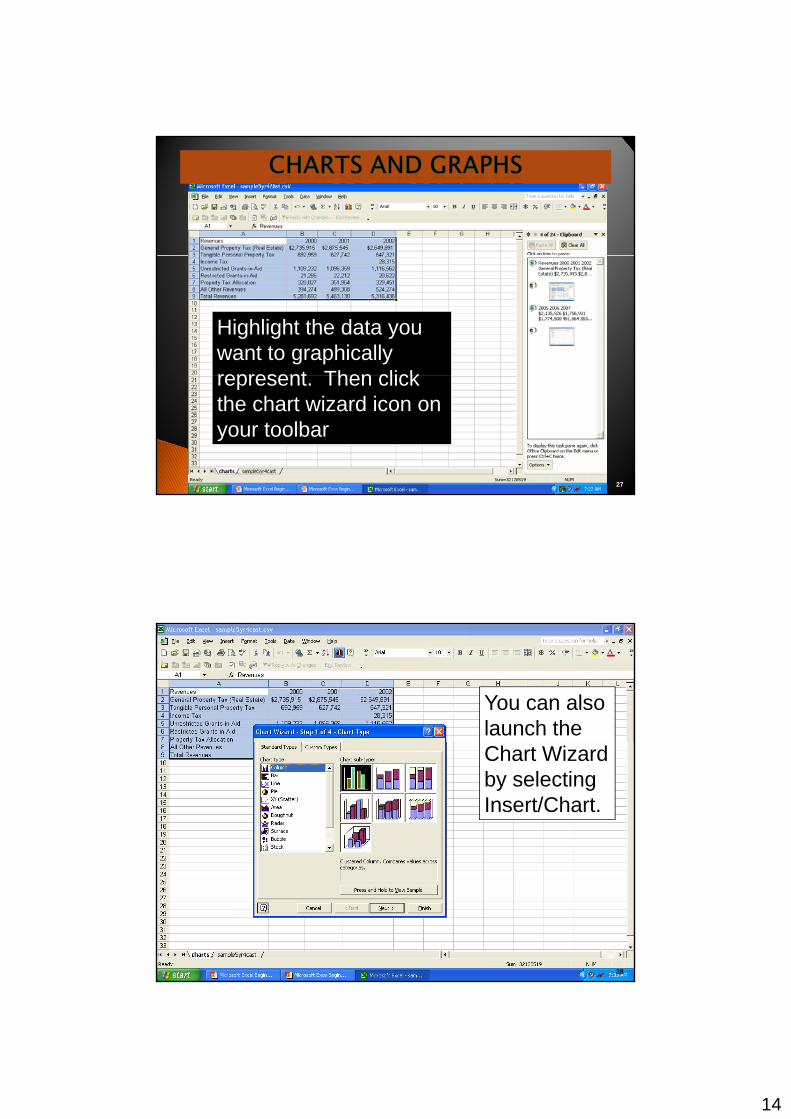
Highlight the data you want to graphically represent Then clickrepresent. Then click the chart wizard icon on your toolbar
27
You can also launch the Chart Wizard by selecting Insert/Chart.
28
15
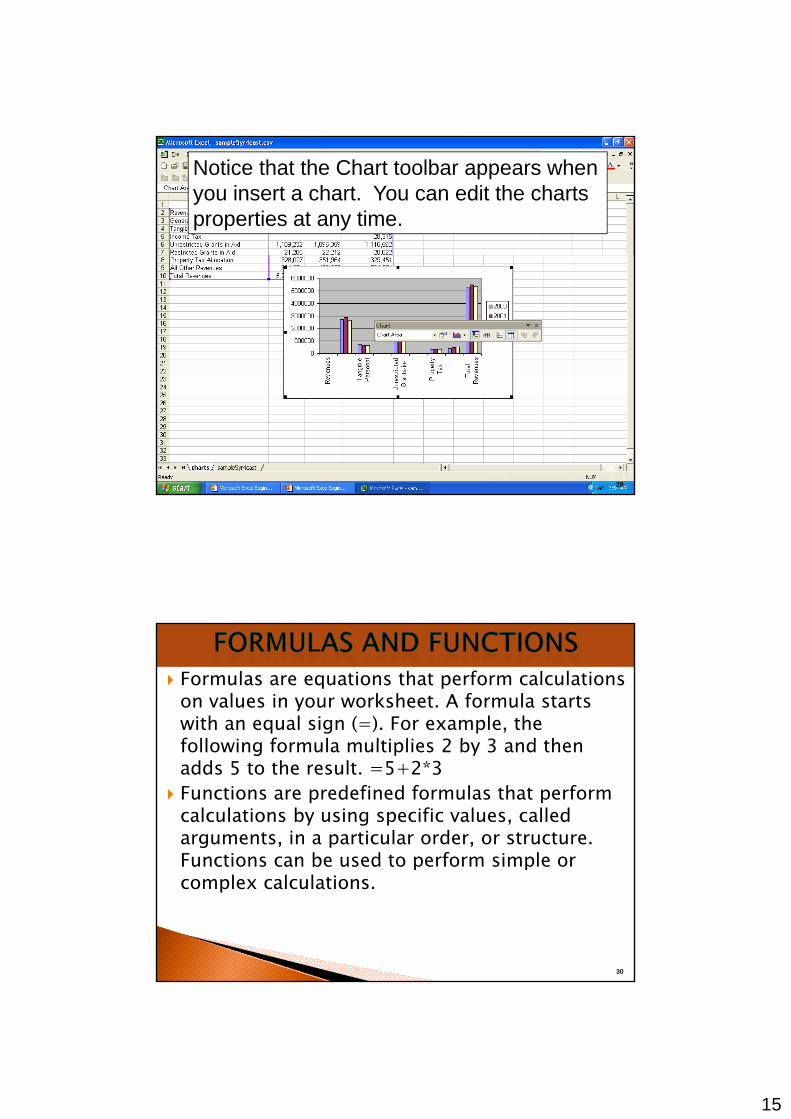
Notice that the Chart toolbar appears when you insert a chart. You can edit the charts properties at any time.
29
Formulas are equations that perform calculations on values in your worksheet. A formula starts with an equal sign (=). For example, the following formula multiplies 2 by 3 and thenfollowing formula multiplies 2 by 3 and then adds 5 to the result. =5+2*3
Functions are predefined formulas that perform calculations by using specific values, called arguments, in a particular order, or structure. Functions can be used to perform simple orFunctions can be used to perform simple or complex calculations.
30
16
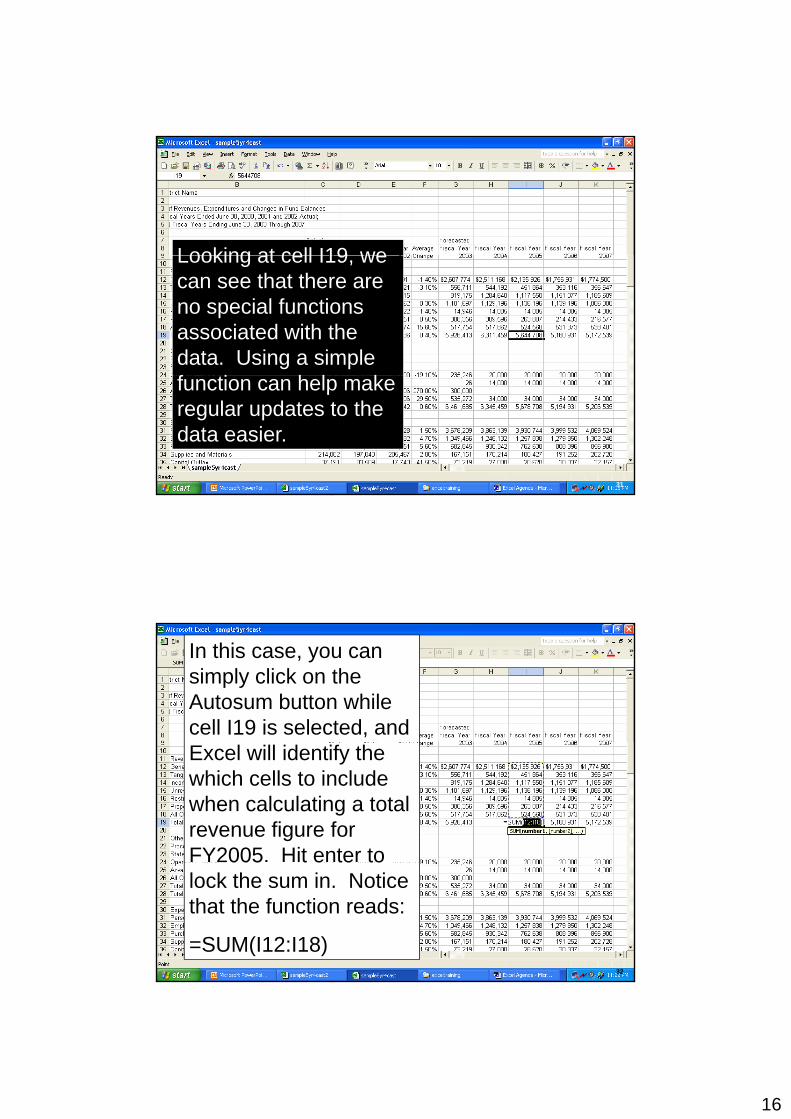
Looking at cell I19 weLooking at cell I19, we can see that there are no special functions associated with the data. Using a simple f i h l kfunction can help make regular updates to the data easier.
31
In this case, you can simply click on the Autosum button while cell I19 is selected, and Excel will identify the which cells to include when calculating a total revenue figure for FY2005. Hit enter to 005 t e te tolock the sum in. Notice that the function reads:
=SUM(I12:I18)32
17
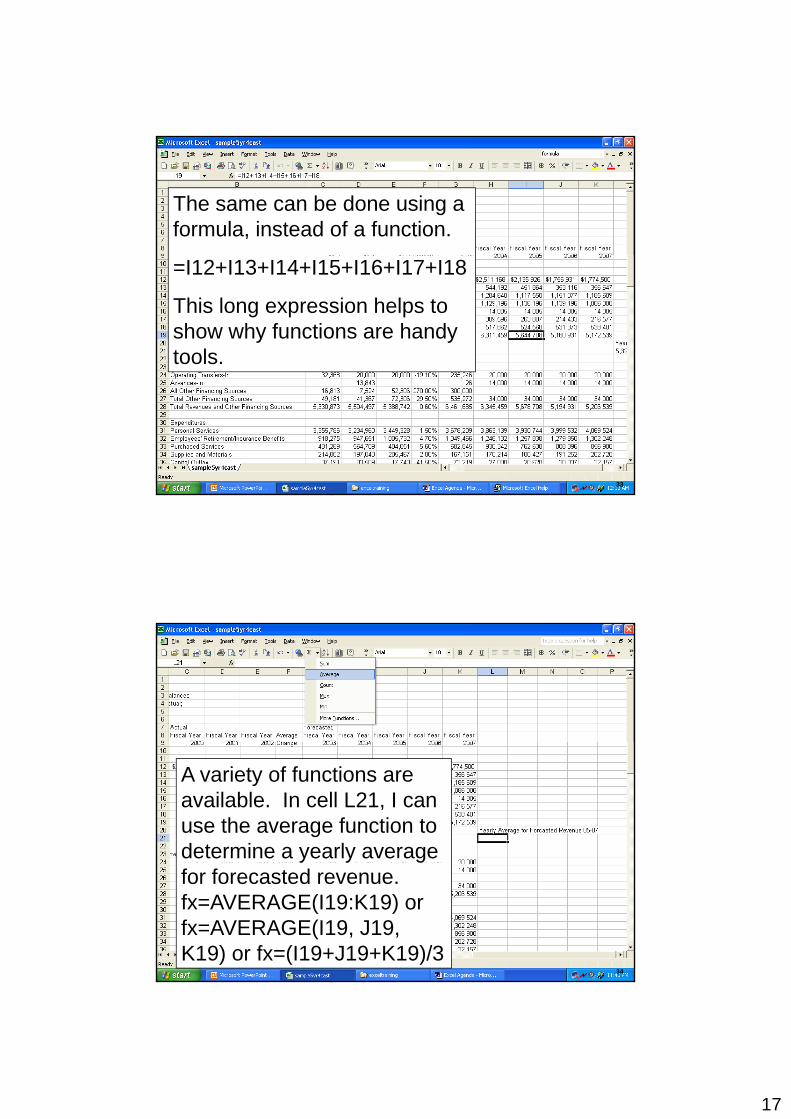
The same can be done using a formula, instead of a function.
=I12+I13+I14+I15+I16+I17+I18
This long expression helps to show why functions are handy tools.
33
A variety of functions are available. In cell L21, I can use the average function to determine a yearly average y y gfor forecasted revenue. fx=AVERAGE(I19:K19) or fx=AVERAGE(I19, J19, K19) or fx=(I19+J19+K19)/3
34
18
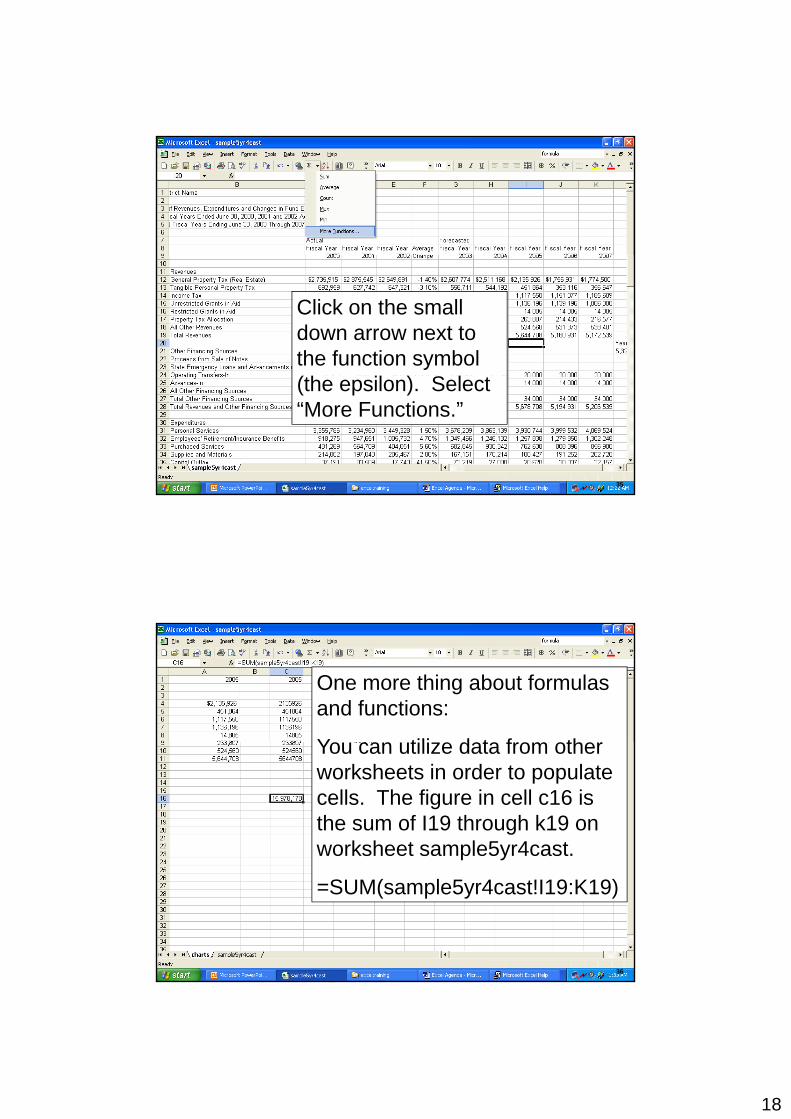
Click on the small down arrow next to the function symbol (the epsilon). Select “More Functions.”
35
One more thing about formulas and functions:
Yo can tili e data from otherYou can utilize data from other worksheets in order to populate cells. The figure in cell c16 is the sum of I19 through k19 on worksheet sample5yr4cast.
=SUM(sample5yr4cast!I19:K19)
36
19
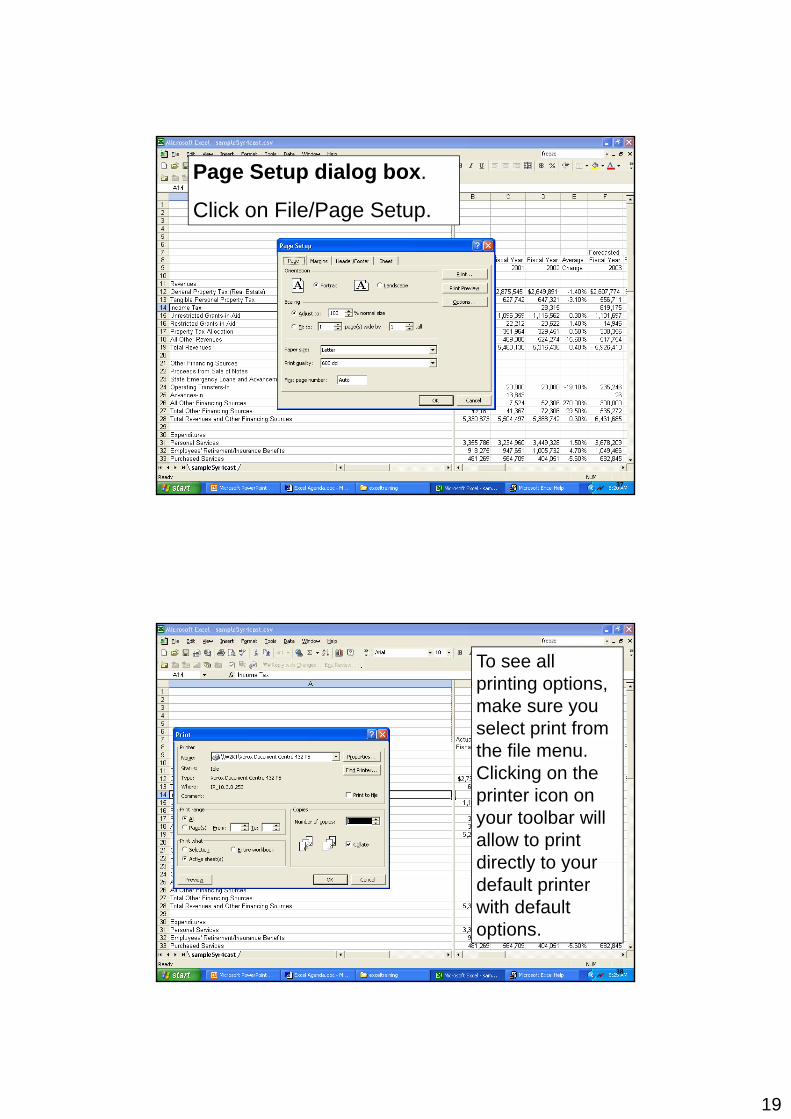
Page Setup dialog box.
Click on File/Page Setup.
37
To see all printing options, make sure you select print from the file menu. Clicking on the printer icon on your toolbar will allow to print directly to yourdirectly to your default printer with default options.
38
Related Documents