MicroRNA-29 family reverts aberrant methylation in lung cancer by targeting DNA methyltransferases 3A and 3B Muller Fabbri* † , Ramiro Garzon* † , Amelia Cimmino* †‡ , Zhongfa Liu †§ , Nicola Zanesi* † , Elisa Callegari* † , Shujun Liu* † , Hansjuerg Alder* † , Stefan Costinean* † , Cecilia Fernandez-Cymering* † , Stefano Volinia* † , Gulnur Guler ¶ , Carl D. Morrison , Kenneth K. Chan †§ , Guido Marcucci* † , George A. Calin* † , Kay Huebner* † , and Carlo M. Croce* † ** *Department of Molecular Virology, Immunology, and Medical Genetics, † Comprehensive Cancer Center, and § College of Pharmacy, Ohio State University, Columbus, OH 43210; ‡ Department of Biochemistry and Biophysics ‘‘F. Cedrangolo,’’ Medical School, Second University of Naples, 80138 Naples, Italy; ¶ Department of Pathology, Hacettepe University, Ankara 06100, Turkey; and Department of Pathology, Roswell Park Center Institute, Buffalo, NY 14263 Contributed by Carlo M. Croce, August 13, 2007 (sent for review August 3, 2007) MicroRNAs (miRNAs) are small, noncoding RNAs that regulate expression of many genes. Recent studies suggest roles of miRNAs in carcinogenesis. We and others have shown that expression profiles of miRNAs are different in lung cancer vs. normal lung, although the significance of this aberrant expression is poorly understood. Among the reported down-regulated miRNAs in lung cancer, the miRNA (miR)-29 family (29a, 29b, and 29c) has intriguing complementarities to the 3-UTRs of DNA methyltransferase (DNMT)3A and -3B (de novo methyltransferases), two key enzymes involved in DNA methylation, that are frequently up-regulated in lung cancer and associated with poor prognosis. We investigated whether miR-29s could target DNMT3A and -B and whether res- toration of miR-29s could normalize aberrant patterns of methyl- ation in non-small-cell lung cancer. Here we show that expression of miR-29s is inversely correlated to DNMT3A and -3B in lung cancer tissues, and that miR-29s directly target both DNMT3A and -3B. The enforced expression of miR-29s in lung cancer cell lines restores normal patterns of DNA methylation, induces reexpression of methylation-silenced tumor suppressor genes, such as FHIT and WWOX, and inhibits tumorigenicity in vitro and in vivo. These findings support a role of miR-29s in epigenetic normalization of NSCLC, providing a rationale for the development of miRNA-based strategies for the treatment of lung cancer. epigenetics tumor-suppressor genes L ung cancer is the leading cause of cancer mortality in the United States, with an incidence of 213,000 new cases per year and a very high mortality (1). Despite new drugs and therapeutic regi- mens, the prognosis for lung cancer patients has not significantly changed in the last 20 years. Non-small-cell lung cancer (NSCLC) accounts for 80% of lung cancers. Surgery remains the main therapy for NSCLC, but a large fraction of patients cannot undergo curative resection. Innovative therapeutic strategies are urgently needed for lung cancer treatment. Hypermethylation is responsible for the silencing of tumor suppressor genes (TSGs) involved in lung carcinogenesis, such as CDKN2A (2), CDH13 (2), FHIT (3), WWOX (3, 4), CDH1 (5), and RASSF1A (5). Specific alterations in DNA methylation patterns are hallmarks of human diseases and therefore could represent specific targets for treatment (6, 7). Methylation changes to the epigenome are controlled by DNA methyltransferases (DNMTs), which catalyze the transfer of a methyl group from the methyl donor S-adenosyl methionine onto the 5 position on the cytosine ring. Three catalytically active DNMTs have been identified in mammals, Dnmt1, Dnmt3A, and Dnmt3B (8). Dnmt3A and -3B proteins can introduce methyl groups onto CG sites that were unmethylated on the parental template strands of DNA (9). All DNMTs possess de novo meth- ylation activity, but Dnmt1 is inefficient in de novo methylation. Once a DNA methylation pattern has been established, it is maintained during DNA replication by the maintenance Dnmt1 (10). The levels of DNMT1, DNMT3A, and DNMT3B mRNA are reportedly elevated in various malignancies, including hepatomas, prostate, colorectal, and breast tumors (11–14). More recently, the mRNA levels of DNMT1 and DNMT3B have been found to be elevated in 53 and 58% of 102 NSCLCs, respectively (15), with DNMT1 levels independently correlated with prognosis in NSCLC patients (15). Dnmt1, -3A, and -3B protein expression, assessed by immunohistochemical analyses, also have been reportedly highly expressed coordinately in lung tumors of smokers (16). In lung squamous cell carcinomas, elevated Dnmt1 expression has been shown to predict a poorer prognosis, and elevated expression of both Dnmt1 and Dnmt3B have been shown to be correlated with hypermethylation of TSG promoters (16). A specific polymorphism in the DNMT3B promoter, which significantly increases promoter activity, has been associated with an increased risk of lung cancer in a hospital-based, case-control study of 659 patients (17). The inhibition of Dnmt1-mediated DNA methylation and histone deacetylation reduced tobacco carcinogen-induced lung cancer in mice by more than 50% (18). MicroRNAs (miRNAs) represent a class of naturally occurring small noncoding RNA molecules, distinct from but related to siRNAs. Mature miRNAs are 19- to 25-nucleotide-long molecules cleaved from 70- to 100-nucleotide hairpin pre-miRNA precursors (19). In animals, single-stranded miRNAs bind, through partial sequence homology, to the 3-UTR of target mRNAs and cause a block of translation or, less frequently, mRNA degradation (19). Deviations from normal miRNA expression patterns play roles in human diseases, including cancer, as reviewed elsewhere (20 –23). It has been demonstrated that expression of miRNA (miR)-29a, -29b, and -29c is down-regulated in NSCLCs (24, 25). In this study, we show that expression of miR-29s is inversely correlated to DNMT3A and -3B expression in lung cancer tissues and that miR-29s directly target both DNMT3A and -3B. The enforced expression of miR-29s in lung cancer cell lines restores normal patterns of DNA methylation, induces reexpression of methylation- silenced TSGs, such as FHIT and WWOX, and inhibits tumorige- nicity both in vitro and in vivo. Author contributions: M.F. and R.G. contributed equally to this work; M.F., R.G., K.H., and C.M.C. designed research; M.F., R.G., A.C., Z.L., N.Z., E.C., S.L., H.A., S.C., C.D.M., and K.K.C. performed research; C.M.C. contributed new reagents/analytic tools; M.F., R.G., A.C., Z.L., C.F.-C., S.V., G.G., G.M., G.A.C., K.H., and C.M.C. analyzed data; and M.F., R.G., and K.H. wrote the paper. The authors declare no conflict of interest. Abbreviations: DNMT, DNA methyltransferase; miRNA, microRNA; miR, miRNA; NSCLC, non-small-cell lung cancer; qRT-PCR, quantitative RT-PCR; TMA, tissue microarray; TSG, tumor suppressor gene. **To whom correspondence should be addressed at: 385L Wiseman Hall, 400 West 12th Avenue, Columbus, OH 43210. E-mail: [email protected]. © 2007 by The National Academy of Sciences of the USA www.pnas.orgcgidoi10.1073pnas.0707628104 PNAS October 2, 2007 vol. 104 no. 40 15805–15810 GENETICS

Welcome message from author
This document is posted to help you gain knowledge. Please leave a comment to let me know what you think about it! Share it to your friends and learn new things together.
Transcript
MicroRNA-29 family reverts aberrant methylation inlung cancer by targeting DNA methyltransferases3A and 3BMuller Fabbri*†, Ramiro Garzon*†, Amelia Cimmino*†‡, Zhongfa Liu†§, Nicola Zanesi*†, Elisa Callegari*†, Shujun Liu*†,Hansjuerg Alder*†, Stefan Costinean*†, Cecilia Fernandez-Cymering*†, Stefano Volinia*†, Gulnur Guler¶,Carl D. Morrison�, Kenneth K. Chan†§, Guido Marcucci*†, George A. Calin*†, Kay Huebner*†, and Carlo M. Croce*†**
*Department of Molecular Virology, Immunology, and Medical Genetics, †Comprehensive Cancer Center, and §College of Pharmacy, Ohio State University,Columbus, OH 43210; ‡Department of Biochemistry and Biophysics ‘‘F. Cedrangolo,’’ Medical School, Second University of Naples, 80138 Naples, Italy;¶Department of Pathology, Hacettepe University, Ankara 06100, Turkey; and �Department of Pathology, Roswell Park Center Institute, Buffalo, NY 14263
Contributed by Carlo M. Croce, August 13, 2007 (sent for review August 3, 2007)
MicroRNAs (miRNAs) are small, noncoding RNAs that regulateexpression of many genes. Recent studies suggest roles of miRNAsin carcinogenesis. We and others have shown that expressionprofiles of miRNAs are different in lung cancer vs. normal lung,although the significance of this aberrant expression is poorlyunderstood. Among the reported down-regulated miRNAs in lungcancer, the miRNA (miR)-29 family (29a, 29b, and 29c) has intriguingcomplementarities to the 3�-UTRs of DNA methyltransferase(DNMT)3A and -3B (de novo methyltransferases), two key enzymesinvolved in DNA methylation, that are frequently up-regulated inlung cancer and associated with poor prognosis. We investigatedwhether miR-29s could target DNMT3A and -B and whether res-toration of miR-29s could normalize aberrant patterns of methyl-ation in non-small-cell lung cancer. Here we show that expressionof miR-29s is inversely correlated to DNMT3A and -3B in lung cancertissues, and that miR-29s directly target both DNMT3A and -3B. Theenforced expression of miR-29s in lung cancer cell lines restoresnormal patterns of DNA methylation, induces reexpression ofmethylation-silenced tumor suppressor genes, such as FHIT andWWOX, and inhibits tumorigenicity in vitro and in vivo. Thesefindings support a role of miR-29s in epigenetic normalization ofNSCLC, providing a rationale for the development of miRNA-basedstrategies for the treatment of lung cancer.
epigenetics � tumor-suppressor genes
Lung cancer is the leading cause of cancer mortality in the UnitedStates, with an incidence of �213,000 new cases per year and a
very high mortality (1). Despite new drugs and therapeutic regi-mens, the prognosis for lung cancer patients has not significantlychanged in the last 20 years. Non-small-cell lung cancer (NSCLC)accounts for �80% of lung cancers. Surgery remains the maintherapy for NSCLC, but a large fraction of patients cannot undergocurative resection. Innovative therapeutic strategies are urgentlyneeded for lung cancer treatment. Hypermethylation is responsiblefor the silencing of tumor suppressor genes (TSGs) involved inlung carcinogenesis, such as CDKN2A (2), CDH13 (2), FHIT (3),WWOX (3, 4), CDH1 (5), and RASSF1A (5). Specific alterations inDNA methylation patterns are hallmarks of human diseases andtherefore could represent specific targets for treatment (6, 7).Methylation changes to the epigenome are controlled by DNAmethyltransferases (DNMTs), which catalyze the transfer of amethyl group from the methyl donor S-adenosyl methionine ontothe 5� position on the cytosine ring. Three catalytically activeDNMTs have been identified in mammals, Dnmt1, Dnmt3A, andDnmt3B (8). Dnmt3A and -3B proteins can introduce methylgroups onto CG sites that were unmethylated on the parentaltemplate strands of DNA (9). All DNMTs possess de novo meth-ylation activity, but Dnmt1 is inefficient in de novo methylation.Once a DNA methylation pattern has been established, it ismaintained during DNA replication by the maintenance Dnmt1
(10). The levels of DNMT1, DNMT3A, and DNMT3B mRNA arereportedly elevated in various malignancies, including hepatomas,prostate, colorectal, and breast tumors (11–14). More recently, themRNA levels of DNMT1 and DNMT3B have been found to beelevated in 53 and 58% of 102 NSCLCs, respectively (15), withDNMT1 levels independently correlated with prognosis in NSCLCpatients (15). Dnmt1, -3A, and -3B protein expression, assessed byimmunohistochemical analyses, also have been reportedly highlyexpressed coordinately in lung tumors of smokers (16). In lungsquamous cell carcinomas, elevated Dnmt1 expression has beenshown to predict a poorer prognosis, and elevated expression ofboth Dnmt1 and Dnmt3B have been shown to be correlated withhypermethylation of TSG promoters (16). A specific polymorphismin the DNMT3B promoter, which significantly increases promoteractivity, has been associated with an increased risk of lung cancerin a hospital-based, case-control study of 659 patients (17). Theinhibition of Dnmt1-mediated DNA methylation and histonedeacetylation reduced tobacco carcinogen-induced lung cancer inmice by more than 50% (18).
MicroRNAs (miRNAs) represent a class of naturally occurringsmall noncoding RNA molecules, distinct from but related tosiRNAs. Mature miRNAs are 19- to 25-nucleotide-long moleculescleaved from 70- to 100-nucleotide hairpin pre-miRNA precursors(19). In animals, single-stranded miRNAs bind, through partialsequence homology, to the 3�-UTR of target mRNAs and cause ablock of translation or, less frequently, mRNA degradation (19).Deviations from normal miRNA expression patterns play roles inhuman diseases, including cancer, as reviewed elsewhere (20–23).It has been demonstrated that expression of miRNA (miR)-29a,-29b, and -29c is down-regulated in NSCLCs (24, 25). In this study,we show that expression of miR-29s is inversely correlated toDNMT3A and -3B expression in lung cancer tissues and thatmiR-29s directly target both DNMT3A and -3B. The enforcedexpression of miR-29s in lung cancer cell lines restores normalpatterns of DNA methylation, induces reexpression of methylation-silenced TSGs, such as FHIT and WWOX, and inhibits tumorige-nicity both in vitro and in vivo.
Author contributions: M.F. and R.G. contributed equally to this work; M.F., R.G., K.H., andC.M.C. designed research; M.F., R.G., A.C., Z.L., N.Z., E.C., S.L., H.A., S.C., C.D.M., and K.K.C.performed research; C.M.C. contributed new reagents/analytic tools; M.F., R.G., A.C., Z.L.,C.F.-C., S.V., G.G., G.M., G.A.C., K.H., and C.M.C. analyzed data; and M.F., R.G., and K.H.wrote the paper.
The authors declare no conflict of interest.
Abbreviations: DNMT, DNA methyltransferase; miRNA, microRNA; miR, miRNA; NSCLC,non-small-cell lung cancer; qRT-PCR, quantitative RT-PCR; TMA, tissue microarray; TSG,tumor suppressor gene.
**To whom correspondence should be addressed at: 385L Wiseman Hall, 400 West 12thAvenue, Columbus, OH 43210. E-mail: [email protected].
© 2007 by The National Academy of Sciences of the USA
www.pnas.org�cgi�doi�10.1073�pnas.0707628104 PNAS � October 2, 2007 � vol. 104 � no. 40 � 15805–15810
GEN
ETIC
S
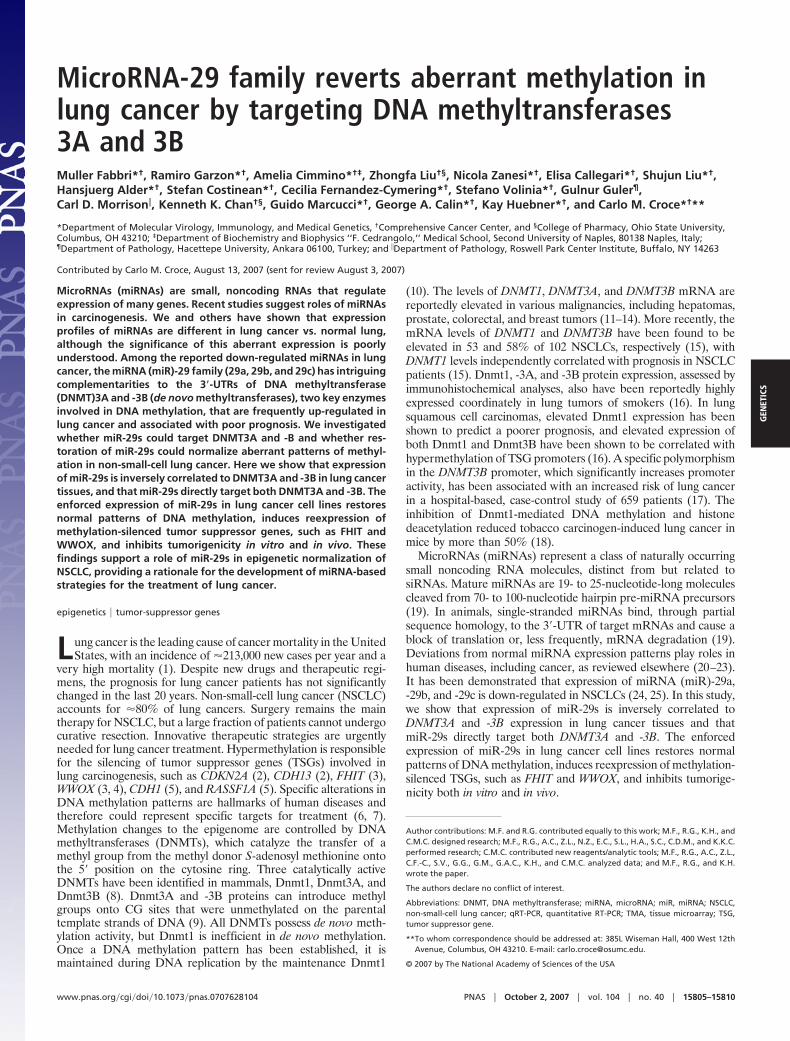
Results and DiscussionTo confirm the relevance of expression of DNMTs in lung cancer,we assessed the expression of Dnmt1, -3A, and -3B proteins byimmunohistochemical analyses in 172 matched nonneoplastic/cancerous lung tissues for which clinical features and time ofsurvival were available; as shown in Fig. 1, high-level expression ofDnmt3A protein was significantly associated with lower overallsurvival (P � 0.029). No statistically significant correlation withsurvival was observed for Dnmt1 or Dnmt3B in this patientpopulation.
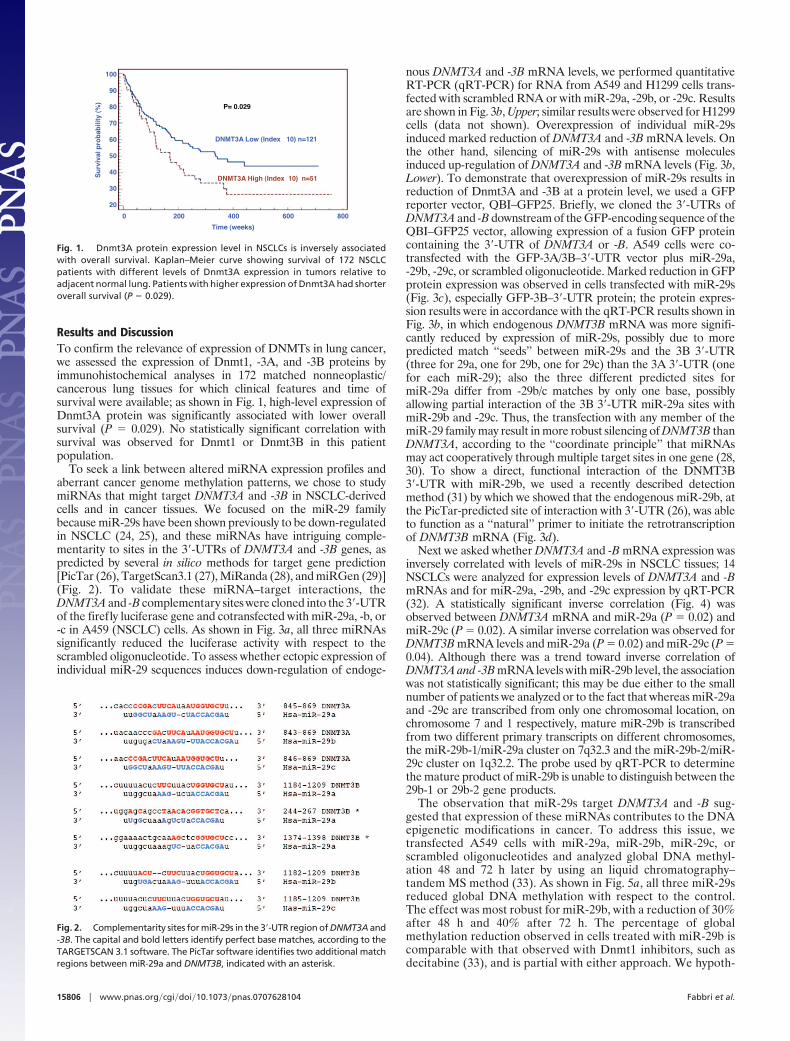
To seek a link between altered miRNA expression profiles andaberrant cancer genome methylation patterns, we chose to studymiRNAs that might target DNMT3A and -3B in NSCLC-derivedcells and in cancer tissues. We focused on the miR-29 familybecause miR-29s have been shown previously to be down-regulatedin NSCLC (24, 25), and these miRNAs have intriguing comple-mentarity to sites in the 3�-UTRs of DNMT3A and -3B genes, aspredicted by several in silico methods for target gene prediction[PicTar (26), TargetScan3.1 (27), MiRanda (28), and miRGen (29)](Fig. 2). To validate these miRNA–target interactions, theDNMT3A and -B complementary sites were cloned into the 3�-UTRof the firefly luciferase gene and cotransfected with miR-29a, -b, or-c in A459 (NSCLC) cells. As shown in Fig. 3a, all three miRNAssignificantly reduced the luciferase activity with respect to thescrambled oligonucleotide. To assess whether ectopic expression ofindividual miR-29 sequences induces down-regulation of endoge-
nous DNMT3A and -3B mRNA levels, we performed quantitativeRT-PCR (qRT-PCR) for RNA from A549 and H1299 cells trans-fected with scrambled RNA or with miR-29a, -29b, or -29c. Resultsare shown in Fig. 3b, Upper; similar results were observed for H1299cells (data not shown). Overexpression of individual miR-29sinduced marked reduction of DNMT3A and -3B mRNA levels. Onthe other hand, silencing of miR-29s with antisense moleculesinduced up-regulation of DNMT3A and -3B mRNA levels (Fig. 3b,Lower). To demonstrate that overexpression of miR-29s results inreduction of Dnmt3A and -3B at a protein level, we used a GFPreporter vector, QBI–GFP25. Briefly, we cloned the 3�-UTRs ofDNMT3A and -B downstream of the GFP-encoding sequence of theQBI–GFP25 vector, allowing expression of a fusion GFP proteincontaining the 3�-UTR of DNMT3A or -B. A549 cells were co-transfected with the GFP-3A/3B–3�-UTR vector plus miR-29a,-29b, -29c, or scrambled oligonucleotide. Marked reduction in GFPprotein expression was observed in cells transfected with miR-29s(Fig. 3c), especially GFP-3B–3�-UTR protein; the protein expres-sion results were in accordance with the qRT-PCR results shown inFig. 3b, in which endogenous DNMT3B mRNA was more signifi-cantly reduced by expression of miR-29s, possibly due to morepredicted match ‘‘seeds’’ between miR-29s and the 3B 3�-UTR(three for 29a, one for 29b, one for 29c) than the 3A 3�-UTR (onefor each miR-29); also the three different predicted sites formiR-29a differ from -29b/c matches by only one base, possiblyallowing partial interaction of the 3B 3�-UTR miR-29a sites withmiR-29b and -29c. Thus, the transfection with any member of themiR-29 family may result in more robust silencing of DNMT3B thanDNMT3A, according to the ‘‘coordinate principle’’ that miRNAsmay act cooperatively through multiple target sites in one gene (28,30). To show a direct, functional interaction of the DNMT3B3�-UTR with miR-29b, we used a recently described detectionmethod (31) by which we showed that the endogenous miR-29b, atthe PicTar-predicted site of interaction with 3�-UTR (26), was ableto function as a ‘‘natural’’ primer to initiate the retrotranscriptionof DNMT3B mRNA (Fig. 3d).
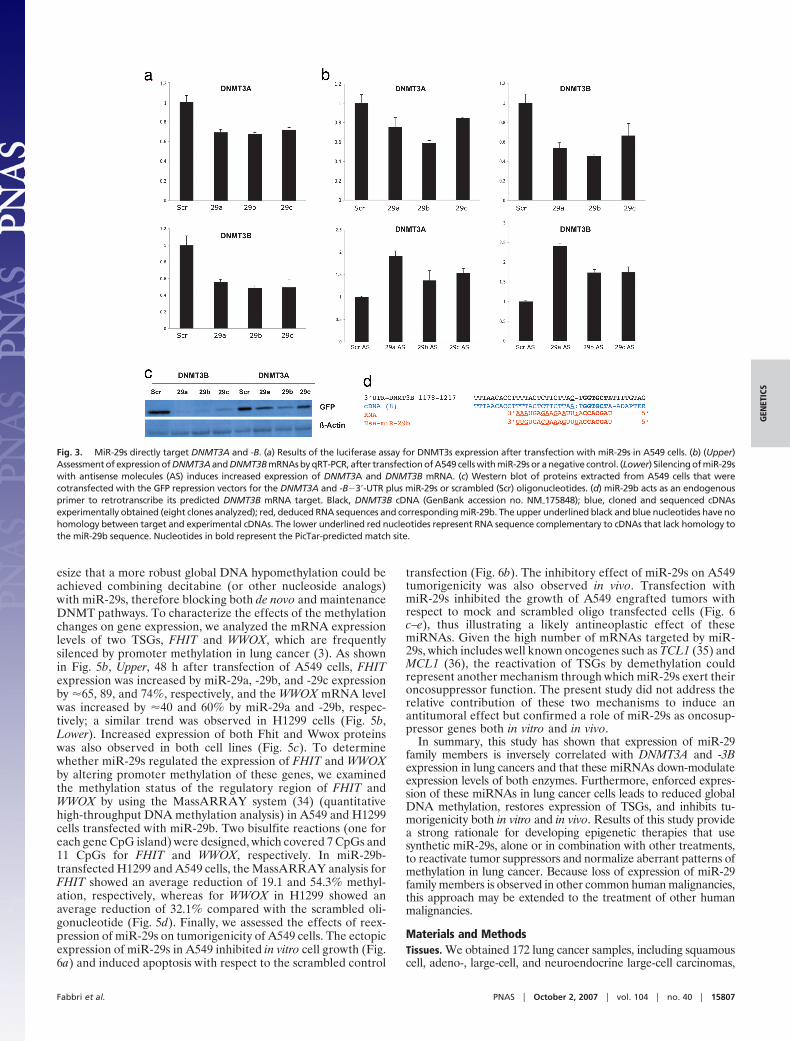
Next we asked whether DNMT3A and -B mRNA expression wasinversely correlated with levels of miR-29s in NSCLC tissues; 14NSCLCs were analyzed for expression levels of DNMT3A and -BmRNAs and for miR-29a, -29b, and -29c expression by qRT-PCR(32). A statistically significant inverse correlation (Fig. 4) wasobserved between DNMT3A mRNA and miR-29a (P � 0.02) andmiR-29c (P � 0.02). A similar inverse correlation was observed forDNMT3B mRNA levels and miR-29a (P � 0.02) and miR-29c (P �0.04). Although there was a trend toward inverse correlation ofDNMT3A and -3B mRNA levels with miR-29b level, the associationwas not statistically significant; this may be due either to the smallnumber of patients we analyzed or to the fact that whereas miR-29aand -29c are transcribed from only one chromosomal location, onchromosome 7 and 1 respectively, mature miR-29b is transcribedfrom two different primary transcripts on different chromosomes,the miR-29b-1/miR-29a cluster on 7q32.3 and the miR-29b-2/miR-29c cluster on 1q32.2. The probe used by qRT-PCR to determinethe mature product of miR-29b is unable to distinguish between the29b-1 or 29b-2 gene products.
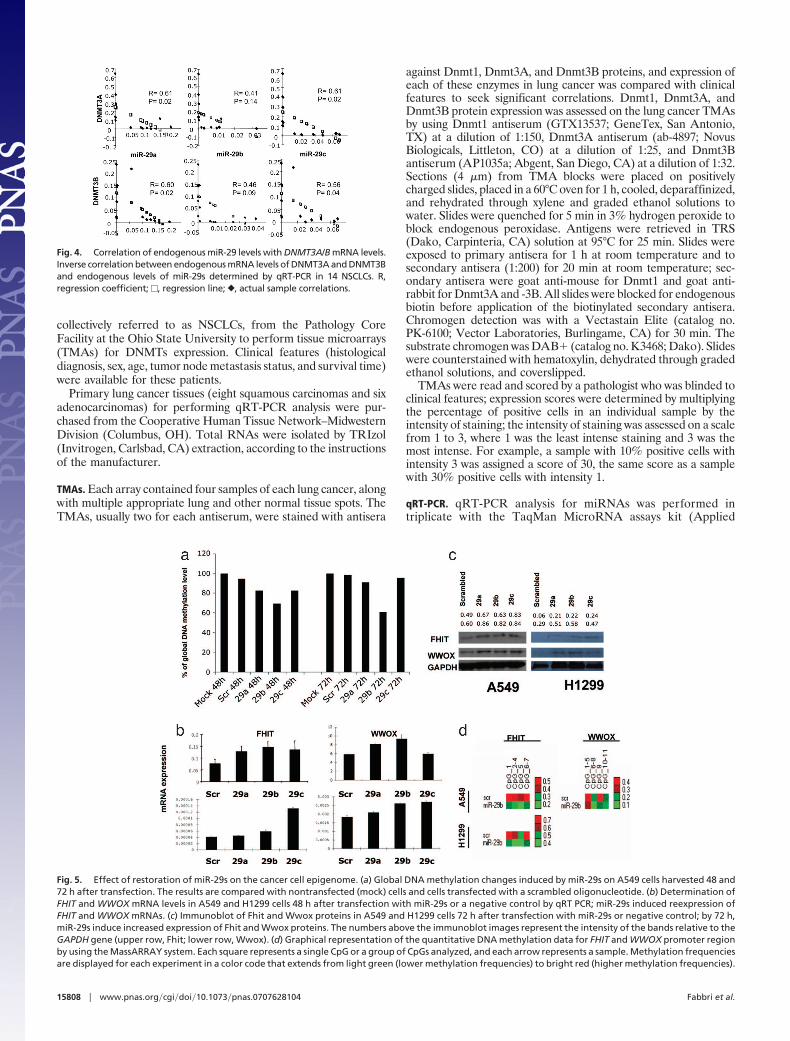
The observation that miR-29s target DNMT3A and -B sug-gested that expression of these miRNAs contributes to the DNAepigenetic modifications in cancer. To address this issue, wetransfected A549 cells with miR-29a, miR-29b, miR-29c, orscrambled oligonucleotides and analyzed global DNA methyl-ation 48 and 72 h later by using an liquid chromatography–tandem MS method (33). As shown in Fig. 5a, all three miR-29sreduced global DNA methylation with respect to the control.The effect was most robust for miR-29b, with a reduction of 30%after 48 h and 40% after 72 h. The percentage of globalmethylation reduction observed in cells treated with miR-29b iscomparable with that observed with Dnmt1 inhibitors, such asdecitabine (33), and is partial with either approach. We hypoth-
xednI( woL A3TMND 121=n )01
xednI( hgiH A3TMND 15=n )01
920.0 =P
100
90
80
70
60
50
40
30
20
Su
rviv
al p
rob
abili
ty (
%)
0 200 400 600 800
Time (weeks)
Fig. 1. Dnmt3A protein expression level in NSCLCs is inversely associatedwith overall survival. Kaplan–Meier curve showing survival of 172 NSCLCpatients with different levels of Dnmt3A expression in tumors relative toadjacent normal lung. Patients with higher expression of Dnmt3A had shorteroverall survival (P � 0.029).
Fig. 2. Complementarity sites for miR-29s in the 3�-UTR region of DNMT3A and-3B. The capital and bold letters identify perfect base matches, according to theTARGETSCAN 3.1 software. The PicTar software identifies two additional matchregions between miR-29a and DNMT3B, indicated with an asterisk.
15806 � www.pnas.org�cgi�doi�10.1073�pnas.0707628104 Fabbri et al.
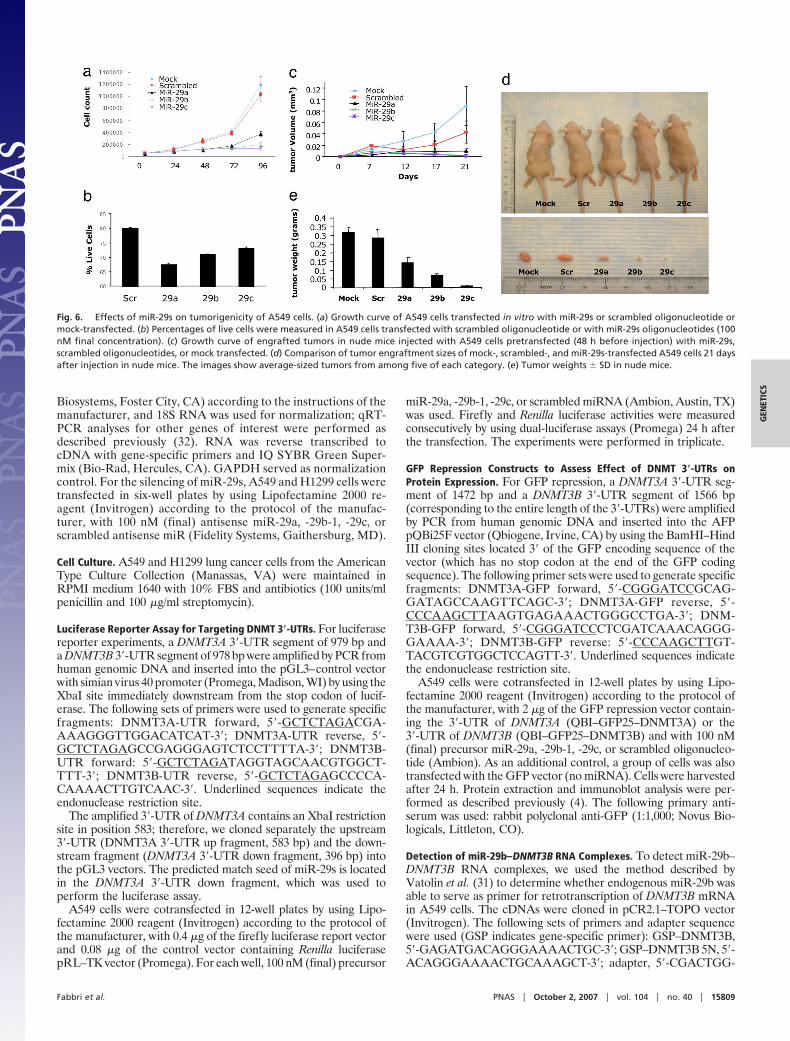
esize that a more robust global DNA hypomethylation could beachieved combining decitabine (or other nucleoside analogs)with miR-29s, therefore blocking both de novo and maintenanceDNMT pathways. To characterize the effects of the methylationchanges on gene expression, we analyzed the mRNA expressionlevels of two TSGs, FHIT and WWOX, which are frequentlysilenced by promoter methylation in lung cancer (3). As shownin Fig. 5b, Upper, 48 h after transfection of A549 cells, FHITexpression was increased by miR-29a, -29b, and -29c expressionby �65, 89, and 74%, respectively, and the WWOX mRNA levelwas increased by �40 and 60% by miR-29a and -29b, respec-tively; a similar trend was observed in H1299 cells (Fig. 5b,Lower). Increased expression of both Fhit and Wwox proteinswas also observed in both cell lines (Fig. 5c). To determinewhether miR-29s regulated the expression of FHIT and WWOXby altering promoter methylation of these genes, we examinedthe methylation status of the regulatory region of FHIT andWWOX by using the MassARRAY system (34) (quantitativehigh-throughput DNA methylation analysis) in A549 and H1299cells transfected with miR-29b. Two bisulfite reactions (one foreach gene CpG island) were designed, which covered 7 CpGs and11 CpGs for FHIT and WWOX, respectively. In miR-29b-transfected H1299 and A549 cells, the MassARRAY analysis forFHIT showed an average reduction of 19.1 and 54.3% methyl-ation, respectively, whereas for WWOX in H1299 showed anaverage reduction of 32.1% compared with the scrambled oli-gonucleotide (Fig. 5d). Finally, we assessed the effects of reex-pression of miR-29s on tumorigenicity of A549 cells. The ectopicexpression of miR-29s in A549 inhibited in vitro cell growth (Fig.6a) and induced apoptosis with respect to the scrambled control
transfection (Fig. 6b). The inhibitory effect of miR-29s on A549tumorigenicity was also observed in vivo. Transfection withmiR-29s inhibited the growth of A549 engrafted tumors withrespect to mock and scrambled oligo transfected cells (Fig. 6c–e), thus illustrating a likely antineoplastic effect of thesemiRNAs. Given the high number of mRNAs targeted by miR-29s, which includes well known oncogenes such as TCL1 (35) andMCL1 (36), the reactivation of TSGs by demethylation couldrepresent another mechanism through which miR-29s exert theironcosuppressor function. The present study did not address therelative contribution of these two mechanisms to induce anantitumoral effect but confirmed a role of miR-29s as oncosup-pressor genes both in vitro and in vivo.
In summary, this study has shown that expression of miR-29family members is inversely correlated with DNMT3A and -3Bexpression in lung cancers and that these miRNAs down-modulateexpression levels of both enzymes. Furthermore, enforced expres-sion of these miRNAs in lung cancer cells leads to reduced globalDNA methylation, restores expression of TSGs, and inhibits tu-morigenicity both in vitro and in vivo. Results of this study providea strong rationale for developing epigenetic therapies that usesynthetic miR-29s, alone or in combination with other treatments,to reactivate tumor suppressors and normalize aberrant patterns ofmethylation in lung cancer. Because loss of expression of miR-29family members is observed in other common human malignancies,this approach may be extended to the treatment of other humanmalignancies.
Materials and MethodsTissues. We obtained 172 lung cancer samples, including squamouscell, adeno-, large-cell, and neuroendocrine large-cell carcinomas,
Fig. 3. MiR-29s directly target DNMT3A and -B. (a) Results of the luciferase assay for DNMT3s expression after transfection with miR-29s in A549 cells. (b) (Upper)Assessment of expression of DNMT3A and DNMT3B mRNAs by qRT-PCR, after transfection of A549 cells with miR-29s or a negative control. (Lower) Silencing of miR-29swith antisense molecules (AS) induces increased expression of DNMT3A and DNMT3B mRNA. (c) Western blot of proteins extracted from A549 cells that werecotransfected with the GFP repression vectors for the DNMT3A and -B�3�-UTR plus miR-29s or scrambled (Scr) oligonucleotides. (d) miR-29b acts as an endogenousprimer to retrotranscribe its predicted DNMT3B mRNA target. Black, DNMT3B cDNA (GenBank accession no. NM�175848); blue, cloned and sequenced cDNAsexperimentally obtained (eight clones analyzed); red, deduced RNA sequences and corresponding miR-29b. The upper underlined black and blue nucleotides have nohomology between target and experimental cDNAs. The lower underlined red nucleotides represent RNA sequence complementary to cDNAs that lack homology tothe miR-29b sequence. Nucleotides in bold represent the PicTar-predicted match site.
Fabbri et al. PNAS � October 2, 2007 � vol. 104 � no. 40 � 15807
GEN
ETIC
S
collectively referred to as NSCLCs, from the Pathology CoreFacility at the Ohio State University to perform tissue microarrays(TMAs) for DNMTs expression. Clinical features (histologicaldiagnosis, sex, age, tumor node metastasis status, and survival time)were available for these patients.
Primary lung cancer tissues (eight squamous carcinomas and sixadenocarcinomas) for performing qRT-PCR analysis were pur-chased from the Cooperative Human Tissue Network–MidwesternDivision (Columbus, OH). Total RNAs were isolated by TRIzol(Invitrogen, Carlsbad, CA) extraction, according to the instructionsof the manufacturer.
TMAs. Each array contained four samples of each lung cancer, alongwith multiple appropriate lung and other normal tissue spots. TheTMAs, usually two for each antiserum, were stained with antisera
against Dnmt1, Dnmt3A, and Dnmt3B proteins, and expression ofeach of these enzymes in lung cancer was compared with clinicalfeatures to seek significant correlations. Dnmt1, Dnmt3A, andDnmt3B protein expression was assessed on the lung cancer TMAsby using Dnmt1 antiserum (GTX13537; GeneTex, San Antonio,TX) at a dilution of 1:150, Dnmt3A antiserum (ab-4897; NovusBiologicals, Littleton, CO) at a dilution of 1:25, and Dnmt3Bantiserum (AP1035a; Abgent, San Diego, CA) at a dilution of 1:32.Sections (4 �m) from TMA blocks were placed on positivelycharged slides, placed in a 60°C oven for 1 h, cooled, deparaffinized,and rehydrated through xylene and graded ethanol solutions towater. Slides were quenched for 5 min in 3% hydrogen peroxide toblock endogenous peroxidase. Antigens were retrieved in TRS(Dako, Carpinteria, CA) solution at 95°C for 25 min. Slides wereexposed to primary antisera for 1 h at room temperature and tosecondary antisera (1:200) for 20 min at room temperature; sec-ondary antisera were goat anti-mouse for Dnmt1 and goat anti-rabbit for Dnmt3A and -3B. All slides were blocked for endogenousbiotin before application of the biotinylated secondary antisera.Chromogen detection was with a Vectastain Elite (catalog no.PK-6100; Vector Laboratories, Burlingame, CA) for 30 min. Thesubstrate chromogen was DAB� (catalog no. K3468; Dako). Slideswere counterstained with hematoxylin, dehydrated through gradedethanol solutions, and coverslipped.
TMAs were read and scored by a pathologist who was blinded toclinical features; expression scores were determined by multiplyingthe percentage of positive cells in an individual sample by theintensity of staining; the intensity of staining was assessed on a scalefrom 1 to 3, where 1 was the least intense staining and 3 was themost intense. For example, a sample with 10% positive cells withintensity 3 was assigned a score of 30, the same score as a samplewith 30% positive cells with intensity 1.
qRT-PCR. qRT-PCR analysis for miRNAs was performed intriplicate with the TaqMan MicroRNA assays kit (Applied
Fig. 4. Correlation of endogenous miR-29 levels with DNMT3A/B mRNA levels.Inverse correlation between endogenous mRNA levels of DNMT3A and DNMT3Band endogenous levels of miR-29s determined by qRT-PCR in 14 NSCLCs. R,regression coefficient; e, regression line; }, actual sample correlations.
Fig. 5. Effect of restoration of miR-29s on the cancer cell epigenome. (a) Global DNA methylation changes induced by miR-29s on A549 cells harvested 48 and72 h after transfection. The results are compared with nontransfected (mock) cells and cells transfected with a scrambled oligonucleotide. (b) Determination ofFHIT and WWOX mRNA levels in A549 and H1299 cells 48 h after transfection with miR-29s or a negative control by qRT PCR; miR-29s induced reexpression ofFHIT and WWOX mRNAs. (c) Immunoblot of Fhit and Wwox proteins in A549 and H1299 cells 72 h after transfection with miR-29s or negative control; by 72 h,miR-29s induce increased expression of Fhit and Wwox proteins. The numbers above the immunoblot images represent the intensity of the bands relative to theGAPDH gene (upper row, Fhit; lower row, Wwox). (d) Graphical representation of the quantitative DNA methylation data for FHIT and WWOX promoter regionby using the MassARRAY system. Each square represents a single CpG or a group of CpGs analyzed, and each arrow represents a sample. Methylation frequenciesare displayed for each experiment in a color code that extends from light green (lower methylation frequencies) to bright red (higher methylation frequencies).
15808 � www.pnas.org�cgi�doi�10.1073�pnas.0707628104 Fabbri et al.
Biosystems, Foster City, CA) according to the instructions of themanufacturer, and 18S RNA was used for normalization; qRT-PCR analyses for other genes of interest were performed asdescribed previously (32). RNA was reverse transcribed tocDNA with gene-specific primers and IQ SYBR Green Super-mix (Bio-Rad, Hercules, CA). GAPDH served as normalizationcontrol. For the silencing of miR-29s, A549 and H1299 cells weretransfected in six-well plates by using Lipofectamine 2000 re-agent (Invitrogen) according to the protocol of the manufac-turer, with 100 nM (final) antisense miR-29a, -29b-1, -29c, orscrambled antisense miR (Fidelity Systems, Gaithersburg, MD).
Cell Culture. A549 and H1299 lung cancer cells from the AmericanType Culture Collection (Manassas, VA) were maintained inRPMI medium 1640 with 10% FBS and antibiotics (100 units/mlpenicillin and 100 �g/ml streptomycin).
Luciferase Reporter Assay for Targeting DNMT 3�-UTRs. For luciferasereporter experiments, a DNMT3A 3�-UTR segment of 979 bp anda DNMT3B 3�-UTR segment of 978 bp were amplified by PCR fromhuman genomic DNA and inserted into the pGL3–control vectorwith simian virus 40 promoter (Promega, Madison, WI) by using theXbaI site immediately downstream from the stop codon of lucif-erase. The following sets of primers were used to generate specificfragments: DNMT3A-UTR forward, 5�-GCTCTAGACGA-AAAGGGTTGGACATCAT-3�; DNMT3A-UTR reverse, 5�-GCTCTAGAGCCGAGGGAGTCTCCTTTTA-3�; DNMT3B-UTR forward: 5�-GCTCTAGATAGGTAGCAACGTGGCT-TTT-3�; DNMT3B-UTR reverse, 5�-GCTCTAGAGCCCCA-CAAAACTTGTCAAC-3�. Underlined sequences indicate theendonuclease restriction site.
The amplified 3�-UTR of DNMT3A contains an XbaI restrictionsite in position 583; therefore, we cloned separately the upstream3�-UTR (DNMT3A 3�-UTR up fragment, 583 bp) and the down-stream fragment (DNMT3A 3�-UTR down fragment, 396 bp) intothe pGL3 vectors. The predicted match seed of miR-29s is locatedin the DNMT3A 3�-UTR down fragment, which was used toperform the luciferase assay.
A549 cells were cotransfected in 12-well plates by using Lipo-fectamine 2000 reagent (Invitrogen) according to the protocol ofthe manufacturer, with 0.4 �g of the firefly luciferase report vectorand 0.08 �g of the control vector containing Renilla luciferasepRL–TK vector (Promega). For each well, 100 nM (final) precursor
miR-29a, -29b-1, -29c, or scrambled miRNA (Ambion, Austin, TX)was used. Firefly and Renilla luciferase activities were measuredconsecutively by using dual-luciferase assays (Promega) 24 h afterthe transfection. The experiments were performed in triplicate.
GFP Repression Constructs to Assess Effect of DNMT 3�-UTRs onProtein Expression. For GFP repression, a DNMT3A 3�-UTR seg-ment of 1472 bp and a DNMT3B 3�-UTR segment of 1566 bp(corresponding to the entire length of the 3�-UTRs) were amplifiedby PCR from human genomic DNA and inserted into the AFPpQBi25F vector (Qbiogene, Irvine, CA) by using the BamHI–HindIII cloning sites located 3� of the GFP encoding sequence of thevector (which has no stop codon at the end of the GFP codingsequence). The following primer sets were used to generate specificfragments: DNMT3A-GFP forward, 5�-CGGGATCCGCAG-GATAGCCAAGTTCAGC-3�; DNMT3A-GFP reverse, 5�-CCCAAGCTTAAGTGAGAAACTGGGCCTGA-3�; DNM-T3B-GFP forward, 5�-CGGGATCCCTCGATCAAACAGGG-GAAAA-3�; DNMT3B-GFP reverse: 5�-CCCAAGCTTGT-TACGTCGTGGCTCCAGTT-3�. Underlined sequences indicatethe endonuclease restriction site.
A549 cells were cotransfected in 12-well plates by using Lipo-fectamine 2000 reagent (Invitrogen) according to the protocol ofthe manufacturer, with 2 �g of the GFP repression vector contain-ing the 3�-UTR of DNMT3A (QBI–GFP25–DNMT3A) or the3�-UTR of DNMT3B (QBI–GFP25–DNMT3B) and with 100 nM(final) precursor miR-29a, -29b-1, -29c, or scrambled oligonucleo-tide (Ambion). As an additional control, a group of cells was alsotransfected with the GFP vector (no miRNA). Cells were harvestedafter 24 h. Protein extraction and immunoblot analysis were per-formed as described previously (4). The following primary anti-serum was used: rabbit polyclonal anti-GFP (1:1,000; Novus Bio-logicals, Littleton, CO).
Detection of miR-29b–DNMT3B RNA Complexes. To detect miR-29b–DNMT3B RNA complexes, we used the method described byVatolin et al. (31) to determine whether endogenous miR-29b wasable to serve as primer for retrotranscription of DNMT3B mRNAin A549 cells. The cDNAs were cloned in pCR2.1–TOPO vector(Invitrogen). The following sets of primers and adapter sequencewere used (GSP indicates gene-specific primer): GSP–DNMT3B,5�-GAGATGACAGGGAAAACTGC-3�; GSP–DNMT3B 5N, 5�-ACAGGGAAAACTGCAAAGCT-3�; adapter, 5�-CGACTGG-
Fig. 6. Effects of miR-29s on tumorigenicity of A549 cells. (a) Growth curve of A549 cells transfected in vitro with miR-29s or scrambled oligonucleotide ormock-transfected. (b) Percentages of live cells were measured in A549 cells transfected with scrambled oligonucleotide or with miR-29s oligonucleotides (100nM final concentration). (c) Growth curve of engrafted tumors in nude mice injected with A549 cells pretransfected (48 h before injection) with miR-29s,scrambled oligonucleotides, or mock transfected. (d) Comparison of tumor engraftment sizes of mock-, scrambled-, and miR-29s-transfected A549 cells 21 daysafter injection in nude mice. The images show average-sized tumors from among five of each category. (e) Tumor weights � SD in nude mice.
Fabbri et al. PNAS � October 2, 2007 � vol. 104 � no. 40 � 15809
GEN
ETIC
S
AGCACGAGGACACTGACATGGACTGAAGGAGTAG-AAA-3�; adapter 5N, 5�-CTGAAGGAGTAGAAA-3�. Primersdesignated as 5N represent nested primers from the adapter andGSP sequence used to sensitize the detection of the PCR bands.
Global Methylation Studies. The global methylation status of A549cells after transfection with scrambled miRNA and with miR-29swas determined as described previously (33). For this assay, 2 � 106
A549 cells were transfected as described above for the luciferaseassay and collected 48 and 72 h later.
Quantitative DNA Methylation. Quantitative DNA methylation anal-ysis of the regulatory regions of FHIT and WWOX was performedby using the EpiTYPER methylation analysis assay (Sequenom,San Diego, CA). Two bisulfite reactions (one for each gene CpGisland) were designed, which covered 7 CpGs and 11 CpGs forFHIT and WWOX, respectively. The DNA of scrambled- or miR-29b-transfected A549/H1299 was extracted 48 h after the transfec-tion and 1 �g of DNA was bisulfite treated, in vitro transcribed,cleaved by Rnase A, and subjected to MALDI-TOF MS analysis todetermine methylation patterns, as described previously (34). Thefollowing primers were used to amplify the regulatory regions of theFHIT and WWOX genes: FHIT forward, 5�-GGGGAGGTA-AGTTTAAGTGGAATATTGTT-3�; FHIT reverse, 5�-CAC-CCCCAAAACCAAAAACTATAAC-3�; WWOX forward, 5�-TTGAAAGAAAGTTTTTTAAAATTAGGAAAT-3�; WWOXreverse, 5�-TCAAAAAAACAAAACCTAAAAAAAA-3�.
The heat map in Fig. 5d was created by using Heatmap builderversion 1.0 by Stanford University.
Western Blot Analysis for Fhit and Wwox Proteins. Protein extractionand immunoblot analysis were performed as described previ-ously (4). The following primary antisera were used: rabbitpolyclonal anti-Fhit (1:1000; Zymed, San Francisco, CA); mousemonoclonal anti-Wwox (1:500), as described in ref. 4. Quanti-fication of Fhit, Wwox, and Gapdh signals was performed bydensitometry with a Personal Densitometer SI (Molecular Dy-namics, Sunnyvale, CA) and IMAGEQUANT 5.2 software(Image Products International, Chantilly, VA).
Cell Growth Curve. A549 cells (5 � 104) were plated in 6� multiwellplates and transfected, after 24 h, with scrambled oligonucleotidesor miR-29s oligonucleotides from Ambion at a final concentrationof 100 nM, with Lipofectamine 2000 (Invitrogen), according to theprotocol of the manufacturer. Nontransfected (mock) cells wereincluded as a control. Cells were harvested and counted at 24-h
intervals by using a ViCell counter (Beckman Coulter, Fullerton,CA). Each sample was run in triplicate.
Apoptosis and Flow Cytometric Studies. A549 cells (2 � 105) weretransfected with scrambled oligonucleotides or miR-29 oligonucle-otides (Ambion) at a final concentration of 100 nM, with Lipo-fectamine 2000 (Invitrogen), according to the protocol of themanufacturer. After 24 h, cells were resuspended in binding buffercontaining annexin V–FITC and propidium iodide according to theinstructions of the supplier (BD Biosciences, San Diego, CA) andassessed by flow cytometry by using a model EPICS XL cytometer(Beckman Coulter). Each sample was run in triplicate.
In Vivo Studies. Animal studies were performed according toinstitutional guidelines. A549 cells were transfected in vitro with 100nM (final concentration) scrambled oligonucleotides or miR-29a,-29b, or -29c or were mock transfected by using Lipofectamine 2000reagent (Invitrogen), according to the protocol of the manufac-turer. At 48 h after transfection, 3 � 106 viable cells were injecteds.c. into the left flanks of 6-wk-old female nude mice (Charles RiverBreeding Laboratories, Wilmington, MA), five mice per group.Tumor diameters were measured after 7 days from injection andthen every 5 days. At 21 days after injection, mice were killed andtumors were weighted after necropsy. Tumor volumes were deter-mined by using the equation V (in mm3) � A � B2/2, where A isthe largest diameter and B is the perpendicular diameter.
Statistical Analysis. P values were two sided and obtained by usingthe SPSS 10.0 software package (SPSS, Chicago, IL). Overall,survival was calculated from the time of diagnosis until the date oflast follow up. Data were censored for patients who were alive at thetime of last follow up. To perform the survival analysis and generatea Kaplan–Meier plot, Dnmt1, Dnmt3A, and -B levels measured byimmunohistochemical staining were converted to discrete variablesby splitting the samples into two classes [high and low expression,according to the DNMT score �10 (low) or 10 (high)]. Survivalcurves were obtained for each group and compared by using thelog-rank test. To assess correlation between miRNA expression andDNMT expression, we used Pearson correlation and linear regres-sion analysis (SPSS package; SPSS). These functions examine eachpair of measurements (one from the miRNA and the other fromDNMTs) to determine whether the two variables tend to movetogether or in the opposite direction, that is, whether the largervalues from the miRNA (high expression) are associated with thelower values from DNMT expression.
This study was supported by a National Cancer Institute grant (toC.M.C.).
1. Jemal A, Siegel R, Ward E, Murray T, Xu J, Thun MJ (2007) CA Cancer J Clin 57:43–66.2. Ulivi P, Zoli W, Calistri D, Fabbri F, Tesei A, Rosetti M, Mengozzi M, Amadori D (2006)
J Cell Physiol 206:611–615.3. Iliopoulos D, Guler G, Han SY, Johnston D, Druck T, McCorkell KA, Palazzo J, McCue
PA, Baffa R, Huebner K (2005) Oncogene 24:1625–1633.4. Fabbri M, Iliopoulos D, Trapasso F, Aqeilan RI, Cimmino A, Zanesi N, Yendamuri S, Han
SY, Amadori D, Huebner K, et al. (2005) Proc Natl Acad Sci USA 102:15611–15616.5. Suzuki M, Sunaga N, Shames DS, Toyooka S, Gazdar AF, Minna JD (2004) Cancer Res
64:3137–3143.6. Jones PA, Baylin SB (2007) Cell 128:683–692.7. Chuang JC, Jones PA (2007) Pediatr Res 61:24R–29R.8. Jeltsch A (2002) ChemBioChem 3:274–293.9. Okano M, Bell DW, Haber DA, Li E (1999) Cell 99:247–257.
10. Pradhan S, Talbot D, Sha M, Benner J, Hornstra L, Li E, Jaenisch R, Roberts RJ (2003)Nucleic Acids Res 25:4666–4673.
11. Girault I, Tozlu S, Lidereau R, Bieche I (2003) Clin Cancer Res 9:4415–4422.12. Saito Y, Kanai Y, Nakagawa T, Sakamoto M, Saito H, Ishii H, Hirohashi S (2003) Int J
Cancer 105:527–532.13. Patra SK, Patra A, Zhao H, Dahiya R (2002) Mol Carcinog 33:163–171.14. Eads CA, Danenberg KD, Kawakami K, Saltz LB, Danenberg PV, Laird PW (1999) Cancer
Res 59:2302–2306.15. Kim H, Kwon YM, Kim JS, Han J, Shim YM, Park J, Kim DH (2006) Cancer 107:1042–1049.16. Lin RK, Hsu HS, Chang JW, Chen CY, Chen JT, Wang YC (2007) Lung Cancer 55:205–213.17. Shen H, Wang L, Spitz MR, Hong WK, Mao L, Wei Q (2002) Cancer Res 62:4992–4995.18. Belinsky SA, Klinge DM, Stidley CA, Issa JP, Herman JG, March TH (2003) Cancer Res
63:7089–7093.19. Bartel DP (2004) Cell 116:281–297.
20. Calin GA, Croce CM (2006) Nat Rev Cancer 6:857–866.21. Esquela-Kerscher A, Slack FJ (2006) Nat Rev Cancer 6:259–269.22. Garzon R, Fabbri M, Cimmino A, Calin GA, Croce CM (2006) Trends Mol Med 12:580–587.23. Pasquinelli AE, Hunter S, Bracht J (2005) Curr Opin Genet Dev 15:200–205.24. Volinia S, Calin GA, Liu CG, Ambs S, Cimmino A, Petrocca F, Visone R, Iorio M, Roldo
C, Ferracin M, et al. (2006) Proc Natl Acad Sci USA 103:2257–2261.25. Yanaihara N, Caplen N, Bowman E, Seike M, Kumamoto K, Yi M, Stephens RM, Okamoto
A, Yokota J, Tanaka T, et al. (2006) Cancer Cell 9:189–198.26. Lall S, Grun D, Krek A, Chen K, Wang YL, Dewey CN, Sood P, Colombo T, Bray N,
Macmenamin P, et al. (2006) Curr Biol 16:460–471.27. Lewis BP, Shih IH, Jones-Rhoades MW, Bartel DP, Burge CB (2003) Cell 115:787–798.28. John B, Enright AJ, Aravin A, Tuschl T, Sander C, Marks DS (2004) PLoS Biol 2:e363.29. Megraw M, Sethupathy P, Corda B, Hatzigeorgiou AG (2006) Nucleic Acids Res 35:D149–
D155.30. Krek A, Grun D, Poy MN, Wolf R, Rosenberg L, Epstein EJ, MacMenamin P, da Piedade
I, Gunsalus KC, Stoffel M, et al. (2005) Nat Genet 37:495–500.31. Vatolin S, Navaratne K, Weil RJ (2006) J Mol Biol 358:983–996.32. Chen C, Ridzon DA, Broomer AJ, Zhou Z, Lee DH, Nguyen JT, Barbisin M, Xu NL,
Mahuvakar VR, Andersen MR, et al. (2005) Nucleic Acids Res 33:e179.33. Liu Z, Liu S, Xie Z, Blum W, Perrotti D, Paschka P, Klisovic R, Byrd J, Chan KK, Marcucci
G (2007) Nucleic Acids Res 35:e31.34. Ehrich M, Nelson MR, Stanssens P, Zabeau M, Liloglou T, Xinarianos G, Cantor CR, Field
JK, van den Boom D (2005) Proc Natl Acad Sci USA 102:15785–15790.35. Pekarsky Y, Santanam U, Cimmino A, Palamarchuk A, Efanov A, Maximov V, Volinia S,
Alder H, Liu CG, Rassenti L, et al. (2006) Cancer Res 66:11590–11593.36. Mott JL, Kobayashi S, Bronk SF, Gores GJ (April 2, 2007) Oncogene, 10.1038/
sj.onc.1210436.
15810 � www.pnas.org�cgi�doi�10.1073�pnas.0707628104 Fabbri et al.
Related Documents