Microclimate patterns in an agroforestry intercropped vineyard : first results Grimaldi Juliette 1 , Fieuzal R 1 , Pelletier C 1 , Bustillo V 1 , Houet T 2 , Sheeren D 3 (1) UMR CESBIO, University Paul Sabatier, Toulouse, France (2) UMR GEODE, University Jean Jaures, Toulouse, France (3) UMR DYNAFOR, INP-ENSAT, Toulouse, France

Welcome message from author
This document is posted to help you gain knowledge. Please leave a comment to let me know what you think about it! Share it to your friends and learn new things together.
Transcript
Microclimate patterns in an agroforestry intercropped vineyard :
first results
Grimaldi Juliette1, Fieuzal R1, Pelletier C1, Bustillo V1, Houet T2, Sheeren D3
(1) UMR CESBIO, University Paul Sabatier, Toulouse, France (2) UMR GEODE, University Jean Jaures, Toulouse, France
(3) UMR DYNAFOR, INP-ENSAT, Toulouse, France
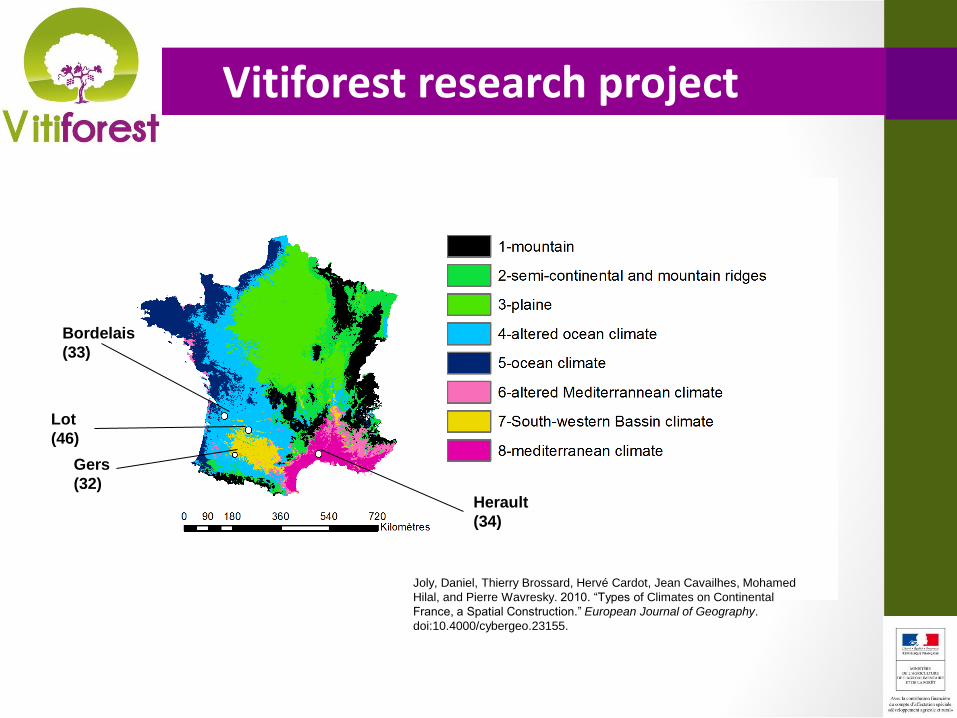
Vitiforest research project
Herault
(34)
Bordelais
(33)
Gers
(32)
Lot
(46)
Joly, Daniel, Thierry Brossard, Hervé Cardot, Jean Cavailhes, Mohamed
Hilal, and Pierre Wavresky. 2010. “Types of Climates on Continental
France, a Spatial Construction.” European Journal of Geography.
doi:10.4000/cybergeo.23155.
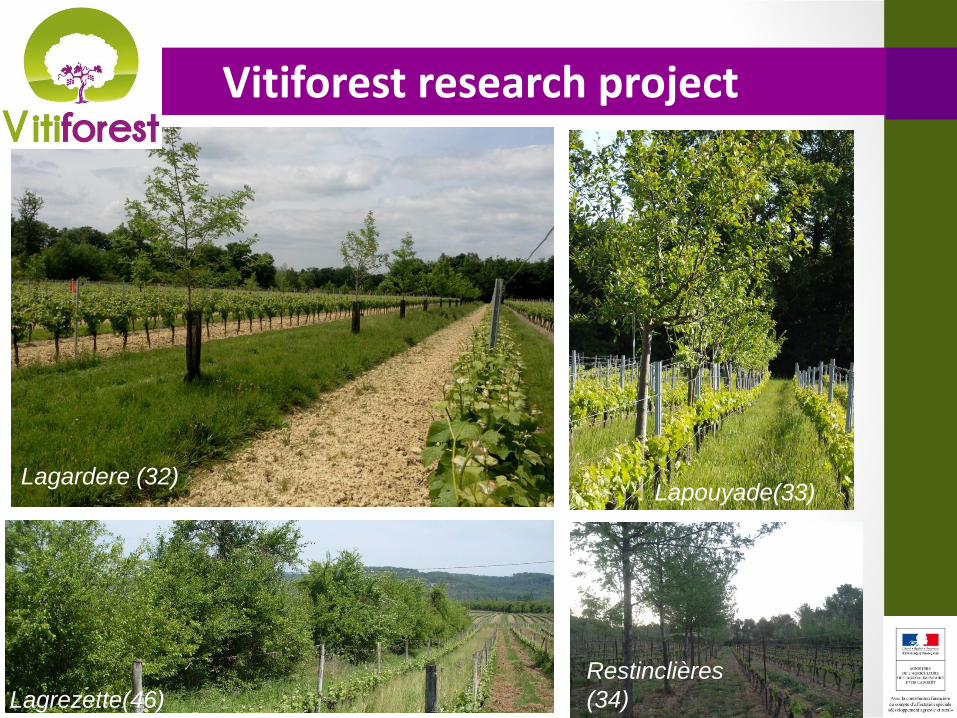
Vitiforest research project
Lagardere (32) Lapouyade(33)
Lagrezette(46)
Restinclières
(34)

Restinclières
(34)
Vitiforest research project
Lagardere (32) Lapouyade(33)
Lagrezette(64)
Yield and grape quality
IFV
Biodiversity Bordeaux
Science Agro
Soil microbiology
INRA Dijon
Coordinator
Arbre et Paysage 32
Economy Bordeaux
Science Agro
Microclimate CESBIO
Do trees benefit to the wine
production and to the cultivated
ecosystem ?
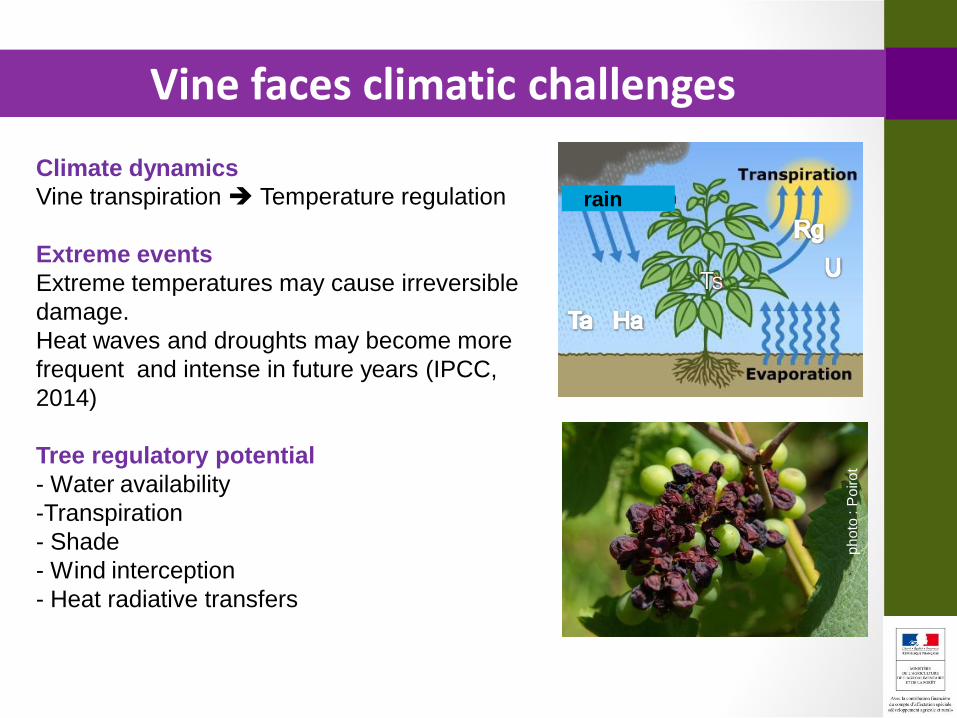
Vine faces climatic challenges
ph
oto
: P
oiro
t
Climate dynamics
Vine transpiration Temperature regulation
Extreme events
Extreme temperatures may cause irreversible
damage.
Heat waves and droughts may become more
frequent and intense in future years (IPCC,
2014)
Tree regulatory potential
- Water availability
-Transpiration
- Shade
- Wind interception
- Heat radiative transfers
rain

Main questions
Phenological stages Heat stress
Pest and diseases
What is the impact of intercropped trees on temperature dynamics and extreme values ?
What is the spatial extent of their effects ?
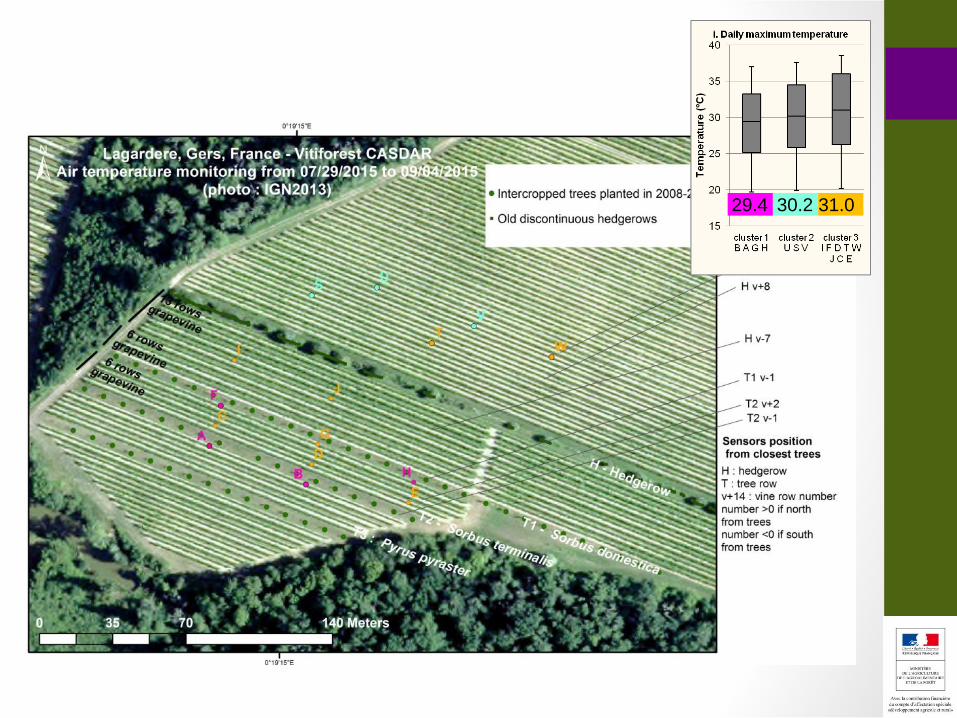
Plot 1 domain – 15 sites
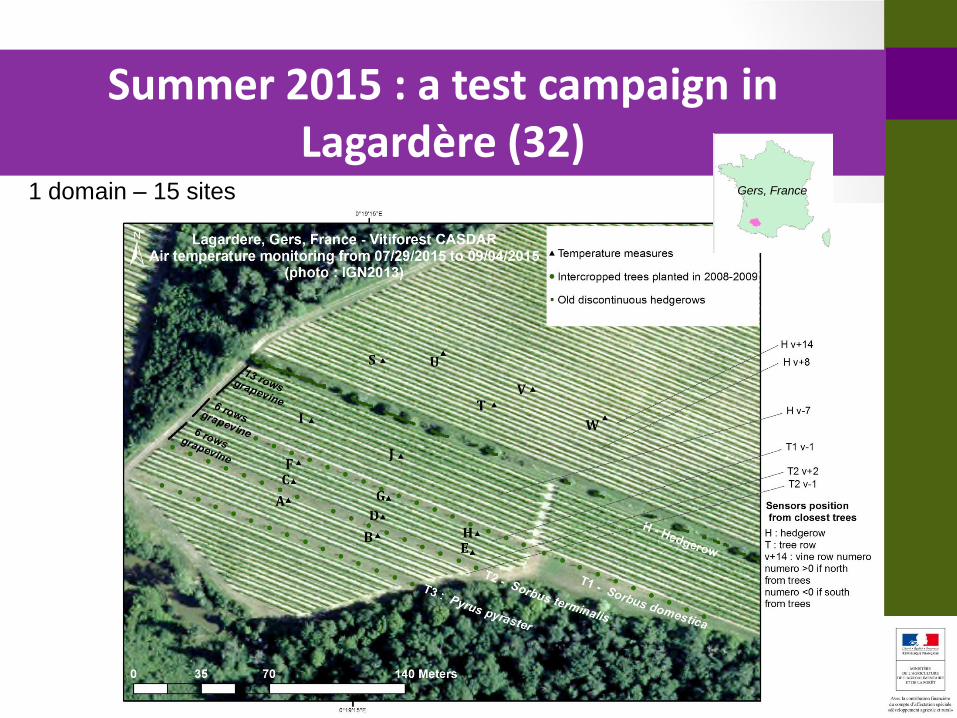
Summer 2015 : a test campaign in Lagardère (32)
Gers, France
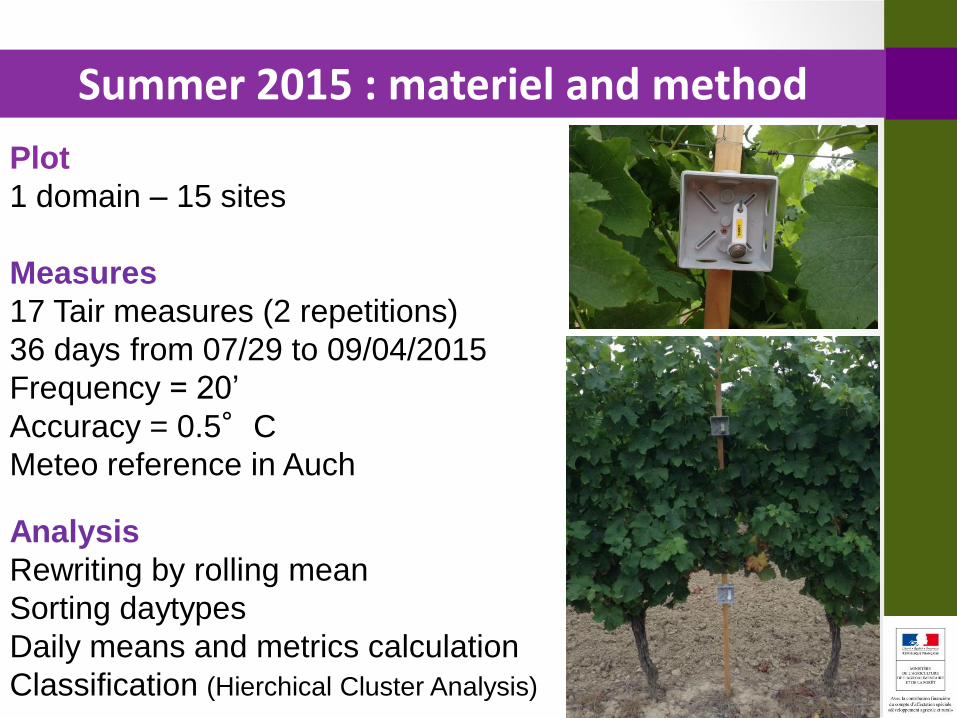
Plot
1 domain – 15 sites
Measures
17 Tair measures (2 repetitions)
36 days from 07/29 to 09/04/2015
Frequency = 20’
Accuracy = 0.5°C
Meteo reference in Auch
Analysis
Rewriting by rolling mean
Sorting daytypes
Daily means and metrics calculation
Classification (Hierchical Cluster Analysis)
Summer 2015 : materiel and method

.
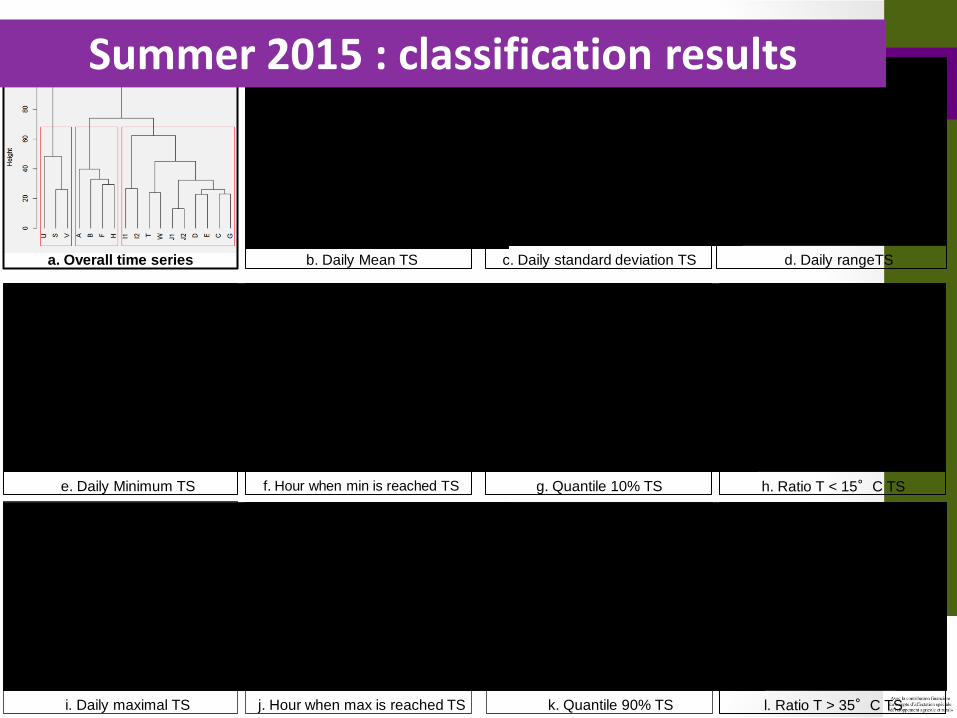
a. Overall time series
i. Daily maximal TS j. Hour when max is reached TS
b. Daily Mean TS c. Daily standard deviation TS d. Daily rangeTS
e. Daily Minimum TS f. Hour when min is reached TS g. Quantile 10% TS h. Ratio T < 15°C TS
k. Quantile 90% TS l. Ratio T > 35°C TS
Summer 2015 : classification results
Are the
temperature
dynamics similar
between sites ?
.
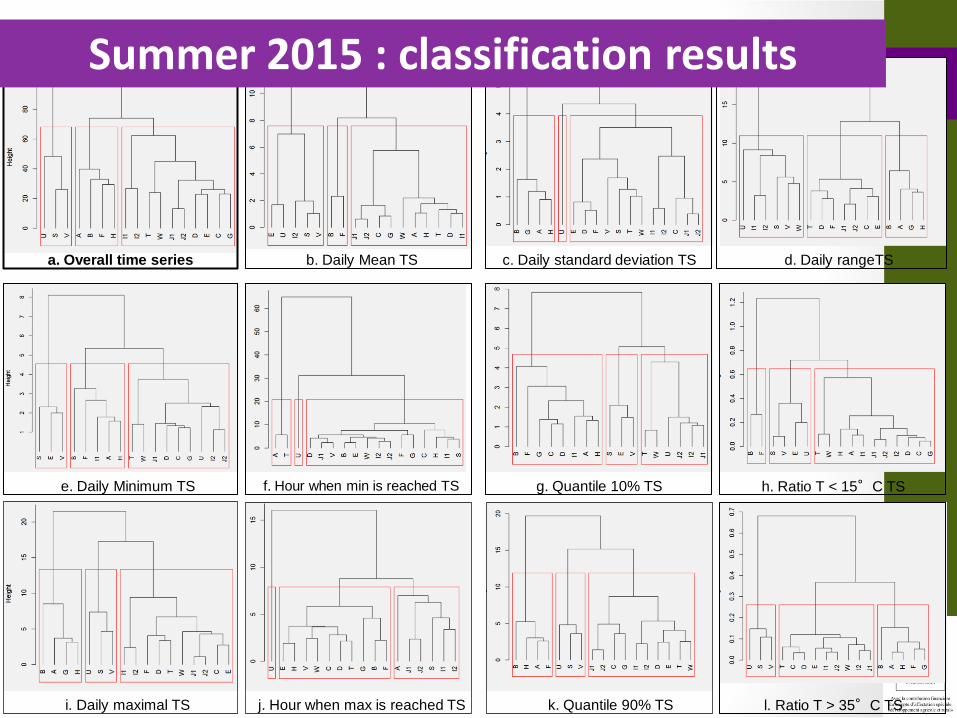
a. Overall time series
i. Daily maximal TS j. Hour when max is reached TS
b. Daily Mean TS c. Daily standard deviation TS d. Daily rangeTS
e. Daily Minimum TS f. Hour when min is reached TS g. Quantile 10% TS h. Ratio T < 15°C TS
k. Quantile 90% TS l. Ratio T > 35°C TS
Summer 2015 : classification results

Plot 1 domain – 15 sites
Summer 2015 : a test campaign in Lagardère (32)
Gers, France

.
a. Overall time series
i. Daily maximal TS j. Hour when max is reached TS
b. Daily Mean TS c. Daily standard deviation TS d. Daily rangeTS
e. Daily Minimum TS f. Hour when min is reached TS g. Quantile 10% TS h. Ratio T < 15°C TS
k. Quantile 90% TS l. Ratio T > 35°C TS
Summer 2015 : classification results
What are the main climatic parameters responsible for
these clusters ?
.
a. Overall time series
i. Daily maximal TS j. Hour when max is reached TS
b. Daily Mean TS c. Daily standard deviation TS d. Daily rangeTS
e. Daily Minimum TS f. Hour when min is reached TS g. Quantile 10% TS h. Ratio T < 15°C TS
k. Quantile 90% TS l. Ratio T > 35°C TS
Summer 2015 : classification results

Summer 2015 : climatic patterns
Overall time series
Daily mean,
minimum and
maximum
29.4 30.2 31.0
14.7 15.0 15.4 20.9 20.5 21.3
20.5 20.9 21.2
29.4 30.2 31.0
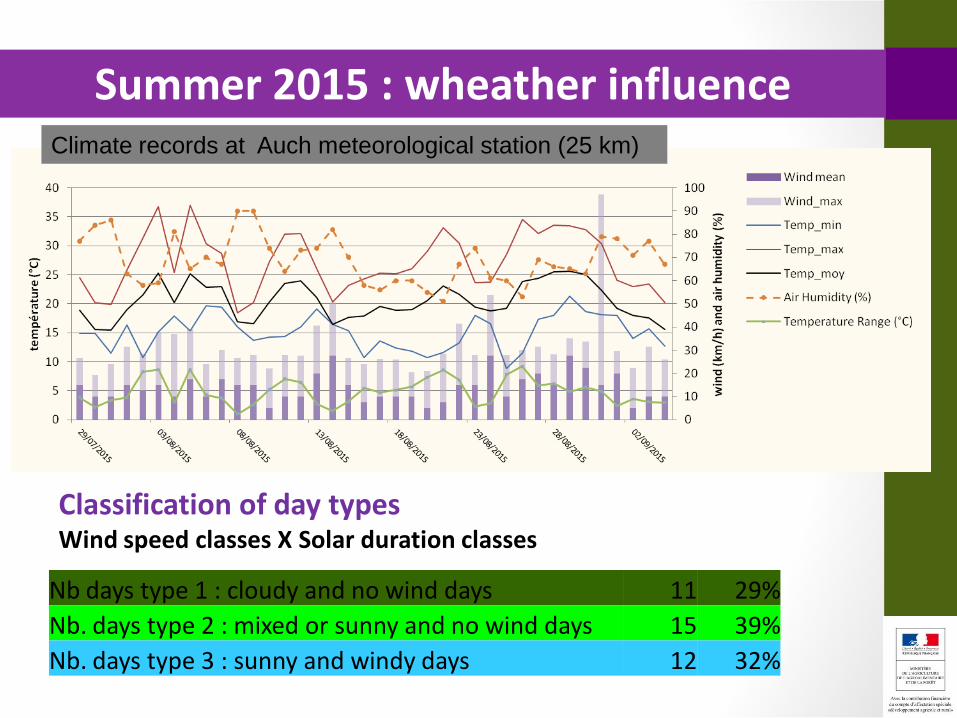
Summer 2015 : wheather influence
Classification of day types Wind speed classes X Solar duration classes
Climate records at Auch meteorological station (25 km)
Nb days type 1 : cloudy and no wind days 11 29%
Nb. days type 2 : mixed or sunny and no wind days 15 39%
Nb. days type 3 : sunny and windy days 12 32%
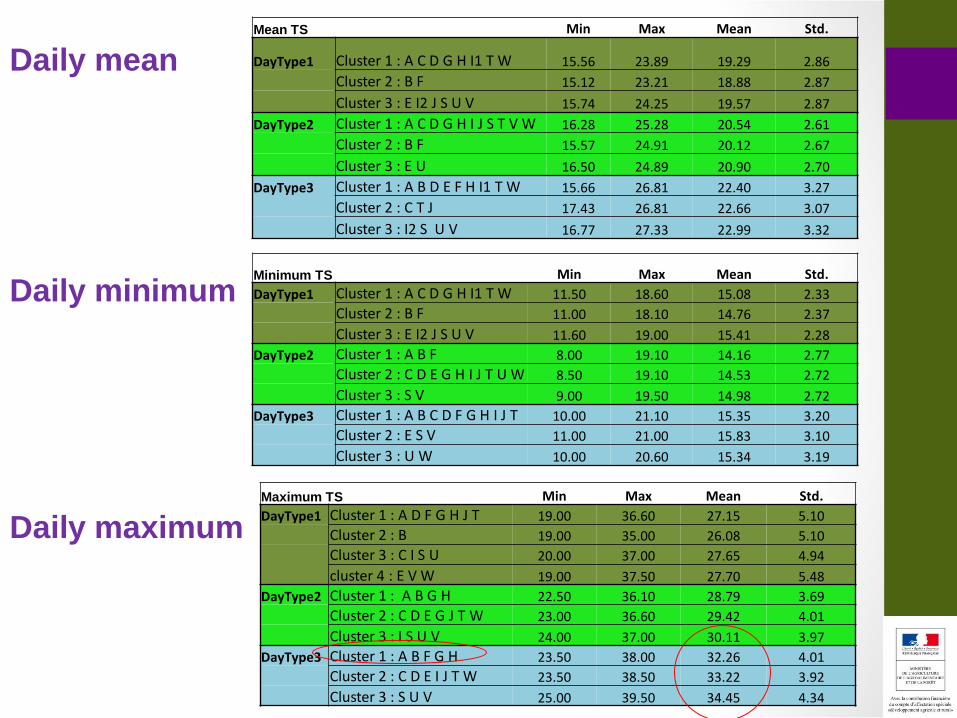
Mean TS Min Max Mean Std.
DayType1 Cluster 1 : A C D G H I1 T W 15.56 23.89 19.29 2.86
Cluster 2 : B F 15.12 23.21 18.88 2.87
Cluster 3 : E I2 J S U V 15.74 24.25 19.57 2.87
DayType2 Cluster 1 : A C D G H I J S T V W 16.28 25.28 20.54 2.61
Cluster 2 : B F 15.57 24.91 20.12 2.67
Cluster 3 : E U 16.50 24.89 20.90 2.70
DayType3 Cluster 1 : A B D E F H I1 T W 15.66 26.81 22.40 3.27
Cluster 2 : C T J 17.43 26.81 22.66 3.07
Cluster 3 : I2 S U V 16.77 27.33 22.99 3.32
Daily mean
Minimum TS Min Max Mean Std.
DayType1 Cluster 1 : A C D G H I1 T W 11.50 18.60 15.08 2.33
Cluster 2 : B F 11.00 18.10 14.76 2.37
Cluster 3 : E I2 J S U V 11.60 19.00 15.41 2.28
DayType2 Cluster 1 : A B F 8.00 19.10 14.16 2.77
Cluster 2 : C D E G H I J T U W 8.50 19.10 14.53 2.72
Cluster 3 : S V 9.00 19.50 14.98 2.72
DayType3 Cluster 1 : A B C D F G H I J T 10.00 21.10 15.35 3.20
Cluster 2 : E S V 11.00 21.00 15.83 3.10
Cluster 3 : U W 10.00 20.60 15.34 3.19
Daily minimum
Daily maximum Maximum TS Min Max Mean Std.
DayType1 Cluster 1 : A D F G H J T 19.00 36.60 27.15 5.10
Cluster 2 : B 19.00 35.00 26.08 5.10
Cluster 3 : C I S U 20.00 37.00 27.65 4.94
cluster 4 : E V W 19.00 37.50 27.70 5.48
DayType2 Cluster 1 : A B G H 22.50 36.10 28.79 3.69
Cluster 2 : C D E G J T W 23.00 36.60 29.42 4.01
Cluster 3 : I S U V 24.00 37.00 30.11 3.97
DayType3 Cluster 1 : A B F G H 23.50 38.00 32.26 4.01
Cluster 2 : C D E I J T W 23.50 38.50 33.22 3.92
Cluster 3 : S U V 25.00 39.50 34.45 4.34
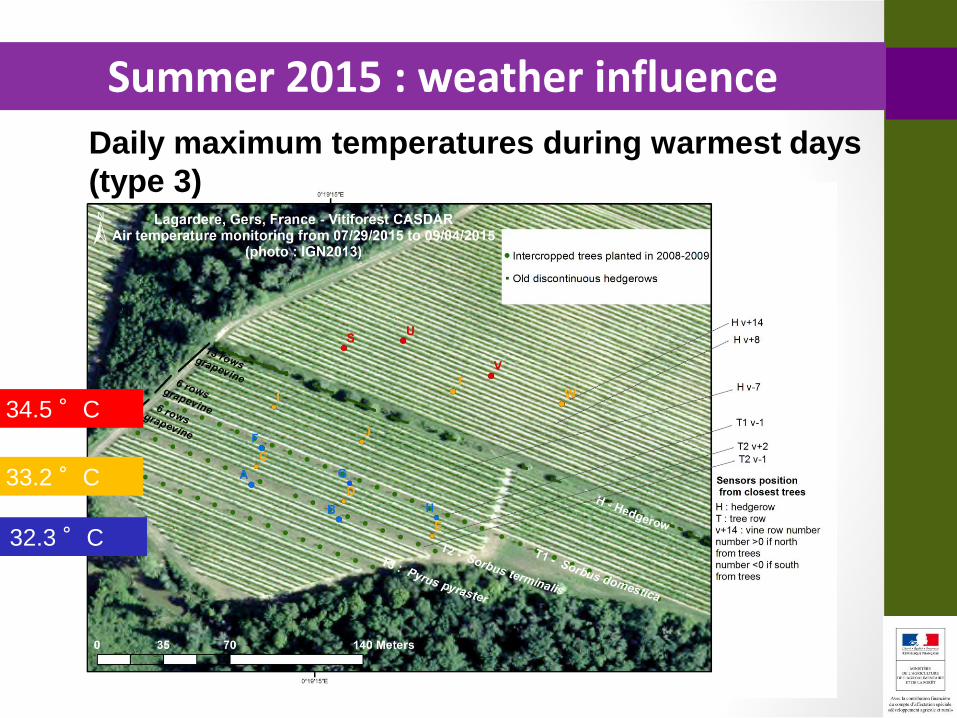
Summer 2015 : weather influence
Daily maximum temperatures during warmest days
(type 3)
32.3 °C
33.2 °C
34.5 °C

Conclusion on 2015 results
Maxima temperatures may be mitigated by tree rows
right next to vine rows
High variability of measurement
Air humidity should be considered in day type
classification
(Chapter 3, Meteorological Data – FAO – online -
http://www.fao.org/docrep/x0490e/x0490e07.htm)
Effect of wind speed on
evapotranspiration in hot-dry
and humid-warm weather
conditions
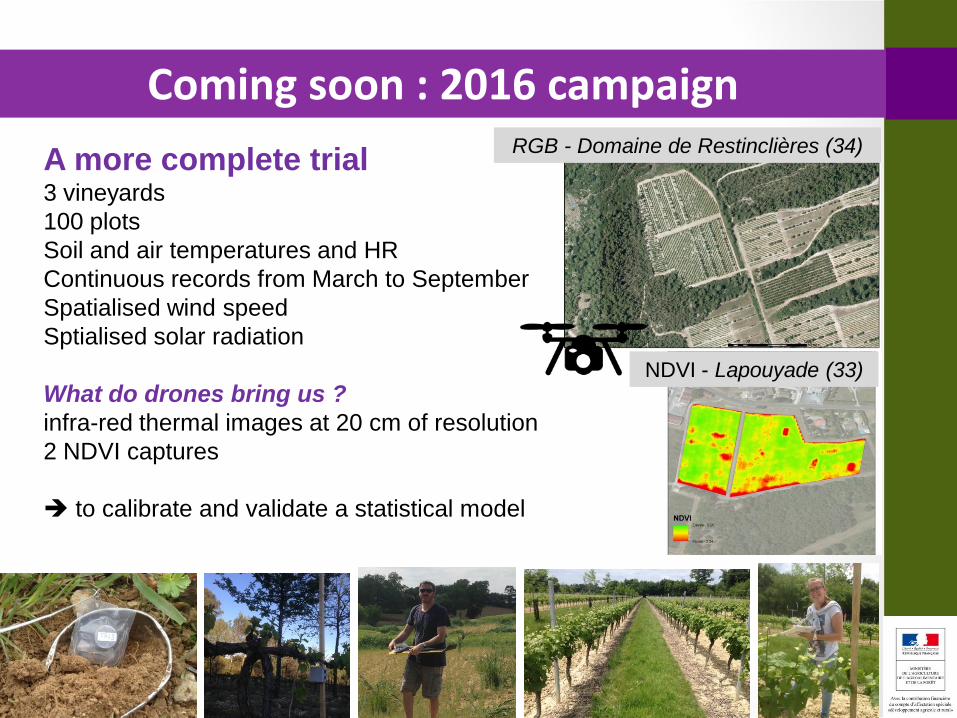
Coming soon : 2016 campaign
A more complete trial 3 vineyards
100 plots
Soil and air temperatures and HR
Continuous records from March to September
Spatialised wind speed
Sptialised solar radiation
What do drones bring us ?
infra-red thermal images at 20 cm of resolution
2 NDVI captures
to calibrate and validate a statistical model
NDVI - Lapouyade (33)
RGB - Domaine de Restinclières (34)

Thank you for your attention !
Related Documents