EVALUATION OF LEGUME COVER CROPS INTERCROPPED WITH COFFEE STEPHEN MUIA KISEVE B.Sc. Agriculture (Hons), University of Nairobi A THESIS SUBMITTED IN PARTIAL FULFILLMENT OF THE REQUIREMENT FOR THE AWARD OF MASTERS OF SCIENCE DEGREE IN AGRICULTURAL RESOURCES MANAGEMENT DEPARTMENT OF PLANT SCIENCE AND CROP PROTECTION FACULTY OF AGRICULTURE UNIVERSITY OF NAIROBI 2012

Welcome message from author
This document is posted to help you gain knowledge. Please leave a comment to let me know what you think about it! Share it to your friends and learn new things together.
Transcript
EVALUATION OF LEGUME COVER CROPS INTERCROPPED
WITH COFFEE
STEPHEN MUIA KISEVE
B.Sc. Agriculture (Hons), University of Nairobi
A THESIS SUBMITTED IN PARTIAL FULFILLMENT OF THE
REQUIREMENT FOR THE AWARD OF
MASTERS OF SCIENCE DEGREE IN AGRICULTURAL RESOURCES
MANAGEMENT
DEPARTMENT OF PLANT SCIENCE AND CROP PROTECTION
FACULTY OF AGRICULTURE
UNIVERSITY OF NAIROBI
2012

ii
DECLARATION
I declare that this is my original work and has not been presented for an award of a
degree in any other University
Stephen M. Kiseve___________________________ Date _____________________
This thesis is submitted for examination with our approval as the University
supervisors:
1. Prof. Mary W. K. Mburu
Department of Plant Science and Crop Protection
University of Nairobi
Signature ____________________________ Date ______________________
2. Prof. Charles K. K. Gachene
Department of Land Resource Management and Agricultural Technology
University of Nairobi
Signature ____________________________Date ______________________
3. Dr. Jedidah M. Maina
Kenya Agricultural Research Institute
Signature _________________________Date _________________________

iii
DEDICATION
To The Lord God from whom all blessings come and for His grace by which I got the
opportunity, resources and ability to study
To my dear parents Samson Kyumbi Kiseve and Bretta Munee who form the bed rock
of my academic excellence through their motivation and good will

iv
ACKNOWLEDGEMENT
I thank my supervisors Prof. M.W.K. Mburu (Department of Dryland Agriculture,
South Eastern University College, constituent college of the University of Nairobi),
Prof. C.K.K. Gachene (Department of Land Resource Management and Agricultural
Technology, University of Nairobi) and Dr J.M. Maina of Kenya Agricultural
Research Institute for the devotion, guidance and skillful advice during this study.
I am very grateful to the University of Nairobi technical staff who assisted me in field
and laboratory work. I am indebted to the Public Service Commission of Kenya and
Ministry of Agriculture for graciously according me study leave to pursue this
programme. I am indebted to my collegues of the pioneering M.Sc. Agricultural
Resource Management class who made my stay in Kabete memorable through
academic discussions and shared fun. I acknowledge the District Agricultural Officer
Siakago, Mr P. Nyaga and Gatundu District Agricultural Officer Mr A. Nyaga and
Faith Kariuki for the assistance they accorded to me at my working stations.
Last but not least, I acknowledge my brothers Nahason Nyamasyo and Sam Kimanthi,
sisters in Christ Dr. Martha Mueni Sila and Regina Mumbua Tende for their prayers
and warm support during my study. God bless all who in one way or another
contributed to my success.

v
TABLE OF CONTENTS
Declaration ……………………………………………………………………… ii
Dedication ……………………………………………………………………… iii
Acknowledgement ……………………………………………………………… iv
Table of contents …………….………………………………………………… v
List of figures ………………………………………………………………… ix
List of tables ………………………………………………………………….. x
List of plates…………………………………………………………………… xii
List of appendices ………………………………...…………………..……..… xiii
Acronyms……………………………………………………………………… xvi
Abstract …………..………………………………………………….……… xvii
Chapter 1: Introduction …………………………………………….……….. 1
1.1 History and global importance of coffee ………………………… 1
1.2 Importance of coffee in Kenya.……………………………..…… 2
1.3 Coffee production systems in Kenya……………………..……… 3
1.4 Use of legume cover crops as coffee intercrops…………………. 7
1.4.1 Potential advantages of using LCCs as coffee intercrops… 7
1.4.2 Potential disadvantages of using LCCs as coffee intercrops 9
1.5 Problem statement and justification…………………………… 11
1.6 Objectives………………………………………….…………… 13
1.6.1 Broad objective………………………………………………. 13
1.6.2 Specific objectives…………………………………………… 13
1.7 Hypothesis……………………………………………………… 13
Chapter 2: Literature review ……………………………………….………. 14
2.1 Environmental requirements of coffee………………….…….. 14

vi
2.1.1 Climatic and soil requirements……. ……………….……… 14
2.1.2 Coffee growth habits and agronomic requirements……….. 14
2.1.3 Weeds, diseases and insect pest management..…………… 15
2.1.4 Fertilizer requirement…………… ……………..………….. 16
2.2 Legume cover crops ……...………………...……......................... 18
2.2.1 Legume cover crop establishment …….…………………… 18
2.2.2 Legume cover crop phonological development…………… 19
2.2.3 Legume biomass production………………………………. 21
2.2.4 Legume seed yield…………………………………………. 23
2.3 Coffee intercrop systems………………………………………… 24
2.3.1 Principles of intercropping………………………………… 24
2.3.2 Intercropping coffee with annual crops……….……….... 26
2.3.3 Intercropping coffee with perennial crops……………….... 28
2.3.4. Best –bet legume cover crops options……………..….… 30
2.4 Resource use in intercrops………………………….……..…….. 31
2.4.1 Competition and complementarity in cropping systems.… 31
2.4.2 Above ground resource use…………………………….… 32
2.4.3 Below ground resource use……………………..………… 34
2.5 Weeds…………………………………………………………… 36
2.5.1 Introduction……………………………………….……… 36
2.5.2 Weed control methods………………………….………… 38
2.5.3 Suppression of weeds by legume cover crops…………… 41
2.6 Research gaps………………………………………….………… 43
44

vii
Chapter 3: Materials and methods……………………………………………
3.1 Experimental site……………………………………….…..…… 44
3.2 Experimental design……………………………………..….…… 44
3.3 Data collection and analysis…………………………….…….… 47
3.3.1 Legume growth, phenological development and biomass
production ……………………………………………………. 47
3.3.2 Interception of photosyntetically active radiation (PAR)… 47
3.3.3 Soil moisture………………………………..………..…… 48
3.3.4 Weed count and biomass accumulation…………………… 49
Chapter 4: Results and discussion……………………………………..……… 50
4.1 Experimental site characteristics…………………………..……… 50
4.1.1Rainfall and temperature…………………………………… 50
4.1.2 Soil moisture content………………………………………. 51
4.2 Physiological basis of legume phonological characteristics…….. 54
4.2.1 Legume establishment………………..………………….... 54
4.2.2 Legume phenological duration……………………………… 55
4.2.3 Legume growth……………………………………………. 59
4.3 Physiological basis for legume biomass accumulation…………. 61
4.3.1 Canopy PAR interception overtime…………………..…... 61
4.3.2 Legume dry matter accumulation overtime..……………. 67
4.3.2 Seasonal litter fall……………………………..…………….. 69
4.3.3 Legume seasonal litter and total dry matter (TDM)
accumulation……………………………………………………… 70
4.3.3 Correlation between cumulative PAR intercepted and TDM
accumulation…………………………………………………….. 73

viii
4.5.4 Seed yield and harvest index………………………..…… 77
4.6 Impact of legume canopy on weed density and biomass……..…. 83
4.6.1 Weed density and growth habits………………………….. 83
4.6.2 Legume growth habits and weed density…………………… 91
4.6.3 Cropping system and weeds density……………………… 92
4.6.4 Collective weed density and biomass accumulation……….. 95
Chapter 5: Conclusions and recommendations..…………..………………… 99
5.1 Conclusions 99
5.2 Recommendations 102
References ……………………………………………………………………. 103
Appendices ……………………………………………………………………. 121

ix
LIST OF FIGURES
Page
Figure 1. Field layout of coffee – legume intercrop. 46
Figure 2. A( Average weekly mean maximum and mean minimum temperature (o
C) distribution and total weekly rainfall (mm) at Kabete Field
Station farm………………………………………………………
50
Figure 3. Soil water content in coffee plots undersown with legumes and sole
cropped legumes at 11 and 30 weeks after planting……………..
53
Figure 4. Canopy height of determinate legumes………………………… 59
Figure5 a. Canopy photosynthetically active radiation (PAR) interception by
sole and intercropped annual food and non food legumes ………
63
Figure 5 b Canopy photosynthetically active radiation (PAR) interception by
sole and intercropped perennial legumes……………….. ……….
64
Figure 6 Biomass accumulation (kg/ha) of sole and intercropped food,
perennial and climbing legumes…………………………………..
67
Figure 7. Correlation between dry matter and intercepted PAR of sole and
intercrop annual food legumes ……………………………………
74
Figure 8.
.
Correlation between dry matter and intercepted PAR of sole and
intercrop non food annual legumes……..…………………………
75
Figure 9. Correlation between dry matter and intercepted PAR of sole and
intercropped perennial and climbing legumes……………………….
76

x
LIST OF TABLES
Page
Table 1. Coffee production between 1963 and 2010……………………. 2
Table 2. “Best bet” legume cover crops suitable for coffee intercrop
systems………………………………………………………….
31
Table 3. Names and spacing of legume cover crops evaluated…………. 45
Table 4. Early seedling vigor and duration of phenological stages of
legumes………………………………………………………….
56
Table 5. Relationship between food legume phenological stages and
accumulated thermal time o C days since zero days after
planting to physiological maturity………………………………
58
Table 6. Seasonal litter fall, total dry matter (TDM), relative TDM yield
and % TDM reduction for food legumes………………
71
Table 7. Seasonal litter fall, total dry matter (TDM), relative TDM yield
and % TDM reduction for non food legumes………………
72
Table 8. Yield components of sole and intercropped food legumes…… 80
Table 9 Seed yield, harvest index (HI) and radiation use efficiency
(RUE) of intercepted of sole and intercropped food
legumes…………………………………………………………
81
Table 10 TDM partitioning to seed yield……..………………………….. 82
Table 11 Weed species found in both sole and intercrop system……… 84
Table 12. Density of five most common weeds in food legumes plots at
7 WAP………………………………………………………
87
Table 13. Density of five most common weeds in food legumes plots at
24 WAP……………………………………………………..
88

xi
Table 14. Density of five most common weeds in non food legumes plots
at 7 WAP……………………………………………….……
89
Table 15. Density of five most common weeds in non food legumes plots
at 24 WAP……………………………………………………..
90
Table 16 % PAR at peak legume interception in coffee-legume intercrop. 93
Table 17 Soil water content at 25 cm depth at 11 and 30 WAP………….. 95
Table 18 Weed density and biomass accumulated at 7 weeks after
planting in food legume plots…………………………………...
97
Table 19. Weed density and biomass accumulated at 7 and 24 weeks after
planting in sole and intercropped coffee legume systems………
98

xii
LIST OF PLATES
Page
Plate 1 Intercropped legumes with over 90 % canopy cover at
14WAP: Dolichos (an annual food legume), Desmodium
(perennial non food legume), Mucuna (creeping annual
legume) and Crotalaria (erect annual legume)……………….
60

xiii
LIST OF APPENDICES
Page
Appendix 1 Analysis of variance table showing MSS of Legume emergence
vigor (EV), time to emergence (TE), anthesis (TA), 50 % flowering
(TF), 50 % podding (TP) and physiological maturity (PM) in sole
and intercrop systems………………………………. 123
Appendix 2 Analysis of variance table showing MSS of canopy height (cm) for
mwitemania bean, soya bean 4 and soya bean 17 overtime in sole
and intercrop systems…………………………………………….. 124
Appendix 3 Analysis of variance table showing MSS of % PAR interception for
annual food legumes (butter bean, mwitemania bean, soya bean 4,
soya bean 17 and dolichos) overtime in sole and intercrop
systems…………………………………………………………… 125
Appendix 4 Analysis of variance table showing MSS of % PAR interception for
non food annual legumes (canavalia, crotalaria, Vicia benghalensis,
mucuna (grey) and mucuna (mottled) overtime in sole and intercrop
systems…………………………………………………………….... 126
Appendix 5 Analysis of variance table showing MSS of % PAR interception for
perennial legumes (silver leaf desmodium, green leaf desmodium
and neontonia) overtime in sole and intercrop systems 127
Appendix 6 Analysis of variance table showing MSS of % PAR interception for
all (13) legumes overtime in sole and intercrop systems........... 128
Appendix 7 Analysis of variance table showing MSS of final biomass (FB),
seasonal litter fall (SLF) and total dry matter (TDM) for food
legumes (mwitemania bean, soya bean 4, soya bean 17 and
dolichos) in sole and intercrop systems…………………….129

xiv
Appendix 8 Analysis of variance table showing MSS of final biomass (FB),
seasonal litter fall (SLF) and total dry matter (TDM) for non food
legumes {(mucuna (mottled), mucuna (grey), neontinia, canavalia,
silver leaf desmodium, vicia benghalensis, green leaf desmodium
and crotalaria} in sole and intercrop systems……………………… 130
Appendix 9 Analysis of variance table showing MSS of final biomass (FB),
seasonal litter fall (SLF) and total dry matter (TDM) for all (13)
legumes in sole and intercrop systems……………………………… 131
Appendix 10 Analysis of variance table showing MSS of total dry matter (TDM),
seed yield (SY) and harvest index (HI) for all 13 legumes in sole and
intercrop systems………………………………………………. 132
Appendix 11 Analysis of variance table showing MSS of seed yield (SY) (kg/ha),
Harvest Index (HI), 100 seeds mass (SM) (g), number of seeds per
pod (SP), number of pods per plant (PP) for soya bean 4, soya bean
17 dolichos, butter bean and mwitemania beans in sole and
intercrop systems………………………………………………… 133
Appendix 12 Analysis of variance table showing MSS of weed occurrence
(numbers per m2
) of the five (5) most common weed species Oxalis
latifolia (OL), macdonald‟s eye (ME), black jack (BJ), nut grass
(NG) and love grass (LG) under the best six legumes (crotalaria,
mucuna, neontonia, silver leaf desmodium, Vicia benghalensis and
soyabean) in weed suppression in sole and intercropped systems at
7 and 24 WAP…………………………………………………
134
xv
Appendix 13
Analysis of variance table showing MSS of weed occurrence WO
(numbers per m2), weed biomass WB (kg/ha), for food legumes
(mwitemania bean, soya bean 4, soya bean 17 and dolichos) at 7
WAP in sole and intercrop
systems……………………………………………………………..
135
Appendix 14 Analysis of variance table showing MSS of weed occurrence (WO)
(numbers per m2
), weed biomass (WB) (kg/ha), for non food
legumes {(mucuna (mottled), mucuna (grey), neontinia, canavalia,
silver leaf desmodium, vicia benghalensis, green leaf desmodium
and crotalaria} at 7 and 24 WAP in sole and intercrop
systems…………………………………………………………….. 136
Appendix 15 Analysis of variance table showing MSS of weed occurrence (WO)
(numbers per m2
), weed biomass (WB) (kg/ha), for both all 13
legumes in sole and intercrop systems…………………………. 137
Appendix 16 Analysis of variance table showing MSS of soil water content (%)
with soil depth under mucuna, silver leaf desmodium neontonia, and
crotalaria in sole and intercropped systems at 11 and 30 WAP 138

xvi
ACRONYMS
BNF Biological Nitrogen Fixation
DAP Days After Planting
DM Dry Matter
GMLCC Green Manure Legume Cover Crop
HI Harvest Index
LCC Legume Cover Crop
LRNP Legume Research Network Project
LSD Least Significant Difference
PAR Photosynthetically Active Radiation
RUE Radiation Use Efficiency
SMC Soil Moisture Content
TDM Total Dry Matter
WAP Weeks After Planting

xvii
Abstract
A field experiment was conducted at the central highlands of Kenya at Kabete,
University of Nairobi, during the March/ April 2005 long rains season. The objective
of this study was to investigate the growth of 13 legume cover crops under coffee and
their impacts on weeds. Yield of grain legumes and Soil moisture content under
legumes was also assessed.
Average soil moisture content was significantly higher (P< 0.05) by 8 % at 11 WAP
compared to 30 WAP and was also significantly higher by 15 % under mucuna
compared to other legume at upper depths (< 50cm). All legumes had attained over 90
% PAR interception by 12 WAP except Neontonia and canavalia that attained the
same at 16 WAP. Crotalaria accumulated the highest biomass (14,006kg/ha) and
mucuna the lowest (1,004 kg/ha). Intercropped soyabean had the highest grain yield
(894 kg/ha) among the assessed food legumes. Intercropping did not have significant
effects on emergence and shoot vigor of legumes but on average it significantly (P
<0.05) decreased grain yield, biomass accumulation, litter fall by 59 %, 46 %, 42 %
respectively. Total dry matter accumulation and cumulative PAR interception were
positively and highly correlated. Silver leaf desmodium, crotalaria, mucuna were
significantly (P<0.05) more effective in weed suppression compared to other legumes
because they sustained high ground cover (> 90 %) overtime. Over all, the most
outstanding legumes in terms of biomass accumulation, ground cover (PAR
interception), and weed suppression were crotalaria, desmodium, dolichos and
mucuna.
Results of this study indicate that the use of proper choice of legume cover crop
species may provide a cost –effective alternative strategy for soil fertility
improvement, soil moisture conservation and weed management in small holder
coffee farms.
Key words: Coffee, legume cover crops, intercropping, weeds control.

1
CHAPTER 1
INTRODUCTION
1.1 History and global importance of coffee
Coffee is the most widely traded commodity in the world after petroleum with an
annual turnover exceeding US$10 billion and a major contributor of even up to 80
percent of total foreign currency earnings in some African countries (Nair, 2010). In
2000/2001 it commanded a gross value of US$ 65billion (Coffee Board of Kenya,
2003a; International Coffee Organization, 2011) and accounted for exports worth US$
15.4 billion in 2009/10 (International Coffee Organization, 2011). Coffee is produced
in more than sixty tropical countries, providing a livelihood for twenty-five million
farmers around the world (Waller et al., 2007). The two most commercially
important coffee species grown are varieties of Coffea canephora (robusta) and
Coffea arabica (arabica) with Coffee arabica being the most widespread species
accounting for about 80 % of the world‟s coffee production (Coste and Cambrony,
1992; Coffee Research Institute, 2006).
The primary center of origin and genetic diversity of Coffea arabica is Ethiopia,
which is recognized as its oldest exporter in the world (Coste and Cambrony, 1992;
Waller et al., 2007). Coffee spread from Ethiopia and begun to be grown in other
parts of the world such as Asia, Europe and India in early 1600s and later in the
United States of America in 1668 (International Coffee Organization, 2011). It is now
established in the economies and lifestyles of the main producing and trading nations.
Coffee is cultivated for its popular beverage (coffee) obtained from the dried beans
(Wilson, 1999). Currently coffee is cultivated in eighty countries within the tropics of

2
Cancer and Capricorn in South and Central America, the Caribbean, Africa and Asia.
The largest producers of coffee are Brazil, Vietnam, Indonesia, Colombia, India, and
Ethiopia in that order (Food and Agricultural Organization, 2010). Africa‟s
contribution to the world‟s total coffee production was 27 % and 17 % between 1963
to 1980 and 1990 to 2004 respectively and 10.9 % in 2010 (Food and Agricultural
Organization, 2012). The leading producers of coffee in Africa are Ethiopia, Uganda,
Cote d‟ Ivoire, Madagasca, Cameroon, Kenya and Tanzania in that order (Food and
Agricultural Organization, 2012). Kenya contributed 8.3, 8.5 and 4.6 % of Africa‟s
total coffee in 1990, 2000 and 2010 respectively (Table 1).
Table 1 Coffee production between 1963 and 2010
Coffee (green) Production (1000) Mt) 1963 1970 1980 1990 2000 2010
World 4,152 3,850 4,837 6,072 7,550 836
Africa 997 1,295 1,161 1,255 1,185 908
Kenya 41 58 91 104 101 42
Kenya‟s % of Africa 4.1 4.5 7.8 8.3 8.5 4.6
Source: Food and Agricultural Organization, 2012
1.2 Importance of coffee in Kenya
Coffee was introduced as a cash crop in Kenya by the missionaries in 1898 and it has
remained important in Kenya‟s economy to date (Coffee Board of Kenya, 2003b;
Coffee Research Foundation, 2012a). The coffee sub sector is a major contributor to
the Kenyan economy. In the 1980s, 2005 and 2011 coffee contributed about 40, 10
and 8 % of the total domestic foreign exchange earnings respectively. Coffee sales
earned Kenya US $ 20 billion between 1987 and 2002 (Coffee Board of Kenya,

3
2003a) and 5.4 billion export sales in 2008 (Food and Agricultural Organization,
2010). It ranked fourth after tourism, tea and horticulture and contributed about KSh.
16 billion in 2009/10 (Ministry of Agriculture, 2011). Coffee incomes have been
invested in the economy, mainly in the rural areas brining considerable rural
development in terms of improvement of farm income, employment and food
security. Over the years, coffee has contributed towards poverty alleviation especially
among the small holders because it has a medium to high potential for agriculture
growth and medium potential for poverty reduction. Today 250,000 Kenyans are
employed in the coffee sector (Coffee Research Foundation, 2012a).
1.3 Coffee production systems in Kenya
The total area under coffee has steadily grown over the years from 1,215 hectares
owned by 11, 864 licensed growers in 1952 to 170,000 hectares grown by about
700,000 smallholders and 3,217 estates in 2003 (Coffee Board of Kenya, 2001;
Coffee Board of Kenya, 2003a) but has since reduced to 155,000 hectares in 2008
(Food and Agricultural Organization, 2012). The annual coffee production had been
on a downward trend from an all time high of 128,700 mt in 1988 to 42,000 mt in
2010 (Food and Agricultural Organization, 2012). This decline was attributed to an
escalating cost of production (especially fertilizer and other inputs), lack of affordable
credit, adverse weather conditions, declining global coffee prices and poor corporate
governance in coffee institutions (Coffee Board of Kenya, 2005; Ministry of
agriculture, 2010).
Both large-scale commercial estates and small holder farmers currently grow coffee in
Kenya and account for about 33 and 67 % of the total area under coffee and about 53

4
and 47 % of the actual total production respectively (Coffee Board of Kenya, 2003b).
The commercial estates (> 25 hectares) typically maintain a monoculture system with
high standard of management and achieve high yields and reasonable profitability.
For many years many small-scale holders have been intercropping coffee with food
crops to produce food for subsistence and income from the surplus produce (Wilson,
1999). Coffee yields in smallholder farms are very low compared to the estates. In
1993/94 cooperatives and estates registered average yields of 0. 34 tons/ ha and 1.01
tons/ ha that is nearly a 300 fold difference (Ministry of Agriculture and Livestock
Development, 1997). The recent average production further reduced to 0.2 and 0.7
tons /ha of coffee for cooperatives and estates respectively (Coffee Board of Kenya,
2003b) and to 0.25 and 0.5 tons/ ha for cooperatives and estates respectively 2011
(Ministry of Agriculture, 2011).
The leading challenges that have contributed to decline in coffee industry
performance in Kenya include high production, processing and transaction costs, lack
of credit to finance farm activities, low and delayed coffee payments, competition for
land between coffee and other high paying enterprises such as horticulture,
floriculture, food crops and real estate development, restrictive world trade
regulations, unpredictable coffee prices, unfavorable weather conditions, over
dependence on old coffee trees, poor crop and post-harvest handling practices, poor
soil fertility management, pests, diseases and weed infestations (Ministry of
Agriculture and Livestock Development, 1997; Coffee Board of Kenya, 2003a;
Coffee Board of Kenya, 2003b). For example when the International Coffee
Agreement (ICA) collapsed in 1989 it lead to a decline in coffee prices that resulted to

5
a 13 % drop in Kenya‟s production from over 100,000 tons of clean coffee in 1989/90
to 87,000 tones in 1990/91 (Kimemia, 1998).
Kenya‟s coffee is mainly grown in the highland districts of Kenya: Kiambu, Muranga,
Nyeri, Thika, and Kirinyaga in CentralProvince; Meru North, Meru Central, Meru
South, Embu, Machakos and Kitui in Eastern Province; Nakuru, West Pokot, Kajiado,
Baringo, Kericho, Nandi, Laikipia, Transnzoia, UasinGishu, Keiyo, Marakwet and
Kajiado in Rift Valley Province; Bungoma, Kakamega, and Busia in Western
Province; Kisii, Siaya, Kisumu, and South Nyanza in Nyanza Province; and Taita in
Coast Province. The high production zone is a triangle formed by Mt. Kenya, the
Aberdare Range and Machakos Town essentially the Central and Eastern Provinces
which account for about 70 per cent of Kenya‟s coffee production (Coste and
Cambrony, 1992; Coffee Board of Kenya, 2001; Coffee Board of Kenya, 2010;
Mureithi, 2008). Due to population pressure and demand for individual land
ownership there has been an increase in sub-division of agricultural land, further
reducing available coffee growing areas. Low coffee prices have pushed the small
scale farmer from coffee growing to more profitable enterprises such as dairy and tea
farming, which also flourishes very well at the higher altitudes, leaving coffee
unattended. Due to slow payments and low returns coupled with lack of appropriate
management practices, farmers do not have incentive to invest in better farm
management practices in coffee and thus the decline in coffee productivity and
quality.
The most important factors limiting coffee production in Kenya‟s smallholder farms
are declining soil fertility, pest, disease and weed infestations, high costs of inputs

6
(fertilizers, pesticides and labour) (Coffee Research Foundation, 2003) and low coffee
prices (Coffee Board of Kenya, 2003b). Low coffee returns have reduced farmers‟
ability to effectively improve soil fertility through maintenance of soil conservation
structures and application of recommended fertilizers rates and control weeds leading
to further decline in coffee yields. Small scale farmers have now intercropped coffee
with annual food legumes to maximize on land utilization for food production
(Kimemia, 2003). Inappropriate intercrop systems have resulted to further destruction
of soil conservation structures (terrace embankments) and increased soil erosion.
These constraints should be addressed with the aim of guaranteeing greater
production margins especially for small holder farmers who are more vulnerable to
yield losses compared to large scale farmers.
To ensure improved productivity of coffee, the government has put in place strategies
to improve coffee productivity that include creating an enabling legal and economic
environment, improved research, extension and market services and effective land and
water resource management and improved crop husbandry practices (Ministry of
Agriculture, 1997; Ministry of Agriculture and Ministry of Livestock and Fisheries
Development, 2004). High coffee yields can be achieved through high standards of
husbandry including good soil fertility management practices, effective pest, disease
and weed control (Wilson, 1999). Legume cover crops can potentially play an
important role in reducing soil erosion, replenishing and maintaining soil fertility and
weed control in coffee farms (Giller 2001).
7
1.4 Use of legume cover crops (LCC) as coffee intercrops
1.4.1 Potential advantages of using LCC as coffee intercrops
Growing of under-storey legumes has been widely practiced and found useful as
cover crops with virtually all types of plantain crops such as coffee (Giller, 2001).
Legumes that have been most successful cover crops in plantations are species that
are excellent forage, pasture or green manure legumes and those that spread rapidly to
provide complete soil cover between the established trees (Giller, 2001) resulting to
various benefits and accompanying costs (Snapp et al., 2005).
Like many other intercrops, legume intercrops are extensively used for soil fertility
improvement through N fixation and organic matter accumulation (Gachene and
Kimaru, 2003). Improvement in soil fertility translates to reduced fertilizer
requirements and therefore savings on fertilizer inputs. A mixture of Centrosema
pubescens and Pueraria phaseoloides was estimated to contribute 151 kg N ha-1
year-1
in an oil plantation in Malaysia through atmospheric nitrogen (N2) fixation (Giller,
2001). Vissoh et al, (1998) reported an annual saving of about 6.5 million kg of N-
fertilizer valued at 1.85 million USD due to adoption of mucuna into Nigerian
farming systems. The combined incorporation of green manures and 30 kg P2O5 ha-1
and 30 kg N ha-1
significantly increased maize yield compared to use of 30 kg P2O5
ha-1 and 30 kg N ha-1 or green manure alone (Kimidi, 2000) indicating an added
advantage in fertility improvement when green manures are used.
Legume cover crops (LCCs) can be grown for control of soil erosion (Gachene and
Haru, 1997) and moisture preservation (Abayomi, et al., 2001; Giller, 2001). They
can also be used as live mulch (Muller and Kotschi, 1997; Food and Agricultural

8
Organization, 2000), a practice that is beneficial in sustaining moisture in the soil
(Giller, 2001; Mburu et al, 2003) and moderation of soil temperatures (Muller and
Kotschi, 1997). When slashed back, some perennial legumes re-grow under the next
crop (Giller, 2001) thereby maintaining soil cover suitable for moisture retention
across seasons.
Cover crops are important weed suppressors. Cover crops such Calopogonium
caeruleum and Desmodium ovalifolium are suitable understorey crops because they
are shade-tolerant and persist longer when established ensuring effective weed control
for a long time (Abayomi, et al., 2001; Giller, 2001). Legumes have also been used
for control of pests by providing suitable habitats for beneficial insects (Vissoh et al,
1998) or breaking disease and pest cycles thereby reducing the need for use of
pesticides and fumigation (Snapp et al., 2005) which are hazardous to man and the
environment. For example Canavalia and Mucuna have been reported to have shown
repellant and insecticidal properties (McIntyre, et al., 2001). Canavalia has been used
by some communities to control moles (Gachene and Kimaru, 2003).
Benefits of growing cover crops in plantations include increased crop yields (Giller,
2001; Sullivan, 2003a). Rubber trees grown with legume cover crops gave much
higher yields over the first 4 years compared to trees grown with grass or other none-
legume covers (Giller, 2001). Better responses to fertilization have been observed in
plantations with cover crops (Giller, 2001). Intercropping with LCCs result to lower
crop production costs and general increase in land productivity through provision of
food for humans and forage for livestock. A survey by Kabambe et al. (1998) showed
that 100% of Malawian farmers growing Mucuna used it for food. Legumes such as

9
Lablab purpureus (dolichos) and Glycine max (soya beans) are used both as a food
and forage plant (Bunch and Buckles, 1998; Gachene and Makau, 2000). Grain
legume crop residues are more often than not used as dry-season fodder either for
feeding to animals in stalls or by free grazing of animals to safe on fodder harvesting
costs (Giller, 2001).
1.4.2 Potential disadvantages of using LCC as coffee intercrops
Use of cover crops has some disadvantages that largely relate to costs of production.
The costs of adopting cover crops include increased direct production costs such as
labour costs for establishment and incorporation of green manure legume cover crops;
establishment costs can be ten times higher for leguminous crops than for grasses
(Snapp et al., 2005). Labour demand for turning a stand of mucuna into the soil on 1
ha of land can be as high as 60 man- days (Giller, 2001).
Intercropped cover crops, especially where appropriate crop combinations, spacing
management are not observed, can use up stored soil water that might otherwise be
used for the main crop (Giller, 2001). LCC can potentially reduce incomes if their use
competes with other attractive (cash) crops and slow soil-warming (Snapp et al.,
2005) or if they contain toxic substances such as canavelin in Canavalia ensiformis
(Jackbean) (Gachene and Kimaru, 2003) that may even hinder legume adoption by
farmers.
Despite the known disadvantages, GMLCC and other LCC have been widely adopted
in many parts of the world including Kenya (Bunch and Buckles, 1998; Giller, 2001;
Gachene and Makau, 2000; Mureithi et al., 2003). Adoption of cover crops by small-

10
scale farmers depends on whether they are grown on land that has few opportunity
costs; for example on land left fallow or under tree or commercial crops, whether their
use saves or requires very little additional labour and their biomass provides benefits
over and above improvements to soil fertility (Bunch and Buckles, 1998). Since land
is scarce, the opportunity costs of establishing sole legumes on agricultural land can
be high unless the land is otherwise left fallow (Bunch and Buckles, 1998) farmers
use appropriate LCC intercrops systems.
In Kenya, some farmers have intensified crop production by intercropping coffee
with food legumes such as common beans (Phaseolus vulgaris), maize (Zea mays)
and Irish potatoes (Ipomea batatus) (Coffee Research Foundation, 2003; Khisa, 2000
and Mureithi et al., 2003) for food production and other legume cover crops for weed
control (Mureithi et al., 2003). Intercropping coffee with annual crops like beans
(Phaseolus vulgaris), and cowpeas (Vigna unguiculata) does not significantly affect
coffee in terms of tree growth, yield and quality during the first year of establishment
Kimemia (2003).
Perennial tree crops affect coffee differently. Intercropping coffee with perennial
crops such as pawpaw (Carica papaya), passion fruit (Pasiflora edulis), apples
(Malus pumila), oranges (Citrus sinensis), avocadoes (Persea americana), loquats
(Eriobotrya japonica) and macadamia (Macadamia ternifolia) did not reduce clean
coffee yields or bean quality. Bananas (Musa sapentium) and guava (Psidium
guajava) however significantly depressed coffee plant height and yield components
but did not affect coffee quality significantly (Kimemia, 1998).
11
Screening of legume species under the Legume Research Network Project (LRNP)
has been done and some “best-bets” identified (Mureithi et al., 2003). These include
crotalaria, jack bean, silver leaf desmodium and mucuna (Gachene and Wortmann,
2004; Mureithi et al., 2003). Canavalia ensiformis (jack bean) and Mucuna pruriens
(velvet bean) are among the best species in terms of ability to nodulate under low soil
moisture conditions, tolerance to moisture stress, soil conservation and providing
good ground cover for effective weed control (Gachene and Makau, 2000; Saha et al.,
2000). Vicia benghalensis (purple vetch) and Lablab purpureus (lablab) showed good
cover while Mucuna pruriens and Lablab purpureus were good in biomass production
(Gachene and Makau, 2000). Since legume cover crops provide ground cover and
accumulate high biomass over a short time, they have a potential to effectively control
weeds and therefore contribute towards savings in weeding labour in coffee. Their
ability to fix atmospheric N is an added advantage which can result to reduced N
fertilizer requirements. The possibility of intercropping legumes with coffee is an
opportunity for improvement of land productivity and hence poverty alleviation
among the smallholder coffee farmers.
1.5 Problem statement and justification
Kenya‟s coffee is predominantly grown under a monoculture system (Coffee Board of
Kenya, 2003c) that is characterized by declining productivity (Food and Agricultural
Organization, 2012), low payments and lack of credit to coffee farmers (Nyangito,
2001). The major coffee production constraints are high costs of fertilizers, pesticides
and labour for pest, disease and weed control (Coffee Research Foundation, 2003;
Coffee Board of Kenya, 2003a; Ministry of agriculture, 2010).

12
Studies in Kenya coffee show that 72 % of smallholder farmers hire labour for farm
activities which include weeding, pest management and harvesting (Karanja, 2002).
Weeds decrease coffee yield and quality by over 50% (Njoroge and Kimemia, 1990).
Fertilizers constitute over 26 % of the coffee production costs which most small
holder farmers cannot afford, subsequently, farmers use them sub-optimally resulting
in low coffee yields and quality (Karanja, 2002). Low returns of (monoculture) coffee
have reduced farmers‟ ability to effectively improve soil fertility through maintenance
of soil conservation structures and application of recommended fertilizers and
pesticide rates and hire labour for weed control leading to further decline in coffee
yields (Coffee Board of Kenya, 2003a; Hassan et al., 1998).
Low and unreliable coffee earnings have driven small holder farmers to intercrop
coffee with food crops. Inappropriate intercrop practices have led to destruction of
soil conservation structures (terrace embankments) and increased soil erosion.
Adequate information on suitable coffee intercrops to address these problems is
lacking and limited research has been carried out in Kenya on suitable legume cover
crop intercrops with mature coffee (Kimemia, 2003). Studies by Legume Research
Network Project (LRNP) showed that the potential of using legume cover crops for
soil fertility improvement, weed and soil erosion control is enormous (Gachene and
Makau, 2000). This study investigated the effects of legume cover crops under coffee
on weeds. Recommendations for their use in coffee and further research were made
based on the information generated.

13
1.6 Objectives
1.6.1 Broad objective
To investigate the growth of legume cover crops under coffee and their impact
on weeds.
1.6.2 Specific objectives
1. To evaluate the growth of different legume cover crops under coffee
2. To determine the effects of the legume cover crops on weeds under coffee
1.7 Hypothesis
1. Coffee has no effects on intercropped legume cover crops
2. Legume cover crops have the potential of controlling weeds in coffee
14
CHAPTER 2
LITERATURE REVIEW
2.1 Environmental requirements of Coffee
2.1.1 Climatic and soil requirements
Natural stands of Coffea arabica are found on the high plateau of Ethiopia at altitude
of 1300-1800 m above sea level with annual rainfall of about 1500-1800 mm and
average temperature ranging between 15-25oC (Wilson, 1999; Waller et al, 2007).
Coffee is adaptable to a range of ecological conditions (Coste and Cambrony, 1992).
It can be established at an altitude of 1400-2000 m above sea level. For optimal
growth, the maximum day temperatures should not exceed 30oC and minimum night
temperature not below 15oC and annual rainfall of not less than 1000 mm. It requires
well- drained, slightly acidic fertile loam soils with a depth of at least 1.5m and pH
ranging between 5.3-6.5 (Coffee Research Foundation, 2001; Elzebroek and Wind,
2008). Different varieties are adapted to different ecological zones, for example SL
28, K7 and SL 34 can only be grown in low to medium agro-ecological zones while
RUIRU 11 (eleven) hybrid can be grown in all coffee growing areas in Kenya
(Coffee Research Foundation, 2001).
2.1.2 Coffee growth habit and agronomic requirements
Coffee is a perennial crop that can grow up to about 10m tall when mature. Its main
stem is vertical (orthotropic) with lateral (plagiotropic) branches (Wilson, 1999;
Winston et al., 2005) that bear evergreen leaves. The leaves intercept light for
photosynthesis. The root system of mature coffee consists of a taproot growing to a
depth of up to 1 m, axial roots that grow vertically downwards to a depth of 2.3 m and
lateral roots forming a mat structure almost parallel to the soil surface (Coste and

15
Cambrony, 1992; Winston et al., 2005) with in the upper 30 cm of soil (Winston et
al., 2005; Waller et al 2007). The root system is useful in nutrient and water uptake.
Coffee is widely spaced at 2.74 m x 2.74 m for the traditional varieties (K7, SL28 and
SL34) or 2 m x 2 m for the compact varieties like RUIRU 11 (Coffee Research
Foundation, 2001). Coffee requires weed free fields (Kimemia, 1998), effective soil
conservation measures especially on sloppy ground (Khisa, 2000; Wilson, 1999) and
adequate supply of nitrogen, phosphorus, calcium and magnesium (Coffee Research
Foundation, 2001) for good establishment and production. The understanding of
coffee agronomic requirements is important when considering intercropping coffee.
2.1.3 Weed, disease and insect pest management
Weed control or weed management is a term used to describe activities and
modifications of measures or conditions in the cropping system with an intention of
influencing or reducing weed populations (Hakansson, 2003). The three widely
practiced methods of weed control in fruit and other perennial crops (including
coffee) are mechanical, cultural and chemical application (Clay et al., 1990; Coffee
Research Foundation, 2003; Coffee Research Foundation, 2004). In Kenya, the use of
integrated weed management (IWM), which is combination of the above methods, is
recommended (Coffee Research Foundation, 2004; Nyabundi and Kimemia, 1998).
Mechanical weed control involves manual or machine operated tools. Hand hoes are
commonly used to remove perennial grasses such as Digitaria abbisinica (couch
grass) and Cynodon dactylon (star grass) in small-scale farms. Weed slashing can be
done to minimize water and nutrient uptake by weeds or when the soil is too wet to
dig. Herbicides are used in large and small holder farms. The cost of using herbicides

16
for weed control is generally high compared to cultural methods (Njoroge and
Kimemia, 1990). Cultural methods like planting suitable legume cover crops can
minimize weed control costs. Growing legume cover crops in situ is potentially cost-
effective because they also serve as mulch (Muller and Kotsch, 1997). Application of
mulch from plant materials grown in situ under coffee saves labour by 20 -40 %
(Muller and Kotsch, 1997).
Insect pests and diseases are a major problem in coffee in Sub-Saharan Africa with
estimated crop losses of 15 and 20 % respectively in Africa (Wilson, 1999). The most
common coffee pests include leaf miners, mealy bugs and stem bores while the main
coffee diseases are coffee leaf rust and coffee berry disease (Wilson, 1999; Waller et
al, 2007). Pest and disease control are an integral part of coffee management in coffee
farms and forms a significant part in production costs especially for small holder
farmers (Wilson, 1999; Karanja, 2002) who do not benefit from economies of scale
compared to large scale farms. Introduction of LCC in coffee may improve pest and
disease management in coffee farms especially if the legumes used break disease and
pest cycles (Snapp et al., 2005). For example Canavalia and Mucuna have repellant
and insecticidal properties (McIntyre, et al., 2001). Manipulation of cropping systems
by use of LCC may offer an alternative integrated pest management approach in
coffee farms.
2.1.4 Fertilizer requirements
Coffee exhausts the soil in which it is grown through extraction of soil nutrients and
removal of harvested coffee beans (Winston et al., 2005). It takes 35 kg of nitrogen
(N), 3 kg of phosphorus (P2O5) and 40 kg of potassium (K2O) from the soil to

17
produce 1 tonne of green coffee beans (Elzebroek and Wind, 2008). It is therefore
necessary to replenish the nutrients in the coffee system to sustain coffee yields
overtime. Nitrogen (N), potassium (K) and phosphorus (P) are among the major
elements required in large quantities for nutrition of coffee (Coffee Research
Foundation, 2012b). Nitrogen is important for vegetative growth, phosphorus for bean
production and root development for nutrient uptake from the soil and potassium for
berry development and ripening (Winston et al., 2005; Coffee Research Foundation,
2012b).
In Brazil, the requirement for Coffea arabica is equivalent to 94.7 kg N, 14.4 kg P2O5
and 116.8 kg K2O per hectare per year (Coste and Cambrony, 1992). In Kenya, it is
recommended that NPK compound fertilizers should be shallowly incorporated into
the soil (Coffee Research Foundation, 2004) at the rate of 50 -400 kg N /ha /year, 100
kg P2O/ha/year and 100 kg K2O /ha /year split into 3 -4 applications per year
depending on the level of management and expected yields (Wilson, 1999). This is
similar to 175 g N, 100 g P and 175 g K per tree per year (Elzebroek and Wind,
2008). Farmers in Kenya, especially small scale farmers, are however unable to
implement these recommendations because of high costs of inorganic fertilizers
coupled with lack of affordable credit to buy inputs (Hassan et al., 1998; Coffee
Board of Kenya 2003a). Farmers maintain soil fertility by use of farm yard manure
which in many cases is inadequate (Mureithi et al., 2003) and its quality is usually
low due to poor handling and poor quality feeds for livestock (Lekasi et al., 1998).
The problem of soil fertility management is therefore a major challenge to coffee
farmers. Incorporation of N-fixing legumes especially those that establish quickly
18
(Mureithi, et al., 2003) are preferred in coffee systems as an alternative source of soil
nutrient supply for soil fertility improvement (Gachene and Kimaru, 2003).
2.2 Legume Cover Crops.
2.2.1 Legume cover crop establishment
A legume cover crop (LCC) is a legume primarily grown to prevent soil erosion,
weed suppression through ground cover and for soil fertility improvement (Bunch and
Buckles, 1998; Abayomi et al., 2001; Giller, 2001) through biological Nitrogen
fixation (Sullivan, 2003a; Eninn et al., 2004; Chemining‟wa et al, 2004). A legume
cover crop can be incorporated into the soil as an organic fertilizer (Gachene and
Kimaru, 2003) in which case it is regarded as green manure (Food and Agricultural
Organization, 2000; Gilbert, 1998; Giller, 2001; Mureithi et al., 2003). The choice of
growing a cover crop depends largely on the objectives of a farmer, whether to
prevent soil erosion, as source of fertility, pest suppression, yield enhancement and
suppression of root –not nematodes in cropping systems (Kimenju et al., 2007; Snapp
et al., 2005). Establishment and performance of the chosen crop however depends on
farmers‟ cultural practices such as the plant density, seed spacing and fertilizer
applications (Giller, 2001).
The legumes‟ own characteristics also determine its growth and development; for
example the germination of Mucuna pruriens can be difficult due to its hard seed coat
but unlike Canavalia ensiformis, it establishes quickly due to its large seed and
relative resistance to moisture stress at shoot emergence (Giller, 2001; Gitari et al.,
2000). Leguminous species such as Crotalaria ochroleuca, Mucuna pruriens, Lablab
purpureus, Glycine max, Vicia benghalensis have good to excellent emergence and

19
early plant vigour in 2 to 3 weeks after planting (Maobe et al., 2000a) while
Desmodium intortum and Neontonia wightii are typically slow in establishment
(Giller, 2001). Neontonia wightii can take 2 to 3 months to establish (Gitari et al.,
2000).
The performance of legumes overtime also differs from one legume to the other
depending on prevailing environmental conditions (temperatures, light, soil fertility
and moisture availability) that influence growth and development (Food and
Agricultural Organization, 2000). Mucuna pruriens is adapted to low fertility soils
with sandy to sandy-clay texture and a pH range of 5.0-7.0 and is susceptible to water
logging and somewhat tolerant to drought (Vissoh et al., 1998). Suitable temperatures
for Mucuna range between 19 and 27oC. Canavalia is well adapted to acidic and
infertile soils and can grow in climates ranging from very wet to very arid (Giller,
2001). It does well at 0-1800 m a.s.l within an average temperature range between
14.4oC –27.8
oC. Legumes should therefore be grown in conditions that favour their
optimal growth so as to maximize their use.
2.2.2 Legume cover crop phenological development
The primary factor that determines plant phenological stages is temperature (Elmore,
2010), usually expressed in terms of thermal time (TT) or growing degree days
(GDD) (o
C days) (Mburu, 1996; Sayid and Squaire, 2002; Elmore, 2010). Thermal
time is described as the number of temperature degrees above a certain threshold base
temperature, below which an organism does not grow or grows very slowly (Elmore,
2010; Stockle et al., 2012). Thermal time varies from one crop to another and is
accumulated throughout its growing season starting with planting until harvest such

20
that a crop enters the next stage of development when the thermal time reaches the
thermal time requirement for the respective stage (Stockle et al., 2012; Wikipedia,
2012). For example the base temperature for common bean, lablab and soyabean is 8
(Mburu, 1996), 9.9 (Awadhwal et al., 2001) and 10 o C (Elmore, 2010). Light, soil
water content, nutrients, CO2 and salinity may also influence crop phenology but to a
lesser extent (Matthias, 2002; Howard et al., 2000; McMaster et al., 2002). Based on
temperature, accumulated thermal time (TT) can be computed as follows; (Mburu,
1996)
TTDD = ∑ 0DAP
((Tmax –Tmin)/2) - Tb
Where DD is days after planting
Tmax is daily maximum temperature (o C)
Tmin is daily minimum temperature (o C) and
Tb is the base temperature
The minimum and maximum temperatures for most plants (crops) is usually 10 to 30 o
C respectively because most plants do not grow outside that temperature range
(Elmore, 2010; Wikipedia, 2012).
Legumes reach different phenological stages (time to emergence, anthesis, 50%
flowering, 50% podding and physiological maturity) at different times (Stockle et al.,
2012). Experiments have shown that legumes reach flowering stage at varying periods
in a growing season (Gitari, et al., 2000). Short lived annuals such as Lablab,
Crotalaria , Vicia ) and Glycine max (soya bean) reached on set of flowering at 84,
74, 66 and 66 DAP respectively while long lived legumes like Mucuna and
Desmodium uncinatum reach on set of flowering at 102 and 103 DAP respectively

21
(Maobe et al., 2000a). Flowering in legumes coincides with the time when most root
nodules are active for nitrogen fixation which contributes to soil fertility improvement
(Giller, 2001; Liu et al., 2011). However, legumes differ in the number of nodules at
flowering. For example, Vicia benghalensis, soyabean, lablab had 100, 50 and 20
active nodules per plant respectively at 2-3 months after planting (flowering time),
(Maobe et al., 2000a). Biological nitrogen fixation is a cost-effective means of
nitrogen supply to the soil (Giller, 2001).
Different legumes have different growth characteristics. Some legume types are short
and erect (e.g. soyabean and common bean), tall and erect (Crotalaria ochroleuca)
while others are creeping or spreading (butter bean, Desmodium, mucuna pruriens
and lablab purpureus). The creeping properties facilitate quick ground cover for weed
suppression and soil erosion control. Annual legumes species are rapid in foliage
establishment for ground cover (Gitari et al., 2000). Vicia benghalensis, Glycine max
and Lablab can achieve over 60% ground cover by 2 to 3 months after planting
(Maobe et al., 2000a). Long-lived creeping perennials such as Desmodium intortum
and Neontonia are able to achieve up to 100% ground cover within the first six
months after planting (Giller, 2001; Gitari et al., 2000). Fast legume establishment
coupled with creeping characteristics ensure good ground cover which is important
for soil erosion (Gitari et al., 2000) and weed control (Vissoh et al., 1998).
2.2.3 Legume biomass production
Plant biomass is the weight of living plant material contained above and below a unit
of ground surface area at a given point in time (Roberts, et al., 1995). Plant herbage
(stem, leaves and reproductive parts) form the above ground biomass and the roots the

22
below ground biomass (Roberts, et al., 1995). Above ground biomass production is
largely depended on intercepted radiation, transpiration and plant nitrogen uptake
(Roberts, et al., 1995). Each of these factors is capable of limiting growth. Estimation
of biomass accumulation is necessary when growing legumes for either livestock feed
or incorporation into the soil as green manure for fertility enhancement (Gitari et al.,
2000). The relationship between biomass accumulation and resource use is explained
in section 2.4.2 of this study.
As legumes near maturity, senescence sets in resulting in litter fall (Gilbert, 1998;
Ansari, and Chen, 2011). Senescence and litter fall occurs when the rate of respiration
is greater than the rate of photosynthesis. The factors affecting leaf senescence
include low light levels, water stress and self shedding characteristics of the legume
(Gilbert, 1998; Ansari, and Chen, 2011). The amount of litter differs from one legume
to another even under the same conditions; for example Mucuna leaf litter fall was
double (3200 kg ha -1
) that of soybean (1560 kg ha -1
) in the same environment
(Gilbert, 1998). Both leaf and stem litter contribute towards soil amelioration in
various ways. Mucuna has a copious amount of N-rich litter that falls during the
growth season. Mucuna rotations were found to contain 100 kg N ha -1
in leaf and
stem litter, which upon decomposing or incorporation into the soil becomes available
for crop use (Gilbert, 1998). Other LCC that have high nitrogen content in their
organic materials include desmodium (3.44 %), Jack bean (3.45 %), purple vetch
(3.68 %), mucuna (3.56 %) and crotalaria (4.45 %) (Gachene and Kimaru, 2003). This
shows that suitable LCC intercrops can be used to supply nutrients and organic matter
through litter and leaf fall. Organic matter improves soil structure and water holding
capacity, aeration and regulates soil temperature (Gachene and Kimaru, 2003).
23
2.2.4 Legume seed yield
The amount and duration of intercepted radiation and dry mater (DM) accumulation
are directly linked to crop yield because DM is partitioned into the crops harvestable
parts (pods, seeds) and the rest of the plant material (Akhter et al, 2009; Akinyele and
Osekita, 2006). The relationship between seed yield, dry matter production and
radiation interception is expressed by the equation below: (Simmonds et al, 1999).
Ys = HI * es (∑Si * f)
Where: Ys is seed yield (g m-2
)
HI is harvest index
es is the ratio of dry matter to intercepted radiation (conversion
efficiency g MJ-1
); SSi is the cumulative total of intercepted radiation
(MJ m-2
); Si is the amount of radiation intercepted on day i and f is the
fraction of incident radiation intercepted
From this equation, it is evident that radiation interception and dry matter
accumulation are related and contribute to seed yield production. For grain crops,
harvest index (HI) is the ratio of harvested grain to total shoot dry matter, and can be
used as a measure of reproductive efficiency (Unkovich et al., 2010). Factors that
influence crop HI include the energy and protein content of seeds, extreme (either hot
or cold) temperatures during crop reproductive development and crop husbandry
especially delayed sowing, which shortens the length of the vegetative phase and
increases HI (Unkovich et al., 2010).

24
2.3 Coffee intercrop systems
2.3.1 Principles of intercropping
Intercropping is defined as a form of multiple cropping in which two or more crops
are grown in row arrangements and simultaneously on the same piece of land
(Palaniappan and Sivaraman, 2001) for at least part of the life of each species (Azam-
Ali and Squire, 2001). When two or more crops are growing together, each must have
adequate space to maximize cooperation and minimize competition between them. To
accomplish this, spatial arrangement, plant density, maturity dates and plant
architecture of the crops being grown need to be considered (Sullivan, 2003b). The
most suitable special arrangement for intercropping in coffee is relay cropping
(Njoroge, 1992). Relay cropping is planting a second crop into a standing crop at a
time when the standing crop is at its reproductive stage but before harvesting
(Sullivan, 2003b). To optimize plant density, the seeding rate of each crop in the
mixture is adjusted below its full rate. Planting intercrops that feature staggered
maturity dates or development periods takes advantage of variations in peak resource
demands for nutrients, water, and sunlight Sullivan, 2003b). Having one crop mature
before its companion crop lessens the competition between the two crops. Plant
architecture is a commonly used strategy to allow one member of the mix to capture
sunlight that would not otherwise be available to the others (Sullivan, 2003b). It is
therefore more advantageous to intercrop plantation trees with shorter plant species
because the understory plants capture light that is not intercepted by the taller species
resulting in optimal light interception in the intercrop compared to the sole plantation
crop (Giller 2001).

25
Advantages of intercropping have been widely documented (Giller 2001; Kimemia,
1998; Kimemia, 2003; Njoroge 1992; Vissoh at al., 1998; Sullivan, 2003a; Sullivan,
2003b). The documented advantages include increase in crop yields and farm income,
intensified land use resulting to increased crop yield stability (Azam-Ali and Squire,
2001), reduction in labour requirements for weeding and land productivity per unit
area (Kimemia, 1998; Maina, 1997; Sullivan, 2003b). Generally, these benefits are
achieved through efficient use of limited resources (light, water and nutrients) leading
to higher yields per unit area, income stability, more balanced distribution of labour
requirements through the seasons (Njoroge, 1992). Intercrops may also reduce
impacts of pests and diseases where pathogens may settle on non-host components of
the intercrop (Azam-Ali and Squire, 2001).
Legumes cover crops suppress weed infestation and growth in intercrops resulting in
less competition from weeds and thus contribute to yield advantages (Giller, 2001;
Maina, 1997; Mureithi et al, 2003; Gachene and Makau, 2000). They also contribute
to nutrient recycling in intercrop systems; the magnitude of nutrient recycling is
determined by biomass production, nutrient contents and decomposition rate in the
intercrop system (Lehmann et al., 2000). Legumes provide more N because they
generally have high foliar N content ranging from 20 to 45 mg g-1
compared to non
legumes (Lehmann et al., 2000). Intercrop systems that involve use of legumes also
provide crop residue with low Carbon-Nitrogen C/N (10:1) compared to systems
intercropped with cereals whose ratio is high (200:1) (Njihia, 2000). High C/N ratio
materials decompose slower than low C/N ratio materials and there fore have a higher
organic matter buildup than low C/N ratio materials (Njihia, 2000). Organic matter
results in improved soil structure and reduction in nutrient leaching in intercrops.

26
Intercrops that enhance organic matter build up and soil cover are more beneficial
because they help in maintenance of soil fertility and environmental protection
(Giller, 2001; Bot and Benites, 2005).
Different intercrops combinations are widely practiced in various parts of the world.
Perennial tree crops (including coffee) have been intercropped with annual food crops
and leguminous species (Giller, 2001). Cereal food crops and legumes intercrops such
as corn and soybean are found in Canada (Sullivan, 2003b) and relay – mucuna
intercrops in west Africa (Vissoh at al., 1998). Intercrops of grasses such as Napier
and forage legumes (e.g desmodium) are also widely practiced in sub-saharan Africa
(Wandera et al., 2000). Coffee and maize have been intercropped with green manure
cover crops such as canavalia and mucuna for soil fertility improvement in Uganda
(Gachene and Wortmann, 2004) while cocoa and coffee have been intercropped with
legume cover crops in Ghana (Giller, 2001). In Kenya, coffee has been intercropped
with beans for food production (Njoroge, 1992).
2.3.2 Intercropping coffee with annual crops
In the past, coffee intercropping was not practiced in both large and small holder
farms because of restrictive regulations by the Kenyan government (Nyangito, 2001).
However in recent years, intercropping coffee with food crops has become
increasingly necessary in small holder farms mainly for subsistence food production
and income generation from produce surplus (Famaye, 2004).
Suitable coffee intercrop combinations with annual food crops have benefits which
include reduction of soil erosion (Khisa, 2000) and provision of food for coffee
27
farmers (Kimemia, 1998). Legume cover crops such as lablab (Lablab purpureus) can
also be used for weed control and soil fertility and food (Mureithi et al., 2003). Coffee
intercrops with food crops have been reported to result in net benefits. Coffee - food
crop (potatoes, tomatoes and beans) intercrops were considered most ideal because
the food crop yields were found to be higher than the corresponding pure stands.
However maize affected coffee growth and yields adversely making its intercrop
unprofitable (Njoroge, 1992).
Other studies in Kenya showed that intercropping coffee with annual food crops like
dry beans (Phaseolus vulgaris), cowpeas (Vigna unguiculata), Irish potatoes
(Solanum tuberosum), tomatoes (Lycopersicon esculantum) resulted in positive net
returns even with increased coffee tree densities (Kimemia , 1998). Similarly,
intercropping beans and garden peas in coffee planted at conventional and hedge row
plantings had positive net returns. This shows that intercropping coffee with food
crops can be advantageous especially when suitable agronomic practices such as crop
spacing are observed. For example, short crops can be planted within the one (1)
meter spacing between coffee rows without much competition with coffee and at least
60 cm from the coffee plants to avoid nutrient and water competition (Kimemia,
2003).
Annual legumes cover crops exhibit different responses in terms of dry matter
accumulation, weed suppression and soil erosion control when intercropped with
other crops. Sole mucuna produced 11 tons DM ha-1
(Mureithi et al., 2003) and 3 tons
ha-1
when intercropped with maize (Maobe et al., 2000b) while sole Vicia
benghalensis (purple vetch) produced 2 tons DM ha-1
under similar environments.

28
Impacts of legume cover crops in controlling soil erosion have been recorded.
Intercropping purple vetch (Vicia benghalensis) with maize reduced cumulative soil
loss over an eight-month period by three fold compared to uncropped plots which had
7.1 t ha-1 cumulative soil loss (Gachene and Haru, 1997).
2.3.3 Intercropping coffee with perennial crops
Intercropping tree crops at establishment stages has been reported to be economically
beneficial because the intercrops can utilize the light energy and other growth
resources for production between the main trees before they closed their canopy
(Njoroge, 1992). During the establishment phase of coffee, pawpaw (Carica papaya),
passion fruit (Pasiflora edulis) and avocadoes (Persea americana) did not reduce
clean coffee yields or bean quality. Bananas (Musa sapentium) and guava (Psidium
guajava) significantly depressed coffee plant height and yield components but did not
affect coffee quality significantly (Kimemia, 1998). The effects of intercrops on
coffee may differ depending on whether they shade coffee or not. Coffee shaded by
Mimosa scrabella yielded significantly less (1870 kg /ha) compared to unshaded
coffee (2052 kg/ha) while Grevillea robusta and (Macadamia ternifolia) macadamia
did not significantly affect the yield of clean coffee (Kimemia, 2003).
Intercropping coffee with perennial forage legume cover crops has different impacts
on the intercrops. Kimemia (1998) intercropped coffee (Ruiru 11) with desmodium
and recommended use of desmodium for weed suppression and moisture preservation
but discouraged the use of desmodium as green manure in coffee because it has low
rates of mineralization. Intercropping can reduce dry matter accumulation for
legumes. For example the dry matter yield for sole Desmodium uncinatum (silver leaf

29
desmodium) was depressed by over 85% from 10 t DM ha-1
to 2 t DM ha-1
due
intercropping with napier in Embu (Wandera et al, 2000) .
Advantages of intercropping coffee with perennial legumes include continuous supply
of livestock feed, prolonged weed suppression and moisture retention especially over
dry seasons (Bunch, R. and Buckles, D. 1998; Giller, 2001). Challenges associated
with intercropping perennial legumes generally include possible competition for light,
water and nutrients (Giller, 2001; Ong et al., 1996; Palaniappan and Sivaraman, 2001)
and yield reduction in the main crop (Giller, 2001; Kimemia, 1998).
Certain disadvantages of intercropping coffee with other crops have been reported.
Intercropping generally hinders time-saving mechanized operations such as fertilizer
and pesticide application and to some extent harvesting (Giller, 2001). It may result in
resource (light and soil moisture) competition (Giller, 2001). For example, Crotalaria
is an excellent green manure legume and an effective weed suppressor, but it may not
be suitable for intercropping with established coffee because it grows tall (Gachene
and Wortmann, 2004; Giller, 2001;), posing a challenge of competition for light
through shading (Kroff, 1993a). It therefore needs to be cut back early to reduce light
competition and to open up coffee farms for ease of harvesting (Maina et al., 2006).
Trailing legumes require extra labour requirements to prevent the spreading cover
crops from climbing over coffee bushes (Giller, 2001). It is recommended to train
intercrop Mucuna and Lablab to prevent it from tangling coffee. Intercropping can
also lead to reduction of the coffee grain yields (Kimemia, 2003).

30
2.3.4 Best- bet legume cover crop options
A good choice of a legume cover crop for intercropping in coffee systems is the one
that is suited to the conditions favoring its growth and development and serve the
purpose for which it is grown (Gachene and Wortmann, 2004). For coffee
intercropping, the legume should be effective in weed suppression, soil erosion
control and soil fertility improvement without making the intercrop system
counterproductive (International Center for Tropical Agriculture, 2003; Gachene and
Wortmann, 2004) (Table 2).
The most outstanding legume cover crops that can be suitable in coffee systems based
on these attributes are Mucuna pruriens, Canavalia ensiformis, Lablab purpureus and
Desmodium unicinatum (Maobe et al., 2000b; International Center for Tropical
Agriculture, 2003; Mureithi et al., 2003; Gachene and Wortmann, 2004) (Table 2).
Dual purpose annual cover crops like Lablab purpureus can be attractive to farmers
who may want to intercrop them for food human consumption and forage provision
for dairy cows (Gachene and Wortmann, 2004). Perennial cover crops like
Desmodium and can be suitable for large scale farmers who are interested in fodder
production (Giller, 2001).

31
Table 2 “Best bet” legume cover crops suitable for coffee intercrop systems
Best bet
legume Growth habit
Intercrop
Recommendation Use options
Canavalia
ensiformis
Long lived annual,
Erect canopy
Intercrop with
newly
planted coffee
Green manure
Lablab
purpureus
Short lived annual,
Spreading and
climbing
Intercrop with
newly
planted coffee
Food, green manure,
forage production and
weed and soil erosion
control
Mucuna
pruriens
Long lived annual,
Spreading and
climbing
Intercrop with
Established coffee
Green manure and
Forage production,
weed and soil erosion
control
Source: Gachene and Wortmann, (2004).
2.4 Resource use in intercrops
2.4.1 Competition and complementarity in cropping systems
The basic principle underlying the concept of resource capture is that complementary
or competitive interactions between species depend on their ability to capture and use
the most limiting essential growth resources effectively (Ong et al, 1996). Capturing
of the limiting resource (e.g. light, water or nutrients) depends on the number, surface,
distribution and effectiveness of the individual elements within the canopy or root
system of the species or mixture involved (Ong et al., 1996). When resources are not
limiting, densely planted monocultures usually provide the most efficient resource
capture systems. However, where one (or more) resources is limiting, productivity
may be improved by using species mixtures if the component species capture more of
the available resources or use them more efficiently for growth. In such instances,
32
mixtures may provide a greater yield than the combined yield of the corresponding
sole crops. When the productivity of the mixture is superior to that of the sole-crop,
yield advantages are realized and complementarily is said to have occurred.
Competition is the reverse. Yield advantages are expressed in terms of Land
equivalent ratio (LER). The Land Equivalent Ratio (LER) is the sum of the fractions
of the intercropped yields divided by the sole-crop yield. LER is calculated using the
equation: (Mazaheri, et al., 2006; Morales-Rosales and Franc-Mora, 2009)
LER = Σ (Ypi/Ymi),
Where Yp is the yield of each crop or variety in the intercrop and Ym is the yield of
each crop or variety in the sole crop or monoculture. For each crop (i) a ratio is
calculated to determine the partial LER for that crop, the partial LERs are summed to
give the total LER for the intercrop. A LER value of 1.0, indicates no difference in
yield between the intercrop and the collection of monocultures. LER value greater
than 1.0 indicates a yield advantage for intercrop. A LER of 1.2 for example, indicates
that the area planted to monocultures would need to be 20% greater than the area
planted to intercrop for the two species to produce the same combined yields.
2.4.2. Above ground resource use
Light is essential to all green plants because of its primary role in photosynthesis
(Squire, 1990; Roberts et al., 1995). All kinds of radiant energy, including light, vary
in several different ways, most important of which are irradiation (intensity), quality
and duration. Under natural conditions, differences in irradiance have more significant
effects upon growth of plants than differences in light quality (Roberts et al., 1995).

33
During crop growth incident solar radiation is converted to more useful forms of
chemical potential energy located in the harvestable plant parts (Hall et al., 1993).
This energy transformation is achieved through interception of incident solar radiation
by the leaf canopy, conversion of the intercepted radiation energy (conveniently
expressed in terms of plant dry matter), and partitioning of the dry matter produced
between the harvested parts and the rest of the plant (Hall and Rao, 1994; Sayed and
Squire, 2002). For any crop or stand of natural vegetation, the net biomass gain or net
productivity (Y) is determined by the quantity of incident light (Si), the proportion of
that light intercepted by green plant organs (f), the efficiency of photosynthetic
conversion of the intercepted light into biomass (ε), and respiratory losses of biomass
(R) (Hall and Rao, 1994). The relationship between plant productivity and these
factors can be expressed as:
Y= (ε (Si * f)) – R
These factors ultimately determine the efficiency with which intercepted
photosynthetically active radiation (PAR) affects the conversion of CO2 into crop dry
matter (Hall and Rao, 1994). PAR is the solar radiation within the 400-700 nm band
that is used in photosynthesis (Ehlers and Goss, 2003). There is a linear relationship
between total dry-matter production and the quantity of radiant energy intercepted
(Hall and Rao, 1994; Ehlers and Goss, 2003). The extent to which a canopy intercepts
the available radiation depends on the leaf area index (LAI), leaf angle and canopy
structure and architecture (Nobel, et al., 1995; Ehlers and Goss, 2003). LAI is the
crop leaf area displayed per unit of soil surface area (Nobel, et al., 1995).

34
Canopy structure refers to the amount and organization of above ground plant
material, including the size, shape and orientation of plant organs such as leaves,
stems, flowers and fruits (Nobel, et al., 1995). In canopies where leaves are nearly
vertical (erectrophiles) light penetrates to the lower layers readily and so the foliar
absorption coefficient (k) is often low, about 0.4 for many grasses. Canopies in which
leaves are predominantly horizontal are termed planophile and allow less light to pass
through (Nobel, et al., 1995; Muthuri, 2004). Coffees‟ planophile canopy is expected
to intercept considerable light leaving intercropped legumes with less light for
photosynthetic activity.
Shading of understorey by taller plants results in lower leaf chlorophyll concentration
per plant of the shadowed crop. Chlorophyll is a sensitive indicator of photosynthesis
that reflects photosynthetic carbon assimilation capacity and low biomass production
(Odeleye et al., 2001). Plants grown in the open tend to have higher dry matter (DM)
accumulation compared to those grown under reduced light intensity or in a
competitive intercrop (Kroff, 1993a; Odeleye et al., 2001). Although optimal light
interception can be reached in sole crops compared to intercrops, efficiency in light
utilization is usually higher in intercrops (Njoroge, 1992; Obuo et al., 1997). Taller
plants in an intercrop dominate light interception at the upper layer while shorter ones
utilize the light transmitted to the ground that otherwise may be wasted in sole
cropping.
2.4.3 Below ground resource use
The most important below ground resources for plant growth and development are
soil water and nutrients. Water is a necessary constituent of all living plant cells and

35
tissues and serves as a biochemical medium and solvent of nutrients and is involved in
metabolic processes including photosynthesis (Hall et al., 1993). During the growth of
a plant, water supply among other factors such as temperature and population density
is key in determining leaf area and longevity (Bréda, 2008; Fang and Liang, 2008)
and hence plant canopy development and biomass production.
Plants compete for soil water differently depending on the prevailing circumstances
(Wallace, 1996). For example, plants growing in a mixture under a limited water
situation will compete for soil water in particular and generally for light (Ong et al.,
1996; Wallace, 1996). Competition for water differs in principal from competition for
light in that competition for light is a process of direct competition for resource
capture, with an instantaneous nature (Ong et al., 1996). If the light resource is not
captured, it is lost because it is not stored in the system. Unlike light, water can be
stored. The implication is that different plants grown in an intercrop can compete for
water either directly or indirectly. Direct competition occurs when the life cycle of
species in a mixture differs, for example, an early maturing species may not suffer
water stress itself, but may subject the later maturing species to increased water stress
by enhancing water loss earlier in the season (Kroff, 1993b).
To minimize competition for water, conservation measures that promote availability
of moisture at the root zone and its surrounding areas creating conducive micro-
environment are necessary. Conserved water leads to greater fertilizer use and
efficiency, better nutrient uptake by plants (Snapp et al., 2005) and can enable
perennial crops, including coffee, to survive dry spells across seasons, making it an
important aspect in sustaining crop productivity. Soil moisture conservation in coffee
can be achieved through in situ mulching which involves the use of legume cover

36
crops as „live mulch‟ and their litter as „dead mulch‟ (Giller, 2001; Hussein et al.,
2000; Food and Agricultural Organization, 2000).
Increased shade from cover crops and their mulching effects reduce water runoff and
evaporation from the soil which effectively raises water use efficiency (WUE). Water
use efficiency is commonly defined as the amount of dry matter produced per unit
water evaporated, from all surfaces, during a specific time (Nobel, et al., 1995;
Squire, 1990). Some legumes have been shown to perform well interms of moisture
conservation. Mucuna pruriens and Canavalia ensiformis are reported to be able to
maintain soil moisture content of 46 and 72 % respectively during the early dry
season in a semi arid zone due to good ground cover and continued biomass
accumulation (Carsky and Ndikawa, 1998). In Ghana, Mucuna pruriens accumulated
13.8 t ha -1
of dry mulch with a thickness of 12.6 cm after a fallow of two seasons in a
bimodal rainfall season (Vissoh et al., 1998). When intercropped with coffee, legumes
should however be planted at least 50 cm away from the coffee plants to avoid water
competition that can lead to reduced coffee yields (Kimemia, 1998).
2.5. Weeds
2.5.1 Introduction
A weed can be defined as „a plant out of place or growing where it is not wanted‟ or
growing without the grower‟s intention or objective (Mortimer, 1990; Coffee
Research Foundation, 2003; Hakansson, 2003). Weeds are also referred to as
„volunteer‟ crop plants (Hakansson, 2003). There are over 250,000 plant species in
the world (Rao, 2000) of which about 8000 species of them behave as weeds and 250
of these are important for world agriculture (Memon et al., 2003). Weeds may be
37
classified as annual, biennial or perennial depending on their origin, habitat,
morphology and biological characteristics (Hakansson, 2003).
Annual weeds are those that come up from seed, flower, produce seed, and die in a
year or less (Hakansson, 2003). Annual weeds (herbaceous and grasses) are easier to
control because they are short lived and have shallow root systems (Coffee Research
Foundation, 2003; Hakansson, 2003). Examples of annual weeds in coffee are
Amaranthus spp, Bidens pilosa ,Tagetes minuta and (Coffee Research Foundation,
2003; Nyabundi and Kimemia, 1998). Biennial weeds complete their life cycle in two
years. During their first year these weeds form an extensive root system below the
ground and a cluster of leaves or rosette above the ground. Control of biennials is
most effective in their regenerative phase before seed set during the first year
(Hakanson, 2003). Perennial weeds live for three or more years and produce seeds
and extensive root system which may include underground rhizomes, tubers, or bulbs
(Hakansson, 2003) which sprout again when not fully uprooted or destroyed making
them difficult to control (Coffee Research Foundation, 2003). Examples of perennial
weeds in coffee are Digitaria abbisinica (Couch grass), Commelina benghalensis
(Wondering Jew), Cyperus rotundus L.(Nut grass), Cynondon dactylon (Star grass)
Oxalis latifolia (Wood sorrel), Pennisetum clandestinum (Kikuyu grass) (Coffee
Research Foundation, 2003; Nyabundi and Kimemia, 1998).
Weeds pose potential threat to crop production. Mortimer (1990) identified three
categories of financial losses due to weeds in crop production systems; namely
production inefficiency, commodity yield reduction and loss of commodity price.
Commodity yield reduction is caused by reduced components of crop yield through

38
competition; weed parasitism, pest and disease infestation where weeds act as
alternate hosts. This is exacerbated by the fact that weeds are very prolific in
multiplication and excessively competitive for soil moisture and nutrients (Clay et al.,
1990; Mortimer, 1990). Competition for nutrients by weeds can be seen in the amount
of minerals they accumulate in their tissues. Cyperus rotundus is reported to
accumulated 2.17 N, 0.26 P2O5 and 2.73 K2O in its tissues and Commelina
benghalesis accumulated 2.02 N, 1.46 P2O5 and 1.86 K2O (Gupta 1998) indicating
that they had drawn these nutrients, which would have otherwise been available for
crop use from the soil.
Effects of weeds on coffee include water stress during dry spells, deficiencies of
essential elements, reduction in yield and quality (Coffee Research Foundation,
2003). Yield losses due to these effects can be over 50% (Coffee Research
Foundation, 2003). Production inefficiency is attributed to increased time and labour
in weed control, crop damage in the application of weed control agents and
interference with other management practices such as spraying, pruning and
harvesting. Commodity price loss is caused by lowered produce quality through
contamination and poor appearance (Mortimer, 1990).
2.5.2 Weed control methods
Weed control is defined as the activities and modifications of measures or conditions
in the cropping system intended to reduce weed populations (Hakansson, 2003). One
of the major challenges in weed control is reducing the amount of propagules (seed
and or vegetative) in the soil or their regeneration after weeding (Hakansson, 2003;
Kelton et al., 2011). Germination of weed seeds from the seed reserve in the soil

39
depends on the availability of adequate moisture, adequate oxygen, a favorable
temperature range and light (Rao, 2000). These factors plus availability of adequate
nutrients, competition with other plants and applied weed control measures influence
the germination and development of weed seedlings (Kropff, 1993b; Rao, 2000).
Weeds have an adaptation mechanism to produce large numbers of seeds and other
propagules that make them persist in the fields sustaining weed population from year
to year (Clay et al., 1990; Kelton et al., 2011). The cropping system, cultural practices
and weed control methods adopted can determine weed seed population because they
influence weed seeding and therefore their soil seed bank (Hakansson, 2003; Kelton
et al., 2011).
The choice of weed control method depends on its effectiveness and economic
advantages associated with it (Traoré et al., 2001). To attain efficient weed control,
the choice of control methods needs to be based on objective assessment of weed
effects and crop requirements, without neglecting the cost of the treatments available
(Clay et al., 1990). The most commonly practiced weed control methods include
manual, mechanical cultivation and use of herbicides (Robinson, 1990) or integrated
weed management (IWM). Integrated weed control involves the use of a range of
weed control techniques embrasing physical, chemical and biological methods in an
integrated manner without excessive reliance on any one method (Bayer Crop
Science, 2009). The purpose of IWM is to reduce weed pressure and keep weeds
below their economic thresholds while minimizing negative impacts on the
environment (Coffee Research Foundation, 2003; Bayer Crop Science, 2009).

40
Manual weed control involves the use of handhoes such as the heavy blanded hoe
(Jembe), forked Jembe and Panga which are most widely practiced by small-scale
farmers for weed control in coffee among other crops (Coffee Research Foundation,
2003; Robinson, 1990). A major limitation of this method is that it is not very
effective in dealing with weeds growing close to the crop and may result to physical
injuries on coffee stems and lateral roots (Nyabundi and Kimemia, 1998). The
weeding operations need to be repeated several times during the growing season,
which is expensive. Mechanical weed control involves the use of tractor mounted
implements such as rotary or tined cultivators in large coffee estates where the manual
weeding would require a large labour force (Coffee Research Foundation, 2003).
Chemical control of weeds involves the use of herbicides. Herbicides can be defined
as crop-protecting chemicals used to kill weeds (Lingenfelter and Hartwig, 2007).
Herbicides provide a convenient, economical and effective way of managing weeds.
Use of herbicides enhances minimum tillage leading to reduction in soil erosion,
allows earlier planting dates and provides additional time to perform the other tasks
because it is time saving (Lingenfelter and Hartwig, 2007) . Herbicides should
however be used with caution because they are hazardous to man and the environment
when used or disposed inappropriately. Their residues contaminate the environment
especially when they infiltrate into ground water and water reservoirs like rivers and
lakes (Food and Agricultural Organization, 2000). This adds to costs of government
abatement programs against environmental pollution.
Herbicides can be classified into several ways based on their weed control spectrum
(selective or nonselective), labeled crop usage, chemical families, mode of action and

41
application timing/ method (Lingenfelter and Hartwig, 2007). For example based on
mode of action and site of action herbicides are grouped according to contact and
systemic herbicides. Contact herbicides kill only the plant parts contacted by the
chemical, whereas systemic herbicides are absorbed by the roots or foliage and
translocated throughout the plant. Herbicide activity can be either selective or
nonselective. Selective herbicides are used to kill weeds without significant damage to
desirable plants. Nonselective herbicides kill or injure all plants present if applied at
an adequate rate. Use herbicides require skills because they are crop specific and have
to be applied at recommended rates, times and methods. Use of herbicides has
different effects on weed re-growth compared to mechanical methods. The effect of
loosened soil due to hand weeding may encourage fresh germination of weeds (Traoré
et al., 2001). This is not expected with chemical control since there is no soil
disturbance.
2.5.3 Suppression of weeds by legume cover crops
Compared to conventional farming which is characterized by high external inputs,
organic farming and or use of organic amendments is cheaper and safer, making it an
appropriate and sustainable option for farmers that have a low resource base. Organic
farming and or organic amendments involve the use of biological resources that
include legume cover crops (LCC) for weed control (Khisa, 2000). In Nigeria,
legumes cover crops (especially Mucuna spp) have been used as „live mulch‟ to
maintain soil cover thus controlling both weeds and soil erosion (Giller, 2001). When
slashed back after maturity, their residues prolong the duration for soil cover and
weed control (Muller and Kotschi, 1997).

42
Key factors that facilitate effective weed suppression by LCCs include their ability to
develop fast ground cover, their twining ability and allelopathic properties for some
legumes (Vissoh et al., 1998; Giller, 2001). These properties vary from species to
species. Lablab and mucuna are suitable for weed control because of their high
biomass production, good ground cover and twining ability (Giller, 2001; Mureithi et
al, 2003). Mucuna can reach 100% ground cover in 60- 90 days after planting (Carsky
and Ndikawa, 1998; Abayomi et al, 2001). Canavalia can reach flowering in 59 to
109 days and attain substantial ground cover there after. Compared to mucuna,
Canvalia is not a good weed suppressor (Gachene and Kimaru, 2003) because it has
an erect canopy and does not cover the ground quickly.
Mucuna has been used to rehabilitate fields formally abandoned because of degraded
soils or excessive weed infestation (Peden, 1998). Studies in Benin show that mucuna
reduced Imperata weed to less than 10% of its initial density on farmers‟ fields while
spear grass density dropped from 270 shoots m-2
to 32 shoots m-2
and completely
eliminated spear grass only after two to three consecutive mucuna crops (Vissoh et
al., 1998). Compared to other methods of controlling the Imperata weed, mucuna was
the most effective mainly because of its substantial biomass production. Its foliage
completely covers the soil and strangles all the weeds as it can climb as high as its
support allows (Vissoh et al., 1998). At the end of its life cycle mucuna leaves thick
mulch free of weeds (Vissoh et al., 1998). This has the benefit that little or no land
preparation or weeding may be required in the subsequent season.

43
2.6. Research gaps
Legume cover crops have great potential in soil fertility improvement and weed
control and provision of food and fodder in different cropping systems including
plantation crops like coffee (Giller, 2001; Mureithi, et al.2003; Maina et al., 2006).
Intercropping coffee with legume cover crops in Kenya has not been widely practiced
since intercropping coffee with other crops was prohibited by law (Coffee Act Cap
333) until it started recently (Kimemia, 1998; (Nyangito, 2001) indicating that few
studies have addressed coffee intercropping. Some research involving coffee
intercrops with legume cover crops has been done (Maina et al., 2006) but there is
still no exhaustive information on performance of these legumes under coffee.
In particular, more information on the performance of individual legumes in terms of
their growth, use of both above (light) and below ground resources (water and
nutrients) for biomass production and ground cover for weed suppression under
coffee needs to be generated. Knowledge on performance of legumes under coffee
can form a basis for recommending better husbandry practices for production of
organic coffee that has an increasing demand in world coffee markets (Van der
Vossen, 2005). Some legume cover crops such as lablab, soyabean and mucuna are
potential sources of livestock feed and human feed (Mureithi, et al.2003; Bunch and
Buckles. 1998). Their contribution to food and feed supply when intercropped with
coffee requires investigation especially from the small holder point of view. In
addition, the possibility of legume cover crops contributing to cash savings through
reduced manual and mechanical weeding, inorganic fertilizer inputs and alternative
food and feed provisions qualifies further investigations on use of these legumes in
coffee systems.
44
CHAPTER 3
MATERIALS AND METHODS
3.1 Experimental site
The study was conducted at the University of Nairobi Kabete Field Station, latitude
01o
15‟ S and longitude 36o44‟ E at altitude of 1940 m above sea level. It receives an
average annual rainfall of 1006 mm (Karuku, 2011). The rainfall pattern is bimodal
with the long rains in March to June and short rains in October to December. The
mean annual temperature range is 13 o
C -23oC. Average humidity is 70%. The soils
are humic nitosols, deep and well-drained with a pHwater of 6.5 (Karuku, 2011).
3.2 Experimental design
The experiment was conducted between March and October 2005. The legumes were
sown as sole crop and intercropped with mature coffee (variety SL28) established in
1930 at a spacing of 2.74 m by 2.74 m. Eleven legume species were sown on 24th
March 2005 in furrows at recommended spacing (Table 3) with 1 and 2 plants per hill
for small and large seeded legumes respectively. The number of rows per plot varied
from 4 to 8 for large and small seeded legumes, respectively.
The experiment design was randomized complete block design (RCBD) and
replicated three times. Intercrop plots were 1.5 m wide and 5 m long, each surrounded
by 6 coffee plants. Spacing between each plot was 2.74 m. The coffee plots that were
intercropped with legumes measured 100 x 54 cm. A separate plot with sole legumes
was established adjacent to the coffee- legume intercrop. Unweeded plots were
maintained throughout the experiment in the sole and intercrop systems.

45
Table 3. Names and spacing of legume cover crops evaluated
Scientific name Common name Abbreviation Spacing (cm) Category Duration months
1 Glycine max Soya bean variety 4 Sy4 50 x 5 Short duration annual 2.5 - 4
Glycine max Soya bean variety 17 Sy17 50 x 5 Short duration annual 2.5 - 4
2 Phaseolus vulgaris Mwitemania bean Be 50 x 5 Short duration annual 3 -3.5
3 Phaseolus coccineus Butter bean Bu 50 x 20 Short duration annual 3.5 - 5
4 Crotalaria ochroleuca Tanzanian sunnhemp Cr 30 x drill Short duration annual 4 - 5
5 Vicia benghalensis Purple vetch Vi 30 x drill Short duration annual 4 - 8
6 Lablab purpureus Dolichos lablab (brown) Do 60 x30 Medium duration annual 4 - 5
7 Mucuna pruriens Velvet bean (mottled) Mu (m) 60 x30 Medium duration annual 4 - 8
Mucuna pruriens Velvet bean (gray) Mu (g) 60 x30 Medium duration annual 4 - 8
8 Canavalia ensiformis Jack bean Ca 50 x 50 Medium duration annual 4 -5
9 Neontonia wightii Neontonia Ne 30 x drill Perennial > 5
10 Desmodium intortum Green leaf desmodium GD 30 x drill Perennial > 5
11 Desmodium uncinatum Silver leaf desmodium SD 30 x drill Perennial > 5

46
Figure 1. Field layout of coffee – legume intercrop.
Key:
Be - Mwitemania bean Mu (g) - Mucuna grey
Bu - Butter bean Mu (m) - Mucuna mottled
Ca – Canavalia Ne - Neontonia
Co – Control (sole coffee) SD - Silverleaf desmodium
Cr – Crotalaria Sy4 – Soyabean 4
Do – Dolichos Sy17 - Soyabean 17
GD - Green leaf desmodium Vi - Purple vetch
Note: The controls for sole and intercrop systems were uncropped plot (without legumes) and sole coffee respectively
Block 1 Be Ca Mu (g) GD Bu Mu (m) Co Vi Sy4 SD Ne Cr Sy17 Do
Block 2 Co Mu (g) GD Mu (m) Cr Do Be Sy17 Ca Sy4 Vi SD Ne Bu
Block 3 Cr Ne Sy17 Mu(m) Bu Mu (g) GD Be SD Co Sy4 Do Vi Ca

47
3.3 Data collection and analysis
3.3.1 Legume growth, phenological development and biomass production
Legume growth and development was monitored. This included days to 50%
emergence, anthesis, 50% flowering, 50% podding, seed set and physiological
maturity. Canopy height was measured using a meter rule on seven randomly
selected plants. Grain legumes were harvested, threshed and the grain weighed. The
harvesting dates were between 30th
May 2005 and 18th
July 2005 depending on time
to maturity.
Grain legume dry matter (DM) accumulation was determined at 4, 10 and 12 weeks
after planting (WAP) while that of the perennial legumes extended to 10, 16, and 24
WAP. The fresh mass of three randomly selected plants was determined and a sub-
sample dried at 105oC to constant mass to determine dry matter content. Litter was
collected for canavalia, desmodium, mucuna, vicia, neontonia and crotalaria in a
0.25m2
quadrant placed randomly in the sole and intercropped legumes at 17th
and 24th
WAP. Litter for dolichos and butter bean was collected at 17 WAP. The litter was
oven dried at 105oC to constant mass and weighed. Legume yield was determined
from the entire plots of each food legumes. Total dry matter (TDM) accumulated by
the food legumes (dolichos and butter bean) was determined at 17 WAP and at 24
WAP for non food legumes.
3.3.2 Interception of photosynthetically active radiation (PAR)
The photosynthetically active radiation (PAR) intercepted by the canopy was
measured using a sunfleck ceptometer (SF-80 Decagon, Pullman, Washington). The
ceptometer was randomly placed perpendicular to the rows above and below each

48
legume between 11.30 am and 1.30 pm (local time). Seven measurements were taken
in each plot after every 2 weeks. Three ceptometer measurements were taken in the
intercrop system; one above coffee canopy, another above the legume but below the
coffee and the third one below the green area of the legume. The PAR intercepted was
calculated by subtracting the ceptometer reading below the legume canopy from the
ceptometer reading above the canopy.
% PAR intercepted = {(PARa –PARb) / PARa}* 100
Where: PARa = PAR above legume canopy and
PARb = PAR below legume canopy
3.3.3 Soil moisture
Soil water content (SMC) was determined gravimetrically at 0-25, 25-50, 50-75, and
75-100 cm in sole and intercropped legumes at 11 and 30 weeks after planting. The
soil samples were obtained from these depths by use of a soil auger and oven dried
separately at 105 oC for 24 hours. Soil moisture content was determined by
subtracting the weight of oven dried soil sample from that of the fresh soil sample
divided by weight of the dry soil sample.
% SMC = (Sw –Sd) / Sd x 100
Where: Sw = Weight of wet soil
Sd = weight of dry soil
The soil moisture content was used to determine soil moisture conservation and
extraction by sole and intercropped legumes

49
3.3.4 Weed density and biomass accumulation
Weed density was determined at 7 and 24 WAP by counting the individual weed
species within a 0.25 m2
quadrant. Weeds were cut and oven dried at 105oC to
constant mass.
All data was analyzed using the Genstat statistical computer package (GenStat
Release 7.2, Copyright 2002, Lawes Agricultural Trust (Rothamsted Experimental
Station) and significant means separated using least significant difference (LSD)
tested at 5% probability.

50
CHAPTER 4
RESULTS AND DISCUSSION
4.1 Experimental site characteristics
4.1.1 Rainfall and temperature
Rainfall (mm) and mean maximum and minimum temperature (o
C) were obtained
from a meteorological station from the farm over a period of nine months. Mean
maximum temperature varied from 20.1 to 25.8 o
C. Mean minimum temperatures
during the growing period ranged between 14.4 to 15.1 o
C (Figure 2a). The total
amount of rainfall received during the experiment period of 30 weeks was 894.8 mm.
A total 830.3mm (93 %) was received during the first 14 WAP with a peak of 154
mm at 9 WAP. Weekly rainfall remained below 25 mm between 15 to 30 WAP
(Figure 2b).
Figure 2. (a) Average weekly mean maximum and mean minimum temperature (o
C)
distribution and (b) total weekly rainfall (mm) at the Kabete Field Station farm.

51
All the legumes were sown on the same day to allow their growth at same temperature
and rainfall regimes.
4.1.2 Soil moisture content
Soil moisture content was measured in plots of sole and intercropped mucuna,
desmodium, Neontonia and crotalaria at 11 and 30 WAP (Figure 3). Average soil
moisture content was significantly higher by 8 % at 11 WAP compared to 30 WAP
due to input from rainfall during the first 14 WAP. At 11 WAP the soil moisture
content was comparable in all treatments and at all depths but differences were
apparent by 30 WAP (Figure 3). This was attributed to low rainfall between 15 to 30
WAP, direct soil water evaporation and plant uptake contributed to decline in soil
moisture (Figure 3). Soil water content variation was more apparent under sole
legumes compared to those intercropped with coffee between 11 and 30 WAP.
Differences in soil moisture content among legumes and between sole coffee and
coffee – legume intercrops indicated variations in legume ground cover (life and dead
mulch) and extend of soil moisture conservation or extraction. For example, high soil
water content under mucuna may be attributed to its maintained high ground cover (>
90 %) and its comparatively high seasonal litter fall between 11 and 30 WAP. Both
live and dead mulch of mucuna, desmodium, Canavalia ensiformis and Neontonia
may have reduced direct evaporative water loss from the soil. This resulted in high
soil moisture in plots long after rains subsided between 15 to 30 WAP enabling these
legumes to survive soil moisture stress over this period. The difference in the amount
of litter among the legumes may have influenced water loss through evaporation.
Intercropped Mucuna had the highest amount of litter (748 kg/ha) compared to

52
Neontonia (115 kg/ha) and the soil water content higher (31 %) at upper soil depths
compared to that of Neontonia (25 %) at the same depth indicating that more litter
mulch resulted in greater soil moisture conservation. Soil water change was
influenced by direct evaporative loss (controlled by litter) and also uptake by roots
(McIntyre et al., 2001)
Soil water content in sole coffee plots was higher by 26 % compared to that in the
uncropped plots at 25 cm soil depth. This was indicative that coffee shading probably
reduced temperatures and reduced wind speed, leading to reduced soil water
evaporation hence the higher soil moisture content at that depth, but was comparable
at 50 cm at at 30 WAP (Figure 3). It was however significantly lower in the coffee-
legume intercrop plots compared to that in sole coffee and varied among the
intercropped legumes. Average soil moisture content in plots with sole and intercrop
legumes was generally lower in the upper (< 50cm) compared to the lower depth (75
and 100cm) but was apparent among individual legume species at all depths at 30
WAP. This may be attributed to high water extraction rate due to high concentration
of both legumes and coffee roots at this depth. The greatest coffee feeder and lateral
root concentration is in the first 20 and 30 -45 cm respectively (Coffee Research
Institute, 2006).
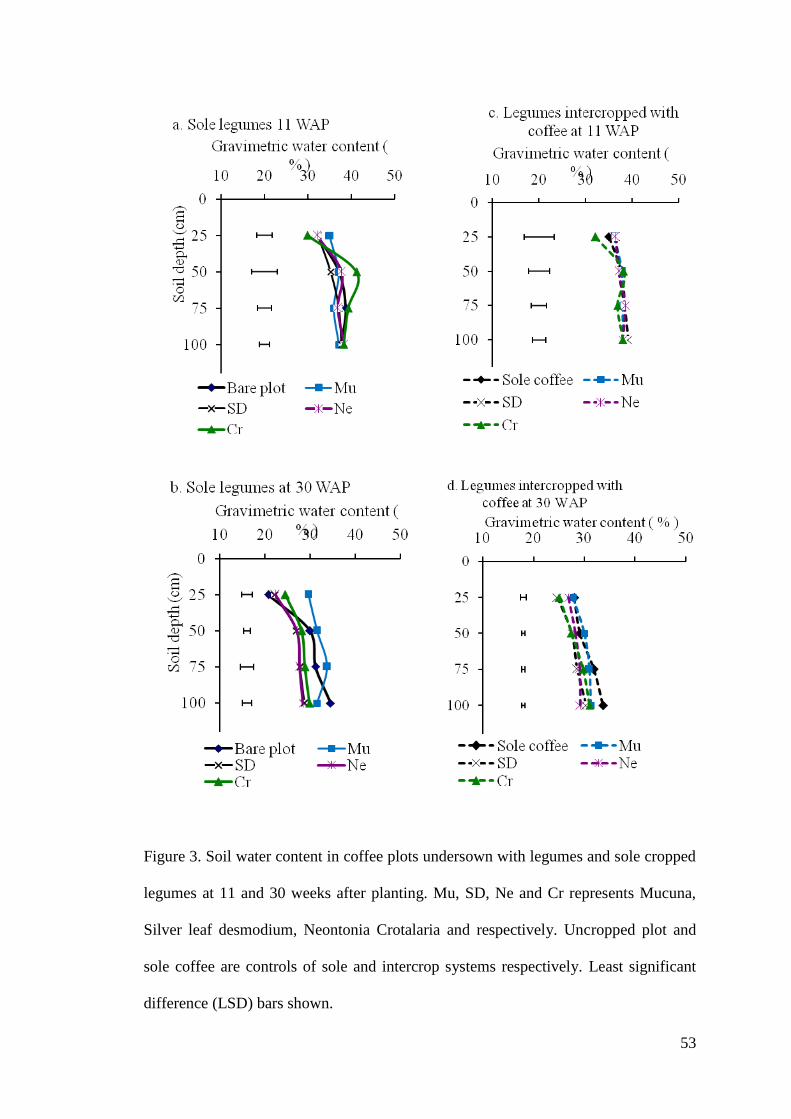
53
Figure 3. Soil water content in coffee plots undersown with legumes and sole cropped
legumes at 11 and 30 weeks after planting. Mu, SD, Ne and Cr represents Mucuna,
Silver leaf desmodium, Neontonia Crotalaria and respectively. Uncropped plot and
sole coffee are controls of sole and intercrop systems respectively. Least significant
difference (LSD) bars shown.
54
Average soil moisture content in plots under mucuna was significantly higher than
silver leaf desmodium and Neontonia by 15 % at upper soil depths (<50 cm) and by
10 % at lower depths (> 75 cm) at 30 WAP. Mucuna, silver leaf desmodium,
crotalaria and Neontonia had low soil moisture content below 50 cm indicating that
their roots may have reached and taken up water at this depth at 30 WAP (Figure 3).
Mucuna and crotalaria have the ability to extend roots into the subsoil (65 cm) and
take up residual soil moisture leading to decreased soil moisture overtime at that
depth (Gachene et al., 2000). Understanding the differences in root depth between
coffee and intercropped legumes is important because it may provide an avenue for
selecting the most complementary legumes for intercropping with coffee that
minimize competition for water and nutrients and therefore increase productivity in
coffee farms. Overall, soil water content was highest in plots planted with mucuna
followed by crotalaria, silverleaf desmodium and Neontonia and varied with depth
among these legumes. This showed that the legumes differed in soil moisture
conservation and extraction.
4.2 Physiological basis of legume phenological characteristics
4.2.1 Legume establishment
Legume establishment and growth was good due to favorable weather conditions but
varied among the legume species. Intercropping did not significantly affect time to
emergence, 50 % flowering and podding significantly (Table 4). Small seeded
legumes (desmodium, crotalaria and Neontonia) germinated better than medium
(Mwitemania and soya bean) and large seeded legumes (mucuna, canavalia, and
Butter bean) (Table 4) probably because they comparatively require less moisture to

55
germinate (Njarui et al., 2003). Generally all the legumes had regular to high shoot
vigor (Table 4).
High shoot vigor and rate of seedling growth observed in the medium and large
seeded legumes compared to small seeded legumes was probably due to availability
of adequate food reserves (assimilates) in the large seeds (Gunaga, 2008). Seedling
vigor was also attributed to legume genotypic characteristics such as seed size (Hojjat,
2011) Canavalias‟ fast establishment within 4 WAP was comparable to observations
made by Gitari et al., (2000) where canavalia established faster than the other
legumes.
4.2.2 Legume phenological duration
Phenological duration (time to emergence, anthesis, 50 % flowering, 50 % podding
and physiological maturity) generally varied significantly between legume species
and not between cropping system (Table 4). Soyabean emerged earliest (6.3 DAP)
among food legumes and desmodium among non food legumes (14 DAP). Neontonia
emerged last (20.5 DAP).

56
Table 4. Early seedling vigor and duration of phenological stages of legumes
Legume Early seedling vigor Time to 50 % (in Days)
Emergence Anthesis Flowering Podding Physiological maturity
Mwitemania bean 4.0 12.7 37.3 39.8 48.2 92.7
Butter bean 4.0 12.5 35 40.3 47.8 96
Soyabean4 4.0 6.3 69.8 74 78.1 101.8
Soyabean17 4.0 6.2 75.5 78.8 80.7 89
Dolichos 3.7 8.8 80.3 98.3 114.3 156
Mucuna (grey) 3.7 15.5 99 105 111 -
Mucuna (mottled) 3.5 15.8 101.5 109.2 114 -
Crotalaria 3.7 11.7 97.7 113.5 129 -
Vicia benghalensis 3.3 15.0 152 159.7 168.5 -
Silver leaf desmodium 3.7 15.3 75.5 - - -
Green leaf desmodium 3 14.8 - - - -
Canavalia 3.7 13.0 - - - -
Neontinia 3.2 20.5 - - - -
Fpr <0.001 <0.001 <0.001 <0.001 <0.001 <0.001
L.S.D 1.82 0.49 1.367 1.4 1.572 2.971
CV % 12.1 11.6 1.4 1.3 1.4 2.3
Shoot vigor: scale 1, 2, 3, 4 and 5 represents very bad, low, regular, high and excellent respectively.
57
Differences in the length of phenological stages of legumes at the vegetative stage
(emergence to 50 % flowering) and reproductive stage (50 % flowering to
physiological maturity) may be attributed to differences in thermal duration in degree
days (Mburu, 1996; Elmore, 2010). The vegetative stage of common beans, soya
beans, Dolichos and was 424o
C, 629 o
C and 708o
C days accumulated over 37, 70,
and 80 days, respectively, while the reproductive stages were 974o
C, 838o
C and
1190o
C days accumulated over 93, 102 and 156 days respectively (Table 5). This was
similar to Soya bean and Dolichos that took to 72 (Wanjekeche et al., 2004) and 117
DAP (Abayoni et al., 2001) to flower, respectively. Legume flowering time and seed
filling stages are important because they coincide with the peak of biological nitrogen
fixation which is important for soil fertility improvement (Ennin et al., 2004; Liu et
al., 2011).
The earliest maturing (89 - 102 days) were annual grain legumes (Soya beans,
mwitemania and butter bean) compared to medium maturing legumes such as
Dolichos (116 days). The reproductive stage marks the seed production time for grain
crops (Nordby, 2004). Physiological maturity of perennial legumes could not be
established because the experiment was terminated (210 DAP) before these legumes
reached seeding. Perennial legumes (Neontonia and Desmodiums) were considered as
late maturing based on their perennial nature. The results showed that thermal time
influenced legumes phenological stages. Knowledge of phenological stages such as
flowering (peak time for BNF activity) is important especially when legumes are
grown for soil fertility improvement. Similarly, timing physiological maturity is
important when grain legumes for food.

58
Table 5. Relationship between food legume phenological stages and accumulated
thermal time o C days since zero days after planting to physiological maturity
Phenological stage
Accumulated thermal time (o
C days)
Bean (Tb =8)* Dolichos (Tb = 9.9)$ Soyabean (Tb= 10)
#
Emergence 147 95 63
Anthesis 424 708 629
50 % flowering 457 829 658
50 % podding 544 927 687
Physiological maturity 974 1190 838
Tb is base temperature (o C): Source; *(Mburu, 1996),
$(Awadhwal et al., 2001) and
# (Elmore, 2010)

59
4.2.3 Legume growth
The canopy height of the erect and determinate legumes (bean, soyabean and
crotalaria) increased overtime in both sole and intercropped systems and varied
significantly among legume types but not among cropping systems within species
(Figure 4). Bean canopy height increased significantly at 4 and 6 WAP but not
thereafter. Sole and intercropped mwitemania canopy reached maximum height of 60
cm at 10 WAP respectively while intercropped soyabean 4, soyabean 17 and
crotalaria had maximum canopy of 49, 64 and 108 cm respectively at 14 WAP
(Figure 4).
Figure 4. Canopy height of determinate legumes: Sy4, Sy17, Be and Cr represents
soyabean4, soyabean17, bean and crotalaria respectively. Least significant difference
(LSD) bars shown.
The height of canopy of Mucuna, butter bean, , Lablab purpureus, Neontonia wightii
(climbing and creeping legumes), Desmodium uncinatum, Desmodium intortum Vicia
benghalensis (creeping) and Canavalia ensiformis (erect) was not measured but from
intercepted PAR observations (Figures 4 a and 4 b), these legumes had established

60
considerable canopy at 14 WAP (Plate 1). Crotalaria established a high canopy
quickly posing a light competition challenge making it suitable for intercropping with
coffee if grown when coffee is not ready for picking or if it is slashed back to provide
mulch. The climbing legumes (such as mucuna) were trained not to entangle the
coffee canopy. Plant (canopy) height is a major resource use factor when determining
intercrop suitability.
(a) (b)
(c )
Plate 1: Intercropped legumes with over 90 % canopy cover at 14WAP: (a) Dolichos
(an annual food legume), (b) Desmodium (perennial non food legume), (c) Mucuna
(creeping annual legume) and (d) Crotalaria (erect annual legume)
(d )
61
4.3 Physiological basis for legume biomass accumulation
4.3.1 Canopy PAR interception overtime
Canopy photosynthetically active radiation (PAR) interception differed significantly
within legume species and among sole and intercropped legumes. Coffee canopy
intercepted approximately 41 % of the incident PAR largely due to its planophile
canopy leaving 59 % of the total incident PAR was available to the intercropped
legumes. Consequently, canopy PAR interception by sole legumes was significantly
higher than in the coffee – legume intercrop throughout the growing season (Figure 5
a and 5 b). Differences in PAR interception may be attributed to variations in legume
duration and growth habits (erect or spreading). Legumes with high ground cover
(crotalaria and silver leaf desmodium) intercepted more PAR compared to those with
low ground cover (canavalia and Neontonia). Intercepted PAR in all the legumes
increased with time and either leveled off or decreased where leaf abscission
occurred.
All legumes had attained over 90 % PAR by 12 WAP except Neontonia and canavalia
(both comparable) that attained the same at 16 WAP (Figure 5 a and 5 b). Short
duration food legumes established faster and reached peak % PAR interception earlier
than medium duration annual and perennial legumes. The PAR interception for short
duration annual legumes (bean, soyabean, crotalaria and Vicia) increased linearly
during the vegetative phase (within 8 WAP) and declined at the reproductive after 10
WAP (Figure 5 a). The rate of PAR interception by bean and soyabean decreased at
10 and 12 WAP respectively possibly due to reduced ground cover associated with
end of the vegetative phase (leaf production), beginning of the reproductive phase

62
(pod formation) and subsequent leaf senescence at physiological maturity (Ansari and
Chen, 2011).
Mwitemania bean and soyabean reached peak radiation interception (65 % and 82 %
PAR) earliest at 8WAP and 10 WAP respectively among annual food legumes (Figure
5 a). Peak interception for intercropped mwitemania bean and soyabean 17 was 65 %
and 82% PAR respectively. Intercepted PAR for soya bean 4 and soyabean 17 were
not significantly different so only soyabean 17 is shown in Figure 5 a. Similarly PAR
interception of Dolichos and butterbean was comparable and reached peak PAR
interception latest (90 % PAR) at 14 WAP and maintained the highest % PAR
interception even after 16 WAP (Figure 5 a) among the food legumes.

63
Figure 5 a. Canopy photosynthetically active radiation (PAR) interception by sole and
intercropped annual food and non food legumes; Be, Sy17 and Do represents
Mwitemania bean, Soya bean 17 and Dolichos respectively. Cr, Vi and Mu (m)
represents Crotalaria, Vicia benghalensis and Mucuna (mottled) respectively. Least
significant difference (LSD) bars shown.
Crotalaria intercepted higher PAR compared to Vicia benghalensis and mucuna
(Figure 5 a). The rate of PAR interception of crotalaria, increased rapidly between 6

64
WAP and 12 WAP and generally slowed thereafter when the legumes reached
maximum PAR interception (Figure 5 a).
Figure 5 b. Canopy photosynthetically active radiation (PAR) interception by sole and
intercropped perennial legumes; GD, SD and Ne represent Green leaf desmodium,
Silver leaf desmodium and Neontonia respectively. Least significant difference (LSD)
bars shown.
The sole silver and green leaf desmodium intercepted comparable PAR throughout
the growing season. Intercropping reduced PAR interception of green leaf
desmodium and Neontonia wightii compared to silver leaf desmodium throughout
the growing season (Figure 5 b). The rate of PAR interception of these legumes
increased gradually between 4 WAP and 12 WAP and slowed thereafter. Sole
Neontonia wightii and green leaf desmodium intercepted over 60 % and 86 % PAR
by 10 WAP, respectively while in the intercrop they intercepted 36 % and 25%,
respectively at that time. Over all, Crotalaria, silver leaf desmodium, Vicia
benghalensis and mucuna maintained highest % PAR interception overtime

65
compared to other legumes while Neontonia wightii intercepted the least PAR
comparatively.
4.3.2 Legume dry matter accumulation overtime
The amount of dry matter (biomass) accumulated increased over time and differed
among the legumes and cropping systems (Figure 6). Differences in total dry matter
(TDM) accumulation among legumes may be attributed to variations in (mainly) the
amount and time of PAR intercepted by legumes. Amount of PAR intercepted was
determined by legumes‟ growth habits and crop management (sole-cropping and
intercropping). Legumes that grew fast (mwitemania, soyabean and crotalaria) and
those that had spreading growth habit ( butter bean, Vicia, desmodium) attained fast
ground cover hence high PAR interception (Figure 5a and 5b). This possibly led to
the observed early dry matter accumulation by these legumes (Figure 6).
Mwitemania bean accumulated the highest biomass in both sole and intercrop systems
at 10 WAP, while Dolichos had the lowest at that time. Among the non food legumes
Vicia and crotalaria (short duration annuals) accumulated DM faster than Neontonia
and desmodium (perennials). The dry matter accumulated by perennial spreading
forage legumes (desmodium, mucuna, Neontonia) was comparable at 10 WAP in both
the sole and intercrop but differenced significantly between 12 and 16 WAP when
rate of dry matter accumulation was highest, then declined gradually thereafter
(Figure 6).

66
Intercropping significantly decreased amount of DM accumulated in all legumes. This
was probably due to reduced incident PAR due to coffee shading that led to slowed
leaf photosynthetic activity in intercropped legumes, hence depressed dry matter
accumulation in these legumes compared to sole legumes. Intercropping reduced the
dry matter accumulated by Vicia and Neontonia by 83 % and 78 %, respectively and
in both silver leaf desmodium and mucuna by 69 % at 17 WAP. Overall, Crotalaria
accumulated significantly higher DM than all the other legumes in both sole and
intercrop throughout the experiment period (Figure 6).
Perennial (long term duration) legumes (Neontonia, desmodium) may have
accumulated low DM early in the season (8WAP) (Figure 6) because they intercepted
less light at that time (Figure 5 b). These legumes however, increased tremendously
in leaf ground cover (over 80 %) with time due to their spreading growth habit and
durable nature leading to high and prolonged PAR interception period ( Figure 5 b).
This resulted in high final TDM accumulation at 24 WAP. This fast increase in DM
accumulation by spreading legumes was also reported by Anthofer and Kroschel
(2005). Canavalias‟ slow rate of establishment and erect growth habit probably
contributed to low PAR interception hence slowed DM accumulation.
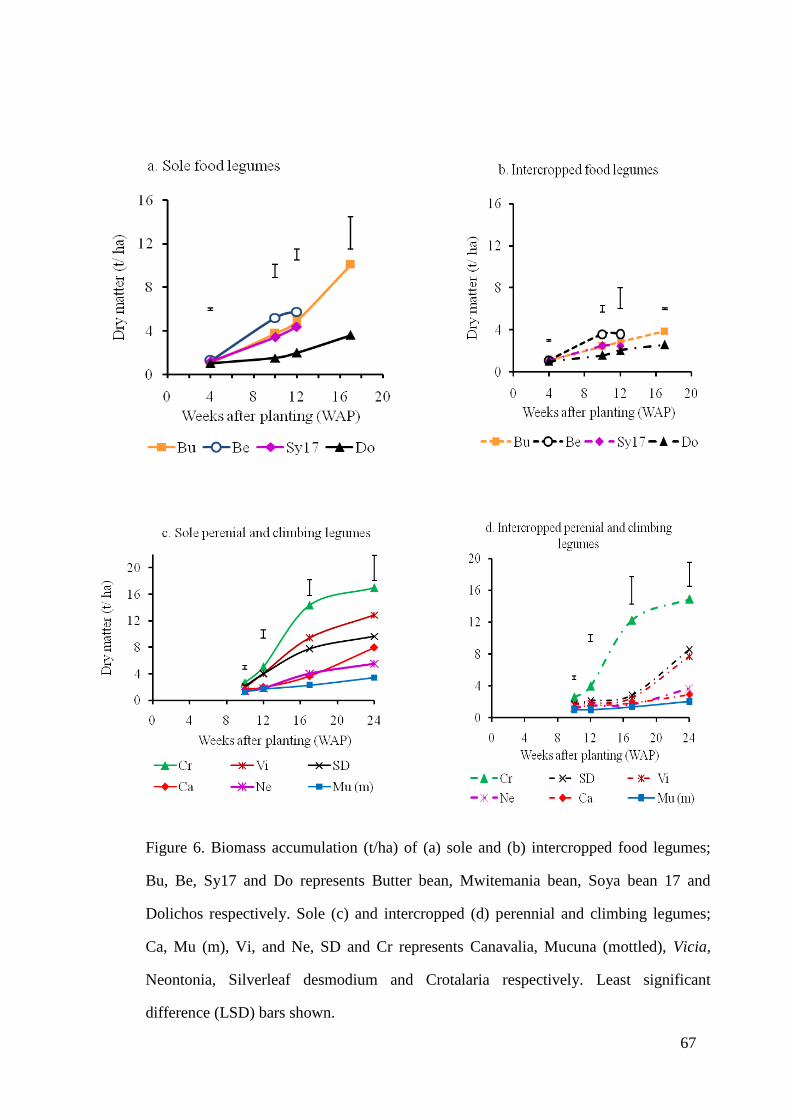
67
Figure 6. Biomass accumulation (t/ha) of (a) sole and (b) intercropped food legumes;
Bu, Be, Sy17 and Do represents Butter bean, Mwitemania bean, Soya bean 17 and
Dolichos respectively. Sole (c) and intercropped (d) perennial and climbing legumes;
Ca, Mu (m), Vi, and Ne, SD and Cr represents Canavalia, Mucuna (mottled), Vicia,
Neontonia, Silverleaf desmodium and Crotalaria respectively. Least significant
difference (LSD) bars shown.

68
Intercropped silver leaf desmodium accumulated high dry matter overtime possibly
because it was resistant to coffee shading (Kanton and Dennett, 2004) since sole and
intercropped silver leaf desmodium peak PAR interception and accumulated TDM
were comparable (Tables 7 and 16). Crotalarias‟ height corresponded with high
biomass accumulation compared to other legumes. This implied that even when
intercropped, it captured more radiation energy due to its heght, thereby making it a
better use of incident radiation in the intercrop comparatively (Kanton and Dennett,
2004). Differences in soil moisture content (Figure 3) among sole and intercropped
legumes may also have affected TDM accumulation. Lower soil moisture content and
low accumulated DM in the intercrop compared to that in sole system (Figure 3)
indicated that the intercropped legumes may have experienced competition for water
and possibly nutrients (Famaye, 2004), leading to less legume biomass accumulation
by these legumes.
These results showed that radiation capture and effective legume dry matter
accumulation among legumes and between sole and intercrop systems was mainly
influenced by amount of incident radiation, leaf area index (canopy ground cover) and
leaf area (photosynthetic) area duration. Both canopy cover and duration are depended
on the growth habits (morphology) and phenology of a plant (Kanton and Dennett,
2004). The amount of foliage in the plant canopy is commonly quantified by leaf area
index (LAI) (Breda, 2008) which is an important measure of the primary sites of
energy and mass exchange in plants upon which canopy interception,
evapotranspiration, and gross photosynthesis take place (Fang and Liang, 2008). LAI
determines net primary production, water and nutrient use, and carbon balance in
plants and consequently dry matter accumulation (Breda, 2008).

69
4.3.2 Seasonal litter fall
The total amount of litter collected by the end of the season differed significantly
among legumes and between the sole and intercrop systems. Silver leaf desmodium
had the lowest seasonal litter among the legumes probably because it is a perennial
legume and its leaves have a long life span than the annual legumes. It thereby
retained much of its foliage. Mucuna was better in mulch (litter) supply compared to
other legumes (Table 6), probably because of its genetic self shedding characteristics.
This suggested mucuna would be a competitive option for soil fertility improvement
in coffee farms because its high amount of litter provided mulch on the soil and this
may have preserved soil moisture, provided soil organic matter and suppressed weeds.
On average, the litter in intercropped legumes was lower by 42 % compared to that in
sole legumes (Tables 6 and 7). This difference may be attributed to slowed leaf
senescence probably due delayed leaf physiological maturity associated with low
PAR interception in the intercrop. Intercropping significantly reduced the litter of
mucuna, Dolichos and butter bean but did not significantly affect litter from the other
legumes. Cessation of leaf photosynthetic activity in mucuna and physiological
maturity in Dolichos and Butter bean was likely the main reason for leaf senescence
leading to high litter fall in these legumes. The litter from sole and intercropped
crotalaria, desmodium, Vicia and Neontonia was comparable but significantly lower
than from canavalia. The amount of litter from Dolichos was significantly higher than
that from butter bean in both sole and intercrop (Table 7).
4.3.3 Legume Seasonal litter and total dry matter (TDM) accumulation
Total dry matter (TDM) accumulation differed significantly among legume species
and between sole and intercropped systems. Among the food legumes butter bean had

70
the highest biomass followed by mwitemania bean (Table 6). Crotalaria accumulated
the highest TDM followed by silverleaf desmodium, Vicia benghalensis and green
leaf desmodium among non food legumes (Table 7). Overall, crotalaria accumulated
the highest TDM. Intercropping significantly reduced TDM of canavalia, green leaf
desmodium, mucuna and Vicia benghalensis but had no significant effect on
crotalaria, Neontonia and silver leaf desmodium (Table 7). On average, intercropping
reduced TDM production of butter bean and Dolichos by 78 % and 55 %, respectively
but had insignificant effect on TDM of soyabean and mwitemania bean. Silver leaf
desmodium had the lowest TDM reduction compared to other legumes (Table 7).
Legumes with high seasonal litter fall had comparatively low TDM accumulation.
Mucuna had the highest seasonal litter fall in both cropping systems but had the
lowest TDM accumulation compared to other non food legumes (Table 7). Among the
food legumes, sole Butter bean had significantly higher TDM than Dolichos but had
significantly lower seasonal litter fall compared to that of Dolichos in both systems
(Table 6). Relative TDM yield varied among the legumes species. Soyabean and
butter bean had the highest and lowest relative TDM respectively, among food
legumes (Table 6). Silverleaf desmodium and crotalaria had higher relative TDM
yield compared to mucuna among non food legumes (Table 7). Litter fall to TDM
ratio differed significantly among legumes. On average mucuna and crotalaria had the
highest and lowest litter fall to TDM ratio respectively (Table 7).

71
Table 6. Seasonal litter fall, total dry matter (TDM), relative TDM yield and % TDM reduction for food legumes
Food legumes Seasonal litter fall
(kg/ha)
TDM
(kg/ha)
Relative litter
yield
Relative
TDM yield
% TDM
reduction
Sole crop Inter crop Sole crop Inter crop Sole crop Inter crop
Soyabean4 - - 2525 1720 - - 0.68 32
Butter bean 588 274 10675 2331 6 12 0.22 78
Mwitemania bean - - 4228 2586 - - 0.61 39
Dolichos 1158 635 3785 1685 31 38 0.45 55
Soyabean17 - - 2422 1477 - - 0.61 39
Fpr 0.007 0.113 0.043 0.260
LSD 205 572.1 6349.8 1787.6
CV % 6.7 35.8 25 25.3
Note: - HI for soya beans and mwitemania bean was calculated using legume final biomass only because seasonal litter fall
for these legumes was not collected.
- Relative litter yield is the proportion of litter to TDM calculated as follows; (Litter fall / TDM) x 100
- Relative TDM yield is the ratio of the TDM of intercropped legumes to the TDM of sole legumes
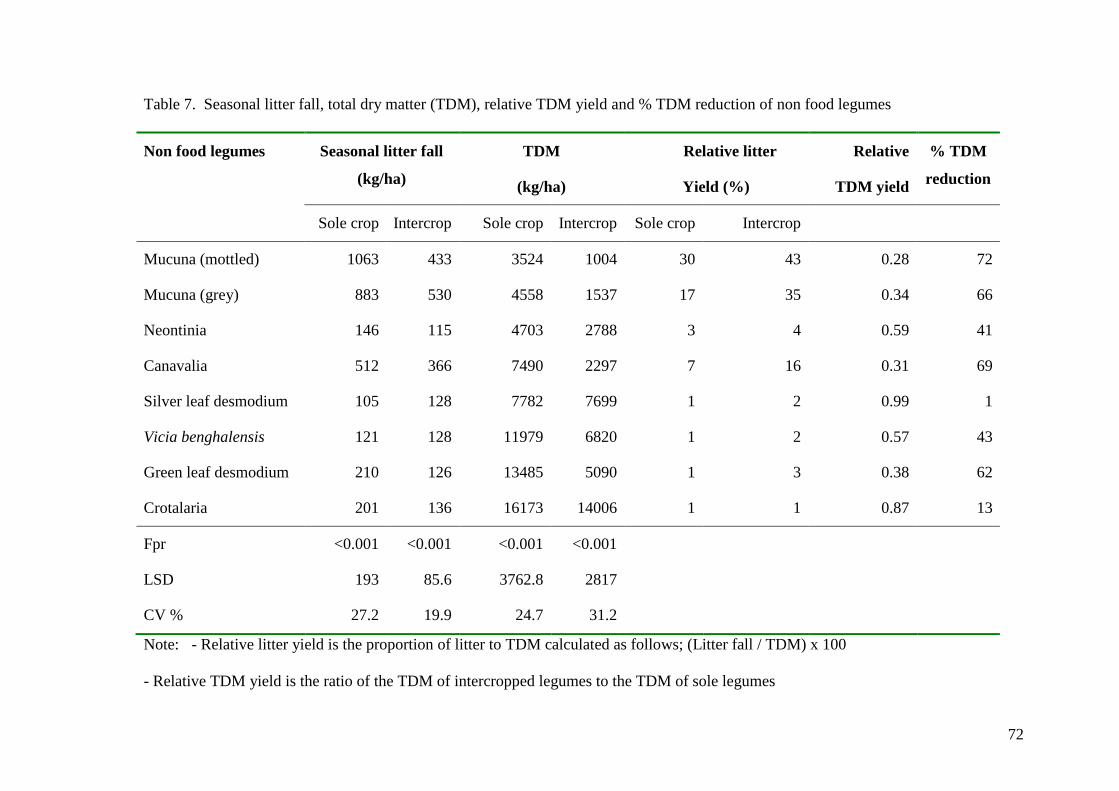
72
Table 7. Seasonal litter fall, total dry matter (TDM), relative TDM yield and % TDM reduction of non food legumes
Non food legumes Seasonal litter fall
(kg/ha)
TDM
(kg/ha)
Relative litter
Yield (%)
Relative
TDM yield
% TDM
reduction
Sole crop Intercrop Sole crop Intercrop Sole crop Intercrop
Mucuna (mottled) 1063 433 3524 1004 30 43 0.28 72
Mucuna (grey) 883 530 4558 1537 17 35 0.34 66
Neontinia 146 115 4703 2788 3 4 0.59 41
Canavalia 512 366 7490 2297 7 16 0.31 69
Silver leaf desmodium 105 128 7782 7699 1 2 0.99 1
Vicia benghalensis 121 128 11979 6820 1 2 0.57 43
Green leaf desmodium 210 126 13485 5090 1 3 0.38 62
Crotalaria 201 136 16173 14006 1 1 0.87 13
Fpr <0.001 <0.001 <0.001 <0.001
LSD 193 85.6 3762.8 2817
CV % 27.2 19.9 24.7 31.2
Note: - Relative litter yield is the proportion of litter to TDM calculated as follows; (Litter fall / TDM) x 100
- Relative TDM yield is the ratio of the TDM of intercropped legumes to the TDM of sole legumes
73
4.3.3 Correlation between cumulative PAR intercepted and TDM accumulation
Generally, the accumulated TDM was linearly positive and highly correlated to the
cumulative intercepted PAR, but differed in level of correlation among the legumes
(Figures 7, 8 and 9). For example, the high regression slop (gradient) observed in
intercropped mwitemania beans (1.357) compared to that of Dolichos (0.336) (Figure 7)
indicated that any given increase in cumulative PAR corresponded with a greater increase
in the amount of TDM accumulated in former compared to the latter. Correlation
coefficient (r) (derived from the corresponding R2 values) was 0.996 0.991, 0.987, 0.957
and 0.713 for soyabean bean, crotalaria, Dolichos and mucuna respectively) (Figures 7, 8
and 9). High r values indicated that legume dry matter production was highly associated
with the photosynthetically active radiation (PAR) intercepted (Akhter et al., 2009). PAR
interception depended on legume canopy ground cover and duration (Tesfaye et al.,
2006; Kanton and Dennett, 2004 and Mureithi et al., 2003). Correlation coefficient (r)
was on average 0.979 and 0.885 in sole and intercropped system respectively (Figures 7,
8 and 9) indicating that intercepted PAR was not as strongly correlated to TDM
accumulation in the intercrop legumes as in the sole legumes.
Butter bean and soyabean had intercepted 270 and 240 MJ m-2
at 10 WAP compared to
Dolichos (205 MJ m-2
) at the same time (Figure 7). The cumulative (total) intercepted
PAR for intercropped crotalaria was higher (656 MJ m-2
) compared to that for mucuna
(553 MJ m-2
) at 24 WAP. Crotalaria probably intercepted high PAR because of its high
ground cover (Figure 5a) leading to high DM accumulation (Figure 6).
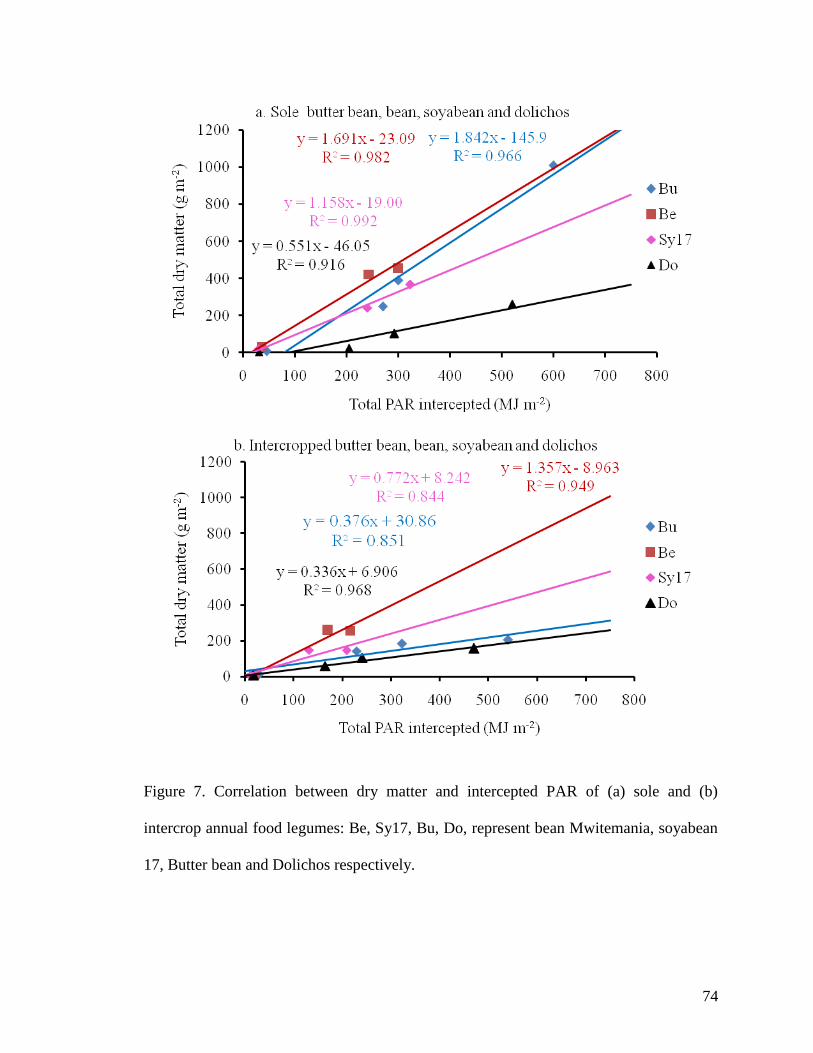
74
Figure 7. Correlation between dry matter and intercepted PAR of (a) sole and (b)
intercrop annual food legumes: Be, Sy17, Bu, Do, represent bean Mwitemania, soyabean
17, Butter bean and Dolichos respectively.

75
Figure 8. Correlation between total dry matter and intercepted PAR of (c) sole and (d)
intercrop non food annual legumes: Cr, Vi, Mu represent crotalaria, Vicia and mucuna
respectively.

76
Figure 9. Correlation between total dry matter and intercepted PAR of (e) sole and (f)
intercrop perennial and climbing legumes: SD, Ne and Ca represent, Silver leaf
desmodium, Neontonia and canavalia respectively.
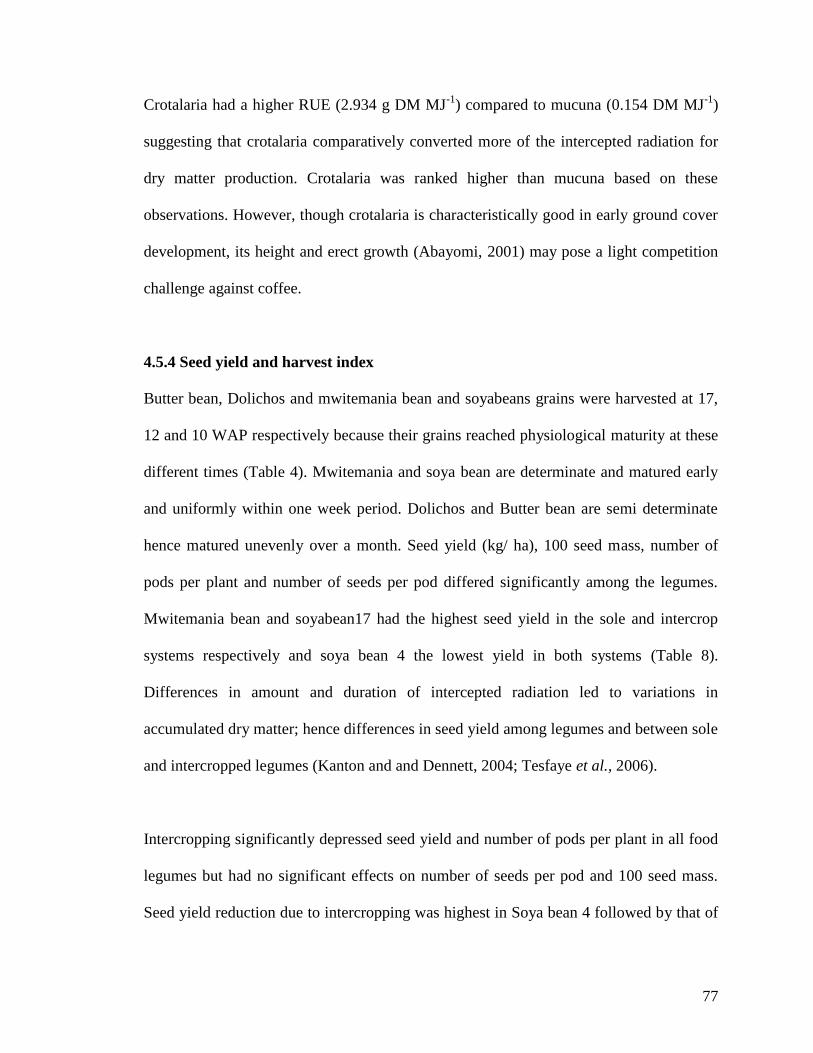
77
Crotalaria had a higher RUE (2.934 g DM MJ-1
) compared to mucuna (0.154 DM MJ-1
)
suggesting that crotalaria comparatively converted more of the intercepted radiation for
dry matter production. Crotalaria was ranked higher than mucuna based on these
observations. However, though crotalaria is characteristically good in early ground cover
development, its height and erect growth (Abayomi, 2001) may pose a light competition
challenge against coffee.
4.5.4 Seed yield and harvest index
Butter bean, Dolichos and mwitemania bean and soyabeans grains were harvested at 17,
12 and 10 WAP respectively because their grains reached physiological maturity at these
different times (Table 4). Mwitemania and soya bean are determinate and matured early
and uniformly within one week period. Dolichos and Butter bean are semi determinate
hence matured unevenly over a month. Seed yield (kg/ ha), 100 seed mass, number of
pods per plant and number of seeds per pod differed significantly among the legumes.
Mwitemania bean and soyabean17 had the highest seed yield in the sole and intercrop
systems respectively and soya bean 4 the lowest yield in both systems (Table 8).
Differences in amount and duration of intercepted radiation led to variations in
accumulated dry matter; hence differences in seed yield among legumes and between sole
and intercropped legumes (Kanton and and Dennett, 2004; Tesfaye et al., 2006).
Intercropping significantly depressed seed yield and number of pods per plant in all food
legumes but had no significant effects on number of seeds per pod and 100 seed mass.
Seed yield reduction due to intercropping was highest in Soya bean 4 followed by that of

78
butter bean and mwitemania bean (Table 8). Intercropping significantly reduced number
of pods per plant in butter bean, soyabean 17, Dolichos and soyabean 4 by 56 %, 31 %,
27 % and 13 %, respectively (Table 8). Reduced photosynthetic activity due to less PAR
reaching intercropped legumes led to low dry matter accumulation and radiation use
efficiency (RUE) hence reduced intercrop yields (Table 9). Radiation use efficiency is the
ratio between biomass accumulation and radiation interception during a considered time
interval (Stockle and Kemanian, 2009). It is estimated as the slope of the linear regression
between cumulative biomass and cumulative intercepted radiation for a given period of
time (Figure 7). A RUE of 1.4 g MJ-1
for C3 plant species (dry beans, soyabean) has been
reported (Stockle and Kemanian, 2009). Butter bean and Dolichos had comparable PAR
interception but TDM for the former was comparatively higher than the latter because
Butter bean had higher light use efficiency. Low Mwitemania yields in the intercrop
system (593 kg ha-1
) in this experiment were comparable to an average of 701 kg ha-1
per
season observed under a similar coffee intercrop (Kimemia, 1998). Reduced seed yield of
Dolichos and soya bean by 59 and 42 % respectively corresponded with 55 and 32 % DM
reduction due to intercropping for the respective legumes implying that DM
accumulation and grain yield in food legumes are related (Tesfaye et al., 2006).
Harvest index (HI) differed significantly among food legumes and between sole and
intercrop systems. On average soya bean17 had the highest HI while butter bean had the
lowest in both sole and intercrop systems (Table 8). HI of soyabean 4 and mwitemania
were comparable in both the sole and intercrop but significantly reduced by 78 % and 52
%, respectively, due to intercropping. Intercropping did not affect HI of butter bean and

79
Dolichos. Differences in HI among Butter bean, Mwitemania, soya bean and Dolichos
were attributed to differences in grain yields and biomass accumulation among these
legumes (Table 8).

80
Table 8. Yield components of sole and intercropped food legumes
Legume Number of pods
per plant
Number of seeds
per pod
100 seed mass
(g)
Seed Yield
kg/ ha
Harvest Index
(HI)
Sole
crop
Intercrop Sole
crop
Intercrop Sole
crop
Intercrop Sole
crop
Intercrop Sole
crop
Intercrop
Soya 4 43.9 38.0 2.7 2.7 10.1 8.8 1224 781 0.48 0.45
Soya 17 36.8 25.5 3.0 2.7 15.6 16.9 1634 894 0.67 0.61
Dolichos 31.4 23.0 3.6 3.8 24.3 25.6 1842 753 0.49 0.45
Butter bean 13.4 5.9 3.0 2.7 99.9 103.8 1857 314 0.17 0.13
Mwitemania bean * * * * 36.5 38.8 2202 593 0.52 0.23
Fpr 0.002 <0.001 0.007 0.023 <0.001 <0.001 <0.008 <0.001 0.022 <0.001
LSD 5 % 11.81 4.438 0.699 0.965 9.51 5.578 357.2 124.8 0.272 0.154
CV % 21.4 11.0 11.3 16.1 13.5 7.6 11.1 12.1 30.5 26.3
NB: HI for Mwitemania bean, soyabean4 and 17 was calculated using legume final biomass. Litter fall for these legumes was
not collected. * Data not collected

81
Table 9. Seed yield, harvest index (HI) and radiation use efficiency (RUE) of intercepted of sole and intercropped food
legumes
Legume Seed Yield (kg/ ha) TDM
(kg/ha)
Harvest Index
(HI)
Total PAR
intercepted
(MJ m-2
)
Radiation use
efficiency (RUE*)
(g DM MJ-1
)
Sole
crop
Intercrop Sole
crop
Intercrop Sole
crop
Intercro
p
Sole
crop
Intercro
p
Sole
crop
Intercrop
Soya 4 1224 781 2525 1720 0.48 0.45 326 163 1.190 0.811
Soya 17 1634 894 2422 1477 0.67 0.61 333 209 1.158 0.772
Dolichos 1842 753 3785 1685 0.49 0.45 520 470 0.551 0.336
Butter bean 1857 314 10675 2331 0.17 0.13 600 540 1.842 0.376
Mwitemania
bean
2202 593 4228 2586 0.52 0.23 300 216 1.691 1.357
Fpr <0.008 <0.001 0.043 0.260 0.022 <0.001 - - - -
LSD 5 % 357.2 124.8 6349.8 1787.6 0.272 0.154 - - - -
CV % 11.1 12.1 25 25.3 30.5 26.3 - - - -
Note: RUE* values are derived from the linear regression equation between legume total dry matter and cumulative
intercepted PAR
(Stockle et al., 2009), (Figures 7, 8 and 9)

82
High HI in soyabean 17 (with erect growth habit) may be attributed to its high grain
yield in relation to TDM accumulation indicating that much of the plant assimilate
was translated into reproductive organs (seed resource) compared to the HI of Butter
bean (spreading growth habit and extensive vegetative parts) that comparatively
accumulated higher TDM in relation to its grain yield hence its low HI. The maturity
and growth habit of component crops in an intercrop determine the productivity of
each of the crops (Adeniyan and Ayoola, 2006). High grain yield of sole Mwitemania
and Butter bean corresponded with high TDM accumulation indicating a direct
correlation between TDM accumulation and grain yield. On average about 64 %, 48
%, 47 %, 38 % and 15 % of the total dry matter produced was allocated to seed in
soyabean 17, soyabean 4, Dolichos, bean and Butter bean respectively, at the end of
the growing season (Table 10). This showed that TDM partitioning into seed deferred
among legumes, suggesting that careful consideration should be made on the impact
of intercropping on the legume grain yield especially if the objective of intercropping
includes grain production for food.
Table 10. TDM partitioning to seed yield
Proportion of seed yield to TDM (%)
Legume Sole legumes Intercropped legumes Average
Soyabean17 67.5 60.5 64
Soyabean4 48.0 45.0 46.5
Dolichos 48.7 44.7 47
Bean 52.1 22.9 38
Butter bean 17.4 13.5 15

83
These findings confirm that radiation capture and use efficiency in intercrops is
critical in plant dry matter accumulation and yield. Suitability of grain legume species
selected for coffee intercrops should therefore be based on their ability to quickly
develop and sustain a large (photosynthetic) leaf area (in terms of LAI) that can
intercept and convert radiation into dry matter efficiently, and partition the dry matter
into seed yield (Tesfaye et al., 2006). This may be achieved by careful consideration
of radiation use efficiency (RUE) and the morphological characteristics of the
legumes to be intercropped with coffee.
4.6 Impact of legume canopy on weed density and biomass
4.6.1 Weed density and growth habits
Weed density (number of weeds per unit area) and biomass were measured at 7 and
24 WAP. The controls for the sole and intercrop systems were uncropped plot
(without legumes) and sole coffee respectively (both unweeded). Eleven different
weed species were identified in both sole and intercrop systems (Table 11). The most
common five weed species were Oxalis latifolia, Galinsoga parviflora, Bidens pilosa,
Cyperus rotudus and Commelina benghalensis (Table 11). Notably Conyza
bonariensis (fleabane) appeared later in the season (24 WAP) but was comparably
among the least common weeds. Weed density differed significantly among plots
sown with different legume species and in the sole and coffee- legume intercrop
overtime. Variations in individual weed density overtime may largely be attributed to
differences in weed growth habits, legume cover and duration and influence of the
cropping system (sole or intercrop) as discussed in sections 4.6.2 to 4.6.3. Average
weed population in uncropped and sole coffee plots decreased by 16 % and 52 %,
respectively, between 7 and 24 WAP while the average weed density in sole and

84
intercropped legume plots decreased by 65 % and 85 %, respectively, over the same
time. This general decrease may be attributed to death of some of the weeds
(especially short leaved legumes) after completing their life cycle and restricted
germination of fresh weeds due to low soil moisture between 15 and 30 WAP (Figure
1).
Table 11. Weed species found in both sole and intercrop system
No. Botanical name Common name Growth habit
1 Oxalis latifolia Wood sorrel Annual and perennial
broad leaved
2 Galinsoga parviflora Gallant soldier Annual broad leaved
3 Bidens pilosa Black jack Annual broad leaved
4 Commelina
benghalensis
Wandering Jew Annual and perennial
broad leaved
5 Setaria verticillata Love grass Annual grass
6 Cyperus rotudus Nut grass Perennial sedge
7 Conyza bonariensis fleabane Annual broad leaved
8 Oxygonium sinuatum Double thorn Annual broad leaved
9 Sonchus oleraceus Sow thistle Annual broad leaved
10 Amaranthus spp Pigweed Annual broad leaved
11 Cynodon dactylon Star grass Annual grass
On average, weed density of annual weeds was lower compared to that of perennial
weeds between 7 and 24 WAP. For example, Galinsoga parviflora and Bidens pilosa
(both annual and herbaceous) were easily suppressed compared to Cyperus rotundus,

85
Commelina benghalensis and Oxalis latifolia (all perennial) among the five most
common weeds at 7 and 24 WAP (Tables 12 - 15). Annual and herbaceous weeds are
easier to control because it is easier to break their short life cycle and therefore
prevent further seed production (Damalas, 2008) which is their primary method of
propagation (Rao, 2000). The perennial weeds had unique growth habits and /or
morphology (Coffee Research Foundation, 2003) that made them survive suppressive
effects by the legumes, making them difficulty to control. In particular Commelina
benghalensis is succulent and it thrived in even during the dry season between 15 and
24 WAP (Figure 2). Cyperus rotundus was difficult to control through suppression
probably because it multiplied very quickly during wet weather before legumes
established large ground cover. Its tubers which remain dormant under the soil
(Coffee Research Foundation, 2003) rejuvenated into new shots later in the season (24
WAP) prolonging its survival. Oxalis latifolia may have escaped legume suppression
by surviving using its underground bulbs (Coffee Research Foundation, 2003).
Legumes significantly differed in suppression of the five most common weeds.
Compared to other legumes, and soyabeans (among food legumes) and crotalaria,
silver leaf desmodium, mucuna (mottled), Vicia benghalensis (all non food legumes)
suppressed weeds the most (Tables 14 and 15) at 7 and 24 WAP. The number of
Galinsoga parviflora weeds in plots with crotalaria, soya bean 4, V. benghalensis,
silverleaf desmodium and mucuna was comparable and reduced by over 90 %
between 7 and 24 WAP (Table 14 and 15). The numbers of Bidens pilosa declined by
over 90 % between 7 and 24 WAP in plots with crotalaria, mucuna and silver leaf
desmodium. Plots with V. benghalensis and soyabean had less Bidens pilosa numbers
at 7 WAP compared to those at 24 WAP. On average crotalaria, V. benghalensis and

86
Neontonia poorly suppressed Commelina benghalensis at 7 WAP compared to other
legumes (Table 14). Legume properties that may have contributed to the differences
in weed suppression (section 4.6.2)

87
Table 12. Density of five most common weeds in food legumes plots at 7 WAP
Weed density (numbers per m2 ) at 7 WAP
Treatment Bidens pilosa Oxalis latifolia Cyperus rotundus Galinsoga parviflora Commelina benghalensis
Sole
crop
Inter
crop
Sole
crop
Inter
crop
Sole
crop
Inter
crop
Sole
crop
Inter
crop
Sole
crop
Inter
crop
Control 6.7 117.3 48 180 20 70.7 53.3 220 7 12
Food legumes
Soyabean17 1.33 45.3 66.7 12 6.7 42.7 1.3 5.3 1.33 16
Soyabean4 0 28 40 43.3 5.3 24 5.3 1.3 0 12
Dolichos 0.0 9.3 65.3 30.7 6.7 102.7 1.3 14.7 1.33 16
Mwitemania bean 0.0 10.7 40 24 1.3 74.7 16 10.7 1.33 14.7
Butter bean 0.0 16 72 30.7 0.0 72 8 25.3 0.00 5.3
Fpr 0.061 <0.001 0.713 0.003 0.023 0.311 0.007 <0.001 0.770 0.952
LSD 4.79 29.1 59.2 69.8 10.7 73.8 25.1 68.7 3.25 27.9
CV % 197.5 42.3 58.8 69.6 88.3 62.9 97.1 72 268.3 121.1
Note: The controls for sole and intercrop systems was uncropped plot (without legumes) and sole coffee respectively
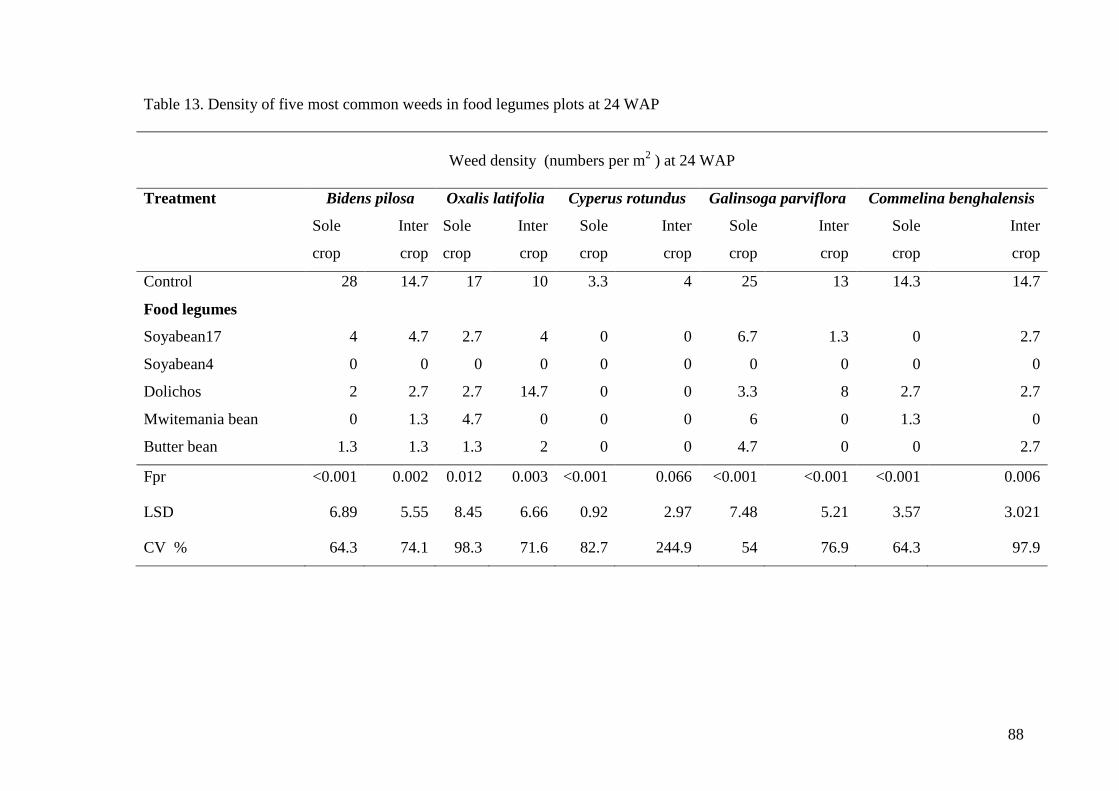
88
Table 13. Density of five most common weeds in food legumes plots at 24 WAP
Weed density (numbers per m2 ) at 24 WAP
Treatment Bidens pilosa Oxalis latifolia Cyperus rotundus Galinsoga parviflora Commelina benghalensis
Sole
crop
Inter
crop
Sole
crop
Inter
crop
Sole
crop
Inter
crop
Sole
crop
Inter
crop
Sole
crop
Inter
crop
Control 28 14.7 17 10 3.3 4 25 13 14.3 14.7
Food legumes
Soyabean17 4 4.7 2.7 4 0 0 6.7 1.3 0 2.7
Soyabean4 0 0 0 0 0 0 0 0 0 0
Dolichos 2 2.7 2.7 14.7 0 0 3.3 8 2.7 2.7
Mwitemania bean 0 1.3 4.7 0 0 0 6 0 1.3 0
Butter bean 1.3 1.3 1.3 2 0 0 4.7 0 0 2.7
Fpr <0.001 0.002 0.012 0.003 <0.001 0.066 <0.001 <0.001 <0.001 0.006
LSD 6.89 5.55 8.45 6.66 0.92 2.97 7.48 5.21 3.57 3.021
CV % 64.3 74.1 98.3 71.6 82.7 244.9 54 76.9 64.3 97.9

89
Table 14. Density of five most common weeds in non food legumes plots at 7 WAP
Weed density (numbers per m2 ) at 7 WAP
Treatment Bidens pilosa Oxalis latifolia Cyperus rotundus Galinsoga parviflora Commelina benghalensis
Sole
crop
Inter
crop
Sole
crop
Inter
crop
Sole
crop
Inter
crop
Sole
crop
Inter
crop
Sole
crop
Inter
crop
Control 6.7 117.3 48 180 20 70.7 53.3 257 0 12
Non food legumes
Vicia benghalensis 0 25.3 30.7 20 5.3 65 8 7 0 25.3
Mucuna (grey) 26.7 18.7 65.3 47 5.3 59 6.7 47 0 4
Mucuna (mottled) 0 84 54.7 111 2.7 99 4 63 0 5.3
Canavalia 0 26.7 48 52 1.3 91 14.7 92 0 10.7
Green leaf desmodium 6.7 73.3 38.7 197 0 60 36 84 0 20
Silver leaf desmodium 16 69.3 12 153 6.7 104 6.7 124 103.3 10.7
Crotalaria 2.7 20 86.7 49 4 71 0 8 0 10.7
Neontinia 1.3 93.3 70.7 47 5.3 4 6.7 275 0 13.3
Fpr 0.466 0.019 0.138 0.057 0.156 0.623 0.004 0.024 0.473 0.581
LSD 27.18 60.31 49.02 126.6 13.05 106.6 24.38 165.5 1.332 21.79
CV % 235.6 59.4 56.1 76.9 133.9 84.9 93.2 90 519.6 101.1

90
Table 15. Density of five most common weeds in non food legumes plots at 24 WAP
Weed density (numbers per m2 )
at 24 WAP
Treatment Bidens pilosa Oxalis latifolia Cyperus rotundus Galinsoga parviflora Commelina benghalensis
Sole
crop
Inter
crop
Sole
crop
Inter
crop
Sole
crop
Inter
crop
Sole
crop
Inter
crop
Sole
crop
Inter
crop
Control 28 14.7 17 10 3.3 4 25 13 14.3 14.7
Non food legumes
Vicia benghalensis 0 2.7 0 5.3 0 2.7 0 5.3 0 4
Mucuna (grey) 0 9.3 1.3 9.7 1.3 0 2.7 7.7 0 2.7
Mucuna (mottled) 0 1.3 0 6.7 0 1.3 2.7 9.3 0 0
Canavalia 2.7 12 10 24.7 0 2.7 4 15.3 0 11.3
Green leaf desmodium 0 6.7 0 44 0 0 0.3 5.3 0 2.7
Silver leaf desmodium 0 1.7 0 1.3 0 0 0 0.3 0 0
Crotalaria 28 1.3 0 0 0 0 0 0 0 1.3
Neontinia 0 4 0 29.7 0 0 4 5.3 0 4
Fpr <0.001 0.040 <0.001 0.005 0.002 0.254 <0.001 0.011 <0.001 0.005
LSD 3.948 9.04 6.381 21.16 1.452 3.885 5.71 7.907 2.146 7.144
CV % 66.9 87.6 117.1 83.8 161.8 189.4 76.8 27.2 71.2 91.3

91
4.6.2 Legume growth habits and weeds density
There were significantly fewer weeds in annual legume plots compared to perennial
legume plots at 7 WAP. Marked differences in weed suppression between annual and
perennial legumes may be attributed to differences in the legumes duration and
phenological (growth) characteristics. Legumes with fast ground cover establishment
(crotalaria and Vicia) and spreading growth habits such as desmodium and Vicia
benghalensis smothered the weeds at a faster rate and were therefore more effective in
reducing weed densities (Table 15) early in the season (7 WAP). This was observed
under silver leaf desmodium, crotalaria, mucuna and canavalia where on average, weed
numbers reduced by 99 %, 93 %, 89 % and 67 % respectively between 7 and 24 WAP
were the lowest at 24 WAP (Table 14).
Plots under soya bean, crotalaria and Vicia benghalensis had the lowest weed densities at
7 WAP among short duration annual legumes (Table 13) while mucuna (mottled) and
silver leaf desmodium plots had lowest weed densities among medium to long duration at
the same time (Table 15). This indicated that these annual legumes were best in weed
suppression early in the season (7WAP) due to early ground cover. The medium to long
duration legumes (mucuna, desmodium and Neontonia) were poor weed suppressors due
to slow establishment at early stages of growth and subsequent poor ground canopy cover
(Figure 5b) at that time. However, these legumes (with spreading growth habits) were
more effective in weed control later in the season (24 WAP) (Table 15) due to sustained
high ground cover (99 %) overtime (Sparks, 2004). Desmodium is slow to establish and
not effective in weed control at early stages of development but is very effective later
92
when it has dense ground cover (Gachene and Kimaru, 2003). This indicated that the
short duration legumes would be best in weed suppression shortly after onset of rains
when many weeds sprout while the long duration would be effective past the rainy season
ensuring prolonged weed control. In addition, there were other legume attributes that may
enhance weed suppression. For example mucuna was effective in weed suppression
probably because of its twining abilities in addition to good ground cover. Legumes are
known to smother weeds through shading and twinning properties (Udensi et al., 2005).
Udensi et al, (2005) demonstrated that mucuna canopy suppressed spear grass weed
biomass by 90 % in 5 months.
4.6.3 Cropping system and weeds density
There were significantly more weeds in coffee-legume intercrop plots compared to those
of sole legume at 7 and 24 WAP (Tables 12 - 14). This was attributed to low legume
ground cover in the intercrop that allowed much of the PAR (59 %) reaching legumes in
the intercrop to be transmitted through their canopy (Table 16). Weeds utilized the
transmitted radiation for fresh and sustained weed growth hence increased weed numbers
and biomass accumulation (Udensi et al., 2005). Intercropped canavalia was not
effective in suppressing weeds (Table 19) probably due to low ground cover. Since it was
also widely spaced (Table 3), it generally intercepted less light implying that a lot of PAR
was transmitted and therefore available for weeds growth (Table 16).

93
Table 16. % PAR at peak legume interception in coffee-legume intercrop
% PAR Coffee
only
Butter
bean
Dolichos Mwitemania Soyabeans Canavalia Crotalari
a
Desmodium Mucuna Neontonia Vicia
7 WAP
Below
coffee
59
Above
legume
- 55 68 55 51 56 69 65 65 56 60
Below
legume
- 23 44 35 61 45 35 70 57 88 42
24
WAP
Below
coffee
59
Above
legume
- 55 62 * * 57 62 65 63 56 60
Below
legume
- 58 5 * * 23 15 10 5 24 21
* Mwitemania bean Soya beans 4 and 17 had already been harvested

94
The positive relationship between poor legume canopy cover and poor weed control
was also reported by Gachene and Kimaru (2003) who observed that canavalia did not
suppress weeds effectively even at 6 months (24 WAP) primarily because of its low
canopy cover, implying that canavalia may not be suitable for weed control in coffee
systems.
Besides the radiation transmitted through the legumes, other factors that may have
influenced weed suppression were litter and soil moisture levels. Legume litter on the
soil service may have obstructed (intercepted) the PAR transmitted through legumes
from reaching weeds hence preventing their germination and or growth. High legume
litter corresponded with low weed numbers implying that litter enhanced weed
suppression.
It is also possible that higher soil moisture levels in the upper soil horizon (< 25 cm)
(Table 17), which is also the major seed and root zone for most weeds (Peralta et al.,
2011), may have contributed to high weed numbers at 24 WAP. The soil under
intercrops had higher soil moisture content at 0 - 25 cm soil depth compared to the
sole crops (Table 16). This corresponded with higher weed numbers in the former
compared to the latter (Tables 18 and 19), implying that higher soil moisture (Kelton
et al., 2011) may have comparatively favoured weed growth in the intercrop.
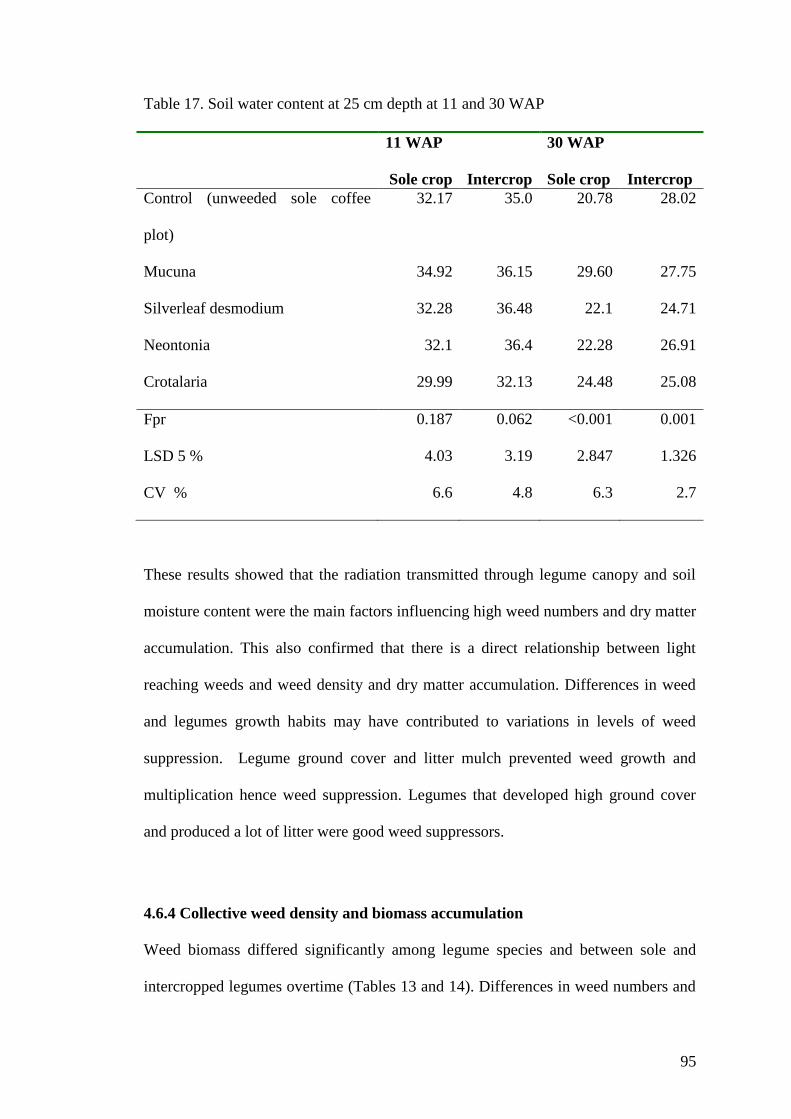
95
Table 17. Soil water content at 25 cm depth at 11 and 30 WAP
11 WAP 30 WAP
Sole crop Intercrop Sole crop Intercrop
Control (unweeded sole coffee
plot)
32.17 35.0 20.78 28.02
Mucuna 34.92 36.15 29.60 27.75
Silverleaf desmodium 32.28 36.48 22.1 24.71
Neontonia 32.1 36.4 22.28 26.91
Crotalaria 29.99 32.13 24.48 25.08
Fpr 0.187 0.062 <0.001 0.001
LSD 5 % 4.03 3.19 2.847 1.326
CV % 6.6 4.8 6.3 2.7
These results showed that the radiation transmitted through legume canopy and soil
moisture content were the main factors influencing high weed numbers and dry matter
accumulation. This also confirmed that there is a direct relationship between light
reaching weeds and weed density and dry matter accumulation. Differences in weed
and legumes growth habits may have contributed to variations in levels of weed
suppression. Legume ground cover and litter mulch prevented weed growth and
multiplication hence weed suppression. Legumes that developed high ground cover
and produced a lot of litter were good weed suppressors.
4.6.4 Collective weed density and biomass accumulation
Weed biomass differed significantly among legume species and between sole and
intercropped legumes overtime (Tables 13 and 14). Differences in weed numbers and
96
biomass were both influenced by the amount of PAR transmitted through the legumes
because this is the light energy they used for their growth (Table 15). Weed biomass
in the uncropped and sole coffee (both unweeded) plots was significantly higher by 86
% and 84 % respectively, compared to that of weeds in plots with legumes implying
that legume canopy intercepted light leaving less PAR available to weeds for DM
accumulation. For example weed biomass in plots with sole Mwitemania bean,
Dolichos, soyabean 17 and soya bean 4 was lower than their respective coffee-
intercropped stand by 79 %, 60 %, and 48 % and 41 % respectively at 7 WAP (Table
13). Poor ground cover in coffee- Butter bean and canavalia intercrop permitted high
radiation (58 % and 23 % PAR respectively) (Table 14 and 15) to reach weeds
leading to high weed biomass accumulation. This contrasted with the low weed
biomass was observed in Silver leaf desmodium and mucuna plots where the legumes
transmitted less radiation (10 % and 5 % PAR respectively) (Table 14), leading to low
weed biomass accumulation.
The average weed biomass in plots with non food legumes increased by 84 % and 67
% in sole and intercropped systems respectively between 7 and 24 WAP but varied
significantly among legumes over the same time. Weed biomass in intercrop plots of
crotalaria, silver leaf desmodium, mucuna and canavalia decreased by 96 %, 57 %, 56
% and 51 % respectively compared to unweeded coffee between 7 and 24 WAP
(Table 14). Increase of weed biomass over time indicated that PAR transmitted
through the legumes continued to be absorbed by weeds leading to dry matter
accumulation by the weeds overtime.

97
Table 18. Weed density and biomass accumulated at 7 weeks after planting in food legume plots
Treatment Weed density (numbers /m2) Weed biomass (kg/ha)
7 WAP 24 WAP 7 WAP 24 WAP
Sole crop Intercrop Sole crop Intercrop Sole crop Intercrop Sole crop Intercrop
Control (weedy plot) 217.3 776 - - 291.7 543.3 - -
Food legumes
Soyabean17 85.3 131 - - 41.3 78.7 - -
Soyabean4 53.3 139 - - 49.3 82.7 - -
Dolichos 82.7 183 - - 40.0 100.0 - -
Mwitemania bean 61.3 141 - - 21.3 102.7 - -
Fpr <0.001 <0.001 - - <0.001 <0.001 - -
LSD 5 % 53.49 135.2 - - 48.61 62.67 - -
% CV 30.2 28.8 - - 32.9 21.4 - -
NB: Weed density and biomass included all weed species. Weed data was not collected in food legume plots at 24 WAP.

98
Table 19. Weed density and biomass accumulated at 7 and 24 weeks after planting in sole and intercropped coffee legume systems
Treatment Weed density (numbers /m2) Weed biomass (kg/ha)
7 WAP 24 WAP 7 WAP 24 WAP
Sole crop Intercrop Sole crop Intercrop Sole crop Intercrop Sole crop Intercrop
Control (weedy plot) 217.3 776 183.0 370.7 291.7 543.3 1791 1635
Non food legumes
Vicia benghalensis 73.3 167 0 30.7 129 105 0 59
Mucuna (grey) 121.3 184 10.7 42.7 372 127 428 262
Mucuna (mottled) 68.0 436 8.0 36.0 135 183 145 78
Canavalia 93.3 324 26.7 122.7 105 243 153 501
Green leaf desmodium 121.3 493 0 82.7 372 248 0 144
Silver leaf desmodium 65.3 511 0 4.7 155 257 0 120
Crotalaria 114.7 173 5.3 12 89 279 20 12
Neontinia 109.3 519 10.7 52 184 352 335 238
Fpr 0.12 0.002 <0.001 <0.001 0.163 0.26 <0.001 <0.001
LSD 5 % 71.93 256.5 21.11 29.73 212.0 223 559.3 314.4
% CV 38.0 37.2 44.9 31.3 68.8 49.6 101.2 53.6
99
CHAPTER 5
CONCLUSIONS AND RECOMMENDATIONS
5.1 Conclusions
Crotalaria, mucuna, silver leaf desmodium ranked best in terms of ground cover
development, total dry matter accumulation and weed suppression. Mucuna had the
highest litter.
Legume PAR interception (both depended on legume growth characteristics) was the
main factor contributing to variations in legume dry matter accumulation and weed
suppression. Intercepted PAR (canopy cover) and total dry matter (TDM) accumulation
were linearly and positively correlated and differed significantly among legumes and
between the sole and intercrop systems. Intercropping significantly reduced the TDM
accumulation, legume litter and seed yield.
Annual legumes (crotalaria, Visia benghalensis and soyabeans) were good in short term
weed control during rainy season while , medium to long duration legumes (silver leaf
desmodium and mucuna) were found suitable for prolonged weed control in coffee.
Soyabeans were preferable for seed production compared to the investigated food
legumes.
Soyabeans excelled in seed yield production because of its high resource use efficiency
that led to a significant amount of its TMD was allocated for seed production. Dolichos
was second best based on seed yield. Butter bean and mwitemania bean were poorest in
seed yield.

100
Crotalaria, desmodium and vicia benghalensis had fast ground cover development and
were therefore more effective in weed suppression early in the season. Mucuna and
neontonia established slowly but had high and sustained ground cover later in the season,
ensuring prolonged weed control under these legumes (Table 17).
Despite crotalarias‟ good traits (quick canopy development, high biomass accumulation
and effective weed suppression) its height would make it unsuitable for intercropping
with coffee unless it is slashed back to provide mulch under coffee or it is established
when the coffee is not ready for picking. Although mucuna grew and accumulated dry
matter slowly it was effective in weed suppression later in the season and had high litter
that would provide nutrients for coffee. Mucuna however would require training by
cutting off its tips to control trailing of coffee.
Silver leaf desmodium produced high biomass, effectively suppressed weeds but has the
potential to compete for water with coffee. Proper management of silver leaf desmodium
especially allowing it to grow when rainfall is high and cutting it back and using its high
biomass as mulch in the dry season would enhance weed control and minimize water
competition in the coffee intercrop. Silver leaf desmodium is also good forage for
livestock.
Vicia benghalensis developed fast in ground cover development but was good in ground
cover duration, dry matter accumulation and weed suppression. This implies that

101
intercropping coffee with Vicia may reduce the need for conventional weed control from
onset of rains up to the early weeks after planting, after which other weed methods should
be applied. Neontonia persisted for long under coffee even during the dry seasons but
poorly conserved soil moisture. Neontonia was not effective in weed control and soil
moisture conservation. Further studies would be necessary to investigate the suitability of
intercropping coffee with Neontonia.
In summary, the results of this study suggest that the choice of legume cover crops
species for intercropping in coffee systems may be based on their ability to development
a fast, high and sustained ground cover (life and /or dead mulch) for soil moisture
conservation and weed suppression and also their ability to accumulate high dry matter
for possible soil fertility improvement through provision of organic matter and seed yield
for food legumes. The choice of such legumes however needs to be put into consideration
due to the possibilities of above and below ground resource competition so as to
minimize competition and optimize resource use in the coffee- legume intercrops. It is
therefore very necessary to further examine the potential of using legume cover crops as a
cost effective means of improving soil fertility and weed control hence increased land
productivity among small holder coffee farms.

102
5.2 Recommendations
The following recommendations can be suggested from this study;
Legumes that accumulate high biomass and ground cover for weed control, with minimal
competition for soil moisture and light, should be given priority when considering in
coffee – legume cover crop intercrops (Table 17).
In this study the impact of the legumes on coffee growth and yields was not evaluated. A
study to evaluate the impact of intercropped legumes on coffee is recommended.
Since intercropping can result in maximization of resource capture and use as well as
resource competition, an evaluation on the most appropriate planting densities of the
legume cover crops under established coffee was recommended. Intercropping coffee
with legumes may also alter microclimate in the intercrop. This change may create an
environment either conducive for buildup or even suppression of certain pests and
diseases. The effects of such changes should be investigated and the cost effectiveness of
using legume cover crops as integrated pest management strategy in coffee explored.

103
REFERENCES
Abayomi, Y.A., Fadayomi O., Babatola, J.O. and Tian G. 2001. Evaluation of Selected
Legume Cover Crops for Biomass Production, Dry Season Survival and Soil
Fertility Improvement in a Moist Savanna in Nigeria. African Crop Science
Journal, 9: 615-627
Adeniyan, O.N. and Ayoola, O.T. 2006. Growth and Yield Performance of Some
Improved Soybean Varieties as Influenced by Intercropping with Maize and
Cassava in Contrasting Locations in South Nigeria. African Journal of
Biotechlogy, 5:1886 – 1889.
Akhter, N., Rahman, M.M., Hasanuzzaman, M. and Nahar, K. 2009. Dry Matter
Partitioning in Garden Pea (Pisum sativum L.) As Influenced by Different Light
Levels. Academic Journal of Plant Sciences IDOSI Publications. 2: 233 – 236.
Akinyele, B.O. and Osekita O.S. 2006. Correlation and Path Coefficient Anlysis os Seed
Yield Attributes in Okra (Abelmoschus esculentus (L.) Moench). African Journal
of Biotechnology. Academic Journals. 5: 1330 – 1336.
Ansari, M. I. and Chen, S.C.G. 2011. Leaf Senescence - An Overview. International
Journal of Recent Trends in Science and Technology, 1: 110 – 114.
Anthofer, J. and Kroschel, J. 2005. Above-ground biomass, nutrients, and persistence of
an early and a late maturing Mucuna variety in the Forest–Savannah Transitional
Zone of Ghana. Agriculture, Ecosystems and Environment, Fallow management
in the Tropics. Elsevier Journals. 110: 59 -77

104
Awadhwal, N.K., Gowda, C.L.L., Chauhan, Y.S., Pande, S., Flower, D.L., Haware, M.P.,
Rego, T.J., Saxena, N.P. Shanower, T.G. and Johansen, C. 2001. Establishment of
Legumes Following Rice - A Review. Natural Resource Management Program,
Report No. 2. Patancheru 502 324, Andhar Pradesh, India: International Crops
Research Institute for The Semi- Arid Tropics. pp 49
Azam-Ali S.N and Squire G.R. 2001. Principles of Tropical Agronomy, pp 107. CAB
International, Wallingford, UK
Bayer Crop Science, 2009. Integrated Weed Management; Tools, Guidelines and
Strategies for Integrated Weed Management. Second Edition, P 4. Available at
www.bayercropscience.com
Bunch, R. and Buckles, D. 1998. Epilogue: Achieving Sustainability in The Use of Cover
Crops, In: Buckles, D., Eteka A., Osiname O., Galiba M., Galino N. (eds) Cover
Crops in West Africa: Contributing to Sustainable Agriculture. International
Development Research Centre (IDRC). 15: 46-49.
Bot , A. and Benites J. 2005. The importance of soil organic matter. Key to drought-
resistant soil and sustained food and production. Food and Agricultural
Organization, Soils Bulletin 80
Bréda, N.J.J. 2008. Leaf Area Index. Encyclopedia of Ecology. Academic Press, pp 2148-
2154. www.sciencedirect.com.
Carsky, J.R. and Ndikawa, R. 1998. Identification of Cover Crops for The Semi-arid
Savanna Zone of West Africa, In: Buckles, D., Eteka A., Osiname O., Galiba M.,

105
Galino N. (eds) Cover Crops in West Africa: Contributing to Sustainable
Agriculture. International Development Research Centre (IDRC). 13: 39-45
Chemining‟wa, G.N., Muthomi, J.W., and Odudho, E.O. 2004. Effect of Rhizobia
Innoculation and Ures Application on Nodulation and Dry Matter accumulation of
Green Manure Legumes at Katumani and Kabete Sites, Kenya. Legume Research
Net Work Project Newsletter. Issue No. 11
Clay, D.V., Lawson, H.M. and Greenfield, A.J. 1990. Weed control in Fruit and Other
Perennial Crops, In: Hance, R.J. and Holly, K. (eds). Weed Control Handbook:
Principles. Eighth Edition. Blackwell Scientific Publications, London, pp 367
Coffee Board of Kenya, 2001. Sessional Paper No 2 of 2001 on Liberalization and
Restructuring of the Coffee Industry. Kixto Enterprises, Nairobi
Coffee Board of Kenya, 2003a. Coffee Industry Highlights. Kixto Enterprises, Nairobi
Coffee Board of Kenya, 2003b. Position Paper on the Status of the Kenyan Coffee
Industry. Kixto Enterprises, Nairobi
Coffee Board of Kenya, 2003c. Coffee Industry Agenda after Reforms: Towards
Sustainable Coffee Quality and Incomes. Kixto Enterprises, Nairobi
Coffee Board of Kenya, 2005. Critical Issues on Coffee Industry. Kixto Enterprises,
Nairobi
Coffee Board of Kenya, 2010. Kenya Coffee; Coffee Growing Areas
Coffee Research Foundation, 2001. Coffee Establishment. Technical Circular No. 501.
Coffee Research Foundation, 2003. Weed Control in Coffee. Technical Circular No. 502.
Coffee Research Foundation, 2004. Coffee and Weather. Coffee Research Foundation
Bulletin October- December 2004, 5: No.19.

106
Coffee Research Foundation, 2012a. History of Kenyan Coffee, Coffee Research
Foundation, Kenya. www.crf.co.ke
Coffee Research Foundation, 2012b. Coffee Nutrition. Technical circular No. 203.
Coffee Research Foundation, Kenya. www.crf.co.ke
Coffee Research Institute, 2006. Arabica and Robusta Coffee Plant.
www.coffeereserach.org
Coste, R. and Cambrony, H. 1992. Coffee. The plant and the Product. Macmillan,
London. pp 328
Damalas, C.A. 2008. Distribution, biology, and agricultural importance of Galinsoga
parviflora (Asteraceae). Weed Biology and Management. Volume 8, Issue 3, pp
147–153, Wiley online library.
Ehlers, W and Goss M. 2003. Water Dynamics in Plant Production. CAB International,
Wallingford, UK. pp. 95-123
Elmore, R.W., 2010. Crop Growth, Production and Management, Agronomy 212. Iowa
State University. www.agron.iastate.edu/courses
Elzebroek, A.J.G and Wind K., 2008. Guide to Cultivated Plants. CAB International,
Wallingford, UK. pp. 1
Ennin, S.A., Dapaa, H.K. and Abaidoo, R.C. 2004. Nitrogen Credits from Cowpea,
Soyabean, Groundnuts and Mucuna to Maize in Rotation. West Africa Journal of
Applied Ecology, 6: 65 - 74
Famaye, A.O. 2004. Effect of intercropping Coffee with Food Crops. Journal of
agricultural Research and Development. 3. 27 -35. Faculty of Agriculture,
University of Ilorin

107
Fang, H. and Liang, S. 2008. Leaf Area Index Models. Encyclopedia of Ecology.
Academic Press. pp 2139 - 2148
Food and Agricultural Organization, 2000. Manual on Integrated Soil Management and
Conservation Practices. FAO Land and Water Bulletin 8. Food and Agricultural
Organization, Rome. www.fao.org.
Food and Agricultural Organization, 2010. FAOSTAT. Food and Agricultural
Organization, Rome. www.fao.org.
Food and Agricultural Organization, 2012. FAOSTAT. Food and Agricultural
Organization, Rome. www.fao.org.
Gachene , C.K.K. and Haru, R. 1997. Controlling Seasonal Soil Loss Using Purple Vetch
(Vicia benghalensis). African Crop Science Conference Proceedings. 3: 369 -373
Gachene , C.K.K., Makau, M. and Haru, R. 2000. Soil Moisture Extraction by Different
Legume Cover Crops. In: Mureithi, J.G., Mwendia, C.W., Muyekho, F.N.,
Onyango, M.A. and Maobe, S.N. (eds) Participatory Technology Development by
Smallholder Management and Legume Research Network Project. Special
Publication of Soil Management and Legume Research Network Projects. (LRNP/
KARI). pp. 133- 143
Gachene, C. K. K. and Makau, M. 2000. Screening Legume Cover Crops for Dry –land
Season Survival in a Semi Arid Environment of Kenya, In: Mureithi, J.G.,
Mwendia, C.W., Muyekho, F.N., Onyango, M.A. and Maobe, S.N. (eds)
Participatory Technology Development by Smallholder Management and Legume
Research Network Project. Special Publication of Soil Management and Legume
Research Network Projects. (LRNP/ KARI). pp. 77-86

108
Gachene, C. K. K. and Kimaru G. 2003. Soil Fertility and Land Productivity: A Guide
For Extension Workers in The Eastern Africa Region. Technical handbook No 30.
Kenya Agricultural Research Institute
Gachene, C. K. K. and Wortmann C.S. 2004. Green Manure/Cover Crop Technology in
Eastern and Central Uganda: Development and Dissemination. In: Eilitta, M.,
Mureithi, J.G. and Derpsh, R. (eds). Green Manure/Cover Crop Systems of
Smallholder Farmers. Experiences from Tropical and Subtropical Regions.
Kluwer Academic Publishers, Netherlands. pp.219-236
Gilbert, R.A. 1998. Undersowing Green Manures for Soil Fertility Enhancement in the
Maize-Based Cropping Systems of Malawi. In: Waddington, S.R., Murwira,
H.K., Kumwenda, J.D.T., Hikwa, D. and Tagwira, F. (eds). Soil Fertility
Research for Maize-Based Farming Systems in Malawi and Zimbabwe. .
Proceedings of the Soil Fertility Network Results and planning workshop, 7-11
July 1997, Mutare, Zimbabwe. Soil Fert Net and CIMMYT-Zimbabwe, Harare,
Zimbabwe. pp. 73-80
Giller, K.E. 2001. Nitrogen Fixation in the Tropical Cropping Systems, Second edition.
CAB International, Wallingford, UK, pp 169-185, 222- 135
Gitari, J.N., E.A. Dyck and P. Maina. 2000. Legume Screening For Soil Fertility
Improvement In The Coastal Lowlands Of Kenya, In: Mureithi J.G. et al (eds)
Participatory Technology Development by Smallholder Management and Legume
Research Network Project (LRNP). KARI, Nairobi.

109
Gunaga R.P., Daddabasava and Vasudeva R., 2008. Influence of Seed Size on
Germination and Seed Growth in Mammea suriga. Karnataka Journal of
Agricultural Sciences, 24: 415-416 (2011)
Gupta, O.P., 1998. Modern Weed Management: With special reference to Agriculture in
The Tropics and Sub-tropics. Agribotanica
Hakansson, S. 2003. Weeds and weed management on Arable Land: An Ecological
Approach. CAB international, Wallingford, UK pp. 3-20
Hall, D.O., Scurlock, J.M.O., Bolhar-Nordenkampf, H.R., Leegood, R.C. and Long, S.P.
1993. Photosynthesis and Production in a Changing Environment. A Field and
Laboratory Manual. Springer; First edition pp 59
Hall, D.O and Rao, K.K. 1994. Photosythesis. (Studies in Biology). Cambridge
University Press. Fifth edition pp100
Hassan, R.M., Muriithi, F.M. and Kamau, G. 1998. Determinants of fertilizer use Gap
Between Farmers‟ Maize yields and Potential Yields in Kenya. In: Hassan, R.M.
(Ed.). Maize Technology Development and Transfer: A GIS Application for
Research Planning in Kenya. CAB International, Wallingford, UK. pp 137-161
Hojjat, S.S. 2011. Effects of Seed Size on Germination and Seedling growth of Some
Lentil Genotypes (Lens culinaris Medik). International journal of Agriculture and
Crop Sciences. 3: 1-5
Howard, M Rowson and Helena Gomez MacPherson. 2000. Explanation of Plant
Development, In Irrigated Wheat. Food and Agricultural Organization, 2000,
Section 6

110
Hussein, M. A., Asmud, B. Are-Halvo, A., Trygve, B. and Hail, G. 2000. The Effect Of
Plant Population And Water Conservation Methods On Grain Yield Of Early
Maturing Maize Varieties in The Moisture –Stress Areas of Southern Ethiopia.
African Crop Science Journal. 8: 159-170
International Center for Tropical Agriculture, 2003. Highlights, CIAT in Africa. Farmers‟
evaluations and innovations with legume cover crops. No.6. In: www.ciat.cgir.org
International Coffee Organization, 2011. The Story of Coffee. www.ico.org
Kabambe, V.H., R.P. Ganunga, and J.D.T. Kumwenda. 1998. Mucuna Management in an
Intercrop with Maize in Southern Malawi: Preliminary Survey Results. In: Annual
report for the Cereals Commodity Group for 1997/98. Ministry of Agriculture and
Irrigation. Lilongwe, Malawi. pp. 187-189.
Kanton, R.A.L. and Dennett, M.D. 2004. Radiation Capture and Use as Affected by
Morphologically Contrasting Maize/ Pea in Sole and Intercropping. West African
Journal of Applied Ecology, Vol 13.
Karanja, A. M. and Wageningen, U. 2002. Liberalisation and Smallholder Agricultural
Development: A Case Study of Coffee Farms in Central Kenya, pp 203.
Wageningen, The Netherlands. Wageningen University
Karuku G. N. 2011. Effects of Crop Residue Management Practices on Soil Moisture
Conservation and Validation of CROPWAT Model for Predicting Water Use
Requirements for Tomato Crop in Kabete, Kenya. PhD. Thesis, University of
Nairobi.
Kelton , J.A., Andrew J. Price, A.J., Santen, E., Balkcom, S.K., Arriaga, F.J. and Shaw,
J.N. 2011. Weed seed bank density and composition in a tillage and landscape

111
variability study. International Journal of the Faculty of Agriculture and Biology,
Communications in Biometry and Crop Science. Warsaw University of Life
Sciences, Poland. 6: 21–30
Khisa, W. P. 2000. Soil loss and Nutrient losses Due To Erosion in a Maize-Legume
based Cropping System in Gatanga (Kenya). Msc Thesis, Soil Science Dept.
University of Nairobi.
Kimemia, J.K. 1998. Studies on Green Manure Application and Intercropping in Coffee
arabica Production. PhD Thesis, University of Nairobi.
Kimemia, J.K 2003. Principles and Practices of Intercropping in Coffee.
Kimenju, J.W., Kagundu, A.M., Nderitu,J.H., Omuolo, F.M. and Mutua, G.K. 2007. Use
of Green Manure Plants in Cropping Systems to Suppress Root-Knot Nematodes.
African Crop Science Conference Proceedings. African Crop Science Society.
Vol. 8. pp. 1083-1085.
Kimidi, M., Gitahi F., Osore, P., Cheruiyot, D., Okumu, M., and Baraza, G. 2000. Effect
of Maize and Beans in Matunda Farm, Transzoia district, North Rift Kenya. In
Mureithi J.G. et al (eds) Participatory Technology Development by Smallholders
in Kenya. Special Publication of Soil Management and Legume Research
Network Projects. KARI, Nairobi. pp. 63-75.
Kroff, M.J. 1993a. Mechanisms of Competition for Light, In: Kroff, M.J. and Van Laar,
H.H. (eds) Modeling Crop- Weed Interactions. CAB International, Wallingford,
UK pp.33-62

112
Kroff, M. J. 1993b. Mechanisms of Competition for Water, In: Kroff M.J. and Van Laar
H.H. (eds) Modeling Crop- Weed Interactions. CAB International, Wallingford,
UK pp. 63-75
Lehmann,J., J.P. da Silva Jr., L. Trujillo and K. Uguen, 2000. Legume Cover Crops and
Nutrient Cycling in Tropical Fruit Tree Production. Acta Horticulturae 531: 65-
72
Lekasi, J.K., Tanner, J.C., Kimani, S.K. and Harris, P.J.C. 1998. Manure Management in
the Kenya Highlands: Practices and Potential. High Potential Production System
Portifolio for the Natural Resources Systems Program, Renewable Natural
Resources Knowledge Strategy. Department for International Development. A
Publication of the Henry Doubleday Research Association, UK. pp 35
Lingenfelter, D.D. and Hartwig, N.L. 2007. Introduction to Weeds and Herbicides.
College of Agricultural Sciences, Agricultural Research and Extension,
Pennsylvania State, U.S.A. www.cas.psu.edu. UC175.
Liu, Y. Wu, L., Baddeley, J.A. and Watson, C.A. 2011. Models of Biological Nitrogen
Fixation of Legumes. In: Lichtfouse E. et al (eds) Sustainable agriculture Vol 2.
Springer Science –EDP Science. pp 883-905
Maina J. M. 1997. The Effect of Intercropping on Weeds and Weed Management in
Maize Growing in Kenya. PhD Thesis, University Of Reading, United Kingdom
Maina, J.M., Mburu, M.W.K., Mureithi, J.G., Gachene, C.K.K., Mburu, J.N. and
Kimemia, J.K. 2006. Evaluation of Legumes as cover Crops for Soil and Weed

113
Management in Smallholder Coffee Cropping Systems in Central Kenya. In:
Legume Research Network Project Newsletter. Issue No. 12, pp 4.
Maobe, S.N., Dyck, E. and Rondicho, A.R. 2000a. Legume Screening For Soil Fertility
Improvement In A High Potential Area In South West Kenya. In: Mureithi J.G. et
al (eds) Participatory Technology Development by Smallholders in Kenya.
Special Publication of Soil Management and Legume Research Network Projects.
KARI, Nairobi. pp.. 63-75.
Maobe, S.N., Mbugua, D.M., Mkwaro, Ondicho A.R. and Dyck, E. 2000b. Researching
with Farmers on Green Manure Technology in a High Potential area in South
West Kenya. In: Mureithi J.G. et al (eds) Participatory Technology Development
by Smallholders in Kenya. Special Publication of Soil Management and Legume
Research Network Projects. KARI, Nairobi. pp. 109-119
Matthias L., 2002 . Thermal time, Solar Radiation and Plant Development. pp 128.
International Conference on AIDS and STIs in Africa (ICASA).
Mazaheri, D., Ahad, M and Meysam, O. 2006. Assessing the Land Equivalent Ratio
(LER) of Two Corn [Zea Mays L.] Varieties Intercropping at Various Nitrogen
Levels in Karaj, Iran. Journal of Central European Agriculture. 7: 359-364
Mburu, M.W.K., 1996. The Effects of Irrigation, Fertilizer Nitrogen and Planting Density
on Bean (Phaseolus vulgaris) Yield under Different Weather Conditions. PhD
Thesis, University Of Reading, United Kingdom
Mburu, M.W.K., Mureithi, J.G., and Gachene, C.K.K. 2003. Effects of Mucuna Planting
Density and Time on Water and Light Use in a Maize- Legume Intercrop System

114
McIntyre, B.D., Gold, C.S., Kashaija, I.N. Ssali, H., Night, G., and Bwamiki, D.P. 2001.
Effects of Legume Intercrops on Soil-borne Pests, Biomass, Nutrients and Soil
Water in Banana. Biol Fertil Soils (2001) 34: pp 342- 348
McMaster, C.S., Ascough II, H.C., Edmunds, D.A., Andles, A.A., Wagner, L. and Fox,
F. 2002. Multi-Crop Plant Growth Modeling for Agricultural Models and
Decision Support System.
Memon, R.A., Bhatti, G.R and Khalid, S. 2003. Weed Diversity of Wheat Crop in
Kharpur District, Sindh. In: Pakistan Journal of Weed Science. Res. 9: 99-103
Ministry of Agriculture and Livestock Development, 1997. Coffee Sector Strategic Study
(Final Report- June 1997). Ministry of agriculture, Kenya.
Ministry of Agriculture and Ministry of Livestock and Fisheries Development. 2004.
Strategy for Revitalizing Agriculture, 2004- 2014. Ministry of agriculture, Kenya.
Ministry of Agriculture, 2010. Economic review of agriculture. Ministry of agriculture,
Kenya.
Ministry of Agriculture, 2011. The Agriculture outlook, January- June 2011. Ministry of
agriculture, Kenya. pp 32.
Morales-Rosales, E.J. and Franc-Mora, O. 2009. Biomass, Yield and Land Equivalent
Ratio of Helionthus annus L. in Sole Crop and Intercropped with Phaseolus
Vulgaris L. in High Valleys of Mexico. Tropical and Subtropical Agro-
ecosystems 10: 431-439
Mortimer, A.M. 1990. The Biology of Weeds, In: Hance, R.J. and Holly, K. (eds) Weed
Control Handbook: Principles. Eighth edition. Blackwell Scientific Publications,
London, pp1.

115
Muller-Samann, K.M. and Kotschi, J. 1997. Sustaining Growth: Soil Fertility
Management in Tropical Smallholdings. In: IFOAM Training Manual on Organic
Agriculture in the Tropics, pp 87. International Federation of Organic Agriculture
Movements, Bonn, Germany
Mureithi, J.G., Gachene, C.K.K. and Wamuogo, J.W. 2003. Legume Cover crops
Research in Kenya: Experiences of the Legume Research Network Project.
Highlights of Phase 1 Research Activities (1994-2000). KARI Technical Note
Series No. 12, February 2003.
Mureithi, L.P. 2008. Coffee in Kenya: Some Challenges for decent work. International
Labour Office, Geneva. Working Paper No 260
Muthuri, C.W. 2004. Impact of Agro forestry on Crop Performance and Water Resources
in Semi- arid Central Kenya. PhD Thesis, JomoKenyatta University of
Agriculture and Technology
Nair, K.P. 2010. Coffee. The Agronomy and Economy of Important Crops of The
Developing World. Elservier, London, pp181 -208. www.sciencedirect.com
Njarui, D.M.G., Bahnish, L.M., O‟Hagan, B. and So, B. 2003. Emergence of Forage
Legume Seedlings Influenced by Water Potential and Soil Strength. East African
Agricultural and Forestry Journal. 2003. 69: 29-38
Njihia, C.M. 2000. Performance of Mixed Cropping In The Yala Swamp, Kenya, In: Soil
Science Society of East Africa (SSSEA), Proceedings of the 15th
Annual General
Meeting Sportsman’s Arms Hotel, Nanyuki, Kenya. August 19th
– 23rd
, 1996.
Njoroge, J.M. and Kimemia, J.K. 1990. A Comparison of Different Weed Control
Methods in Kenya, Kenya Coffee 55: 863. Coffee Research Foundation, Kenya

116
Njoroge, J.M. 1992. Studies on Fertilization, Plant Density, Pruning, Replacement
Methods of Established Coffee and Intercropping Food Crops With Coffee
Arabica L. Cv. Ruiru. PhD Thesis University Of Nairobi, Kenya.
Nobel, P.S., Forseth, I.N. and Long S. P. 1995. Canopy structure and light interception
In: Hall, et al. (eds). Photosynthesis and Production in a Changing Environment,
A Field and Laboratory Manual
Nordby, D. 2004. Pocket Guide to Crop Development: Illustrated Growth Timelines for
Corn, Sorghum, Soyabean and Wheat. University of Illinois, U.SA, C1389. pp 1-
5.
Nyabundi, K.W. and Kimemia, J.K. 1998. Difficult Weed in Kenya Coffee. Kenya
Coffee 63: 2747-2751
Nyangito, H.O., 2001. Policy and Legal Framework for the Coffee Subsector and the
Impact of Liberalization in Kenya. Kenya Institute of Public Policy Research and
Analysis. KIPPRA Policy Paper No. 2, January 2001.
Obuo, J.E., Adipala, E., and Osiru, D.S.O. 1997. Effect of Weeding Frequency on The
Cost-Benefit Ratio and Yield Advantage of Cowpea / Sorghum Intercropping, In:
Adipala, E., Tenywa, J.S., and Ogenga-Latigo, M.W. (eds) African Crop Science
Conference Proceedings, Pretoria, 13-17 January 1997. 3: 865-869.
Odeleye, F.O., Togun, A.O. and Tayo, T.O. 2001. The Effect of Light Intensity on The
Growth, Development and Yield of Soybean in South West Nigeria. African Crop
Science Journal, Vol. 9 No.3, pp.577- 590.
Ong, C.K., Black, C.R., Marshal, F.M. and Corlett, J.E. 1996. Principles of Resource
Capture and Utilization of Light and Water, In: Ong, C.K. and Huxley P. (eds)
Tree-Crop Interactions: A Physiological Approach. CAB International,
Wallingford, UK pp. 73-185.

117
Palaniappan, S.P. and Sivaraman, K. 2001. Cropping in the Tropics, Principles and
Management, Second Edition, pp. 209. New Age International (p) Ltd publishers
Peden, D. 1998. Introduction, In Buckles, D., Eteka A., Osiname O., Galiba, M., Galino,
N. (eds) Cover Crops in West Africa: Contributing to Sustainable Agriculture.
Document1. International Development Research Centre (IDRC).
Peralta R.C., Candia, P.S. and Hinojosa, E.A. 2011. Characterization of The Weed Seed
Bank in Zero and Conventional Tillage Central Chile. Chilean Journal of
Agricultural Research. 71: 140-147
Rao, V.S. 2000. Principles of Weed Science. Oxford and IBH Publishing Co. pp 7, 411,
447.
Roberts, M. J., Long, S. P., Trezen, L.L. and Beadle, C.L. 1995. Measurements of Plant
Biomass and Net Primary Production of Herbaceous Vegetation In: Hall, et al.
(eds). Photosynthesis and Production in a Changing Environment, A Field and
Laboratory Manual. pp. 465-477. Chapman and Hall
Robinson, T.H. 1990. The Methodology of Application, In: Hance, R.J. and Holly, K.
(eds). Weed Control Handbook: Principles. 350pp. Eighth Edition, Blackwell
Scientific Publications, London.
Saha, H.M., Njunie, M.N. and Tsanje, N.M. 2000. Legume Screening for Soil fertility
Management in the Coastal Lowlands of Kenya, In: Mureithi J.G. et al (eds)
Participatory Technology Development by Smallholder Management and Legume
Research Network Project (LRNP). KARI, Nairobi.
Sayed N.A. and Squire G.R. 2002. Principles of Tropical Agronomy. CAB International,
Wallingford, UK pp 22

118
Simmonds, L.P., Mburu, M.W.K. and Pilbeam, C.J., 1999. Bean Growth and Yield
Response to Nitrogen, Fretilizer and Planting Density Under Temperate and
Tropical Conditions. East African Agriculture and Forest Journal (1999) 65 (1),
21 837
Snapp, S.S., Swinton, S.M., Labarata, R., Mutch D., Black, J.R., Leep, R., Nyiraneza, J.,
and O‟Neil, K., 2005. Evaluating Cover Crops for Benefits, Costs and
Performance within Cropping System Niches. Agronomy journal, VOL. 97,
January- February 2005. pp 322-332
Sparks, D.L. 2004. Advances in Agronomy, Vol. 82. Academic Press, Elsevier Inc, USA.
pp 484
Squire, G.R., 1990. The Physiology of Tropical Crop Production. CAB International,
Wallingford, UK, pp 236.
Stockle, C. and Kemanian, A. 2009. Crop Radiation Capture and Use Efficiency: A
Frame Work for Crop Growth Analysis. In: Sandras et al (eds) Crop Physiology:
Applications for Genetic Improvement and Agronomy. Academic Press. P 145
Stockle, C., Nelson, R. and Kemanian, A. 2012. Crop Simulation: Phenology. In:
CropSyst Manual. Washington State University. pp 1-2
Sullivan, P. 2003a. Overview of Cover Crops and Green Manures. Fundamentals of
Sustainable Agriculture. National Center for Appropriate Technology (NCAT),
U.S. At www.attr.ncat.org. pp 1-16
Sullivan, P. 2003b. Intercropping Principles and Production Practices. Agronomy
systems Guide. National Center for Appropriate Technology (NCAT), U.S.
www.attra.ncat.org. pp 1-12
119
Tesfaye, K., Walker, S. and Tsubo, M. 2006. Radiation interception and radiation use
efficiency of three grain legumes under water deficit conditions in a semi-arid
environment. European Journal of Agronomy. Elsevier 25: 60 - 70
Traoré, H., Hess, D.E., Hoffmann, G., Son, G. A. and Salle, G. 2001. Use of hand-
weeding and Herbicides to control Striga Hermontheca in Burkina Faso, In:
African Crop Science Journal, 9: 645-653.
Udensi, U.E., Chikoye, D., and Ogunyemi, S. 2005. Effect of Level and Source of Shade
on the Biomass of Speargrass in Nigeria. African Crop Science Journal, 13: 153-
162
Unkovich, M., Baldock, J. and Forbes, M. 2010. Variability in Harvest Index of Grain
Crops and Potential Significance for Carbon Accounting: Examples from
Australian Agriculture. Advances in Agronomy. Elsevier, 105:173 -219
Van der Vossen, H.A.M. 2005. A Critical Analysis of The Agronomy and Economic
Suitability of Organic Coffee Production. Cambridge University Press, United
Kingdom. Experimental Agriculture, 41: 449-473
Vissoh, P., Manyong, V. M., Carsky, J.R., Osei- Bonsu, P. and Galiba, M. 1998.
Experiences with Mucuna in West Africa. In Buckles, D., Eteka A., Osiname O.,
Galiba M., Galino N. (eds) Cover Crops in West Africa: Contributing to
Sustainable Agriculture. Ottawa, Canada. International Development Research
Centre (IDRC). Document 5: pp 1-32
Wallace, J.S., 1996. The Water Balance of Mixed Tree-Crop Systems. In: Tree-crop
interactions: a physiological approach. Ong, C.K. and Huxley, P. (Eds). pp. 189-
233. Centre for Agriculture and Biosciences International (CABI) and the
120
International Centre for Research in Agro-Forestry (ICRAF). Wallingford, UK
and Nairobi
Waller, J.M., Bigger, M., and Hillocks R.J.2007. Coffee Pests, Diseases and Their
Management. CAB International, Wallingford, UK pp 1- 17
Wandera, J. L., Munyekho, F. N., Mbugua, D. M. and Kiruiro, E. M. 2000. Effects Of
Intercropping Herbaciouslegumes and Napier On Frage Dry Matter Production In
The High rainfall Highlands Of Kenya, In: Mureithi J.G. et al (eds) Participatory
Technology Development by Smallholders in Kenya. Special Publication of Soil
Management and Legume Research Network Projects. Kenya Agricultural
Research Institute, Nairobi, pp. 101-107.
Wanjekeche , E., Mureithi J.G., Gachene, C.K.K and Wakasa, V. 2004. Screening of
promiscuous soybean varieties in the North Rift Valley of Kenya. Legume
Research Network Project Newsletter. Issue No. 11. Kenya Agricultural Research
Institute, Nairobi, pp 5
Wikipedia, 2012. Growing Degree Day. At: http://en.wikipendia.org
Wilson, K.C. 1999. Coffee, Cocoa and Tea. Centre for Agriculture and Biosciences
International (CABI), Wallingford, UK pp 15-97
Winston, E., Laak, L.O., Marsh, T., Lempke, H., Aung, O., Nyunt, T. and Chapman, K.
2005. Arabica coffee manual for Myanmar. In. www.fao.org. Food and
Agricultural Organization, Regional Office for Asia and the Pacific, Bangkok,
Thailand.

121
Appendix 1. Analysis of variance table showing MSS of Legume emergence vigor (EV), time to emergence (TE), anthesis (TA), 50
% flowering (TF), 50 % podding (TP) and physiological maturity (PM) in sole and intercrop systems
Mean sum of sums (MSS)
Days after planting (DAP)
Source of variation DF EV TE TA TF TP PM
Replication 2 0.8590 0.667 1.271 4.396 0.271 9.300
Production system
(Sole / intercrop)
1 0.0513 10.782 93.521 44.083 27.00 313.633
Error 1 2 0.1667 0.974 0.021 4.646 2.312 3.233
Legume species 12 0.6346** 96.959** 8500.3** 9601.4** 10411.29** 4617.13**
Interaction
(Production system x legume)
12 0.1346 22.088 38.33 16.08 5.571 5.080
Error 2 48 0.1795 2.459 1.336 1.402 1.768 5.892
Total 77
** Significant at ≤ 1% NB: Analysis for time to anthesis, 50 % flowering and 50 % podding did not include desmodium, canavalia
and neontonia. Only food legumes were included in analysis for time to physiological maturity.

122
Appendix 2. Analysis of variance table showing MSS of canopy height (cm) for mwitemania bean, soya bean 4 and soya bean 17
overtime in sole and intercrop systems
Mean sum of sums (MSS)
Weeks after planting (WAP)
Source of variation DF 4 6 8 10 12 14
Replication 2 4.028 8.324 61.10 145.08 50.54 165.05
Production system
(Sole / intercrop)
1 9.798 18.625 12.50 366.48 476.58 373.19
Error 1 2 1.270 4.319 38.64 86.49 38.29 55.89
Legume species 2 185.271* 355.522* 1786.58* 948.58* 503.33** 842.06**
Interaction
(Production system x legume)
2 16.606 31.255 4.06 94.85 198.25 172.12
Error 2 8 3.067 4.534 43.85 55.28 58.83 97.84
Total 17
* Significant at ≤ 5% ** Significant at ≤ 1%

123
Appendix 3. Analysis of variance table showing MSS of % PAR interception for annual food legumes (butter bean, mwitemania bean,
soya bean 4, soya bean 17 and dolichos) overtime in sole and intercrop systems
Mean sum of sums (MSS)
Weeks after planting (WAP)
Source of variation DF 4 6 8 10 12 14 16 18 24
Replication 2 42.91 137.75 626.5 442.39 158.41 88.25 55.42 255.5 93.2
Production system
(Sole / intercrop) 1 2399.68 2703.89 2075.2 4199.18 1854.96 580.36 1434.69 1261.5 243
Error 1 2 1.66 16.45 192.8 108.19 139.53 237.65 29.07 108.9 262.8
Legume species 4
305.89
**
508.9
*
827.6
*
314.89
*
1679.42
**
4464.98
**
299.82
**
1877.4
**
2408.3
*
Interaction
(Production system x legume) 4 49.46 54.61 350.3 295.37 230.76 254.38 212.98 234.9 1728
Error 2 16 40.59 79.37 143.9 96.17 82.24 42.55 25.95 142.5 141.2
Total 29
* Significant at ≤ 5%, ** significant at ≤ 1% NB: Final % PAR interception for mwitemania and soya beans was done at 14 and 18
WAP respectively.

124
Appendix 4. Analysis of variance table showing MSS of % PAR interception for non food annual legumes (canavalia, crotalaria,
Vicia benghalensis, mucuna (grey) and mucuna (mottled) overtime in sole and intercrop systems
Mean sum of sums (MSS)
Weeks after planting (WAP)
Source of variation DF 4 6 8 10 12 14 16 18 24
Replication 2 3.95 11.83 1.8 242.32 174.03 5.42 4.341 14.53 27.23
Production system
(Sole / intercrop)
1 1355.56 1243.44 809.4 2623.24 2616.51 937.55 1012.68 213.33 48.13
Error 1 2 16.29 12.57 71 358.18 391.09 495 4.54 6.93 34.23
Legume species 4 104.66* 81.01 462.5* 777.73** 290.34* 218.18** 162.71** 128.92** 875.62**
Interaction
(Production system x
legume)
4 64.10 57.73 43.5 231.26 103.89 113.57 92.04 80.75 362.55
Error 2 16 15.22 36.28 120 98.06 78.55 16.68 5.22 16.98 37.36
Total 29
* Significant at ≤ 5%, ** significant at ≤ 1%
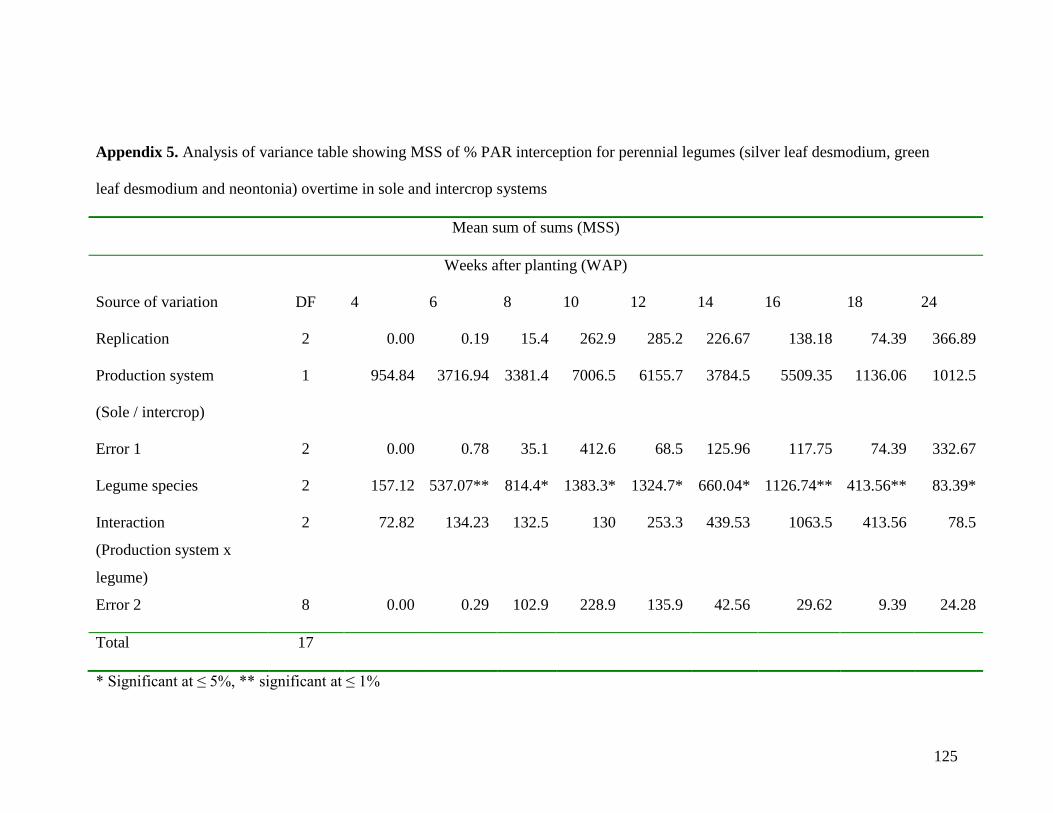
125
Appendix 5. Analysis of variance table showing MSS of % PAR interception for perennial legumes (silver leaf desmodium, green
leaf desmodium and neontonia) overtime in sole and intercrop systems
Mean sum of sums (MSS)
Weeks after planting (WAP)
Source of variation DF 4 6 8 10 12 14 16 18 24
Replication 2 0.00 0.19 15.4 262.9 285.2 226.67 138.18 74.39 366.89
Production system
(Sole / intercrop)
1 954.84 3716.94 3381.4 7006.5 6155.7 3784.5 5509.35 1136.06 1012.5
Error 1 2 0.00 0.78 35.1 412.6 68.5 125.96 117.75 74.39 332.67
Legume species 2 157.12 537.07** 814.4* 1383.3* 1324.7* 660.04* 1126.74** 413.56** 83.39*
Interaction
(Production system x
legume)
2 72.82 134.23 132.5 130 253.3 439.53 1063.5 413.56 78.5
Error 2 8 0.00 0.29 102.9 228.9 135.9 42.56 29.62 9.39 24.28
Total 17
* Significant at ≤ 5%, ** significant at ≤ 1%

126
Appendix 6. Analysis of variance table showing MSS of % PAR interception for all (13) legumes overtime in sole and
intercropped systems
Mean sum of sums (MSS)
Weeks after planting (WAP)
Source of variation DF 4 6 8 10 12 14 16 18 24
Replication 2 27.01 74.6 179 611.8 277.2 124.69 32.98 132.39 64.8
Production system
(Sole / intercrop)
1 4631.86 6956.34 5450.9 12580.4 9239.7 4030 6323.81 2189.01 380.02
Error 1 2 9.98 14.59 193.4 635 353.8 190.43 9.34 61.06 352.87
Legume species 12 413.57
**
430.57
**
1354.6
**
857.7
**
922
**
1812
**
420.7
**
863.8
**
972.91
**
Interaction
(Production system x legume)
12 56.51 118.90 221.4 301.3 269.4 301.94 433.36 206.98 473.20
Error 2 48 19.76 42.37 128.8 127.1 100.7 42.24 28.31 62.24 76.54
Total 77
** Significant at ≤ 1%, NB: Final % PAR interception for mwitemania and soya beans was done at 14 and 18 WAP respectively.
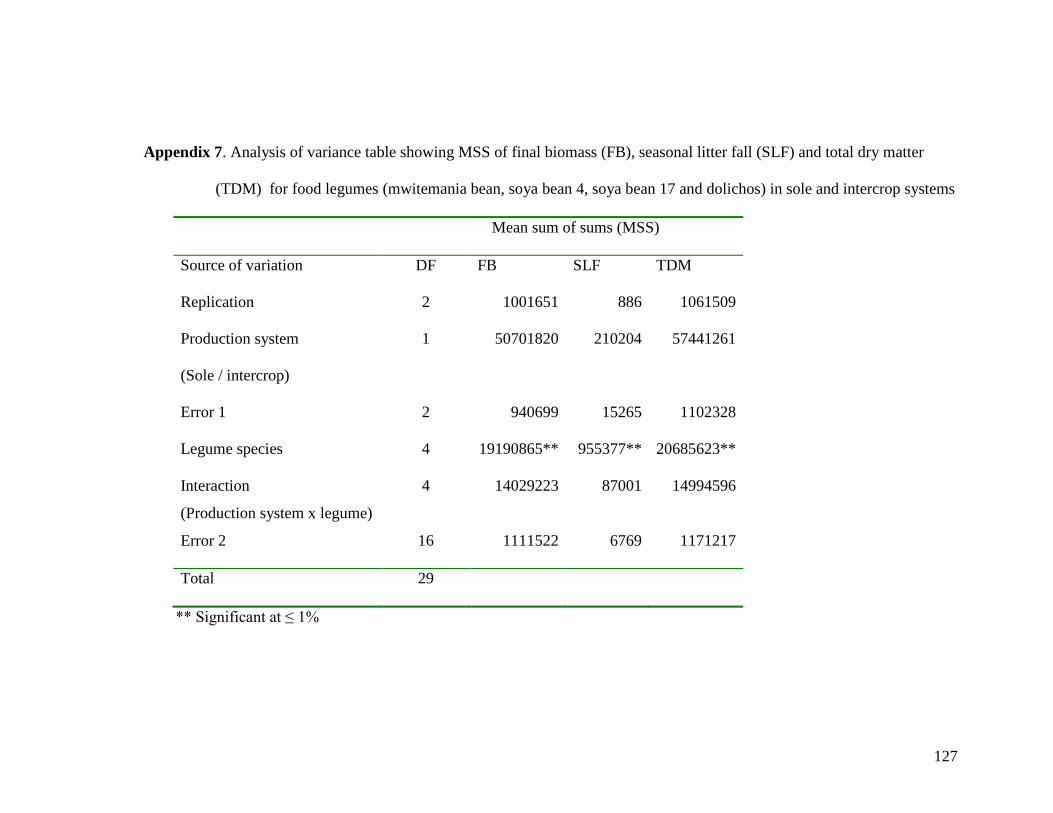
127
Appendix 7. Analysis of variance table showing MSS of final biomass (FB), seasonal litter fall (SLF) and total dry matter
(TDM) for food legumes (mwitemania bean, soya bean 4, soya bean 17 and dolichos) in sole and intercrop systems
Mean sum of sums (MSS)
Source of variation DF FB SLF TDM
Replication 2 1001651 886 1061509
Production system
(Sole / intercrop)
1 50701820 210204 57441261
Error 1 2 940699 15265 1102328
Legume species 4 19190865** 955377** 20685623**
Interaction
(Production system x legume)
4 14029223 87001 14994596
Error 2 16 1111522 6769 1171217
Total 29
** Significant at ≤ 1%

128
Appendix 8. Analysis of variance table showing MSS of final biomass (FB), seasonal litter fall (SLF) and total dry matter
(TDM) for non food legumes {(mucuna (mottled), mucuna (grey), neontinia, canavalia, silver leaf desmodium,
vicia benghalensis, green leaf desmodium and crotalaria} in sole and intercrop systems
Mean sum of sums (MSS)
Source of variation DF FB SLF TDM
Replication 2 1774000 335 1772000
Production system
(Sole / intercrop)
1 138400000 307008 151800000
Error 1 2 2516000 4609 2481000
Legume species 7 121100000** 435684** 111400000**
Interaction
(Production system x legume)
7 10200000 75292 10010000
Error 2 28 3542000 7270 3603000
Total 47
** Significant at ≤ 1%

129
Appendix 9. Analysis of variance table showing MSS of final biomass (FB), seasonal litter fall (SLF) and total dry matter
(TDM) for all (13) legumes in sole and intercrop systems
Mean sum of sums (MSS)
Source of variation DF FB SLF TDM
Replication 2 2600000 719 2666000
Production system (Sole / intercrop) 1 186200000 516955 206400000
Error 1 2 3407000 1397 3542000
Legume species 12 96220000** 578106** 91740000**
Interaction (Production system x legume) 12 10870000 72942 11080000
Error 2 48 2446000 7288 2501000
Total 77
** Significant at ≤ 1%
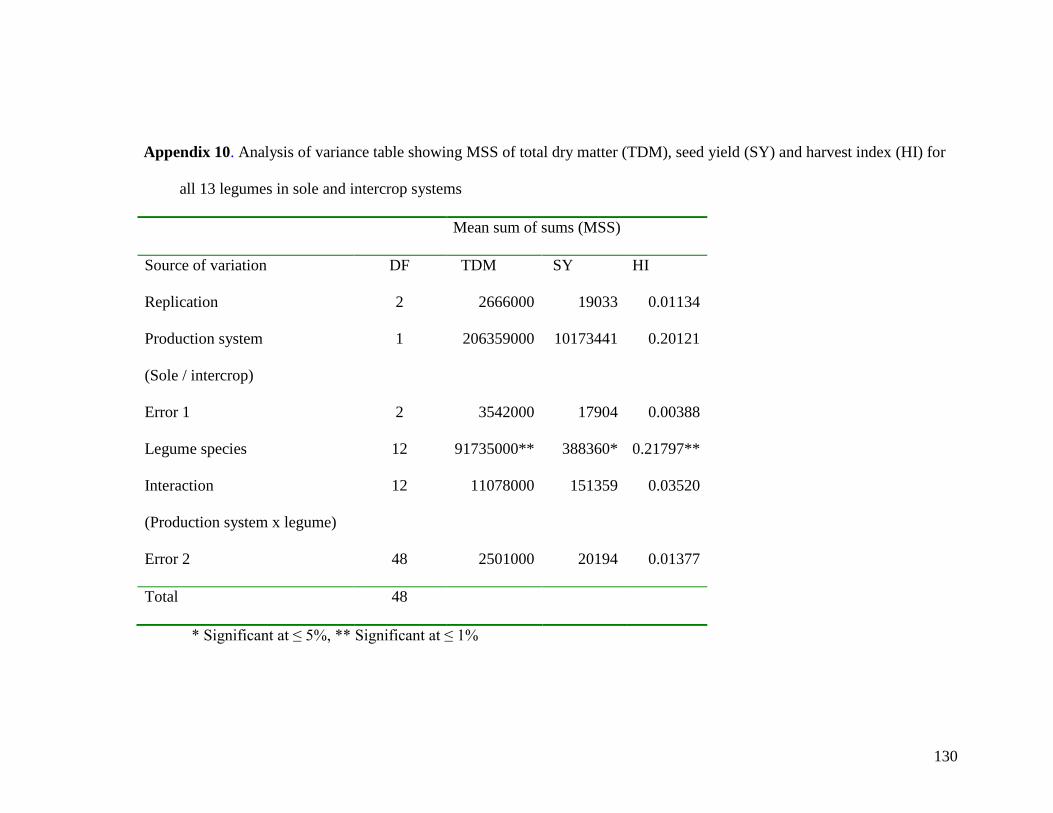
130
Appendix 10. Analysis of variance table showing MSS of total dry matter (TDM), seed yield (SY) and harvest index (HI) for
all 13 legumes in sole and intercrop systems
Mean sum of sums (MSS)
Source of variation DF TDM SY HI
Replication 2 2666000 19033 0.01134
Production system
(Sole / intercrop)
1 206359000 10173441 0.20121
Error 1 2 3542000 17904 0.00388
Legume species 12 91735000** 388360* 0.21797**
Interaction
(Production system x legume)
12 11078000 151359 0.03520
Error 2 48 2501000 20194 0.01377
Total 48
* Significant at ≤ 5%, ** Significant at ≤ 1%

131
Appendix 11. Analysis of variance table showing MSS of seed yield (SY) (kg/ha), Harvest Index (HI), 100 seeds mass (SM) (g),
number of seeds per pod (SP), number of pods per plant (PP) for soya bean 4, soya bean 17 dolichos, butter bean and
mwitemania beans in sole and intercrop systems
Mean sum of sums (MSS)
Source of variation DF SY HI SM SP PP
Replication 2 19033 0.01134 18.43 0.8043 0.60
Production system
(Sole / intercrop)
1 10173441 0.20121 16.88 0.0963 483.21
Error 1 2 17904 0.00388 4.57 0.3503 33.26
Legume species 4 388360* 0.21797** 8296.32** 2.4003** 871.67*
Interaction
(Production system x legume)
4 151359 0.03520 5.37 0.0797 6.20
Error 2 16 20194 0.01377 17.05 0.2003 22.44
Total 29
* Significant at ≤ 5%, ** Significant at ≤ 1%

132
Appendix 12. Analysis of variance table showing MSS of weed occurrence (numbers per m2
) of the five (5) most common weed
species Oxalis latifolia (OL), macdonald‟s eye (ME), black jack (BJ), nut grass (NG) and love grass (LG) under the best
six legumes (crotalaria, mucuna, neontonia, silver leaf desmodium, Vicia benghalensis and soyabean) in weed
suppression in sole and intercropped systems at 7 and 24 WAP
.Source of variation DF Mean sum of squares (MSS)
7 WAP 24 WAP
OL ME BJ NG LG OL ME BJ NG LG
Replication 2 3371 4048 281.5 8963 56.38 64.45 22.57 23.24 1.238 0.00
Production system
(Sole / intercrop)
1 8802 92966 39009 40735 137.5 298.7 2.88 0.60 4.61 0.00
Error 1 2 4875 3431 1349 10136 166.1 65.31 30.1 2.95 1.238 0.00
Legume species 6 527** 25440** 2182* 2025 147.3 222.1* 251.6** 342.5** 11.079** 0.00
Interaction
(Production system x
legume)
6 9935 17188 1871 2118 35.3 201.6 61.33 51.82 1.556 0.00
Error 2 24 3092 3202 560 1466 59.68 46.99 13.64 10.65 2.127 0.00
Total 41 80030.5 3110.48 440542 138978 190728 2674.4 40 (1) 2313.07 136.48 4228.48
* Significant at ≤ 5%, ** significant at ≤ 1%

133
Appendix 13. Analysis of variance table showing MSS of weed occurrence WO (numbers per m2), weed biomass WB (kg/ha), for
food legumes (mwitemania bean, soya bean 4, soya bean 17 and dolichos) at 7 WAP in sole and intercrop systems
Mean sum of sums (MSS)
Source of variation DF WO WB
Replication 2 40128 14068.1
Production system (Sole / intercrop) 1 231682 56723.4
Error 1 2 42488 7164.1
Legume species 5 148014** 126880.8**
Interaction
(Production system x legume)
5 57631 11520.3
Error 2 20 3192 950.2
Total 35
** significant at ≤ 1%

134
Appendix 14. Analysis of variance table showing MSS of weed occurrence (WO) (numbers per m2
), weed biomass (WB) (kg/ha), for
non food legumes {(mucuna (mottled), mucuna (grey), neontinia, canavalia, silver leaf desmodium, vicia benghalensis,
green leaf desmodium and crotalaria} at 7 and 24 WAP in sole and intercrop systems
Mean sum of sums (MSS)
7 WAP 24 WAP
Source of variation DF WO WB WO WB
Replication 2 97984 27455 60 22236
Production system (Sole / intercrop) 1 1125223 89679 10388.9 5190
Error 1 2 66199 41659 454.7 6598
Legume species 8 81680** 56025* 12145.1** 1718145**
Interaction
(Production system x legume)
8 50792 21631 3539.8 41630
Error 2 32 11840 15799 221.9 68713
Total 53
* Significant at ≤ 5%, ** significant at ≤ 1%

135
Appendix 15. Analysis of variance table showing MSS of weed occurrence (WO) (numbers per m2
), weed biomass (WB) (kg/ha), for
both all 13 legumes in sole and intercrop systems
Mean sum of sums (MSS)
7 WAP 24 WAP
Source of variation DF WO WB WO WB
Replication 2 127331 43024 60 22236
Production system
(Sole / intercrop)
1 965786 98373 10388.9 5190
Error 1 2 91227 36848 454.7 6598
Legume species 13 79851** 71209** 12145.1** 1718145**
Interaction
(Production system x legume)
13 47496 14129 3539.8 41630
Error 2 52 9285 10449 221.9 68713
Total 83
** significant at ≤ 1%. Weed analysis at 24 WAP covered non food legumes only.

136
Appendix 16. Analysis of variance table showing MSS of soil water content (%) with soil depth under mucuna, silver leaf
desmodium neontonia, and crotalaria in sole and intercropped systems at 11 and 30 WAP
Mean sum of sums (MSS)
11 WAP 30 WAP
Soil depth (cm) Soil depth (cm)
Source of variation DF 25 50 75 100 25 50 75 100
Replication 2 0.633 18.055 3.077 1.512 1.792 0.0555 2.395 1.0815
Production system
(Sole / intercrop)
1 64.927 0.001 1.236 1.177 52.658 0.3480 0.375 1.9011
Error 1 2 8.036 15.131 0.822 0.414 0.163 0.7831 0.768 1.1205
Legume species 4 16.659* 9.820 1.907 0.620 24.709** 13.689** 21.984** 25.516**
Interaction
(Production system x
legume)
4 2.639 5.089 5.005 0.867 18.527 1.7713 4.380 1.5932
Error 2 16 3.733 7.195 2.245 1.263 1.391 0.5377 1.573 0.8966
Total 29 219.183 241.127 72.608 31.195 251.774 72.5066 136.961 129.087
* Significant at ≤ 5%, ** significant at ≤ 1%
Related Documents