MGT 5155 A: TOPICS IN BUSINESS ANALYTICS Wake Forest University MBA: Fall 2013 Jonathan P Pinder PhD • [email protected] • 336 Farrell Hall Objectives: 1) To develop a high level business analytics modeling process using data mining, predictive modeling, and agent-based models. 2) To learn specific statistical techniques for predictive modeling. 3) To learn specific simulation techniques for agent-based modeling. Grading: Mid-term Exam: 40% September 17, 2013 Final Exam: 60% October 15, 2013 Exams: Both the Mid-term and Final exams will consist of a take-home component and an in-class component (3-5 short questions). The take-home components will consist of 2-3 problems, similar to the homework exercise sets discussed in class. Class Participation: You are expected to attend all classes prepared to ask questions, provide answers, and take an active part in the learning process. Read and be prepared to discuss the exercise sets. Class discussions will center on the examples in the exercise sets, so you are expected to be thoroughly prepared to discuss each example and exercise set. Your questions and comments should demonstrate that you have thoroughly read and synthesized the assigned material. Failure to fully participate, especially due to lack of preparation, will result in at least a THREE level downward adjustment to your final grade (e.g., A to B, B+ to C+, C+ to F, etc.).

Welcome message from author
This document is posted to help you gain knowledge. Please leave a comment to let me know what you think about it! Share it to your friends and learn new things together.
Transcript
MGT 5155 A: TOPICS IN BUSINESS ANALYTICS Wake Forest University MBA: Fall 2013
Jonathan P Pinder PhD • [email protected] • 336 Farrell Hall
Objectives:
1) To develop a high level business analytics modeling process using data mining, predictive modeling, and
agent-based models.
2) To learn specific statistical techniques for predictive modeling.
3) To learn specific simulation techniques for agent-based modeling.
Grading:
Mid-term Exam: 40% September 17, 2013
Final Exam: 60% October 15, 2013
Exams:
Both the Mid-term and Final exams will consist of a take-home component and an in-class component (3-5 short
questions). The take-home components will consist of 2-3 problems, similar to the homework exercise sets
discussed in class.
Class Participation:
You are expected to attend all classes prepared to ask questions, provide answers, and take an active part in the
learning process. Read and be prepared to discuss the exercise sets. Class discussions will center on the
examples in the exercise sets, so you are expected to be thoroughly prepared to discuss each example and
exercise set. Your questions and comments should demonstrate that you have thoroughly read and synthesized
the assigned material. Failure to fully participate, especially due to lack of preparation, will result in at least a
THREE level downward adjustment to your final grade (e.g., A to B, B+ to C+, C+ to F, etc.).

Business Analytics, Fall 2013- Syllabus 2
Grade Definitions:
Letter grades will be assigned according to the following values:
Grade Value Description
A 94%
A- 90% Proficient: All major and minor managerial and learning issues achieved
B+ 86%
B 82% Competent: Most major and most minor managerial and learning issues achieved
B- 78%
C+ 74% Literate: Several major and many minor managerial and learning issues NOT achieved
C 70%
F 0% Not Competent: Student is unprepared for advanced work
Readings:
Excerpts from::
Business Statistics, A First Course, by Sharpe, De Veaux, and Velleman, 2011
The Practice of Statistics for Business and Economics, 3rd Edition, by Moore, McCabe, Alwan, Craig, Duckworth, 2011
Data Mining In Excel, by Shmueli, Patel, and Bruce, 2005 (or newer)
Applied Logistic Regression, 2nd Edition, Hosmer and Lemeshow, 2000
Agent-Based Models, by Nigel Gilbert, Sage Publications, 2008, ISBN (0-324-32359-X)
are provided on Sakai.
Office Hours:
Tuesdays and Thursdays: 2:30 – 4:00
Laptops & Cell Phones:
The use of laptops, cell phones, and other web-enabled devices in class is prohibited at all times. There will be
no exceptions.
Honor Code:
The class is conducted in accordance with the Wake Forest University honor code. I assume that there will be
no cheating and that students act responsibly and professionally during exams. Any violations will result in an
immediate F for the course as well as consequences as imposed by the Honor Council.
More specifically, it is imperative that students discover the learning process in their own fashion. Therefore,
for this course, the following actions will also result in failing this course:
1) To ask for, or otherwise seek, class materials from students, or others, who have previously taken this class.
2) To accept class materials from others who have previously taken a similar class.
3) Conveying information regarding exams.
“Class materials” include, but are not limited to notes, exams, quizzes, spreadsheets (or other software), or
other forms of written or verbal “solutions”.
Learning Assistance Center:
If you have a disability or need special consideration, please contact the Learning Assistance Center at 758-5929
in the first 2 weeks of class.

Business Analytics, Fall 2013- Syllabus 3
Emergency Course Continuation Plan:
1. Continue to read all materials and lecture notes as indicated in the syllabus. Be sure to download all class
material onto your computer or onto a CD/DVD so that you will have access to it in case of internet
connectivity interruptions during an emergency.
2. Write answers to the learning objectives for each class (100-150 words each). Submit to the appropriate
professor as soon as feasible via email. If internet resources are not available, send via regular post office
mail to:
Jonathan P. Pinder
School of Business
Wake Forest University
PO Box 7897
336 Farrell Hall
Winston-Salem, NC 27109
3. If both email and U.S. Postal Service are interrupted for a period of time, complete the assignments above
in a timely manner and hold the written material until communications methods are restored.

Business Analytics, Fall 2013- Syllabus 4
BUSINESS ANALYTICS 2 - SCHEDULE – Fall 2013
Session Date Day Module Topic Readings Assignment
1 Aug 27 Th Data Mining:
Exploring the data
Overview:
Data Mining,
Predictive
Modeling, &
Optimization
Intro to Data
Mining
2 Aug 29 T Data Mining Credit Scoring
Example Pilot Bank
3 Sept 3 Th Logistic Regression:
Probabilities from data
Logit & MLE
estimation
A Good Lead Is
Hard To Find;
SPB: Example
8.2.1 Personal
Loan p.133
Logistic Regression
Exercises
4 Sept 5 T
Ch 1 H&L Logistic Regression
Exercises
5 Sept 10 Th Multinomial
MLE estimation Ch 8 H&L
Multinomial
Logistic Regression
Exercises
6 Sept 12 T Application
Multinomial
Logistic Regression
Exercises
7 Sept 17 Th Midterm Exam
8 Sept 19 T
Agent-Based
Models: Using
probability to make
optimal decisions
Intro To ABM Gilbert; Agent-
Based Models NetLogo Examples
9 Sept 24 Th
Simulating
Individuals
(Agents)
Macal & North;
Tutorial on
Agent-Based
Modeling
ABM 1
10 Sept 26 T
ABM 1
11 Oct 1 Th Developing
ABMs
WSJ Facebook
&St. Petersburg
Paradox
ABM II
12 Oct 3 T
ABM II
13 Oct 8 Th Using Agents to
optimize ABM Optimization
14 Oct 10 T
ABM Optimization
15 Oct 15 Th Final Exam

Business Analytics, Fall 2013- Syllabus 5
Data Mining Exercises
Type I Error = Probability of a False Positive. Type II Error = Probability of Failure to Detect.
1. One percent of people at age 40 who participate in routine cancer screenings have cancer. 80% of people
with cancer will get positive screenings. 10% of people without cancer will also get positive screenings.
This type of question has been asked of physicians and medical students with very small proportion of
them answering correctly.
a. Construct a contingency table for this problem and draw a probability tree for this problem.
b. In a routine screening, a person in this age group had a positive screening. What is the probability that the
person actually has cancer?
c. State relevant joint, marginal and conditional probabilities for this problem and their managerial relevance
d. Identify the Type I and Type II errors, their probabilities, and their consequences.

Business Analytics, Fall 2013- Syllabus 6
2. There is a controversy over the practice of insurance companies using credit ratings as an input to
determining car insurance premiums1. Consider this information: 2% of those insured file a claim. 90% of
claims are filed by customers with bad credit ratings. Of the customers who do not file claims, 95% have
good credit ratings.
a) The probability of a Type I Error =
b) Given a good credit rating, the probability of a customer filing a claim =
c) Managerial interpretation of a) & b) is:
1: http://bucks.blogs.nytimes.com/2011/06/22/want-to-pay-less-for-car-insurance-have-good-credit/
Business Analytics, Fall 2013- Syllabus 7
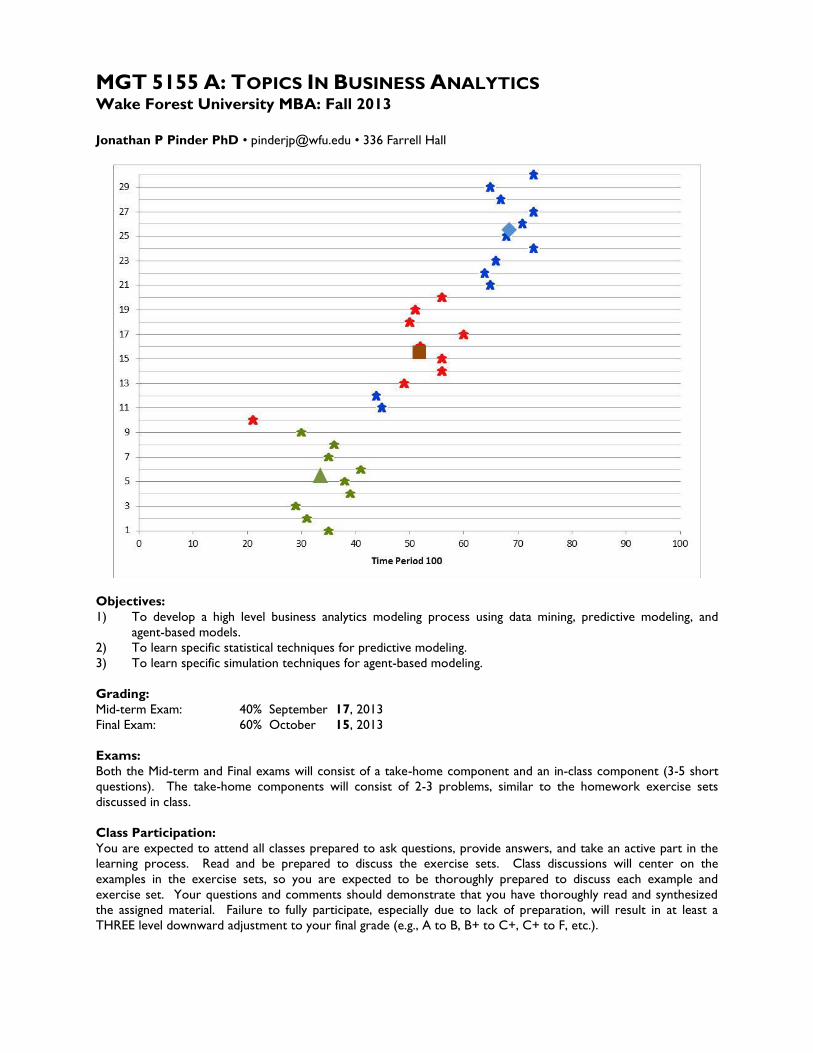
Logistic Regression Exercises
y =
e( 0 1 x )
1 e( 0 1 x )
=
1
1 e ( 0 1 x )
; y is the cumulative probability of an event; usually estimated as the
proportion belonging to a specific group.
1. Car Max would like to develop a predictive model to determine the likelihood of demand for various cars.
For a sample of customers, gender, marital status, age were recorded and 3 attributes of the cars
purchased: country of manufacture, size of car, and type of car. Initially, you are interested in the
relationship between gender and country of manufacture. Here are the results from the 303 consumers.
Use both a Chi-Square and a logistic regression to analyze the relationship between gender and country
of manufacture.
Gender
Country Female Male
US 54 61
Other 84 104
2. A study compared demographic characteristics of people who use the Internet for travel arrangements
and of people who do not. Of 1132 Internet users, 643 had completed college. Among the 852
nonusers, 349 had completed college. Use both a Chi-Square and a logistic regression to analyze the
relationship between college and Internet usage.
3. 1,000 homes were given coupons for a product. The coupons offered different price reductions ($0.25,
$0.50, $0.75, $1.00, and $1.50). 200 homes were randomly appointed to each of the price reduction
levels. The number of coupons redeemed is given below. Estimate a logit model to test whether coupon
value is a significant factor in for coupon redemption, and determine the critical coupon value at which
consumers are more likely than not to redeem the coupon. What other factors would you consider in
developing an optimum coupon system/
Coupon Value Households Redeemed
0.25 200 32
0.50 200 51
0.75 200 70
1.00 200 103
1.50 200 148
Business Analytics, Fall 2013- Syllabus 8
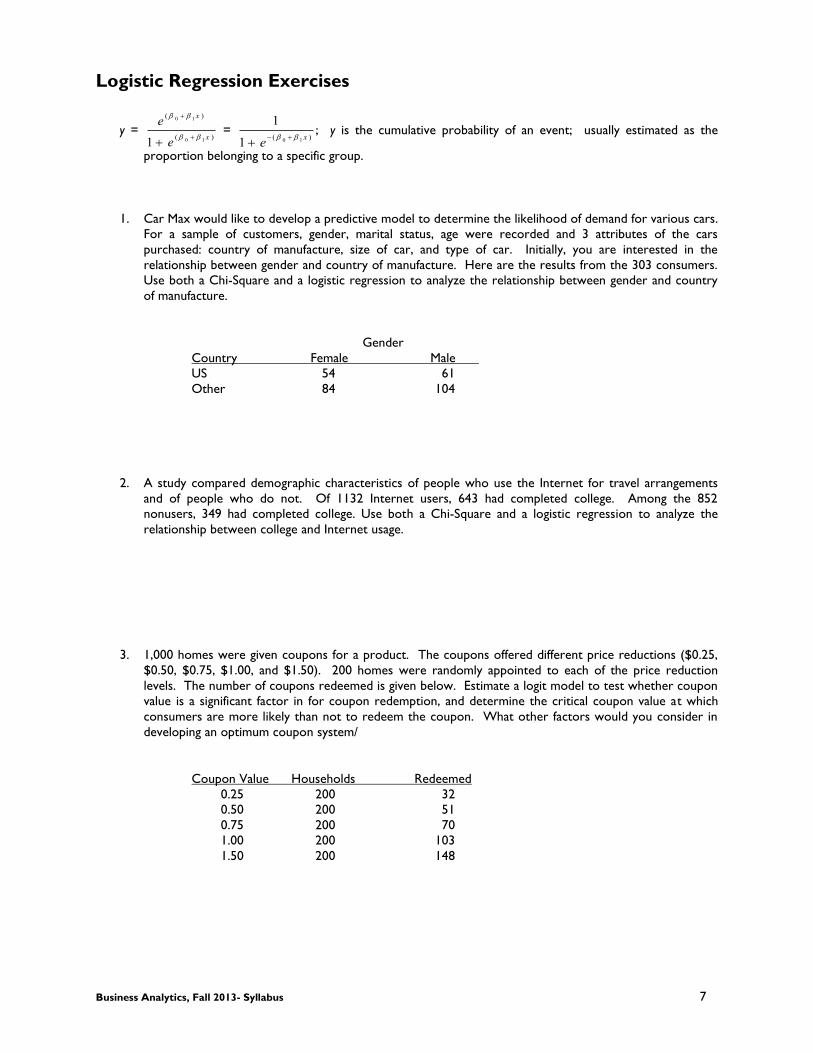
4. The annual incomes of 600 purchasers of Hondas and Acuras are tabulated below. Estimate a logit model
to test whether annual income is a significant factor in buyer preference, and determine the critical
income at which buyers are more likely to purchase an Acura than a Honda.
Product Income Count
Honda 35 138
Acura 35 12
Honda 45 145
Acura 45 25
Honda 55 58
Acura 55 47
Honda 65 36
Acura 65 49
Honda 75 27
Acura 75 63
5. 20 highway construction contracts were discussed during a trial and several were determined, through
corroborating testimony, to be colluded. Use the ratio of the contractors’ bids to the state Department
of Transportation estimated cost (including profit) to build a logit model to estimate the probability of a
contract being rigged. What is your critical value? What are some of the problems associated with
building and using this model?
Collusion Bid/Est ratio
no 1.03832394
no 1.04678272
no 0.97692481
no 0.92547517
no 0.96356347
no 0.98367323
yes 1.06244465
yes 1.32546552
no 0.91998217
yes 1.01491127
no 1.00146506
no 0.96446551
no 0.92746178
no 0.89338949
yes 1.17891914
no 1.10371689
no 1.03111041
no 1.12453782
no 1.0364084
yes 1.19791717
Business Analytics, Fall 2013- Syllabus 9
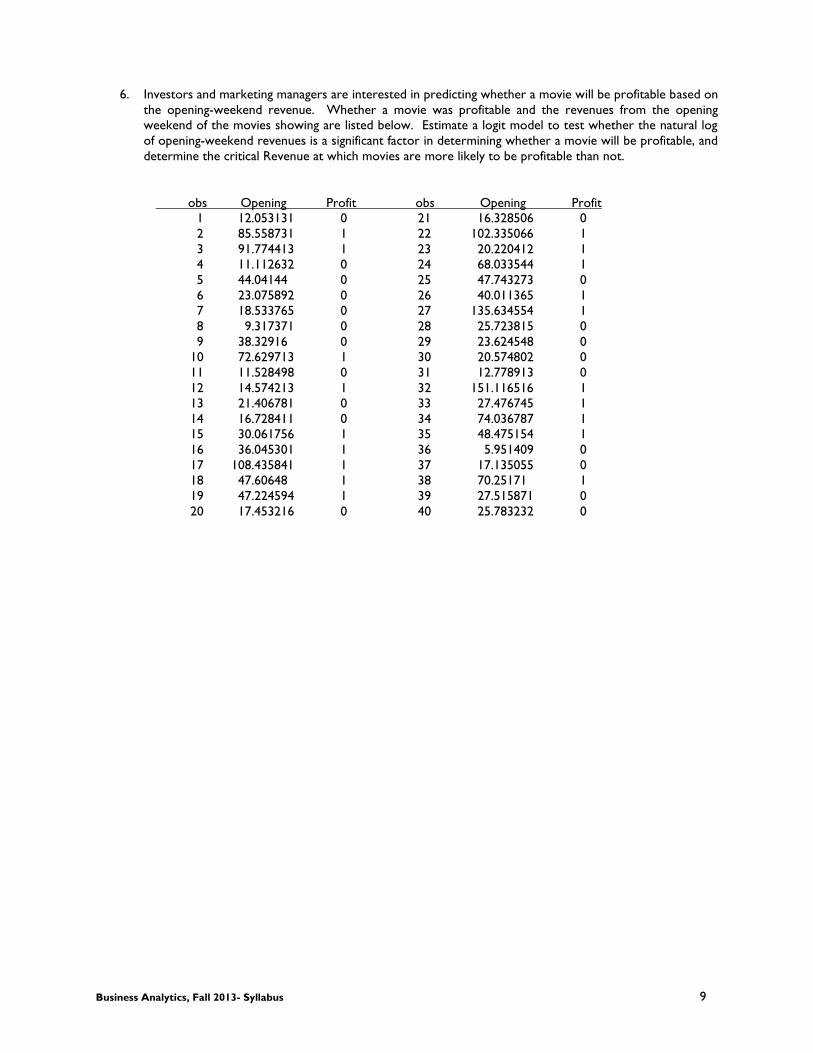
6. Investors and marketing managers are interested in predicting whether a movie will be profitable based on
the opening-weekend revenue. Whether a movie was profitable and the revenues from the opening
weekend of the movies showing are listed below. Estimate a logit model to test whether the natural log
of opening-weekend revenues is a significant factor in determining whether a movie will be profitable, and
determine the critical Revenue at which movies are more likely to be profitable than not.
obs Opening Profit obs Opening Profit
1 12.053131 0 21 16.328506 0
2 85.558731 1 22 102.335066 1
3 91.774413 1 23 20.220412 1
4 11.112632 0 24 68.033544 1
5 44.04144 0 25 47.743273 0
6 23.075892 0 26 40.011365 1
7 18.533765 0 27 135.634554 1
8 9.317371 0 28 25.723815 0
9 38.32916 0 29 23.624548 0
10 72.629713 1 30 20.574802 0
11 11.528498 0 31 12.778913 0
12 14.574213 1 32 151.116516 1
13 21.406781 0 33 27.476745 1
14 16.728411 0 34 74.036787 1
15 30.061756 1 35 48.475154 1
16 36.045301 1 36 5.951409 0
17 108.435841 1 37 17.135055 0
18 47.60648 1 38 70.25171 1
19 47.224594 1 39 27.515871 0
20 17.453216 0 40 25.783232 0

Business Analytics, Fall 2013- Syllabus 10
Multinomial Logistic Regression Exercises
yj =
e( 0 j 1 j x )
e( 0 j 1 j x )
j
; y is the cumulative probability of an event; usually estimated as the proportion belonging
to a specific group.
1. The CreditScore data lists the credit score and the associated loans status for each account. A closed
account can be classified as one of 4 states: term (paid in full through all payments), prepaid (paid in full
before term), arrears (behind in payments but not defaulted, future payments may resume), default
(payments have ceased and will not continue).
a. Estimate a predictive model based on the credit scores.
b. Calculate the probabilities for each state, and most likely state, for each credit score.
2. Amazon uses various types of data to predict which products will appeal to various customers. The
ProductChoice data lists the gender and total expenditures at Amazon for the previous 12 months for a
sample of 63 customers. Use this data to estimate a predictive model for brand preference.
a. Estimate the main effects models and the model with interaction.
b. If a female has spent $250 in the past 12 months, which type of product is she most likely to buy?
Calculate the specific probability of buying each type of product.
c. Which groups/expenditures have the highest probability of buying books?
3. The BrandPref data lists region, income, and brand of product for a sample. Use this data to estimate a
predictive model for brand preference.
a. Estimate the main effects models and the model with interaction.
b. If a family from the east has an annual income of $72,000, which product is the family most likely to
buy? Calculate the specific probability of buying each product.
c. Which groups/income have the highest probability of buying C?
4. Car Max would like to develop a predictive model to determine the likelihood of demand for various cars.
For a sample of customers, gender, marital status, age were recorded (CarPoll data) and 3 attributes of the
cars purchased: country of manufacture, size of car, and type of car.
a. Using exploratory data analysis, develop an influence diagram and state the major relationships.
b. Estimate the main effects and interaction models for each car parameter.
c. Estimate the type of car (include the relevant probabilities) for various age, gender, marital statuses.

Business Analytics, Fall 2013- Syllabus 11
NetLogo Examples
View these examples, and consider the following:
a. What are the agents and their attributes?
b. What business settings might the Ecology Examples represent?
c. How might you use Excel to model similar settings?
http://ccl.northwestern.edu/netlogo/models/
Ecology Examples:
Simple Birth Rates http://ccl.northwestern.edu/netlogo/models/SimpleBirthRates
Altruism http://ccl.northwestern.edu/netlogo/models/Altruism
Flocking http://ccl.northwestern.edu/netlogo/models/Flocking
Shepherds http://ccl.northwestern.edu/netlogo/models/Shepherds
Wolf Sheep Predation http://ccl.northwestern.edu/netlogo/models/WolfSheepPredation
Cooperation http://ccl.northwestern.edu/netlogo/models/Cooperation
Life http://ccl.northwestern.edu/netlogo/models/Life
Probability/Statistics Examples:
Galton Box http://ccl.northwestern.edu/netlogo/models/GaltonBox
Expected Value http://ccl.northwestern.edu/netlogo/models/ExpectedValue
Three Doors http://ccl.northwestern.edu/netlogo/models/ThreeDoors
Business Examples:
Bank Reserves http://ccl.northwestern.edu/netlogo/models/BankReserves
Team Assembly http://ccl.northwestern.edu/netlogo/models/TeamAssembly

Business Analytics, Fall 2013- Syllabus 12
Agent-Based Modeling Exercises – Set 1
1. Bayesian Analysis: A soft drink company employs drivers to deliver products and stock them in
grocery stores. Applicants for this position are given a pre-employment test to increase the likelihood of
reliability and retention. Test questions are multiple-choice questions and each has five possible answers.
Solve this with an Agent-based model. Check your answer with algebra and with Bayes Theorem.
a. Assume that all guesses are equally likely. If 60% of the respondents got the correct answer, what is
the percentage of applicants who actually know the correct answer?
b. Assume that test takers can rule out 1 answer. If 60% of the respondents got the correct answer,
what is the percentage of applicants who actually know the correct answer?
c. Assume that test takers can rule out 2 answers. If 68% of the respondents got the correct answer,
what is the percentage of applicants who actually know the correct answer?
d. Assume that one of the questions is ruled out by all but 5% and that the other 4 questions are equally
likely. If 30% of the respondents got the correct answer, what is the percentage of applicants who
actually know the correct answer?
2. Bayesian Analysis: A bank is reviewing its credit card policy to ameliorate the default risk for credit
cards. In the past, approximately 5% of cardholders have defaulted and the bank has been unable to
collect the outstanding balance. Thus management has established a prior probability of 0.05 that any
particular cardholder will default. The bank has further found that the probability of missing one or more
monthly payments for those customers who do not default is 0.20. Of course the probability of missing
one or more payments for those who default is 1.
a. Given that a customer has missed a monthly payment, calculate the probability that the customer will
default.
b. The bank would like to recall its card if the probability that a customer will default is greater than
0.20. Should the bank cancel a card if the customer misses a monthly payment? Why or why not?
c. Solve this problem graphically.
d. Solve this analytically using notation.
e. Solve this problem with an agent-based simulation.
3. Bivariate Probability Distribution: There are two people going to a concert that starts at 9pm. Each
person will arrive at the concert independently between 8 and 9pm. Assume their arrival times are
independently uniformly distributed over 8-9. Whoever arrives first will wait for the other one outside,
so that they can go in to the event together. They also agree to two rules. First, if it is 8:50 and you are
waiting, then wait no longer and go in. Second, if you have been waiting for 10 minutes, then wait no
longer and go in. What is the probability that the two people will actually meet outside before going in?
a. Solve this problem with a Monte Carlo simulation.
b. Solve this problem graphically.
c. Solve this problem with a graphical simulation.
d. Solve this problem with an agent-based simulation.
e. Solve this analytically using notation.

Business Analytics, Fall 2013- Syllabus 13
4. Individual Demand Model: A local dairy supplies 150 local restaurants with ice cream for their
desserts each week. The ice cream is produced once a week before orders are taken and cannot be
stored for longer than a week (unsold must be discarded). How much ice cream should be produced each
week if the selling price to restaurants is $10/gallon and the cost to the dairy is $6.50/gallon?
a. Suppose each restaurant has a 30% chance of ordering a gallon of ice cream each week. How much
ice cream should be produced?
b. Suppose the restaruants are grouped according to their level of demand and their probabilities of
ordering a gallon of ice cream each week are given in the table below. How much ice cream should
be produced?
Number of Restaurants Prob(Order 1 gallon)
25 10%
30 20%
45 30%
35 40%
15 50%
5. The Galton Board, also known as a quincunx or bean machine, is a device for statistical experiments
named after English scientist Sir Francis Galton. It consists of an upright board with evenly spaced nails (or
pegs) driven into its upper half, with the nails arranged in staggered order, and a lower half divided into a
number of evenly-spaced rectangular slots. The front of the device is covered with a glass cover to allow
viewing of both nails and slots. In the middle of the upper edge, there is a funnel into which balls can be
poured, where the diameter of the balls must be much smaller than the distance between the nails. The
funnel is located precisely above the central nail of the first row so that each ball, if perfectly centered,
would fall vertically and directly onto the uppermost point of this nail's surface. The figure below shows a
stylized version of a Galton Board; see http://www.youtube.com/watch?v=9xUBhhM4vbM for an actual
Galton Board in action.
Each time a ball hits one of the nails, it can bounce right (or left) with some probability p (and 1-p). For
symmetrically placed nails, balls will bounce left or right with equal probability.
Thus, this process gives rise to a binomial distribution of in the heights of heaps of balls in the lower slots.
If the number of balls is sufficiently large, then according to the Central Limit Theorem, the distribution of
the heights of the ball heaps will approximate a normal distribution.
a. Construct a Galton Board as an agent based simulation.
b. What statement in the Central Limit Theorem creates the Normality exhibited in the Galton Board?

Business Analytics, Fall 2013- Syllabus 14
6. In 1989 Money magazine assessed the performance of 277 mutual funds over the previous 10 years. For
each of the 10 years, they determined which funds performed better than the S&P 500. The research
showed that five of the 277 funds performed better than the S&P 500 for eight or more of the 10 years.
Investment portfolios constructed by blindfolded monkeys throwing darts at the Wall Street Journal, have
a 50% probability of performing better than the S&P 500.
a. Create an agent-based simulation to determine the number of Monkey funds that would be expected
to outperform the S&P 500.
b. How does this problem relate to the Galton Board?
c. Use the insight of c. to solve the problem analytically.
7. A miner is trapped in a mine containing three doors. The first door leads to a tunnel that will take him to
safety after three hours of travel. The second door leads to a tunnel that will return him to the mine
after five hours of travel. The third door leads to a tunnel that will return him to the mine after seven
hours. (from Introduction to Probability Models 10th edition, Sheldon Ross)
a. Assume that the miner marks the doors before he enters a tunnel so as to avoid re-entering the
tunnel later, what is the expected length of time until he reaches safety?
b. Assume that the miner is at all times equally likely to choose any one of the doors (dope … this is
the original problem statement), what is the expected length of time until he reaches safety?
8. The Monty Hall problem is a probability puzzle loosely based on the American television game show Let's
Make a Deal. The name comes from the show's original host, Monty Hall.
The problem was originally posed in a letter by Steve Selvin to the American Statistician in 1975. A well-
known statement of the problem was published in Marilyn vos Savant's "Ask Marilyn" column in Parade
magazine in 1990:
Suppose you're on a game show, and you're given the choice of three doors: Behind one door is a car;
behind the others, goats. You pick a door, say No. 1, and the host, who knows what's behind the doors,
opens another door, say No. 3, which has a goat. He then says to you, "Do you want to pick door No. 2?"
Is it to your advantage to switch your choice?
(http://en.wikipedia.org/wiki/Monty_Hall_problem)

Business Analytics, Fall 2013- Syllabus 15
a. Construct an agent based simulation to determine the optimum strategy for this problem.
b. Suppose that the winning prize is worth $100 … determine what loss would make the expected value
= $0 (thus making this a “fair game” using simulation.
c. Show what happens if some agents can observe other groups and learn or become discouraged.
Business Analytics, Fall 2013- Syllabus 16
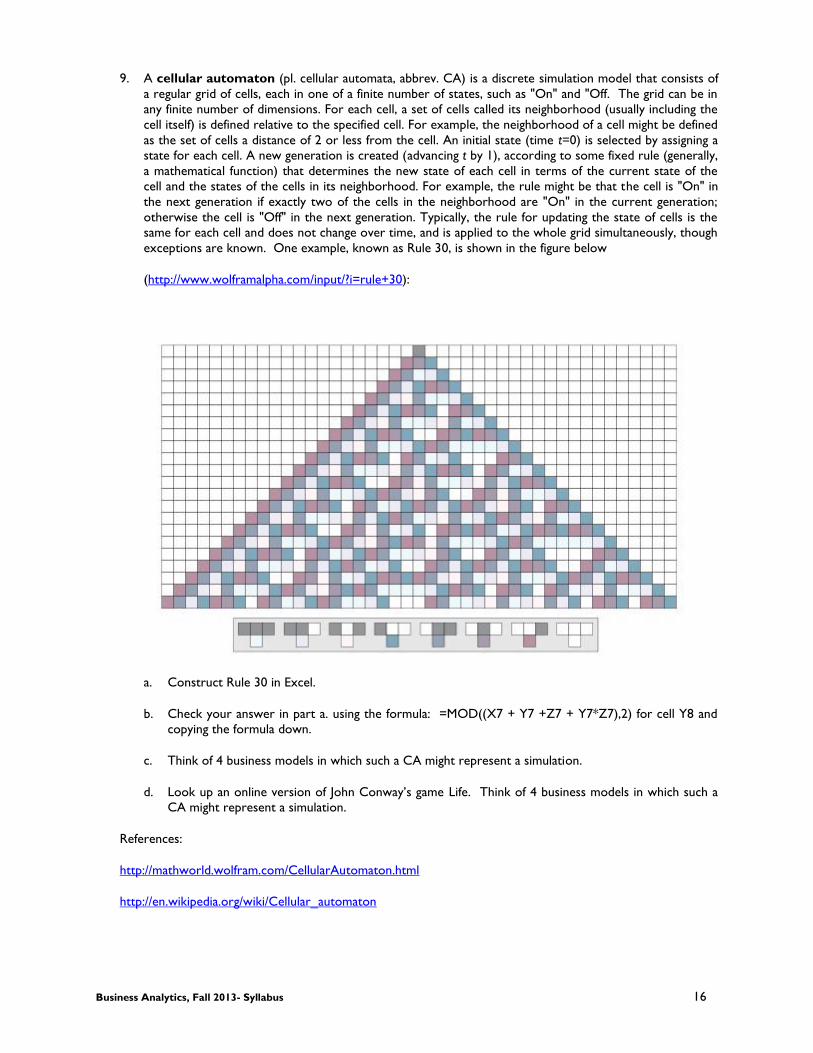
9. A cellular automaton (pl. cellular automata, abbrev. CA) is a discrete simulation model that consists of
a regular grid of cells, each in one of a finite number of states, such as "On" and "Off. The grid can be in
any finite number of dimensions. For each cell, a set of cells called its neighborhood (usually including the
cell itself) is defined relative to the specified cell. For example, the neighborhood of a cell might be defined
as the set of cells a distance of 2 or less from the cell. An initial state (time t=0) is selected by assigning a
state for each cell. A new generation is created (advancing t by 1), according to some fixed rule (generally,
a mathematical function) that determines the new state of each cell in terms of the current state of the
cell and the states of the cells in its neighborhood. For example, the rule might be that the cell is "On" in
the next generation if exactly two of the cells in the neighborhood are "On" in the current generation;
otherwise the cell is "Off" in the next generation. Typically, the rule for updating the state of cells is the
same for each cell and does not change over time, and is applied to the whole grid simultaneously, though
exceptions are known. One example, known as Rule 30, is shown in the figure below
(http://www.wolframalpha.com/input/?i=rule+30):
a. Construct Rule 30 in Excel.
b. Check your answer in part a. using the formula: =MOD((X7 + Y7 +Z7 + Y7*Z7),2) for cell Y8 and
copying the formula down.
c. Think of 4 business models in which such a CA might represent a simulation.
d. Look up an online version of John Conway’s game Life. Think of 4 business models in which such a
CA might represent a simulation.
References:
http://mathworld.wolfram.com/CellularAutomaton.html
http://en.wikipedia.org/wiki/Cellular_automaton

Business Analytics, Fall 2013- Syllabus 17
Agent-Based Modeling Exercises – Set 2
1. An analyst for a computer firm is trying to determine the optimum price for new e-reader. The variable
cost of the e-reader is $50. As an experiment, 200 units for each of 6 price points were offered in 6
similar test markets (see table below). Develop an agent-based model to determine the optimum price
and quantity based on the price/quantity pairings given below:
Price Quantity Sold
$100 65
$125 54
$150 41
$175 30
$200 27
$225 24
2. St. Petersburg Paradox: A person tosses a fair coin until a tail appears for the first time. Each time a
heads comes up – before the game ending tail – the pot is doubled. Thus, if the initial pot is $1 and the
tail appears on the nth flip, the person wins $2n-1. Let X denote the player’s winnings (from Introduction to
Probability Models 10th edition by Sheldon Ross), also see:
“Facebook and the St. Petersburg Paradox,” Wall Street Journal Feb. 4, 2012 (in the readings pdf)
http://en.wikipedia.org/wiki/St._Petersburg_paradox#The_paradox)
a. What is the expected value of this game?
b. What would be a ‘fair’ price to enter this game?
c. Would you be willing to pay $50,000 to play each game if you could play for as long as you liked and
only have to settle up when you stopped playing?
3. Kelly Betting (from Fortune’s Formula by William Poundstone): Consider a game in which each play you
are offered a gamble with 2/3 probability of winning and 1/3 probability of losing. You may bet any positive
amount you like, provided you have it. The amount you bet is either doubled or lost, independently each
play. This gamble is only offered for 20 plays. Construct an agent-based model to determine how much
should you bet on each play?

Business Analytics, Fall 2013- Syllabus 18
4. An Insurance Risk Model (from Simulation 3rd edition by Sheldon Ross): Construct an Agent-Based
model of an insurance company using the following conditions:
• The initial number of customers is n0 = 500.
• The initial capital is a0 = $5,000,000.
• There is a 1% chance that non-customers will become customers. A possible alternative assumption
is that new customers sign up according to a Poisson processes with a common rate λarrival =
15/month
• Each policyholder pays the insurance firm at a fixed rate c = $100 per month.
• Customers in this risk class average 1 claim about every 2 years and that each claim amount has
distribution N(µ, σ2) = N($10,000, $5002) .
• Policyholders remain with the insurance firm for an average of 36 months.
a. Create an Agent-Based Model to estimate the probability that the firm’s capital is always nonnegative
at all times up to Time T
b. How would you determine a ’fair’ rate to charge for c?
c. The range over which the model parameters are stable; i.e., at what point does the models behavior
significantly change as the model parameters change?

Business Analytics, Fall 2013- Syllabus 19
Agent-Based Modeling Optimization Exercises
1. Knapsack problems are applied to decision-making processes such as the finding the least wasteful
cutting of raw materials, selection of capital investments and financial portfolios, selection of assets for
asset-backed securitization.
As an example, consider the situation of getting lost while hiking in the wilderness. The table below
shows all of the items that are available to you that will aid you in your hike out of the wilderness.
Containers of food and water will give you energy; shelter will protect you from the elements; and
defense will protect you from wild animals. Each item has a weight (lbs) and survival points. You must
take one item from each category. Unfortunately, the backpack you have has a maximum capacity of 25
lbs. Your chance of survival is calculated by adding all of the survival points together from the items you
choose to take with you. Construct an Agent-Based Model to determine the optimum knapsack load.
Extra Credit: Cite the source for “Emotional Knapsack”.
Category Weight (lbs) Survival (points)
Food 5 10
8 20
12 25
Water 3 10
5 20
8 25
Shelter 5 5
8 15
12 20
Defense 1 5
2 15
3 20

Business Analytics, Fall 2013- Syllabus 20
2. The stagecoach problem (shortest route problem) is a classic problem in dynamic programming. It was
developed by Professor Harvey M. Wagner while he was at Stanford University. It concerns a mythical
fortune seeker in Missouri who decided to go west to join the gold rush in California during the mid-19th
century. The journey would require traveling by stagecoach through unsettled country where there was
serious danger of attack by marauders. Although his starting point and destination were fixed, he had
considerable choice as to which states (or territories that subsequently became states) to travel through
en route. The possible routes, and their corresponding distances, are shown in the diagram below, where
each state is represented by a circled letter.
Thus four stages (stagecoach runs) were required to travel from his point of embarkation in state A
(Missouri) to his destination J (California).
This fortune seeker was a prudent man who was quite concerned about his safety. After some thought,
he decided the safest route would be the shortest route (the distances are also shown in the diagram).
Construct an Agent-Based Model to determine the optimum route. For further reading, Google Shortest
Route Problem.

Business Analytics, Fall 2013- Syllabus 21
3. A company will soon be introducing a new product into a very competitive market and so is currently
planning its marketing strategy. The decision has been made to introduce the product in three phases.
Phase 1 will feature making a special introductory offer of the product to the public at a greatly reduced
price to attract first-time buyers. Phase 2 will involve an intensive advertising campaign to persuade these
first-time buyers to continue purchasing the product at a regular price. It is known that another company
will be introducing a new competitive product at about the same time phase 2 will end. Therefore phase
3 will involve a follow-up advertising and promotion campaign to try to keep the regular purchasers from
switching to the competitive product.
A total of $5 million has been budgeted for this marketing campaign. The problem now is to determine
how to most effectively allocate this money to the three phases. Let m denote the initial share of the
market expressed as a percentage attained in phase 1, f2 the fraction of this market share that is retained
in phase 2, and f3 the fraction of the remaining market share that is retain in phase 3. Given the data
outlined below, create an agent-based model to determine how to allocate the $5 million to maximize the
final share of the market for the new product, i.e., to maximize m(f2)(f3).
a. Assume that the money must be sent in integer multiples of $1 million in each phase where the
following table gives the estimated effect of expenditures in each phase:
Millions Effect on
of dollars market share
expended m f2 f3
0 0.30 0.50
1 10 0.50 0.70
2 15 0.70 0.85
3 22 0.80 0.90
4 27 0.85 0.93
5 30 0.90 0.95
b. Now assume that any amount within the total budget can be spent in each phase, with the estimated
effect of spending an amount xi (in millions of dollars) in phase i (i = 1, 2, 3) is:
m = 10xi – xi2
f2 = 0.40 + 0.10x2
f3 = 0.60 + 0.07x3
Related Documents