Metropolitan Social Environments and Pre-HAART/ HAART Era Changes in Mortality Rates (per 10,000 Adult Residents) among Injection Drug Users Living with AIDS Samuel R. Friedman 1 *, Brooke S. West 1 , Enrique R. Pouget 1 , H. Irene Hall 2 , Jennifer Cantrell 3 , Barbara Tempalski 1 , Sudip Chatterjee 4 , Xiaohong Hu 2 , Hannah L. F. Cooper 5 , Sandro Galea 6 , Don C. Des Jarlais 1,7 1 Institute of Infectious Disease Research, National Development and Research Institutes, Inc., New York, New York, United States of America, 2 Centers for Disease Control, Atlanta, Georgia, United States of America, 3 Legacy Foundation, Washington, D. C., United States of America, 4 Independent Consultant, Bangalore, India, 5 Department of Behavioral Sciences and Health Education, Emory University, Atlanta, Georgia, United States of America, 6 Department of Epidemiology, Columbia University, New York, New York, United States of America, 7 Baron Edmond de Rothschild Chemical Dependency Institute at Beth Israel Medical Center, New York, New York, United States of America Abstract Background: Among the largest US metropolitan areas, trends in mortality rates for injection drug users (IDUs) with AIDS vary substantially. Ecosocial, risk environment and dialectical theories suggest many metropolitan areas characteristics that might drive this variation. We assess metropolitan area characteristics associated with decline in mortality rates among IDUs living with AIDS (per 10,000 adult MSA residents) after highly active antiretroviral therapy (HAART) was developed. Methods: This is an ecological cohort study of 86 large US metropolitan areas from 1993–2006. The proportional rate of decline in mortality among IDUs diagnosed with AIDS (as a proportion of adult residents) from 1993–1995 to 2004–2006 was the outcome of interest. This rate of decline was modeled as a function of MSA-level variables suggested by ecosocial, risk environment and dialectical theories. In multiple regression analyses, we used 1993–1995 mortality rates to (partially) control for pre-HAART epidemic history and study how other independent variables affected the outcomes. Results: In multivariable models, pre-HAART to HAART era increases in ‘hard drug’ arrest rates and higher pre-HAART income inequality were associated with lower relative declines in mortality rates. Pre-HAART per capita health expenditure and drug abuse treatment rates, and pre- to HAART-era increases in HIV counseling and testing rates, were weakly associated with greater decline in AIDS mortality. Conclusions: Mortality among IDUs living with AIDS might be decreased by reducing metropolitan income inequality, increasing public health expenditures, and perhaps increasing drug abuse treatment and HIV testing services. Given prior evidence that drug-related arrest rates are associated with higher HIV prevalence rates among IDUs and do not seem to decrease IDU population prevalence, changes in laws and policing practices to reduce such arrests while still protecting public order should be considered. Citation: Friedman SR, West BS, Pouget ER, Hall HI, Cantrell J, et al. (2013) Metropolitan Social Environments and Pre-HAART/HAART Era Changes in Mortality Rates (per 10,000 Adult Residents) among Injection Drug Users Living with AIDS. PLoS ONE 8(2): e57201. doi:10.1371/journal.pone.0057201 Editor: Claire Thorne, UCL Institute of Child Health, University College London, United Kingdom Received May 3, 2012; Accepted January 22, 2013; Published February 21, 2013 This is an open-access article, free of all copyright, and may be freely reproduced, distributed, transmitted, modified, built upon, or otherwise used by anyone for any lawful purpose. The work is made available under the Creative Commons CC0 public domain dedication. Funding: This work was supported by National Institute of Drug Abuse grants # R01 DA013336 (Community Vulnerability and Responses to Drug-User-Related HIV/AIDS), R01 DA 003574 (Risk Factors for AIDS among Intravenous Drug Users), and 5T32 DA007233 (Behavioral Sciences Training in Drug Abuse Research program sponsored by Public Health Solutions and National Development and Research Institutes). The funders had no role in study design, data collection and analysis, decision to publish, or preparation of the manuscript. Competing Interests: The authors have declared that no competing interests exist. * E-mail: [email protected] Introduction Antiretroviral therapy (ART) can delay or prevent HIV-related mortality for people who inject drugs and who have access to and can adhere to treatment regimens [1]. While understanding individual characteristics is important for clinical decision making, public health strategies require a broader understanding of social environmental processes that shape mortality for high risk groups. These can include service provision adequacy and quality, plus other factors that affect levels of access to ART or treatment adherence. They may also include factors that affect mortality independently of, or in interaction with, ART access and use. Krusi et al. recently called for studies of social and structural determinants of ART access and adherence among injection drug users (IDUs) [2]. This paper aims at a related goal: it explores how characteristics of 86 large US metropolitan areas (MSAs) were associated with changes in AIDS mortality since the pre-HAART period among IDUs living with AIDS [3,4,5,6]. These exploratory analyses were guided by ecosocial, risk environment, and dialectical theories about how social environmental processes PLOS ONE | www.plosone.org 1 February 2013 | Volume 8 | Issue 2 | e57201

Welcome message from author
This document is posted to help you gain knowledge. Please leave a comment to let me know what you think about it! Share it to your friends and learn new things together.
Transcript
Metropolitan Social Environments and Pre-HAART/HAART Era Changes in Mortality Rates (per 10,000 AdultResidents) among Injection Drug Users Living with AIDSSamuel R. Friedman1*, Brooke S. West1, Enrique R. Pouget1, H. Irene Hall2, Jennifer Cantrell3,
Barbara Tempalski1, Sudip Chatterjee4, Xiaohong Hu2, Hannah L. F. Cooper5, Sandro Galea6, Don C. Des
Jarlais1,7
1 Institute of Infectious Disease Research, National Development and Research Institutes, Inc., New York, New York, United States of America, 2 Centers for Disease
Control, Atlanta, Georgia, United States of America, 3 Legacy Foundation, Washington, D. C., United States of America, 4 Independent Consultant, Bangalore, India,
5 Department of Behavioral Sciences and Health Education, Emory University, Atlanta, Georgia, United States of America, 6 Department of Epidemiology, Columbia
University, New York, New York, United States of America, 7 Baron Edmond de Rothschild Chemical Dependency Institute at Beth Israel Medical Center, New York, New
York, United States of America
Abstract
Background: Among the largest US metropolitan areas, trends in mortality rates for injection drug users (IDUs) with AIDSvary substantially. Ecosocial, risk environment and dialectical theories suggest many metropolitan areas characteristics thatmight drive this variation. We assess metropolitan area characteristics associated with decline in mortality rates among IDUsliving with AIDS (per 10,000 adult MSA residents) after highly active antiretroviral therapy (HAART) was developed.
Methods: This is an ecological cohort study of 86 large US metropolitan areas from 1993–2006. The proportional rate ofdecline in mortality among IDUs diagnosed with AIDS (as a proportion of adult residents) from 1993–1995 to 2004–2006was the outcome of interest. This rate of decline was modeled as a function of MSA-level variables suggested by ecosocial,risk environment and dialectical theories. In multiple regression analyses, we used 1993–1995 mortality rates to (partially)control for pre-HAART epidemic history and study how other independent variables affected the outcomes.
Results: In multivariable models, pre-HAART to HAART era increases in ‘hard drug’ arrest rates and higher pre-HAARTincome inequality were associated with lower relative declines in mortality rates. Pre-HAART per capita health expenditureand drug abuse treatment rates, and pre- to HAART-era increases in HIV counseling and testing rates, were weaklyassociated with greater decline in AIDS mortality.
Conclusions: Mortality among IDUs living with AIDS might be decreased by reducing metropolitan income inequality,increasing public health expenditures, and perhaps increasing drug abuse treatment and HIV testing services. Given priorevidence that drug-related arrest rates are associated with higher HIV prevalence rates among IDUs and do not seem todecrease IDU population prevalence, changes in laws and policing practices to reduce such arrests while still protectingpublic order should be considered.
Citation: Friedman SR, West BS, Pouget ER, Hall HI, Cantrell J, et al. (2013) Metropolitan Social Environments and Pre-HAART/HAART Era Changes in MortalityRates (per 10,000 Adult Residents) among Injection Drug Users Living with AIDS. PLoS ONE 8(2): e57201. doi:10.1371/journal.pone.0057201
Editor: Claire Thorne, UCL Institute of Child Health, University College London, United Kingdom
Received May 3, 2012; Accepted January 22, 2013; Published February 21, 2013
This is an open-access article, free of all copyright, and may be freely reproduced, distributed, transmitted, modified, built upon, or otherwise used by anyone forany lawful purpose. The work is made available under the Creative Commons CC0 public domain dedication.
Funding: This work was supported by National Institute of Drug Abuse grants # R01 DA013336 (Community Vulnerability and Responses to Drug-User-RelatedHIV/AIDS), R01 DA 003574 (Risk Factors for AIDS among Intravenous Drug Users), and 5T32 DA007233 (Behavioral Sciences Training in Drug Abuse Researchprogram sponsored by Public Health Solutions and National Development and Research Institutes). The funders had no role in study design, data collection andanalysis, decision to publish, or preparation of the manuscript.
Competing Interests: The authors have declared that no competing interests exist.
* E-mail: [email protected]
Introduction
Antiretroviral therapy (ART) can delay or prevent HIV-related
mortality for people who inject drugs and who have access to and
can adhere to treatment regimens [1]. While understanding
individual characteristics is important for clinical decision making,
public health strategies require a broader understanding of social
environmental processes that shape mortality for high risk groups.
These can include service provision adequacy and quality, plus
other factors that affect levels of access to ART or treatment
adherence. They may also include factors that affect mortality
independently of, or in interaction with, ART access and use.
Krusi et al. recently called for studies of social and structural
determinants of ART access and adherence among injection drug
users (IDUs) [2]. This paper aims at a related goal: it explores how
characteristics of 86 large US metropolitan areas (MSAs) were
associated with changes in AIDS mortality since the pre-HAART
period among IDUs living with AIDS [3,4,5,6]. These exploratory
analyses were guided by ecosocial, risk environment, and
dialectical theories about how social environmental processes
PLOS ONE | www.plosone.org 1 February 2013 | Volume 8 | Issue 2 | e57201
interact with individual and group creativity and activities to
create health outcomes. Ecosocial theories focus on how these
social environmental processes are embodied and incorporated
biologically over the life course to shape morbidity or mortality
[6]; risk environment theories focus more on qualitative insights
into the pathways connecting macrosocial and microsocial
environments and their relationships with individual agency [3];
and dialectical theory attempts to understand embodiment,
pathways and agency in terms of historically-developing processes
including collective organizing and thinking on the part of groups
of affected people [5].
Our attention is thus not on individual-level predictors of
mortality nor multilevel predictors of individual mortality, but
rather on predictors of change in area-level mortality rates (per
10,000 adult MSA population) among IDUs living with AIDS.
The change in such mortality is a good indicator of relative levels
of total system success or failure. This is because change in
mortality over a period of about 15 years may result from changes
in incidence of initiation into injection drug use (or of other
increases in drug injection); from changes in HIV incidence
among IDUs due to changes in risk behaviors or network
structures among IDUs; from changes in the time from HIV
incidence to HIV diagnosis; from changes in rates and timing of
entry into treatment after diagnosis; from changes in retention
once in care; and from changes in mortality rates of those who
remain in care [7].
Our prior research suggested that a number of variables related
to economic conditions, racial/ethnic inequalities, public finances,
social cohesion, and the population prevalence of arrests of drug
users in metropolitan areas are related to HIV prevalence among
IDUs or to the population prevalence of IDUs [8,9,10,11,12,13].
Most other research, however, has studied individual-level
predictors of outcomes. Meditz et al. [14] found that at an
individual level both race and geographic region affect clinical
outcomes of people newly infected with HIV, and Harrison, Song
and Zhang [15] showed that race/ethnicity is related to life
expectancy among people with HIV. Rubin, Colen and Link [16]
showed that socioeconomic status and race were associated with
HIV-related mortality in the US both before and after HAART
was introduced. IDUs who are in drug abuse treatment,
particularly those in methadone or buprenorphine treatment,
are more able to gain access to ART and to survive [17]. In a
recent review of the literature on ART access and adherence
among IDUs, Krusi et al. [2] suggested that structural variables
like social exclusion, housing availability and crowding, health care
system variables, access to drug abuse treatment, and drug policy
variables, like arrests, are likely to affect ART access and
adherence—and thus mortality rates.
This paper analyzes changes in metropolitan-area level mortal-
ity among IDUs with AIDS as a function of levels of, and/or
changes in, economic conditions, government finances, racial/
ethnic structures, social cohesion, interventions such as drug abuse
treatment, HIV counseling and testing, hard drug arrest rates, and
epidemiologic factors like IDU population prevalence and HIV
prevalence rates among IDUs.
Methods
Our unit of analysis is the metropolitan statistical area (MSA).
Our study design is a longitudinal study at the MSA level of
analysis. As such, it can be considered an ‘‘ecological cohort’’
study of MSAs as social and epidemiologic units. Given the
complex pathways likely to occur within MSAs to create the
outcome variable (mortality rate of IDUs living with AIDS per
10,000 adult MSA population), this design has important strengths
and limitations that are described in the Discussion section of this
paper.
The US Census Bureau defines MSAs as contiguous counties
containing a central city of 50,000 people or more that form a
socioeconomic unity [18]. Studying HIV epidemics among IDUs
at the MSA-level [19] is useful since each MSA has its own
epidemic history, HIV prevalence rate, and, among HIV-positives,
its own distribution of time-since-infection. The broader project in
which these analyses are embedded studies the 96 MSAs that had
populations of 500,000 or more in 1992. We limited these analyses
to the 86 MSAs that had data on key independent variables.
Specifically, all analyses were limited to MSAs reporting data on
hard drug arrests, which an earlier analysis demonstrated was
related to higher HIV prevalence among injectors in 1998 [8],
perhaps for reasons related to the rate of change in AIDS mortality
among IDUs.
AnalysisThe advent of HAART in 1996 led to rapid declines in AIDS
mortality in the United States as a whole [20]; however, we
expected variations in AIDS mortality trajectories for IDUs across
MSAs due to differences in when HIV entered their IDU
populations, in rates and patterns of HIV transmission thereafter
[21,22], and differences in the timing and extent of effective
utilization of ART. Data did not exist to allow us to control these
differences directly. Instead, we used AIDS mortality rates during
1993–1995 as a control, and analyzed the rate of decline between
then and 2004–2006, a period well after HAART became
available. Data on IDUs per 10,000 population (aged 15–64),
and on changes in this parameter during the study period, were
also used to control for the size of the population at risk. This
variable refers to people who injected drugs during the prior year
[23].
We analyzed rate of decline rather than the absolute magnitude
of the decline because AIDS mortality rates (per 10,000 adult
population) varied across MSAs by a ratio of more than ten to one
(Table 1) and because our focus was on understanding relative
changes in local epidemics rather than on individuals per se. We
used MSA population (aged 15–64) as the denominator for
mortality rate calculations rather than estimates of the number of
IDUs in the MSA because (1) estimates of current IDUs were
available only through 2002 [23]; (2) during the study period, both
IDU numbers and metropolitan populations changed considerably
in some MSAs; and (3) ex-IDUs who developed AIDS and then
died would contribute to mortality data. Importantly, conducting
this analysis on a per capita basis means that we analyze the
effectiveness of the total system in preventing AIDS mortality
among IDUs.
Dependent Variable and Analysis EquationWe compared CDC’s National HIV Surveillance System data
on AIDS mortality among IDU with AIDS per 10,000 adult
population averaged across 1993–1995 in a given MSA with that
averaged across 2004–2006. The conceptual dependent variable
was the ratio of mortality in the later ART era period divided by
mortality in the earlier pre-HAART period [24]. To avoid well-
known statistical problems of correlated error terms, we modeled
this using linear regression techniques based on Equation 1:
Metropolitan Areas, ART & IDU Mortality
PLOS ONE | www.plosone.org 2 February 2013 | Volume 8 | Issue 2 | e57201
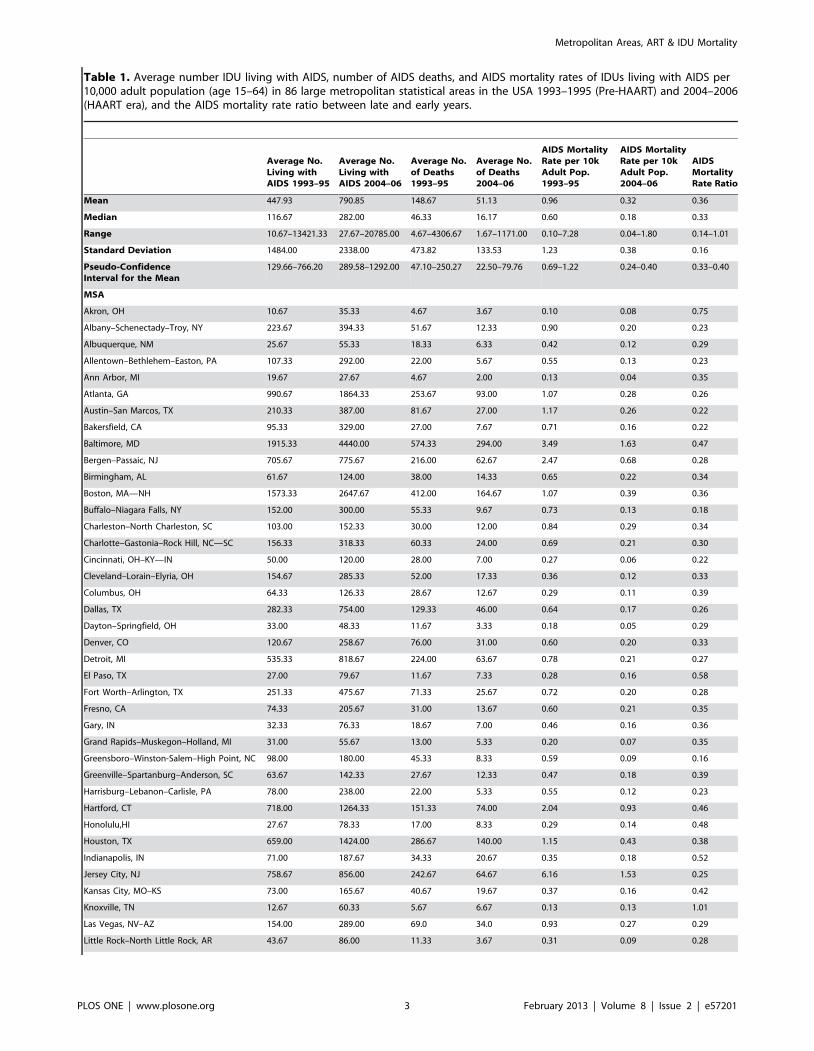
Table 1. Average number IDU living with AIDS, number of AIDS deaths, and AIDS mortality rates of IDUs living with AIDS per10,000 adult population (age 15–64) in 86 large metropolitan statistical areas in the USA 1993–1995 (Pre-HAART) and 2004–2006(HAART era), and the AIDS mortality rate ratio between late and early years.
Average No.Living withAIDS 1993–95
Average No.Living withAIDS 2004–06
Average No.of Deaths1993–95
Average No.of Deaths2004–06
AIDS MortalityRate per 10kAdult Pop.1993–95
AIDS MortalityRate per 10kAdult Pop.2004–06
AIDSMortalityRate Ratio
Mean 447.93 790.85 148.67 51.13 0.96 0.32 0.36
Median 116.67 282.00 46.33 16.17 0.60 0.18 0.33
Range 10.67–13421.33 27.67–20785.00 4.67–4306.67 1.67–1171.00 0.10–7.28 0.04–1.80 0.14–1.01
Standard Deviation 1484.00 2338.00 473.82 133.53 1.23 0.38 0.16
Pseudo-ConfidenceInterval for the Mean
129.66–766.20 289.58–1292.00 47.10–250.27 22.50–79.76 0.69–1.22 0.24–0.40 0.33–0.40
MSA
Akron, OH 10.67 35.33 4.67 3.67 0.10 0.08 0.75
Albany–Schenectady–Troy, NY 223.67 394.33 51.67 12.33 0.90 0.20 0.23
Albuquerque, NM 25.67 55.33 18.33 6.33 0.42 0.12 0.29
Allentown–Bethlehem–Easton, PA 107.33 292.00 22.00 5.67 0.55 0.13 0.23
Ann Arbor, MI 19.67 27.67 4.67 2.00 0.13 0.04 0.35
Atlanta, GA 990.67 1864.33 253.67 93.00 1.07 0.28 0.26
Austin–San Marcos, TX 210.33 387.00 81.67 27.00 1.17 0.26 0.22
Bakersfield, CA 95.33 329.00 27.00 7.67 0.71 0.16 0.22
Baltimore, MD 1915.33 4440.00 574.33 294.00 3.49 1.63 0.47
Bergen–Passaic, NJ 705.67 775.67 216.00 62.67 2.47 0.68 0.28
Birmingham, AL 61.67 124.00 38.00 14.33 0.65 0.22 0.34
Boston, MA—NH 1573.33 2647.67 412.00 164.67 1.07 0.39 0.36
Buffalo–Niagara Falls, NY 152.00 300.00 55.33 9.67 0.73 0.13 0.18
Charleston–North Charleston, SC 103.00 152.33 30.00 12.00 0.84 0.29 0.34
Charlotte–Gastonia–Rock Hill, NC—SC 156.33 318.33 60.33 24.00 0.69 0.21 0.30
Cincinnati, OH–KY—IN 50.00 120.00 28.00 7.00 0.27 0.06 0.22
Cleveland–Lorain–Elyria, OH 154.67 285.33 52.00 17.33 0.36 0.12 0.33
Columbus, OH 64.33 126.33 28.67 12.67 0.29 0.11 0.39
Dallas, TX 282.33 754.00 129.33 46.00 0.64 0.17 0.26
Dayton–Springfield, OH 33.00 48.33 11.67 3.33 0.18 0.05 0.29
Denver, CO 120.67 258.67 76.00 31.00 0.60 0.20 0.33
Detroit, MI 535.33 818.67 224.00 63.67 0.78 0.21 0.27
El Paso, TX 27.00 79.67 11.67 7.33 0.28 0.16 0.58
Fort Worth–Arlington, TX 251.33 475.67 71.33 25.67 0.72 0.20 0.28
Fresno, CA 74.33 205.67 31.00 13.67 0.60 0.21 0.35
Gary, IN 32.33 76.33 18.67 7.00 0.46 0.16 0.36
Grand Rapids–Muskegon–Holland, MI 31.00 55.67 13.00 5.33 0.20 0.07 0.35
Greensboro–Winston-Salem–High Point, NC 98.00 180.00 45.33 8.33 0.59 0.09 0.16
Greenville–Spartanburg–Anderson, SC 63.67 142.33 27.67 12.33 0.47 0.18 0.39
Harrisburg–Lebanon–Carlisle, PA 78.00 238.00 22.00 5.33 0.55 0.12 0.23
Hartford, CT 718.00 1264.33 151.33 74.00 2.04 0.93 0.46
Honolulu,HI 27.67 78.33 17.00 8.33 0.29 0.14 0.48
Houston, TX 659.00 1424.00 286.67 140.00 1.15 0.43 0.38
Indianapolis, IN 71.00 187.67 34.33 20.67 0.35 0.18 0.52
Jersey City, NJ 758.67 856.00 242.67 64.67 6.16 1.53 0.25
Kansas City, MO–KS 73.00 165.67 40.67 19.67 0.37 0.16 0.42
Knoxville, TN 12.67 60.33 5.67 6.67 0.13 0.13 1.01
Las Vegas, NV–AZ 154.00 289.00 69.0 34.0 0.93 0.27 0.29
Little Rock–North Little Rock, AR 43.67 86.00 11.33 3.67 0.31 0.09 0.28
Metropolitan Areas, ART & IDU Mortality
PLOS ONE | www.plosone.org 3 February 2013 | Volume 8 | Issue 2 | e57201
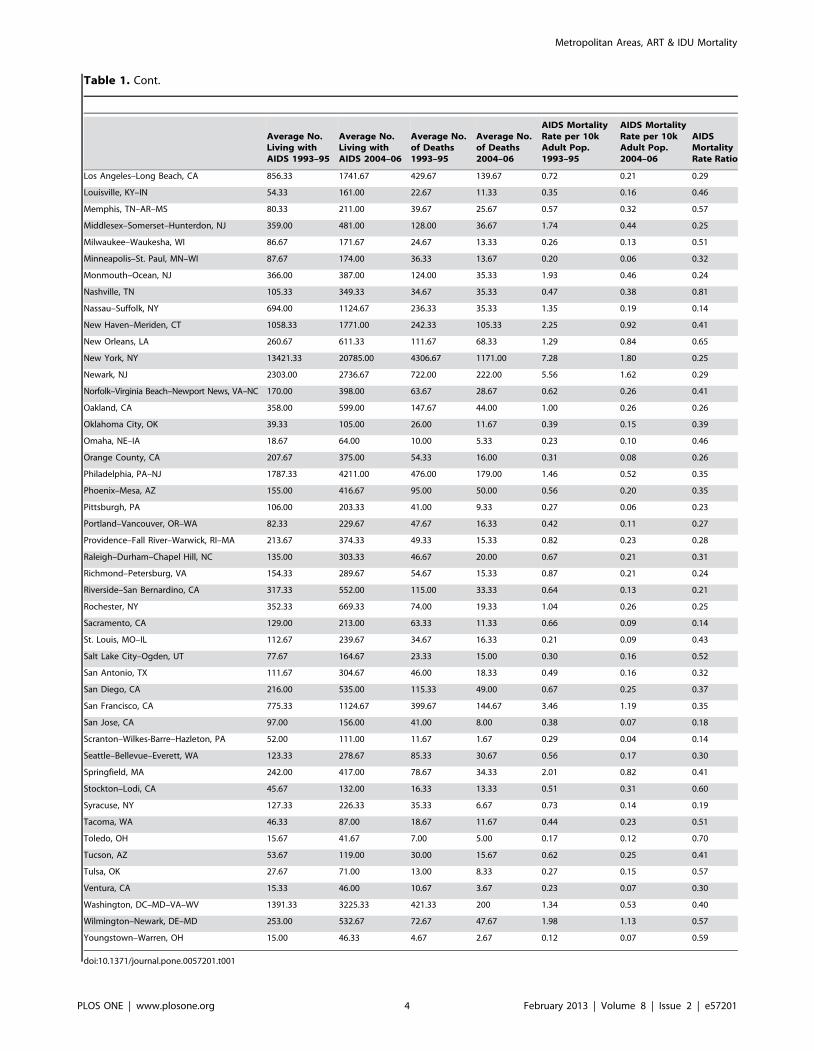
Table 1. Cont.
Average No.Living withAIDS 1993–95
Average No.Living withAIDS 2004–06
Average No.of Deaths1993–95
Average No.of Deaths2004–06
AIDS MortalityRate per 10kAdult Pop.1993–95
AIDS MortalityRate per 10kAdult Pop.2004–06
AIDSMortalityRate Ratio
Los Angeles–Long Beach, CA 856.33 1741.67 429.67 139.67 0.72 0.21 0.29
Louisville, KY–IN 54.33 161.00 22.67 11.33 0.35 0.16 0.46
Memphis, TN–AR–MS 80.33 211.00 39.67 25.67 0.57 0.32 0.57
Middlesex–Somerset–Hunterdon, NJ 359.00 481.00 128.00 36.67 1.74 0.44 0.25
Milwaukee–Waukesha, WI 86.67 171.67 24.67 13.33 0.26 0.13 0.51
Minneapolis–St. Paul, MN–WI 87.67 174.00 36.33 13.67 0.20 0.06 0.32
Monmouth–Ocean, NJ 366.00 387.00 124.00 35.33 1.93 0.46 0.24
Nashville, TN 105.33 349.33 34.67 35.33 0.47 0.38 0.81
Nassau–Suffolk, NY 694.00 1124.67 236.33 35.33 1.35 0.19 0.14
New Haven–Meriden, CT 1058.33 1771.00 242.33 105.33 2.25 0.92 0.41
New Orleans, LA 260.67 611.33 111.67 68.33 1.29 0.84 0.65
New York, NY 13421.33 20785.00 4306.67 1171.00 7.28 1.80 0.25
Newark, NJ 2303.00 2736.67 722.00 222.00 5.56 1.62 0.29
Norfolk–Virginia Beach–Newport News, VA–NC 170.00 398.00 63.67 28.67 0.62 0.26 0.41
Oakland, CA 358.00 599.00 147.67 44.00 1.00 0.26 0.26
Oklahoma City, OK 39.33 105.00 26.00 11.67 0.39 0.15 0.39
Omaha, NE–IA 18.67 64.00 10.00 5.33 0.23 0.10 0.46
Orange County, CA 207.67 375.00 54.33 16.00 0.31 0.08 0.26
Philadelphia, PA–NJ 1787.33 4211.00 476.00 179.00 1.46 0.52 0.35
Phoenix–Mesa, AZ 155.00 416.67 95.00 50.00 0.56 0.20 0.35
Pittsburgh, PA 106.00 203.33 41.00 9.33 0.27 0.06 0.23
Portland–Vancouver, OR–WA 82.33 229.67 47.67 16.33 0.42 0.11 0.27
Providence–Fall River–Warwick, RI–MA 213.67 374.33 49.33 15.33 0.82 0.23 0.28
Raleigh–Durham–Chapel Hill, NC 135.00 303.33 46.67 20.00 0.67 0.21 0.31
Richmond–Petersburg, VA 154.33 289.67 54.67 15.33 0.87 0.21 0.24
Riverside–San Bernardino, CA 317.33 552.00 115.00 33.33 0.64 0.13 0.21
Rochester, NY 352.33 669.33 74.00 19.33 1.04 0.26 0.25
Sacramento, CA 129.00 213.00 63.33 11.33 0.66 0.09 0.14
St. Louis, MO–IL 112.67 239.67 34.67 16.33 0.21 0.09 0.43
Salt Lake City–Ogden, UT 77.67 164.67 23.33 15.00 0.30 0.16 0.52
San Antonio, TX 111.67 304.67 46.00 18.33 0.49 0.16 0.32
San Diego, CA 216.00 535.00 115.33 49.00 0.67 0.25 0.37
San Francisco, CA 775.33 1124.67 399.67 144.67 3.46 1.19 0.35
San Jose, CA 97.00 156.00 41.00 8.00 0.38 0.07 0.18
Scranton–Wilkes-Barre–Hazleton, PA 52.00 111.00 11.67 1.67 0.29 0.04 0.14
Seattle–Bellevue–Everett, WA 123.33 278.67 85.33 30.67 0.56 0.17 0.30
Springfield, MA 242.00 417.00 78.67 34.33 2.01 0.82 0.41
Stockton–Lodi, CA 45.67 132.00 16.33 13.33 0.51 0.31 0.60
Syracuse, NY 127.33 226.33 35.33 6.67 0.73 0.14 0.19
Tacoma, WA 46.33 87.00 18.67 11.67 0.44 0.23 0.51
Toledo, OH 15.67 41.67 7.00 5.00 0.17 0.12 0.70
Tucson, AZ 53.67 119.00 30.00 15.67 0.62 0.25 0.41
Tulsa, OK 27.67 71.00 13.00 8.33 0.27 0.15 0.57
Ventura, CA 15.33 46.00 10.67 3.67 0.23 0.07 0.30
Washington, DC–MD–VA–WV 1391.33 3225.33 421.33 200 1.34 0.53 0.40
Wilmington–Newark, DE–MD 253.00 532.67 72.67 47.67 1.98 1.13 0.57
Youngstown–Warren, OH 15.00 46.33 4.67 2.67 0.12 0.07 0.59
doi:10.1371/journal.pone.0057201.t001
Metropolitan Areas, ART & IDU Mortality
PLOS ONE | www.plosone.org 4 February 2013 | Volume 8 | Issue 2 | e57201
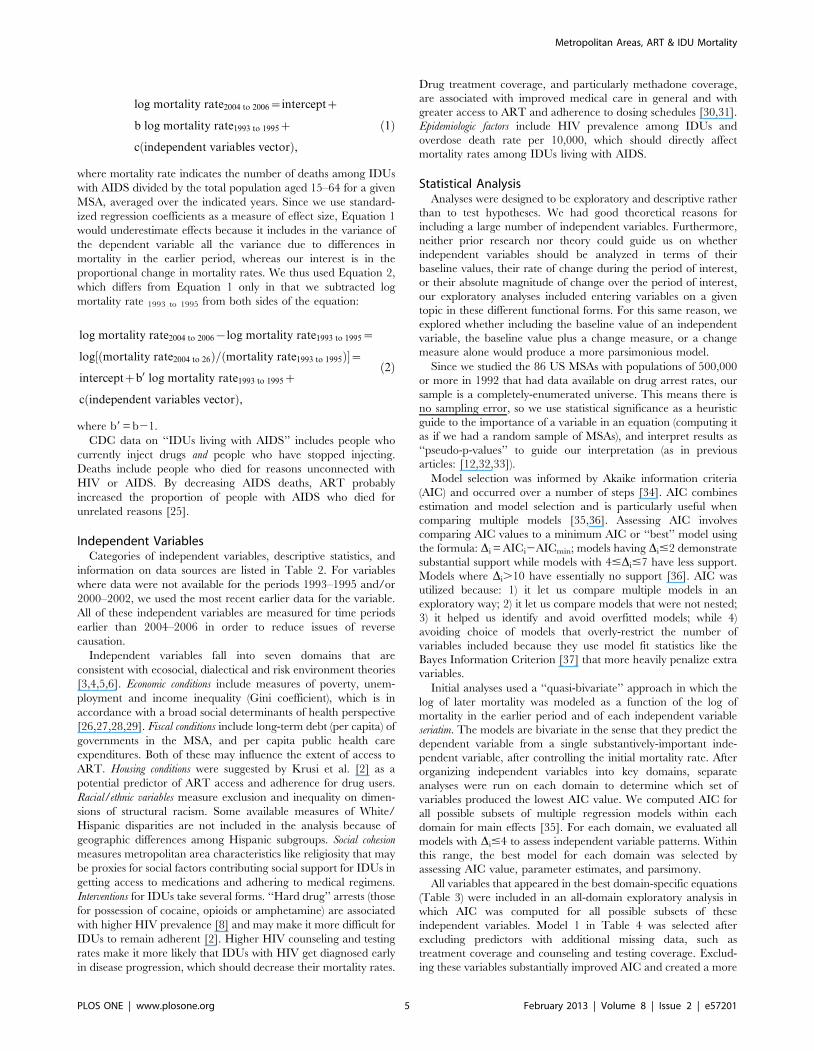
log mortality rate2004 to 2006~interceptz
b log mortality rate1993 to 1995z
c independent variables vectorð Þ,
ð1Þ
where mortality rate indicates the number of deaths among IDUs
with AIDS divided by the total population aged 15–64 for a given
MSA, averaged over the indicated years. Since we use standard-
ized regression coefficients as a measure of effect size, Equation 1
would underestimate effects because it includes in the variance of
the dependent variable all the variance due to differences in
mortality in the earlier period, whereas our interest is in the
proportional change in mortality rates. We thus used Equation 2,
which differs from Equation 1 only in that we subtracted log
mortality rate 1993 to 1995 from both sides of the equation:
log mortality rate2004 to 2006{log mortality rate1993 to 1995~
log mortality rate2004 to 26ð Þ= mortality rate1993 to 1995ð Þ½ �~
interceptzb0 log mortality rate1993 to 1995z
c independent variables vectorð Þ,
ð2Þ
where b9 = b21.
CDC data on ‘‘IDUs living with AIDS’’ includes people who
currently inject drugs and people who have stopped injecting.
Deaths include people who died for reasons unconnected with
HIV or AIDS. By decreasing AIDS deaths, ART probably
increased the proportion of people with AIDS who died for
unrelated reasons [25].
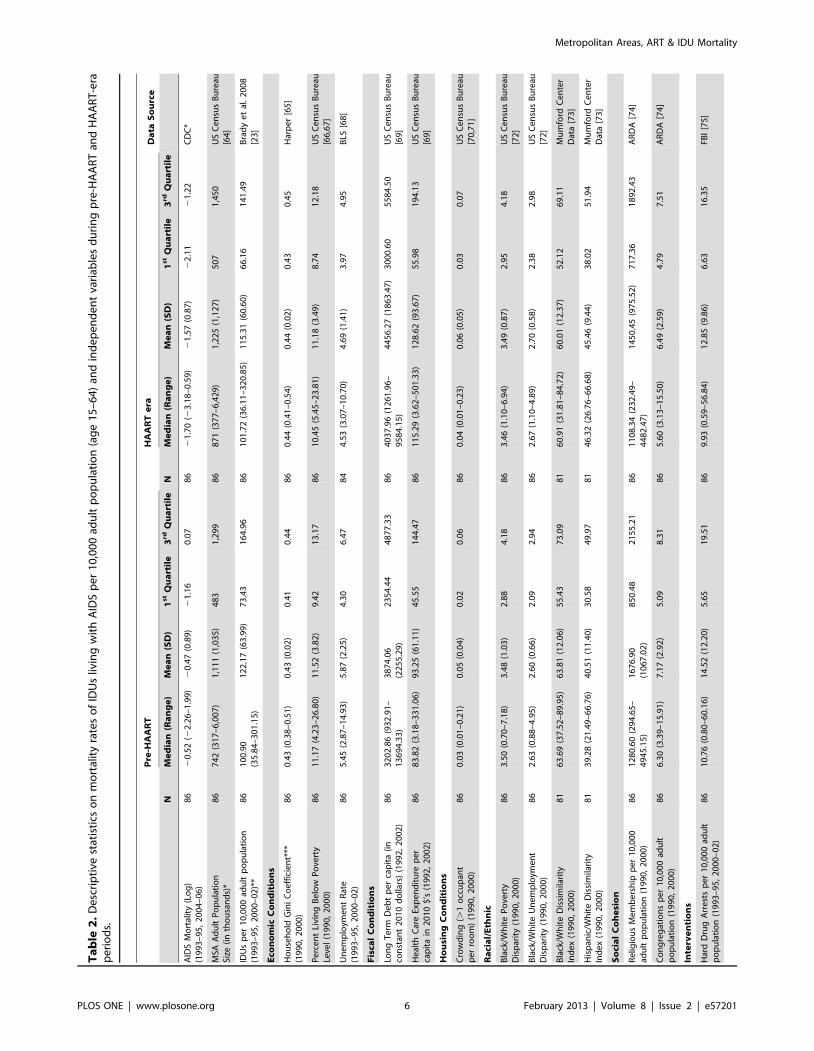
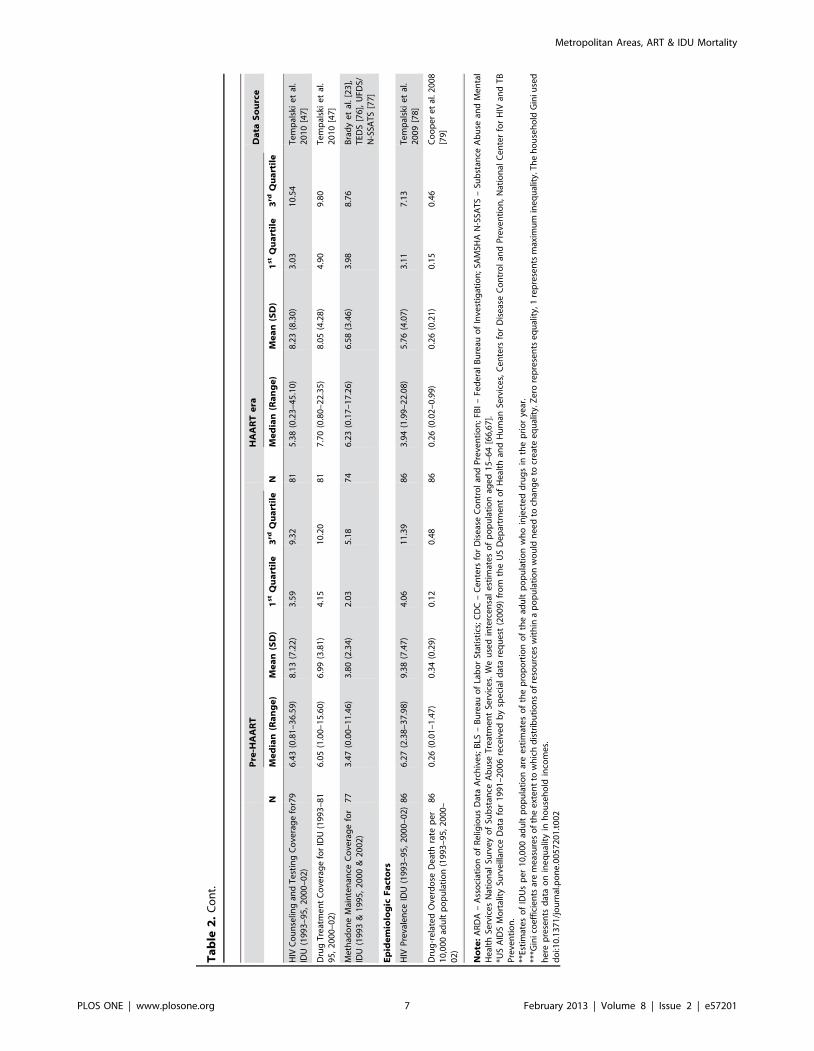
Independent VariablesCategories of independent variables, descriptive statistics, and
information on data sources are listed in Table 2. For variables
where data were not available for the periods 1993–1995 and/or
2000–2002, we used the most recent earlier data for the variable.
All of these independent variables are measured for time periods
earlier than 2004–2006 in order to reduce issues of reverse
causation.
Independent variables fall into seven domains that are
consistent with ecosocial, dialectical and risk environment theories
[3,4,5,6]. Economic conditions include measures of poverty, unem-
ployment and income inequality (Gini coefficient), which is in
accordance with a broad social determinants of health perspective
[26,27,28,29]. Fiscal conditions include long-term debt (per capita) of
governments in the MSA, and per capita public health care
expenditures. Both of these may influence the extent of access to
ART. Housing conditions were suggested by Krusi et al. [2] as a
potential predictor of ART access and adherence for drug users.
Racial/ethnic variables measure exclusion and inequality on dimen-
sions of structural racism. Some available measures of White/
Hispanic disparities are not included in the analysis because of
geographic differences among Hispanic subgroups. Social cohesion
measures metropolitan area characteristics like religiosity that may
be proxies for social factors contributing social support for IDUs in
getting access to medications and adhering to medical regimens.
Interventions for IDUs take several forms. ‘‘Hard drug’’ arrests (those
for possession of cocaine, opioids or amphetamine) are associated
with higher HIV prevalence [8] and may make it more difficult for
IDUs to remain adherent [2]. Higher HIV counseling and testing
rates make it more likely that IDUs with HIV get diagnosed early
in disease progression, which should decrease their mortality rates.
Drug treatment coverage, and particularly methadone coverage,
are associated with improved medical care in general and with
greater access to ART and adherence to dosing schedules [30,31].
Epidemiologic factors include HIV prevalence among IDUs and
overdose death rate per 10,000, which should directly affect
mortality rates among IDUs living with AIDS.
Statistical AnalysisAnalyses were designed to be exploratory and descriptive rather
than to test hypotheses. We had good theoretical reasons for
including a large number of independent variables. Furthermore,
neither prior research nor theory could guide us on whether
independent variables should be analyzed in terms of their
baseline values, their rate of change during the period of interest,
or their absolute magnitude of change over the period of interest,
our exploratory analyses included entering variables on a given
topic in these different functional forms. For this same reason, we
explored whether including the baseline value of an independent
variable, the baseline value plus a change measure, or a change
measure alone would produce a more parsimonious model.
Since we studied the 86 US MSAs with populations of 500,000
or more in 1992 that had data available on drug arrest rates, our
sample is a completely-enumerated universe. This means there is
no sampling error, so we use statistical significance as a heuristic
guide to the importance of a variable in an equation (computing it
as if we had a random sample of MSAs), and interpret results as
‘‘pseudo-p-values’’ to guide our interpretation (as in previous
articles: [12,32,33]).
Model selection was informed by Akaike information criteria
(AIC) and occurred over a number of steps [34]. AIC combines
estimation and model selection and is particularly useful when
comparing multiple models [35,36]. Assessing AIC involves
comparing AIC values to a minimum AIC or ‘‘best’’ model using
the formula: Di = AICi2AICmin; models having Di#2 demonstrate
substantial support while models with 4#Di#7 have less support.
Models where Di.10 have essentially no support [36]. AIC was
utilized because: 1) it let us compare multiple models in an
exploratory way; 2) it let us compare models that were not nested;
3) it helped us identify and avoid overfitted models; while 4)
avoiding choice of models that overly-restrict the number of
variables included because they use model fit statistics like the
Bayes Information Criterion [37] that more heavily penalize extra
variables.
Initial analyses used a ‘‘quasi-bivariate’’ approach in which the
log of later mortality was modeled as a function of the log of
mortality in the earlier period and of each independent variable
seriatim. The models are bivariate in the sense that they predict the
dependent variable from a single substantively-important inde-
pendent variable, after controlling the initial mortality rate. After
organizing independent variables into key domains, separate
analyses were run on each domain to determine which set of
variables produced the lowest AIC value. We computed AIC for
all possible subsets of multiple regression models within each
domain for main effects [35]. For each domain, we evaluated all
models with Di#4 to assess independent variable patterns. Within
this range, the best model for each domain was selected by
assessing AIC value, parameter estimates, and parsimony.
All variables that appeared in the best domain-specific equations
(Table 3) were included in an all-domain exploratory analysis in
which AIC was computed for all possible subsets of these
independent variables. Model 1 in Table 4 was selected after
excluding predictors with additional missing data, such as
treatment coverage and counseling and testing coverage. Exclud-
ing these variables substantially improved AIC and created a more
Metropolitan Areas, ART & IDU Mortality
PLOS ONE | www.plosone.org 5 February 2013 | Volume 8 | Issue 2 | e57201
Ta
ble
2.
De
scri
pti
vest
atis
tics
on
mo
rtal
ity
rate
so
fID
Us
livin
gw
ith
AID
Sp
er
10
,00
0ad
ult
po
pu
lati
on
(ag
e1
5–
64
)an
din
de
pe
nd
en
tva
riab
les
du
rin
gp
re-H
AA
RT
and
HA
AR
T-e
rap
eri
od
s.
Pre
-HA
AR
TH
AA
RT
era
Da
taS
ou
rce
NM
ed
ian
(Ra
ng
e)
Me
an
(SD
)1
st
Qu
art
ile
3rd
Qu
art
ile
NM
ed
ian
(Ra
ng
e)
Me
an
(SD
)1
st
Qu
art
ile
3rd
Qu
art
ile
AID
SM
ort
alit
y(L
og
)(1
99
3–
95
,2
00
4–
06
)8
62
0.5
2(2
2.2
6–
1.9
9)
20
.47
(0.8
9)
21
.16
0.0
78
62
1.7
0(2
3.1
8–
0.5
9)
21
.57
(0.8
7)
22
.11
21
.22
CD
C*
MSA
Ad
ult
Po
pu
lati
on
Size
(in
tho
usa
nd
s)*
86
74
2(3
17
–6
,00
7)
1,1
11
(1,0
35
)4
83
1,2
99
86
87
1(3
77
–6
,42
9)
1,2
25
(1,1
27
)5
07
1,4
50
US
Ce
nsu
sB
ure
au[6
4]
IDU
sp
er
10
,00
0ad
ult
po
pu
lati
on
(19
93
–9
5,
20
00
–0
2)*
*8
61
00
.90
(35
.84
–3
01
.15
)1
22
.17
(63
.99
)7
3.4
31
64
.96
86
10
1.7
2(3
6.1
1–
32
0.8
5)
11
5.3
1(6
0.6
0)
66
.16
14
1.4
9B
rad
ye
tal
.2
00
8[2
3]
Eco
no
mic
Co
nd
itio
ns
Ho
use
ho
ldG
ini
Co
eff
icie
nt*
**(1
99
0,
20
00
)8
60
.43
(0.3
8–
0.5
1)
0.4
3(0
.02
)0
.41
0.4
48
60
.44
(0.4
1–
0.5
4)
0.4
4(0
.02
)0
.43
0.4
5H
arp
er
[65
]
Pe
rce
nt
Livi
ng
Be
low
Po
vert
yLe
vel
(19
90
,2
00
0)
86
11
.17
(4.2
3–
26
.80
)1
1.5
2(3
.82
)9
.42
13
.17
86
10
.45
(5.4
5–
23
.81
)1
1.1
8(3
.49
)8
.74
12
.18
US
Ce
nsu
sB
ure
au[6
6,6
7]
Un
em
plo
yme
nt
Rat
e(1
99
3–
95
,2
00
0–
02
)8
65
.45
(2.8
7–
14
.93
)5
.87
(2.2
5)
4.3
06
.47
84
4.5
3(3
.07
–1
0.7
0)
4.6
9(1
.41
)3
.97
4.9
5B
LS[6
8]
Fis
cal
Co
nd
itio
ns
Lon
gT
erm
De
bt
pe
rca
pit
a(i
nco
nst
ant
20
10
do
llars
)(1
99
2,
20
02
)8
63
20
2.8
6(9
32
.91
–1
36
94
.33
)3
87
4.0
6(2
25
5.2
9)
23
54
.44
48
77
.33
86
40
37
.96
(12
61
.96
–9
58
4.1
5)
44
56
.27
(18
63
.47
)3
00
0.6
05
58
4.5
0U
SC
en
sus
Bu
reau
[69
]
He
alth
Car
eEx
pe
nd
itu
rep
er
cap
ita
in2
01
0$
’s(1
99
2,
20
02
)8
68
3.8
2(3
.18
–3
31
.06
)9
3.2
5(6
1.1
1)
45
.55
14
4.4
78
61
15
.29
(3.6
2–
50
1.3
3)
12
8.6
2(9
3.6
7)
55
.98
19
4.1
3U
SC
en
sus
Bu
reau
[69
]
Ho
usi
ng
Co
nd
itio
ns
Cro
wd
ing
(.1
occ
up
ant
pe
rro
om
)(1
99
0,
20
00
)8
60
.03
(0.0
1–
0.2
1)
0.0
5(0
.04
)0
.02
0.0
68
60
.04
(0.0
1–
0.2
3)
0.0
6(0
.05
)0
.03
0.0
7U
SC
en
sus
Bu
reau
[70
,71
]
Ra
cia
l/E
thn
ic
Bla
ck/W
hit
eP
ove
rty
Dis
par
ity
(19
90
,2
00
0)
86
3.5
0(0
.70
–7
.18
)3
.48
(1.0
3)
2.8
84
.18
86
3.4
6(1
.10
–6
.94
)3
.49
(0.8
7)
2.9
54
.18
US
Ce
nsu
sB
ure
au[7
2]
Bla
ck/W
hit
eU
ne
mp
loym
en
tD
isp
arit
y(1
99
0,
20
00
)8
62
.63
(0.8
8–
4.9
5)
2.6
0(0
.66
)2
.09
2.9
48
62
.67
(1.1
0–
4.8
9)
2.7
0(0
.58
)2
.38
2.9
8U
SC
en
sus
Bu
reau
[72
]
Bla
ck/W
hit
eD
issi
mila
rity
Ind
ex
(19
90
,2
00
0)
81
63
.69
(37
.52
–8
9.9
5)
63
.81
(12
.06
)5
5.4
37
3.0
98
16
0.9
1(3
1.8
1–
84
.72
)6
0.0
1(1
2.3
7)
52
.12
69
.11
Mu
mfo
rdC
en
ter
Dat
a[7
3]
His
pan
ic/W
hit
eD
issi
mila
rity
Ind
ex
(19
90
,2
00
0)
81
39
.28
(21
.49
–6
6.7
6)
40
.51
(11
.40
)3
0.5
84
9.9
78
14
6.3
2(2
6.7
6–
66
.68
)4
5.4
6(9
.44
)3
8.0
25
1.9
4M
um
ford
Ce
nte
rD
ata
[73
]
So
cia
lC
oh
esi
on
Re
ligio
us
Me
mb
ers
hip
pe
r1
0,0
00
adu
ltp
op
ula
tio
n(1
99
0,
20
00
)8
61
28
0.6
0(2
94
.65
–4
94
5.1
5)
16
76
.90
(10
67
.02
)8
50
.48
21
55
.21
86
11
08
.34
(23
2.4
9–
44
82
.47
)1
45
0.4
5(9
75
.52
)7
17
.36
18
92
.43
AR
DA
[74
]
Co
ng
reg
atio
ns
pe
r1
0,0
00
adu
ltp
op
ula
tio
n(1
99
0,
20
00
)8
66
.30
(3.3
9–
15
.91
)7
.17
(2.9
2)
5.0
98
.31
86
5.6
0(3
.13
–1
5.5
0)
6.4
9(2
.59
)4
.79
7.5
1A
RD
A[7
4]
Inte
rve
nti
on
s
Har
dD
rug
Arr
est
sp
er
10
,00
0ad
ult
po
pu
lati
on
(19
93
–9
5,
20
00
–0
2)
86
10
.76
(0.8
0–
60
.16
)1
4.5
2(1
2.2
0)
5.6
51
9.5
18
69
.93
(0.5
9–
56
.84
)1
2.8
5(9
.86
)6
.63
16
.35
FBI
[75
]
Metropolitan Areas, ART & IDU Mortality
PLOS ONE | www.plosone.org 6 February 2013 | Volume 8 | Issue 2 | e57201
Ta
ble
2.
Co
nt.
Pre
-HA
AR
TH
AA
RT
era
Da
taS
ou
rce
NM
ed
ian
(Ra
ng
e)
Me
an
(SD
)1
st
Qu
art
ile
3rd
Qu
art
ile
NM
ed
ian
(Ra
ng
e)
Me
an
(SD
)1
st
Qu
art
ile
3rd
Qu
art
ile
HIV
Co
un
selin
gan
dT
est
ing
Co
vera
ge
for
IDU
(19
93
–9
5,
20
00
–0
2)
79
6.4
3(0
.81
–3
6.5
9)
8.1
3(7
.22
)3
.59
9.3
28
15
.38
(0.2
3–
45
.10
)8
.23
(8.3
0)
3.0
31
0.5
4T
em
pal
ski
et
al.
20
10
[47
]
Dru
gT
reat
me
nt
Co
vera
ge
for
IDU
(19
93
–9
5,
20
00
–0
2)
81
6.0
5(1
.00
–1
5.6
0)
6.9
9(3
.81
)4
.15
10
.20
81
7.7
0(0
.80
–2
2.3
5)
8.0
5(4
.28
)4
.90
9.8
0T
em
pal
ski
et
al.
20
10
[47
]
Me
thad
on
eM
ain
ten
ance
Co
vera
ge
for
IDU
(19
93
&1
99
5,
20
00
&2
00
2)
77
3.4
7(0
.00
–1
1.4
6)
3.8
0(2
.34
)2
.03
5.1
87
46
.23
(0.1
7–
17
.26
)6
.58
(3.4
6)
3.9
88
.76
Bra
dy
et
al.
[23
],T
EDS
[76
],U
FDS/
N-S
SAT
S[7
7]
Ep
ide
mio
log
icF
act
ors
HIV
Pre
vale
nce
IDU
(19
93
–9
5,
20
00
–0
2)
86
6.2
7(2
.38
–3
7.9
8)
9.3
8(7
.47
)4
.06
11
.39
86
3.9
4(1
.99
–2
2.0
8)
5.7
6(4
.07
)3
.11
7.1
3T
em
pal
ski
et
al.
20
09
[78
]
Dru
g-r
ela
ted
Ove
rdo
seD
eat
hra
tep
er
10
,00
0ad
ult
po
pu
lati
on
(19
93
–9
5,2
00
0–
02
)
86
0.2
6(0
.01
–1
.47
)0
.34
(0.2
9)
0.1
20
.48
86
0.2
6(0
.02
–0
.99
)0
.26
(0.2
1)
0.1
50
.46
Co
op
er
et
al.2
00
8[7
9]
No
te:
AR
DA
–A
sso
ciat
ion
of
Re
ligio
us
Dat
aA
rch
ive
s;B
LS–
Bu
reau
of
Lab
or
Stat
isti
cs;
CD
C–
Ce
nte
rsfo
rD
ise
ase
Co
ntr
ol
and
Pre
ven
tio
n;
FBI
–Fe
de
ral
Bu
reau
of
Inve
stig
atio
n;
SAM
SHA
N-S
SAT
S–
Sub
stan
ceA
bu
sean
dM
en
tal
He
alth
Serv
ice
sN
atio
nal
Surv
ey
of
Sub
stan
ceA
bu
seT
reat
me
nt
Serv
ice
s.W
eu
sed
inte
rce
nsa
le
stim
ate
so
fp
op
ula
tio
nag
ed
15
–6
4[6
6,6
7].
*US
AID
SM
ort
alit
ySu
rve
illan
ceD
ata
for
19
91
–2
00
6re
ceiv
ed
by
spe
cial
dat
are
qu
est
(20
09
)fr
om
the
US
De
par
tme
nt
of
He
alth
and
Hu
man
Serv
ice
s,C
en
ters
for
Dis
eas
eC
on
tro
lan
dP
reve
nti
on
,N
atio
nal
Ce
nte
rfo
rH
IVan
dT
BP
reve
nti
on
.**
Esti
mat
es
of
IDU
sp
er
10
,00
0ad
ult
po
pu
lati
on
are
est
imat
es
of
the
pro
po
rtio
no
fth
ead
ult
po
pu
lati
on
wh
oin
ject
ed
dru
gs
inth
ep
rio
rye
ar.
***G
inic
oe
ffic
ien
tsar
em
eas
ure
so
fth
ee
xte
nt
tow
hic
hd
istr
ibu
tio
ns
of
reso
urc
es
wit
hin
ap
op
ula
tio
nw
ou
ldn
ee
dto
chan
ge
tocr
eat
ee
qu
alit
y.Z
ero
rep
rese
nts
eq
ual
ity,
1re
pre
sen
tsm
axim
um
ine
qu
alit
y.T
he
ho
use
ho
ldG
iniu
sed
he
rep
rese
nts
dat
ao
nin
eq
ual
ity
inh
ou
seh
old
inco
me
s.d
oi:1
0.1
37
1/j
ou
rnal
.po
ne
.00
57
20
1.t
00
2
Metropolitan Areas, ART & IDU Mortality
PLOS ONE | www.plosone.org 7 February 2013 | Volume 8 | Issue 2 | e57201
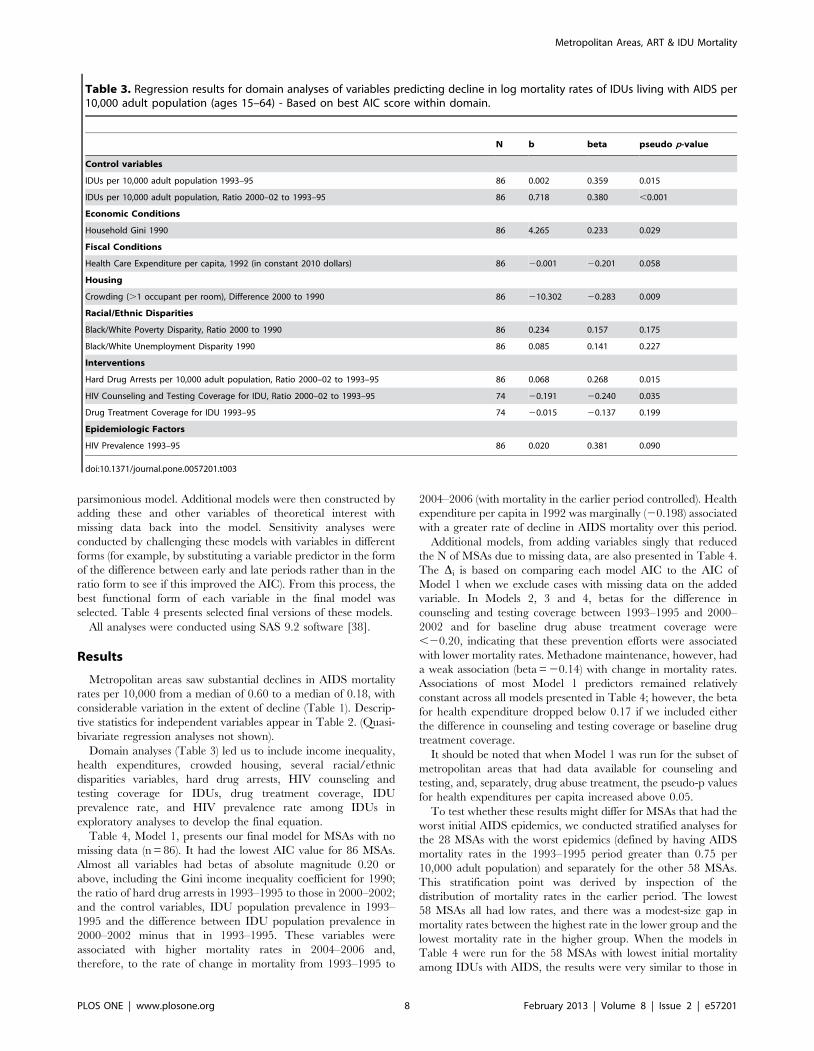
parsimonious model. Additional models were then constructed by
adding these and other variables of theoretical interest with
missing data back into the model. Sensitivity analyses were
conducted by challenging these models with variables in different
forms (for example, by substituting a variable predictor in the form
of the difference between early and late periods rather than in the
ratio form to see if this improved the AIC). From this process, the
best functional form of each variable in the final model was
selected. Table 4 presents selected final versions of these models.
All analyses were conducted using SAS 9.2 software [38].
Results
Metropolitan areas saw substantial declines in AIDS mortality
rates per 10,000 from a median of 0.60 to a median of 0.18, with
considerable variation in the extent of decline (Table 1). Descrip-
tive statistics for independent variables appear in Table 2. (Quasi-
bivariate regression analyses not shown).
Domain analyses (Table 3) led us to include income inequality,
health expenditures, crowded housing, several racial/ethnic
disparities variables, hard drug arrests, HIV counseling and
testing coverage for IDUs, drug treatment coverage, IDU
prevalence rate, and HIV prevalence rate among IDUs in
exploratory analyses to develop the final equation.
Table 4, Model 1, presents our final model for MSAs with no
missing data (n = 86). It had the lowest AIC value for 86 MSAs.
Almost all variables had betas of absolute magnitude 0.20 or
above, including the Gini income inequality coefficient for 1990;
the ratio of hard drug arrests in 1993–1995 to those in 2000–2002;
and the control variables, IDU population prevalence in 1993–
1995 and the difference between IDU population prevalence in
2000–2002 minus that in 1993–1995. These variables were
associated with higher mortality rates in 2004–2006 and,
therefore, to the rate of change in mortality from 1993–1995 to
2004–2006 (with mortality in the earlier period controlled). Health
expenditure per capita in 1992 was marginally (20.198) associated
with a greater rate of decline in AIDS mortality over this period.
Additional models, from adding variables singly that reduced
the N of MSAs due to missing data, are also presented in Table 4.
The Di is based on comparing each model AIC to the AIC of
Model 1 when we exclude cases with missing data on the added
variable. In Models 2, 3 and 4, betas for the difference in
counseling and testing coverage between 1993–1995 and 2000–
2002 and for baseline drug abuse treatment coverage were
,20.20, indicating that these prevention efforts were associated
with lower mortality rates. Methadone maintenance, however, had
a weak association (beta = 20.14) with change in mortality rates.
Associations of most Model 1 predictors remained relatively
constant across all models presented in Table 4; however, the beta
for health expenditure dropped below 0.17 if we included either
the difference in counseling and testing coverage or baseline drug
treatment coverage.
It should be noted that when Model 1 was run for the subset of
metropolitan areas that had data available for counseling and
testing, and, separately, drug abuse treatment, the pseudo-p values
for health expenditures per capita increased above 0.05.
To test whether these results might differ for MSAs that had the
worst initial AIDS epidemics, we conducted stratified analyses for
the 28 MSAs with the worst epidemics (defined by having AIDS
mortality rates in the 1993–1995 period greater than 0.75 per
10,000 adult population) and separately for the other 58 MSAs.
This stratification point was derived by inspection of the
distribution of mortality rates in the earlier period. The lowest
58 MSAs all had low rates, and there was a modest-size gap in
mortality rates between the highest rate in the lower group and the
lowest mortality rate in the higher group. When the models in
Table 4 were run for the 58 MSAs with lowest initial mortality
among IDUs with AIDS, the results were very similar to those in
Table 3. Regression results for domain analyses of variables predicting decline in log mortality rates of IDUs living with AIDS per10,000 adult population (ages 15–64) - Based on best AIC score within domain.
N b beta pseudo p-value
Control variables
IDUs per 10,000 adult population 1993–95 86 0.002 0.359 0.015
IDUs per 10,000 adult population, Ratio 2000–02 to 1993–95 86 0.718 0.380 ,0.001
Economic Conditions
Household Gini 1990 86 4.265 0.233 0.029
Fiscal Conditions
Health Care Expenditure per capita, 1992 (in constant 2010 dollars) 86 20.001 20.201 0.058
Housing
Crowding (.1 occupant per room), Difference 2000 to 1990 86 210.302 20.283 0.009
Racial/Ethnic Disparities
Black/White Poverty Disparity, Ratio 2000 to 1990 86 0.234 0.157 0.175
Black/White Unemployment Disparity 1990 86 0.085 0.141 0.227
Interventions
Hard Drug Arrests per 10,000 adult population, Ratio 2000–02 to 1993–95 86 0.068 0.268 0.015
HIV Counseling and Testing Coverage for IDU, Ratio 2000–02 to 1993–95 74 20.191 20.240 0.035
Drug Treatment Coverage for IDU 1993–95 74 20.015 20.137 0.199
Epidemiologic Factors
HIV Prevalence 1993–95 86 0.020 0.381 0.090
doi:10.1371/journal.pone.0057201.t003
Metropolitan Areas, ART & IDU Mortality
PLOS ONE | www.plosone.org 8 February 2013 | Volume 8 | Issue 2 | e57201
Ta
ble
4.
Fin
alre
gre
ssio
nm
od
els
exp
lori
ng
the
pre
dic
tors
of
de
clin
ein
log
mo
rtal
ity
rate
so
fID
Us
livin
gw
ith
AID
Sp
er
10
,00
0ad
ult
po
pu
lati
on
(ag
e1
5–
64
).
Mo
de
l1
(n=
86
)M
od
el
2*
(n=
79
)M
od
el
3*
(n=
81
)M
od
el
4*
(n=
77
)
Ind
ep
en
de
nt
Va
ria
ble
sb
(pse
ud
op
-v
alu
e)
be
tab
(pse
ud
op
-v
alu
e)
be
tab
(pse
ud
op
-v
alu
e)
be
tab
(pse
ud
op
-v
alu
e)
be
ta
Inte
rce
pt
23
.24
3(,
0.0
01
)0
23
.63
7(,
0.0
01
)0
22
.99
1(0
.00
3)
02
3.6
46
(,0
.00
1)
0
Co
ntr
ol
Va
ria
ble
s
AID
SM
ort
alit
y(L
og
),1
99
3–
95
20
.16
3(0
.00
1)
20
.35
82
0.1
26
(0.0
17
)2
0.2
78
20
.17
8(,
0.0
01
)2
0.3
85
20
.17
7(,
0.0
01
)2
0.4
00
IDU
sp
er
10
,00
0ad
ult
po
pu
lati
on
19
93
–9
50
.00
1(0
.04
1)
0.2
22
0.0
03
(0.0
79
)0
.19
80
.00
2(0
.00
8)
0.3
08
0.0
01
(0.0
31
)0
.23
5
IDU
sp
er
10
,00
0ad
ult
po
pu
lati
on
,D
iffe
ren
cein
rate
s1
99
3–
95
to2
00
0–
02
0.0
05
(0.0
01
)0
.34
30
.00
5(0
.00
1)
0.3
41
0.0
05
(,0
.00
1)
0.4
07
0.0
05
(,0
.00
1)
0.4
24
An
aly
tic
Va
ria
ble
s
Ho
use
ho
ldG
ini
19
90
4.5
87
(0.0
11
)0
.25
15
.53
9(0
.00
4)
0.2
97
4.1
31
(0.0
28
)0
.22
05
.72
2(0
.00
2)
0.3
16
He
alth
Car
eEx
pe
nd
itu
rep
er
cap
ita
19
92
(in
con
stan
t2
01
0d
olla
rs)
20
.00
13
(0.0
38
)20
.19
82
0.0
01
0(0
.12
3)2
0.1
51
20
.00
11
(0.0
87
)20
.16
12
0.0
01
3(0
.03
6)2
0.2
04
Har
dD
rug
Arr
est
sp
er
10
,00
0ad
ult
po
pu
lati
on
,R
atio
20
00
–0
2to
19
93
–9
50
.06
3(0
.01
0)
0.2
47
0.0
61
(0.0
14
)0
.24
20
.06
2(0
.01
0)
0.2
45
0.0
63
(0.0
06
)0
.26
3
HIV
Co
un
selin
gan
dT
est
Co
vera
ge
for
IDU
,D
iffe
ren
ce2
00
0–
02
to1
99
3–
95
––
20
.02
9(0
.03
7)
20
.21
7–
––
–
Dru
gT
reat
me
nt
Co
vera
ge
for
IDU
19
93
–9
5–
––
–2
0.0
22
(0.0
43
)2
0.2
04
––
Me
thad
on
eM
ain
ten
ance
Co
vera
ge
for
IDU
19
93
–9
5–
––
––
–2
0.0
24
(0.1
62
)2
0.1
40
AIC
Di
––
22
.87
42
2.5
88
20
.20
11
*Mo
de
lslim
ite
dto
MSA
sw
he
red
ata
are
no
tm
issi
ng
on
add
ed
vari
able
.C
han
ge
inA
ICta
kes
this
into
acco
un
t.G
ive
nth
ep
ub
lich
eal
thim
po
rtan
ceo
fm
eth
ado
ne
tre
atm
en
t,w
ee
stim
ate
dM
od
el
4o
nce
itb
eca
me
cle
arth
atth
em
ore
incl
usi
veca
teg
ory
,d
rug
tre
atm
en
tco
vera
ge
,w
asas
soci
ate
dw
ith
mo
rtal
ity
red
uct
ion
.d
oi:1
0.1
37
1/j
ou
rnal
.po
ne
.00
57
20
1.t
00
4
Metropolitan Areas, ART & IDU Mortality
PLOS ONE | www.plosone.org 9 February 2013 | Volume 8 | Issue 2 | e57201
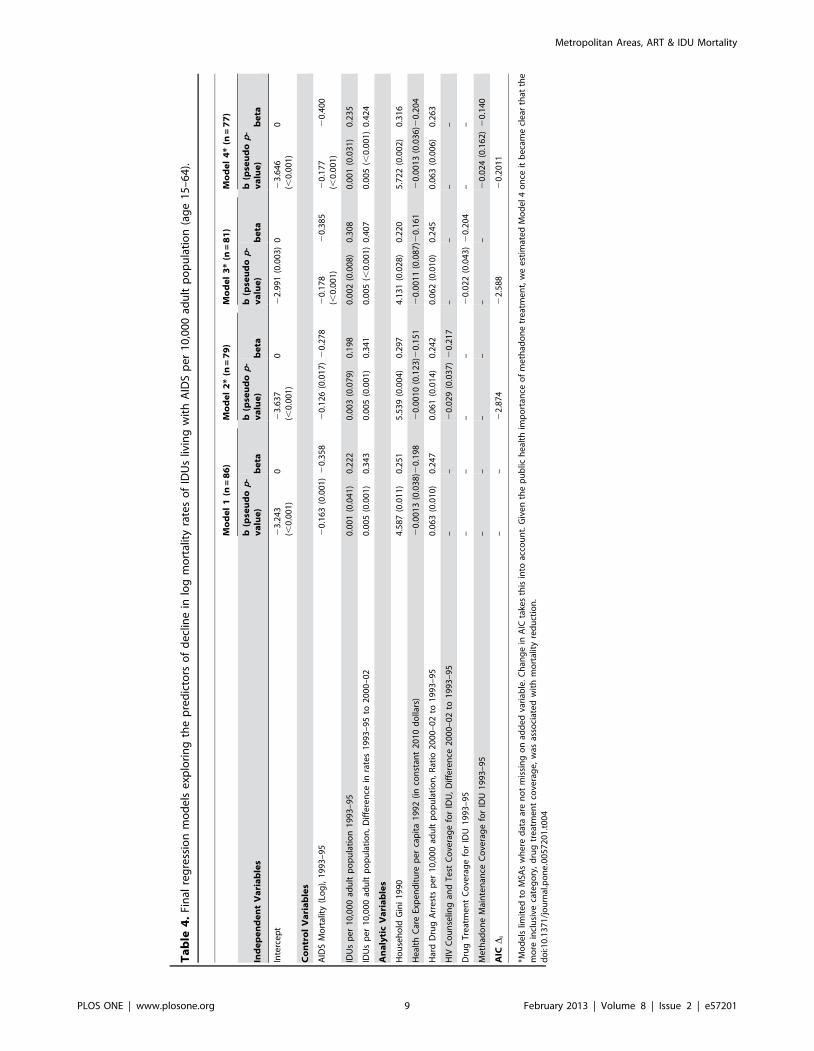
Table 4. In the subset of 28 MSAs with the highest mortality rates,
there was a reversal in direction of the coefficient for the ratio of
hard drug arrests in 2000–2002 to those in 1993–1995. In these
MSAs, a higher increase in arrest rates was associated with a
decrease in mortality rates. To test whether this might be a
multicollinearity effect, we examined the quasi-bivariate for the
arrest ratio, but here too a higher increase in arrest rates was
associated with a decrease in mortality rates.
Discussion
Mortality rates among IDUs with AIDS decreased greatly in
most MSAs following the introduction of HAART. The rate of this
decline, however, varied dramatically: mortality rates fell to less
than one-fifth of their former values in three MSAs but remained
at 70% or more in three others.
Pre-HAART income inequality was associated with higher
mortality in the HAART era. Although past research has found
income inequality to be associated with higher rates of some causes
of mortality [39,40,41], mechanisms through which income
inequality would slow the decline in mortality among IDUs with
AIDS are not clear. The literatures on social determinants of
health and risk environments suggest strong associations between
income (or other economic) inequality and stress levels [42,43,44],
and neighborhood-level income inequality has been found to be
related to drug users’ overdose death rates with mediators that
suggest that the pathway between inequality and overdose
mortality may include stress [45]. More research should be
conducted on whether and how such mechanisms might lead to a
greater propensity among the population to begin injecting drugs
or to do so in high-risk ways and whether income inequality
reduces (or results from reduced) social cohesion leading to less
investment in public healthcare or other services that IDUs use to
prolong life [46]. Causation might be specific to IDUs or people
living with AIDS, which suggests that parallel analyses might be
conducted for IDUs without AIDS or non-IDUs with AIDS. Since
greater public expenditures for health in an MSA were associated
with greater declines in mortality among IDUs living with AIDS,
future cutbacks in general public health expenditures might
increase mortality—and perhaps also that of non-IDUs living with
AIDS.
Drug abuse treatment and HIV counseling and testing rates had
positive impacts on mortality among IDUs living with AIDS. In
sensitivity analyses using different forms of these variables,
however, these findings were not very stable, which reduces our
confidence in these results—as does the lack of association of
methadone treatment variables with mortality. These unstable
results may be the result of relatively low coverage rates of these
services [33,47]. Neither overdose death rates nor changes in these
rates predicted changes in mortality rates among IDUs living with
AIDS.
We have previously shown that heroin/cocaine possession
arrests do not reduce the number of IDUs per capita, and are
associated with higher subsequent HIV seroprevalence among
IDUs [8,13]. In this analysis, we found that increases in hard drug
arrests were associated with slower decreases in death rates in most
MSAs.
We also found that increases in hard drug arrests were
associated with more rapid decreases in death rates for the 28
MSAs that had the highest mortality rates among IDUs living with
AIDS in the 1993–1995 period. Our data do not allow us to come
to any definitive conclusions about what is happening, but we note
that the five MSAs that had the highest early mortality rates—
New York, Jersey City, Newark, Baltimore and San Francisco—
had considerably higher early mortality than the next highest
MSA and also were five of the six highest MSAs (among the 28) in
hard drug arrest rates in 2000–2002. These data are consistent
with either of two somewhat-related explanations: 1) It may be
that these MSAs, given the severity of their AIDS epidemics and
AIDS mortality rates early in the epidemic, took particular care to
make sure that arrestees and prisoners with HIV received good
medical care while in custody. 2) It also might be the case that
these MSAs did a particularly good job of making HIV care
available outside of custodial settings. Both of these explanations
are consistent with the findings in the regression models given the
fact that arrest rates remained high in these MSAs.
Overall, then, we do not know the mechanisms through which
hard drug arrests might influence mortality among IDUs with
AIDS. Such mechanisms might include disruptions in ART
treatment for IDUs who get arrested in some MSAs, whether at
time of arrest, while incarcerated, or upon release [48]; stress from
arrest or imprisonment; or exposure to pathogens while incarcer-
ated [49,50]. Alternatively, a higher risk of hard drug arrest might
increase stress among IDUs in the community and/or lead them
to hide their drug use by injecting in settings where they might be
exposed to other pathogens or to risk STI or homicide by engaging
in sex trading [51,52,53,54,55,56,57]. Arrests might also lead to
greater HIV transmission, and subsequent mortality, by causing
higher rates of risk behavior, greater turnover in injection and
sexual networks, or increased partner concurrency, all of which
could increase the transmission of HIV at a community level
[58,59]. As noted above, these relationships might work differently
in the MSAs most affected by AIDS in the earlier period.
These findings are subject to several limitations. Causal
mechanisms are hard to study at a single level of analysis since
both higher-level and lower-level variables may affect observed
relationships. Care must be taken both to avoid interpretations
that fall into the ecological fallacy and also to be open to
interpretations that are valid at a single level of analysis—in this
case, at the MSA level. Here, we are limited in our ability to study
pathways by which independent variables lead to outcomes. As
with many studies, including many on social determinants of
health [60,61,62], we cannot specify the mechanisms by which
differences in MSA characteristics, like hard drug arrest rates or
crowded housing, or how effects of interventions on HIV
incidence and the effect of ART on reducing the rate of AIDS
incidence among the HIV-infected, are associated with a slower
decline in mortality among IDUs with AIDS at the individual
level. In addition, all variables are subject to measurement error,
which may be considerable for arrest data, drug abuse treatment
and HIV counseling and testing coverage data. We are seriously
limited by unavailability of data on ART use and adherence rates
among IDUs in these MSAs.
This paper is exploratory in spite of being guided by ecosocial,
risk environmental and dialectical theory. These theories provided
little guidance about which functional form of change measures
(differences or ratios) to use in multivariable models. These
theories also suggested far more independent variables of
importance than could be included in one equation. Thus, these
results might have been shaped by our exploratory procedures to
determine which variables to retain in the model. (Our sensitivity
analyses which challenged Equation 2 with additional variables
provide some protection against errors here.) Our analyses thus
generated rather than tested hypotheses. Since this is a study of the
set of the largest metropolitan areas in the US, rather than of a
partial sampling of MSAs, it is not possible to draw a new sample
to test these hypotheses. Instead, researchers might investigate
whether future changes in these variables are followed by changes
Metropolitan Areas, ART & IDU Mortality
PLOS ONE | www.plosone.org 10 February 2013 | Volume 8 | Issue 2 | e57201
in mortality among IDUs living with AIDS in the predicted
directions and magnitudes. Testing their generalizability to other
countries and to smaller MSAs or counties in the US would also be
useful.
Guided both by the findings of this paper and also by our prior
findings that income inequality helped to predict the MSA-level
population prevalence of IDUs, HIV prevalence among IDUs,
and HIV incidence among IDUs in 1992 [11], we hypothesize
that income inequality may be a particularly important ecosocial
variable in shaping HIV epidemics among people who inject
drugs. We also hypothesize that the extent of coverage by
programs like HIV counseling and testing and drug abuse
treatment, as well as the importance of arrest rates for hard drug
use, point to the dialectical importance of political and budgetary
decisions for the epidemic [3,4,5,6].
Mortality among people who inject drugs might be decreased by
reducing metropolitan income inequality and increasing public
expenditures on health (including HIV-related care) [63].
Increasing availability of public health interventions like drug
abuse treatment and HIV counseling and testing might reduce
mortality among injectors living with AIDS. Given prior evidence
that drug-related arrest rates are associated with higher HIV
prevalence rates among IDUs and do not seem to decrease IDU
population prevalence [8], changes in laws and policing practices
to reduce such arrests while still protecting public order should be
considered alongside increasing public health intervention cover-
age.
Acknowledgments
Disclaimers: The findings and conclusions in this paper are those of the
authors and do not necessarily represent the views of the Centers for
Disease Control and Prevention.
Author Contributions
Reviewed, contributed ideas, and helped edit the manuscript: ERP HIH
JC BT SC XH HLFC SG DCDJ. Conceived and designed the
experiments: SRF BSW ERP BT HLFC SG DCDJ. Analyzed the data:
JC SC BSW. Wrote the paper: SRF BSW ERP HIH.
References
1. Montaner JSG, Wood E, Kerr T, Lima V, Barrios R, et al. (2010) Expanded
Highly Active Antiretroviral Therapy Coverage Among HIV-Positive Drug
Users to Improve Individual and Public Health Outcomes. JAIDS Journal of
Acquired Immune Deficiency Syndromes 55: S5–S9
2. Krusi A, Wood E, Montaner J, Kerr T (2010) Social and structural determinants
of HAART access and adherence among injection drug users. The International
Journal on Drug Policy 21: 4–9.
3. Rhodes T (2009) Risk Environments and drug harms: A social science for harm
reduction approach. Int J Drug Policy 20: 193–201.
4. Friedman SR, Rossi D (2011) A reply to Bongmba, Floyd, Palmer and Susser:
An invitation to dialectics. Dialectical Anthropolgy 35: 453–457.
5. Friedman SR, Rossi D (2011) Dialectical theory and the study of HIV/AIDS
and other epidemics. Dialectical Anthropolgy 35: 403–427.
6. Krieger N (2001) Theories for social epidemiology in the 21st century: an
ecosocial perspective. Int J Epidemiol 30: 668–677.
7. Gardner E, McClean M, Steiner J, del Rio C, Burnam W (2011) The Spectrum
of Engagement in HIV Care and its Relevance to Test-and-Treat Strategies for
Prevention of HIV Infection. Clin Infect Dis 52: 793–800.
8. Friedman SR, Cooper HLF, Tempalski B, Keem M, Friedman R, et al. (2006)
Relationships of deterrence and law enforcement to drug-related harms among
drug injectors in US metropolitan areas. AIDS 20: 93–99.
9. Friedman SR, Tempalski B, Cooper H, Lieb S, Brady J, et al. (2008)
Metropolitan area characteristics, injection drug use and HIV among injectors.
In: D. . Richardson YT, and I . Cheung, editor. Geography and Drug
Addiction. Berlin: Springer-Verlag.
10. Roberts ET, Friedman SR, Brady JE, Pouget ER, Tempalski B, et al. (2010)
Environmental conditions, political economy, and rates of injection drug use in
large US metropolitan areas 1992–2002. Drug Alcohol Depend 106: 142–153.
11. Friedman SR, Perlis TE, Lynch J, Des Jarlais DC (2001) Economic inequality,
poverty, and laws against syringe access as predictors of metropolitan area rates
of drug injection and HIV infection. Global Research Network Meeting on HIV
Prevention in Drug-Using Populations: 147–149.
12. Cooper H, Friedman SR, Tempalski B, Friedman R (2007) Residential
segregation and the prevalence of injection drug use among Black adult
residents of US metropolitan areas. American Journal of Public Health 96: 344–
352.
13. Friedman SR, Pouget ER, Chatterjee S, Cleland CM, Tempalski B, et al. (2011)
Drug arrests and injection drug deterrence. Am J Public Health 101: 344–349.
14. Meditz A, MaWhinney S, Allshouse A, Feser W, Markowitz M, et al. (2011) Sex,
Race, and Geographic Region Influence Clinical Outcomes Following Primary
HIV-1 Infection. J Infect Dis 203: 442–451.
15. Harrison K, Song R, Zhang X (2010) Life Expectancy After HIV Diagnosis
Based on National HIV Surveillance Data from 25 States, United States.
J Acquir Immune Defic Syndr 53: 124–130.
16. Rubin MS, Colen CG, Link BG (2010) Examination of Inequalities in HIV/
AIDS Mortality in the United States From a Fundamental Cause Perspective.
American Journal of Public Health 100: 1053–1059.
17. Lucas GM, Mullen BA, Weidle PJ, Hader S, McCaul ME, et al. (2006) Directly
Administered Antiretroviral Therapy in Methadone Clinics Is Associated with
Improved HIV Treatment Outcomes, Compared with Outcomes among
Concurrent Comparison Groups. Clinical Infectious Diseases 42: 1628–1635.
18. Office of Management and Budget (2000) Standards for defining metropolitan
and micropolitan statistical areas. Federal Register 65: 8228–82238.
19. Friedman SR, Tempalski B, Cooper H, Perlis T, Keem M, et al. (2004)Estimating numbers of injecting drug users in metropolitan areas for structural
analyses of community vulnerability and for assessing relative degrees of service
provision for injecting drug users. J Urban Health 81: 377–400.
20. Crum N, Riffenburgh R, Wegner S, Agan B, Tasker S, et al. (2006)
Comparisons of causes of death and mortality rates among HIV-infectedpersons: analysis of the pre-, early, and late HAART (highly active antiretroviral
therapy) eras. J Acquir Immune Defic Syndr 41: 194–200.
21. Brown B, Beschner G (1993) Handbook on Risk of AIDS: Injection Drug Users
and Sexual Partners; Consortium NAR, editor. Westport, CT: Greenwood
Press.
22. Springer KW, Sterk CE, Jones TS, Friedman L (1999) Syringe disposal options
for injection drug users: a community-based perspective. Subst Use Misuse 34:1917–1934.
23. Brady JE, Friedman SR, Cooper HL, Flom PL, Tempalski B, et al. (2008)Estimating the prevalence of injection drug users in the U.S. and in large U.S.
metropolitan areas from 1992 to 2002. Journal of Urban Health 85: 323–351.
24. Schneider M, Gange S, Williams C, Anastos K, Greenblat tR, et al. (2005)
Patterns of the hazard of death after AIDS through the evolution of
antiretroviral therapy: 1984–2004. AIDS 19: 2009–2018.
25. The Antiretroviral Theraphy Cohort Collaboration (2010) Causes of Death in
HIV-1 - Infected Patients Treated with Antiretroviral Therapy, 1996–2006:Collaborative Analysis of 13 HIV Cohort Studies Clin Infect Dis 50: 1387–1396.
26. Cooper R, Kennelly J, Durazo-Arvizu R, Oh H, Kaplan G, et al. (2001)Relationship between premature mortality and socioeconomic factors in black
and white populations of US metropolitan areas. Public Health Reports 116:464–473.
27. Song R, Hall HI, Harrison KM, Sharpe TT, Lin LS, et al. (2011) Identifying the
impact of social determinants of health on disease rates using correlation analysisof area-based summary information. Public Health Rep 126 Suppl 3: 70–80.
28. Kondo N, Sembajwe G, Kawachi I, van Dam R, Subramanian S, et al. (2009)Income Inequality, mortality, and self rated health: meta-analysis of multilevel
studies. BMJ 10.
29. Syme S (2005) Historical Perspective: The social determinants of disease - some
roots of the movement. Epidemiol Perspect Innov 2.
30. Uhlmann S, Milloy M, Kerr T, Zhang R, Guillemi S, et al. (2010) Methadone
maintenance therapy promotes initiation of antiretroviral therapy among
injection drug users. Addiction 105: 907–913.
31. Roux P, Carrieri M, Villes V, Dellamonica P, Poizot-Martin I, et al. (2008) The
impact of methadone or buprenorphine treatment and ongoing injection onhighly active antiretroviral therapy (HAART) adherence: evidence from the
MANIF2000 cohort study. Addiction 103: 1828–1836.
32. Friedman SR, Perlis T, Des Jarlais DC (2001) Laws prohibiting over-the-counter
syringe sales to injection drug users: Relations to population density, HIV
prevalence, and HIV incidence. American Journal of Public Health 91: 791–793.
33. Friedman SR, Tempalski B, Brady J, Friedman JJ, Cooper H, et al. (2007)Predictors of the degree of drug treatment coverage for injection drug users in 94
metropolitan areas in the United States. International Journal of Drug Policy 18:475–485.
34. Akaike H (1974) A new look at the statistical model identification. IEEETransactions on Automatic Control 19: 716–723.
35. Beal D (2005) SAS Code to Select the Best Multiple Linear Regression Model
for Multivariate Data Using Information Criteria.
Metropolitan Areas, ART & IDU Mortality
PLOS ONE | www.plosone.org 11 February 2013 | Volume 8 | Issue 2 | e57201
36. Burnham K, Anderson D (2004) Multimodal Inference: Understanding AIC and
BIC in Model Selection. Sociological Methods and Research 33: 261–304.37. Kuha J (2004) AIC and BIC: Comparisons of Assumptions and Performance.
Sociological Methods and Research 33: 188–229.
38. SAS Institute Inc. (2002–2009) SAS 9.2. Cary, NC: SAS Institute Inc.39. Backlund E, Rowe G, Lynch J, Wolfson M, Kaplan G, et al. (2007) Income
Inequality and Mortality: A multilevel prospective study of 521,248 individualsin 50 US states. Int J Epidemiology 36: 590–596.
40. Lynch JW, Smith GD, Harper S, Hillemeier M, Ross N, et al. (2004) Income
inequality a determinant of population health? Part 1. A systemic review.Milbank Quarterly 82: 5–99.
41. Marmot M, Wilkinson R (2005) Social Determinants of Health. New York:Oxford University Press.
42. Marmot M (2004) The Status Syndrome: How Social Standing Affects ourHealth and Longevity. New York: Times Books.
43. Wilkinson R (1999) Putting it all Together. In: Marmot M, Wilkinson R, editors.
Social Determinants of Health. Oxford: Oxford University Press. pp. 256–274.44. Link BG, Phelan J (2005) Fundamental Sources of Health Inequities. In:
Mechanic D, Rogut L, Colby D, Knickman J, editors. Policy Challenges inModern Health Care. New Brunswick: Rutgers University Press. pp. 71–84.
45. Nandi A, Galea S, Ahern J, Bucciarelli A, Vlahov D, et al. (2006) What explains
the association between neighborhood-level income inequality and the risk offatal overdose in New York City? Social Science and Medicine 63: 662–674.
46. Subramanian SV, Kawachi I (2004) Income Inequality and Health: What HaveWe Learned So Far? Epidemiologic Reviews 26: 78–91.
47. Tempalski B, Cleland CM, Pouget ER, Chatterjee S, Friedman SR (2010)Persistence of low drug treatment coverage for injection drug users in large US
metropolitan areas. Subst Abuse Treat Prev Policy 5: 23.
48. Milloy M, Kerr T, Buxton J, Rhodes T, Guillemi S, et al. (2011) Dose-responseeffect of incarceration events on nonadherence to HIV antiretroviral therapy
among injection drug users. J Infect Dis 203: 1215–1221.49. Kerr T, Marshall A, Walsh J, Pelepu A, Tyndall M, et al. (2005) Determinants of
highly active antiretroviral therapy discontinuation among injection drug users.
AIDS Care 17: 539–549.50. Small W, Kerr T, Betteridge G, Wood E, Montaner J (2009) Adherence to HIV
Treatment among HIV-Positive Injection Drug Users within CorrectionalEnvironments in British Columbia. AIDS Care 21: 708–714.
51. Bluthenthal RN, Kral AH, Erringer EA, Edlin BR (1999) Drug ParaphernaliaLaws and Injection-Related Infectious Disease Risk Among Drug Injectors.
Drug Issues 22: 1–16.
52. Bluthenthal RN, Kral AH, Lorvick J, Watters JK (1997) Impact of lawenforcement on syringe exchange programs: a look at Oakland and San
Francisco. Medical Anthropology 18: 61–83.53. Bluthenthal RN, Lorvick J, Kral AH, Erringer EA, Kahn JG (1999) Collateral
damage in the war on drugs: HIV risk behaviors among injection drug users.
International Journal of Drug Policy 10: 25–38.54. Cooper H, Moore L, Gruskin S, Krieger N (2005) The Impact of a Police Drug
Crackdown on Drug Injectors’ Ability to Practice Harm Reduction: AQualitative Study. Social Science & Medicine 61: 673–684.
55. Khan MR, Miller WC, Schoenbach VJ, Weir SS, Kaufman JS, et al. (2008)Timing and duration of incarceration and high-risk sexual partnerships among
African Americans in North Carolina. Annals of Epidemiology 18: 403–410.
56. Aitken C, Moore D, Higgs D, Kelsall J, Kerger M (2002) The impact of a policecrackdown on a street drug scene: evidence from the street. The International
Journal of Drug Policy 13: 189–198.57. Thomas JC, Sampson LA (2005) High rates of incarceration as a social force
associated with community rates of sexually transmitted infection. The Journal
of Infectious Diseases 191: S55–S60.
58. Small W, Rhodes T, Woods E, Kerr T (2007) Public injection settings in
Vancouver: physical environment, social context and risk. Int J Drug Policy 18:27–36.
59. Wood E, Spittal PM, Small W, et al (2004) Displacement of Canada’s largest
public illicit drug marker in responds to a police crackdown. Canada MedicalAssociation Journal 170: 1551–1556.
60. Galea S, Tracy M, Hoggatt K, Dimaggio C, Karpati A (2011) Estimated deathsattributable to social factors in the United States. American Journal of Public
Health 101: 1456–1465.
61. Galea S, Ahern J, Rudenstine S, Wallace A, Vlahov D (2005) Urban builtenvironment and depression: a multilevel analysis. J Epidemiol Community
Health 59: 822–827.62. Chaix B, Leal C, Evans D (2010) Neighborhood-level confounding in
epidemiologic studies: unavoidable challenges, uncertain solutions. Epidemiol-ogy 21: 124–127.
63. CDC (2011) Vital Signs: HIV Prevention Through Care and Treatment.
MMWR 60: 1618–1623.64. Cooper HL, Bossak BH, Tempalski B, Friedman SR, Des Jarlais DC (2009)
Temporal trends in spatial access to pharmacies that sell over-the-countersyringes in New York City health districts: relationship to local racial/ethnic
composition and need. J Urban Health 86: 929–945.
65. Harper S (2005) Estimates of GINI Coefficients based on US Census BureauData. Ann Arbor, MI: University of Michigan, School of Public Health, Center
for Social Epidemiology and Population Health.66. US Census Bureau (1990) Population Estimates. In: Bureau UC, editor.
Washington, DC.67. US Census Bureau (2000) Population Estimates. In: Bureau UC, editor.
Washington, DC.
68. Bureau of Labor Statistics (2009) Local area unemployment statistics. UnitedStates Department of Labor.
69. US Census Bureau (1992, 2002) Census of Goverments. United States CensusBureau.
70. US Census Bureau (1990) Housing and Household Economic Statistics Division:
Poverty Index. In: Bureau UC, editor. Washington, DC.71. US Census Bureau (2000) Housing and Household Economic Statistics Divisioj:
Poverty Index. In: Bureau UC, editor. Washington, DC.72. Cooper HLF, Friedman S, Tempalski B, Friedman R, Keem M (2005) Racial/
ethnic disparities in injection drug use in 94 U.S. metropolitan statistical areas in1998. Annals of Epidemiology 15: 326–334.
73. Tempalski B, McQuie H (2009) Drugscapes and the role of place and space in
injection drug use-related HIV risk environments. Int J Drug Policy 20: 4–13.74. Association of Religious Data Archives (2009) Churches and church member-
ship in the United States, 1990 (Counties).75. Federal Bureau of Investigations (2009) Crime in the United States.
76. Substance Abuse and Mental Health Services Administration Office of Applied
Studies1992–2002 TREATMENT EPISODE DATA SET (TEDS), [Computerfile]. U.S. Dept. of Health and Human Services: Prepared by Synectics,
Incorporated.77. Substance Abuse and Mental Health Services Administration (1998) National
Household Survey on Drug Abuse: Main Findings 1996. SAMSHA, Office ofApplied Studies, Rockville, MD.
78. Tempalski B, Lieb S, Cleland CM, Cooper H, Brady JE, et al. (2009) HIV
prevalence rates among injection drug users in 96 large US metropolitan areas,1992–2002. J Urban Health 86: 132–154.
79. Cooper HLF, Brady JE, Friedman SR, Tempalski B, Gostnell K, et al. (2008)Estimating the prevalence of injection drug use among Black and White adults in
large US metropolitan areas over time (1992–2002): Estimation methods and
prevalence trends. Journal of Urban Health 85: 826–856.
Metropolitan Areas, ART & IDU Mortality
PLOS ONE | www.plosone.org 12 February 2013 | Volume 8 | Issue 2 | e57201
Related Documents