9 METHODS FOR INCORPORATING EFFECTS OF LWR COOLANT ENVIRONMENT INTO ASME CODE FATIGUE EVALUATIONS* Omesh K. Chopra and William J. Shack Energy Technology Division Argonne National Laboratory Argonne, IL 60439, USA April 1999 Thesubmittedmanuscripthesbeencreated by the Universityof Chissgoas operator of Argonne National Laboratory (’Argonne’) under ContractNo. W-3I-109-ENG-38 with tha U.S. Department of Energy.The U.S. Governmentretainsforitself,andothersact- ing on ita behalf, a paid-up, nonexclusive, irrevocableworldwidelicensein said artiole to raproduoe,preparederivativeworka,dia- tributacopiestothepublic,andperformpub Holyand displaypubliily,by or on behaffof the Government ._1 Invited paper to be presented at the Symposium on Fatigue and Fracture in Pressure Vessels and Piping, 1999 ASMWJSME Joint Pressure Vessel and Piping Conf., Boston, August 1-5, 1999, *Work supported by the Office of Nuclear Regulatory Research, U.S. Nuclear Regulatory Commission, FIN Number W661O.

Welcome message from author
This document is posted to help you gain knowledge. Please leave a comment to let me know what you think about it! Share it to your friends and learn new things together.
Transcript
9
METHODS FOR INCORPORATING EFFECTS OF LWR COOLANTENVIRONMENT INTO ASME CODE FATIGUE EVALUATIONS*
Omesh K. Chopra and William J. ShackEnergy Technology DivisionArgonne National Laboratory
Argonne, IL 60439, USA
April 1999
The submittedmanuscripthes beencreatedby the Universityof Chissgoas operator ofArgonne National Laboratory (’Argonne’)under ContractNo. W-3I-109-ENG-38 withtha U.S. Department of Energy.The U.S.Governmentretainsforitself,andothersact-ing on ita behalf, a paid-up, nonexclusive,irrevocableworldwidelicensein said artioleto raproduoe,preparederivativeworka,dia-tributacopiestothepublic,andperformpubHolyand displaypubliily,by or on behaffofthe Government ._1
Invited paper to be presented at the Symposium on Fatigue and Fracture in Pressure Vessels andPiping, 1999 ASMWJSME Joint Pressure Vessel and Piping Conf., Boston, August 1-5, 1999,
*Work supported by the Office of Nuclear Regulatory Research, U.S. Nuclear RegulatoryCommission, FIN Number W661O.
DISCLAIMER
This report was prepared as an account of work sponsoredby an agency of the United States Government. Neither theUnited States Government nor any agency thereof, nor anyof their employees, make any warranty, express or implied,or assumes any legal liability or responsibility for theaccuracy, completeness, or usefulness of any information,apparatus, product, or process disclosed, or represents thatits use would not infringe privately owned rights. Referenceherein to any specific commercial product, process, orservice by trade name, trademark, manufacturer, orotherwise does not necessarily constitute or imply itsendorsement, recommendation, or favoring by the UnitedStates Government or any agency thereof. The views andopinions of authors expressed herein do not necessarilystate or reflect those of the United States Government orany agency thereof.

DISCLAIMER
Portions of this document may be illegiblein electronic imageproduced from thedocument.
products. Images arebest available original
.
*
METHODS FOR INCORPORATING EFFECTS OF LWR COOLANT ENVIRONMENTINTO ASME CODE FATIGUE EVALUATIONS
Omesh K. Chopra and William J. Shack. Energy Technology DivisionArgonne National Laboratory
Argonne, Illinois60439
ABSTRACTThe ASME Boiler and Pressure Vessel Code provides rules for
the construction of nuclear power plant components. Appendix I toSection HI of the Code specifies design fatigue curves for structuralmaterials. However, the effects of light water reactor (LWR) coolantenvironments are not explicitly addressed by the Code design curves.Recent test data illustrate potentially significant effects of LWRenvironments on the fatigue resistance of carbon and low-alloy steelsand austenitic stainless steels (SSs). Under certain loading andenvironmental conditions, fatigue lives of carbon and low-alloy steelscan be a factor of =70 lower in an LWR environment than in air.These results raise the issue of whether the design fatigue curves inSection III are appropriate for the intended purpose. This paperpresents the two methods that have been proposed for incorpomting theeffects of LWR coolant environments into the ASME Code fatigueevaluations. The mechanisms of fatigue crack initiation in carbon andlow-alloy steels and austenitic SSs in LWR environments arediscussed.
INTRODUCTIONCyclic loadings on a structural component occur because of
changes in mechanical and thermal loadings as the system goes fromone load set (e.g., pressure, temperature, moment, and force loadlng)to any other load set. For each set of load pairs, an individual fatigueusage factor is determined by the ratio of the number of cyclesanticipated during the lifetime of the component to the allowablecycles. F@ures I-9.1 through I-9.6 of Appendix I to Section III of theASME Boiler and Pressure Vessel Code specify design fatigue curvesthat define the allowable number of cycles as a function of appliedstress amplitude. The cumulative usage factor (CUF) is the sum of theindividual usage factors, and the ASME Code Section 111requires thatthe CUF at each location must not exceed 1.
The Code design fatigue curves were based on strain-controlledtests of small polished specimens at room temperature in air. Thedesign fatigue curves were obtained by adjusting the best–fit curves tothe experimental data for the effect of mean stress and then decreasingthe mean-stress-adjusted curves by a factor of 2 on strain or 20 oncycles, whichever was more conservative, at each point on the best-titcurve. As described in the Section III criteria document, these factorswere intended to account for the differences and uncertainties inrelating the fatigue lives of laboratory test specimens to those of actualreactor components. The factors of 2 and 20 are not safety marginsbut rather conversion factors that must be applied to the experimentaldata to obtain reasonable estimates of the lives of acturd reactorcomponents; in a benign environment, some fraction (e.g., =25%) ofthe factors actually represents a safety margin.
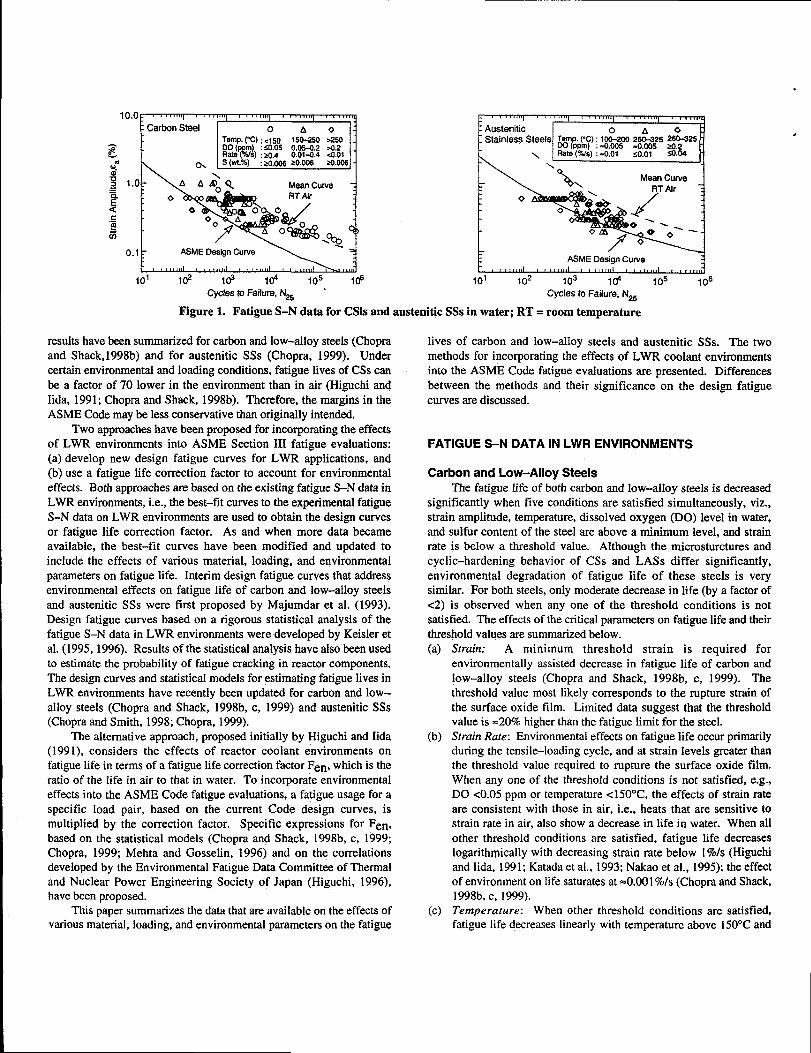
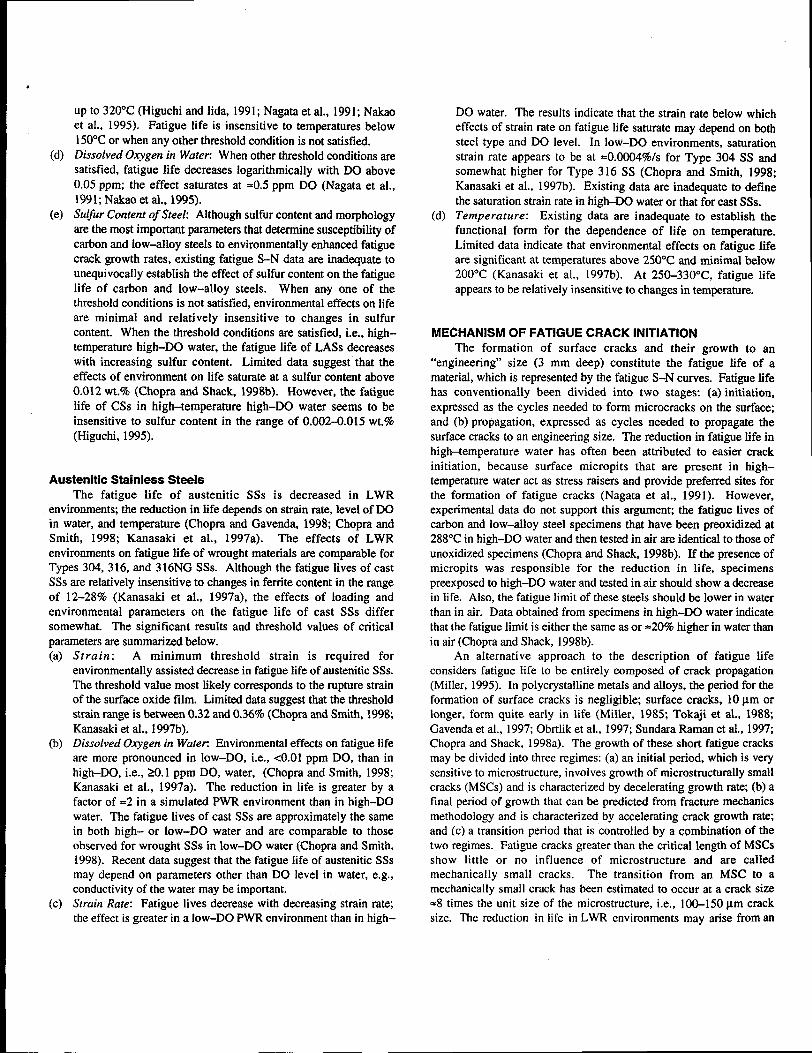
Subsection NB-3 121, of Section 111of the Code states that thedata on which the design fatigue curves (Figs. I–9. 1 through I-9.6) arebased did not include tests in the presence of comosive environmentsthat might accelerate fatigue failure. Article B-21 31 in Appendix B toSection 111states that the owner’s design specifications should provideinformation about any reduction to design fatigue curves that has beennecessitated by environmental conditions. Recent fatigue strain-vs.-life (S-N) data illustrate potentially significant effects of light waterreactor (LWR) coolant environments on the fatigue resistance ofcarbon steels (CSS) and low-alloy steels (LASS) (Ranganath et aL,1982; Higuchi and Iida, 1991; Nagata et al., 1991; Van Der Sluy~,1993; Kanasaki et al., 1995; Nakao et al., 1995; Higuchi et al., 1997;Chopra and Shack, 1997, 1998a, b, c, 1999), as well as of austeniticstainless steels (SSs) (Fujiwara et al., 1986; Mimaki et al., 1996;Higuchi and Iida, 1997; Kanasaki et al., 1997a, b; Hayashi, 1998;Hayashi et al., 1998; Chopra and Gavenda, 1997, 1998; Chopra andSmith, 1998; Chopra, 1999), (Fig. 1).
The existing fatigue S-N data have been analyzed to establish theeffects of various material, loading, and environmental parameters onthe fatigue life of carbon and low-alloy steels and austenitic SSs; the
10.0L I I I I “9 L I I I I
: CarbonSteel o AO : Austenitic JTemp. (%) :.150 150-2W >2s0 Z StainlessSteels Tern ~CJ:M&X30 2#-s25 2&25 -
T%$a, ;;E ;%$: :;, ~
DO &pm) :.0.005 -0.005 20.2~
S*s (w.%) :20.00620.00620.006-
j 1.0 zMeanCurve
E E
.-4U2
0.1 : ASME Oasign CurveASME Design Cuwe
I I 1 I J.Lui.,.l I& ld id ,.5 IN ,01 ,.2 ,03 Id ,05 ,.6
Cycles to Failure,$$5 ‘ Cycles to Failure,N=
Figure 1. Fatigue S-N data for CSISand austenitic SSs in water; RT = room temperature
results have been summarized for carbon and low-alloy steels (Chopraand Shack, 1998b) and for austenitic SSs (Chopra, 1999). Undercertain environmental and loadlng conditions, fatigue lives of CSS canbe a factor of 70 lower in the environment than in air (Higuchi andIida, 1991; Chopra and Shack, 1998b). Therefore, the margins in theASME Code maybe less conservative than originally intended,
Two approaches have been proposed for incorporating the effeetsof LWR environments into ASME Section 111fatigue evaluations:(a) develop new design fatigue curves for LWR applications, and(b) use a fatigue life correction factor to account for environmentaleffects. Both approaches are based on the existing fatigue S-N data inLWR environments, i.e., the best-fit curves to the experimental fatigueS-N data on LWR environments are used to obtain the design curvesor fatigue life correction factor. As and when more data becameavailable, the best–tit curves have been modified and updated toinclude the effects of various material, loading, and environmentalparameters on fatigue life. Interim design fatigue curves that addressenvironmental effects on fatigue life of carbon and low-alloy steelsand austenitic SSs were first proposed by Majumdar et al. (1993).Design fatigue curves based on a rigorous statistical analysis of thefatigue S–N data in LWR environments were developed by Keisler etal. (1995, 1996). Results of the statistical analysis have also been usedto estimate the probability of fatigue cracking in reactor components.The design curves and statistical models for estimating fatigue lives inLWR environments have recently been updated for carbon and low-alloy steels (Chopra and Shack, 1998b, c, 1999) and austenitic SSs(Chopra and Smith, 1998; Chopra, 1999).
lle alternative approach, proposed initially by Higuchi and Iida(199 1), considers the effects of reactor coolant environments onfatigue life in terms of a fatigue life correction factor Fen, which is theratio of the life in air to that in water. To incorporate environmentaleffects into the ASME Code fatigue evaluations, a fatigue usage for aspecific load pair, based on the current Code design curves, ismultiplied by the correction factor. Specific expressions for Fen,based on the statistical models (Chopra and Shack, 1998b, c, 1999;Chopra, 1999; Mehta and Gosselin, 1996) and on the correlationsdeveloped by the Environmental Fatigue Data Committee of Thermaland Nuclear Power Engineering Society of Japan (Higuchi, 1996),have been proposed.
This paper summarizes the data that are available on the effects ofvarious material, loading, and environmental parameters on the fatigue
lives of carbon and low-alloy steels and austenitic SSs. The twomethods for incorporating the effects of LWR coolant environmentsinto the ASME Code fatigue evaluations are presented. Differencesbetween the methods and their significance on the design fatiguecurves are discussed.
FATIGUE S-N DATA IN LWR ENVIRONMENTS
Carbon and Low-Alloy SteelsThe fatigue fife of both carbon and low–alIoy steels is deereased
significantly when five conditions are satisfied simultaneously, viz.,strain amplitude, temperature, dissolved oxygen (DO) level in water,and sulfur content of the steel are above a minimum level, and strainrate is below a threshold value. Although the microsturctures andcyclic–hardening behavior of CSS and LASS differ significantly,environmental degradation of fatigue life of these steels is verysimilar. For both steels, only moderate decrease in life (by a factor of<2) is observed when any one of the threshold conditions is notsatisfied. The effects of the critical parameters on fatigue life and theirthreshold values are summarized below.(a)
(b)
(c)
Strain: A minimum threshold strain is required forenvironmentally assisted decrease in fatigue life of carbon andlow-alloy steels (Chopra and Shack, 1998b, c, 1999). Thethreshold value most likely corresponds to the rupture strain ofthe surface oxide film. Limited data suggest that the thresholdvalue is =2070 higher than the fatigue limit for the steel.Strain Rate: Environmental effects on fatigue life occur primarilyduring the tensile–loading cycle, and at strain levels greater thanthe threshold value required to rupture the surface oxide film.When any one of the threshold conditions is not satisfied, e.g.,DO <0.05 ppm or temperature e 150”C, the effects of strain rateare consistent with those in air, i.e., heats that are sensitive tostrain rate in air, also show a decrease in life in water. When allother threshold conditions are satisfied, fatigue life decreaseslogarithmically with decreasing strain rate below 1%/s (Higuchiand Iida, 1991; Katada et al., 1993; Nakao et al., 1995); the effectof environment on life saturates at =0.001%/s (Chopra and Shack,1998b, C, 1999).Temperature: When other threshold conditions are satisfied,fatigue life decreases Iinearly with temperature above 150°C and
.
*
.
(d)
(e)
up to 320°C (Higuchi and Iida, 1991; Nagata et al., 1991; Nakaoet al., 1995). Fatigue life is insensitive to temperatures below150”C or when any other threshold condition is not satisfied.Dissolved Oxygen in Watec When other threshold conditions aresatisfied, fatigue life decreases logarithmically with DO above0.05 ppm; the effect saturates at =0.5 ppm DO (Nagata et al.,1991; Nakao et ai., 1995).Sulfur Content of Steek Although sulfur content and morphologyare the most important parameters that determine susceptibility ofcarbon and low–alloy steels to environmentally enhanced fatiguecrack growth rates, existing fatigue S-N data are inadequate tounequivocally establish the effect of sulfur content on the fatiguelife of carbon and low-alloy steels. When any one of thethreshold conditions is not satisfied, environmental effects on lifeare minimal and relatively insensitive to changes in sulfurcontent. When the threshold conditions are satisfied, i.e., high-temperature high-DO water, the fatigue life of LASS decreaseswith increasing sulfur content. Limited data suggest that theeffects of environment on life saturate at a sulfur content above0.012 wt.% (Chopra and Shack, 1998b). However, the fatiguelife of CSS in high-temperature high–DO water seems to beinsensitive to sulfur content in the range of 0.002-0.015 wt.~o(Higuchi, 1995).
Austenitic Stainless SteelsThe fatigue life of austenitic SSs is decreased in LWR
environments; the reduction in life depends .on strain rate, level of DOin water, and temperature (Chopra and Gavenda, 1998; Chopra andSmith, 1998; Kanasaki et al., 1997a). The effects of LWRenvironments on fatigue life of wrought materials are comparable forTypes 304, 316, and 316NG SSs. Although the fatigue lives of castSSs are relatively insensitive to changes in ferrite content in the rangeof 12–28% (Kanasaki et al., 1997a), the effects of loading andenvironmental parameters on the fatigue life of cast SSs differsomewhat. The significant results and threshold values of criticalparameters are summarized below.(a)
(b)
(c)
Strain: A minimum threshold strain is required forenvironmentally assisted decrease in fatigue life of austenitic SSs.The threshold value most likely corresponds to the rupture strainof the surface oxide film. Limited data suggest that the thresholdstrain range is between 0.32 and 0.369io(Chopra and Smith, 1998;Kanasaki et al., 1997b).Dissolved Oxygen in Wate~ Environmental effects on fatigue lifeare more pronounced in Iow–DO, i.e., <0.01 ppm DO, than inhigh-DO, i.e., 20.1 ppm DO, water, (Chopra and Smith, 1998;Kanasaki et al., 1997a). The reduction in life is greater by afactor of =2 in a simulated PWR environment than in high-DOwater. The fatigue lives of cast SSs are approximately the samein both high- or low-DO water and are comparable to thoseobserved for wrought SSs in low-DO water (Chopra and Smith,[998). Recent data suggest that the fatigue life of austenitic SSsmay depend on parameters other than DO level in water, e.g.,conductivity of the water may be important.Strain Rate: Fatigue lives decrease with decreasing strain rate;the effect is greater in a low-DO PWR environment than in high-
(d)
DO water. The results indicate that the strain rate below whicheffects of strain rate on fatigue life saturate may depend on bothsteel type and DO Ievel. In low-DO environments, saturationstrain rate appears to be at =0.000470/s for Type 304 SS andsomewhat higher for Type 316 SS (Chopra and Smith, 1998;Kanasaki et al., 1997b). Existing data are inadequate to definethe saturation strain rate in high-DO water or that for cast SSs.Temperature: Existing data are inadequate to establish thefunctional form for the dependence of ‘life on temperature.Limited data indicate that environmental effects on fatigue lifeare significant at temperatures above 250”C and minimal below200°C (Kanasaki et al., 1997b). At 250-330”C, fatigue lifeappears to be relatively insensitive to changes in temperature.
MECHANISM OF FATIGUE CRACK INITIATIONThe formation of surface cracks and their growth to an
“engineering” size (3 mm deep) constitute the fatigue life of amaterial, which is represented by the fatigue S-N curves. Fatigue lifehas conventionally been divided into two stages: (a) initiation,expressed as the cycles needed to form microcracks on the surface;and (b) propagation, expressed as cycles needed to propagate thesurface cracks to an engineering size. The reduction in fatigue life inhigh-temperature water has often been attributed to easier crackinitiation, because surface micropits that are present in high–temperature water act as stress raisers and provide preferred sites forthe formation of fatigue cracks (Nagata et al., 1991). However,experimental data do not support this argument the fatigue lives ofcarbon and low–alloy steel specimens that have been prwxidized at288°C in high–DO water and then tested in air are identical to those ofunoxidized specimens (Chopra and Shack, 1998b). If the presence ofmicropits was responsible for the reduction in life, specimenspreexposed to high–DO water and tested in air should show a decreasein life. Also, the fatigue limit of these steels should be lower in waterthan in air. Data obtained from specimens in high-DO water indicatethat the fatigue limit is either the same as or =20% higher in water thanin air (Chopra and Shack, 1998b).
An alternative approach to the description of fatigue lifeconsiders fatigue life to be entirely composed of crack propagation(Miller, 1995). In polycrystalline metals and alloys, the period for theformation of surface cracks is negligible; surface cracks, 10 Urn orlonger, form quite early in life (Miller, 1985; Tokaji et aL, 1988;Gavenda et al., 1997; Obrtlik et al., 1997; Sundara Raman et al., 1997;Chopra and Shack, 1998a). The growth of these short fatigue cracksmay be divided into three regimes: (a) an initial period, which is verysensitive to microstructure, involves growth of microstructuraUy smallcracks (MSCS) and is characterized by decelerating growth ratq (b) afinal period of growth that can be predicted from fracture mechanicsmethodology and is characterized by accelerating crack growth ra~,and (c) a transition period that is controlled by a combination of thetwo regimes. Fatigue cracks greater than the critical length of MSCSshow little or no influence of microstructure and are calledmechanically small cracks. The transition from an MSC to amechanically small crack has been estimated to occur at a crack size=8 times the unit size of the microstructure, i.e., 100-150 ~m cracksize. The reduction in life in LWR environments may arise from art
increase in growth rates of cracks during the initial stage of MSC andshear crack growth and/or during the transition and final stage oftensile<rack growth.
The enhanced growth rates of long cracks in pressure vessel andpiping steels in LWR environments have been attributed to either slipoxidation/dissolution (Ford, 1986) or hydrogen-induced cracking(Hanninen et al., 1986) mechanisms. Both mechanisms depend on therates of oxide rupture, passivation, and liquid diffusion. Therefore, itis often difficult to differentiate between the two processes or toestablish their relative contributions to crack growth in LWRenvironments.
Studies on crack initiation in smooth fatigue specimens indicatethat the decrease in fatigue life of carbon and low–alloy @els in LWRenvironments is caused primarily by the effects of environment on thegrowth of cracks c1OOpm deep (Gavenda et al., 1997, Chopra andShack, 1998b). When compared with crack growth rates in air, growthrates in high–DO water are nearly two orders of magnitude higher forcracks that are <100 ~m and one order of magnitude higher for cracksthat are >100 pm. Metallographic examinations of test specimensindicate that, in high-DO water, surface cracks grow entirely as tensilecracks normal to the stress, whereas, in air or simulated PWRenvironments, they are at an angle of 45° to the stress axis (Gavenda etal., 1997). Also, for CSS, cracks propagate across both ferrite andpearlite regions. These results indicate that growth of MSCS occurs byslip oxidationfdissolution.
In high–DO water, crack initiation in carbon and low-alloy steelsmay be explained as follows: (a) surface microcracks form quite earlyin fatigue life; (b) during cyclic loading, the protective oxide film isruptured at strains greater than the fracture strain of surface oxides,and the microcracks grow by andlc dissolution of the freshly exposedsurface to crack depths greater than the critical length of MSCS; and(c) these mechanically small cracks grow to engineering size, and theirgrowth, which is characterized by accelerating rates, can be prtilctedby fracture mechanics methodology.
Studies on crack initiation in austenitic SSs yield similar results,i.e., that the decrease in fatigue life in LWR environments is causedprimarily by the effects of environment on the growth of cracks thatare <500 pm deep (Smith and Chopra, 1999). However, fatigue Iivesthat are lower in low-DO water than in high-DO water are difficult toreconcile in terms of the slip oxidation/dissolution mechanism. Also,austenitic SS specimens tested in LWR environments show well-defined fatigue striations, indicating that mechanical factors and notthe slip dissolutiordoxidation process are important (Chopra andSmith, 1998). The results indicate that environmentally assistedreduction in fatigue life of austenitic SSs is most likely caused byhydrogen-induced cracking.
INCORPORATING ENVIRONMENTAL EFFECTS INTO ASMEFATIGUE EVALUATIONS
Two procedures are currently being proposed for incorporatingeffects of LWR coolant environments into the ASME Section IIIfatigue evaluations; (a) develop a new set of environmentally adjusteddesign fatigue curves (Chopra and Shack, 1998b, 1999; Chopra, 1999;Chopra and Smith 1998) or (b) use fatigue life correction factors, Ken,to adjust the current ASME Code fatigue usage values forenvironmental effects (Chopra and Shack, 1999; Chopra, 1999; Mehta
and Gosselin, 1996). For both approaches, the range and boundingvalues must be defined for key service parameters that influencefatigue life. It has been demonstrated that both approaches givesimilar results for carbon and low-alloy steels (Chopra and Shack,1998b) but the results for austenitic SSs differ (Chopra, 1999) becausethe existing ASME mean curve for SS in air is not consistent with theexiting fatigue S-N data.
Design Fatigue CurvesA set of environmentally adjusted design fatigue curves can be
developed from the best-fit curves to the experimental data in LWRenvironments by using the same procedure that has been used todevelop the current ASME Code design fatigue curves. The best-titexperimental curves are first adjusted for the effect of mean stress byusing the modified Goodman relationship
()C&=sa ‘“-”Y for Sac Gy,Gu - Sa
(la)
and S; = Sa for Sa> Oy, (lb)
where S; is the adjusted value of stress amplitude, and tTYand auare yield and ultimate strengths of the material, respectively. Thedesign fatigue curves are then obtained by lowering the adjusted best–fit curve by a factor of 2 on stress or 20 on cycles, whichever is moreconservative, to account for differences and uncertainties in fatigue lifethat are associated with material and loadlng conditions.
Statistical models based on the existing fatigue S–N data havebeen developed for estimating the fatigue lives of pressure vessel andpiping steels in air and LWR environments (Chopra and Shack, 1998b,1999; Chopra, 1999; Chopra and Smith, 1998). In air at roomtemperature. the fatigue data for CSS are best represented by
In(N) = 6.564 – 1.975 hr(~ – O.113) (2a)
and for LASS, by
In(N) = 6.627 – 1.808 In(&a– O.151), (2b)
where N is fatigue life of a smooth test specimen and &a is appliedstrain amplitude (70). In LWR environments, the fatigue data for CSSare best represented by
in(N) = 6.010 – 1.975 ln(ea -0.1 13)+ 0.101 S* T* O* i“ (3a)
and for LASS, by
in(N) = 5.729-1.808 ln(&a-0.151) + 0.101 S* T* O* &*, (3b)
where S*, T*, O*, and i* are transformed sulfur content, temperature,DO, and strain rate, respectively, defined as follows:
S*=S (o< s s 0.015 wt.%)s*= 0.015 (s> 0.015 wt.%) (4a)
T*=O (T< 150°C)T*= T–150 (T= 150-350”C) (4b)
O*=O (DO <0.05 ppm)O*= ln(DO/O.04) (0.05 ppm < DOs 0.5 ppm)O*= ln(12.5) (DO >0.5 ppm) (4C).*& =0 (&>l%/s)6*=ln(6) (0.001 s t < 1%/s)6* = ln(O.001) (& < 0.001%/s). (4d)
*
sa ~~ ts”= 551.6 MPa ~
................ ..... c = 275.8 MPa...........................+...... y . . . ..._
+3= %’
=
z~
z$
g InIn
&DesignCu~e ~wd..-+- ....-...+---.-..~.<.-..=-..
g
O’ 1(Y 7- on StetisticslModel : - -.----- ASME Co& Curve ! – ---- ‘ASMECock Curve ~
I u
10’ 1(? 103 104 I& 10$ 10’ lC? ,03 104 105 Id+Number of Cycles, N Number of Cycles, N
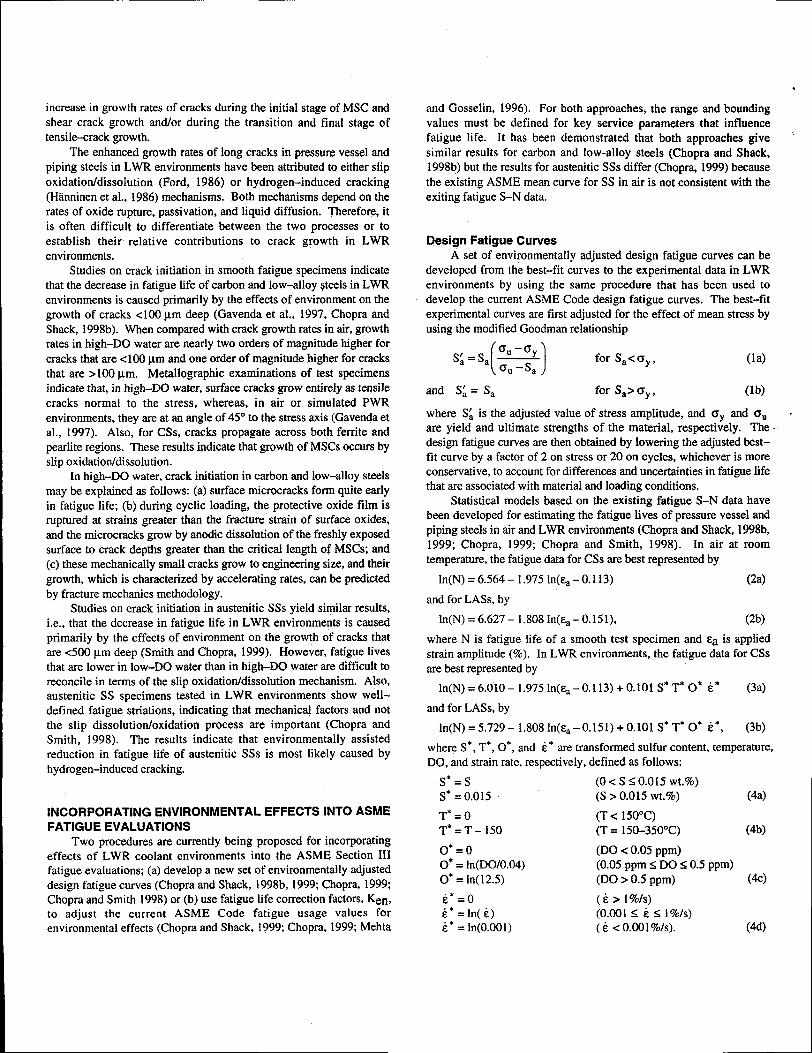
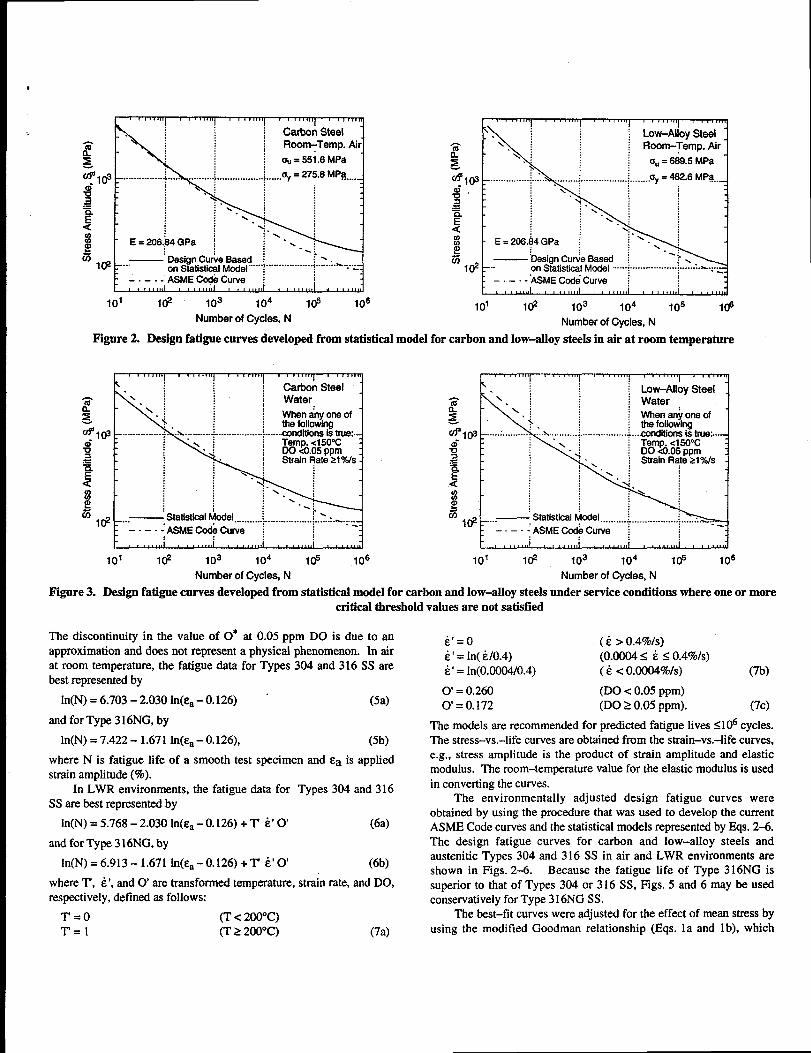
Figure 2. Design fatigue curves developed from statistical model for carbon and low-alloy steels in air at room temperature
!\ ! ! I
Carbon Steel
~
~
;~ StrainRats 21%/s -
$
~*
—’ StatisticalModel I* l& r“””_ - _ .: ASME ~ cube-’”--; ----””-”-----.!”’---”-”’-”:”::
10’ lr3 103 104 105 106
2
+3=
g
g
gcl) — StstistieelJodel (,& . .... ........... ................... ........ ...
--–--’ ASMECocfkCurve {- --
3
Number of Cycles, N Number of Cycles, N
Figure 3. Design fatigue curves developed from statistical model for carbon and low-alloy steels under service conditions where one or morecritical threshold values are not satisfied
The discontinuity in the value of O* at 0.05 ppm DO is due to anapproximation and does not represent a physical phenomenon. In airat room temperature, the fatigue data for Types 304 and 316 SS arebest represented by
In(N) = 6.703 – 2.030 in(&a-O. 126) ~ (5a)
and for Type 316NG, by
in(N) = 7.422-1.671 ln(~ – 0.126), (5b)
where N is fatigue life of a smooth test specimen and &a is appliedstrain amplitude (70).
In LWR environments, the fatigue data for Types 304 and316SS are best represented by
In(N) = 5.768 – 2.030 In(&a-O. 126)+ T E’O’ (6a)
and for Type 316NG, by
in(N) =6.913 -1.671 ln(ea-0.126) +T &’O (6b)
where T’, &‘,and O are transformed temperature, strain rate, and DO,respectively, defined as follows:
T’=o (T< 200°C)T’=1 (T> 2f3r3°C) (7a)
i’=o (&> 0.4%/s)i‘ = ln( i/O.4) (0.0004< Ls 0.4%/s)t‘ = ln(O.0004/O.4) (& < o.0004%/s) (7b)
o = 0.260 (DO <0.05 ppm)0=0.172 (DO 20.05 ppm). (7C)
The models are recommended for predcted fatigue lives<106 cycles.The stress-vs.-life curves are obtained from the strain-vs.-life curves,e.g., stress amplitude is the product of strain amplitude and elasticmodulus. The room-temperature value for the elastic modulus is usedin converting the curves.
The environmentally adjusted design fatigue curves wereobtained by using the procedure that was used to develop the currentASME Code curves and the statistical models represented by Eqs. 2-6.The design fatigue curves for carbon and low-alloy steels andaustenitic Types 304 and 316 SS in air and LWR environments areshown in Figs. 2-6. Because the fatigue life of Type 316NG issuperior to that of Types 304 or 316 SS, Figs. 5 and 6 may be usedconservatively for Type 3 16NG SS.
The best-fit curves were adjusted for the effect of mean stress byusing the modified Goodman relationship (Eqs. la and lb), which
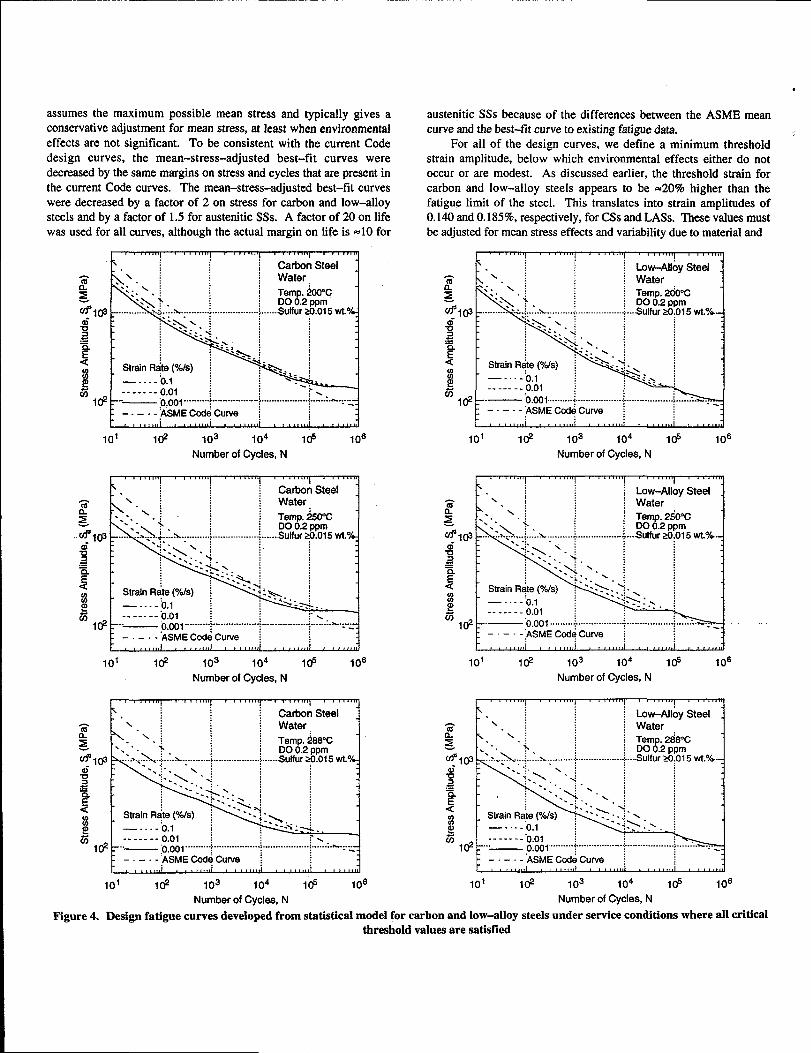
assumes the maximum possible mean stress and typically gives aconservative adjustment for mean stress, at least when environmentaleffects are not significant. To be consistent with the current Codedesign curves, the mean-stress-adjusted best-fit curves weredecreased by the same margins on stress and cycles that are present inthe current Code curves. The mean-stress-adjusted best-fit curveswere decreased by a factor of 2 on stress for carbon and low–alloysteels and by a factor of 1.5 for austenitic SSs. A factor of 20 on lifewas used for all curves, although the actual margin on life is =10 for
I\
! n
—... -0.1 i
1-------0.01.-— p,ml.........+. .............------ ASME Code Curve
c 1 I u
Temp. bnCDO 0.2 ppm
,1
....Sulfur20.015 wt.Y
1 d,01 102 103 10’$ Id 106
Number of Cycles, N
E’.’‘r’’’’”~“’’”>’‘“’’’’”‘ “’’’”‘ ““:Carbon Steel
3
.3g
2
FI%&_StrainRate (%/s) t—----b.l-------0.01.._ ~.ool .......... .... ~
:X........................................... ....
-. – -- ASME Code Curve i -1t I I I I J
10’ K? 103 104 lF 106Number of Cycfes, N
{ r“’’’”~ I I I m
Carbon Steel
~ \~ Water,
~ >-. ‘.: Temp. 288°C
q,@ .:.>;.>.;6..:.k.: ......\ .................. .........f..2MwoT5 wt.%-
#?= ‘K. >:. i ~ j
E:
%g
-------0.01~ ,6 –.. ;..OO1.........j ............... :......................j........b.....--- -.F —.- -- ASME code Cuwe i 7t I I I i Luil
10’ K? 103 104 I& 10$Number of Cycles, N
austenitic SSs because of the differences between the ASME meancurve and the best-fit curve to existing fatigue data.
For all of the design curves, we define a minimum thresholdstrain amplitude, below which environmental effects either do notoccur or are modest. As discussed earlier, the threshold strain forcarbon and low-alloy steels appears to be =20% higher than thefatigue limit of the steel. This translates into strain amplitudes of0.140 and 0.185%, respectively, for CSS and LASS. These values mustbe adjusted for mean stress effects and variability due to material and
k ‘““7 ‘ “’’’”/‘‘“mL
\\:
-------0.01 ;~— 0.001...--.-...+------------------.— --‘ASMECodeCuwe
Low-Alloy SteelWater iTemp. ~O°CDO 0.2 ppm
...Sulfur20.015 wt.%
Ii
‘-+-4>--;<,.:.......................-......--
10’ 102 103 ,04 105 ,06
Number of Cycles, N
\ ! I I 1 m
~ Low-Alloy Steef\:
G j Waterj Temp. 2500C; DO 0.2 ppm
....j..................~...Sulfur20.015 wt.%:
s “+:.\.’. : ~ :3~q +.. i i
:-..:
A;lti~:~R:c>y-—:0.001---.---.-+-.-...----.-..---;-.------------.-.-;-----:-.--:--
t $$ l!,ll!i I 1 I Uil10’ 102 103 104 105 ,06
Numberof Cycles, N
f I I rnl’1
\
a \:.\ i
g\ .:..
g.=
mcog
-------’0.01~ ,& -... ~.ool . . . . . . . . . . . . . . . . . . . . . . . . . .
---- - ASME Cork Curvet I I u
Low-All~y SteelWater iTemp. 288°CDO 0.2 ppm
.-.Sulfur20.015 wt.%
11-1
-+4\>:>.:............................%.:
I J,01 1# 103 ,04 Id 106
Number of Cycles, N
.
Figure 4. Design fatigue curves developed from statistical model for carbon and low-alloy steels under service conditions where all criticalthreshold values are satisfied
.
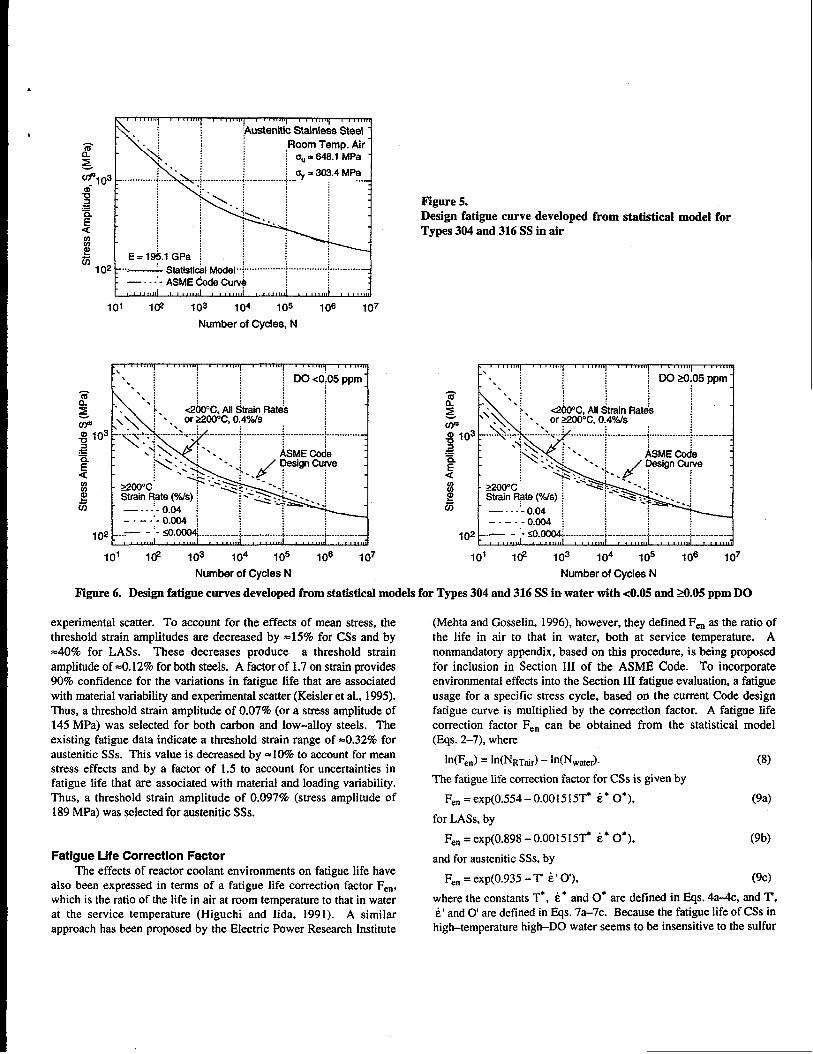
b$ustenitii stainless Steel -
3
g! u = 303,4 MPa...............+... y , ..._
g Figure 5..=
$ Design fatigue curve developed from statistical model forTypes 304 and 316 SS in air
mmg E=19kl GPa ~ ~ ! ~m 102 ---- StatisticalM~el.-~..-.’----”-”--~.-..-”--------------------
— -- -“-ASME h Curve ( ;I u
101 l(y 103 104 I 05 1@ 107
Number of Oycles, N
102 ---- ‘- a.@ ...............................4.............................
10’ 102 1fJ3 104 105 106 107
I I I I I.: ~ DO 20.05 ppm. . .:
._. - <o.mi ...............i...............................~l.............I
102
10’ 102 103 104 1or’ 106 107
Number of Cycles N Number of Cycles N
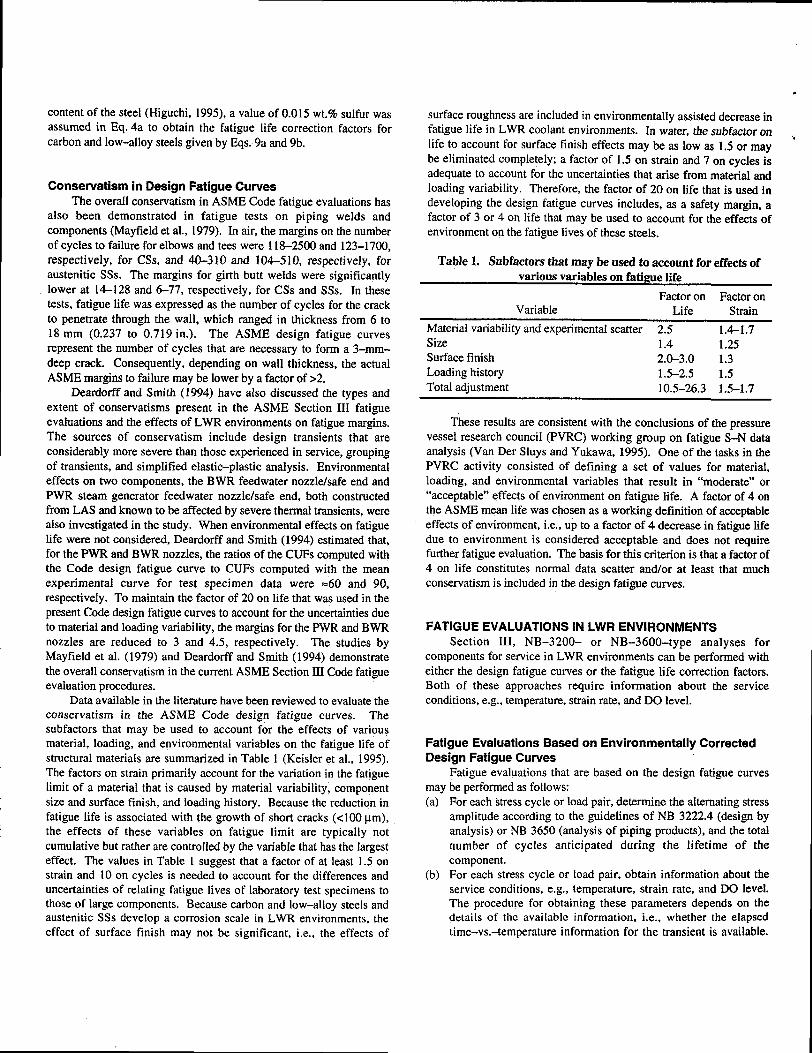
Figure 6. Design fatigue curves developed from statistical models for Types 304 and 316 SS in water with <0.05 and 20.05 ppm DO
experimental scatter. To account for the effects of mean stress, thethreshold strain amplitudes are decreased by =15% for CSS and by=40% for LASS. These decreases produce a threshold strainamplitude of =0.12% for both steels. A factor of 1.7 on strain provides90% confidence for the variations in fatigue life that are associatedwith material variability and experimental scatter (Keisler et al., 1995).Thus, a threshold strain amplitude of 0.07% (or a stress amplitude of145 MPa) was selected for both carbon and low-alloy steels. Theexisting fatigue data indicate a threshold strain range of =0.32% foraustenitic SSs. This value is decreased by 510% to account for meanstress effects and by a factor of 1.5 to account for uncertainties infatigue life that are associated with material and loading variability.Thus, a threshold strain amplitude of 0.097% (stress amplitude of189 MPa) was selected for austenitic SSs.
Fatigue Liie Correction FactorThe effects of reactor coolant environments on fatigue life have
also been expressed in terms of a fatigue life correction factor Fen,which is the ratio of the life in air at room temperature to that in waterat the service temperature (Higuchi and Iida, 1991). A similarapproach has been proposed by the Electric Power Research Institute
(Mehta and Gosselin, 1996), however, they defined Fen as the ratio ofthe life in air to that in water, both at service temperature. Anonmsndatory appendix, based on this procedure, is being proposedfor inclusion in Section HI of the ASME Code. To incorporateenvironmental effects into the Section III fatigue evaluation, a fatigueusage for a specific stress cycle, baaed on the current Code designfatigue curve is multiplied by the correction factor. A fatigue lifecorrection factor Fen can be obtained from the statistical model(Eqs. 2-7), where
In(Fen)= ht(NRT~r)- In(NWater). (8)
The fatigue life correction factor for CSS is given by
Fen = exp(0,554 - 0.001515T’ k* O*), (9a)
for LASS, by
Fen = exp(O.898 - 0.001515~ 6* O*), (9b)
and for austertitic SSs, by
F,n = exp(O.935 - T &‘O), (9C)
where the constants T*, 6* and 0“ are defined in Eqs. 4a4c, and T,ti’ and O are defined in Eqs. 7a-7c. Because the fatigue life of CSS inhigh-temperature high-DO water seems to be insensitive to the sulfur
content of the steel (Higuchi, 1995), a value of 0.015 wt.~o sulfur wasassumed in Eq. 4a to obtain the fatigue life correction factors forcarbon and low–alloy steels given by Eqs. 9a and 9b.
Conservatism in Design Fatigue CurvesThe overall conservatism in ASME Code fatigue evaluations has
also been demonstrated in fatigue tests on piping welds andcomponents (Maytield et al., 1979). In air, the margins on the numberof cycles to failure for elbows and tees were 118-2500 and 123–1700,respectively, for CSS, and 40-310 and 104-510, respectively, foraustenitic SSs. The margins for girth butt welds were significantlylower at 14-128 and 6-77, respectively, for CSS and SSs. In thesetests, fatigue life was expressed as the number of cycles for the crackto penetrate through the wall, which ranged in thickness from 6 to18 mm (0.237 to 0.719 in.). The ASME design fatigue curvesrepresent the number of cycles that are necessary to form a 3-mm-deep crack. Consequently, depending on wall thickness, the actualASME margins to failure maybe lower by a factor of >2.
Deardorff and Smith (1994) have also discussed the types andextent of conservatism present in the ASME Section III fatigueevaluations and the effects of LWR environments on fatigue margins.The sources of conservatism include design transients that areconsiderably more severe than those experienced in service, groupingof transients, and simplified elastic–plastic analysis. Environmentaleffects on two components, the BWR feedwater nozzlelsafe end andPWR steam generator feedwater nozzle/safe end, both constmctedfrom LAS and known to be affected by severe thermrd transients, werealso investigated in the study. When environmental effects on fatiguelife were not considered, Deardorff and Smith (1994) estimated that,for the PWR and BWR nozzles, the ratios of the CUFS computed withthe Code design fatigue curve to CUFS computed with the meanexperimental curve for test specimen data were =60 and 90,respectively. To maintain the factor of 20 on life that was used in thepresent Code design fatigue curves to account for the uncertainties dueto material and loading variability, the margins for the PWR and BWRnozzles are reduced to 3 and 4.5, respectively. The studies byMayfield et al. (1979) and Deardorff and Smith (1994) demonstratethe overall conservatism in the current ASME Section III Code fatigueevaluation procedures.
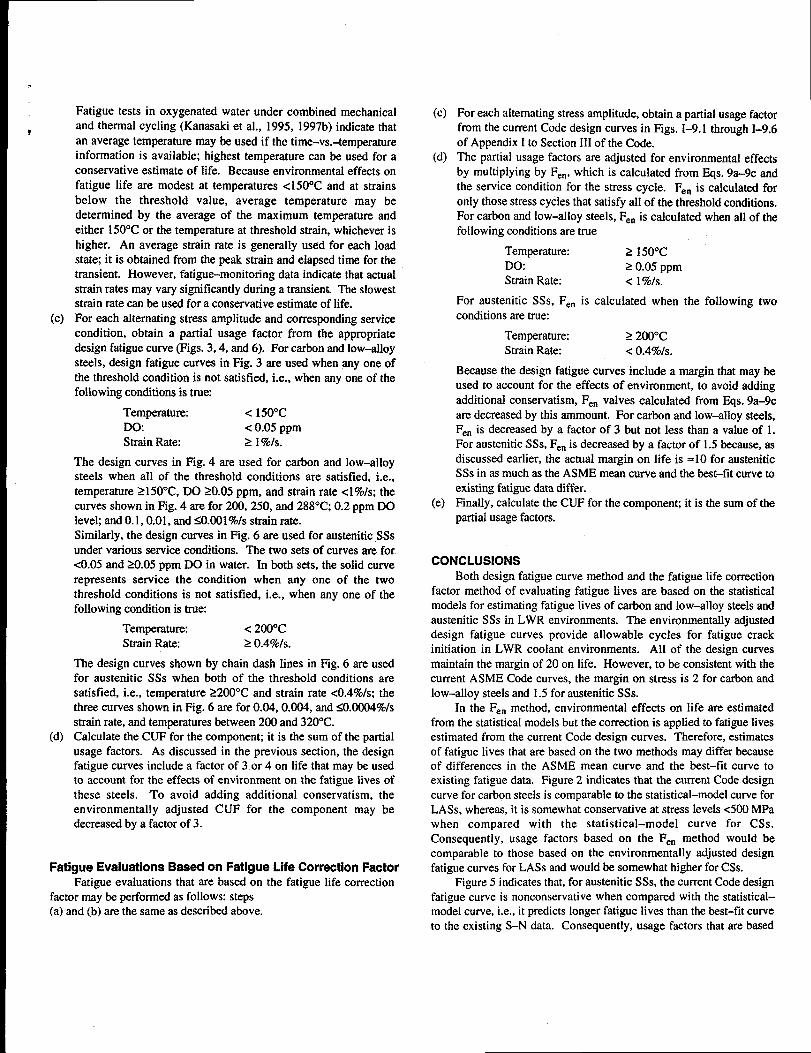
Data available in the literature have been reviewed to evaluate theconservatism in the ASME Code design fatigue curves. Thesubfactors that may be used to account for the effects of variousmaterial, loading, and environmental variables on the fatigue life ofstructural materials are summarized in Table 1 (Keisler et al., 1995).The factors on strain primarily account for the variation in the fatiguelimit of a material that is caused by material variability, componentsize and surface finish, and loading history. Because the reduction infatigue life is associated with the growth of short cracks (c1OOpm),the effects of these variables on fatigue limit are typically notcumulative but rather are controlled by the variable that has the largesteffect. The values in Table 1 suggest that a factor of at least 1.5 onstrain and 10 on cycles is needed to account for the differences anduncertainties of relating fatigue lives of laboratory test specimens tothose of large components. Because carbon and low-alloy steels andaustenitic SSs develop a corrosion scale in LWR environments, theeffect of surface finish may not be significant, i.e., the effects of
surface roughness are included in environmentally assisted decrease infatigue life in LWR coolant environments. In water, the subfactor onlife to account for surface finish effects may be as low as 1,5 or maybe eliminated completely; a factor of 1.5 on strain and 7 on cycles isadequate to account for the uncertainties that arise from material andloading variability. Therefore, the factor of 20 on life that is used indeveloping the design fatigue curves includes, as a safety margin, afactor of 3 or 4 on life that may be used to account for the effects ofenvironment on the fatigue lives of these steels.
Table L Subfactors that maybe used to account for effects ofvarious variables on fatigue life
Factor on Factor onVariable Life Strain
Material variability and experimental scatter 2.5 1.4-1.7Size 1.4 1.25Surface finish 2.0-3.0 1.3Loading history 1.5-2.5 1.5Total adjustment 10.5–26.3 1.5–1.7
These results are consistent with the conclusions of the pressurevessel research council (PVRC) working group on fatigue S-N dataanalysis (Van Der ShIys and Yukawa, 1995). One of the tasks in thePVRC activity consisted of defining a set of values for material,loading, and environmental variables that result in “moderate” or“acceptable” effects of environment on fatigue life. A factor of 4 onthe ASME mean life was chosen as a working definition of acceptableeffects of environment, i.e., up to a factor of 4 decrease in fatigue lifedue to environment is considered acceptable and does not requirefurther fatigue evaluation. The basis for this criterion is that a factor of4 on life constitutes normal data scatter and/or at least that muchconservatism is included in the design fatigue curves.
FATIGUE EVALUATIONS IN LWR ENVIRONMENTSSection 111, NB–3200- or NB–3600–type analyses for
components for service in LWR environments can be performed witheither the design fatigue curves or the fatigue life correction factors.Both of these approaches require information about the servicecondkions, e.g., temperature, strain rate, and DO level.
Fatigue Evaluations Based on Environmentally CorrectedDesign Fatigue Curves
Fatigue evaluations that are based on the design fatigue curvesmay be performed as follows:(a)
(b)
For each stress cycle or load pair, determine the alternating stressamplitude according to the guidelines of NB 3222.4 (design byanalysis) or NB 3650 (analysis of piping products), and the totalnumber of cyc~es anticipated during the lifetime of thecomponent.For each stress cycle or load pair, obtain information about theservice conditions, e.g., temperature, strain rate, and DO level.The procedure for obtaining these parameters depends on thedetails of the available information, i.e., whether the elapsedtime-vs.-temperature information for the transient is available.
●
‘#
.
r
(c)
(d)
Fatigue tests in oxygenated water under combined mechanicaland thermal cycling (Kanasaki et al., 1995, 1997b) indicate thatan average temperature may be used if the time-vs.-temperatureinformation is available; highest temperature can be used for aconservative estimate of life. Because environmental effects onfatigue life are modest at temperatures c 150”C and at strainsbelow the threshold value, average temperature may bedetermined by the average of the maximum temperature andeither 150°C or the temperature at threshold strain, whichever ishigher. An average strain rate is generally used for each loadstate; it is obtained from the peak strain and elapsed time for thetransient. However, fatigue-monitoring data indicate that actualstrain rates may vary significantly during a transien~ The sloweststrain rate can be used for a conservative estimate of life.For each alternating stress amplitude and corresponding servicecondition, obtain a partial usage factor from the appropriatedesign fatigue curve (Figs. 3,4, and 6). For carbon and low-alloysteels, design fatigue cuwes in Fig. 3 are used when any one ofthe threshold condition is not satisfied, i.e., when any one of thefollowing conditions is true
Temperature: < 150°cDO. c 0.05 ppmStrain Rate: ~ 1%fs.
The design curves in Fig. 4 are used for carbon and low–alloysteels when all of the threshold conditions are satisfied, i.e.,temperature 2150°C, DO 20.05 ppm, and strain rate <1%/s; thecurves shown in Ftg. 4 are for 200, 250, and 288°C; 0.2 ppm DOleve~ and 0.1,0.01, and <0.001%/s strain rate.Similarly, the design curves in Fig. 6 are used for austenitic SSsunder various service conditions. The two sets of curves are for<0.05 and 20.05 ppm DO in water. In both sets, the solid curverepresents service the condition when any one of the twothreshold conditions is not satisfied, i.e., when any one of thefollowing condition is true
Temperattuw < 200”CStrain Rate: > ().4%/s.
The design curves shown by chain dash lines in Fig. 6 are usedfor austenitic SSs when both of the threshold conditions aresatisfied, i.e., temperature 2200°C and strain rate <0.4%/s; thethree curves shown in Fig. 6 are for 0.04,0.004, and <0.0004Y0/sstrain rate, and temperatures between 200 and 320”C.Calculate the CUF for the component; it is the sum of the partialusage factors. As discussed in the previous section, the designfatigue curves include a factor of 3 or 4 on life that maybe usedto account for the effects of environment on the fatigue lives ofthese steels. To avoid adding additional conservatism, theenvironmentally adjusted CUF for the component may bedecreased by a factor of 3.
Fatigue Evaluations Based on Fatigue Life Correction FactorFatigue evaluations that are based on the fatigue life correction
factor may be performed as follows: steps(a) and (b) are the same as described above.
(c)
(d)
(e)
For each alternating stress amplitude, obtain a partial usage factorfrom the current Code design curves in Figs. I–9. 1 through I-9.6of Appendix I to Section 111of the Code.The partial usage factors are adjusted for environmental effectsby multiplying by Fen, which is calculated from Eqs. 9a-9c andthe service condition for the stress cycle. Fen is calculated foronly those stress cycles that satisfy all of the threshold condhions.For carbon and low-alloy steels, Fen is calculated when all of thefollowing conditions are true
Temperature: 2 150”CDO: 20.05 ppmStrain Rate: <1 %/s.
For austenitic SSs, Fen is calculated when the foIlowing twoconditions are true:
Temperature: 2 200”CStrain Rate: < 0.4%/s.
Because the design fatigue curves include a margin that maybeused to account for the effects of environment, to avoid addingadditional conservatism, Fen valves calculated from Eqs. 9a-9care decreased by this ammount. For carbon and low-alloy steels,Fen is decreased by a factor of 3 but not less than a value of 1.For austenitic SSs, Fen is decreased by a factor of 1.5 because, asdiscussed earlier, the actual margin on life is =10 for austeniticSSs in as much as the ASME mean curve and the best-fit curve toexisting fatigue data differ.Finally, calculate the CUF for the component; it is the sum of thepartial usage factors.
CONCLUSIONSBoth design fatigue curve method and the fatigue life correction
factor method of evaluating fatigue lives are based on the statisticalmodels for estimating fatigue lives of carbon and low–alloy steels andaustenitic SSs in LWR environments. The environmentally adjusteddesign fatigue curves provide allowable cycles for fatigue crackinitiation in LWR coolant environments. All of the design curvesmaintain the margin of 20 on life. However, to be consistent with thecument ASME Code curves, the margin on stress is 2 for carbon andlow–alloy steels and 1.5 for austenitic SSs.
In the Fen method, environmental effects on life are estimatedfrom the statistical models but the correction is applied to fatigue livesestimated from the current Code design curves. Therefore, estimatesof fatigue lives that are based on the two methods may differ becauseof differences in the ASME mean curve and the best-fit curve toexisting fatigue data. F]gure 2 indicates that the current Code designcurve for carbon steels is comparable to the statistical-model curve forLASS, whereas, it is somewhat conservative at stress levels 400 MPawhen compared with the statistical-model curve for CSS.Consequently, usage factors based on the Fe. method would becomparable to those based on the environmentally adjusted designfatigue curves for LASS and would be somewhat higher for CSS.
Figure 5 indicates that, for austenitic SSs, the current Code designfatigue curve is nonconservative when compared with the statistical-model curve, i.e., it predicts longer fatigue lives than the best-fit curveto the existing S-N data. Consequently, usage factors that are based
on the Fen method would be lower than those determined from theenvironmentally corrected design fatigue curves. However, becausethe usage factors are decreased by a factor of 1.5 in the Fen method and3 in the design curve method, the values from the two methods wouldbe comparable after they are adjusted.
ACKNOWLEDGMENTSThis work was sponsored by the Office of Nuclear Regulatory
Research, U.S. Nuclear Regulatory Commission, FIN Number W661O;Program Managec Dr. M. McNeil.
REFERENCESChopra, O. K., 1999, “Effects of LWR Cookmt Environments on
Fatigue Design Curves of Austenitic Stainless Steelsfl NUREG/CR-5704, ANL-98131 .
Chopra, O. K., and Gavenda, D. J., 1997, “Effects of LWRCoolant Environments on Fatigue Lives of Austenitic StainlessSteels; Pressure VesseI and Piping Codes and Standards, PVP Vol.353, D. P. Jones, B. R. Newton, W. J. ODonnell, R. Vecchio, G. A.Antaki, D. Bhavani, N. G. Cofie, and G. L. Hollinger, eds., AmericanSociety of Mechanical Engineers, New York, pp. 87–97.
Chopra, O. K., and Gavenda, D., J., 1998, “Effects of LWRCoolant Environments on Fatigue Lives of Austenitic StainlessSteel$” J. Pressure Vessel Technol. 120, pp. 116-121.
Chopra, O. K., and Shack, W. J., 1997, ‘73valuation of Effects ofLWR Coolant Environments on Fatigue Life of Carbon and Low-Alloy Steels: E$ects of the Environment on the Initiation of Crock
Growth, ASTM STP 1298, W. A. Van Der Sluys, R. S. Piascik, and R.Zawierucha, eds., American Society for Testing and Materials,Philadelphia, pp. 247-266.
Chopra, O. K., and Shack, W. J., 1998a, “Low-Cycle Fatigue ofPiping and Pressure Vessel Steels in LWR Environments’ Nucl. Eng.Des. 184, pp. 49-76.
Chopra, O. K., and Shack, W. J., 1998b, “Effects of LWRCoolant Environments on Fatigue Design Curves of Carbon and Low-Alloy Steels,” NUREG/CR-6583, ANL–97/18.
Chopra, O. K., and Shack, W. J., 1998c, “Fatigue Crack Initiationin Carbon and Low–Alloy Steels in Light Water ReactorEnvironments – Mechanism and Prediction:’ Fatigue, EnvironmentalFactors, and New Materials, PVP Vol. 374, H. S. Mehta, R. W.Swindeman, J. A. Todd, S. Yukawa, M. Zako, W. H. Bamford, M.Higuchi, E. Jones, H. Nickel, and S. Rahman, eds., American Societyof Mechanical Engineers, New York, pp. 155-168.
Chopra, O. K., and Shack, W. J., 1999, “Overview of FatigueCrack Initiation in Carbon and Low-Alloy Steels in Light WaterReactor Environments,” J. Pressure Vessel Technol., in press.
Chopra, O. K., and Smith, J., L., 1998, “Estimation of FatigueStrain-Life Curves for Austenitic Stainless Steels in Light WaterReactor Environments,” Fatigue, Environmental Factors, and NewMaterials, PVP Vol. 374, H. S. Mehta, R. W. Swindeman, J. A. Todd,S. Yukawa, M. Zako, W. H. Bamford, M. Higuchi, E. Jones, H.Nickel, and S. Rahman, eds., American Society of MechanicalEngineers, New York, pp. 249-259.
Deardorff, A. F., and Smith, J, K., 1994, “Evaluation ofConservatism and Environmental Effects in ASME Code, Section III,
Class1 Fatigue Analysis,” SAND94-01 87, prepared by StructuralIntegrity Associates, San Jose, CA, under contract to Sandia NationalLaboratories, Albuquerque, NM.
Ford, F. P., 1986, “Overview of Collaborative Research into theMechanisms of Environmentally Controlled Cracking in the LowAlloy Pressure Vessel Steel/Water System; Proc, 2nd Int. AtomicEnergy Agency Specialists’ Meeting on Subcritical Crack Growth,NUREG/CP-O067, MEA–2090, Vol. 2, pp. 3-71.
Fujiwara, M., Endo, T., and Kanasaki, H., 1986, “Strain RateEffects on the Low Cycle Fatigue Strength of 304 Stainless Steel inHigh Temperature Water Environment: Fatigue Life: Analysis andPrediction, Proc. of the Intl. Conf and Exposition on Fatigue,
Corrosion Cracking, Fracture Mechanics, and Failure Analysis,ASM, Metals Park, OH, pp. 309-313.
Gavenda, D. J., Luebbers, P. R., and Chopra, O. K., 1997, “CrackInitiation and Crack Growth Behavior of Carbon and Low–AlloySteels; Fatigue and Fracture 1, Vol. 350, S. Rahman, K. K. Yoon, S.Bhandari, R. Warke, and J. M. Bloom, eds., American Society ofMechanical Engineers, New York, pp. 243-255.
Hanninen, H., Torronen, K., and Cullen, W. H., 1986,“Comparison of Proposed Cyclic Crack Growth Mechanisms of LowAlloy Steels in LWR Environmentsfl Proc. 2nd Int. Atomic Energy
Agency Specialists’ Meeting on Subcritical Crack Growth,NUREG/CP-0067, MEA–2090, Vol. 2, pp. 73-97.
Hayashi, M., 1998, ‘Thermal Fatigue Strength of Type 304Stainless Steel in Simulated BWR environment; Nucl. Eng. Des. 184,pp. 135-144.
Hayashi, M., Enomoto, K., Saito, T., and Miyagawa, T., 1998,“Development of Thermal Fatigue Testing with BWR WaterEnvironment and Thermal Fatigue Strength of Austenitic StainlessSteels,” Nucl. Eng. Des. 184, pp. 113-122.
Higuchi, M., 1995, presented at Working Group Meeting on S-NData Analysis, the Pressure Vessel Research Council, June,Milwaukee.
Higuchi, M., 1996, presented at Working Group Meeting on S-NData Analysis, the Pressure Vessel Research Council, April, Orlando,FL.
Higuchi, M., and Iida, K., 1991, “Fatigue Strength CorrectionFactors for Carbon and Low–Alloy Steels in Oxygen-ContainingHigh–Temperature Water: Nucl. Eng. Des. 129, pp. 293–306.
Higuchi, M., and Iida, K., 1997, “Reduction in Low-CycleFatigue Life of Austenitic Stainless Steels in High–TemperatureWater;’ Pressure Vessel and Piping Codes and Standards, PVP Vol.353, D. P. Jones, B. R. Newton, W. J. ODonnell, R. Vecchio, G. A.Antaki, D. Bhavani, N, G. Cotle, and G. L. Hollinger, eds., AmericanSociety of Mechanical Engineers, New York, pp. 79–85.
Higuchi, M., [ids, K., and Asada, Y., 1997, “Effects of StrainRate Change on Fatigue Life of Carbon steel in High–TemperatureWater; Effects of [he Environment on the Initiation of Crack Growth,ASTM STP 1298, W. A. Van Der Sluys, R. S. Piascik, and R.Zawierucha, eds., American Society for Testing and Materials,Philadelphia, pp. 216-231.
Kanasaki, H., Hayashi, M., Iida, K., and Asada, Y., 1995,“Effects of Temperature Change on Fatigue Life of Carbon steel inHigh Temperature Water: Fatigue and Crack Growth: EnvironmentalEffects, Modeling Studies, and Design Considerations, PVP Vol. 306,
9
&
c
S. Yukawa, cd., American Society of Mechanical Engineers, NewYork, pp. 117-122.
Kanasaki, H., Umehara, R,, Mizuta, H., and Suyama, T,, 1997a,“Fatigue Lives of Stainless Steels in PWR Primary Water,” Trans.
14th Intl. Conj on Structural Mechanics in Reactor Technology
(SMiRT 14), Lyon, France, pp. 473-483.Kanasaki, H., Umehara, R., Mizuta, H., and Suyama, T., 1997b,
“Effects of Strain Rate and Temperature Change on the Fatigue Life ofStainless Steel in PWR Primary Water,” Trans. 14th Intl. Conjl onStructural Mechanics in Reactor Technology (Sh4iRT 14), Lyon,France, pp. 485-493.
Katada, Y., Nagata, N., and Sate, S., 1993, “Effect of DissolvedOxygen Concentration on Fatigue Crack Growth Behavior of A533 BSteel in High–Temperature Water: LSIJIntl. 33 (8), pp. 877-883.
Keisler, J., Chopra, O. K., and Shack, W. J., 1995, “FatigueStrain-Life Behavior of Carbon and Low–Alloy Steels, AusteniticStainless Steels, and Alloy 600 in LWR Environments: NUREG/CR-6335, ANL-95/15.
Keisler, J., Chopra, O. K., and Shack, W. J., 1996, “FatigueStrain-Life Behavior of Carbon and Low-Alloy Steels, AusteniticStainless Steels, and Alloy 600 in LWR Environments,” Nucl. Eng,Des. 167, pp. 129-154.
Majumdar, S., Chopra, O. K., and Shack, W. J., 1993, “InterimFatigue Design Curves for Carbon, Low–Alloy, and AusteniticStainless Steels in LWR Environments: NUREG/CR-5999, ANL-93/3.
Mayfield, M. E., Rodabaugh, E. C., and Eiber, R. J., 1979, “AComparison of Fatigue Test Data on Piping with the ASME CodeFatigue Evaluation Procedure: ASME paper 79-PVP-92, AmericanSociety of Mechanical Engineers, New York.
Mehta, H. S., and Gosselin, S. R., 1996, “An EnvironmentalFactor Approach to Account for Reactor Water Effects in Light WaterReactor Pressure Vessel and Piping Fatigue Evaluations;’ Fatigue andFracture Volume 1, PVP Vol. 323, H. S. Mehta, cd., American Societyof Mechanical Engineers, New York, pp. 171–185.
Miller, K. J., 1985, “Initiation and Growth Rates of Short FatigueCracks,” Fundamentals of Deformation and Fracture, EshelbyMemorial Symposium, Cambridge University Press, Cambridge, pp.477-500.
Miller, K. J., 1995, “Damage in Fatigue: A New Outlook;International Pressure Vessels and Piping Codes and Standards:Volume I - Current Applications, PVP Vol. 313-1, K. R. Rao and Y.Asada, eds., American Society of Mechanical Engineers, New York,pp. 191-192.
Mimaki, H., Kanasaki, H., Suzuki, L, Koyama, M., Akiyama, M.,Okubo, T., and Mishima, Y., 1996, “Material Aging Research Programfor PWR Plants,” Aging Management Through MaintenanceManagement, PVP Vol. 332, I. T. IGsisel, cd., American Society ofMechanical Engineers, New York, pp. 97-105.
Nagata, N., Sate, S., and Katada, Y., 1991, “Low-Cycle FatigueBehavior of Pressure Vessel Steels in High-Temperature PressurizedWater: LSIJIntl. 31 (1), pp. 106-114.
Nakao, G., Kanasaki, H., Higuchi, M., Iida, K., and Asada, Y.,1995, “Effects of Temperature and Dissolved Oxygen Content onFatigue Life of Carbon and Low–Alioy Steels in LWR WaterEnvironment,” Fatigue and Crack Growth: Environmental Effects,Modeling Studies, and Design Considerations, PVP Vol. 306, S.
Yukawa, cd., American Society of Mechanical Engineers, New York,pp. 123-128.
Obttlik, K., Poklk, J,, Hfijek, M., and Vasek, A., 1997, “ShortFatigue Crack Behaviour in 316L Stainless Steel; ML J. Fatigue 19,pp. 471475.
Ranganath, S., Kass, J. N., and Heald, J. D., 1982, “FatigueBehavior of Carbon steel Components in High-Temperature WaterEnvironments BWR Environmental Cracking Margins for CarbonSteel Piping, EPRI NP-2406, Electric Power Research Institute, PaloAlto, CA, Appendix 3.
Smith, J., L., and Chopra, O. K., 1999, “Crack Initiation inSmooth Fatigue Specimens of Austenitic Stainless Steel in LightWater Reactor Environmentsfl These proceedings.
Sundara Raman, S. G., Argence, D., and Plneau, A., 1997, “HighTemperature Short Fatigue Crack Behaviour in a Stainless Steel:Fatigue Fract. Engng. Mater. Struct. 20, pp. 1015–1031.
Tokaji, K., Ogawa, T., and Osaka, S., 1988, “The Growth ofMicrostructurally Small Fatigue Cracks in a Ferrite-Pearlite Steel:Fatigue Fract. Engng. Mater. Struct. 11, pp. 311-342.
Van Der Sluys, W. A., 1993, “Evaluation of the Available Dataon the Effect of the Environment on the Low Cycle Fatigue Propertiesin Light Water Reactor Environments,” Proc. 6th Zntl. Symp. on
Environmental Degradation of Materials in Nuclear Power Systems –Water Reactors, R. E. Gold and E. P. Simonen, eds., The MetallurgicalSociety, Wamendale, PA, pp. 1-4.
Van Der Sluys, W. A., and Yukawa, S., 1995, “Status of PVRCEvaluation of LWR Coolant Environmental Effects on the S-NFatigue Properties of Pressure Boundary Materials: Fatigue andCrack Growth: Environmental Effects, Modeling Studies, and DesignConsiderations, PVP Vol. 306, S. Yukawa, cd., American Society ofMechanical Engineers, New York, pp. 47-58.
Related Documents