NUREG/CR-5704 ANL-98/31 Effects of LWR Coolant Environments on Fatigue Design Curves of Austenitic Stainless Steels Argonne National Laboratory U.S. Nuclear Regulatory Commission Office of Nuclear Regulatory Research Washington, DC 20555-0001

Welcome message from author
This document is posted to help you gain knowledge. Please leave a comment to let me know what you think about it! Share it to your friends and learn new things together.
Transcript

NUREG/CR-5704 ANL-98/31
Effects of LWR CoolantEnvironments onFatigue Design Curves ofAustenitic Stainless Steels
Argonne National Laboratory
U.S. Nuclear Regulatory CommissionOffice of Nuclear Regulatory ResearchWashington, DC 20555-0001

NUREG/CR-5704 ANL-98/31
Effects of LWR CoolantEnvironments on Fatigue Design Curves ofAustenitic Stainless SteelsManuscript Completed: November 1998Date Published: April 1999
Prepared byO. K. Chopra
Argonne National Laboratory9700 South Cass AvenueArgonne, IL 60439
M. McNeil, NRC Project Manager
Prepared forDivision of Engineering TechnologyOffice of Nuclear Regulatory Research U.S. Nuclear Regulatory CommissionWashington, DC 20555-0001NRC Job Code W6610

NUREG/CR–5704 ii

iii NUREG/CR–5704
EFFECTS OF LWR COOLANT ENVIRONMENTSON FATIGUE DESIGN CURVES OF AUSTENITIC STAINLESS STEELS
by
O. K. Chopra
Abstract
The ASME Boiler and Pressure Vessel Code provides rules for the construction of nuclearpower plant components. Figures I–9.1 through I–9.6 of Appendix I to Section III of the Codespecify fatigue design curves for structural materials. While effects of reactor coolantenvironments are not explicitly addressed by the design curves, test data indicate that theCode fatigue curves may not always be adequate in coolant environments. This reportsummarizes work performed by Argonne National Laboratory on fatigue of austenitic stainlesssteels in light water reactor (LWR) environments. The existing fatigue S–N data have beenevaluated to establish the effects of various material and loading variables such as steel type,dissolved oxygen level, strain range, strain rate, and temperature on the fatigue lives of thesesteels. Statistical models are presented for estimating the fatigue S–N curves as a function ofmaterial, loading, and environmental variables. Design fatigue curves have been developed foraustenitic stainless steel components in LWR environments. The extent of conservatism in thedesign fatigue curves and an alternative method for incorporating the effects of LWR coolantenvironments into the ASME Code fatigue evaluations are discussed.

NUREG/CR–5704 iv

v NUREG/CR–5704
Contents
Executive Summary.................................................................................................... ix
Acknowledgments.......................................................................................................... xi
1 Introduction ........................................................................................................... 1
2 Experimental.......................................................................................................... 3
3 Overview of Fatigue S–N Data .................................................................................. 9
3.1 Air Environment ............................................................................................ 9
3.2 LWR Environments........................................................................................ 12
3.2.1 Strain Rate......................................................................................... 13
3.2.2 Strain Amplitude................................................................................ 13
3.2.3 Dissolved Oxygen ............................................................................... 14
3.2.4 Temperature ...................................................................................... 15
3.3 Cast Stainless Steels...................................................................................... 16
4 Mechanism of Fatigue Crack Initiation ..................................................................... 18
4.1 Formation of Engineering Cracks.................................................................... 18
4.2 Environmental Effects.................................................................................... 20
5 Statistical Model ..................................................................................................... 24
6 Design Fatigue Curves ............................................................................................ 28
7 Fatigue Life Correction Factor.................................................................................. 31
8 Conservatism in Design Fatigue Curves ................................................................... 31
9 Fatigue Evaluations in LWR Environments............................................................... 33
NUREG/CR–5704 vi
10 Summary ............................................................................................................... 33
10.1 Air Environment ............................................................................................ 34
10.2 LWR Environments........................................................................................ 34
10.3 Fatigue Design Curves in LWR Environments.................................................. 35
References.............................................................................................................. 35

vii NUREG/CR–5704
Figures
1. Fatigue S–N data for CSs and austenitic SSs in water ............................................. 2
2. Configuration of fatigue test specimen ................................................................... 4
3. Schematic diagram of autoclave system for fatigue tests in water environment .......... 4
4. Total applied displacement and strain in specimen gauge section duringstroke–controlled tests with a sawtooth waveform.................................................... 6
5. Fatigue S–N behavior for Types 304, 316, and 316NG austenitic SSs in air atvarious temperatures............................................................................................. 10
6. Effect of strain rate on fatigue lives of austenitic SSs in air for various strain ranges . 10
7. Effect of strain range on cyclic strain–hardening behavior of Type 316NG SS in airat room temperature and 288°C ............................................................................. 11
8. Cyclic stress–strain curves for Types 316NG, 304, and 316 SSs in air at roomtemperature and 288°C.......................................................................................... 11
9. Fatigue strain amplitude–vs.–life data for Types 316NG and 304 SS in water at288°C ................................................................................................................... 12
10. Dependence of fatigue life of austenitic SSs on strain rate in low– and high–DOwater .................................................................................................................... 13
11. Results of strain rate change tests on Type 316 SS in low–DO water at 325°C........... 14
12. Change in fatigue lives of austenitic SSs in low–DO water with temperature.............. 15
13. Waveforms for change in temperature during exploratory fatigue tests...................... 15
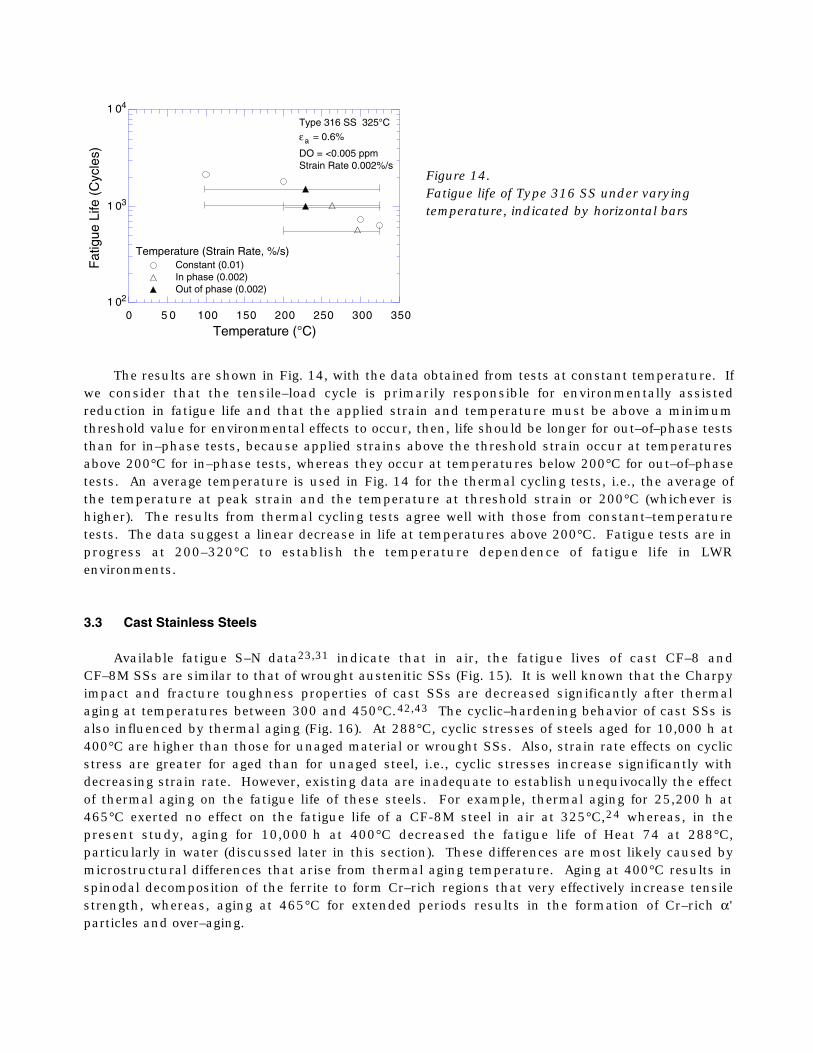
14. Fatigue life of Type 316 SS under varying temperature indicated by horizontal bars... 16
15. Fatigue strain amplitude–vs.–life data for CF–8M cast SSs in air............................... 17
16. Effect of strain rate on cyclic–hardening behavior of wrought and cast SSs in air at288°C ................................................................................................................... 17
17. Fatigue strain amplitude–vs.–life data for CF–8M cast SSs in water .......................... 18
18. Dependence of fatigue lives of CF–8M cast SSs on strain rate in low–DO water atvarious strain amplitudes ...................................................................................... 18
19. Growth of cracks in smooth fatigue specimens ........................................................ 19
20. Schematic illustration of short–crack behavior ....................................................... 20

NUREG/CR–5704 viii
21. Photomicrographs of gauge surface of Type 316NG SS specimens tested in air,simulated PWR water, and high–DO water ............................................................. 21
22. Schematic illustration of film rupture/slip dissolution process ................................. 22
23. Photomicrographs of fracture surfaces of Types 304 and 316NG SS specimenstested in air, high–DO water, and low–DO, simulated PWR water.............................. 23
24. Experimental and predicted values of fatigue lives of austenitic SSs in air and waterenvironments ........................................................................................................ 26
25. Experimental fatigue lives and those estimated from statistical models for austeniticSSs in water environments..................................................................................... 26
26. Residual error for austenitic SSs as a function of test temperature ........................... 27
27. Residual error for austenitic SSs as a function of material heat ................................ 27
28. Residual error for austenitic SSs as a function of loading strain rate......................... 27
29. Residual error for austenitic SSs as a function of applied strain amplitude................ 28
30. Residual error for austenitic SSs as a function of dissolved oxygen in water .............. 28
31. ASME and statistical–model design fatigue curves for Types 304 and 316 SS in air .. 30
32. ASME and statistical–model design fatigue curves for Types 304 and 316 SS inwater with <0.05 ppm DO ...................................................................................... 30
33. ASME and statistical–model design fatigue curves for Types 304 and 316 SS inwater with ≥0.05 ppm DO ...................................................................................... 30
Tables
1. Composition (in wt.%) of wrought and cast SSs used for fatigue tests........................ 3
2. Fatigue test results for Type 316NG austenitic SS ................................................... 7
3. Fatigue test results for Type 304 austenitic SS at 288°C .......................................... 8
4. Fatigue test results for CF–8M cast SSs at 288°C .................................................... 8
5. Subfactors that may be used to account for effects of various variables on fatiguelife........................................................................................................................ 32

ix NUREG/CR–5704
Executive Summary
Section III, Subsection NB of the ASME Boiler and Pressure Vessel Code contains rules forthe design of Class 1 components. Figures I–9.1 through I–9.6 of Appendix I to Section IIIspecify the Code design fatigue curves for applicable structural materials. However, SectionIII, Subsection NB–3121 of the Code states that effects of the coolant environment on fatigueresistance of a material were not intended to be addressed in these design curves. Therefore,there is uncertainty about the effects of environment on fatigue resistance of materials used inoperating pressurized water reactor (PWR) and boiling water reactor (BWR) plants, whoseprimary–coolant–pressure–boundary components were designed in accordance with the Code.
The current Section–III design fatigue curves of the ASME Code were based primarily onstrain–controlled fatigue tests of small polished specimens at room temperature in air.Best–fit curves to the experimental test data on stress or on cycles, were lowered by a factor of2 on stress or 20 on cycles, whichever was more conservative, to obtain the design fatiguecurves. These factors are not safety margins but rather adjustment factors that must beapplied to experimental data to obtain estimates of the lives of components. They were notintended to address the effects of the coolant environment on fatigue life. Recent fatigue strainv s . l i f e (S–N) data obtained in the U.S. and Japan demonstrate that light water reactor (LWR)environments can have potentially significant effects on the fatigue resistance of materials.Specimen lives obtained from tests in simulated LWR environments can be much shorter thanthose obtained from corresponding tests in air.
This report summarizes work performed by Argonne National Laboratory on fatigue ofaustenitic stainless steels (SSs) in simulated LWR environments. The existing fatigue S–Ndata, foreign and domestic, for wrought and cast stainless steels have been evaluated toestablish the effects of various material and loading variables on fatigue life. Statisticalmethods have been used to develop fatigue S–N curves that include the effects of material,loading, and environmental variables. An alternative method for incorporating the effects ofLWR coolant environments into the ASME Code fatigue design curves is presented.
Overview of Fatigue S–N Data
In air, the fatigue lives of Types 304 and 316 SS are comparable; those of Type 316NG aresuperior. The fatigue S–N behavior of cast CF–8 and CF–8M SSs is similar to that of wroughtaustenitic SSs. The fatigue life of all steels is independent of temperature in the range fromroom temperature to 427°C; at temperatures above 260°C, it may decrease with decreasingstrain rate. The ASME mean curve for austenitic SSs is nonconservative with respect to theexisting fatigue S–N data; at strain amplitudes <0.5%, the mean curve predicts significantlylonger fatigue lives than those observed experimentally.
The fatigue lives of cast and wrought austenitic SSs is decreased in LWR environments.The reduction in life depends on strain rate, dissolved oxygen (DO) level in water, andtemperature. The effect of LWR environments on fatigue life is comparable for all steels. Theresults indicate that a minimum threshold strain is required to produce an environmentallyassisted decrease in the fatigue life of these steels. The threshold value most likelycorresponds to the rupture strain of the surface oxide film; limited data suggest that thethreshold strain is between 0.32 and 0.36%.
NUREG/CR–5704 x
The effects of environment on fatigue life occur primarily during the tensile–loading cycle,and at strain levels greater than the threshold value required to rupture the surface oxide film.Consequently, loading and environmental conditions, e.g., strain rate, temperature, and DOlevel, in excess of the oxide rupture strain during the tensile–loading cycle, are importantparameters for environmentally assisted reduction of fatigue life of these steels. Unlike ferriticsteels, where environmental effects are greater in high–DO environments, environmentaleffects on fatigue life of austenitic stainless steels are more pronounced in low– than inhigh–DO water. The reduction in life is greater by a factor of ≈2 in simulated PWRenvironment, i.e., <0.01 ppm DO, than in high–DO water, i.e., ≥0.1 ppm DO. Existing data areinadequate to establish the functional form for the dependence of fatigue life on DO content.Recent data indicate that conductivity of water is important for environmental effects onfatigue life in high–DO water. The fatigue lives of cast SSs are approximately the same in bothhigh– and low–DO water and are comparable to those observed for wrought SSs in low–DOwater.
The fatigue lives of austenitic SSs decrease with decreasing strain rate; the effect isgreater in a low–DO PWR environment than in high–DO water. The results indicate that therate below which the effects of strain rate on fatigue life saturate may depend on both steeltype and DO level. In low–DO PWR environments, saturation strain rate appears to be at≈0.0004%/s for Type 304 SS and somewhat higher for Type 316 SS. The existing data areinadequate to establish the functional form for the dependence of life on temperature. Limiteddata indicate that environmental effects on fatigue life are significant at 250°C and minimalbelow 200°C.
Fatigue Design Curves in LWR Environments
Statistical models have been developed to predict fatigue lives of small smooth specimensof austenitic SSs as a function of material, loading, and environmental parameters. Thefunctional form and bounding values of these parameters were based on experimentalobservations and data trends. The statistical models were obtained by minimizing the squaredCartesian distances from the data point to the predicted curve instead of minimizing the sumof the square of the residual errors for either strain amplitude or fatigue life. The models arerecommended for predicted fatigue lives ≤106 cycles. The results indicate that the ASMEmean curve for SSs is not consistent with the experimental data at strain amplitudes <0.5% orstress amplitudes <975 MPa (<141 ksi); the ASME mean curve is non conservative.
The design fatigue curves for austenitic SSs in LWR environments were obtained by theprocedure that has been used to develop the current ASME Code design fatigue curves, i.e., byadjusting the best–fit experimental curve for the effect of mean stress and setting margins of20 on cycles and 2 on strain to account for the uncertainties in life that are associated withmaterial and loading conditions. However, because the margin on strain for the current ASMECode design fatigue curve is closer to 1.5 than 2, a factor of 1.5 was used in developing thedesign fatigue curves for LWR environments. Data available in the literature were reviewed toevaluate the conservatism in the existing Code fatigue design curves. The use of a fatigue lifecorrection factor to incorporate the effects of environment into the ASME Code fatigueevaluations is also discussed.
xi NUREG/CR–5704
Acknowledgments
The author thanks J. L. Smith, W. F. Burke, T. M. Galvin, and J. Tezak for theircontributions to the experimental effort and W. J. Shack and T. F. Kassner for helpfuldiscussions. This work is sponsored by the Office of Nuclear Regulatory Research, U.S.Nuclear Regulatory Commission, under Job Code W6610-6; Program Manager: Dr. M. B.McNeil.

NUREG/CR–5704 xii

1 Introduction
Experience with operating nuclear power plants worldwide reveals that many failures, e.g., inpiping components, nozzles, valves, and pumps, may be attributed to fatigue.1–3 In most cases,these failures have been associated with thermal loading due to thermal stratification or thermalstriping, or with mechanical loading due to vibration. Significant thermal loadings due to flowstratification were not included in the original design basis analysis. The effect of these loadingsmay also have been aggravated by corrosion effects due to exposure to high–temperature aqueousenvironments. Fatigue cracks have been observed in pressurizer surge lines in pressurized waterreactors (PWRs) (NRC Bulletin No. 88–11), and in feedwater lines connected to nozzles of pressurevessels in boiling water reactors (BWRs) and steam generators in PWRs (NRC IE Bulletin, 79–13;NRC Information Notice 93–20). These cracks have been attributed to corrosion fatigue (NRC IEBulletin, 79–13) or strain–induced corrosion cracking4 caused by cyclic loading due to thermalstratification during startup (hot standby) and shutdown periods.
Cyclic loadings on a structural component occur because of changes in the mechanical andthermal loadings as the system goes from one set of pressure, temperature, moment, and forceloading to any other load set. For each pair of load sets, an individual fatigue usage factor isdetermined by the ratio of the number of cycles anticipated during the lifetime of the component tothe allowable cycles. Figures I–9.1 through I-9.6 of Appendix I to Section III of the ASME Boilerand Pressure Vessel Code5 specifies fatigue design curves that define the allowable number ofcycles as a function of applied stress amplitude. The cumulative usage factor (CUF) is the sum ofthe individual usage factors, and Section III of the ASME Code requires that the CUF at eachlocation must not exceed 1.
The Code design fatigue curves were based on strain–controlled tests of small polishedspecimens at room temperature in air. In most studies, the fatigue life of a test specimen is definedas the number of cycles required for the tensile stress to drop 25% from its peak value. Such adrop corresponds to an ≈3–mm–deep crack. Consequently, fatigue life N represents the number ofcycles required to initiate a crack ≈3 mm deep. The best–fit curves to the experimental data wereexpressed in terms of the Langer equation6 of the form
εa = B(N)–b + A, (1)
where A, B, and b are parameters of the model. Equation 1 may be written in terms of stressamplitude Sa instead of strain amplitude εa, in which case stress amplitude is the product of strainamplitude and elastic modulus, i.e., Sa = Ε εa. The design fatigue curves were obtained bydecreasing the best–fit curves by a factor of 2 on stress or 20 on cycles, whichever was moreconservative, at each point on the best–fit curve. As described in the ASME Section–III criteriadocument, these factors were intended to account for the differences and uncertainties in relatingthe fatigue lives of laboratory test specimens to those of actual reactor components. The factor of20 on cycles is the product of three separate subfactors: 2 for scatter of data (minimum to mean),2.5 for size effects, and 4 for surface finish, atmosphere, etc. “Atmosphere” was intended to reflectthe effects of an industrial environment rather than the controlled environment of a laboratory.The factors of 2 and 20 are not safety margins but rather conversion factors that must be appliedto the experimental data to obtain reasonable

0.1
1.0
10.0
101 102 103 104 105 106
Str
ain
Am
plitu
de,
ε a (%
)
Carbon Steel
Fatigue Life (Cycles)
Mean CurveRT Air
ASME Design Curve
Temp. (°C)DO (ppm)Rate (%/s)S (wt.%)
: <150: ≤0.05: ≥0.4: ≥0.006
150–2500.05–0.20.01–0.4≥0.006
>250>0.2<0.01≥0.006
101 102 103 104 105 106
Austenitic Stainless Steels
Fatigue Life (Cycles)
Mean CurveRT Air
ASME Design Curve
Temp. (°C)DO (ppm)Rate (%/s)
250–325≈0.005≤0.01
: 100–200: ≈0.005: ≈0.01
260–325≥0.2≤0.04
Figure 1. Fatigue S–N data for CSs and austenitic SSs in water (RT = room temperature)
estimates of the lives of actual reactor components. In a benign environment, some fraction of thefactors actually represents a safety margin.
Subsection NB–3121 of Section III of the Code states that the data on which the fatigue designcurves (Figs. I–9.1 through I–9.6) are based did not include tests in the presence of corrosiveenvironments that might accelerate fatigue failure. Article B–2131 in Appendix B to Section IIIstates that the owner's design specifications should provide information about any reduction tofatigue design curves that is required because of environmental conditions. Recent fatiguestrain–vs.–life (S–N) data illustrate potentially significant effects of light water reactor (LWR) coolantenvironments on the fatigue resistance of carbon steels (CSs) and low–alloy steels (LASs),7–20 aswell as of austenitic stainless steels (SSs),21–31 (Fig. 1). Under certain conditions of loading andenvironment, fatigue lives of CSs can be a factor of 70 lower in the environment than in air.10,17–20
Therefore, the margins in the ASME Code may be less conservative than originally intended.
A program is being conducted at Argonne National Laboratory (ANL) to develop data andmodels for predicting the effects of environment on fatigue design curves of pressure vessel andpiping steels and to assess the additivity of fatigue damage under load histories typical of LWRcomponents. Fatigue tests are being conducted to establish the effects of various loading andenvironmental variables on the fatigue S–N behavior of pressure boundary steels. Interim designfatigue curves that address environmental effects on fatigue life of carbon and low–alloy steels andaustenitic SSs have been proposed; they are based on existing fatigue S–N data.32 Statisticalmodels have also been developed at ANL for estimating the effects of various material and loadingconditions on the fatigue life of these materials.33,34 Results of the statistical analysis have beenused to estimate the probability of fatigue cracking in reactor components. The statistical modelsfor carbon and low–alloy steels have recently been updated with a larger fatigue S–N database.18–20
The interim design curve and statistical model for austenitic SSs were based on limited data.For example, nearly all of the data in water were obtained at high temperatures (280–320°C) andhigh levels of dissolved oxygen (DO) (0.2–8 ppm). The data were inadequate to define the loadingand environmental conditions that can decrease fatigue life of austenitic SSs. The threshold forstrain amplitude above which environment can decrease fatigue life, and the value of strain ratebelow which environmental effects saturate, were based on the data for carbon and low–alloy steels.Fatigue lives in LWR environments were assumed to be independent of temperature. Furthermore,although the proposed interim fatigue design curve33,34 for austenitic SSs was based on data

obtained in high–DO water, the curve was recommended for use at all oxygen levels until additionaldata became available, on the assumption that this was a conservative estimate of the likely effectof DO. Recent experimental results indicate that this assumption is not true.29–31 Also, the effectsof LWR environments on the fatigue lives of cast SSs have not been addressed. Recent test resultsand a larger fatigue S–N data base have led to the update of statistical models that were developedearlier for estimating the fatigue lives of austenitic SSs in LWR environments.31
This report summarizes available data on the effects of various material and loading variables,such as steel type, DO level, strain range, and strain rate, on the fatigue lives of wrought and castaustenitic SSs. The data have been analyzed to identify key parameters that influence fatigue lifeand define the threshold and saturation values of these parameters. The updated statisticalmodels for estimating the fatigue lives of austenitic SSs in LWR environments are presented. Thesignificance of the effect of environment on the current Code design curve is evaluated.
2 Experimental
Fatigue tests have been conducted on Types 316NG and 304 SS and two heats of CF–8M castSS to establish the effects of LWR coolant environments on fatigue lives of these steels. Thechemical composition of the steels is given in Table 1. For the CF–8M steels, fatigue specimenswere obtained from material that was thermally aged for 10,000 h at 400°C; Heat 74 was testedboth in the unaged and aged condition. Smooth cylindrical specimens with 9.5–mm diameter and19–mm gauge length were used for the fatigue tests (Fig. 2). A 1–µm surface finish in the axialdirection on the specimen gauge length to prevent circumferential scratches that might act as sitesfor crack initiation.
Table 1. Composition (in wt.%) of wrought and cast SSs used for fatigue tests
Material Heat Source C P S Si Cr Ni Mn Mo Cu N
Type 316NGa D432804 Vendor 0.011 0.020 0.001 0.52 17.55 13.00 1.76 2.49 0.10 0.108ANL 0.013 0.020 0.002 0.49 17.54 13.69 1.69 2.45 0.10 0.105
Type 304b 30956 Vendor 0.060 0.019 0.007 0.48 18.99 8.00 1.54 0.44 – 0.100
CF–8M c 74 ANL 0.064 – – 0.73 19.11 9.03 0.54 2.51 – 0.048
CF–8M d 75 ANL 0.065 – – 0.67 20.86 9.12 0.53 2.58 – 0.052
aASME SA312 seamless stainless steel pipe (hot–finished), 610–mm O.D. and 30.9–mm wall, fabricated bySumitomo Metal Industries, Ltd. Solution-annealed at 1038–1093°C for 0.5 h and water-quenched.
bSolution-annealed at 1050°C for 0.5 h.cSolutionannealed 1065–1120°C and waterquenched, measured ferrite content 18%.dSolutionannealed 1065–1120°C and waterquenched, measured ferrite content 28%.
Tests in water were conducted in a small autoclave with an annular volume of 12 mL; seeFig. 3. The once–through system consists of a 132–L supply tank, PulsafeederTM pump, heatexchanger, preheater, and autoclave. Water is circulated at a rate of ≈10 mL/min and a systempressure of 9 MPa. The autoclave is constructed of Type 316 SS and contains a titanium liner.The supply tank and most of the low–temperature piping are Type 304 SS;

.380
.378.380.378
A .001A .001
.376
.374A .001
.375
.750
1 1/4
5 15/16
11 7/8
1.500 R.750
+.0000-.0005
A .001
.750+.000-.002
A .001
A
Figure 2. Configuration of fatigue test specimen (all dimensions in inches)
1 2
4
9
10
11
9
12
3
815 16
14
19
7
6
13
18
5
17
1. Cover–gas supply tank 2. Water supply tank 3. Pulsafeeder high–pressure pump 4. Check valve 5. Heat exchanger 6. Preheat exchanger 7. Pipe autoclave 8. Fatigue test specimen 9. MTS hydraulic collet grips10. MTS load cell11. Displacement LVDT12. MTS hydraulic actuator13. ECP cell14. Platinum electrode15. Specimen electrode16. Reference electrode17. Mity MiteTM back–pressure regulator18. Orbisphere dissolved–oxygen meter19. MTS electrohydraulic controls
Figure 3. Schematic diagram of autoclave system for fatigue tests in water environment
titanium tubing is used in the heat exchanger and for connections to the autoclave andelectrochemical potential (ECP) cell. An Orbisphere meter and CHEMetricsTM ampules were used tomeasure the DO concentrations in the supply and effluent water. The redox and open–circuit

corrosion potentials were monitored at the autoclave outlet by measuring the ECPs of platinum andan electrode of the test material, respectively, against a 0.1–M KCl/AgCl/Ag external (cold)reference electrode. The measured ECPs, E(meas) (mV), were converted to the standard hydrogenelectrode (SHE) scale, E(SHE) (mV), by the polynomial expression35
E(SHE) = E(meas) + 286.637 – 1.0032(∆T) + 1.7447x10⁻⁴(∆T)2 – 3.03004x10⁻⁶(∆T)3, (2)
where ∆T (°C) is the test temperature of the salt bridge in the reference electrode minus the ambienttemperature. The test facility was later modified from a once–through system to a recirculatingsystem. For fatigue tests in high–DO environments, an ion–exchange filter was added to the returnline to maintain the high resistivity of the water. Also, a filter was installed in the cover–gas line toeliminate possible contamination. A similar recirculating system was used for fatigue tests insimulated low–DO PWR environments, except that the ECP cell was bypassed during recirculationand the ion–exchange filter in the return line from the autoclave to the feedwater supply tank wasexcluded.
After an initial transition period, when an oxide film develops on the fatigue sample, the DOlevel and ECP remain constant during the fatigue tests in either the once–through or recirculatingwater system. Although the difference between the DO levels in the feedwater and effluent water is>0.1 ppm, the difference between the DO levels at the inlet and outlet of the autoclave is≈0.02 ppm.
The DO level in the water was established by bubbling nitrogen that contains 1–2% oxygenthrough deionized water in the supply tank. The deionized water was prepared by passing purifiedwater through a set of filters that comprise a carbon filter, an Organex–Q filter, two ionexchangers, and a 0.2–mm capsule filter. Water samples were taken periodically to measurepH, resistivity, and DO concentration. When the desired concentration of DO was attained, thenitrogen/oxygen gas mixture in the supply tank was maintained at a 20–kPa overpressure. Afteran initial transition period during which an oxide film develops on the fatigue specimen, the DOlevel and the ECP in the effluent water remained constant during the test. Test conditions aredescribed in terms of the DO in effluent water.
Simulated PWR water was obtained by dissolving boric acid and lithium hydroxide in 20 L ofdeionized water before adding the solution to the supply tank. The DO in the deionized water wasreduced to <10 ppb by bubbling nitrogen through the water. A vacuum was drawn on the tankcover gas to speed deoxygenation. After the DO was reduced to the desired level, a 34–kPaoverpressure of hydrogen was maintained to provide ≈2 ppm dissolved hydrogen (or ≈23 cm3/kg) inthe feedwater.
All tests were conducted at 288°C, with fully reversed axial loading (i.e., R = –1) and atriangular or sawtooth waveform. The tests in water were performed under stroke control, whereinthe specimen strain was controlled between two locations outside the autoclave. Tests in air wereperformed under strain control with an axial extensometer; the stroke at the location used tocontrol the water tests was also recorded. Information from the air tests was

Strain in specimen gauge sectionApplied displacement
Figure 4.Total applied displacement (dashed line)and strain in specimen gauge section (solidline) during stroke–controlled tests with asawtooth waveform
used to determine the stroke required to maintain constant strain in the specimen gauge. Toaccount for cyclic hardening of the material, the stroke that was needed to maintain constantstrain was gradually increased during the test. Figure 4 shows the actual strain in the specimengauge section during a stroke–controlled test with a sawtooth waveform. The fraction of applieddisplacement that goes to the specimen gauge section is not constant but varies with loadingstrain. Consequently, the loading rate also varies during the fatigue cycle; it is lower than theapplied strain rate at strain levels below the elastic limit and higher at larger strains.
The strain–controlled fatigue tests in air on cast SS specimens showed strain ratcheting incompression. Although strain in the gauge section of the specimens remained constant, overalllength of the specimens decreased during the test. The results indicated that strain ratcheting wascaused by differences in the strain hardening behavior of these steels in tension and compression.For both heats of CF–8M steel, strain hardening was greater in compression than in tension. Theresult of this difference was a mean compressive stress, which caused strain ratcheting of theshoulder region of the specimens. To prevent strain racheting, tests in water were conducted understroke control with a small tensile strain.
To date, the fatigue results obtained on Types 316NG and 304 SS and two heats of CF–8M castSS in air and LWR environments are summarized in Tables 2–4. The fatigue life N25 is defined asthe number of cycles for tensile stress to drop 25% from its peak value. Fatigue lives defined byother criteria, e.g., a 50% decrease in peak tensile stress or complete failure, may be converted toan N25 value by solving the equation
N25 = NX / (0.947 + 0.00212 X), (3)
where X is the failure criteria, i.e., 25, 50, or 100% decrease in peak tensile stress. For tests inwater, the DO level and ECPs of platinum and SS electrodes represent the values in the effluent,and the pH and conductivity of water were both measured in the supply tank.

Table 2. Fatigue test results for Type 316NG austenitic SS
Test No. Env.aDOb
(ppb)pH
at RT
Conduc-tivity c
(µS/cm)
ECPPt mV(SHE)
ECPSteel mV
(SHE)
Ten.Rate(%/s)
Comp.Rate(%/s)
StressRange(MPa)
StrainRange
(%)
LifeN25
(Cycles)Room Temp.1394 Air – – – – – 5.0E-1 5.0E-1 694.7 1.51 4,6491391 Air – – – – – 5.0E-1 5.0E-1 554.8 1.00 13,5611390 Air – – – – – 5.0E-1 5.0E-1 518.1 0.75 25,7361396 Air – – – – – 5.0E-1 5.0E-1 506.7 0.76 30,0001420 Air – – – – – 4.9E-1 4.9E-1 495.3 0.49 54,2491392 Air – – – – – 5.0E-1 5.0E-1 475.9 0.51 60,7411393 Air – – – – – 5.0E-1 5.0E-1 464.7 0.41 127,3861395 Air – – – – – 5.0E-1 5.0E-1 456.7 0.35 183,9791397 Air – – – – – 5.0E-1 5.0E-1 446.0 0.30 347,9911398 Air – – – – – 5.0E-1 5.0E-1 436.7 0.27 666,0001399 Air – – – – – 5.0E-1 5.0E-1 431.8 0.25 >1,900,0001400 Air – – – – – 5.0E-1 5.0E-1 427.4 0.25 1,775,000
288°C1408 Air – – – – – 5.0E-1 5.0E-1 416.6 0.76 21,5481790 Air – – – – – 5.0E-3 5.0E-1 452.8 0.75 16,7651409 Air – – – – – 5.0E-1 5.0E-1 377.2 0.50 53,1441410 Air – – – – – 5.0E-1 5.0E-1 377.6 0.50 51,1941792 Air 5.0E-3 5.0E-1 413.4 0.51 35,7101407 Air – – – – – 5.0E-1 5.0E-1 364.4 0.40 82,6911430 Air – – – – – 5.0E-1 5.0E-1 348.3 0.30 168,8521435 Air – – – – – 5.0E-1 5.0E-1 342.0 0.25 314,3521480 Air – – – – – 4.9E-1 4.9E-1 340.1 0.25 319,3081485 Air – – – – – 5.1E-1 5.1E-1 340.4 0.25 369,206
320°C1405 Air – – – – – 5.0E-1 5.0E-1 426.0 0.75 20,4251404 Air – – – – – 5.0E-1 5.0E-1 387.4 0.50 47,0111406 Air – – – – – 5.0E-1 5.0E-1 371.6 0.40 82,691
288°C1796 PWR 5 6.4 20.20 –677 –673 5.0E-1 5.0E-1 403.6 0.80 12,5001812 PWR 2 6.5 20.00 –689 –686 5.0E-2 5.0E-1 413.9 0.80 6,3751791 PWR 4 6.5 19.23 –697 –697 5.0E-3 5.0E-1 441.9 0.77 3,0401793 PWR 4 6.4 19.23 –699 –700 5.0E-3 5.0E-1 434.3 0.80 3,0201794 PWR 4 6.4 20.00 –690 –689 5.0E-3 5.0E-1 390.9 0.50 7,3701814 PWR 1 6.5 20.00 –694 –691 5.0E-2 5.0E-1 348.7 0.29 33,200
1426 Hi DO >200 – – – – 8.0E-1 8.0E-1 405.1 0.80 12,0691427 Hi DO >200 – – – – 8.2E-2 8.2E-2 421.7 0.82 6,6791428 Hi DO >200 – – – – 7.4E-3 7.4E-3 441.4 0.74 5,8971797 Hi DO 750 5.9 0.076 199 64 5.0E-3 5.0E-1 437.3 0.78 4,5201414 Hi DO >200 – – – – 5.0E-1 5.0E-1 375.3 0.50 26,2301418 Hi DO >200 – – – – 5.0E-1 5.0E-1 375.5 0.50 25,7141423 Hi DO >200 – – – – 5.0E-2 5.0E-2 378.8 0.50 17,8121425 Hi DO >200 – – – – 4.9E-3 4.9E-3 393.2 0.49 13,6841431 Hi DO >200 – – – – 2.9E-1 2.9E-1 356.5 0.29 116,7541434 Hi DO >200 – – – – 2.9E-2 2.9E-2 350.0 0.29 40,6431436 Hi DO >200 – – – – 2.5E-2 2.5E-2 354.0 0.25 >1,719,8511512 Hi DO >200 – – – – 2.4E-1 2.4E-1 361.2 0.24 2,633,954
aPWR = simulated PWR water containing 2 ppm lithium and 1000 ppm boron.bDO and ECPs measured in effluent.cConductivity of water measured in feedwater supply tank.
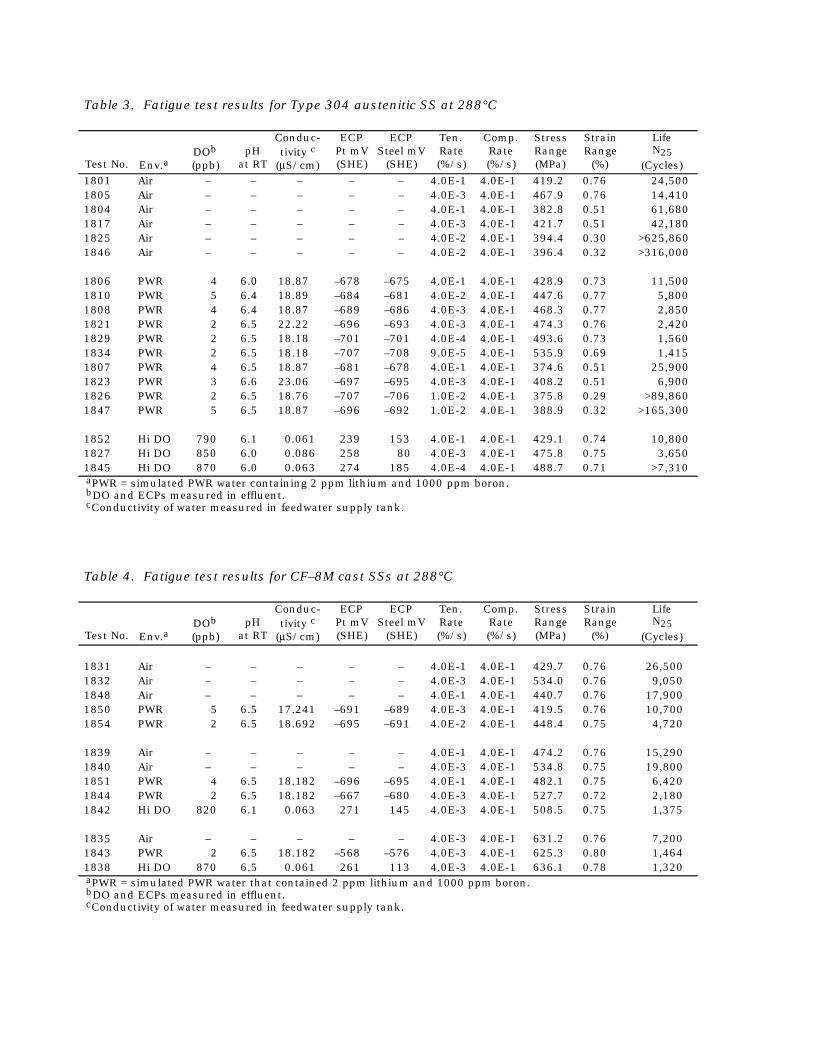
Table 3. Fatigue test results for Type 304 austenitic SS at 288°C
Test No. Env.aDOb
(ppb)pH
at RT
Conduc-tivity c
(µS/cm)
ECPPt mV(SHE)
ECPSteel mV
(SHE)
Ten.Rate(%/s)
Comp.Rate(%/s)
StressRange(MPa)
StrainRange
(%)
LifeN25
(Cycles)1801 Air – – – – – 4.0E-1 4.0E-1 419.2 0.76 24,5001805 Air – – – – – 4.0E-3 4.0E-1 467.9 0.76 14,4101804 Air – – – – – 4.0E-1 4.0E-1 382.8 0.51 61,6801817 Air – – – – – 4.0E-3 4.0E-1 421.7 0.51 42,1801825 Air – – – – – 4.0E-2 4.0E-1 394.4 0.30 >625,8601846 Air – – – – – 4.0E-2 4.0E-1 396.4 0.32 >316,000
1806 PWR 4 6.0 18.87 –678 –675 4.0E-1 4.0E-1 428.9 0.73 11,5001810 PWR 5 6.4 18.89 –684 –681 4.0E-2 4.0E-1 447.6 0.77 5,8001808 PWR 4 6.4 18.87 –689 –686 4.0E-3 4.0E-1 468.3 0.77 2,8501821 PWR 2 6.5 22.22 –696 –693 4.0E-3 4.0E-1 474.3 0.76 2,4201829 PWR 2 6.5 18.18 –701 –701 4.0E-4 4.0E-1 493.6 0.73 1,5601834 PWR 2 6.5 18.18 –707 –708 9.0E-5 4.0E-1 535.9 0.69 1,4151807 PWR 4 6.5 18.87 –681 –678 4.0E-1 4.0E-1 374.6 0.51 25,9001823 PWR 3 6.6 23.06 –697 –695 4.0E-3 4.0E-1 408.2 0.51 6,9001826 PWR 2 6.5 18.76 –707 –706 1.0E-2 4.0E-1 375.8 0.29 >89,8601847 PWR 5 6.5 18.87 –696 –692 1.0E-2 4.0E-1 388.9 0.32 >165,300
1852 Hi DO 790 6.1 0.061 239 153 4.0E-1 4.0E-1 429.1 0.74 10,8001827 Hi DO 850 6.0 0.086 258 80 4.0E-3 4.0E-1 475.8 0.75 3,6501845 Hi DO 870 6.0 0.063 274 185 4.0E-4 4.0E-1 488.7 0.71 >7,310aPWR = simulated PWR water containing 2 ppm lithium and 1000 ppm boron.bDO and ECPs measured in effluent.cConductivity of water measured in feedwater supply tank.
Table 4. Fatigue test results for CF–8M cast SSs at 288°C
Test No. Env.aDOb
(ppb)pH
at RT
Conduc-tivity c
(µS/cm)
ECPPt mV(SHE)
ECPSteel mV
(SHE)
Ten.Rate(%/s)
Comp.Rate(%/s)
StressRange(MPa)
StrainRange
(%)
LifeN25
(Cycles)
1831 Air – – – – – 4.0E-1 4.0E-1 429.7 0.76 26,5001832 Air – – – – – 4.0E-3 4.0E-1 534.0 0.76 9,0501848 Air – – – – – 4.0E-1 4.0E-1 440.7 0.76 17,9001850 PWR 5 6.5 17.241 –691 –689 4.0E-3 4.0E-1 419.5 0.76 10,7001854 PWR 2 6.5 18.692 –695 –691 4.0E-2 4.0E-1 448.4 0.75 4,720
1839 Air – – – – – 4.0E-1 4.0E-1 474.2 0.76 15,2901840 Air – – – – – 4.0E-3 4.0E-1 534.8 0.75 19,8001851 PWR 4 6.5 18.182 –696 –695 4.0E-1 4.0E-1 482.1 0.75 6,4201844 PWR 2 6.5 18.182 –667 –680 4.0E-3 4.0E-1 527.7 0.72 2,1801842 Hi DO 820 6.1 0.063 271 145 4.0E-3 4.0E-1 508.5 0.75 1,375
1835 Air – – – – – 4.0E-3 4.0E-1 631.2 0.76 7,2001843 PWR 2 6.5 18.182 –568 –576 4.0E-3 4.0E-1 625.3 0.80 1,4641838 Hi DO 870 6.5 0.061 261 113 4.0E-3 4.0E-1 636.1 0.78 1,320aPWR = simulated PWR water that contained 2 ppm lithium and 1000 ppm boron.bDO and ECPs measured in effluent.cConductivity of water measured in feedwater supply tank.
3 Overview of Fatigue S–N Data
The relevant fatigue S–N data for austenitic SSs in air include the data compiled by Jaske andO'Donnell36 for developing fatigue design criteria for pressure vessel alloys, the JNUFAD* database from Japan, and the results of Conway et al.37 and Keller.38 In water, the existing fatigue S–Ndata include the tests performed by General Electric Co. (GE) in a test loop at the Dresden 1reactor,39 the JNUFAD data base, studies at Mitshubishi Heavy Industries, Ltd., (MHI),21–24
Ishikawajima–Harima Heavy Industries Co., (IHI),25 and Hitachi26,27 in Japan, and the presentwork at ANL.28–31 The data base for austenitic SSs is composed of 500 tests in air (240 tests on 26heats of Type 304 SS, 170 tests on 15 heats of Type 316 SS, and 90 tests on 4 heats of Type 316NG) and 290 tests in water (135 tests on 9 heats of Type 304 SS, 55 tests on 3 heats of Type 316SS, and 100 tests on 4 heats of Type 316NG). Nearly 60% of the tests in air were conducted atroom temperature, 20% at 250–325°C, and 20% at 350–450°C. Nearly 90% of the tests in waterwere conducted at temperatures between 260 and 325°C; the remainder were at lowertemperatures. The data on Type 316NG in water have been obtained primarily at DO levels≥0.2 ppm and those on Type 316 SS, at ≤0.005 ppm DO; half of the tests on Type 304 SS are atlow–DO and the remaining at high–DO levels.
3.1 Air Environment
The existing fatigue S–N data, both domestic and from abroad, indicate that the fatigue lives ofTypes 304 and 316 SS are comparable; those of Type 316NG are superior. Fatigue life in air isindependent of temperature in the range from room temperature to 427°C (Fig. 5). The threecurves in Fig. 5 are based on the current ASME mean curve, the best–fit curve developed by Jaskeand O'Donnell,36 and the updated statistical model that is discussed later in this report. Theresults indicate that the ASME mean curve is not consistent with the existing fatigue S–N data foraustenitic SSs. At strain amplitudes <0.5%, the mean curve predicts significantly longer fatiguelives than those observed experimentally. The results also indicate that at temperatures above260°C, the fatigue life of austenitic SSs may decrease with decreasing strain rate (Fig. 6). The effectof strain rate on fatigue life seems to be significant at 400–430°C. However, other studies40 haveshown no effect of strain rate on the fatigue life of Type 316 SS at 0.4–0.008%/s strain rates andtemperatures up to 450°C.
During cyclic loading, austenitic SSs exhibit rapid hardening during the first 50–100 cycles;the extent of hardening increases with increasing strain amplitude and decreasing temperature andstrain rate.27,28,41 The cyclic strain hardening of Type 316NG SS tested in air at room temperatureand 288°C is shown in Fig. 7. The initial hardening is followed by softening and a saturation stageat 288°C, and by continuous softening at room temperature.
The cyclic stress–vs.–strain curves for Types 304, 316, and 316NG SS at room temperatureand 288°C are shown in Fig. 8; cyclic stress corresponds to the value at half life and at a strain rateof 0.4%/s. For the various steels, cyclic stresses increase in magnitude in the following order:Types 316NG, 304, and 316. At room temperature, the strain amplitude εa(%) for Type 316 SS canbe expressed in terms of the cyclic stress amplitude σa (MPa) by the equation
* M. Higuchi, Ishikawajima–Harima Heavy Industries Co., Japan, private communication to M. Prager of the PressureVessel Research Council, 1992.

0.1
1.0
102 103 104 105 106 107 108
RT100°C260°C288°C300°C325°C427-430°C
Statistical ModelJaske & O'DonnellASME Mean Curve
Str
ain
Am
plitu
de, ε
a (%
)
Fatigue Life (Cycles)
Type 304 SS
102 103 104 105 106 107 108
RT290°C325°C400°C427-430°C456°C
Statistical ModelJaske & O'DonnellASME Mean Curve
Fatigue Life (Cycles)
Type 316 SS
0.1
1.0
102 103 104 105 106 107 108
RT288°C320°C
Statistical ModelJaske & O'DonnellASME Mean Curve
Str
ain
Am
plitu
de, ε
a (%
)
Fatigue Life (Cycles)
Type 316NG
Figure 5.Fatigue S–N behavior for Types 304, 316,and 316NG austenitic SSs in air at varioustemperatures
1 02
1 03
1 04
1 05
1 06
1 0-4 1 0-3 1 0-2 1 0-1 1 00
1.5%0.88%0.5%
0.38%0.25%
Fat
igue
Life
(C
ycle
s)
Strain Rate (%/s)
Type 304 SS(260–290°C)
Type 316 SS(400–430°C)
Figure 6.Effect of strain rate on fatigue lives ofaustenitic SSs in air for various strain ranges

200
300
400
500
600
700
1 00 1 01 1 02 1 03 1 04 1 05 1 06
1.00.750.500.350.27
Str
ess
Ran
ge, ∆
σ (M
Pa)
Number of Cycles
Strain Range (%)
Room TemperatureStrain Rate: 0.4%/s
1 00 1 01 1 02 1 03 1 04 1 05 1 06
0.750.50
Number of Cycles
Strain Range (%)Strain Rate (%/s)Open Symbols: 0.5Closed Symbols: 0.005
288°C
Figure 7. Effect of strain range on cyclic strain–hardening behavior of Type 316NG SS in air at roomtemperature and 288°C
0
1 0 0
2 0 0
3 0 0
4 0 0
5 0 0
6 0 0
0 . 0 0 . 5 1 . 0 1 . 5
25°C288–430°CS
tres
s A
mpl
itude
, σ a
(M
Pa)
Strain Amplitude, εa (%)
Type 316 SS
ε a = (σ a /1950)+(σ a /588.5)1.94
ε a = (σ a /1760)+(σ a /496.8)2.19
0 . 0 0 . 5 1 . 0 1 . 5
RT288–430°C
Strain Amplitude, εa (%)
Type 304 SS
ε a = (σ a /1950)+(σ a /503.2)2.19
ε a = (σ a /1760)+(σ a /373.9)2.31
0
1 0 0
2 0 0
3 0 0
4 0 0
5 0 0
6 0 0
0 . 0 0 . 5 1 . 0 1 . 5
RT288°CS
tres
s A
mpl
itude
, σ a
(M
Pa)
Strain Amplitude, εa (%)
Type 316NG
ε a = (σ a /1760)+(σ a /330.1)3.24
ε a = (σ a /1950)+(σ a /447.0)2.59
Figure 8.Cyclic stress–strain curves for Types316NG, 304, and 316 SSs in air at roomtemperature and 288°C
εa = σa
1950+ σa
588.5
1.94
, (4a)

for Type 304 SS, by
εa = σa
1950+ σa
503.2
2.19
, (4b)
and for Type 316NG, by
εa = σa
1950+ σa
447.0
2.59
. (4c)
At 288–430°C, the cyclic stress–vs.–strain curve for Type 316 SS can be expressed by
εa = σa
1760+ σa
496.8
2.19
, (4d)
for Type 304 SS, by
εa = σa
1760+ σa
373.9
2.31
, (4e)
and for Type 316NG, by
εa = σa
1760+ σa
330.1
3.24
. (4f)
3.2 LWR Environments
The fatigue S–N data indicate a significant decrease in fatigue life in LWR environments (Fig. 9).The reduction in life depends on strain rate, DO level in water, and temperature.21–31 Also,environmental effects on fatigue life are comparable for all steels. To define the threshold values,the effects of various parameters on fatigue life are discussed below in greater detail.
0 . 1
1 . 0
1 03 1 04 1 05 1 06
0.50.050.005
Str
ain
Am
plitu
de, ε
a (%
)
Fatigue Life (Cycles)
Type 316NG Strain Rate (%/s)
Open Symbols DO: ≤ 0.004 ppmClosed Symbols: DO 0.8 ppm
Best–Fit Air
ASME CodeDesign Curve
1 03 1 04 1 05 1 06
0.40.040.010.0040.00040.00009
Fatigue Life (Cycles)
Type 304 SS Strain Rate (%/s)
Open Symbols: DO ≤ 0.004 ppmClosed Symbols: DO 0.8 ppm
Best–Fit Air
ASME CodeDesign Curve
Figure 9. Fatigue strain amplitude–vs.–life data for Types 316NG and 304 SS in water at 288°C

1 02
1 03
1 04
1 0-5 1 0-4 1 0-3 1 0-2 1 0-1 1 00
0.380.25
Fat
igue
Life
(C
ycle
s)
Strain Rate (%/s)
288°C; DO ≤ 0.005 ppmOpen Symbols: Type 304Closed Symbols: Type 316NG
Strain Amplitude (%)
1 0-5 1 0-4 1 0-3 1 0-2 1 0-1 1 00
0.600.300.25
Strain Rate (%/s)
325°C; DO ≤ 0.005 ppmOpen Symbols: Type 304Closed Symbols: Type 316
Strain Amplitude (%)
1 02
1 03
1 04
1 0-5 1 0-4 1 0-3 1 0-2 1 0-1 1 00
0.60.50.40.30.25
Fat
igue
Life
(C
ycle
s)
Strain Rate (%/s)
288°C; DO ≥ 0.2 ppmType 316NG
Strain Amplitude (%)
Figure 10.Dependence of fatigue life of austeniticSSs on strain rate in low– and high–DOwater
3.2.1 Strain Rate
A slow strain rate applied during the tensile–loading cycle (i.e., up–ramp with increasing strain)is primarily responsible for environmentally assisted reduction in fatigue life. Slow rates appliedduring both tensile– and compressive–loading cycles (i.e., up– and down–ramps) do not causefurther decrease in fatigue life.29–31 The fatigue lives of austenitic SSs in low– and high–DO waterare plotted as a function of tensile strain rate in Fig. 10. At both low– and high–DO levels, fatiguelives decrease with decreasing strain rate. The effect of strain rate is greater in a low–DO PWRenvironment than in high–DO water. In a simulated PWR environment, a decrease in strain ratefrom 0.4 to 0.0004%/s decreases fatigue life by a factor of ≈10. The results indicate that the strainrate below which effects of strain rate on fatigue life saturate may depend on both steel type andDO level. In low–DO PWR environments, saturation strain rate appears to be at ≈0.0004%/s forType 304 SS and somewhat higher for Type 316 SS (best estimate of ≈0.004%/s). Limited datasuggest that the saturation strain rate is also higher in high– than in low–DO water.
3.2.2 Strain Amplitude
Nearly all of the existing fatigue S–N data have been obtained under loading histories withconstant strain rate, temperature, and strain amplitude. Actual loading histories encountered

0.000
0.001
0.002
0.003
0.004
0.0 0.2 0.4 0.6 0.8 1.0 1.2
Inve
rse
Fat
igue
Life
(1/
cycl
e)
∆ εfast
/ ∆ ε
Threshold Strain = 0.36%
Strain Range ∆ ε = 1.2%DO = 0.005 ppm
Figure 11.Results of strain rate change tests onType 316 SS in low–DO water at 325°C
during service of nuclear power plants are far more complex. Exploratory fatigue tests have beenconducted with waveforms in which the slow strain rate is applied during only a fraction of thetensile loading cycle.24 The results indicate that a minimum threshold strain is required toproduce an environmentally assisted decrease in fatigue life of these steels. Figure 11 shows that,for a heat of Type 316 SS, the threshold strain in low–DO water at 325°C is ≈0.36%. During eachcycle, relative damage due to slow strain rate is the same once the strain amplitude exceeds thethreshold value.
Fatigue data from the present study indicate a threshold strain range of ≈0.32% for the ANLheat of Type 304 SS. For example, the test at 0.15% strain amplitude and 0.01%/s strain rate (asshown by a runoff triangle symbol in Fig. 9), failed after an additional 41,240 cycles when thestrain amplitude was increased to 0.16%. Another test at 0.16% strain amplitude failed after anadditional 50,700 cycles at 0.17% strain amplitude. The threshold strain most likely correspondsto rupture strain of the passive oxide film. These results are similar to those observed for carbonand low–alloy steels.16–20
3.2.3 Dissolved Oxygen
The results also indicate that environmental effects on the fatigue life of austenitic SSs differfrom those on carbon and low–alloy steels; they are more pronounced in low–DO than in high–DOwater.18,19 At a strain rate of 0.004%/s, the reduction in fatigue life of Type 316NG (Fig. 10) isgreater by a factor of ≈2 in a simulated PWR environment (<0.01 ppm DO) than in high–DO water(≥0.2 ppm DO). For carbon and low–alloy steels, environmental effects on fatigue life increase withincreasing DO content above a minimum threshold value of 0.05 ppm; only a modest decrease inlife is observed at DO levels <0.05 ppm.11–13,16–20
Existing data are inadequate to establish the functional form for the dependence of fatigue lifeof austenitic SSs on DO level. Recent test results indicate that the fatigue lives of austenitic SSsmay depend on the conductivity of the water rather than on the DO content, e.g., fatigue life islonger at lower conductivity (<0.1 µS/cm). In the existing fatigue S–N data base, most of the testsin high–DO water have been performed at conductivities up to 0.2 µS/cm. Recent tests in high–DOwater with conductivities <0.08 µS/cm show only a modest effect of environment on the fatiguelives of these steels. Tests are in progress to establish the effects of water chemistry on the fatiguelives of austenitic SSs.

1 03
1 04
0 5 0 100 150 200 250 300 350
0.4%/s0.01%/s≤0.004%/s
Fat
igue
Life
(C
ycle
s)
Temperature (°C)
Austenitic SSsεa = 0.3%, DO ≤ 0.005 ppm
Open Symbols: Type 304Closed Symbols: Type 316
0 5 0 100 150 200 250 300 350
0.4%/s0.01%/s
Temperature (°C)
Austenitic SSsεa = 0.6%, DO ≤ 0.005 ppm
Open Symbols: Type 304Closed Symbols: Type 316 & 316NG
Figure 12. Change in fatigue lives of austenitic SSs in low–DO water with temperature
3.2.4 Temperature
The existing fatigue S–N data are inadequate to establish the functional form for thedependence of life on temperature. Limited data indicate that environmental effects on the fatiguelives of austenitic SSs are significant at temperatures above 250°C and are minimal attemperatures ≤200°C (Fig. 12). At 250–330°C, fatigue life appears to be relatively insensitive tochanges in temperature.
As discussed in the previous section, actual loading histories encountered during service innuclear power plants involve variable loading and environmental conditions, whereas the existingfatigue S–N data have been obtained under loading histories with constant strain rate, temperature,and strain amplitude. Fatigue tests have been conducted at MHI Japan on Type 316 SS undercombined mechanical and thermal cycling.24 Triangular waveforms were used for both strain andtemperature cycling. Two sequences were selected for temperature cycling (Fig. 13): an in–phasesequence, in which temperature cycling was synchronized with mechanical strain cycling; and asequence in which temperature and strain were out of phase, i.e., maximum temperature occurredat minimum strain level and vice-versa. Two temperature ranges, 100–325°C and 200–325°C, wereselected for the tests.
0.6
-0.6
High
LowIn Phase
Tem
pera
ture
Stra
in (%
)
0.6
-0.6
High
LowOut of Phase
Tem
pera
ture
Stra
in (%
)
Figure 13. Waveforms for change in temperature during exploratory fatigue tests
1 02
1 03
1 04
0 5 0 100 150 200 250 300 350
Constant (0.01)In phase (0.002)Out of phase (0.002)
Fat
igue
Life
(C
ycle
s)
Temperature (°C)
Type 316 SS 325°Cε a = 0.6%
DO = <0.005 ppmStrain Rate 0.002%/s
Temperature (Strain Rate, %/s)
Figure 14.Fatigue life of Type 316 SS under varyingtemperature, indicated by horizontal bars
The results are shown in Fig. 14, with the data obtained from tests at constant temperature. Ifwe consider that the tensile–load cycle is primarily responsible for environmentally assistedreduction in fatigue life and that the applied strain and temperature must be above a minimumthreshold value for environmental effects to occur, then, life should be longer for out–of–phase teststhan for in–phase tests, because applied strains above the threshold strain occur at temperaturesabove 200°C for in–phase tests, whereas they occur at temperatures below 200°C for out–of–phasetests. An average temperature is used in Fig. 14 for the thermal cycling tests, i.e., the average ofthe temperature at peak strain and the temperature at threshold strain or 200°C (whichever ishigher). The results from thermal cycling tests agree well with those from constant–temperaturetests. The data suggest a linear decrease in life at temperatures above 200°C. Fatigue tests are inprogress at 200–320°C to establish the temperature dependence of fatigue life in LWRenvironments.
3.3 Cast Stainless Steels
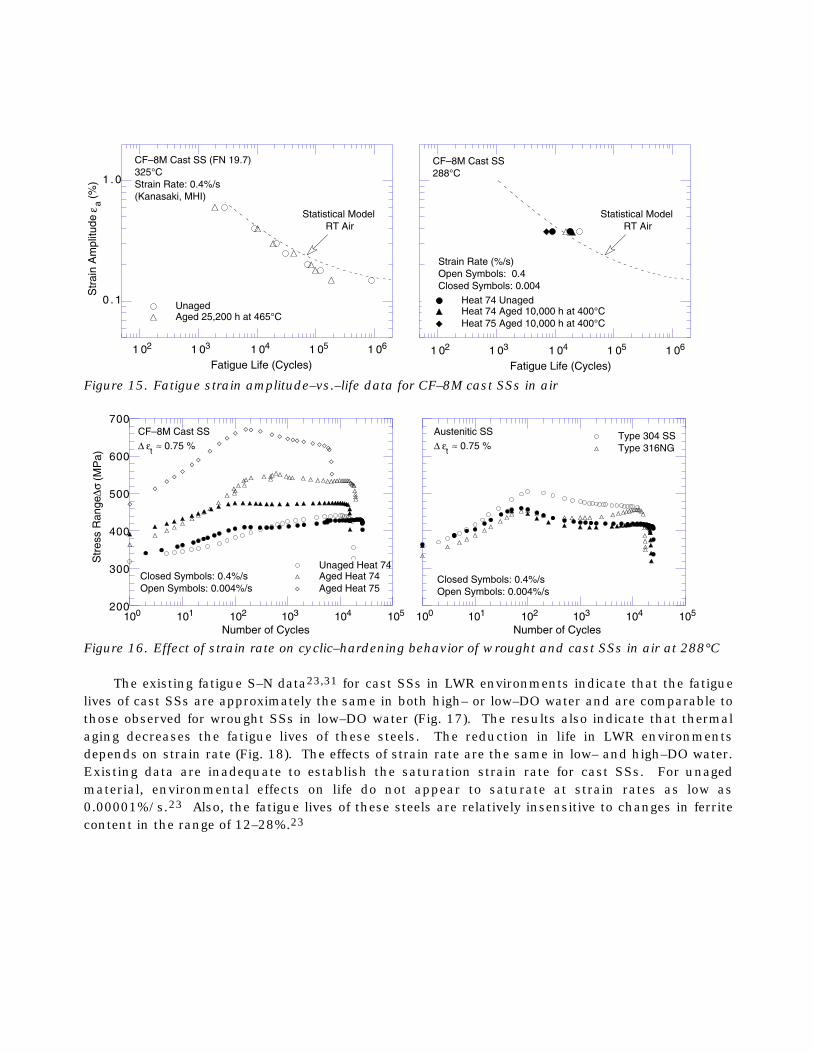
Available fatigue S–N data23,31 indicate that in air, the fatigue lives of cast CF–8 andCF–8M SSs are similar to that of wrought austenitic SSs (Fig. 15). It is well known that the Charpyimpact and fracture toughness properties of cast SSs are decreased significantly after thermalaging at temperatures between 300 and 450°C.42,43 The cyclic–hardening behavior of cast SSs isalso influenced by thermal aging (Fig. 16). At 288°C, cyclic stresses of steels aged for 10,000 h at400°C are higher than those for unaged material or wrought SSs. Also, strain rate effects on cyclicstress are greater for aged than for unaged steel, i.e., cyclic stresses increase significantly withdecreasing strain rate. However, existing data are inadequate to establish unequivocally the effectof thermal aging on the fatigue life of these steels. For example, thermal aging for 25,200 h at465°C exerted no effect on the fatigue life of a CF-8M steel in air at 325°C,24 whereas, in thepresent study, aging for 10,000 h at 400°C decreased the fatigue life of Heat 74 at 288°C,particularly in water (discussed later in this section). These differences are most likely caused bymicrostructural differences that arise from thermal aging temperature. Aging at 400°C results inspinodal decomposition of the ferrite to form Cr–rich regions that very effectively increase tensilestrength, whereas, aging at 465°C for extended periods results in the formation of Cr–rich α'particles and over–aging.
0 . 1
1 . 0
1 02 1 03 1 04 1 05 1 06
UnagedAged 25,200 h at 465°C
Str
ain
Am
plitu
de ε
a (%
)
CF–8M Cast SS (FN 19.7)325°CStrain Rate: 0.4%/s(Kanasaki, MHI)
Fatigue Life (Cycles)
Statistical ModelRT Air
1 02 1 03 1 04 1 05 1 06
Heat 74 UnagedHeat 74 Aged 10,000 h at 400°CHeat 75 Aged 10,000 h at 400°C
CF–8M Cast SS288°C
Fatigue Life (Cycles)
Strain Rate (%/s)Open Symbols: 0.4Closed Symbols: 0.004
Statistical ModelRT Air
Figure 15. Fatigue strain amplitude–vs.–life data for CF–8M cast SSs in air
200
300
400
500
600
700
100 101 102 103 104 105
Unaged Heat 74Aged Heat 74Aged Heat 75
Str
ess
Ran
ge ∆σ
(M
Pa)
Number of Cycles
CF–8M Cast SS∆ εt ≈ 0.75 %
Closed Symbols: 0.4%/sOpen Symbols: 0.004%/s
100 101 102 103 104 105
Type 304 SSType 316NG
Number of Cycles
Austenitic SS∆ εt ≈ 0.75 %
Closed Symbols: 0.4%/sOpen Symbols: 0.004%/s
Figure 16. Effect of strain rate on cyclic–hardening behavior of wrought and cast SSs in air at 288°C
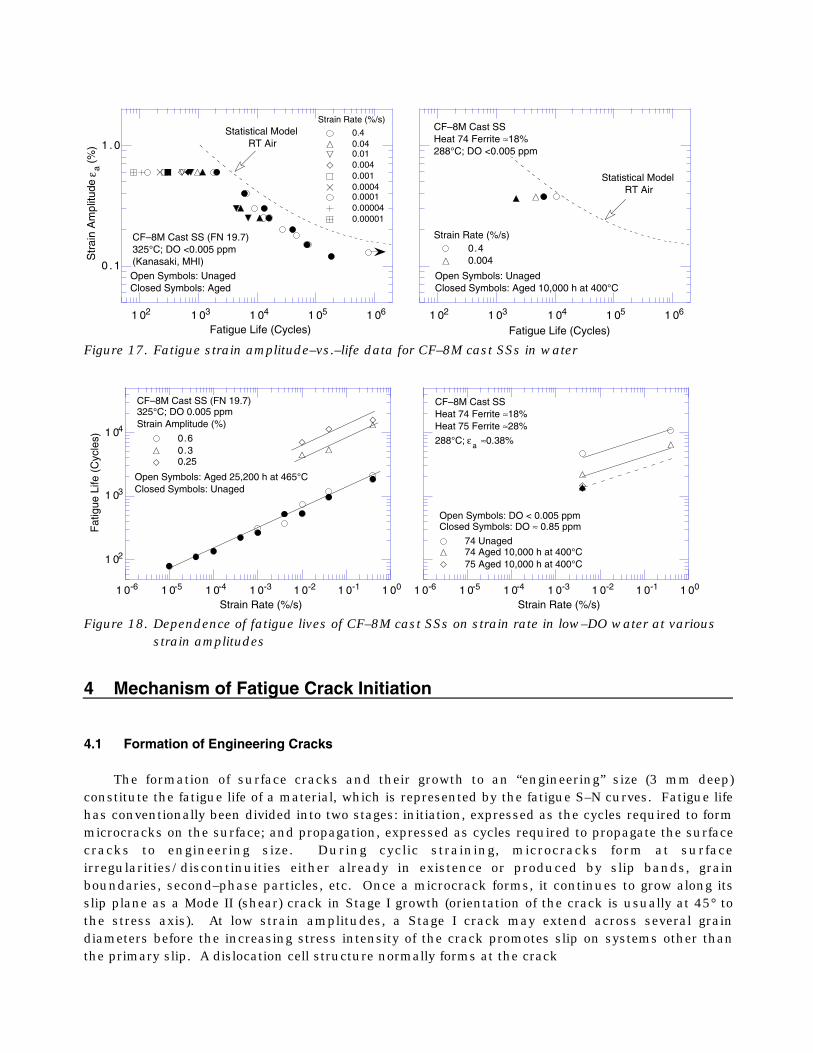
The existing fatigue S–N data23,31 for cast SSs in LWR environments indicate that the fatiguelives of cast SSs are approximately the same in both high– or low–DO water and are comparable tothose observed for wrought SSs in low–DO water (Fig. 17). The results also indicate that thermalaging decreases the fatigue lives of these steels. The reduction in life in LWR environmentsdepends on strain rate (Fig. 18). The effects of strain rate are the same in low– and high–DO water.Existing data are inadequate to establish the saturation strain rate for cast SSs. For unagedmaterial, environmental effects on life do not appear to saturate at strain rates as low as0.00001%/s.23 Also, the fatigue lives of these steels are relatively insensitive to changes in ferritecontent in the range of 12–28%.23
0 . 1
1 . 0
1 02 1 03 1 04 1 05 1 06
0.40.040.010.0040.0010.00040.00010.000040.00001
Str
ain
Am
plitu
de ε
a (%
)
CF–8M Cast SS (FN 19.7)325°C; DO <0.005 ppm(Kanasaki, MHI)
Fatigue Life (Cycles)
Open Symbols: UnagedClosed Symbols: Aged
Statistical ModelRT Air
Strain Rate (%/s)
1 02 1 03 1 04 1 05 1 06
0.40.004
CF–8M Cast SSHeat 74 Ferrite ≈18%288°C; DO <0.005 ppm
Fatigue Life (Cycles)
Open Symbols: UnagedClosed Symbols: Aged 10,000 h at 400°C
Statistical ModelRT Air
Strain Rate (%/s)
Figure 17. Fatigue strain amplitude–vs.–life data for CF–8M cast SSs in water
1 02
1 03
1 04
1 0-6 1 0-5 1 0-4 1 0-3 1 0-2 1 0-1 1 00
0.60.30.25
Fat
igue
Life
(C
ycle
s)
Strain Rate (%/s)
CF–8M Cast SS (FN 19.7)325°C; DO 0.005 ppmStrain Amplitude (%)
Open Symbols: Aged 25,200 h at 465°CClosed Symbols: Unaged
1 0-6 1 0-5 1 0-4 1 0-3 1 0-2 1 0-1 1 00
74 Unaged74 Aged 10,000 h at 400°C75 Aged 10,000 h at 400°C
Strain Rate (%/s)
CF–8M Cast SSHeat 74 Ferrite ≈18%Heat 75 Ferrite ≈28%
288°C; εa
≈0.38%
Open Symbols: DO < 0.005 ppmClosed Symbols: DO ≈ 0.85 ppm
Figure 18. Dependence of fatigue lives of CF–8M cast SSs on strain rate in low–DO water at variousstrain amplitudes
4 Mechanism of Fatigue Crack Initiation
4.1 Formation of Engineering Cracks
The formation of surface cracks and their growth to an “engineering” size (3 mm deep)constitute the fatigue life of a material, which is represented by the fatigue S–N curves. Fatigue lifehas conventionally been divided into two stages: initiation, expressed as the cycles required to formmicrocracks on the surface; and propagation, expressed as cycles required to propagate the surfacecracks to engineering size. During cyclic straining, microcracks form at surfaceirregularities/discontinuities either already in existence or produced by slip bands, grainboundaries, second–phase particles, etc. Once a microcrack forms, it continues to grow along itsslip plane as a Mode II (shear) crack in Stage I growth (orientation of the crack is usually at 45° tothe stress axis). At low strain amplitudes, a Stage I crack may extend across several graindiameters before the increasing stress intensity of the crack promotes slip on systems other thanthe primary slip. A dislocation cell structure normally forms at the crack

0 0 . 2 0 . 4 0 . 6 0 . 8 1
Cra
ck L
engt
h
Life Fraction
Microstructurally Small Crack (MSC)(Stage I Shear Crack)
Mechanically Small Crack(Stage II Tensile Crack)
A
B
C
D
∆ σ2
∆ σ1
∆ σ2 > ∆ σ1
Figure 19.Growth of cracks in smooth fatiguespecimens
tip. Because slip is no longer confined to planes at 45° to the stress axis, the crack begins topropagate as a Mode I (tensile) crack, normal to the stress axis in Stage II growth. At high strainamplitudes, the stress intensity is quite large and the crack propagates entirely by the Stage IIprocess. Stage II crack propagation continues until the crack reaches engineering size (≈3 mmdeep). In air or mildly corrosive environments, Stage II cracking is characterized by fatiguestriations.
An alternative approach considers fatigue life to be entirely composed of the growth of shortsurface cracks.44 In polycrystalline materials, the period for the formation of surface cracks isnegligible, Fig. 19. However, the growth rates of short cracks cannot be predicted accurately fromfracture mechanics methodology on the basis of the range of the stress intensity factor (∆K). Undercyclic loading and the same ∆K, short fatigue cracks (i.e., with lengths comparable to the unit sizeof the microstructure) grow at a faster rate than long fatigue cracks.45 Also, short cracks can growat ∆K values below those predicted from linear elastic fracture mechanics (LEFM). The differencesbetween the growth rates of short and long cracks have been attributed to interactions amongmicrostructural features, contributions of crack closure with increasing crack length, effects ofmixed–mode crack propagation, and an inadequate characterization of the crack tip stress/strainfields associated with short cracks.
Recent studies indicate that during fatigue loading of smooth test specimens, surface cracks10 µm or longer form quite early, i.e., <10% of life, even at low strain amplitudes.46,47 Growth ofthese surface cracks may be divided into three regimes: (a) initial period that involves growth ofmicrostructurally small cracks (MSCs) below a critical length, characterized by decelerating crackgrowth rate, seen in region AB of Fig. 19; (b) final period of growth, characterized by acceleratingcrack growth rate, region CD; and (c) a transition period controlled by a combination of the tworegimes, region BC. The crack growth rates as a function of crack length during the three regimesof fatigue life are shown in Fig. 20.
The growth of MSCs is very sensitive to microstructure.46,48 The MSCs correspond to Stage Icracks and grow along slip planes as shear cracks in the early stage of growth. Microstructuraleffects on MSCs are strong because of Stage I growth, i.e., crystallographic growth. Fatigue cracksgreater than the critical length of MSCs show little or no influence of microstructure and are termedmechanically small cracks. For a stress ratio of –1, the transition from an MSC to a mechanicallysmall crack for several materials has been estimated

Cra
ck V
eloc
ity (
da/d
N)
Crack Length
MSC
LEFM
∆ σ1
Non–PropagatingCracks
Short Cracks
∆ σ3
∆ σ2
∆ σ3 > ∆ σ2 > ∆ σ1
Figure 20.Schematic illustration of short–crackbehavior
to be ≈8 times the unit size of the microstructure.48 Mechanically small cracks correspond to StageII (tensile) cracks, which are characterized by striated crack growth, with a fracture surface normalto the maximum principal stress.
At low stress levels, e.g., ∆ σ1 in Figs. 19 and 20, the transition from MSC growth toaccelerating crack growth does not occur and the cracks are nonpropagating. This circumstancerepresents the fatigue limit for the smooth specimen. Although cracks can form below the fatiguelimit, they can grow to engineering size only at stresses greater than the fatigue limit. Possiblepreexisting large cracks in the material, e.g., defects in welded samples, or those created by growthof microcracks at high stresses, can grow at stress levels below the fatigue limit, and their growthcan be estimated from ∆K–based LEFM.
4.2 Environmental Effects
The reduction in fatigue life in LWR coolant environments may arise from easy formation ofsurface microcracks and/or an increase in growth rates of cracks during either the initial stage ofMSC and shear crack growth or during the transition and final stage of tensile crack growth.Photomicrographs of the gauge surface of Type 316NG specimens tested in air, simulated PWRwater, and high–DO water are shown in Fig. 21. Specimens tested in water contain crystallineoxides and a thin gray corrosion scale. X–ray diffraction analyses of specimens tested in waterindicate that the corrosion scale consists primarily of magnetite (Fe3O4) or ferroferric oxide(FeFe2O4), chromium oxide (CrO), and maghemite (γ–Fe2O3). In addition to these phases, specimenstested in high–DO water also contained hematite (ferric oxide or α–Fe2O3). The specimens tested inwater also show some surface micropitting.
The reduction in fatigue life in high–temperature water has often been attributed to thepresence of micropits10 that act as stress raisers and provide preferred sites for the formation offatigue cracks. However, the fatigue data for carbon and low–alloy steel indicate that the largereductions in the fatigue lives of these steels in LWR environments cannot be explained on thebasis of micropits alone.18–20 If the presence of micropits was responsible for reducing the fatiguelives of carbon and low–alloy steels in LWR environments, specimens preexposed to high–DO waterand then tested in air should also show a decrease in fatigue life. Fatigue lives

(a) (b)
Figure 21.Photomicrographs of gauge surface of Type316NG SS specimens tested in (a) air,(b) simulated PWR water, and (c) high–DOwater
(c)
of the preoxidized and unoxidized specimens are identical; life would be expected to decrease ifsurface micropits facilitate the formation of fatigue cracks.18–20 Only a moderate decrease in life isobserved for both preoxidized and unoxidized specimens that were tested in low–DO water. Thesignificant reduction in fatigue life in LWR coolant environments may be attributed to enhancedgrowth rates of cracks either during the initial growth stage of microstructurally small and shearcracks or the transition and final stage of tensile crack growth.
The enhanced growth rates of long cracks in pressure vessel and piping steels in LWRenvironments have been attributed to either slip oxidation/dissolution49 or hydrogen–inducedcracking50 mechanisms. The requirements for a slip dissolution model are that a protective oxidefilm is thermodynamically stable to ensure that a crack will propagate with a high aspectratio without degrading into a blunt pit, and that a strain increment occurs to rupture that filmand thereby expose the underlying matrix to the environment; see Fig. 22. Once the passive oxidefilm is ruptured, crack extension is controlled by dissolution of freshly exposed surfaces and by theoxidation characteristics.
Hydrogen–induced cracking is explained as follows: hydrogen produced by the oxidationreaction at or near the crack tip is partly absorbed into the metal; the absorbed hydrogen diffusesahead of the crack tip, interacts with inclusions, and leads to the formation of cleavage cracks atthe inclusion/matrix interface; and linkage of the cleavage cracks leads to discontinuous crackextension in addition to extension caused by mechanical fatigue. Other hydrogen–induced fractureprocesses may also enhance growth rates in LWR environments.
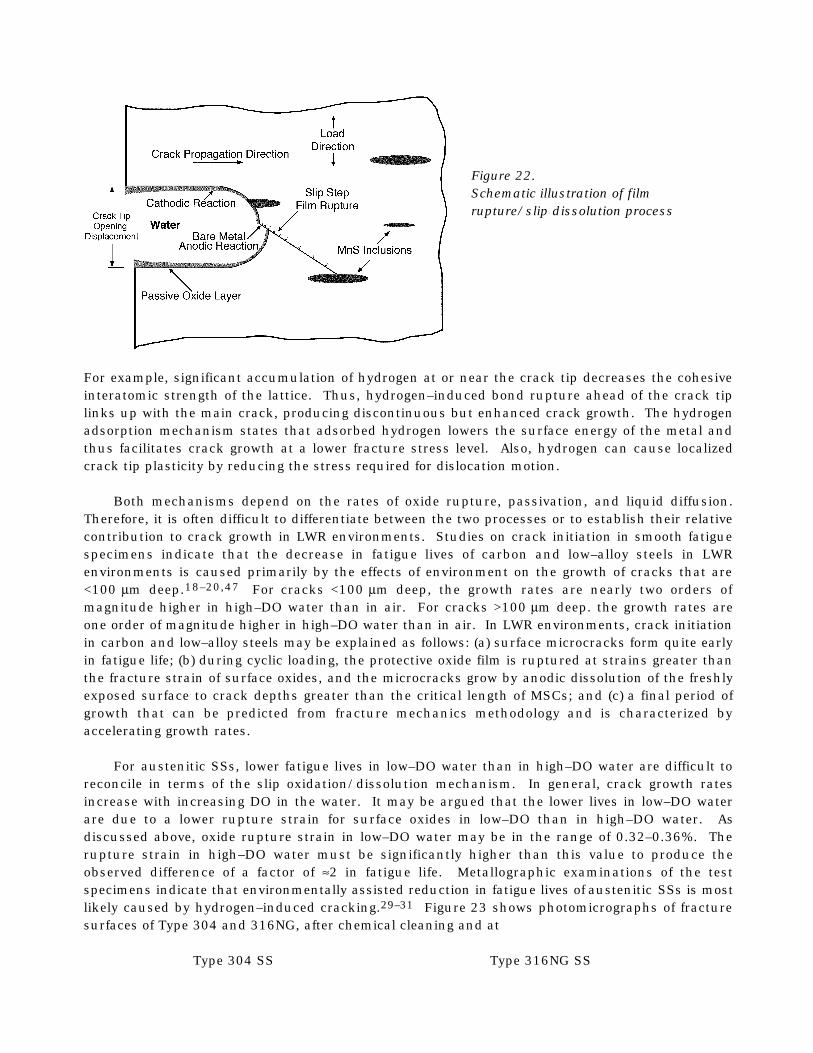
Figure 22.Schematic illustration of filmrupture/slip dissolution process
For example, significant accumulation of hydrogen at or near the crack tip decreases the cohesiveinteratomic strength of the lattice. Thus, hydrogen–induced bond rupture ahead of the crack tiplinks up with the main crack, producing discontinuous but enhanced crack growth. The hydrogenadsorption mechanism states that adsorbed hydrogen lowers the surface energy of the metal andthus facilitates crack growth at a lower fracture stress level. Also, hydrogen can cause localizedcrack tip plasticity by reducing the stress required for dislocation motion.
Both mechanisms depend on the rates of oxide rupture, passivation, and liquid diffusion.Therefore, it is often difficult to differentiate between the two processes or to establish their relativecontribution to crack growth in LWR environments. Studies on crack initiation in smooth fatiguespecimens indicate that the decrease in fatigue lives of carbon and low–alloy steels in LWRenvironments is caused primarily by the effects of environment on the growth of cracks that are<100 µm deep.18–20,47 For cracks <100 µm deep, the growth rates are nearly two orders ofmagnitude higher in high–DO water than in air. For cracks >100 µm deep. the growth rates areone order of magnitude higher in high–DO water than in air. In LWR environments, crack initiationin carbon and low–alloy steels may be explained as follows: (a) surface microcracks form quite earlyin fatigue life; (b) during cyclic loading, the protective oxide film is ruptured at strains greater thanthe fracture strain of surface oxides, and the microcracks grow by anodic dissolution of the freshlyexposed surface to crack depths greater than the critical length of MSCs; and (c) a final period ofgrowth that can be predicted from fracture mechanics methodology and is characterized byaccelerating growth rates.
For austenitic SSs, lower fatigue lives in low–DO water than in high–DO water are difficult toreconcile in terms of the slip oxidation/dissolution mechanism. In general, crack growth ratesincrease with increasing DO in the water. It may be argued that the lower lives in low–DO waterare due to a lower rupture strain for surface oxides in low–DO than in high–DO water. Asdiscussed above, oxide rupture strain in low–DO water may be in the range of 0.32–0.36%. Therupture strain in high–DO water must be significantly higher than this value to produce theobserved difference of a factor of ≈2 in fatigue life. Metallographic examinations of the testspecimens indicate that environmentally assisted reduction in fatigue lives of austenitic SSs is mostlikely caused by hydrogen–induced cracking.29–31 Figure 23 shows photomicrographs of fracturesurfaces of Type 304 and 316NG, after chemical cleaning and at
Type 304 SS Type 316NG SS

Air
High–DO Water
Low–DO PWR Water
Figure 23. Photomicrographs of fracture surfaces of Types 304 and 316NG SS specimens tested inair, high–DO water, and low–DO, simulated PWR water
approximately the same crack length; specimens were tested at 288°C and ≈0.75% strain range inair, high–DO water, and a low–DO simulated PWR water. All of the specimens show fatiguestriations; the spacing between striations indicates that crack growth increases in the followingsequence: air, high–DO water, and low–DO PWR water. The presence of well defined striationssuggests that the enhanced crack growth rates in austenitic SSs are most likely due to

hydrogen–induced cracking. Fatigue striations should not be observed if enhancement of crackgrowth is caused by the slip oxidation/dissolution process.
5 Statistical Model
The fatigue S–N curves are generally expressed in terms of the Langer equation,6 which may beused to represent either strain amplitude in terms of life or life in terms of strain amplitude. Theparameters of the equation are commonly established through least–squares curve–fitting of thedata to minimize the sum of the square of the residual errors for either fatigue life or strainamplitude. A predictive model based on least–squares fit on life is biased for low strain amplitude.The model leads to probability curves that converge to a single value of strain, and fails to addressthe fact that at low strain values, most of the error in life is due to uncertainty associated witheither measurement of strain or variation in fatigue limit caused by material variability. On theother hand, a least–squares fit on strain does not work well for higher strain amplitudes.Statistical models have been developed at ANL33,34 by combining the two approaches andminimizing the sum of the squared Cartesian distances from the data point to the predicted curve;the models were later updated with a larger fatigue S–N data base.31 The functional forms andtransformation for the different variables were based on experimental observations and data trends.
In air, the model assumes that fatigue life is independent of temperature and that strain rateeffects occur at temperatures >250°C. It is also assumed that the effect of strain rate on lifedepends on temperature. One data set, obtained on Type 316 SS in room–temperature air, wasexcluded from the analysis. The tests in this data set were conducted in load–control mode atstress levels in the range of 190–230 MPa. The strain amplitudes were calculated only as elasticstrains, i.e., strain amplitudes of 0.1–0.12% (the data are shown as circles in Fig. 5, with fatiguelives of 4 x 10⁵ to 3 x 10⁷). Based on cyclic stress vs. strain correlations for Type 316 SS(Eqs. 4a–4f), actual strain amplitudes for these tests should be 0.23–0.32%. In air, the fatigue lifeN of Types 304 and 316 SS is expressed as
ln(N) = 6.703 – 2.030 ln(εa – 0.126) + T* ε* (5a)
and that of Type 316NG, as
ln(N) = 7.422 – 1.671 ln(εa – 0.126) + T* ε*, (5b)
where εa is the strain amplitude (%) and T* and ε* are transformed temperature and strain rate,respectively, defined as follows:
T* = 0 (T < 250°C)T* = [(T – 250)/525]0.84 (250 ≤ T < 400°C) (6a)
ε* = 0 ( ε > 0.4%/s)
ε* = ln( ε/0.4) (0.0004 ≤ ε ≤ 0.4%/s)
ε* = ln(0.0004/0.4) ( ε < 0.0004%/s). (6b)
In LWR environments, the fatigue lives of austenitic SSs depends on strain rate, DO level, andtemperature; the decrease in life is greater at low–DO levels and high temperatures. However,existing data are inadequate to establish the functional form for the dependence of fatigue life onDO level or temperature. Separate correlations have been developed for low– and high–DO levels (<or ≥ 0.05 ppm), and low and high temperatures (< or ≥ 200°C). Also, a threshold strain rate of

0.4%/s and saturation rate of 0.0004%/s is assumed in the model. Furthermore, for conveniencein incorporating environmental effects into fatigue evaluations, the slope of the S–N curve in LWRenvironments was assumed to be the same as that in air although the best–fit of the experimentaldata in water yielded a slope for the S–N curve that differed from the slope of the curve that wasobtained in air. In LWR environments, the fatigue life N of Types 304 and 316 SS is expressed as
ln(N) = 5.768 – 2.030 ln(εa – 0.126) + T* ε* O* (7a)
and that of Type 316NG, as
ln(N) = 6.913 – 1.671 ln(εa – 0.126) + T* ε* O*, (7b)
where the constants for transformed temperature, strain rate, and DO are defined as follows:
T* = 0 (T < 200°C)T* = 1 (T ≥ 200°C) (8a)
ε* = 0 ( ε > 0.4%/s)
ε* = ln( ε/0.4) (0.0004 ≤ ε ≤ 0.4%/s)
ε* = ln(0.0004/0.4) ( ε < 0.0004%/s) (8b)
O* = 0.260 (DO < 0.05 ppm)O* = 0.172 (DO ≥ 0.05 ppm). (8c)
The model is recommended for predicted fatigue lives ≤ 106 cycles. Recent test results indicatethat for high–DO environments, conductivity of water is important for environmental effects onfatigue life of austenitic SSs. Therefore, the above correlations may be conservative for high–DO,i.e., ≥0.05 ppm DO, environments. The experimental values of fatigue life in air and water andthose predicted from Eqs. 5–8 are plotted in Fig. 24. The estimated fatigue S–N curves for Types304, 316, and 316NG SSs in air and LWR environments are shown in Figs. 5 and 25, respectively.The predicted fatigue lives show good agreement with the experimental data. Note that the ASMEmean curve is not consistent with the existing fatigue S–N data (Fig. 5). Also, although the best–fitof the S–N data in LWR environments (Fig. 25) yields a steeper slope, the slope of the S–N curve inwater was assumed to be the same as in air.
Upon completion of the modeling phase, the residual errors (i.e., the Cartesian distance fromthe prediction curve) should not show significant patterns, such as heteroskedasticity (changingvariance), or a nonzero slope. The residual errors for each variable, grouped by steel type andenvironment (air or water), are plotted in Figs. 26–30. Most data subsets and plots

1 01
1 02
1 03
1 04
1 05
1 06
1 07
1 08
1 09
1 01 1 02 1 03 1 04 1 05 1 06 1 07 1 08 1 09
Type 304 SS
Type 316 SSType 316NG
Pre
dict
ed L
ife (
Cyc
les)
Observed Life (Cycles)
Austenitic Stainless SteelsAir
1 02
1 03
1 04
1 05
1 06
1 07
1 08
1 09
1 02 1 03 1 04 1 05 1 06 1 07 1 08 1 09
Type 304 SS
Type 316 SSType 316NG
Pre
dict
ed L
ife (
Cyc
les)
Observed Life (Cycles)
Austenitic Stainless SteelsWater
Figure 24. Experimental and predicted values of fatigue lives of austenitic SSs in air and waterenvironments
0.1
1.0
102 103 104 105
0.4%/s0.04%/s0.004%/s≤0.0004%/s
Str
ain
Am
plitu
de ε a
(%)
Type 304 SSDO: 0.005 ppm
Fatigue Life (Cycles)
Strain Rate (%/s)
Open Symbols: 325°CClosed Symbols: 300°C
102 103 104 105
0.4%/s0.01%/s
Type 316 SSDO: 0.005 ppm
Fatigue Life (Cycles)
Strain Rate (%/s)
Open Symbols: 100°CClosed Symbols: 200°C
All Strain Rates
0.1
1.0
102 103 104 105
0.4%/s0.04%/s0.004%/s≤0.0004%/s
Str
ain
Am
plitu
de ε a
(%)
Type 304 SS288°C, DO: 0.003 ppm
Fatigue Life (Cycles)
Strain Rate (%/s)
102 103 104 105
0.5%/s0.05%/s0.005%/s
Type 316NG SS288°C; DO: 0.004 ppm
Fatigue Life (Cycles)
Strain Rate (%/s)
Figure 25. Experimental fatigue lives and those estimated from statistical models for austenitic SSs inwater environments

-3.0
-2.0
-1.0
0 . 0
1 . 0
2 . 0
3 . 0
0 5 0 100 150 200 250 300 350
Type 304Type 316Type 316NG
Res
idua
l
Temperature (°C)
Air Environment
0 5 0 100 150 200 250 300 350
Type 304Type 316Type 316NG
Temperature (°C)
Water Environment
Figure 26. Residual error for austenitic SSs as a function of test temperature
-3.0
-2.0
-1.0
0 . 0
1 . 0
2 . 0
3 . 0
0 1 0 2 0 3 0 4 0 5 0 6 0
Type 304Type 316Type 316NG
Res
idua
l
Heat Identification
Air Environment
0 1 0 2 0 3 0 4 0 5 0 6 0
Type 304Type 316Type 316NG
Heat Identification
Water Environment
Figure 27. Residual error for austenitic SSs as a function of material heat
-3.0
-2.0
-1.0
0 . 0
1 . 0
2 . 0
3 . 0
1 0-4 1 0-3 1 0-2 1 0-1 1 00
Type 304Type 316Type 316NG
Res
idua
l
Strain Rate (%/s)
Air Environment
1 0-4 1 0-3 1 0-2 1 0-1 1 00
Type 304Type 316Type 316NG
Strain Rate (%/s)
Water Environment
Figure 28. Residual error for austenitic SSs as a function of loading strain rate

-3.0
-2.0
-1.0
0 . 0
1 . 0
2 . 0
3 . 0
1 0-1 1 00
Type 304Type 316Type 316NG
Res
idua
l
Strain Amplitude (%)
Air Environment
1 0-1 1 00
Type 304Type 316Type 316NG
Strain Amplitude (%)
Water Environment
Figure 29. Residual error for austenitic SSs as a function of applied strain amplitude
-3.0
-2.0
-1.0
0 . 0
1 . 0
2 . 0
3 . 0
1 0-3 1 0-2 1 0-1 1 00 1 01
Type 304Type 316Type 316NG
Res
idua
l
Dissolved Oxygen (ppm)
Water Environment
Figure 30.Residual error for austenitic SSs as a function ofdissolved oxygen in water
do not show patterns. In general, high variance tends to be associated with longer lives and lowerstrain amplitudes. Furthermore, biases seem to be traceable to heat–to–heat variation.
6 Design Fatigue Curves
The design fatigue curves in the current ASME Section III Code were based on experimentaldata on small polished test specimens. The curves were obtained by adjusting the best–fit curve forthe effect of mean stress and then lowering the adjusted curve by a factor of 2 on stress or 20 onlife, whichever was more conservative, at each point of the curve. The best–fit curve to theexperimental data,51 expressed in terms of strain amplitude εa (%) and fatigue cycles N, foraustenitic SSs is given by
ln[N] = 6.954 – 2.0 ln(εa – 0.167). (9)
The mean curve, expressed in terms of stress amplitude Sa (MPa), which is the product of εa andelastic modulus E, is given by
Sa = 58020/(N)1/2 + 299.92. (10)

The strain–vs.–life data were converted to stress–vs.–life curves by using the room–temperaturevalue of 195.1 GPa (28300 ksi) for the elastic modulus. The best–fit curves were adjusted for theeffect of mean stress by using the modified Goodman relationship46
′Sa = Sa
σu − σy
σu − Sa
for Sa < σy, (10a)
and ′Sa = Sa for Sa > σy, (10b)
where ′Sa is the adjusted value of stress amplitude, and σy and σu are yield and ultimate strengths
of the material, respectively. The Goodman relationship assumes the maximum possible meanstress and typically gives a conservative adjustment for mean stress, at least when environmentaleffects are not significant. The design fatigue curves were then obtained by lowering the adjustedbest–fit curve by a factor of 2 on stress or 20 on cycles, whichever was more conservative, toaccount for differences and uncertainties in fatigue life associated with material and loadingconditions.
The same procedure has been used to develop design fatigue curves for LWR environments.However, because of the differences between the ASME mean curve and the best–fit curve toexisting fatigue data (Fig. 5), the margin on strain for the current ASME Code design fatigue curveis closer to 1.5 than 2. Therefore, to be consistent with the current Code design curve, a factor of1.5 rather than 2 was used in developing the design fatigue curves from the updated statisticalmodels in air and LWR environments.
The design fatigue curves based on the statistical model for Types 304 and 316 SS in air andlow– and high–DO water are shown in Figs. 31–33. A similar set of curves can be obtained for Type316NG SS. Because the fatigue life of Type 316NG is superior to that of Types 304 or 316 SS,Figs. 31–33 may be used conservatively for Type 316NG SS. Also, as mentioned earlier, recent testresults indicate that the conductivity of water is important for environmental effects on fatigue lifeof austenitic SSs in high–DO environments. Therefore, the design fatigue curves for Type 304 and316 SS in water with ≥0.05 ppm DO (Fig. 33) may be conservative.
Although, in air at low stress levels, the differences between the current ASME Code designcurve and the design curve obtained from the updated statistical model at temperatures <250°Chave been reduced or eliminated by reducing the margin on stress from 2 to 1.5, significantdifferences still exist between the two curves. For example, at stress amplitudes >300 MPa,estimates of life from the updated design curve are a factor of ≈2 lower than those from the ASMECode curve. Therefore, the actual margins on stress and life for the current ASME Code designfatigue curve are 1.5 and 10, respectively, instead of 2 and 20.

1 02
1 03
1 01 1 02 1 03 1 04 1 05 1 06 1 07
≤250°C, All Strain Ratesor 250–350°C, ≥0.4%/s290°C, ≤0.0004%/s325°C, ≤0.0004%/s
Str
ess
Am
plitu
de S
a (M
Pa)
Number of Cycles N
σu = 648.1 MPa
σy = 303.4 MPa
E = 195.1 GPaASME Code Curve
Figure 31.ASME and statistical–model design fatiguecurves for Types 304 and 316 SS in air
1 02
1 03
1 01 1 02 1 03 1 04 1 05 1 06 1 07
0.040.004≤0.0004
Str
ess
Am
plitu
de S
a (M
Pa)
Number of Cycles N
DO <0.05 ppm
≥200°CStrain Rate (%/s)
ASME Code Design Curve
<200°C, All Strain Ratesor ≥200°C, 0.4%/s
Figure 32.ASME and statistical–model design fatiguecurves for Types 304 and 316 SS in waterwith <0.05 ppm DO
1 02
1 03
1 01 1 02 1 03 1 04 1 05 1 06 1 07
0.040.004≤0.0004
Str
ess
Am
plitu
de S
a (M
Pa)
Number of Cycles N
DO ≥0.05 ppm
≥200°CStrain Rate (%/s)
ASME Code Design Curve
<200°C, All Strain Ratesor ≥200°C, 0.4%/s
Figure 33.ASME and statistical–model design fatiguecurves for Types 304 and 316 SS in waterwith ≥0.05 ppm DO
As discussed above, the existing fatigue data indicate a threshold strain range of ≈0.32%,below which environmental effects on the fatigue life of austenitic SSs either do not occur or areinsignificant. This value must be adjusted for the effects of mean stress and uncertainties due tomaterial and loading variability. Threshold strain amplitudes are decreased by ≈10% to account formean stress effects and by a factor of 1.5 to account for uncertainties in fatigue life associated withmaterial and loading variability. Thus, a threshold strain amplitude of 0.097% (stress amplitude of189 MPa) was selected, below which environmental effects on life are modest and are representedby the design curve for temperatures <200°C (shown by the solid line in Figs. 31 and 32).
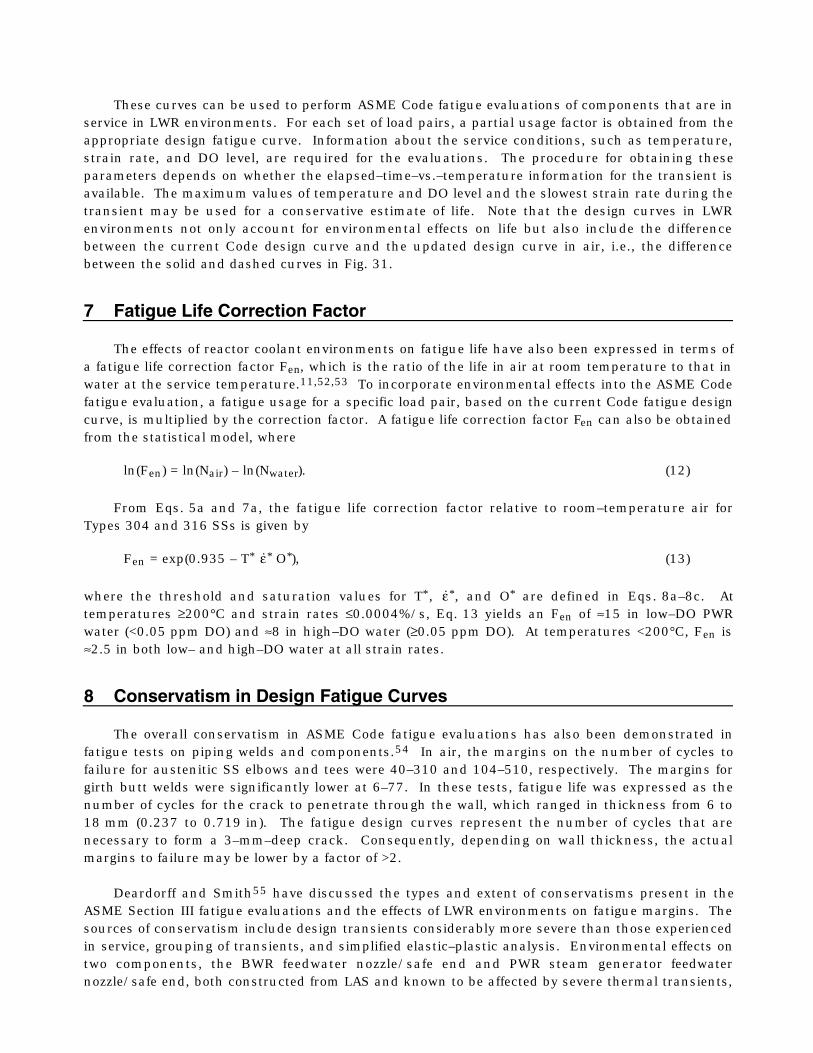
These curves can be used to perform ASME Code fatigue evaluations of components that are inservice in LWR environments. For each set of load pairs, a partial usage factor is obtained from theappropriate design fatigue curve. Information about the service conditions, such as temperature,strain rate, and DO level, are required for the evaluations. The procedure for obtaining theseparameters depends on whether the elapsed–time–vs.–temperature information for the transient isavailable. The maximum values of temperature and DO level and the slowest strain rate during thetransient may be used for a conservative estimate of life. Note that the design curves in LWRenvironments not only account for environmental effects on life but also include the differencebetween the current Code design curve and the updated design curve in air, i.e., the differencebetween the solid and dashed curves in Fig. 31.
7 Fatigue Life Correction Factor
The effects of reactor coolant environments on fatigue life have also been expressed in terms ofa fatigue life correction factor Fen, which is the ratio of the life in air at room temperature to that inwater at the service temperature.11,52,53 To incorporate environmental effects into the ASME Codefatigue evaluation, a fatigue usage for a specific load pair, based on the current Code fatigue designcurve, is multiplied by the correction factor. A fatigue life correction factor Fen can also be obtainedfrom the statistical model, where
ln(Fen) = ln(Nair) – ln(Nwater). (12)
From Eqs. 5a and 7a, the fatigue life correction factor relative to room–temperature air forTypes 304 and 316 SSs is given by
Fen = exp(0.935 – T* ε* O*), (13)
where the threshold and saturation values for T* , ε*, and O* are defined in Eqs. 8a–8c. Attemperatures ≥200°C and strain rates ≤0.0004%/s, Eq. 13 yields an Fen of ≈15 in low–DO PWRwater (<0.05 ppm DO) and ≈8 in high–DO water (≥0.05 ppm DO). At temperatures <200°C, Fen is≈2.5 in both low– and high–DO water at all strain rates.
8 Conservatism in Design Fatigue Curves
The overall conservatism in ASME Code fatigue evaluations has also been demonstrated infatigue tests on piping welds and components.54 In air, the margins on the number of cycles tofailure for austenitic SS elbows and tees were 40–310 and 104–510, respectively. The margins forgirth butt welds were significantly lower at 6–77. In these tests, fatigue life was expressed as thenumber of cycles for the crack to penetrate through the wall, which ranged in thickness from 6 to18 mm (0.237 to 0.719 in). The fatigue design curves represent the number of cycles that arenecessary to form a 3–mm–deep crack. Consequently, depending on wall thickness, the actualmargins to failure may be lower by a factor of >2.
Deardorff and Smith55 have discussed the types and extent of conservatisms present in theASME Section III fatigue evaluations and the effects of LWR environments on fatigue margins. Thesources of conservatism include design transients considerably more severe than those experiencedin service, grouping of transients, and simplified elastic–plastic analysis. Environmental effects ontwo components, the BWR feedwater nozzle/safe end and PWR steam generator feedwaternozzle/safe end, both constructed from LAS and known to be affected by severe thermal transients,

were also investigated in the study. When environmental effects on fatigue life were not considered,Deardorff and Smith55 estimated that the ratio of the CUFs for the PWR and BWR nozzles (bothconstructed from LAS), computed with the mean experimental curve for test specimen data, toCUFs computed with the Code fatigue design curve were ≈60 and 90, respectively. To maintain thefactor of 20 on life that was used in the present Code fatigue design curves to account for theuncertainties due to material and loading variability, the margins for the PWR and BWR nozzles arereduced to 3 and 4.5, respectively. These results suggest that, for carbon and low–alloy steels, theCode Design procedures provide some margin in life that can be used to account for environmentaleffects on life. However, as noted previously in Section 6, the Code fatigue design curve foraustenitic SSs is not consistent with the existing fatigue S–N data; the actual margins on stressand life are 1.5 and 10, respectively, instead of 2 and 20. Consequently, the Code fatigue designcurve for austenitic SSs provides little or no margin in life to account for environmental effects.
Data available in the literature have been reviewed to evaluate the effects of various material,loading, and environmental variables on the fatigue life of structural materials in air and LWRenvironments.33 The subfactors that may be used to account for the effects of these variables onfatigue life are summarized in Table 5. The factors on strain primarily account for variation in thefatigue limit of a material caused by material variability, component size and surface finish, andloading history. Because the reduction in fatigue life is associated with the growth of short cracks(<100 µm), the effects of these variables on threshold strain are typically not cumulative but ratherare controlled by the variable that has the largest effect. The values in Table 5 suggest that a factorof at least 1.5 on strain and 10 on cycles is needed to account for the differences and uncertaintiesof relating the fatigue lives of laboratory test specimens to those of large components. Beacuse SSsdevelop a corrosion scale in LWR environments, the effect of surface finish may not be significant;the subfactor on life to account for surface finish effects may be as low as 1.5 or may be eliminatedcompletely. Therefore, a factor of 1.5 or 2 on life may be able to account for the effects ofenvironment on the fatigue lives of austenitic SSs.
Table 5. Subfactors that may be used to account for effects of various variables onfatigue life
Variable Factor on Life Factor on Strain
Material variability and experimental scatter 2.5 1.4–1.7
Size 1.4 1.25
Surface finish 2.0–3.0 1.3
Loading history 1.5–2.5 1.5
Total adjustment 10.0–26.0 1.5–1.7
9 Fatigue Evaluations in LWR Environments
Section III of the ASME Boiler and Pressure Vessel Code contains rules for the construction ofnuclear power plant Class 1 components.5 It provides requirements for designs that will withstandcyclic loadings on a structural component that occur because of changes in mechanical andthermal loadings as the system goes from one load set (pressure, temperature, moment, and force)to any other load set. ASME Section III, NB–3600 (piping design) methodology is used exclusivelyfor piping and sometimes for branch nozzles. ASME Section III, NB–3200 (design by analysis)methodology is generally used for vessels and frequently for nozzles. In both cases, the various setsof load states at the most highly stressed locations in the component are defined first. The loadstates are defined in terms of the three principal stresses in NB–3200 methodology, and in terms of

internal pressure, moments, average temperature, and temperature gradients in NB–3600methodology. A peak stress–intensity range and an alternating stress–intensity amplitude Sa isthen calculated for each load state. The value of Sa is used to first obtain the allowable number ofcycles from the design fatigue curve and then to calculate the fatigue usage associated with thatload state. The CUF is the sum of the partial usage factors. The Section III, NB–3200– orNB–3600–type analyses of components for service in LWR environments can be performed with thedesign fatigue curves presented in Figs. 32 and 33. Note that fatigue evaluations performed withthese updated curves not only account for the environmental effects but they also include thedifference between the current ASME mean air curve and the statistical–model air curve.
An alternative approach to fatigue evaluations in LWR environments has been proposed byElectric Power Research Institute (EPRI)52,53 and by the Environmental Fatigue Data (EFD)committee of Thermal and Nuclear Power Engineering Society (TENPES) of Japan.* As discussed inSection 7, the effects of LWR coolant environments on the fatigue S–N curves are expressed interms of fatigue life correction factor Fen, defined as the ratio of the life in air at room temperatureto that in water at service temperature. The effects of environment are incorporated into the ASMEfatigue evaluation by obtaining a fatigue usage for a specific load pair based on the current Codedesign curves and multiplying it by the correction factor. Fatigue evaluations performed with theFen incorporate only the effect of environment.
Both of these approaches require additional information about the service conditions, e.g.,temperature, strain rate, and DO level. The procedure for obtaining these parameters depends onwhether the elapsed–time–vs.–temperature information for the transient is available. The values oftemperature and DO may be conservatively taken as the maximum values for the transient. Anaverage strain rate is generally used for each load state; it is obtained from the peak strain andelapsed time for the transient. However, fatigue–monitoring data indicate that actual strain ratesmay vary significantly during the transient. The slowest strain rate can be used for a conservativeestimate of life.
10 Summary
The work performed at ANL on fatigue of wrought and cast austenitic SSs in LWRenvironments is summarized. The existing fatigue S–N data have been evaluated to establish theeffects of various material and loading variables, such as steel type, strain range, strain rate,temperature,and DO level in water on the fatigue lives of these steels. Current understanding ofthe fatigue S–N behavior of austenitc SSs may be summarized as follows.
10.1 Air Environment
• Steel Type: The fatigue lives of Types 304 and 316 SS are comparable; those of Type 316NGare superior. The fatigue S–N behavior of cast CF–8 and CF–8M SSs is similar to that ofwrought austenitic SSs.
• Temperature: For all steels, life is independent of temperature in the range from roomtemperature to 427°C.
• Strain Rate: At temperatures above 260°C, the fatigue lives of austenitic SSs may decreasewith decreasing strain rate.
*Presented at the Pressure Vessel Research Council Meeting, April 1996, Orlando, FL.
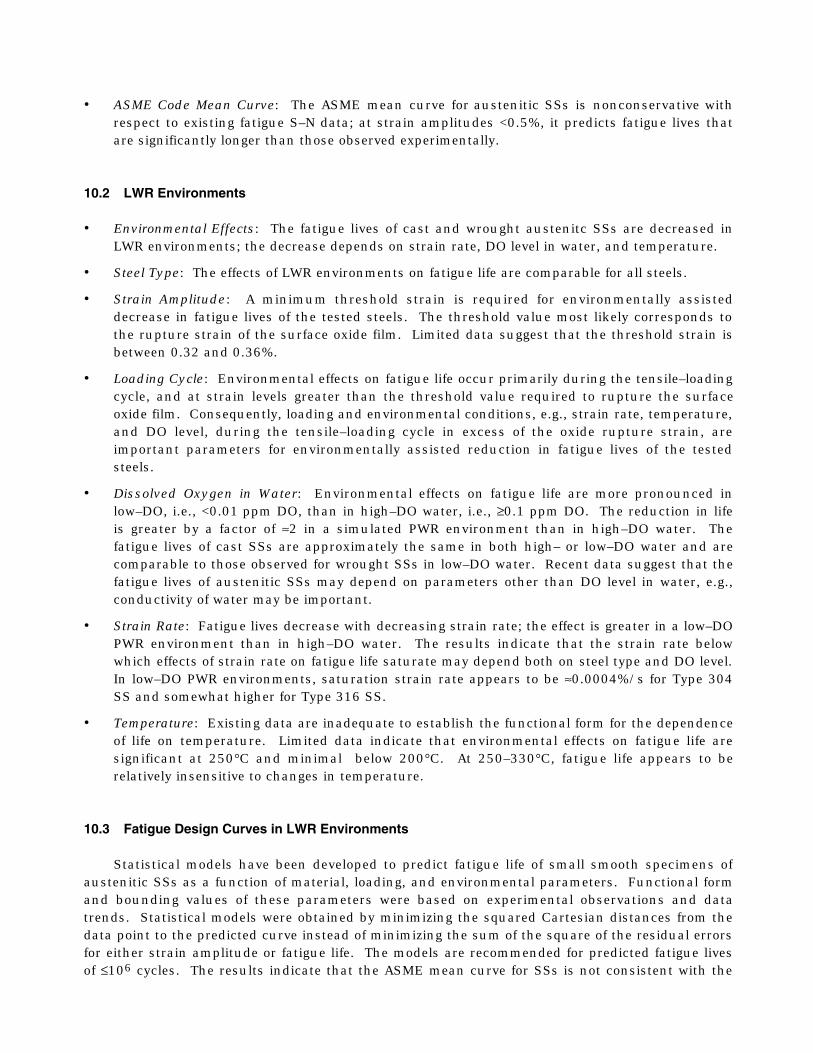
• ASME Code Mean Curve: The ASME mean curve for austenitic SSs is nonconservative withrespect to existing fatigue S–N data; at strain amplitudes <0.5%, it predicts fatigue lives thatare significantly longer than those observed experimentally.
10.2 LWR Environments
• Environmental Effects: The fatigue lives of cast and wrought austenitc SSs are decreased inLWR environments; the decrease depends on strain rate, DO level in water, and temperature.
• Steel Type: The effects of LWR environments on fatigue life are comparable for all steels.
• Strain Amplitude: A minimum threshold strain is required for environmentally assisteddecrease in fatigue lives of the tested steels. The threshold value most likely corresponds tothe rupture strain of the surface oxide film. Limited data suggest that the threshold strain isbetween 0.32 and 0.36%.
• Loading Cycle: Environmental effects on fatigue life occur primarily during the tensile–loadingcycle, and at strain levels greater than the threshold value required to rupture the surfaceoxide film. Consequently, loading and environmental conditions, e.g., strain rate, temperature,and DO level, during the tensile–loading cycle in excess of the oxide rupture strain, areimportant parameters for environmentally assisted reduction in fatigue lives of the testedsteels.
• Dissolved Oxygen in Water: Environmental effects on fatigue life are more pronounced inlow–DO, i.e., <0.01 ppm DO, than in high–DO water, i.e., ≥0.1 ppm DO. The reduction in lifeis greater by a factor of ≈2 in a simulated PWR environment than in high–DO water. Thefatigue lives of cast SSs are approximately the same in both high– or low–DO water and arecomparable to those observed for wrought SSs in low–DO water. Recent data suggest that thefatigue lives of austenitic SSs may depend on parameters other than DO level in water, e.g.,conductivity of water may be important.
• Strain Rate: Fatigue lives decrease with decreasing strain rate; the effect is greater in a low–DOPWR environment than in high–DO water. The results indicate that the strain rate belowwhich effects of strain rate on fatigue life saturate may depend both on steel type and DO level.In low–DO PWR environments, saturation strain rate appears to be ≈0.0004%/s for Type 304SS and somewhat higher for Type 316 SS.
• Temperature: Existing data are inadequate to establish the functional form for the dependenceof life on temperature. Limited data indicate that environmental effects on fatigue life aresignificant at 250°C and minimal below 200°C. At 250–330°C, fatigue life appears to berelatively insensitive to changes in temperature.
10.3 Fatigue Design Curves in LWR Environments
Statistical models have been developed to predict fatigue life of small smooth specimens ofaustenitic SSs as a function of material, loading, and environmental parameters. Functional formand bounding values of these parameters were based on experimental observations and datatrends. Statistical models were obtained by minimizing the squared Cartesian distances from thedata point to the predicted curve instead of minimizing the sum of the square of the residual errorsfor either strain amplitude or fatigue life. The models are recommended for predicted fatigue livesof ≤106 cycles. The results indicate that the ASME mean curve for SSs is not consistent with the
experimental data at strain amplitudes <0.5% or stress amplitudes <975 MPa (<141 ksi); the ASMEmean curve is nonconservative.
The design fatigue curves for austenitic SSs in LWR environments were obtained by theprocedure that was used to develop the current ASME Code design fatigue curves, i.e., by adjustingthe best–fit experimental curve for the effect of mean stress and by setting margins of 20 on cyclesand 2 on strain to account for the uncertainties in life associated with material and loadingconditions. However, because the margin on strain for the current ASME Code design fatigue curveis closer to 1.5 than 2, a factor of 1.5 was used when the design fatigue curves in LWRenvironments were developed. Data available in the literature were reviewed to evaluate theconservatism in the existing Code fatigue design curves. The use of a fatigue life correction factorto incorporate the effects of environment into the ASME Code fatigue evaluations is also discussed.


References
1. K. Iida, A Review of Fatigue Failures in LWR Plants in Japan, Nucl. Eng. Des. 138, 297–312(1992).
2. K. Kussmaul, R. Rintamaa, J. Jansky, M. Kemppainen, and K. Törrönen, On the Mechanism ofEnvironmental Cracking Introduced by Cyclic Thermal Loading, in IAEA Specialists MeetingCorrosion and Stress Corrosion of Steel Pressure Boundary Components and Steam Turbines,VTT Symp. 43, Espoo, Finland, pp. 195–243 (1983).
3. K. Kussmaul, D. Blind, and J. Jansky, Formation and Growth of Cracking in Feed Water Pipesand RPV Nozzles, Nucl. Eng. Des. 81, 105–119 (1984).
4. E. Lenz, B. Stellwag, and N. Wieling, The Influence of Strain Induced Corrosion Cracking on theCrack Initiation in Low Alloy Steels in HT–Water – A Relation Between Monotonic and CyclicCrack Initiation Behavior, in IAEA Specialists Meeting Corrosion and Stress Corrosion of SteelPressure Boundary Components and Steam Turbines, VTT Symp. 43, Espoo, Finland, pp.243–267 (1983).
5. ASME Boiler and Pressure Vessel Code Section III – Rules for Construction of Nuclear PowerPlant Components, The American Society of Mechanical Engineers, New York (1992).
6. B. F. Langer, Design of Pressure Vessels for Low–Cycle Fatigue, ASME J. Basic Eng. 84,389–402 (1962) .
7. Tentative Structural Design Basis for Reactor Pressure Vessels and Directly AssociatedComponents (Pressurized, Water Cooled Systems), PB 151987, U.S. Dept. of Commerce, Officeof Technical Service, 1 Dec. 1958 Revision.
8. S. Ranganath, J. N. Kass, and J. D. Heald, Fatigue Behavior of Carbon Steel Components inHigh–Temperature Water Environments, in BWR Environmental Cracking Margins for CarbonSteel Piping, EPRI NP–2406, Electric Power Research Institute, Palo Alto, CA, Appendix 3 (May1982).
9. W. A. Van Der Sluys, Evaluation of the Available Data on the Effect of the Environment on theLow Cycle Fatigue Properties in Light Water Reactor Environments, in Proc. 6th Int. Symp. onEnvironmental Degradation of Materials in Nuclear Power Systems – Water Reactors, R. E.Gold and E. P. Simonen, eds., The Metallurgical Society, Warrendale, PA, pp. 1–4 (1993).
10. N. Nagata, S. Sato, and Y. Katada, Low–Cycle Fatigue Behavior of Pressure Vessel Steels inHigh–Temperature Pressurized Water, ISIJ Int. 31 (1), 106–114 (1991).
11. M. Higuchi and K. Iida, Fatigue Strength Correction Factors for Carbon and Low–Alloy Steels inOxygen–Containing High–Temperature Water, Nucl. Eng. Des. 129, 293–306 (1991).

12. M. Higuchi, K. Iida, and Y. Asada, Effects of Strain Rate Change on Fatigue Life of Carbon Steelin High–Temperature Water, in Fatigue and Crack Growth: Environmental Effects, ModelingStudies, and Design Considerations, PVP Vol. 306, S. Yukawa, ed., American Society ofMechanical Engineers, New York, pp. 111–116 (1995); also in Proc. of Symp. on Effects of theEnvironment on the Initiation of Crack Growth, ASTM STP 1298, American Society for Testingand Materials, Philadelphia (1997).
13. H. Kanasaki, M. Hayashi, K. Iida, and Y. Asada, Effects of Temperature Change on Fatigue Lifeof Carbon Steel in High Temperature Water, in Fatigue and Crack Growth: EnvironmentalEffects, Modeling Studies, and Design Considerations, PVP Vol. 306, S. Yukawa, ed.,American Society of Mechanical Engineers, New York, pp. 117–122 (1995).
14. G. Nakao, H. Kanasaki, M. Higuchi, K. Iida, and Y. Asada, Effects of Temperature andDissolved Oxygen Content on Fatigue Life of Carbon and Low–Alloy Steels in LWR WaterEnvironment, in Fatigue and Crack Growth: Environmental Effects, Modeling Studies, andDesign Considerations, PVP Vol. 306, S. Yukawa, ed., American Society of MechanicalEngineers, New York, pp. 123–128 (1995).
15. O. K. Chopra and W. J. Shack, Effects of LWR Environments on Fatigue Life of Carbon andLow–Alloy Steels, in Fatigue and Crack Growth: Environmental Effects, Modeling Studies, andDesign Considerations, PVP Vol. 306, S. Yukawa, ed., American Society of MechanicalEngineers, New York, pp. 95–109 (1995).
16. O. K. Chopra and W. J. Shack, Evaluation of Effects of LWR Coolant Environments on FatigueLife of Carbon and Low–Alloy Steels, in Effects of the Environment on the Initiation of CrackGrowth, ASTM STP 1298, W. A. Van Der Sluys, R. S. Piascik, and R. Zawierucha, eds.,American Society for Testing and Materials, Philadelphia, pp. 247–266 (1997).
17. O. K. Chopra and W. J. Shack, Low–Cycle Fatigue of Piping and Pressure Vessel Steels in LWREnvironments, Nucl. Eng. Des. 184, 49–76 (1998).
18. O. K. Chopra and W. J. Shack, Effects of LWR Coolant Environments on Fatigue Design Curvesof Carbon and Low–Alloy Steels, NUREG/CR–6583, ANL–97/18 (March 1998).
19. O. K. Chopra and W. J. Shack, Fatigue Crack Initiation in Carbon and Low–Alloy Steels in LightWater Reactor Environments – Mechanism and Prediction, in Fatigue, Environmental Factors,and New Materials, PVP Vol. 374, H. S. Mehta, R. W. Swindeman, J. A. Todd, S. Yukawa, M.Zako, W. H. Bamford, M. Higuchi, E. Jones, H. Nickel, and S. Rahman, eds., American Societyof Mechanical Engineers, New York, pp. 155–168 (1998).
20. O. K. Chopra and W. J. Shack, Overview of Fatigue Crack Initiation in Carbon and Low–AlloySteels in Light Water Reactor Environments, J. Pressure Vessel Technol. 121, 49–60 (1999).
21. M. Fujiwara, T. Endo, and H. Kanasaki, Strain Rate Effects on the Low Cycle Fatigue Strengthof 304 Stainless Steel in High Temperature Water Environment, Fatigue Life: Analysis andPrediction, in Proc. of the Int. Conf. and Exposition on Fatigue, Corrosion Cracking, FractureMechanics, and Failure Analysis, ASM, Metals Park, OH, pp. 309–313 (1986).

22. H. Mimaki, H. Kanasaki, I. Suzuki, M. Koyama, M. Akiyama, T. Okubo, and Y. Mishima,Material Aging Research Program for PWR Plants, in Aging Management Through MaintenanceManagement, PVP Vol. 332, I. T. Kisisel, ed., American Society of Mechanical Engineers, NewYork, pp. 97–105 (1996).
23. H. Kanasaki, R. Umehara, H. Mizuta, and T. Suyama, Fatigue Lives of Stainless Steels in PWRPrimary Water, Trans. 14th Int. Conf. on Structural Mechanics in Reactor Technology (SMiRT14), Lyon, France, pp. 473–483 (1997).
24. H. Kanasaki, R. Umehara, H. Mizuta, and T. Suyama, Effects of Strain Rate and TemperatureChange on the Fatigue Life of Stainless Steel in PWR Primary Water, Trans. 14th Intl. Conf. onStructural Mechanics in Reactor Technology (SMiRT 14), Lyon, France, pp. 485–493 (1997).
25. M. Higuchi and K. Iida, Reduction in Low–Cycle Fatigue Life of Austenitic Stainless Steels inHigh–Temperature Water, in Pressure Vessel and Piping Codes and Standards, PVP Vol. 353,D. P. Jones, B. R. Newton, W. J. O'Donnell, R. Vecchio, G. A. Antaki, D. Bhavani, N. G. Cofie,and G. L. Hollinger, eds., American Society of Mechanical Engineers, New York, pp. 79–86(1997).
26. M. Hayashi, Thermal Fatigue Strength of Type 304 Stainless Steel in Simulated BWREnvironment, Nucl. Eng. Des. 184, 135–144 (1998).
27. M. Hayashi, K. Enomoto, T. Saito, and T. Miyagawa, Development of Thermal Fatigue Testingwith BWR Water Environment and Thermal Fatigue Strength of Austenitic Stainless Steels, Nucl.Eng. Des. 184, 113–122 (1998).
28. W. J. Shack and W. F. Burke, Fatigue of Type 316NG SS, in Environmentally AssistedCracking in Light Water Reactors, Semiannual Report, October 1989–March 1990,NUREG/CR–4667 Vol. 10, ANL–91/5, pp. 3–19 (March 1991).
29. O. K. Chopra and D. J. Gavenda, Effects of LWR Coolant Environments on Fatigue Lives ofAustenitic Stainless Steels, in Pressure Vessel and Piping Codes and Standards, PVP Vol. 353,D. P. Jones, B. R. Newton, W. J. O'Donnell, R. Vecchio, G. A. Antaki, D. Bhavani, N. G. Cofie,and G. L. Hollinger, eds., American Society of Mechanical Engineers, New York, pp. 87–97(1997).
30. O. K. Chopra and D. J. Gavenda, Effects of LWR Coolant Environments on Fatigue Lives ofAustenitic Stainless Steels, J. Pressure Vessel Technol. 120, 116–121 (1998).
31. O. K. Chopra and J. L. Smith, Estimation of Fatigue Strain–Life Curves for Austenitic StainlessSteels in Light Water Reactor Environments, in Fatigue, Environmental Factors, and NewMaterials, PVP Vol. 374, H. S. Mehta, R. W. Swindeman, J. A. Todd, S. Yukawa, M. Zako, W.H. Bamford, M. Higuchi, E. Jones, H. Nickel, and S. Rahman, eds., American Society ofMechanical Engineers, New York, pp. 249–259 (1998).
32. S. Majumdar, O. K. Chopra, and W. J. Shack, Interim Fatigue Design Curves for Carbon,Low–Alloy, and Austenitic Stainless Steels in LWR Environments, NUREG/CR–5999,ANL–93/3 (April 1993).

33. J. Keisler, O. K. Chopra, and W. J. Shack, Fatigue Strain–Life Behavior of Carbon andLow–Alloy Steels, Austenitic Stainless Steels, and Alloy 600 in LWR Environments,NUREG/CR–6335, ANL–95/15 (Aug. 1995).
34. J. Keisler, O. K. Chopra, and W. J. Shack, Statistical Models for Estimating Fatigue Strain–LifeBehavior of Pressure Boundary Materials in Light Water Reactor Environments, Nucl. Eng. Des.167, 129–154 (1996).
35. D. D. Macdonald, A. C. Scott, and P. Wentrcek, External Reference Electrodes for Use in HighTemperature Aqueous Systems, J. Electrochem. Soc. 126, 908–911 (1979).
36. C. E. Jaske, and W. J. O'Donnell, Fatigue Design Criteria for Pressure Vessel Alloys, Trans.ASME J. Pressure Vessel Technol. 99, 584–592 (1977).
37. J. B. Conway, R. H. Stentz, and J. T. Berling, Fatigue, Tensile, and Relaxation Behavior ofStainless Steels, TID–26135, U.S. Atomic Energy Commission, Washington, DC (1975).
38. D. L. Keller, Progress on LMFBR Cladding, Structural, and Component Materials Studies DuringJuly, 1971 through June, 1972, Final Report, Task 32, Battelle–Columbus Laboratories,BMI–1928 (1977).
39. D. A. Hale, S. A. Wilson, E. Kiss, and A. J. Gianuzzi, Low Cycle Fatigue Evaluation of PrimaryPiping Materials in a BWR Environment, GEAP–20244, U.S. Nuclear Regulatory Commission(Sept. 1977).
40. C. Amzallag, P. Rabbe, G. Gallet, H. –P. Lieurade, Influence des Conditions de Sollicitation Surle Comportement en Fatigue Oligocyclique D'aciers Inoxydables Austénitiques, MemoiresScientifiques Revue Metallurgie Mars 1978, pp. 161–173
41. A. Pellissier–Tanon, J. L. Bernard, C. Amzallag, and P. Rabbe, Evaluation of the Resistance ofType 316 Stainless Steel Against Progressive Deformation, in Low–Cycle Fatigue and LifePrediction, ASTM STP 770, C. Amzallag, B. N. Leis, and P. Rabbe, eds., American Society forTesting and Materials, Philadelphia, pp. 69–80 (1982).
42. Slama, G., Petrequin, P., and Mager, T., Effect of Aging on Mechanical Properties of AusteniticStainless Steel Castings and Welds, in Assuring Structural Integrity of Steel Reactor PressureBoundary Components, SMiRT Post Conference Seminar 6, Monterey, CA, 1983.
43. O. K. Chopra, Effect of Thermal Aging on Mechanical Properties of Cast Stainless Steels, inProc. of the 2nd Int. Conf. on Heat–Resistant Materials, K. Natesan, P. Ganesan, and G. Lai,eds., ASM International, Materials Park, OH, pp. 479–485 (1995).
44. K. J. Miller, Damage in Fatigue: A New Outlook, in Pressure Vessels and Piping Codes andStandard: Volume 1 – Current Applications, PVP Vol. 313–1, K. R. Rao and Y. Asada, eds.,American Society of Mechanical Engineers, New York, pp. 191–192 (1995).
45. S. Suresh and R. O. Ritchie, Propagation of Short Fatigue Cracks, Int. Metals Reviews 29,445–476 (1984).
46. K. Tokaji, T. Ogawa, and S. Osako, The Growth of Microstructurally Small Fatigue Cracks in aFerritic–Pearlitic Steel, Fatigue Fract. Eng. Mater. Struct. 11, 331–342 (1988).

47. D. J. Gavenda, P. R. Luebbers, and O. K. Chopra, Crack Initiation and Crack Growth Behaviorof Carbon and Low–Alloy Steels, in Fatigue and Fracture 1, PVP Vol. 350,S. Rahman, K. K. Yoon, S. Bhandari, R. Warke, and J. M. Bloom, eds., American Society ofMechanical Engineers, New York, pp. 243–255 (1997).
48. K. Tokaji and T. Ogawa, The Growth of Microstructurally Small Fatigue Cracks in Metals, inShort Fatigue Cracks, ESIS 13, M. J. Miller and E. R. de los Rios, eds., MechanicalEngineering Publication, London, pp. 85–99 (1992).
49. F. P. Ford, Overview of Collaborative Research into the Mechanisms of EnvironmentallyControlled Cracking in the Low Alloy Pressure Vessel Steel/Water System, in Proc. 2nd Int.Atomic Energy Agency Specialists' Meeting on Subcritical Crack Growth, NUREG/CP–0067,MEA–2090, Vol. 2, pp. 3–71 (1986).
50. H. Hänninen, K. Törrönen, and W. H. Cullen, Comparison of Proposed Cyclic Crack GrowthMechanisms of Low Alloy Steels in LWR Environments, in Proc. 2nd Int. Atomic Energy AgencySpecialists' Meeting on Subcritical Crack Growth, NUREG/CP–0067, MEA–2090, Vol. 2, pp.73–97 (1986).
51. American Society of Mechanical Engineers, Criteria of the ASME Boiler and Pressure VesselCode for Design by Analysis in Sections III and VIII, Division 2, ASME, New York (1969).
52. H. S. Mehta and S. R. Gosselin, An Environmental Factor Approach to Account for ReactorWater Effects in Light Water Reactor Pressure Vessel and Piping Fatigue Evaluations, EPRIReport TR–105759 (Dec. 1995).
53. H. S. Mehta and S. R. Gosselin, An Environmental Factor Approach to Account for ReactorWater Effects in Light Water Reactor Pressure Vessel and Piping Fatigue Evaluations, in Fatigueand Fracture Vol. 1, PVP 323, H. S. Mehta, ed., American Society of Mechanical Engineers,New York, pp. 171–185 (1996).
54. M. E. Mayfield, E. C. Rodabaugh, and R. J. Eiber, A Comparison of Fatigue Test Data on Pipingwith the ASME Code Fatigue Evaluation Procedure, ASME paper 79–PVP–92, American Societyof Mechanical Engineers, New York (1979).
55. A. F. Deardorff and J. K. Smith, Evaluation of Conservatisms and Environmental Effects inASME Code, Section III, Class 1 Fatigue Analysis, SAND94–0187, prepared by StructuralIntegrity Associates, San Jose, CA, under contract to Sandia National Laboratories (Aug.1994).

NRC FORM 335(2–89)NRCM 1102,
U. S. NUCLEAR REGULATORY COMMISSION 1. REPORT NUMBER (Assigned by NRC. Add Vol., Supp., Rev., and Addendum Numbers, if any.)
3201, 3202 BIBLIOGRAPHIC DATA SHEETNUREG/CR–5704
(See instructions on the reverse) ANL–98/312. TITLE AND SUBTITLE
Effects of LWR Coolant Environments on Fatigue Design Curves of Austenitic
Stainless Steels 3. DATE REPORT PUBLISHED
MONTH YEAR
March 1999
4. FIN OR GRANT NUMBER
W66105. AUTHOR(S) 6. TYPE OF REPORT
O. K. Chopra Technical7. PERIOD COVERED (Inclusive Dates)
8. PERFORMING ORGANIZATION – NAME AND ADDRESS (If NRC, provide Division, Office or Region, U.S. Nuclear Regulatory Commission, and mailing address; if contractor, providename and mailing address.)
Argonne National Laboratory9700 South Cass AvenueArgonne, IL 60439
9. SPONSORING ORGANIZATION – NAME AND ADDRESS (If NRC, type “Same as above”: if contractor, provide NRC Division, Office or Region, U.S. Nuclear Regulatory Commission,and mailing address.)
Engineering Issues BranchOffice of Nuclear Regulatory ResearchU. S. Nuclear Regulatory CommissionWashington, DC 20555
10. SUPPLEMENTARY NOTES
M. McNeil, NRC Project Manager
11. ABSTRACT (200 words or less)
The ASME Boiler and Pressure Vessel Code provides rules for the construction of nuclear power plant components. FiguresI–9.1 through I–9.6 of Appendix I to Section III of the Code specify fatigue design curves for structural materials. Althougheffects of reactor coolant environments are not explicitly addressed by the design curves, test data indicate that the Codefatigue curves may not always be adequate for coolant environments. This report summarizes work performed by ArgonneNational Laboratory on the fatigue of austenitic stainless steels in light water reactor (LWR) environments. Existing fatigueS–N data have been evaluated to establish the effects of various material and loading variables, such as steel type, dissolvedoxygen level, strain range, strain rate, and temperature, on the fatigue lives of these steels. Statistical models are presentedfor estimating the fatigue S–N curves as a function of material, loading, and environmental variables. Design fatigue curveshave been developed for austenitic stainless steel components in LWR environments. The extent of conservatism in thedesign fatigue curves and alternative methods for incorporating the effects of LWR coolant environments into the ASMECode fatigue evaluations are discussed.
12. KEY WORDS/DESCRIPTORS (List words or phrases that will assist researchers in locating this report.) 13. AVAILABILITY STATEMENT
Fatigue Strain–Life Curves Unlimited
Fatigue Design Curves 14. SECURITY CLASSIFICATION
LWR Environments (This Page)
Austenitic Stainless Steels Unclassified
Cast Austenitic Stainless Steels (This Report)
Fatigue Crack Initiation Unclassified15. NUMBER OF PAGES
16. PRICE
NRC FORM 335 (2–89)
Related Documents