Natural Hazards 30: 297–308, 2003. © 2003 Kluwer Academic Publishers. Printed in the Netherlands. 297 Methodology for Landslide Susceptibility Mapping by Means of a GIS. Application to the Contraviesa Area (Granada, Spain) T. FERNÁNDEZ 1 , C. IRIGARAY 2 , R. EL HAMDOUNI 2 and J. CHACÓN 2 1 Departamento de Ingeniería Cartográfica, Geodésica y Fotogrametría. Escuela Politécnica Superior de Jaén. Universidad de Jaén. Virgen de la Cabeza, 2, 23071 Jain, Spain (E-mail: [email protected]); 2 Departamento de Ingeniería Civil. Escuela Técnica Superior de Ingenieros de Caminos, Canales y Puertos. Centro Politécnico de Fuentenueva, Universidad de Granada, 18071, Granada (E-mails: [email protected], [email protected], [email protected]) (Received 23 April 2001; accepted 12 November 2001) Abstract. This article presents a method to map landslide susceptibility in rock massifs using Geo- graphical Information Systems (GIS). The method is based on making an inventory of rupture zones of different types of slope movements and then analysing the bivariate correlation of these with the factors that determine instability. After determining the factors that present the highest correlation with each type of movement, a matrix is created to combine these factors and to determine the per- centage of the rupture zone in each combination, which provides an expression of the susceptibility of the terrain. The map thus obtained is divided into susceptibility classes. The susceptibility maps (made in 1995) for each type of movement are first calibrated with the inventory of the movements from which they are derived (previous to 1995), and subsequently validated by another inventory elaborated after the susceptibility maps (in 1997). In both cases, significant correlation coefficients were obtained (the Goodman–Kruskal coefficients were over 0.8 and sometimes exceeded 0.9). The relative error (degree of accumulated fit for very low to low susceptibility classes) was always less than 5%, while the relative success rate was always above 50%. These results illustrate the adequacy of the method and of the maps obtained. Key words: slope movements, susceptibility maps, GIS, validation, determinant factors, rock massifs. 1. Introduction Of all geological risks, landslides are among those that cause most damage, pro- ducing thousands of deaths every year and material losses of billions of dollars (Brabb, 1991). Among the measures that have been taken to reduce these losses are the creation of maps of susceptibility, danger and risk (Brabb, 1984; Ayala, 1987; Corominas, 1987; Chacón et al., 1992, 1994, 1996). These maps are elaborated by means of deterministic and non-deterministic (probabilistic) models. The probab- ilistic ones are more frequently used, and so a large number of methodologies have been developed (Rengers et al., 1998), based on the inventory of landslides, geo-

Welcome message from author
This document is posted to help you gain knowledge. Please leave a comment to let me know what you think about it! Share it to your friends and learn new things together.
Transcript
Natural Hazards 30: 297–308, 2003.© 2003 Kluwer Academic Publishers. Printed in the Netherlands.
297
Methodology for Landslide Susceptibility Mappingby Means of a GIS. Application to the ContraviesaArea (Granada, Spain)
T. FERNÁNDEZ1, C. IRIGARAY2, R. EL HAMDOUNI2 and J. CHACÓN2
1Departamento de Ingeniería Cartográfica, Geodésica y Fotogrametría. Escuela PolitécnicaSuperior de Jaén. Universidad de Jaén. Virgen de la Cabeza, 2, 23071 Jain, Spain (E-mail:[email protected]); 2Departamento de Ingeniería Civil. Escuela Técnica Superior de Ingenieros deCaminos, Canales y Puertos. Centro Politécnico de Fuentenueva, Universidad de Granada, 18071,Granada (E-mails: [email protected], [email protected], [email protected])
(Received 23 April 2001; accepted 12 November 2001)
Abstract. This article presents a method to map landslide susceptibility in rock massifs using Geo-graphical Information Systems (GIS). The method is based on making an inventory of rupture zonesof different types of slope movements and then analysing the bivariate correlation of these with thefactors that determine instability. After determining the factors that present the highest correlationwith each type of movement, a matrix is created to combine these factors and to determine the per-centage of the rupture zone in each combination, which provides an expression of the susceptibilityof the terrain. The map thus obtained is divided into susceptibility classes. The susceptibility maps(made in 1995) for each type of movement are first calibrated with the inventory of the movementsfrom which they are derived (previous to 1995), and subsequently validated by another inventoryelaborated after the susceptibility maps (in 1997). In both cases, significant correlation coefficientswere obtained (the Goodman–Kruskal coefficients were over 0.8 and sometimes exceeded 0.9). Therelative error (degree of accumulated fit for very low to low susceptibility classes) was always lessthan 5%, while the relative success rate was always above 50%. These results illustrate the adequacyof the method and of the maps obtained.
Key words: slope movements, susceptibility maps, GIS, validation, determinant factors, rockmassifs.
1. Introduction
Of all geological risks, landslides are among those that cause most damage, pro-ducing thousands of deaths every year and material losses of billions of dollars(Brabb, 1991). Among the measures that have been taken to reduce these losses arethe creation of maps of susceptibility, danger and risk (Brabb, 1984; Ayala, 1987;Corominas, 1987; Chacón et al., 1992, 1994, 1996). These maps are elaborated bymeans of deterministic and non-deterministic (probabilistic) models. The probab-ilistic ones are more frequently used, and so a large number of methodologies havebeen developed (Rengers et al., 1998), based on the inventory of landslides, geo-
298 T. FERNANDEZ ET AL.
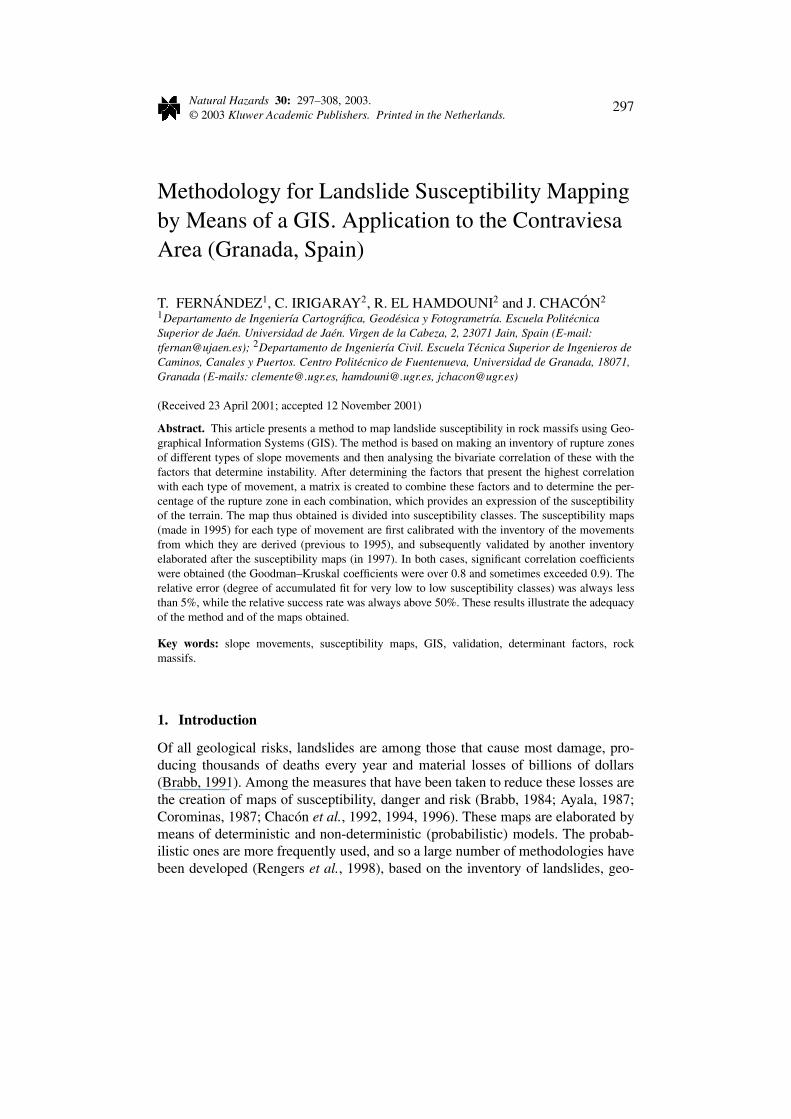
Figure 1. Location of the study area.
morphological analysis, qualitative and statistical bivariate analysis (Brabb et al.,1972; Degraff and Romersburg, 1980; Jade and Sarkar, 1993; Chung and Fabbri,1993; Irigaray, 1995) and multivariate analysis (Carrara, 1983; Carrara et al., 1991;Baeza, 1994; Chung et al., 1995).
This article presents a bivariate analysis methodology to obtain maps oflandslide susceptibility (spatial prediction) developed on the SPANS GeographicInformation System (GIS) (Intera-Tydac, 1993). The methodology is easy to applyand implement completely on a GIS; any type of variable (qualitative or quantit-ative) can be used for the analysis; moreover, it produced the best results in thecalibration and validation of the different methods applied in the study zone (Con-traviesa area) and at the work scale (1 : 25,000) (Fernández et al., 2000; Fernández,2001).
The methodology has been also calibrated for other sectors of the Betic Cor-dillera and for different materials, including both rock massifs of metamorphicorigin (Fernández et al., 1994, 1996, 1997, 2000; El Hamdouni et al., 1996), andsoils (Irigaray, 1995; Irigaray et al., 1997, 1999a).
2. Location of the Study Area
The study zone covers an area of 94 km2 and is located on the northern slopes ofthe Contraviesa and Lújar mountains in the province of Granada (Spain), boundedto the north by the Alpujarra valley and to the south by the Mediterranean coast(Figure 1).
From a geological standpoint, this area is part of the Alpujárride Complexwithin the inner zone of the Betic Cordillera. This complex forms a series of unitssuperimposed by thrusting and low-angled normal faults. The outcropping materi-als are Paleozoic dark schists and quartzites, Permotriassic phyllites and quartzites,and Triassic marbles and dolostones (Aldaya et al., 1979).
METHODOLOGY FOR LANDSLIDE SUSCEPTIBILITY MAPPING 299
3. Methodology
The methodology employed to map landslide susceptibility was as follows (Chacónet al., 1992, 1994, 1996):
– Make the inventory and data base of slope movements– Analyse the factors that determine susceptibility– Create the susceptibility maps
Finally, the maps were calibrated and validated (Fernández et al., 1997, 2000;Irigaray et al., 1997, 1999a).
3.1. INVENTORY OF LANDSLIDES
This was carried out by means of interpretation of aerial photography (correspond-ing to a flight made by the Regional Government of Andalucía in 1992) and groundsurveys, during 1993–1994, before the heavy rainfall of 1996–1997.
Various types of slope movements were identified, according to the mechanismof movement (falls, slides, flow), size and materials involved. These were thengrouped into a series of basic types (Varnes, 1978; Corominas and García-Yague,1997):
– Rock and block falls, caused by the detachment of rock fragments from clifffaces and subsequent movement through the air, by collision, or rolling.
– Debris flows: the rapid movement of detritic materials with predominantlylarge particles, and usually channelled along gullies or ravines. We distin-guished between those comprising carbonate materials and those comprisingmetapelites with a larger proportion of fine materials.
– Collapses. Soil or rock movements with a fundamentally vertical trajectorythrough the rupture surface, on steep slopes, both natural and artificial, afterundermining by a river or disintegration of materials from the base.
– Rock slides maintaining a certain degree of coherence over a plane or gentlycurved surface (translational) or spoon-shaped (rotational) surface.
– Complex movements, with rock falls at the head of the movement due to thepresence of more fragile materials (carbonate rocks).
The field inventory derived from aerial photography was then put on the 1 : 25,000National Topographic Map. For the purposes of our methodology, we distinguishedbetween whole movements and rupture zones (Chacón et al., 1992, 1994, 1996;Irigaray, 1995). The two inventories were digitised and entered into a Geograph-ical Information System (GIS). The first one was used to create the data base ofparameters and characteristics of movements, while the second one was requiredfor all the subsequent analysis, because only the rupture conditions and not thedeposit conditions were statistically analysed for determining the susceptibility.
A similar inventory was made of landslides that occurred or were reactivatedafter the winter rains of 1996–1997. During this period, some rainfall stationsrecorded historical maximum monthly values and considerable instability was pro-duced in the rock slopes in the area (Irigaray et al., 1999b). In this case, too, rupture
300 T. FERNANDEZ ET AL.
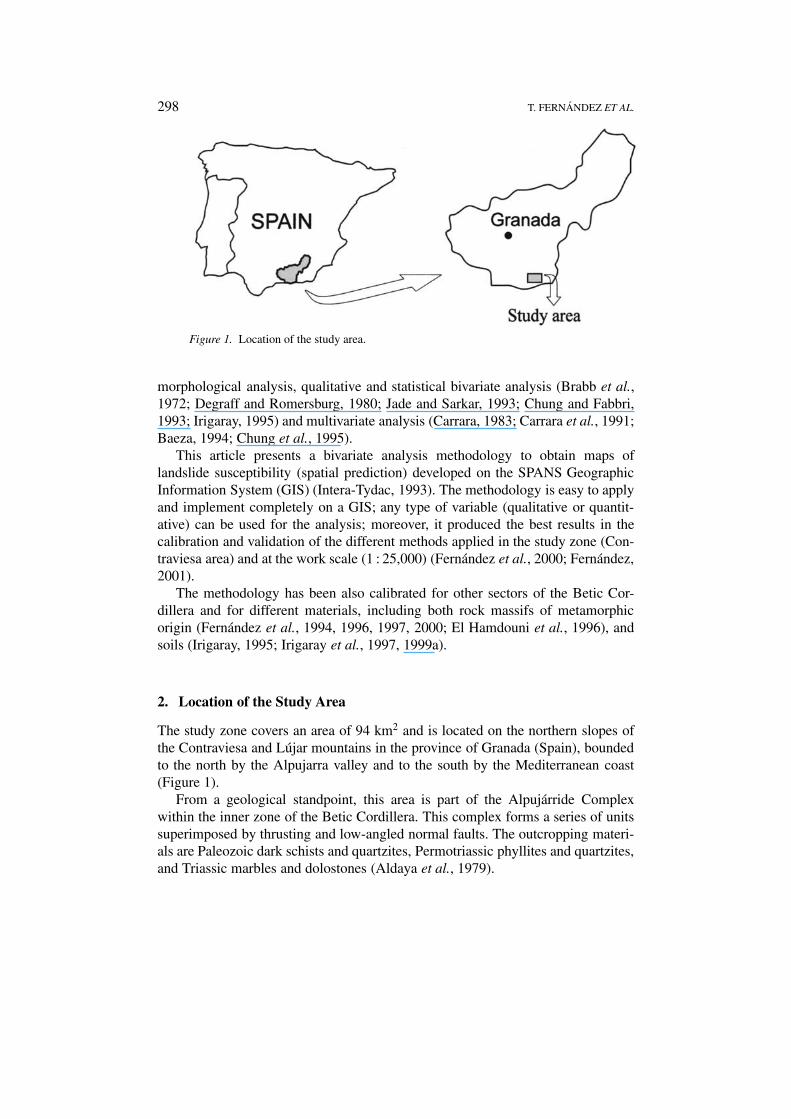
Figure 2. Inventory of slope movements.
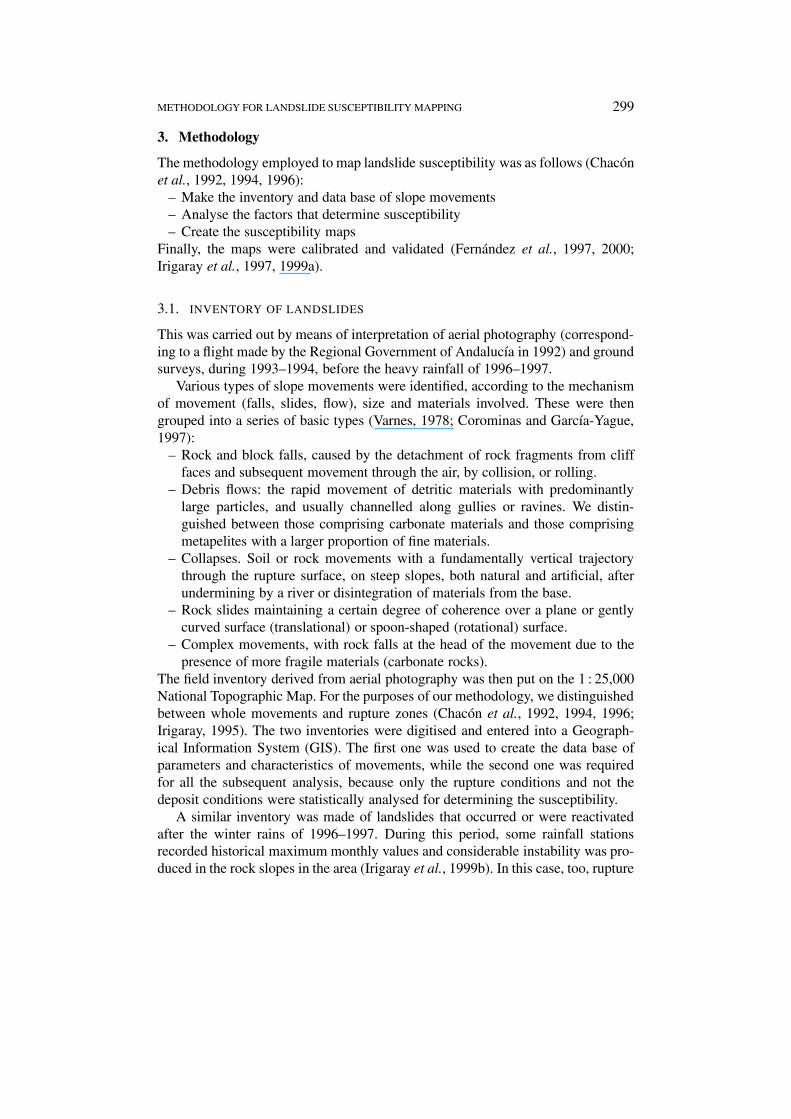
Figure 3. Rockslide susceptibility maps by the matrix method.
zones were distinguished from slope movements for use in subsequent validationof the susceptibility maps.
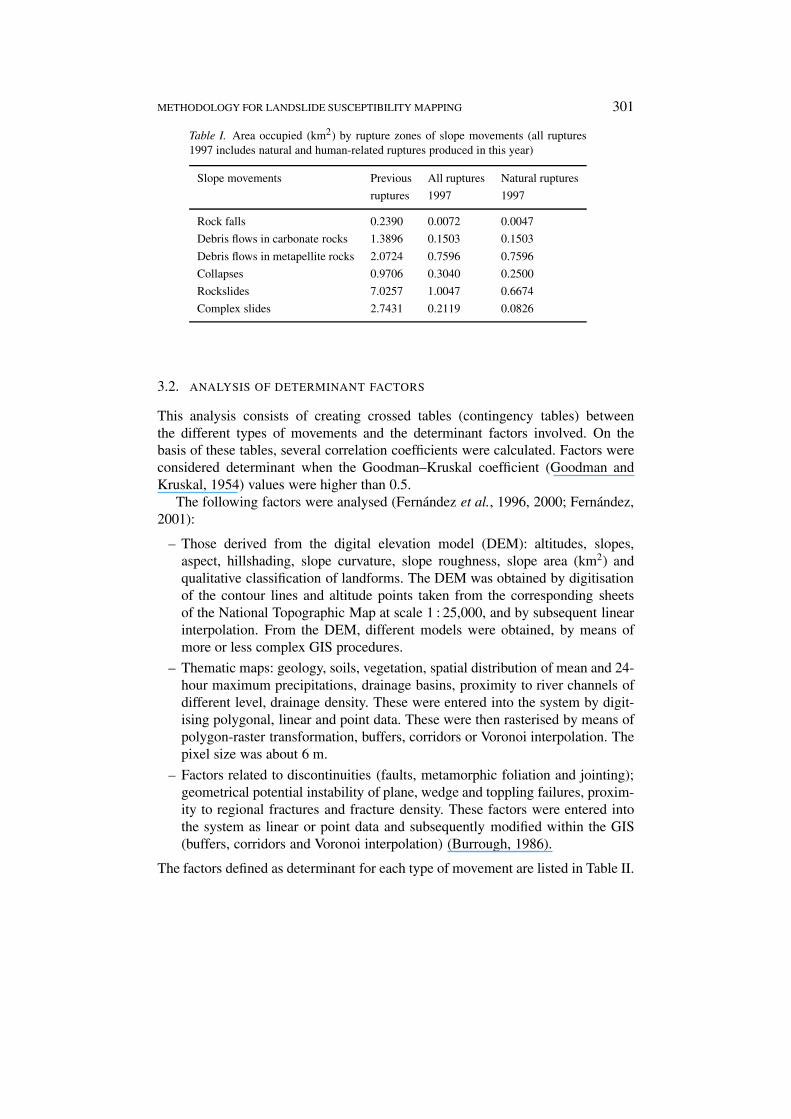
Figure 2 shows the inventory of slope movements in the study area, whileTable I provides the results of the area analysis of the rupture zones, both beforeand after 1997.
METHODOLOGY FOR LANDSLIDE SUSCEPTIBILITY MAPPING 301
Table I. Area occupied (km2) by rupture zones of slope movements (all ruptures1997 includes natural and human-related ruptures produced in this year)
Slope movements Previous All ruptures Natural ruptures
ruptures 1997 1997
Rock falls 0.2390 0.0072 0.0047
Debris flows in carbonate rocks 1.3896 0.1503 0.1503
Debris flows in metapellite rocks 2.0724 0.7596 0.7596
Collapses 0.9706 0.3040 0.2500
Rockslides 7.0257 1.0047 0.6674
Complex slides 2.7431 0.2119 0.0826
3.2. ANALYSIS OF DETERMINANT FACTORS
This analysis consists of creating crossed tables (contingency tables) betweenthe different types of movements and the determinant factors involved. On thebasis of these tables, several correlation coefficients were calculated. Factors wereconsidered determinant when the Goodman–Kruskal coefficient (Goodman andKruskal, 1954) values were higher than 0.5.
The following factors were analysed (Fernández et al., 1996, 2000; Fernández,2001):
– Those derived from the digital elevation model (DEM): altitudes, slopes,aspect, hillshading, slope curvature, slope roughness, slope area (km2) andqualitative classification of landforms. The DEM was obtained by digitisationof the contour lines and altitude points taken from the corresponding sheetsof the National Topographic Map at scale 1 : 25,000, and by subsequent linearinterpolation. From the DEM, different models were obtained, by means ofmore or less complex GIS procedures.
– Thematic maps: geology, soils, vegetation, spatial distribution of mean and 24-hour maximum precipitations, drainage basins, proximity to river channels ofdifferent level, drainage density. These were entered into the system by digit-ising polygonal, linear and point data. These were then rasterised by means ofpolygon-raster transformation, buffers, corridors or Voronoi interpolation. Thepixel size was about 6 m.
– Factors related to discontinuities (faults, metamorphic foliation and jointing);geometrical potential instability of plane, wedge and toppling failures, proxim-ity to regional fractures and fracture density. These factors were entered intothe system as linear or point data and subsequently modified within the GIS(buffers, corridors and Voronoi interpolation) (Burrough, 1986).
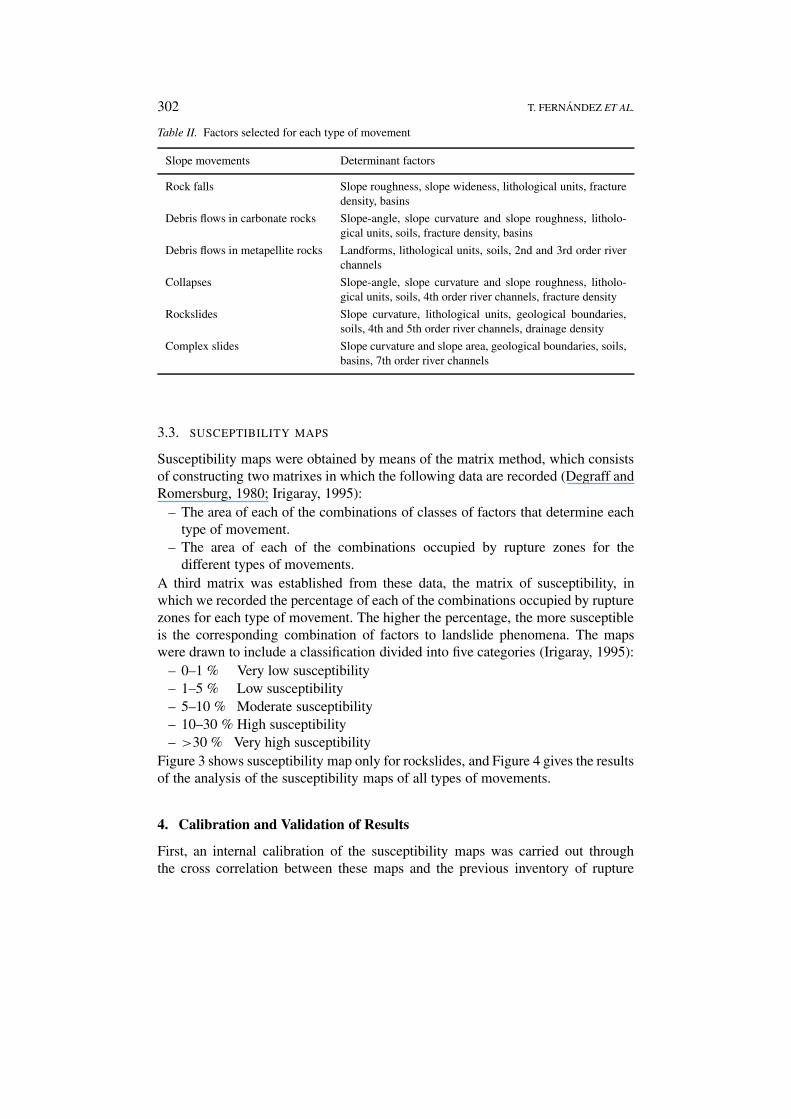
The factors defined as determinant for each type of movement are listed in Table II.
302 T. FERNANDEZ ET AL.
Table II. Factors selected for each type of movement
Slope movements Determinant factors
Rock falls Slope roughness, slope wideness, lithological units, fracturedensity, basins
Debris flows in carbonate rocks Slope-angle, slope curvature and slope roughness, litholo-gical units, soils, fracture density, basins
Debris flows in metapellite rocks Landforms, lithological units, soils, 2nd and 3rd order riverchannels
Collapses Slope-angle, slope curvature and slope roughness, litholo-gical units, soils, 4th order river channels, fracture density
Rockslides Slope curvature, lithological units, geological boundaries,soils, 4th and 5th order river channels, drainage density
Complex slides Slope curvature and slope area, geological boundaries, soils,basins, 7th order river channels
3.3. SUSCEPTIBILITY MAPS
Susceptibility maps were obtained by means of the matrix method, which consistsof constructing two matrixes in which the following data are recorded (Degraff andRomersburg, 1980; Irigaray, 1995):
– The area of each of the combinations of classes of factors that determine eachtype of movement.
– The area of each of the combinations occupied by rupture zones for thedifferent types of movements.
A third matrix was established from these data, the matrix of susceptibility, inwhich we recorded the percentage of each of the combinations occupied by rupturezones for each type of movement. The higher the percentage, the more susceptibleis the corresponding combination of factors to landslide phenomena. The mapswere drawn to include a classification divided into five categories (Irigaray, 1995):
– 0–1 % Very low susceptibility– 1–5 % Low susceptibility– 5–10 % Moderate susceptibility– 10–30 % High susceptibility– >30 % Very high susceptibility
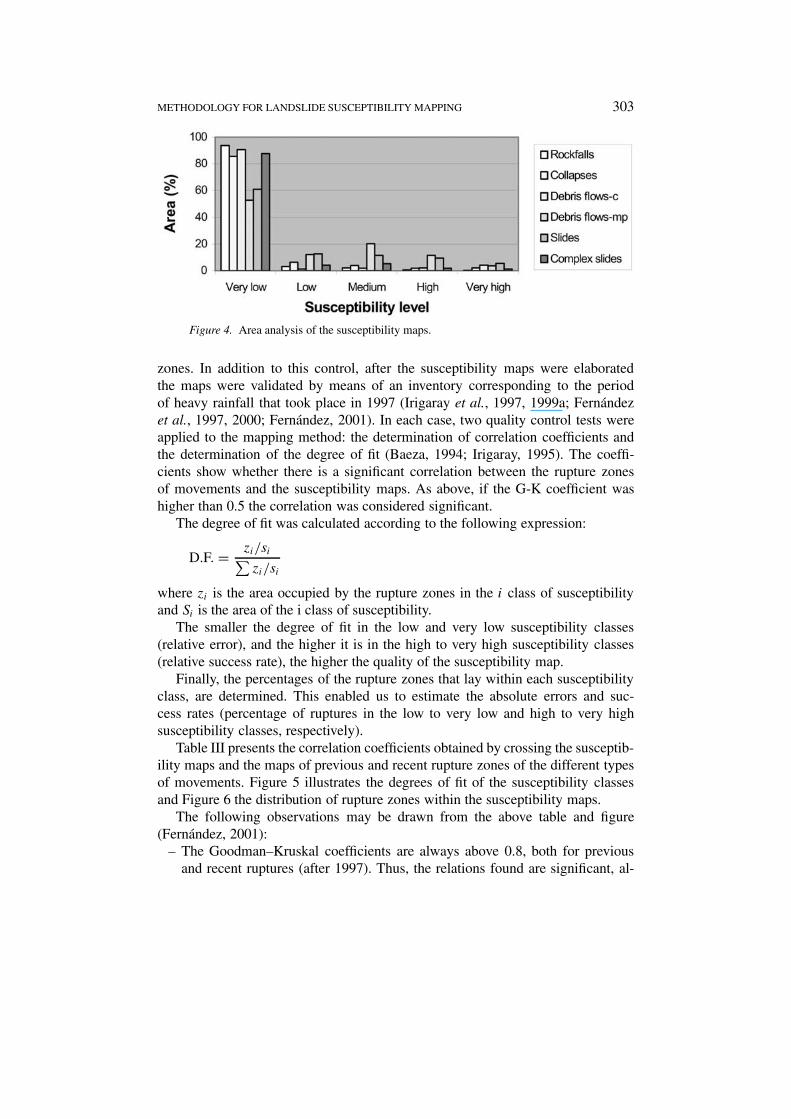
Figure 3 shows susceptibility map only for rockslides, and Figure 4 gives the resultsof the analysis of the susceptibility maps of all types of movements.
4. Calibration and Validation of Results
First, an internal calibration of the susceptibility maps was carried out throughthe cross correlation between these maps and the previous inventory of rupture
METHODOLOGY FOR LANDSLIDE SUSCEPTIBILITY MAPPING 303
Figure 4. Area analysis of the susceptibility maps.
zones. In addition to this control, after the susceptibility maps were elaboratedthe maps were validated by means of an inventory corresponding to the periodof heavy rainfall that took place in 1997 (Irigaray et al., 1997, 1999a; Fernándezet al., 1997, 2000; Fernández, 2001). In each case, two quality control tests wereapplied to the mapping method: the determination of correlation coefficients andthe determination of the degree of fit (Baeza, 1994; Irigaray, 1995). The coeffi-cients show whether there is a significant correlation between the rupture zonesof movements and the susceptibility maps. As above, if the G-K coefficient washigher than 0.5 the correlation was considered significant.
The degree of fit was calculated according to the following expression:
D.F. = zi/si∑
zi/si
where zi is the area occupied by the rupture zones in the i class of susceptibilityand Si is the area of the i class of susceptibility.
The smaller the degree of fit in the low and very low susceptibility classes(relative error), and the higher it is in the high to very high susceptibility classes(relative success rate), the higher the quality of the susceptibility map.
Finally, the percentages of the rupture zones that lay within each susceptibilityclass, are determined. This enabled us to estimate the absolute errors and suc-cess rates (percentage of ruptures in the low to very low and high to very highsusceptibility classes, respectively).
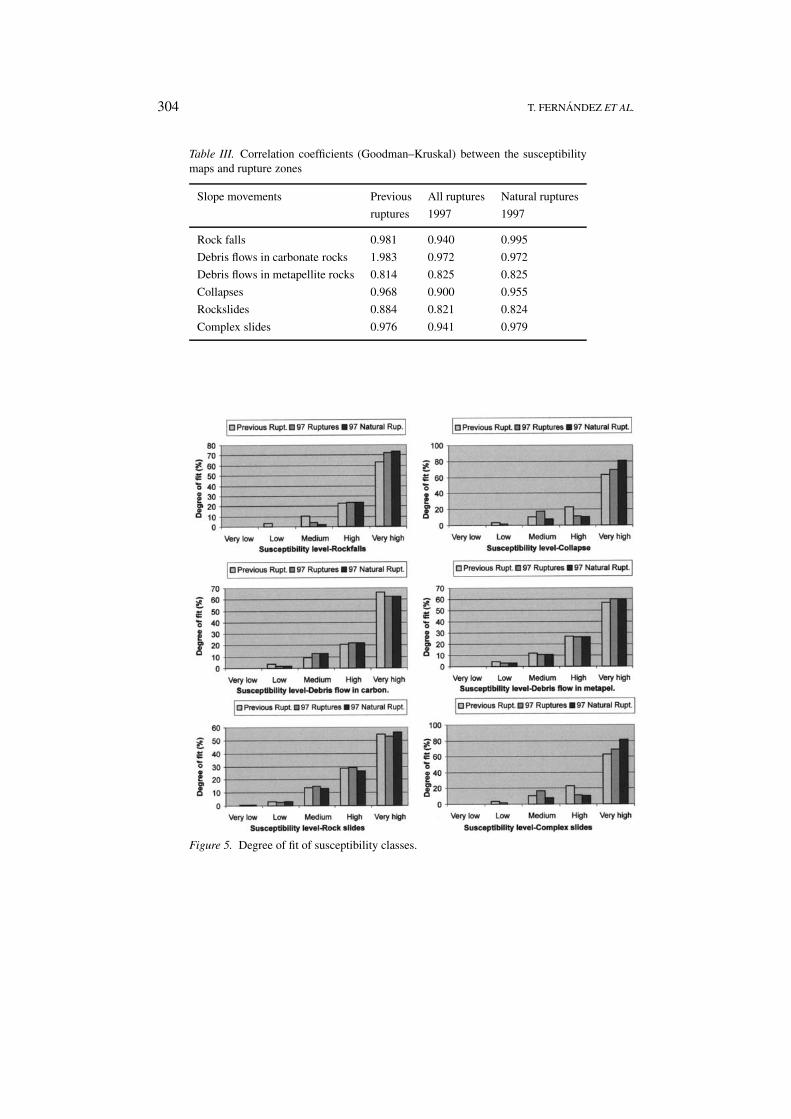
Table III presents the correlation coefficients obtained by crossing the susceptib-ility maps and the maps of previous and recent rupture zones of the different typesof movements. Figure 5 illustrates the degrees of fit of the susceptibility classesand Figure 6 the distribution of rupture zones within the susceptibility maps.
The following observations may be drawn from the above table and figure(Fernández, 2001):
– The Goodman–Kruskal coefficients are always above 0.8, both for previousand recent ruptures (after 1997). Thus, the relations found are significant, al-
304 T. FERNANDEZ ET AL.
Table III. Correlation coefficients (Goodman–Kruskal) between the susceptibilitymaps and rupture zones
Slope movements Previous All ruptures Natural ruptures
ruptures 1997 1997
Rock falls 0.981 0.940 0.995
Debris flows in carbonate rocks 1.983 0.972 0.972
Debris flows in metapellite rocks 0.814 0.825 0.825
Collapses 0.968 0.900 0.955
Rockslides 0.884 0.821 0.824
Complex slides 0.976 0.941 0.979
Figure 5. Degree of fit of susceptibility classes.
METHODOLOGY FOR LANDSLIDE SUSCEPTIBILITY MAPPING 305
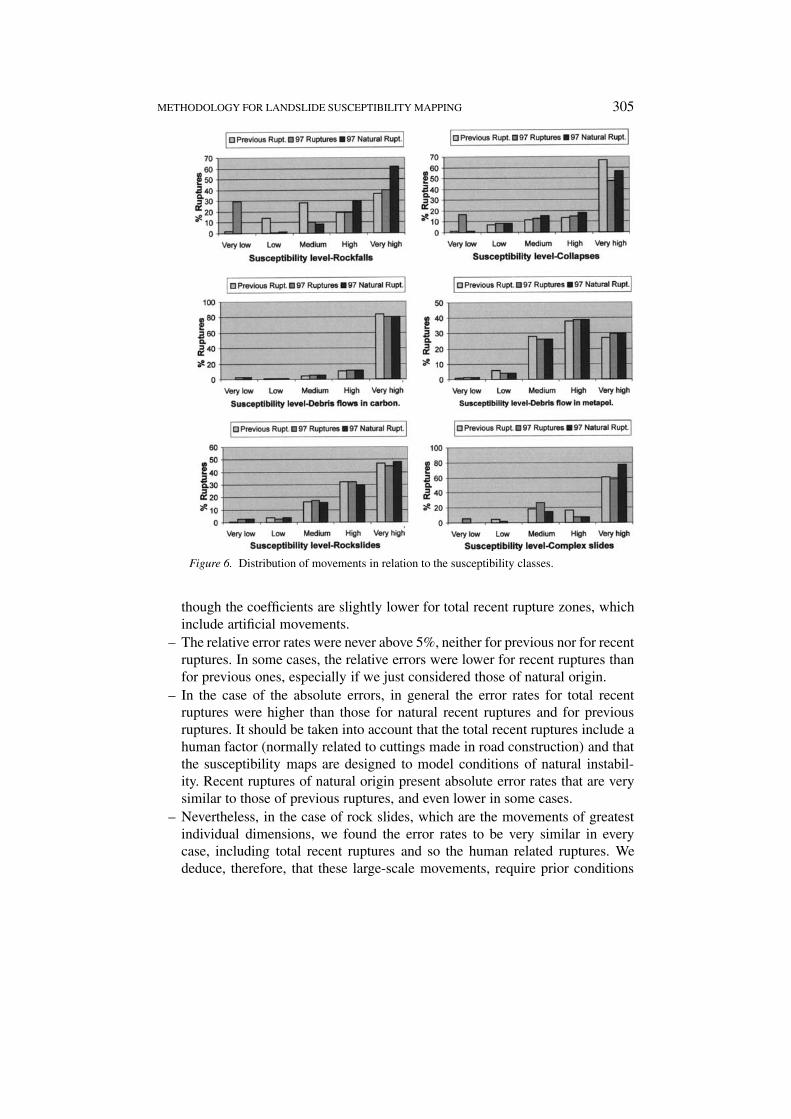
Figure 6. Distribution of movements in relation to the susceptibility classes.
though the coefficients are slightly lower for total recent rupture zones, whichinclude artificial movements.
– The relative error rates were never above 5%, neither for previous nor for recentruptures. In some cases, the relative errors were lower for recent ruptures thanfor previous ones, especially if we just considered those of natural origin.
– In the case of the absolute errors, in general the error rates for total recentruptures were higher than those for natural recent ruptures and for previousruptures. It should be taken into account that the total recent ruptures include ahuman factor (normally related to cuttings made in road construction) and thatthe susceptibility maps are designed to model conditions of natural instabil-ity. Recent ruptures of natural origin present absolute error rates that are verysimilar to those of previous ruptures, and even lower in some cases.
– Nevertheless, in the case of rock slides, which are the movements of greatestindividual dimensions, we found the error rates to be very similar in everycase, including total recent ruptures and so the human related ruptures. Wededuce, therefore, that these large-scale movements, require prior conditions
306 T. FERNANDEZ ET AL.
of instability, irrespective of human action. In smaller ruptures a small changein stability conditions may produce the movement, even in zones of lowsusceptibility.
– In any case, rarely was an absolute error rate of more than 10% recorded (onlyin recent total rock falls and collapses).
– Similar comments apply to absolute success rates, as these are highest whenthe error rate is lowest, and vice versa.
In general, the above results are indicative of the high quality of the maps obtained,for all types of movements analysed in the study area.
5. Conclusion
The controls performed on the susceptibility maps obtained by the matrix methodshow that both the method and the maps themselves are of generally high qualityfor all types of movements, and therefore can be said to provide a correct model ofthe natural susceptibility of the terrain to landslides.
The Goodman–Kruskal correlation coefficients were always lower than 0.8. Thedegree of fit showed that the relative error rate was always below 5%, while theabsolute error rate only exceeded 10% in a few cases of small-scale movementsthat were artificial in origin. Large-scale movements (landslides) are predicted evenin the case of human involvement. The entire methodology applied is perfectlysuitable for development within a Geographic Information System. The methodis a simple one, and it can incorporate various types of variables or factors, evenqualitative ones.
The quality of the final maps obtained, apart from the qualities of the methodapplied, will depend on the inventory of slope movements and on the determinantfactors incorporated (derived from DEM and thematic maps).
Acknowledgements
This study was financed by the CICYT project “Landslide susceptibility mappingby Geographic Information Systems”.
References
Aldaya, F. Martínez-García, E., Avidad, J., García-Dueñas, V., Navarro-Vila, F., Gallegos, J., Díazde Federico, A., and Puga, E.: 1979, Mapa Geológico de España 1 : 50.000 (2a Serie), hoja 1042(Lanjarón), IGME, Madrid, Spain, 65 pp.
Ayala, F. J.: 1987, Introducción a los riesgos geológicos, in F. J. Ayala (ed.), Riesgos Geológicos,IGME, Serie Geología Ambiental, Madrid, Spain, pp. 3–19.
Baeza, C.: 1994, Evaluación de las condiciones de rotura y la movilidad de los deslizamientossuperficiales mediante el uso de técnicas de análisis multivariante, Tesis Univ. Pol. Catalunya.
Brabb, E. E.: 1984, Innovative approaches to landslide hazard and risk mapping, 4th Int. Symposiumon Landslides, Vol. 1, Toronto, pp. 307–324.
Brabb, E. E.: 1991, The World Landslide Problem, Episodes 14(1), 52–61.
METHODOLOGY FOR LANDSLIDE SUSCEPTIBILITY MAPPING 307
Brabb, E. E., Pampeyan, E. H., and Bonilla, M.: 1972, Landslide Susceptibility in the San MateoCounty, California, scale 1 : 62.500, U.S. Geol. Survey Misc. Field Studies Map MF344.
Burrough, P.: 1986, Principles of Geographical Information Systems for Land Resources Assessment,Oxford University Press, 194 pp.
Carrara, A.: 1983, Multivariate models for landslide hazard evaluation, Mathematical Geology 15(3),403–426.
Carrara, A., Cardinali, M., Detti, R., Guzzeti, F., Pasqui, V., and Reichenbach, P.: 1991, GIS tech-niques and statistical models in evaluating landslide hazards, Earth Surface Processes andLandforms 16, 427–445.
Chacón, J., Irigaray, C., and Fernández, T.: 1992, Metodología para la cartografía regional de movi-mientos de ladera y riesgos asociados mediante un Sistema de Información Geográfíca, in J.Corominas and E. Alonso (eds.), III Simposio Nacional sobre Taludes y Laderas Inestables, Vol.1, La Coruña, Spain, pp. 121–133.
Chacón, J., Irigaray, C., and Fernández, T.: 1994, Large to middle scale landslide inventory, analysisand mapping with modelling and assessment of derived susceptibility, hazards and risks in a GIS,Proceedings of 7th IAEG Congress, Balkema, Rotterdam, Holland, pp. 4669–4678.
Chacón, J., Irigaray, C., and Fernández, T.: 1996, From the inventory to the risk analysis: Im-provements to a large scale GIS method, in J. Chacón, C. Irigaray, and T. Fernández (eds.),Proceedings of 8th International Conference and Field Workshop on Landslides, Balkema,Rotterdam, Holland, pp. 335–342.
Chung, C. F. and Fabbri, A. G.: 1993, The representation of geoscience information for dataintegration, Nonrenewable Resources 2(2), 122–139.
Chung, C. F., Fabbri, A. G., and van Westen, C. J.: 1995, Multivariate regression analysis for land-slide hazard zonation, in A. Carrara and F. Guzzetti (eds.), Geographical Information Systems inAssessing Natural Hazards, Kluwer Publishers, Dordrecht.
Corominas, J.: 1987, Criterios para la confección de mapas de peligrosidad de movimientos de ladera,in F. J. Ayala (ed.), Riesgos Geológicos, IGME, Serie Geología Ambiental, Madrid, Spain, pp.193–201.
Corominas, J. and García-Yagüe, A.: 1997, Terminología de los movimientos de ladera, in J. Corom-inas, E. Alonso and J. Chacón (eds.), IV Simposio Nacional de Taludes y Laderas Inestables, Vol.3, Granada, pp. 1051–1072.
Degraff, J. V. and Romersburg, H. C.: 1980, Regional landslide-susceptibility for wildland manage-ment: A matrix approach, in Coates and Vitek (eds.), pp. 410–414.
El Hamdouni, R., Irigaray, C., Fernandez, T., and Chacón, J.: 1996, Landslides inventory anddetermining factor in the Albuñuelas river basin (Granada, Spain), in J. Chacón, C. Irigarayand T. Fernández (eds.), Proceedings of 8th International Conference and Field Workshop onLandslides, Balkema, Rotterdam, Holland, pp. 21–30.
Fernández, T.: 2001, Cartografía, análisis y modelado de la susceptibilidad a los movimientos deladera en macizos rocosos mediante SIG: Aplicación a diversos sectores del Sur de la provinciade Granada, Tesis Doctoral, University Granada, 648 pp.
Fernández, T., Irigaray, C., and Chacón, J.: 1994, Large scale analysis and mapping of determin-ant factors of landsliding affecting rock massifs in the eastern Costa del Sol (Granada, Spain),Proceedings of 7th International IAEG Congress, Balkema, Rotterdam, Holland, pp. 4679–4685.
Fernández, T., Irigaray, C., and Chacón, J.: 1996, GIS analysis and mapping of landslides determ-inant factors in the Contraviesa area (Granada, Southern Spain), in J. Chacón, C. Irigaray, andT. Fernández (eds.), Proceedings of 8th International Conference and Fieldtrip on Landslides,Balkema, Rotterdam, Holland, pp. 141–151.
Fernández, T., El Hamdouni, R., Irigaray, C., and Chacón, J.: 1997, Validación de un método decartografía de movimientos de ladera y susceptibilidad mediante un SIG en un sector de lascuencas de los ríos Guadalfeo e Izbor, in J. Corominas, E. Alonso, and J. Chacón (eds.), IVSimposio Nacional sobre Taludes y Laderas Inestables, Vol I, Granada, Spain, pp. 51–63.
308 T. FERNANDEZ ET AL.
Fernández, T., El Hamdouni, R., Irigaray, C., and Chacón, J.: 2000, Metodología para la elaboraciónde cartografía de susceptibilidad a los movimientos de ladera, Colegio Oficial de IngenieriosTécnicos en Topografía, ed., VII Congreso Nacional de Topografía y Cartografía, TOP-CART2000, Madrid, Spain, pp. 610–620.
Goodman, L. A. and Kruskal, W. H.: 1954, Measures of association for cross classifications, J. Am.Statist. Assoc. 49, 732–764.
Intera-Tydac.: 1993, SPANS GIS Reference Manual, Intera-Tydac Technologies. Inc.Irigaray, C.: 1995, Movimientos de ladera: inventario, análisis y cartografáa de susceptibilidad
mediante un Sistema de Información Geográfíca. Aplicación a las zonas de Colmenar (Ma),Rute (Co) y Montefrío (Gr), Tesis Doctoral, University Granada.
Irigaray, C., Fernández, T., and Chacón, J.: 1997, Validación de un método de análisis de la suscept-ibilidad a los movimientos de ladera. Aplicación al sector de Rute, in J. Corominas, E. Alonso,and J. Chacón (eds.), IV Simposio Nacional sobre Taludes y Laderas Inestables, Granada, Vol.1, Granada, Spain, pp. 39–49.
Irigaray, C., Fernández, T., El Hamdouni, R., and Chacón, J.: 1999a, Verification of landslidesusceptibility mapping: A case study, Earth Surface Processes and Landforms 24, 537–544.
Irigaray, C., Lamas, F., El Hamdouni, R., Fernández, T., and Chacón, J.: 1999b, Slope movementstriggered by heavy rainfall, October 1996 to March 1997 in South-Eastern Spain, NaturalHazards 21, 65–81.
Jade, S. and Sarkar, S.: 1993, Statistical models for slope instability classification, EngineeringGeology 36, 91–98.
Rengers, N., van Westen, C. J., Chacón, J., and Irigaray, C.: 1998, Draft for the chapter on theapplication of digital techniques for natural hazard zonation, Report on Mapping of NaturalHazards, International Association of Engineering Geology. Commission No. 1 on EngineeringGeological Mapping.
Varnes, D. J.: 1978, Slope movements types and processes, in R. L. Schuster and R. J. Krizek (eds.),Landslides: Analysis and Control, National Academy of Sciences, Transportation ResearchBoard, Washington DC, Special Report 176, 2, pp. 11–33.
Related Documents