Estimating the quality of landslide susceptibility models Fausto Guzzetti ⁎ , Paola Reichenbach, Francesca Ardizzone, Mauro Cardinali, Mirco Galli IRPI CNR, via Madonna Alta 126, 06128 Perugia, Italy Received 18 July 2005; received in revised form 13 November 2005; accepted 19 April 2006 Available online 22 May 2006 Abstract We present a landslide susceptibility model for the Collazzone area, central Italy, and we propose a framework for evaluating the model reliability and prediction skill. The landslide susceptibility model was obtained through discriminant analysis of 46 thematic environmental variables and using the presence of shallow landslides obtained from a multi-temporal inventory map as the dependent variable for statistical analysis. By comparing the number of correctly and incorrectly classified mapping units, it is established that the model classifies 77.0% of 894 mapping units correctly. Model fitting performance is investigated by comparing the proportion of the study area in each probability class with the corresponding proportion of landslide area. We then prepare an ensemble of 350 landslide susceptibility models using the same landslide and thematic information but different numbers of mapping units. This ensemble is exploited to investigate the model reliability, including the role of the thematic variables used to construct the model, and the model sensitivity to changes in the input data. By studying the variation of the model's susceptibility estimate, the error associated with the susceptibility assessment for each mapping unit is determined. This result is shown on a map that complements the landslide susceptibility map. Prediction skill of the susceptibility model is then estimated by comparing the forecast with two recent event inventory maps. The susceptibility model is found capable of predicting the newly triggered landslides. A general framework for testing a susceptibility model is proposed, including a scheme for ranking the quality of the susceptibility assessment. © 2006 Elsevier B.V. All rights reserved. Keywords: Landslide susceptibility; Statistically based model; Discriminant analysis; Quality; Uncertainty; Validation; Landslide prediction; Map 1. Introduction Susceptibility is the propensity of an area to generate landslides. In mathematical form, landslide susceptibil- ity is the probability of spatial occurrence of known slope failures, given a set of geoenvironmental condi- tions (Guzzetti et al., 2005). Assuming landslides will occur in the future because of the same conditions that produced them in the past (Guzzetti et al., 1999), susceptibility assessments can be used to predict the geographical location of future landslides (Chung and Fabbri, 1999; Guzzetti et al., 2005). Many methods have been proposed to evaluate landslide susceptibility at the basin scale, including direct geomorphological map- ping, heuristic approaches, statistical classification methods and physically based models (Carrara et al., 1995; Soeters and van Westen, 1996; Chung and Fabbri, 1999; Guzzetti et al., 1999, and references therein). Statistical classification methods are particularly suited to determining landslide susceptibility over large and complex areas (e.g., Cardinali et al., 2002). Such methods provide quantitative estimates of “where” Geomorphology 81 (2006) 166 – 184 www.elsevier.com/locate/geomorph ⁎ Corresponding author. Tel.: +39 075 5014 413; fax: +39 075 5014 420. E-mail address: [email protected] (F. Guzzetti). 0169-555X/$ - see front matter © 2006 Elsevier B.V. All rights reserved. doi:10.1016/j.geomorph.2006.04.007

Welcome message from author
This document is posted to help you gain knowledge. Please leave a comment to let me know what you think about it! Share it to your friends and learn new things together.
Transcript
2006) 166–184www.elsevier.com/locate/geomorph
Geomorphology 81 (
Estimating the quality of landslide susceptibility models
Fausto Guzzetti ⁎, Paola Reichenbach, Francesca Ardizzone, Mauro Cardinali, Mirco Galli
IRPI CNR, via Madonna Alta 126, 06128 Perugia, Italy
Received 18 July 2005; received in revised form 13 November 2005; accepted 19 April 2006Available online 22 May 2006
Abstract
We present a landslide susceptibility model for the Collazzone area, central Italy, and we propose a framework for evaluatingthe model reliability and prediction skill. The landslide susceptibility model was obtained through discriminant analysis of 46thematic environmental variables and using the presence of shallow landslides obtained from a multi-temporal inventory map as thedependent variable for statistical analysis. By comparing the number of correctly and incorrectly classified mapping units, it isestablished that the model classifies 77.0% of 894 mapping units correctly. Model fitting performance is investigated by comparingthe proportion of the study area in each probability class with the corresponding proportion of landslide area. We then prepare anensemble of 350 landslide susceptibility models using the same landslide and thematic information but different numbers ofmapping units. This ensemble is exploited to investigate the model reliability, including the role of the thematic variables used toconstruct the model, and the model sensitivity to changes in the input data. By studying the variation of the model's susceptibilityestimate, the error associated with the susceptibility assessment for each mapping unit is determined. This result is shown on a mapthat complements the landslide susceptibility map. Prediction skill of the susceptibility model is then estimated by comparing theforecast with two recent event inventory maps. The susceptibility model is found capable of predicting the newly triggeredlandslides. A general framework for testing a susceptibility model is proposed, including a scheme for ranking the quality of thesusceptibility assessment.© 2006 Elsevier B.V. All rights reserved.
Keywords: Landslide susceptibility; Statistically based model; Discriminant analysis; Quality; Uncertainty; Validation; Landslide prediction; Map
1. Introduction
Susceptibility is the propensity of an area to generatelandslides. In mathematical form, landslide susceptibil-ity is the probability of spatial occurrence of knownslope failures, given a set of geoenvironmental condi-tions (Guzzetti et al., 2005). Assuming landslides willoccur in the future because of the same conditions thatproduced them in the past (Guzzetti et al., 1999),
⁎ Corresponding author. Tel.: +39 075 5014 413; fax: +39 075 5014420.
E-mail address: [email protected] (F. Guzzetti).
0169-555X/$ - see front matter © 2006 Elsevier B.V. All rights reserved.doi:10.1016/j.geomorph.2006.04.007
susceptibility assessments can be used to predict thegeographical location of future landslides (Chung andFabbri, 1999; Guzzetti et al., 2005). Many methods havebeen proposed to evaluate landslide susceptibility at thebasin scale, including direct geomorphological map-ping, heuristic approaches, statistical classificationmethods and physically based models (Carrara et al.,1995; Soeters and van Westen, 1996; Chung and Fabbri,1999; Guzzetti et al., 1999, and references therein).Statistical classification methods are particularly suitedto determining landslide susceptibility over large andcomplex areas (e.g., Cardinali et al., 2002). Suchmethods provide quantitative estimates of “where”
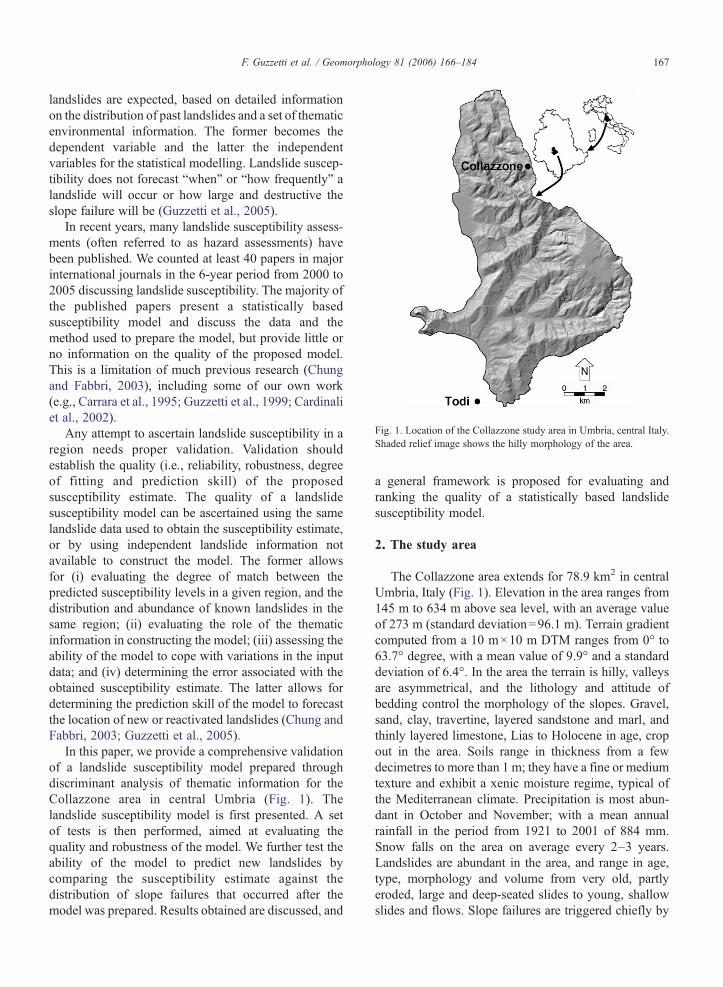
Fig. 1. Location of the Collazzone study area in Umbria, central Italy.Shaded relief image shows the hilly morphology of the area.
167F. Guzzetti et al. / Geomorphology 81 (2006) 166–184
landslides are expected, based on detailed informationon the distribution of past landslides and a set of thematicenvironmental information. The former becomes thedependent variable and the latter the independentvariables for the statistical modelling. Landslide suscep-tibility does not forecast “when” or “how frequently” alandslide will occur or how large and destructive theslope failure will be (Guzzetti et al., 2005).
In recent years, many landslide susceptibility assess-ments (often referred to as hazard assessments) havebeen published. We counted at least 40 papers in majorinternational journals in the 6-year period from 2000 to2005 discussing landslide susceptibility. The majority ofthe published papers present a statistically basedsusceptibility model and discuss the data and themethod used to prepare the model, but provide little orno information on the quality of the proposed model.This is a limitation of much previous research (Chungand Fabbri, 2003), including some of our own work(e.g., Carrara et al., 1995; Guzzetti et al., 1999; Cardinaliet al., 2002).
Any attempt to ascertain landslide susceptibility in aregion needs proper validation. Validation shouldestablish the quality (i.e., reliability, robustness, degreeof fitting and prediction skill) of the proposedsusceptibility estimate. The quality of a landslidesusceptibility model can be ascertained using the samelandslide data used to obtain the susceptibility estimate,or by using independent landslide information notavailable to construct the model. The former allowsfor (i) evaluating the degree of match between thepredicted susceptibility levels in a given region, and thedistribution and abundance of known landslides in thesame region; (ii) evaluating the role of the thematicinformation in constructing the model; (iii) assessing theability of the model to cope with variations in the inputdata; and (iv) determining the error associated with theobtained susceptibility estimate. The latter allows fordetermining the prediction skill of the model to forecastthe location of new or reactivated landslides (Chung andFabbri, 2003; Guzzetti et al., 2005).
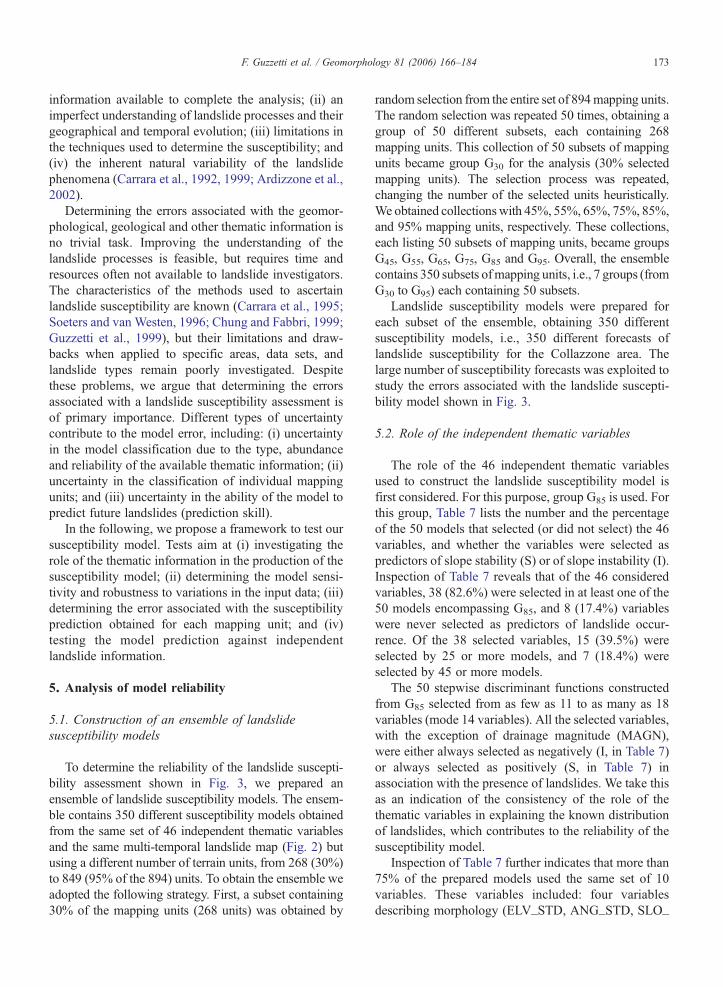
In this paper, we provide a comprehensive validationof a landslide susceptibility model prepared throughdiscriminant analysis of thematic information for theCollazzone area in central Umbria (Fig. 1). Thelandslide susceptibility model is first presented. A setof tests is then performed, aimed at evaluating thequality and robustness of the model. We further test theability of the model to predict new landslides bycomparing the susceptibility estimate against thedistribution of slope failures that occurred after themodel was prepared. Results obtained are discussed, and
a general framework is proposed for evaluating andranking the quality of a statistically based landslidesusceptibility model.
2. The study area
The Collazzone area extends for 78.9 km2 in centralUmbria, Italy (Fig. 1). Elevation in the area ranges from145 m to 634 m above sea level, with an average valueof 273 m (standard deviation=96.1 m). Terrain gradientcomputed from a 10 m×10 m DTM ranges from 0° to63.7° degree, with a mean value of 9.9° and a standarddeviation of 6.4°. In the area the terrain is hilly, valleysare asymmetrical, and the lithology and attitude ofbedding control the morphology of the slopes. Gravel,sand, clay, travertine, layered sandstone and marl, andthinly layered limestone, Lias to Holocene in age, cropout in the area. Soils range in thickness from a fewdecimetres to more than 1 m; they have a fine or mediumtexture and exhibit a xenic moisture regime, typical ofthe Mediterranean climate. Precipitation is most abun-dant in October and November; with a mean annualrainfall in the period from 1921 to 2001 of 884 mm.Snow falls on the area on average every 2–3 years.Landslides are abundant in the area, and range in age,type, morphology and volume from very old, partlyeroded, large and deep-seated slides to young, shallowslides and flows. Slope failures are triggered chiefly by
168 F. Guzzetti et al. / Geomorphology 81 (2006) 166–184
meteorological events, including intense and prolongedrainfall and rapid snow melt.
3. Landslide susceptibility model
For the Collazzone area, we prepared a landslidesusceptibility model using discriminant analysis of 46environmental thematic variables, including morpholo-gy, hydrology, lithology, structure, bedding attitude andland use. To determine landslide susceptibility, wesubdivided the study area into mapping units, i.e.,portions of the ground that contain a set of conditionsthat differ from the adjacent units across distinctboundaries (Guzzetti et al., 1999). To establish theterrain subdivisions, we adopted the approach proposedby Carrara et al. (1991), which has proven to be reliablein predicting landslide susceptibility in Umbria (Carraraet al., 1991, 1995, 1999; Guzzetti et al., 1999; Cardinaliet al., 2002). We obtained the terrain subdivision usingspecialised software that, starting from a 10 m×10 mDTM, generated drainage and divide lines. The DTMwas prepared by automatic interpolation of 10 and 5-minterval contour lines obtained from 1:10,000 scaletopographic maps. By combining the drainage anddivide lines, the software automatically identified 894elementary slopes units (i.e., sub-basins) which repre-sent the mapping units of reference for the determinationof landslide susceptibility in the Collazzone area. Theprocedure also calculated a number of morphologicaland hydrological parameters: some correspond to thoseacquired by traditional methods (e.g., channel length,
Table 1Descriptive statistics of landslide data sets for the Collazzone study area
Inventory Type Number
A Multi-temporal landslideinventory prepared through theinterpretation of five sets ofaerial photographs (Table 2).Landslides are older than 1941to December 2004.
All landslides 2760Deep-seated landslides 363Shallow landslides 2397
B Subset of the multi-temporalinventory showing shallowlandslides and used to preparethe susceptibility model shownin Fig. 3. Landslides are olderthan 1941 to 1996.
Shallow landslides 1759
C Snowmelt induced landslidesoccurred in January 1997(Fig. 10A).
All landslides 413Deep-seated landslides 7Shallow landslides 406
D Rainfall-induced landslidesoccurred in autumn 2004(Fig. 10B).
All landslides 153Deep-seated landslides 1Shallow landslides 152
stream order, link length, etc.); others were specificallydesigned to model the spatial distribution of landslides(e.g., slope unit area, slope unit terrain gradient, slopeunit aspect, slope unit terrain roughness, etc.) (Carrara etal., 1991, 1995).
As the dependent variable for the statistical analysis,we used the presence or absence of shallow landslidesthat occurred before 1997 (Table 1, Fig. 2) in the 894mapping units into which the study area was partitioned.The distribution of landslides was obtained from adetailed, multi-temporal landslide inventory map pre-pared at 1:10,000 scale. The landslide inventory wasprepared through the systematic interpretation of fivesets of aerial photographs (Table 2), supplemented byfield surveys. Two geomorphologists carried out theinterpretation of the aerial photographs in the 5-monthperiod from July to November 2002. The investigatorslooked at each pair of aerial photographs using a mirrorstereoscope (4× magnification) and a continue-zoomstereoscope (3× to 20× magnification). Field surveyscarried out in the period from 1998 to 2004 wereconducted to map new landslides triggered by intense orprolonged rainfall, and to test the inventory obtainedthrough photo-interpretation. The field surveys allowedmapping 230 new or reactivated landslides, most ofwhich occurred in the period from October to December2004. The field surveys also revealed that shallowlandslides are uncommon in forested terrain that covers23.9% of the study area.
In the multi-temporal inventory, landslides wereclassified according to the type of movement, and the
Area
Total (km2) Percent (%) Minimum (m2) Maximum (m2)
12.51 15.8 51 173,5187.70 9.76 3815 173,5186.53 8.28 51 64,691
5.77 7.31 103 43,204
0.78 0.98 78 44,3350.14 0.17 10,199 44,3350.64 0.81 78 98820.38 0.48 51 47,8840.05 0.06 47,884 47,8840.33 0.42 51 12,098
Table 2Aerial photographs used to prepare the multi-temporal landslideinventory map (1 to 4) (Fig. 2) and the inventory of snowmelt inducedlandslides (5) (Fig. 10A) for the Collazzone area
ID Year Period Type Nominal scale
1 1941 Summer Panchromatic 1:18,0002 1954 Spring–Summer Panchromatic 1:33,0003 1977 June Colour 1:13,0004 1985 July Panchromatic 1:15,0005 1997 April Panchromatic 1:20,000
Fig. 2. Multi-temporal landslide inventory map showing shallowlandslides (see Table 1). Original map scale 1:10,000.
169F. Guzzetti et al. / Geomorphology 81 (2006) 166–184
estimated age, activity, depth, and velocity. Landslidetype was defined according to Cruden and Varnes(1996). Landslide age, activity, depth, and velocity weredetermined based on the type of movement, themorphological characteristics and appearance of thelandslides on the aerial photographs, the local litholog-ical and structural setting, and the date of the aerialphotographs. Landslide age was defined as recent, old orvery old, despite ambiguity in the definition of the age ofa mass movement based on its appearance (McCalpin,1984). Overall, the multi-temporal inventory map shows2760 landslides (Table 1A). The subset of shallowlandslides used to prepare the susceptibility modelincludes 1759 landslides, covering 5.77 km2 of thestudy area (Table 2B).
To account for possible cartographic and draftingerrors in the production of the multi-temporal inventorymap (e.g., landslides erroneously mapped as crossing adivide or a stream line), we established an empiricalthreshold to decide if a mapping unit contained or wasfree of landslides. Slope units having less than 2% of thearea covered by shallow slope failures were consideredfree of landslides, whilst slope units having 2% or moreof their area covered were considered as containinglandslides.
Independent variables used in the statistical analysisof the shallow landslides included morphological,
hydrological, lithological, structural and land-use infor-mation. We obtained 26 variables describing hydrologyand morphology from the same DTM used to performthe subdivision of the study area into slope units.Hydrological variables included slope unit drainagechannel length, gradient, order and magnitude, and slopeunit area and upstream contributing area. Morphologicalvariables included slope unit mean elevation, standarddeviation of elevation, mean length, mean terraingradient and standard deviation of terrain gradient,slope unit aspect (in six classes), slope unit terrainroughness, and mean terrain gradient for the upper,intermediate and lower portions of the slope unit. Fromthe latter three statistics, derivative variables describingthe shape of the slope unit profile (concave, convex,irregular, etc.) were obtained. Since most of themorphological variables describe average terrain condi-tions in a slope unit, local testing of the variables in thefield was problematic and was not performed. Wecompiled lithological and structural data, including theattitude of bedding, through detailed lithological andstructural mapping at 1:10,000 scale. The lithologicalmap did not show the distribution and thickness of thesoils or the colluvial deposits. We obtained informationon land use from a map compiled in 1977 by the UmbriaRegional Government, largely revised and updated byinterpreting the most recent aerial photographs (Table 2).
To determine landslide susceptibility we adopteddiscriminant analysis, a multivariate technique intro-duced by Fisher (1936) to classify samples intoalternative groups on the basis of a set of measurements(Michie et al., 1994; Brown, 1998; SPSS, 2004). Moreprecisely, the goal of discriminant analysis is to classifycases into one of several mutually exclusive groupsbased on their values for a set of predictor variables. Thegrouping variable must be categorical and the predictorvariables can be interval or dichotomous. For landslidesusceptibility assessment most commonly two groupsare established, namely, (i) mapping units free oflandslides (G0, stable slopes); and (ii) mapping unitshaving landslides (G1, unstable slopes). The assumption
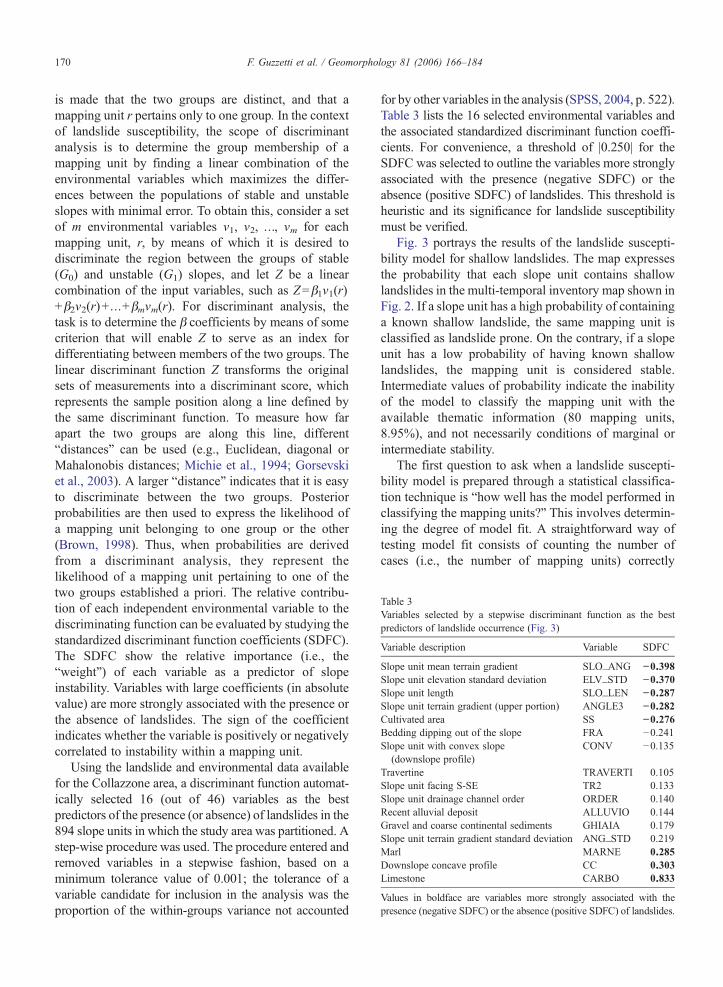
Table 3Variables selected by a stepwise discriminant function as the bestpredictors of landslide occurrence (Fig. 3)
Variable description Variable SDFC
Slope unit mean terrain gradient SLO_ANG −0.398Slope unit elevation standard deviation ELV_STD −0.370Slope unit length SLO_LEN −0.287Slope unit terrain gradient (upper portion) ANGLE3 −0.282Cultivated area SS −0.276Bedding dipping out of the slope FRA −0.241Slope unit with convex slope(downslope profile)
CONV −0.135
Travertine TRAVERTI 0.105Slope unit facing S-SE TR2 0.133Slope unit drainage channel order ORDER 0.140Recent alluvial deposit ALLUVIO 0.144Gravel and coarse continental sediments GHIAIA 0.179Slope unit terrain gradient standard deviation ANG_STD 0.219Marl MARNE 0.285Downslope concave profile CC 0.303Limestone CARBO 0.833
Values in boldface are variables more strongly associated with thepresence (negative SDFC) or the absence (positive SDFC) of landslides.
170 F. Guzzetti et al. / Geomorphology 81 (2006) 166–184
is made that the two groups are distinct, and that amapping unit r pertains only to one group. In the contextof landslide susceptibility, the scope of discriminantanalysis is to determine the group membership of amapping unit by finding a linear combination of theenvironmental variables which maximizes the differ-ences between the populations of stable and unstableslopes with minimal error. To obtain this, consider a setof m environmental variables ν1, ν2, …, νm for eachmapping unit, r, by means of which it is desired todiscriminate the region between the groups of stable(G0) and unstable (G1) slopes, and let Z be a linearcombination of the input variables, such as Z=β1ν1(r)+β2ν2(r)+…+βmνm(r). For discriminant analysis, thetask is to determine the β coefficients by means of somecriterion that will enable Z to serve as an index fordifferentiating between members of the two groups. Thelinear discriminant function Z transforms the originalsets of measurements into a discriminant score, whichrepresents the sample position along a line defined bythe same discriminant function. To measure how farapart the two groups are along this line, different“distances” can be used (e.g., Euclidean, diagonal orMahalonobis distances; Michie et al., 1994; Gorsevskiet al., 2003). A larger “distance” indicates that it is easyto discriminate between the two groups. Posteriorprobabilities are then used to express the likelihood ofa mapping unit belonging to one group or the other(Brown, 1998). Thus, when probabilities are derivedfrom a discriminant analysis, they represent thelikelihood of a mapping unit pertaining to one of thetwo groups established a priori. The relative contribu-tion of each independent environmental variable to thediscriminating function can be evaluated by studying thestandardized discriminant function coefficients (SDFC).The SDFC show the relative importance (i.e., the“weight”) of each variable as a predictor of slopeinstability. Variables with large coefficients (in absolutevalue) are more strongly associated with the presence orthe absence of landslides. The sign of the coefficientindicates whether the variable is positively or negativelycorrelated to instability within a mapping unit.
Using the landslide and environmental data availablefor the Collazzone area, a discriminant function automat-ically selected 16 (out of 46) variables as the bestpredictors of the presence (or absence) of landslides in the894 slope units in which the study area was partitioned. Astep-wise procedure was used. The procedure entered andremoved variables in a stepwise fashion, based on aminimum tolerance value of 0.001; the tolerance of avariable candidate for inclusion in the analysis was theproportion of the within-groups variance not accounted
for by other variables in the analysis (SPSS, 2004, p. 522).Table 3 lists the 16 selected environmental variables andthe associated standardized discriminant function coeffi-cients. For convenience, a threshold of |0.250| for theSDFC was selected to outline the variables more stronglyassociated with the presence (negative SDFC) or theabsence (positive SDFC) of landslides. This threshold isheuristic and its significance for landslide susceptibilitymust be verified.
Fig. 3 portrays the results of the landslide suscepti-bility model for shallow landslides. The map expressesthe probability that each slope unit contains shallowlandslides in the multi-temporal inventory map shown inFig. 2. If a slope unit has a high probability of containinga known shallow landslide, the same mapping unit isclassified as landslide prone. On the contrary, if a slopeunit has a low probability of having known shallowlandslides, the mapping unit is considered stable.Intermediate values of probability indicate the inabilityof the model to classify the mapping unit with theavailable thematic information (80 mapping units,8.95%), and not necessarily conditions of marginal orintermediate stability.
The first question to ask when a landslide suscepti-bility model is prepared through a statistical classifica-tion technique is “how well has the model performed inclassifying the mapping units?” This involves determin-ing the degree of model fit. A straightforward way oftesting model fit consists of counting the number ofcases (i.e., the number of mapping units) correctly
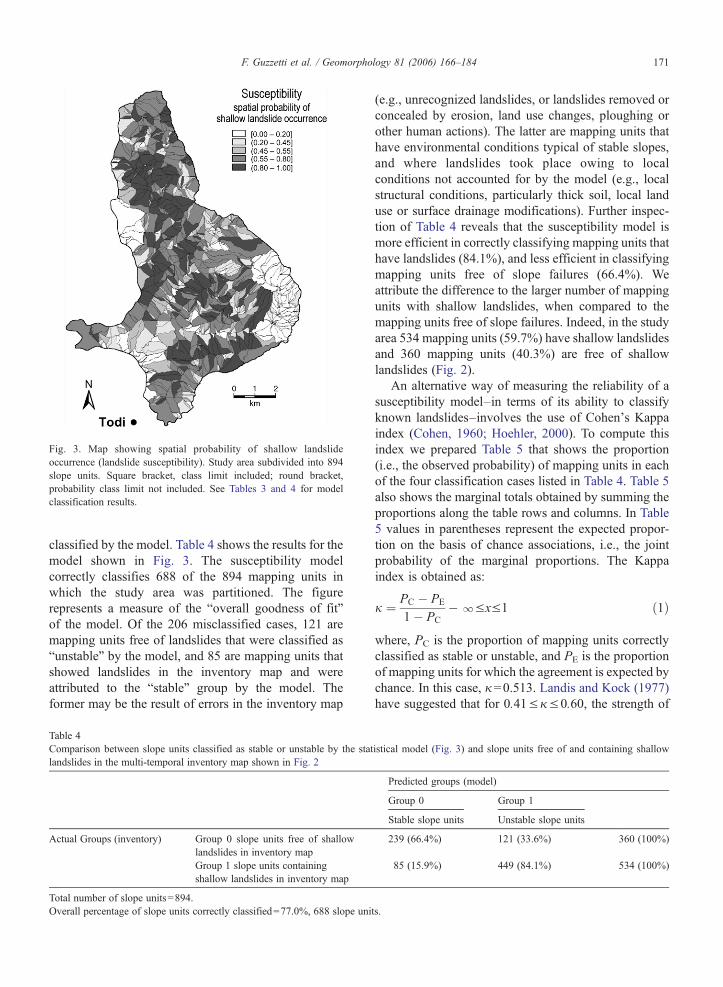
Fig. 3. Map showing spatial probability of shallow landslideoccurrence (landslide susceptibility). Study area subdivided into 894slope units. Square bracket, class limit included; round bracket,probability class limit not included. See Tables 3 and 4 for modelclassification results.
171F. Guzzetti et al. / Geomorphology 81 (2006) 166–184
classified by the model. Table 4 shows the results for themodel shown in Fig. 3. The susceptibility modelcorrectly classifies 688 of the 894 mapping units inwhich the study area was partitioned. The figurerepresents a measure of the “overall goodness of fit”of the model. Of the 206 misclassified cases, 121 aremapping units free of landslides that were classified as“unstable” by the model, and 85 are mapping units thatshowed landslides in the inventory map and wereattributed to the “stable” group by the model. Theformer may be the result of errors in the inventory map
Table 4Comparison between slope units classified as stable or unstable by the statlandslides in the multi-temporal inventory map shown in Fig. 2
Actual Groups (inventory) Group 0 slope units free of shallowlandslides in inventory mapGroup 1 slope units containingshallow landslides in inventory map
Total number of slope units=894.Overall percentage of slope units correctly classified=77.0%, 688 slope uni
(e.g., unrecognized landslides, or landslides removed orconcealed by erosion, land use changes, ploughing orother human actions). The latter are mapping units thathave environmental conditions typical of stable slopes,and where landslides took place owing to localconditions not accounted for by the model (e.g., localstructural conditions, particularly thick soil, local landuse or surface drainage modifications). Further inspec-tion of Table 4 reveals that the susceptibility model ismore efficient in correctly classifying mapping units thathave landslides (84.1%), and less efficient in classifyingmapping units free of slope failures (66.4%). Weattribute the difference to the larger number of mappingunits with shallow landslides, when compared to themapping units free of slope failures. Indeed, in the studyarea 534 mapping units (59.7%) have shallow landslidesand 360 mapping units (40.3%) are free of shallowlandslides (Fig. 2).
An alternative way of measuring the reliability of asusceptibility model–in terms of its ability to classifyknown landslides–involves the use of Cohen's Kappaindex (Cohen, 1960; Hoehler, 2000). To compute thisindex we prepared Table 5 that shows the proportion(i.e., the observed probability) of mapping units in eachof the four classification cases listed in Table 4. Table 5also shows the marginal totals obtained by summing theproportions along the table rows and columns. In Table5 values in parentheses represent the expected propor-tion on the basis of chance associations, i.e., the jointprobability of the marginal proportions. The Kappaindex is obtained as:
j ¼ PC � PE
1� PC�lVxV1 ð1Þ
where, PC is the proportion of mapping units correctlyclassified as stable or unstable, and PE is the proportionof mapping units for which the agreement is expected bychance. In this case, κ=0.513. Landis and Kock (1977)have suggested that for 0.41≤κ≤0.60, the strength of
istical model (Fig. 3) and slope units free of and containing shallow
Predicted groups (model)
Group 0 Group 1
Stable slope units Unstable slope units
239 (66.4%) 121 (33.6%) 360 (100%)
85 (15.9%) 449 (84.1%) 534 (100%)
ts.
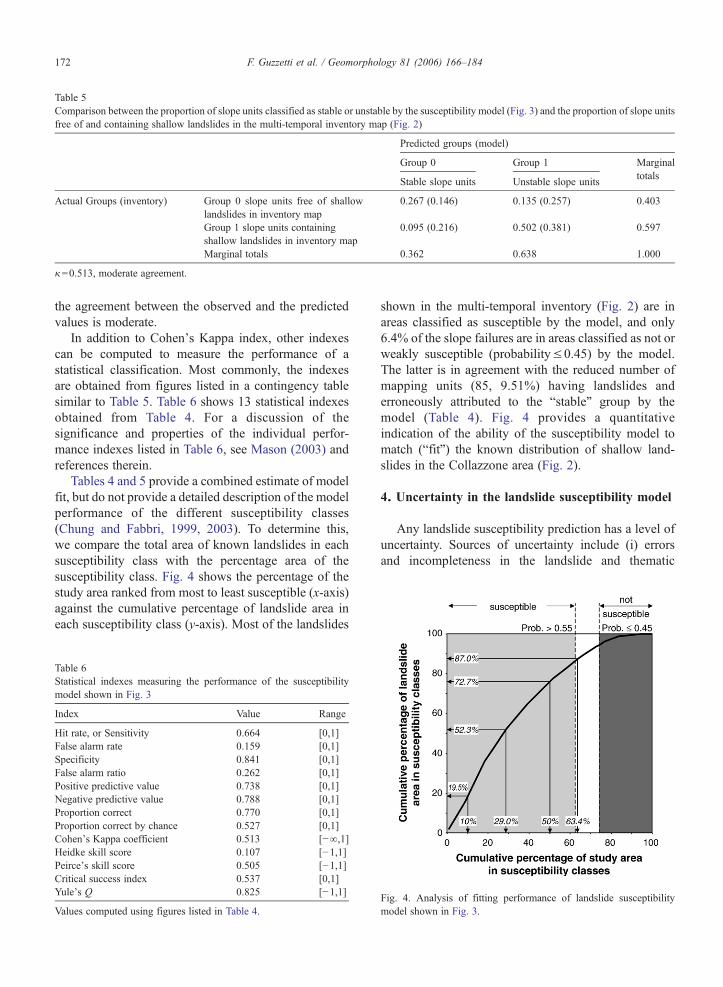
Table 5Comparison between the proportion of slope units classified as stable or unstable by the susceptibility model (Fig. 3) and the proportion of slope unitsfree of and containing shallow landslides in the multi-temporal inventory map (Fig. 2)
Predicted groups (model)
Group 0 Group 1 Marginaltotals
Stable slope units Unstable slope units
Actual Groups (inventory) Group 0 slope units free of shallowlandslides in inventory map
0.267 (0.146) 0.135 (0.257) 0.403
Group 1 slope units containingshallow landslides in inventory map
0.095 (0.216) 0.502 (0.381) 0.597
Marginal totals 0.362 0.638 1.000
κ=0.513, moderate agreement.
172 F. Guzzetti et al. / Geomorphology 81 (2006) 166–184
the agreement between the observed and the predictedvalues is moderate.
In addition to Cohen's Kappa index, other indexescan be computed to measure the performance of astatistical classification. Most commonly, the indexesare obtained from figures listed in a contingency tablesimilar to Table 5. Table 6 shows 13 statistical indexesobtained from Table 4. For a discussion of thesignificance and properties of the individual perfor-mance indexes listed in Table 6, see Mason (2003) andreferences therein.
Tables 4 and 5 provide a combined estimate of modelfit, but do not provide a detailed description of the modelperformance of the different susceptibility classes(Chung and Fabbri, 1999, 2003). To determine this,we compare the total area of known landslides in eachsusceptibility class with the percentage area of thesusceptibility class. Fig. 4 shows the percentage of thestudy area ranked from most to least susceptible (x-axis)against the cumulative percentage of landslide area ineach susceptibility class (y-axis). Most of the landslides
Table 6Statistical indexes measuring the performance of the susceptibilitymodel shown in Fig. 3
Index Value Range
Hit rate, or Sensitivity 0.664 [0,1]False alarm rate 0.159 [0,1]Specificity 0.841 [0,1]False alarm ratio 0.262 [0,1]Positive predictive value 0.738 [0,1]Negative predictive value 0.788 [0,1]Proportion correct 0.770 [0,1]Proportion correct by chance 0.527 [0,1]Cohen's Kappa coefficient 0.513 [−∞,1]Heidke skill score 0.107 [−1,1]Peirce's skill score 0.505 [−1,1]Critical success index 0.537 [0,1]Yule's Q 0.825 [−1,1]
Values computed using figures listed in Table 4.
shown in the multi-temporal inventory (Fig. 2) are inareas classified as susceptible by the model, and only6.4% of the slope failures are in areas classified as not orweakly susceptible (probability≤0.45) by the model.The latter is in agreement with the reduced number ofmapping units (85, 9.51%) having landslides anderroneously attributed to the “stable” group by themodel (Table 4). Fig. 4 provides a quantitativeindication of the ability of the susceptibility model tomatch (“fit”) the known distribution of shallow land-slides in the Collazzone area (Fig. 2).
4. Uncertainty in the landslide susceptibility model
Any landslide susceptibility prediction has a level ofuncertainty. Sources of uncertainty include (i) errorsand incompleteness in the landslide and thematic
Fig. 4. Analysis of fitting performance of landslide susceptibilitymodel shown in Fig. 3.
173F. Guzzetti et al. / Geomorphology 81 (2006) 166–184
information available to complete the analysis; (ii) animperfect understanding of landslide processes and theirgeographical and temporal evolution; (iii) limitations inthe techniques used to determine the susceptibility; and(iv) the inherent natural variability of the landslidephenomena (Carrara et al., 1992, 1999; Ardizzone et al.,2002).
Determining the errors associated with the geomor-phological, geological and other thematic information isno trivial task. Improving the understanding of thelandslide processes is feasible, but requires time andresources often not available to landslide investigators.The characteristics of the methods used to ascertainlandslide susceptibility are known (Carrara et al., 1995;Soeters and van Westen, 1996; Chung and Fabbri, 1999;Guzzetti et al., 1999), but their limitations and draw-backs when applied to specific areas, data sets, andlandslide types remain poorly investigated. Despitethese problems, we argue that determining the errorsassociated with a landslide susceptibility assessment isof primary importance. Different types of uncertaintycontribute to the model error, including: (i) uncertaintyin the model classification due to the type, abundanceand reliability of the available thematic information; (ii)uncertainty in the classification of individual mappingunits; and (iii) uncertainty in the ability of the model topredict future landslides (prediction skill).
In the following, we propose a framework to test oursusceptibility model. Tests aim at (i) investigating therole of the thematic information in the production of thesusceptibility model; (ii) determining the model sensi-tivity and robustness to variations in the input data; (iii)determining the error associated with the susceptibilityprediction obtained for each mapping unit; and (iv)testing the model prediction against independentlandslide information.
5. Analysis of model reliability
5.1. Construction of an ensemble of landslidesusceptibility models
To determine the reliability of the landslide suscepti-bility assessment shown in Fig. 3, we prepared anensemble of landslide susceptibility models. The ensem-ble contains 350 different susceptibility models obtainedfrom the same set of 46 independent thematic variablesand the same multi-temporal landslide map (Fig. 2) butusing a different number of terrain units, from 268 (30%)to 849 (95% of the 894) units. To obtain the ensemble weadopted the following strategy. First, a subset containing30% of the mapping units (268 units) was obtained by
random selection from the entire set of 894mapping units.The random selection was repeated 50 times, obtaining agroup of 50 different subsets, each containing 268mapping units. This collection of 50 subsets of mappingunits became group G30 for the analysis (30% selectedmapping units). The selection process was repeated,changing the number of the selected units heuristically.We obtained collectionswith 45%, 55%, 65%, 75%, 85%,and 95% mapping units, respectively. These collections,each listing 50 subsets of mapping units, became groupsG45, G55, G65, G75, G85 and G95. Overall, the ensemblecontains 350 subsets ofmapping units, i.e., 7 groups (fromG30 to G95) each containing 50 subsets.
Landslide susceptibility models were prepared foreach subset of the ensemble, obtaining 350 differentsusceptibility models, i.e., 350 different forecasts oflandslide susceptibility for the Collazzone area. Thelarge number of susceptibility forecasts was exploited tostudy the errors associated with the landslide suscepti-bility model shown in Fig. 3.
5.2. Role of the independent thematic variables
The role of the 46 independent thematic variablesused to construct the landslide susceptibility model isfirst considered. For this purpose, group G85 is used. Forthis group, Table 7 lists the number and the percentageof the 50 models that selected (or did not select) the 46variables, and whether the variables were selected aspredictors of slope stability (S) or of slope instability (I).Inspection of Table 7 reveals that of the 46 consideredvariables, 38 (82.6%) were selected in at least one of the50 models encompassing G85, and 8 (17.4%) variableswere never selected as predictors of landslide occur-rence. Of the 38 selected variables, 15 (39.5%) wereselected by 25 or more models, and 7 (18.4%) wereselected by 45 or more models.
The 50 stepwise discriminant functions constructedfrom G85 selected from as few as 11 to as many as 18variables (mode 14 variables). All the selected variables,with the exception of drainage magnitude (MAGN),were either always selected as negatively (I, in Table 7)or always selected as positively (S, in Table 7) inassociation with the presence of landslides. We take thisas an indication of the consistency of the role of thethematic variables in explaining the known distributionof landslides, which contributes to the reliability of thesusceptibility model.
Inspection of Table 7 further indicates that more than75% of the prepared models used the same set of 10variables. These variables included: four variablesdescribing morphology (ELV_STD, ANG_STD, SLO_
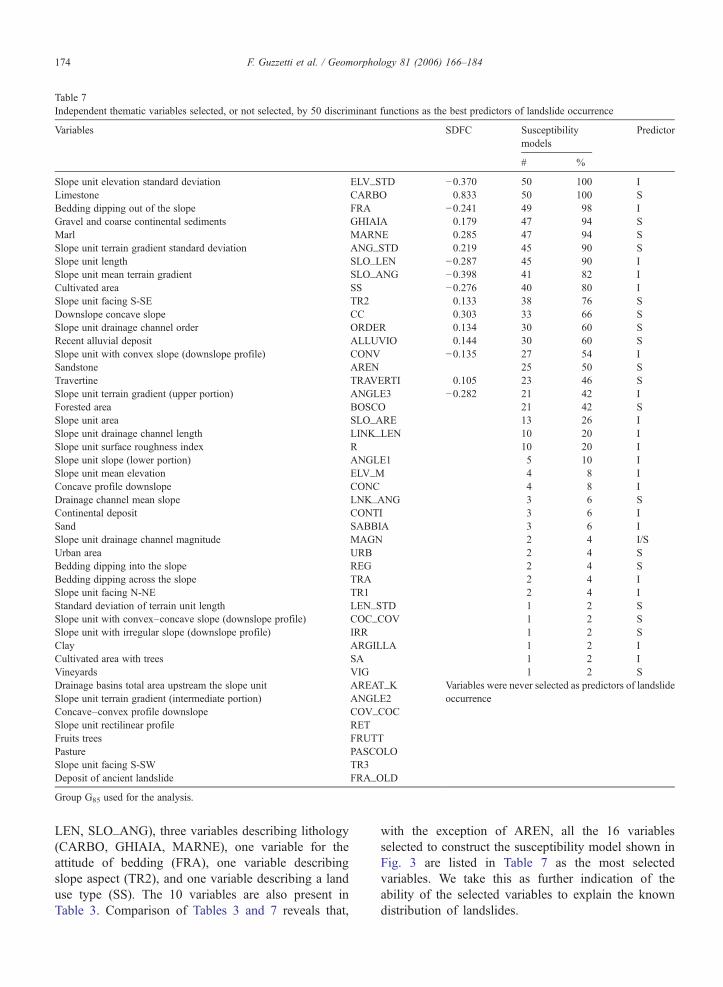
Table 7Independent thematic variables selected, or not selected, by 50 discriminant functions as the best predictors of landslide occurrence
Variables SDFC Susceptibilitymodels
Predictor
# %
Slope unit elevation standard deviation ELV_STD −0.370 50 100 ILimestone CARBO 0.833 50 100 SBedding dipping out of the slope FRA −0.241 49 98 IGravel and coarse continental sediments GHIAIA 0.179 47 94 SMarl MARNE 0.285 47 94 SSlope unit terrain gradient standard deviation ANG_STD 0.219 45 90 SSlope unit length SLO_LEN −0.287 45 90 ISlope unit mean terrain gradient SLO_ANG −0.398 41 82 ICultivated area SS −0.276 40 80 ISlope unit facing S-SE TR2 0.133 38 76 SDownslope concave slope CC 0.303 33 66 SSlope unit drainage channel order ORDER 0.134 30 60 SRecent alluvial deposit ALLUVIO 0.144 30 60 SSlope unit with convex slope (downslope profile) CONV −0.135 27 54 ISandstone AREN 25 50 STravertine TRAVERTI 0.105 23 46 SSlope unit terrain gradient (upper portion) ANGLE3 −0.282 21 42 IForested area BOSCO 21 42 SSlope unit area SLO_ARE 13 26 ISlope unit drainage channel length LINK_LEN 10 20 ISlope unit surface roughness index R 10 20 ISlope unit slope (lower portion) ANGLE1 5 10 ISlope unit mean elevation ELV_M 4 8 IConcave profile downslope CONC 4 8 IDrainage channel mean slope LNK_ANG 3 6 SContinental deposit CONTI 3 6 ISand SABBIA 3 6 ISlope unit drainage channel magnitude MAGN 2 4 I/SUrban area URB 2 4 SBedding dipping into the slope REG 2 4 SBedding dipping across the slope TRA 2 4 ISlope unit facing N-NE TR1 2 4 IStandard deviation of terrain unit length LEN_STD 1 2 SSlope unit with convex–concave slope (downslope profile) COC_COV 1 2 SSlope unit with irregular slope (downslope profile) IRR 1 2 SClay ARGILLA 1 2 ICultivated area with trees SA 1 2 IVineyards VIG 1 2 SDrainage basins total area upstream the slope unit AREAT_K Variables were never selected as predictors of landslide
occurrenceSlope unit terrain gradient (intermediate portion) ANGLE2Concave–convex profile downslope COV_COCSlope unit rectilinear profile RETFruits trees FRUTTPasture PASCOLOSlope unit facing S-SW TR3Deposit of ancient landslide FRA_OLD
Group G85 used for the analysis.
174 F. Guzzetti et al. / Geomorphology 81 (2006) 166–184
LEN, SLO_ANG), three variables describing lithology(CARBO, GHIAIA, MARNE), one variable for theattitude of bedding (FRA), one variable describingslope aspect (TR2), and one variable describing a landuse type (SS). The 10 variables are also present inTable 3. Comparison of Tables 3 and 7 reveals that,
with the exception of AREN, all the 16 variablesselected to construct the susceptibility model shown inFig. 3 are listed in Table 7 as the most selectedvariables. We take this as further indication of theability of the selected variables to explain the knowndistribution of landslides.
175F. Guzzetti et al. / Geomorphology 81 (2006) 166–184
5.3. Model sensitivity
The sensitivity of the susceptibility model to changesin the input data is then investigated. In general, resultsof a robust (least sensitive) statistical model should notchange significantly if the input data are changed withina reasonable range. To investigate the sensitivity of thesusceptibility model to changes in the input data, we usethe entire ensemble of models, and we study thevariation in the overall percentage of mapping unitscorrectly classified by the 350 models. Three cases areconsidered: (i) mapping units selected by the adoptedrandom selection procedure and classified by thediscriminant functions (selected units, i.e., “training”or “modelling” set, Fig. 5A); (ii) mapping units notselected by the random selection procedure and
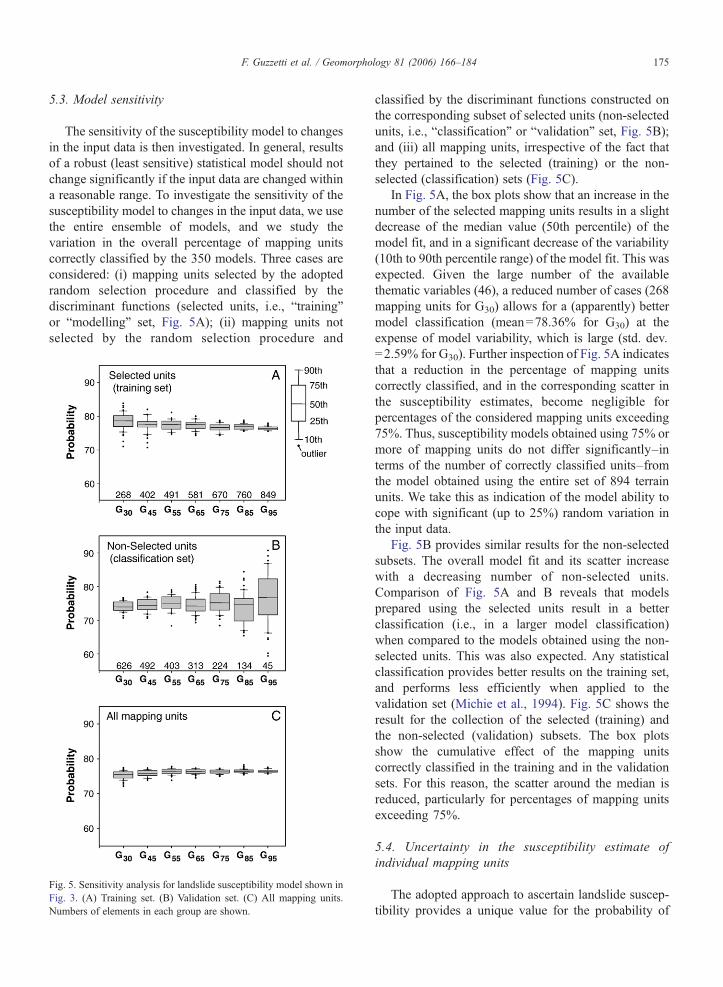
Fig. 5. Sensitivity analysis for landslide susceptibility model shown inFig. 3. (A) Training set. (B) Validation set. (C) All mapping units.Numbers of elements in each group are shown.
classified by the discriminant functions constructed onthe corresponding subset of selected units (non-selectedunits, i.e., “classification” or “validation” set, Fig. 5B);and (iii) all mapping units, irrespective of the fact thatthey pertained to the selected (training) or the non-selected (classification) sets (Fig. 5C).
In Fig. 5A, the box plots show that an increase in thenumber of the selected mapping units results in a slightdecrease of the median value (50th percentile) of themodel fit, and in a significant decrease of the variability(10th to 90th percentile range) of the model fit. This wasexpected. Given the large number of the availablethematic variables (46), a reduced number of cases (268mapping units for G30) allows for a (apparently) bettermodel classification (mean=78.36% for G30) at theexpense of model variability, which is large (std. dev.=2.59% for G30). Further inspection of Fig. 5A indicatesthat a reduction in the percentage of mapping unitscorrectly classified, and in the corresponding scatter inthe susceptibility estimates, become negligible forpercentages of the considered mapping units exceeding75%. Thus, susceptibility models obtained using 75% ormore of mapping units do not differ significantly–interms of the number of correctly classified units–fromthe model obtained using the entire set of 894 terrainunits. We take this as indication of the model ability tocope with significant (up to 25%) random variation inthe input data.
Fig. 5B provides similar results for the non-selectedsubsets. The overall model fit and its scatter increasewith a decreasing number of non-selected units.Comparison of Fig. 5A and B reveals that modelsprepared using the selected units result in a betterclassification (i.e., in a larger model classification)when compared to the models obtained using the non-selected units. This was also expected. Any statisticalclassification provides better results on the training set,and performs less efficiently when applied to thevalidation set (Michie et al., 1994). Fig. 5C shows theresult for the collection of the selected (training) andthe non-selected (validation) subsets. The box plotsshow the cumulative effect of the mapping unitscorrectly classified in the training and in the validationsets. For this reason, the scatter around the median isreduced, particularly for percentages of mapping unitsexceeding 75%.
5.4. Uncertainty in the susceptibility estimate ofindividual mapping units
The adopted approach to ascertain landslide suscep-tibility provides a unique value for the probability of
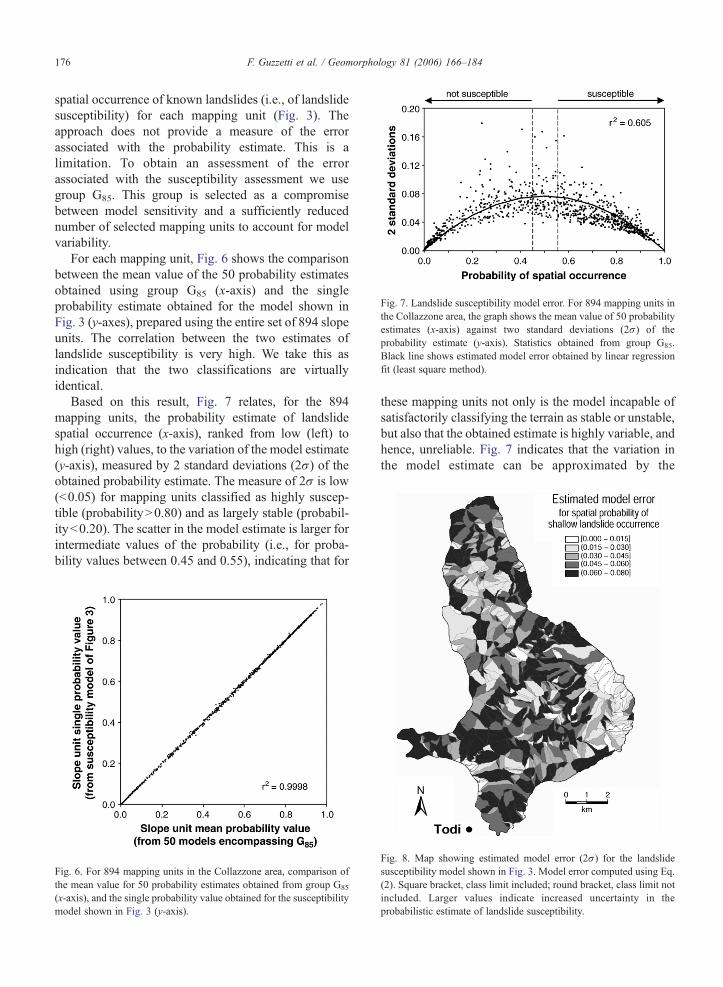
Fig. 7. Landslide susceptibility model error. For 894 mapping units inthe Collazzone area, the graph shows the mean value of 50 probabilityestimates (x-axis) against two standard deviations (2σ) of theprobability estimate (y-axis). Statistics obtained from group G85.Black line shows estimated model error obtained by linear regressionfit (least square method).
176 F. Guzzetti et al. / Geomorphology 81 (2006) 166–184
spatial occurrence of known landslides (i.e., of landslidesusceptibility) for each mapping unit (Fig. 3). Theapproach does not provide a measure of the errorassociated with the probability estimate. This is alimitation. To obtain an assessment of the errorassociated with the susceptibility assessment we usegroup G85. This group is selected as a compromisebetween model sensitivity and a sufficiently reducednumber of selected mapping units to account for modelvariability.
For each mapping unit, Fig. 6 shows the comparisonbetween the mean value of the 50 probability estimatesobtained using group G85 (x-axis) and the singleprobability estimate obtained for the model shown inFig. 3 (y-axes), prepared using the entire set of 894 slopeunits. The correlation between the two estimates oflandslide susceptibility is very high. We take this asindication that the two classifications are virtuallyidentical.
Based on this result, Fig. 7 relates, for the 894mapping units, the probability estimate of landslidespatial occurrence (x-axis), ranked from low (left) tohigh (right) values, to the variation of the model estimate(y-axis), measured by 2 standard deviations (2σ) of theobtained probability estimate. The measure of 2σ is low(<0.05) for mapping units classified as highly suscep-tible (probability>0.80) and as largely stable (probabil-ity<0.20). The scatter in the model estimate is larger forintermediate values of the probability (i.e., for proba-bility values between 0.45 and 0.55), indicating that for
Fig. 6. For 894 mapping units in the Collazzone area, comparison ofthe mean value for 50 probability estimates obtained from group G85
(x-axis), and the single probability value obtained for the susceptibilitymodel shown in Fig. 3 (y-axis).
these mapping units not only is the model incapable ofsatisfactorily classifying the terrain as stable or unstable,but also that the obtained estimate is highly variable, andhence, unreliable. Fig. 7 indicates that the variation inthe model estimate can be approximated by the
Fig. 8. Map showing estimated model error (2σ) for the landslidesusceptibility model shown in Fig. 3. Model error computed using Eq.(2). Square bracket, class limit included; round bracket, class limit notincluded. Larger values indicate increased uncertainty in theprobabilistic estimate of landslide susceptibility.
177F. Guzzetti et al. / Geomorphology 81 (2006) 166–184
following quadratic equation, obtained by linear regres-sion fit (least square method):
y ¼ �0:309x2 þ 0:308x 0VxV1 ðr2 ¼ 0:605Þ ð2Þ
where, x is the estimated value of the probability ofpertaining to an unstable mapping unit (i.e., thelandslide susceptibility estimate), and y is 2σ of themodel estimate.
We consider the value of 2 standard deviations of themodel estimate a proxy for the model error. We use Eq.(2) to estimate quantitatively the model error for eachmapping unit, based on the computed probabilityestimate. For each mapping unit, Fig. 8 shows theerror associated with the probability estimate (i.e., tolandslide susceptibility), computed using the quadraticEq. (2). Fig. 8 provides a quantitative measure of theerror associated with the quantitative landslide suscep-tibility assessment shown in Fig. 3.
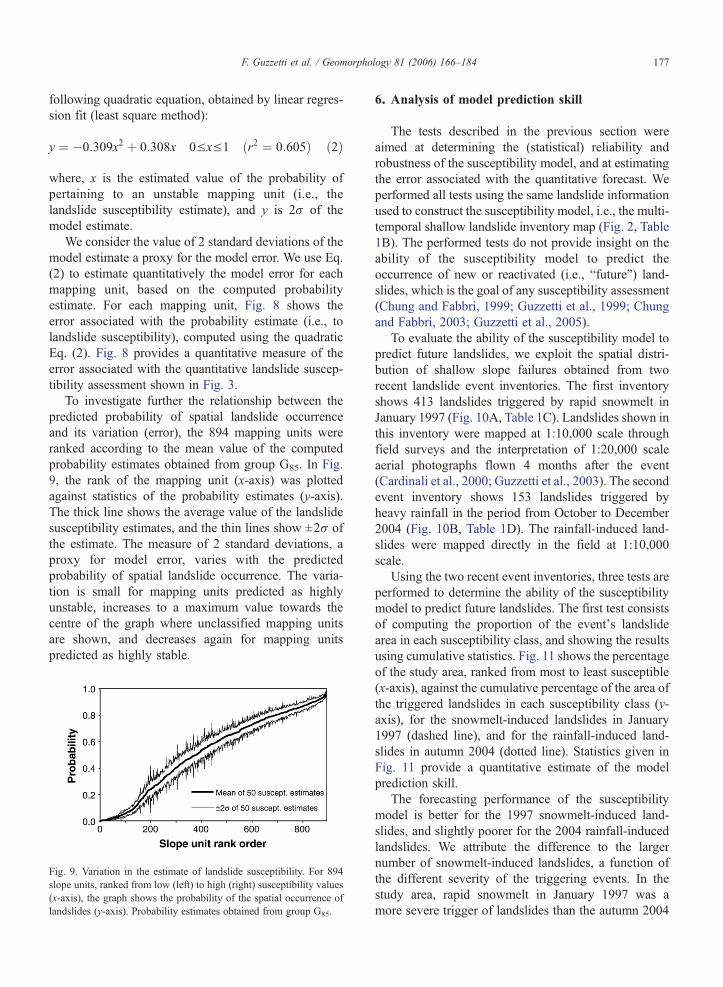
To investigate further the relationship between thepredicted probability of spatial landslide occurrenceand its variation (error), the 894 mapping units wereranked according to the mean value of the computedprobability estimates obtained from group G85. In Fig.9, the rank of the mapping unit (x-axis) was plottedagainst statistics of the probability estimates (y-axis).The thick line shows the average value of the landslidesusceptibility estimates, and the thin lines show ±2σ ofthe estimate. The measure of 2 standard deviations, aproxy for model error, varies with the predictedprobability of spatial landslide occurrence. The varia-tion is small for mapping units predicted as highlyunstable, increases to a maximum value towards thecentre of the graph where unclassified mapping unitsare shown, and decreases again for mapping unitspredicted as highly stable.
Fig. 9. Variation in the estimate of landslide susceptibility. For 894slope units, ranked from low (left) to high (right) susceptibility values(x-axis), the graph shows the probability of the spatial occurrence oflandslides (y-axis). Probability estimates obtained from group G85.
6. Analysis of model prediction skill
The tests described in the previous section wereaimed at determining the (statistical) reliability androbustness of the susceptibility model, and at estimatingthe error associated with the quantitative forecast. Weperformed all tests using the same landslide informationused to construct the susceptibility model, i.e., the multi-temporal shallow landslide inventory map (Fig. 2, Table1B). The performed tests do not provide insight on theability of the susceptibility model to predict theoccurrence of new or reactivated (i.e., “future”) land-slides, which is the goal of any susceptibility assessment(Chung and Fabbri, 1999; Guzzetti et al., 1999; Chungand Fabbri, 2003; Guzzetti et al., 2005).
To evaluate the ability of the susceptibility model topredict future landslides, we exploit the spatial distri-bution of shallow slope failures obtained from tworecent landslide event inventories. The first inventoryshows 413 landslides triggered by rapid snowmelt inJanuary 1997 (Fig. 10A, Table 1C). Landslides shown inthis inventory were mapped at 1:10,000 scale throughfield surveys and the interpretation of 1:20,000 scaleaerial photographs flown 4 months after the event(Cardinali et al., 2000; Guzzetti et al., 2003). The secondevent inventory shows 153 landslides triggered byheavy rainfall in the period from October to December2004 (Fig. 10B, Table 1D). The rainfall-induced land-slides were mapped directly in the field at 1:10,000scale.
Using the two recent event inventories, three tests areperformed to determine the ability of the susceptibilitymodel to predict future landslides. The first test consistsof computing the proportion of the event's landslidearea in each susceptibility class, and showing the resultsusing cumulative statistics. Fig. 11 shows the percentageof the study area, ranked from most to least susceptible(x-axis), against the cumulative percentage of the area ofthe triggered landslides in each susceptibility class (y-axis), for the snowmelt-induced landslides in January1997 (dashed line), and for the rainfall-induced land-slides in autumn 2004 (dotted line). Statistics given inFig. 11 provide a quantitative estimate of the modelprediction skill.
The forecasting performance of the susceptibilitymodel is better for the 1997 snowmelt-induced land-slides, and slightly poorer for the 2004 rainfall-inducedlandslides. We attribute the difference to the largernumber of snowmelt-induced landslides, a function ofthe different severity of the triggering events. In thestudy area, rapid snowmelt in January 1997 was amore severe trigger of landslides than the autumn 2004
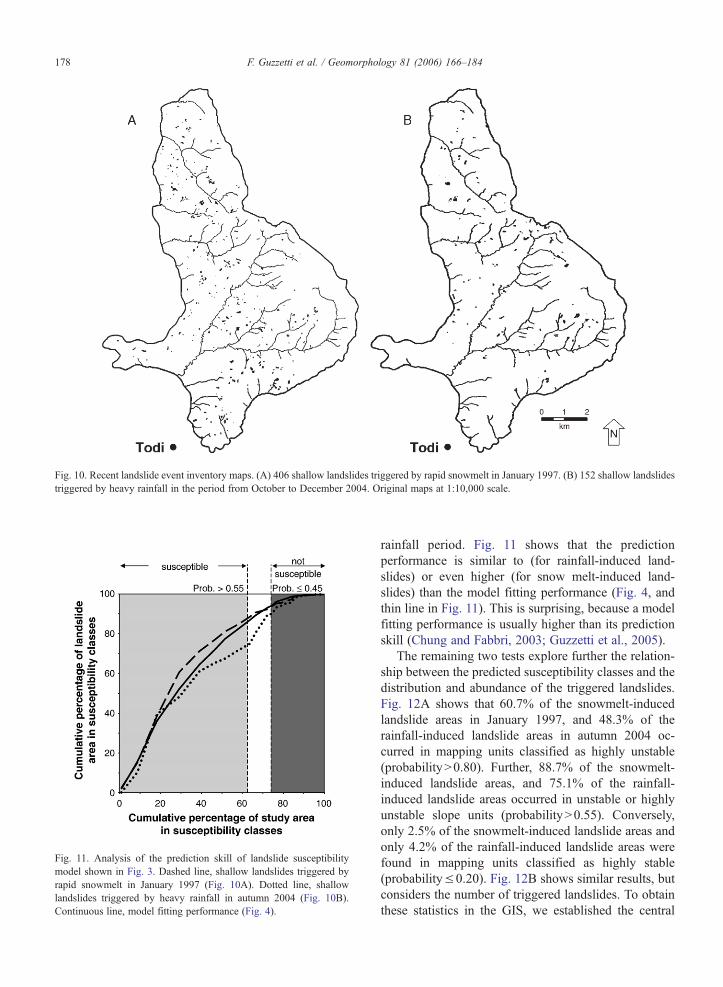
Fig. 11. Analysis of the prediction skill of landslide susceptibilitymodel shown in Fig. 3. Dashed line, shallow landslides triggered byrapid snowmelt in January 1997 (Fig. 10A). Dotted line, shallowlandslides triggered by heavy rainfall in autumn 2004 (Fig. 10B).Continuous line, model fitting performance (Fig. 4).
Fig. 10. Recent landslide event inventory maps. (A) 406 shallow landslides triggered by rapid snowmelt in January 1997. (B) 152 shallow landslidestriggered by heavy rainfall in the period from October to December 2004. Original maps at 1:10,000 scale.
178 F. Guzzetti et al. / Geomorphology 81 (2006) 166–184
rainfall period. Fig. 11 shows that the predictionperformance is similar to (for rainfall-induced land-slides) or even higher (for snow melt-induced land-slides) than the model fitting performance (Fig. 4, andthin line in Fig. 11). This is surprising, because a modelfitting performance is usually higher than its predictionskill (Chung and Fabbri, 2003; Guzzetti et al., 2005).
The remaining two tests explore further the relation-ship between the predicted susceptibility classes and thedistribution and abundance of the triggered landslides.Fig. 12A shows that 60.7% of the snowmelt-inducedlandslide areas in January 1997, and 48.3% of therainfall-induced landslide areas in autumn 2004 oc-curred in mapping units classified as highly unstable(probability>0.80). Further, 88.7% of the snowmelt-induced landslide areas, and 75.1% of the rainfall-induced landslide areas occurred in unstable or highlyunstable slope units (probability>0.55). Conversely,only 2.5% of the snowmelt-induced landslide areas andonly 4.2% of the rainfall-induced landslide areas werefound in mapping units classified as highly stable(probability≤0.20). Fig. 12B shows similar results, butconsiders the number of triggered landslides. To obtainthese statistics in the GIS, we established the central
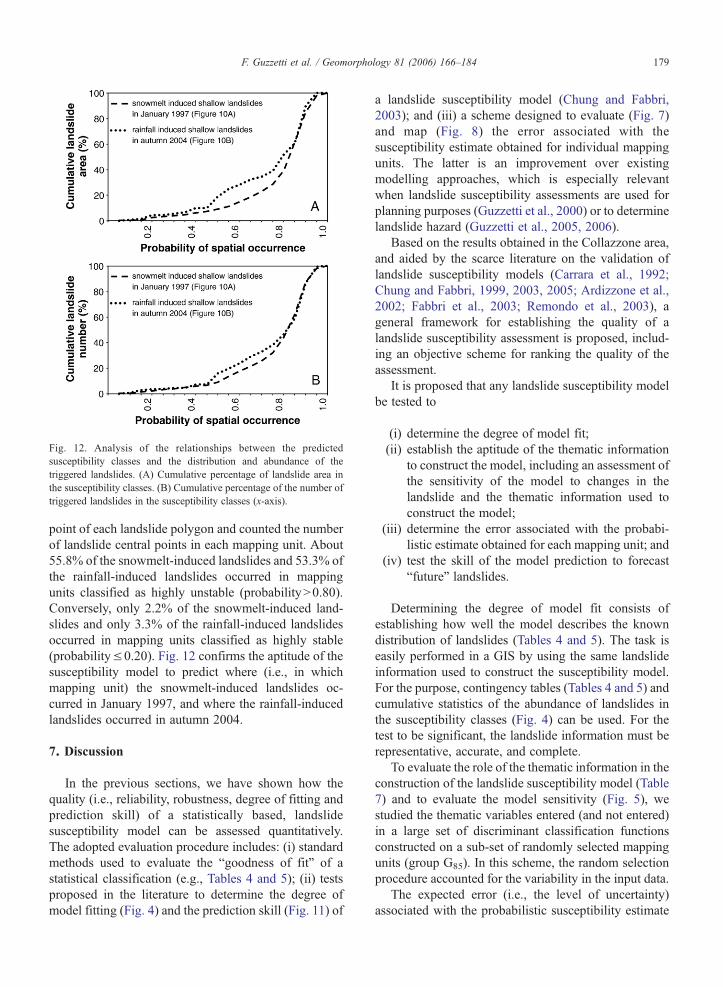
Fig. 12. Analysis of the relationships between the predictedsusceptibility classes and the distribution and abundance of thetriggered landslides. (A) Cumulative percentage of landslide area inthe susceptibility classes. (B) Cumulative percentage of the number oftriggered landslides in the susceptibility classes (x-axis).
179F. Guzzetti et al. / Geomorphology 81 (2006) 166–184
point of each landslide polygon and counted the numberof landslide central points in each mapping unit. About55.8% of the snowmelt-induced landslides and 53.3% ofthe rainfall-induced landslides occurred in mappingunits classified as highly unstable (probability>0.80).Conversely, only 2.2% of the snowmelt-induced land-slides and only 3.3% of the rainfall-induced landslidesoccurred in mapping units classified as highly stable(probability≤0.20). Fig. 12 confirms the aptitude of thesusceptibility model to predict where (i.e., in whichmapping unit) the snowmelt-induced landslides oc-curred in January 1997, and where the rainfall-inducedlandslides occurred in autumn 2004.
7. Discussion
In the previous sections, we have shown how thequality (i.e., reliability, robustness, degree of fitting andprediction skill) of a statistically based, landslidesusceptibility model can be assessed quantitatively.The adopted evaluation procedure includes: (i) standardmethods used to evaluate the “goodness of fit” of astatistical classification (e.g., Tables 4 and 5); (ii) testsproposed in the literature to determine the degree ofmodel fitting (Fig. 4) and the prediction skill (Fig. 11) of
a landslide susceptibility model (Chung and Fabbri,2003); and (iii) a scheme designed to evaluate (Fig. 7)and map (Fig. 8) the error associated with thesusceptibility estimate obtained for individual mappingunits. The latter is an improvement over existingmodelling approaches, which is especially relevantwhen landslide susceptibility assessments are used forplanning purposes (Guzzetti et al., 2000) or to determinelandslide hazard (Guzzetti et al., 2005, 2006).
Based on the results obtained in the Collazzone area,and aided by the scarce literature on the validation oflandslide susceptibility models (Carrara et al., 1992;Chung and Fabbri, 1999, 2003, 2005; Ardizzone et al.,2002; Fabbri et al., 2003; Remondo et al., 2003), ageneral framework for establishing the quality of alandslide susceptibility assessment is proposed, includ-ing an objective scheme for ranking the quality of theassessment.
It is proposed that any landslide susceptibility modelbe tested to
(i) determine the degree of model fit;(ii) establish the aptitude of the thematic information
to construct the model, including an assessment ofthe sensitivity of the model to changes in thelandslide and the thematic information used toconstruct the model;
(iii) determine the error associated with the probabi-listic estimate obtained for each mapping unit; and
(iv) test the skill of the model prediction to forecast“future” landslides.
Determining the degree of model fit consists ofestablishing how well the model describes the knowndistribution of landslides (Tables 4 and 5). The task iseasily performed in a GIS by using the same landslideinformation used to construct the susceptibility model.For the purpose, contingency tables (Tables 4 and 5) andcumulative statistics of the abundance of landslides inthe susceptibility classes (Fig. 4) can be used. For thetest to be significant, the landslide information must berepresentative, accurate, and complete.
To evaluate the role of the thematic information in theconstruction of the landslide susceptibility model (Table7) and to evaluate the model sensitivity (Fig. 5), westudied the thematic variables entered (and not entered)in a large set of discriminant classification functionsconstructed on a sub-set of randomly selected mappingunits (group G85). In this scheme, the random selectionprocedure accounted for the variability in the input data.
The expected error (i.e., the level of uncertainty)associated with the probabilistic susceptibility estimate
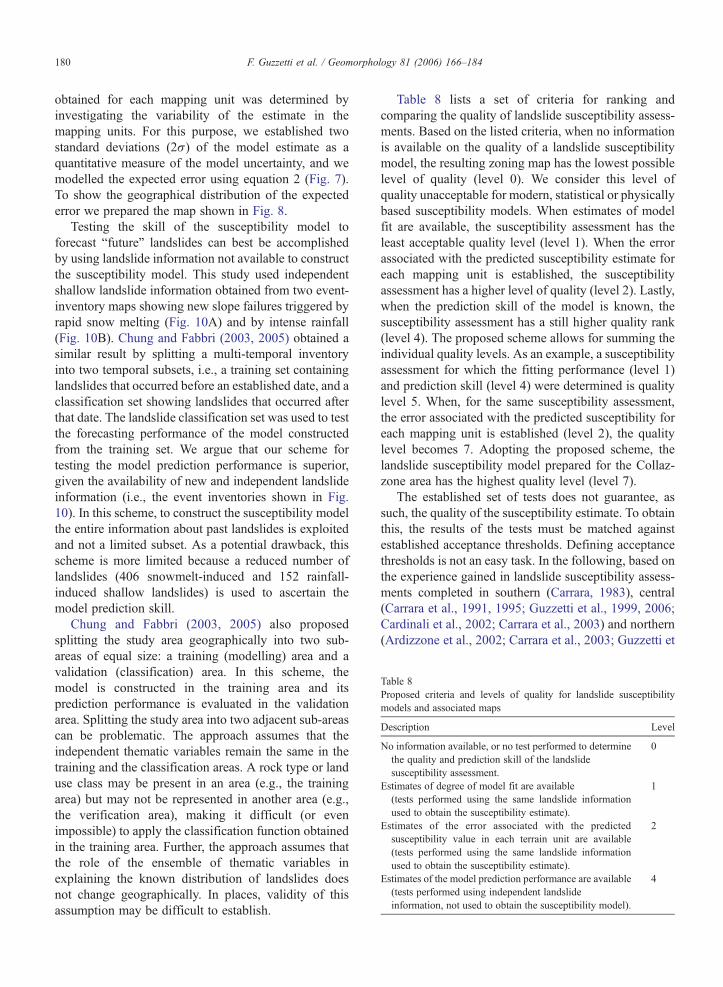
Table 8Proposed criteria and levels of quality for landslide susceptibilitymodels and associated maps
Description Level
No information available, or no test performed to determinethe quality and prediction skill of the landslidesusceptibility assessment.
0
Estimates of degree of model fit are available(tests performed using the same landslide informationused to obtain the susceptibility estimate).
1
Estimates of the error associated with the predictedsusceptibility value in each terrain unit are available(tests performed using the same landslide informationused to obtain the susceptibility estimate).
2
Estimates of the model prediction performance are available(tests performed using independent landslideinformation, not used to obtain the susceptibility model).
4
180 F. Guzzetti et al. / Geomorphology 81 (2006) 166–184
obtained for each mapping unit was determined byinvestigating the variability of the estimate in themapping units. For this purpose, we established twostandard deviations (2σ) of the model estimate as aquantitative measure of the model uncertainty, and wemodelled the expected error using equation 2 (Fig. 7).To show the geographical distribution of the expectederror we prepared the map shown in Fig. 8.
Testing the skill of the susceptibility model toforecast “future” landslides can best be accomplishedby using landslide information not available to constructthe susceptibility model. This study used independentshallow landslide information obtained from two event-inventory maps showing new slope failures triggered byrapid snow melting (Fig. 10A) and by intense rainfall(Fig. 10B). Chung and Fabbri (2003, 2005) obtained asimilar result by splitting a multi-temporal inventoryinto two temporal subsets, i.e., a training set containinglandslides that occurred before an established date, and aclassification set showing landslides that occurred afterthat date. The landslide classification set was used to testthe forecasting performance of the model constructedfrom the training set. We argue that our scheme fortesting the model prediction performance is superior,given the availability of new and independent landslideinformation (i.e., the event inventories shown in Fig.10). In this scheme, to construct the susceptibility modelthe entire information about past landslides is exploitedand not a limited subset. As a potential drawback, thisscheme is more limited because a reduced number oflandslides (406 snowmelt-induced and 152 rainfall-induced shallow landslides) is used to ascertain themodel prediction skill.
Chung and Fabbri (2003, 2005) also proposedsplitting the study area geographically into two sub-areas of equal size: a training (modelling) area and avalidation (classification) area. In this scheme, themodel is constructed in the training area and itsprediction performance is evaluated in the validationarea. Splitting the study area into two adjacent sub-areascan be problematic. The approach assumes that theindependent thematic variables remain the same in thetraining and the classification areas. A rock type or landuse class may be present in an area (e.g., the trainingarea) but may not be represented in another area (e.g.,the verification area), making it difficult (or evenimpossible) to apply the classification function obtainedin the training area. Further, the approach assumes thatthe role of the ensemble of thematic variables inexplaining the known distribution of landslides doesnot change geographically. In places, validity of thisassumption may be difficult to establish.
Table 8 lists a set of criteria for ranking andcomparing the quality of landslide susceptibility assess-ments. Based on the listed criteria, when no informationis available on the quality of a landslide susceptibilitymodel, the resulting zoning map has the lowest possiblelevel of quality (level 0). We consider this level ofquality unacceptable for modern, statistical or physicallybased susceptibility models. When estimates of modelfit are available, the susceptibility assessment has theleast acceptable quality level (level 1). When the errorassociated with the predicted susceptibility estimate foreach mapping unit is established, the susceptibilityassessment has a higher level of quality (level 2). Lastly,when the prediction skill of the model is known, thesusceptibility assessment has a still higher quality rank(level 4). The proposed scheme allows for summing theindividual quality levels. As an example, a susceptibilityassessment for which the fitting performance (level 1)and prediction skill (level 4) were determined is qualitylevel 5. When, for the same susceptibility assessment,the error associated with the predicted susceptibility foreach mapping unit is established (level 2), the qualitylevel becomes 7. Adopting the proposed scheme, thelandslide susceptibility model prepared for the Collaz-zone area has the highest quality level (level 7).
The established set of tests does not guarantee, assuch, the quality of the susceptibility estimate. To obtainthis, the results of the tests must be matched againstestablished acceptance thresholds. Defining acceptancethresholds is not an easy task. In the following, based onthe experience gained in landslide susceptibility assess-ments completed in southern (Carrara, 1983), central(Carrara et al., 1991, 1995; Guzzetti et al., 1999, 2006;Cardinali et al., 2002; Carrara et al., 2003) and northern(Ardizzone et al., 2002; Carrara et al., 2003; Guzzetti et
181F. Guzzetti et al. / Geomorphology 81 (2006) 166–184
al., 2005) Italy, we propose acceptance thresholds, andthen compare the results of our tests to the proposedthresholds.
We consider acceptable a susceptibility model withan overall degree of model fit greater than about 75%. Ifthe overall model fit is greater that 80%, we regard theclassification as very satisfactory. An extremely highvalue of the overall model fit (e.g., ≥90%) is anindication that the model matches too closely theoriginal landslide inventory map. When such a casearises, the model prediction is virtually indistinct from aprediction made using solely the landslide inventory,making the model suspicious. The case may arise, wherethe spatial distribution of landslides is “trivial” toforecast or where the number of mapping units is verysmall compared to the number of the explanatoryvariables (e.g., Campus et al., 1999). An additionalindication of the higher quality of the model consists ofa reduced number (e.g., ≤15%) of mapping units withlandslides erroneously classified as “stable” areas by themodel. The overall fit obtained for the susceptibilitymodel prepared for the Collazzone area was 77.0%(Table 4), and the proportion of mapping units withlandslides erroneously classified as stable areas was9.5% (85 units).
A statistical model obtained using a reduced numberof geomorphologically meaningful explanatory vari-ables is less expensive and, thus, superior to a modelwhich uses a very large number of variables. Further,use of a stable combination of variables provides for arobust model that can cope with uncertainty in the inputdata. The discriminant function used to construct thesusceptibility model shown in Fig. 3 selected 16 of the46 available thematic variables (34.8%). Our analysis(Table 7) revealed that the selected variables werehighly consistent in classifying the mapping units asstable or unstable in a large number of models. Weconsider this an indication of the robustness of theselected model.
Apart from the example discussed in this work (Figs.7 and 8), we are not aware of any other susceptibilityassessment for which the error associated with theprobabilistic estimate of landslide occurrence wasdetermined for individual mapping units. Establishingan acceptance threshold is therefore difficult. Inspectionof Fig. 7 reveals that most mapping units have anexpected error (2σ) lower than 10% of the probabilityestimate. This figure is taken as a quality acceptancethreshold for the model error. In the model presentedhere (Fig. 3), there are only 21 mapping units (2.35%)that do not match this criterion. Most of the latter unitsare in the “unclassified” probability range (Fig. 7).
To appraise the fitting performance and the predic-tion skill of a landslide susceptibility model, Chung andFabbri (2003) proposed comparing the proportion oflandslide area in each susceptibility class (AL) with theproportion of the susceptibility class (AS) in the studyarea. For a successful classification, the “effectivenessratio” AL/AS should be greater than one in the areaspredicted as landslide prone by the model, and less thanone in the areas predicted as stable by the model. A veryeffective prediction class has a ratio close to zero or verylarge, depending whether the class predicts stability orinstability. Where the effectiveness ratio is near one, theproportion of landslides in the susceptibility class is notdifferent from the average landslide density in the studyarea, and the performance of the susceptibility class indetermining the known (“fitting” performance) or thefuture (“prediction” skill) location of landslides is weak.Chung and Fabbri (2003) considered “effective” asusceptibility class with a ratio larger than at least 3(unstable areas) or less than at most 0.2 (stable areas),and “significantly effective” a susceptibility class with aratio larger than at least 6 or less than at most 0.1. Weregard these criteria as very hard to match, particularlyin complex areas where landslides are large andnumerous, and where the landscape exhibits consider-able geomorphological variability. We consider “effec-tive” a susceptibility class with an effectiveness ratiolarger than 1.5 or smaller than 0.5, corresponding to a50% increase or a 50% decrease from the expectedproportion of landslides in the susceptibility class.
Fig. 13 shows the efficacy of the susceptibility modelshown in Fig. 3 in describing the known distribution oflandslides (“fitting” performance, Fig. 13A), and thelocation of “future” landslides (“prediction” skill, Fig.13B and C). Based on the established criteria, 12 of the20 landslides susceptibility classes are “effective” inexplaining the distribution of the known (past) land-slides used to construct the model. In Fig. 13A, the blackand the white bars exceeding the 1.5 and the 0.5thresholds, respectively, show these effective classes. Inthe figure, the three cross-hachured bars representterrain units classified as unstable (spatial probabilityin the range from 0.55 to 0.70) where landslides werenot abundant in the multi-temporal inventory map.Comparison of Fig. 13B and C indicates that theindividual susceptibility classes were better predictors ofthe presence (black bars) or the absence (white bars) ofthe snowmelt-induced landslides than of the rainfall-induced landslides. For the latter, the number of“ineffective” classes is also larger.
It should be clear that the proposed acceptancethresholds are not absolute or fixed. The proposed limits
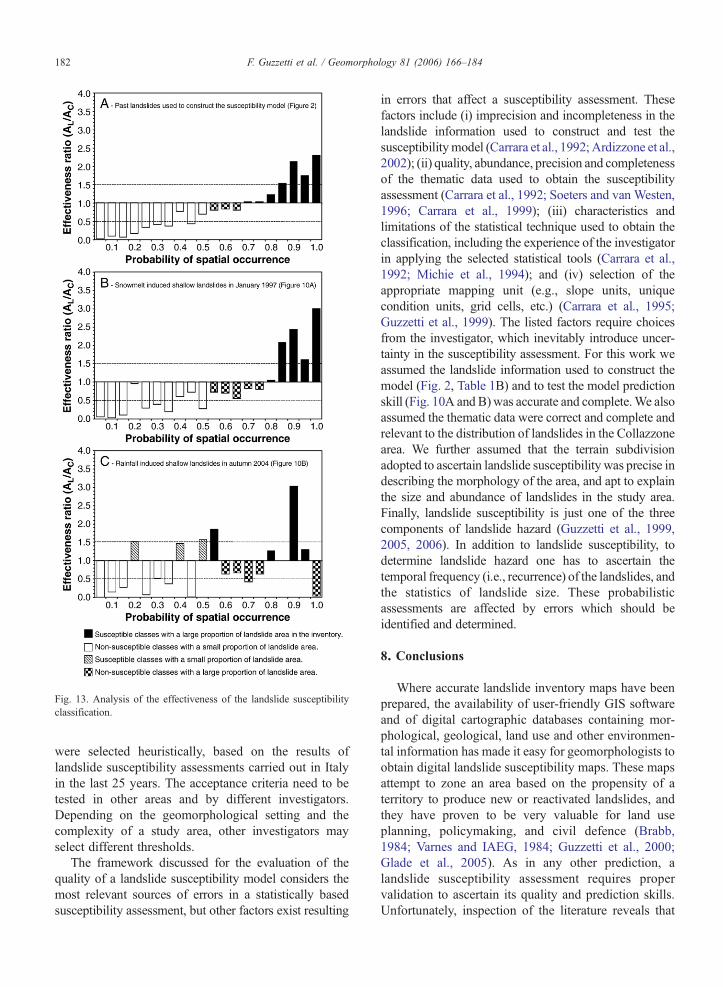
Fig. 13. Analysis of the effectiveness of the landslide susceptibilityclassification.
182 F. Guzzetti et al. / Geomorphology 81 (2006) 166–184
were selected heuristically, based on the results oflandslide susceptibility assessments carried out in Italyin the last 25 years. The acceptance criteria need to betested in other areas and by different investigators.Depending on the geomorphological setting and thecomplexity of a study area, other investigators mayselect different thresholds.
The framework discussed for the evaluation of thequality of a landslide susceptibility model considers themost relevant sources of errors in a statistically basedsusceptibility assessment, but other factors exist resulting
in errors that affect a susceptibility assessment. Thesefactors include (i) imprecision and incompleteness in thelandslide information used to construct and test thesusceptibilitymodel (Carrara et al., 1992; Ardizzone et al.,2002); (ii) quality, abundance, precision and completenessof the thematic data used to obtain the susceptibilityassessment (Carrara et al., 1992; Soeters and van Westen,1996; Carrara et al., 1999); (iii) characteristics andlimitations of the statistical technique used to obtain theclassification, including the experience of the investigatorin applying the selected statistical tools (Carrara et al.,1992; Michie et al., 1994); and (iv) selection of theappropriate mapping unit (e.g., slope units, uniquecondition units, grid cells, etc.) (Carrara et al., 1995;Guzzetti et al., 1999). The listed factors require choicesfrom the investigator, which inevitably introduce uncer-tainty in the susceptibility assessment. For this work weassumed the landslide information used to construct themodel (Fig. 2, Table 1B) and to test the model predictionskill (Fig. 10A and B)was accurate and complete.We alsoassumed the thematic data were correct and complete andrelevant to the distribution of landslides in the Collazzonearea. We further assumed that the terrain subdivisionadopted to ascertain landslide susceptibility was precise indescribing the morphology of the area, and apt to explainthe size and abundance of landslides in the study area.Finally, landslide susceptibility is just one of the threecomponents of landslide hazard (Guzzetti et al., 1999,2005, 2006). In addition to landslide susceptibility, todetermine landslide hazard one has to ascertain thetemporal frequency (i.e., recurrence) of the landslides, andthe statistics of landslide size. These probabilisticassessments are affected by errors which should beidentified and determined.
8. Conclusions
Where accurate landslide inventory maps have beenprepared, the availability of user-friendly GIS softwareand of digital cartographic databases containing mor-phological, geological, land use and other environmen-tal information has made it easy for geomorphologists toobtain digital landslide susceptibility maps. These mapsattempt to zone an area based on the propensity of aterritory to produce new or reactivated landslides, andthey have proven to be very valuable for land useplanning, policymaking, and civil defence (Brabb,1984; Varnes and IAEG, 1984; Guzzetti et al., 2000;Glade et al., 2005). As in any other prediction, alandslide susceptibility assessment requires propervalidation to ascertain its quality and prediction skills.Unfortunately, inspection of the literature reveals that
183F. Guzzetti et al. / Geomorphology 81 (2006) 166–184
this is rarely performed. Forecast without validation is ofas little use in science as in common life (Jollifee andStephenson, 2003). Landslide susceptibility assess-ments are no exception, and lack of proper verification(or falsification) jeopardizes the use of a susceptibilitymap. Indeed, if a geomorphologist cannot define thereliability, robustness, degree of fitting and predictionskill (i.e., the quality) of a susceptibility assessment,why should a planner, policy-maker or civil defencemanager use the prediction?
In this paper, we have proposed a framework toaddress this problem. The framework is based on a set oftests and related acceptance criteria aimed at establish-ing and ranking the quality of a landslide susceptibilityassessment, including the degree of model fit, therobustness of the model to changes in the input data, theerror associated with the probabilistic estimate, and themodel prediction skill. The proposed framework hasbeen successfully tested in the Collazzone area. Theexperiment has demonstrated that adopting a simple,statistical classification method applied to good-qualitydata allows geomorphologists to prepare and validate alandslide susceptibility model, at least for areas of thesize of the Collazzone study area. It remains to bedemonstrated if the same set of tests and relatedacceptance criteria are applicable to larger areas,extending for hundreds or even thousands of squarekilometres (e.g., Cardinali et al., 2002).
Two noteworthy improvements over existing land-slide susceptibility modelling efforts have beenobtained. The first improvement consists of providingan estimate of the error associated with the probability oflandslide spatial occurrence (i.e., susceptibility) ob-tained for each mapping unit in which a study area ispartitioned. This is particularly significant wherelandslide susceptibility assessments are prepared to beused for planning purposes or for establishing land useregulations (Guzzetti et al., 2000). The second improve-ment consists of having established clearly definedcriteria and associated acceptance thresholds for deter-mining and ranking the quality of a landslide suscep-tibility assessment. If adopted, the proposed frameworkwill provide for quantitative comparisons of the resultsobtained by different investigators working in differentareas, and using different methods, to predict landslidesusceptibility. Ultimately, this will add to the credibilityof our products and the quality of our science.
Acknowledgements
Work supported by CNR-GNDCI (Publication Num-ber 2893) and CNR-IRPI grants. We thank Earl E.
Brabb, the editor, and two anonymous referees for theircomments.
References
Ardizzone, F., Cardinali, M., Carrara, A., Guzzetti, F., Reichenbach, P.,2002. Uncertainty and errors in landslide mapping and landslidehazard assessment. Natural Hazards and Earth System Sciences 2(1–2), 3–14.
Brabb, E.E., 1984. Innovative approach to landslide hazard and riskmapping. Proceedings of the 4th International Symposium onLandslides, Toronto, vol. 1, pp. 307–324.
Brown, C.E., 1998. Applied Multivariate Statistics in Geohydrologyand Related Sciences. Springer-Verlag. 248 pp.
Campus, S., Forlati, F., Pegoraro, C., 1999. Studio propedeutico allavalutazione della pericolosità geologica inerente l'instabilità deiversanti mediante tecniche GIS ed approccio statistico multi-variato. In: Piemonte, Regione (Ed.), Eventi Alluvionali inPiemonte, Regione Piemonte, Torino, pp. 288–295.
Cardinali, M., Ardizzone, F., Galli, M., Guzzetti, F., Reichenbach, P.,2000. Landslides triggered by rapid snow melting: the December1996–January 1997 event in Central Italy. In: Claps, P., Siccardi, F.(Eds.), Proceedings 1st Plinius Conference on MediterraneanStorms. Bios Publisher, Cosenza, pp. 439–448.
Cardinali, M., Carrara, A., Guzzetti, F., Reichenbach, P., 2002.Landslide hazard map for the Upper Tiber River basin. CNR,Gruppo Nazionale per la Difesa dalle Catastrofi Idrogeologiche,Publication n. 2116, scale 1:100,000.
Carrara, A., 1983. A multivariate model for landslide hazardevaluation. Mathematical Geology 15, 403–426.
Carrara, A., Cardinali, M., Detti, R., Guzzetti, F., Pasqui, V.,Reichenbach, P., 1991. GIS Techniques and statistical models inevaluating landslide hazard. Earth Surface Processes and Land-forms 16 (5), 427–445.
Carrara, A., Cardinali, M., Guzzetti, F., 1992. Uncertainty in assessinglandslide hazard and risk. ITC Journal 2, 172–183.
Carrara, A., Cardinali, M., Guzzetti, F., Reichenbach, P., 1995. GIStechnology in mapping landslide hazard. In: Carrara, A., Guzzetti,F. (Eds.), Geographical Information Systems in Assessing NaturalHazards. Kluwer Academic Publisher, Dordrecht, The Nether-lands, pp. 135–175.
Carrara, A., Guzzetti, F., Cardinali, M., Reichenbach, P., 1999. Use ofGIS technology in the prediction and monitoring of landslidehazard. Natural Hazards 20 (2–3), 117–135.
Carrara, A., Crosta, G.B., Frattini, P., 2003. Geomorphological andhistorical data in assessing landslide hazard. Earth SurfaceProcesses and Landforms 28 (10), 1125–1142.
Chung, C.-J.F., Fabbri, A.G., 1999. Probabilistic prediction models forlandslide hazard mapping. Photogrammetric Engineering &Remote Sensing 65 (12), 1389–1399.
Chung, C.-J.F., Fabbri, A.G., 2003. Validation of spatial predictionmodels for landslide hazard mapping. Natural Hazards 30 (3),451–472.
Chung, C.-J.F., Fabbri, A.G., 2005. Systematic procedures of landslidehazard mapping for risk assessment using spatial predictionmodels. In: Glade, T., Anderson, M.G., Crozier, M.J. (Eds.),Landslide Risk Assessment. John Wiley, pp. 139–174.
Cohen, J., 1960. A coefficient of agreement for nominal scales.Educational and Psychological Measurement 20, 37–46.
Cruden, D., Varnes, D., 1996. Landslide types and processes. In:Turner, A., Schuster, R. (Eds.), Landslides: Investigation and
184 F. Guzzetti et al. / Geomorphology 81 (2006) 166–184
Mitigation. Transportation Research Board, National ResearchCouncil, vol. 247, pp. 36–75.
Fabbri, A.G., Chung, C.-J.F., Cendrero, C., Remondo, J., 2003. Isprediction of future landslides possible with a GIS? NaturalHazards 30 (3), 487–503.
Fisher, R.A., 1936. The use of multiple measurements in taxonomicproblems. Annales Eugenics 7, 179–188.
Glade, T., Anderson, M.G., Crozier, M.J. (Eds.), 2005. Landslide RiskAssessment. John Wiley and Sons. 832 pp.
Gorsevski, P.V., Gessler, P.E., Jankowski, P., 2003. Integrating a fuzzyk-means classification and a Bayesian approach for spatialprediction of landslide hazard. Journal of Geographical Systems5 (3), 223–251.
Guzzetti, F., Carrara, A., Cardinali, M., Reichenbach, P., 1999.Landslide hazard evaluation: an aid to a sustainable development.Geomorphology 31, 181–216.
Guzzetti, F., Cardinali, M., Reichenbach, P., Carrara, A., 2000.Comparing landslide maps: a case study in the upper Tiber RiverBasin, central Italy. Environmental Management 25 (3), 247–363.
Guzzetti, F., Reichenbach, P., Cardinali, M., Ardizzone, F., Galli, M.,2003. Impact of landslides in the Umbria Region, Central Italy.Natural Hazards and Earth System Sciences 3 (5), 469–486.
Guzzetti, F., Reichenbach, P., Cardinali, M., Galli, M., Ardizzone, F.,2005. Landslide hazard assessment in the Staffora basin, northernItalian Apennines. Geomorphology 72, 272–299.
Guzzetti, F., Galli, M., Reichenbach, P., Ardizzone, F., Cardinali, M.,2006. Landslide hazard assessment in the Collazzone area,Umbria, central Italy. Natural Hazards and Earth System Sciences6, 115–131.
Hoehler, F.K., 2000. Bias and prevalence effects on kappa viewed interms of sensitivity and specificity. Journal of Clinical Epidemi-ology 53 (5), 499–503.
Jollifee, I.T., Stephenson, D.B., 2003. Forecast Verification. APractitioner's Guide in Atmospheric Science. John Wiley. 240 pp.
Landis, J.R., Kock, G.G., 1977. The measurement of observeragreement for categorial data. Biometrics 33, 159–174.
Mason, I.B., 2003. Binary events. Chapter 3. In: Jollifee, I.T.,Stephenson, D.B. (Eds.), Forecast Verification. A Practitioner'sGuide in Atmospheric Science. John Wiley, pp. 37–76.
McCalpin, J., 1984. Preliminary age classification of landslides forinventory mapping. 21st Annual Symposium on EngineeringGeology and Soils Engineering, April 5–6, 1984, Pocatello, Idaho.13 pp.
Michie, D., Spiegelhalter, D.J., Taylor, C.C. (Eds.) 1994. MachineLearning, Neural and Statistical Classification. Internet versionavailable at http://www.amsta.leeds.ac.uk/~charles/statlog/.
Remondo, J., Gonzalez, A., Diaz De Teran, J.R., Cendrero, A., Fabbri,A., Chung, C.-J.F., 2003. Validation of Landslide SusceptibilityMaps; Examples and Applications from a Case Study in NorthernSpain. Natural Hazards 30, 437–449.
Soeters, R., van Westen, C.J., 1996. Slope instability recognitionanalysis and zonation. In: Turner, A.K., Schuster, R.L. (Eds.),Landslide Investigation and Mitigation, National ResearchCouncil. Transportation Research Board Special Report, vol.247. National Academy Press, Washington, D.C., pp. 129–177.
SPSS, 2004. SPSS 13.0 Command Syntax Reference. SPSS Inc.Chicago. 1994 p.
Varnes, D.J., and IAEG Commission on Landslides and other Mass-Movements, 1984. Landslide Hazard Zonation: A Review ofPrinciples and Practice. UNESCO Press, Paris. 63 pp.
Related Documents