Research Article Open Access Tengli et al, Biochem Anal Biochem 2013, 2:2 DOI: 10.4172/2161-1009.1000130 Volume 2 • Issue 2 • 1000130 Biochem Anal Biochem ISSN:2161-1009 Biochem, an open access journal Keywords: HPLC; Metformine; Pioglitazone; Glibenclamide; Gliclazide; Simultaneous estimation Introduction Metformin HCl is an antidiabetic drug. Chemically, it is 1,1-dimethyl biguanide hydrochloride. Metformin decrease the gluconeogenisis and increases the glucose uptake by muscles and fat cells. It is indicated for the treatment of type II diabetes mellitus, used alone or in combination with sulfonylureas, alpha-glycosidase inhibitors, or insulin. It has fewer adverse effects and is generally tolerable and self limiting. Although its exact mechanism of action is not completely understood, it mainly has blood glucose-lowering activity which appears to be primarily through suppression of hepatic glucose output. Its therapeutic blood glucose-normalizing action is dependent on the presence of circulating insulin. Various methods have been reported for the analysis of metformine alone or its combination with other drugs in different dosage forms is capillary electrophoresis [1,2], HPLC [3,4], Liquid chromatography–mass spectrometry (LCMS), [5], spectrophotometric [6], High performance thin layer chromatography (HPTLC) [7] and spectrofluorometric method [8]. Pioglitazone is a thiazolidinedione antidiabetic agent, chemically it is (RS)-5-(4-[2-(5-ethylpyridin-2- yl)ethoxy]benzyl)thiazolidine-2,4- dione. It selectively stimulates the peroxisome proliferator-activated receptor gamma (PPAR-γ) and to a lesser extent PPAR-α. Pioglitazone modulates the transcription of the insulin-sensitive genes involved in the control of glucose and lipid metabolism in the muscle, adipose tissue, and in the liver. It is used for the treatment of type II diabetes mellitus either alone or in combination with other oral antidiabetic drugs. Various methods reported for the assay of pioglitazone alone or its combination with other drugs is HPLC [9-12], HPTLC [13], spectrophotometry [14,15], LCMS/MS [16], chemometrics [17] and voltametry [18]. Glibenclamide is a second generation sulphonyl urea oral hy- poglycemic agent, chemically it is 1-[4-[2-(chloro 2-methoxybenza- mido) ethyl]-benzenesulphonyl]-3cyclohexylurea, 5-chloro-N-[2-[4- [[[(cyclohexyl(amino)carbonyl]-amino]sulphonyl] phenyl] ethyl-2- methoxy benzamide. It is more potent than first generation sulfonyl ureas. It is used to assist to control mild to moderately severe type II diabetes mellitus that does not require insulin that can be adequately controlled by diet alone. It is drug of choice for initiating treatment in noninsulin-dependent diabetes mellitus when diet and weight control fails. It stimulates the secretion and enhances the utilization of insulin by appropriate tissues. Different methods have been reported for the analysis of Glibenclamide alone or its combination with other drugs is HPLC [19-24], voltametric [25], spectophotometry [25] and LCMS/ MS [26]. Experimental Materials, reagents and chemicals Working standards, Metformine, Glibenclamide, Pioglitazone and Gliclazide was from Ranbaxy laboratories, New Delhi, India. Potassium dihydrogen phosphate, orthophosphoric acid AR grade, HPLC grade Acetonitrile, methanol and water used were from Rankem, Mumbai. e pharmaceutical dosage form containing 500 mg MET, 15 mg PIOG and 5 mg GLIB, Triglycomet 520 mg, 20 tablets (USV Pharmaceuticals Ltd.) purchased from a local drug store. Gliclazide, which was employed as an internal standard (IS) was obtained from Ranbaxy Laboratories, New Delhi. Equipment The development and validation of the assay was performed on a Shimadzu LC2010 integrator a 4-liquid gradient HPLC system (Kyoto Japan), provided with high speed auto sampler, column oven, degasser and UV detector. LC solution software was used for data acquisition. *Corresponding author: Anandkimar R. Tengli, Department of Pharmaceutical Chemistry, JSS College of Pharmacy, JSS University, S. S. Nagar, Mysore-570015, Karnataka, India, E-mail: [email protected] Received February 28, 2013; Accepted March 26, 2013; Published March 29, 2013 Citation: Tengli AR, Gurupadayya BM, Soni N, Vishwanathan B (2013) Method Development and Validation of Metformine, Pioglitazone and Glibenclamide in Tablet Dosage Form by using RP-HPLC. Biochem Anal Biochem 2: 130. doi:10.4172/2161-1009.1000130 Copyright: © 2013 Tengli AR, et al. This is an open-access article distributed under the terms of the Creative Commons Attribution License, which permits unrestricted use, distribution, and reproduction in any medium, provided the original author and source are credited. Abstract Reverse phase high performance liquid chromatographic method has developed for the simultaneous estimation of metformine, pioglitazone and glibenclamide in tablet dosage for using gliclazide as an internal standard. The separation was achieved at ambient temperature with low pressure gradient mode by using 5 µ size phenomenex luna CN (100R 250×4.60 (mm) column with mobile phase containing acetonitrile, water and buffer (0.5% potassium dihydrogen phosphate) pH 2.5 adjusted with orthophosphoic acid in the ratio of 60:20:20. The flow rate was 1 mL min -1 and eluent was monitored at 230 nm by using UV detector. The selected chromatographic conditions effectively separated Metformine, pioglitazone and Glibenclamide with the retention time of 2.2, 2.8 and 5.8 min respectively. The linearity range for metformine, pioglitazone and glibenclamide is found in the range of 50-300 µg mL -1 , 1.5-9.0 µg mL -1 and 0.5- 3.0 µg mL -1 respectively. The developed method was found to be accurate, simple, specific and reproducible. It can also be used for routine quality control analysis of these antidiabetic drugs in combinational dosage forms. Method Development and Validation of Metformine, Pioglitazone and Glibenclamide in Tablet Dosage Form by using RP-HPLC Anandkimar R. Tengli*, Gurupadayya BM, Neeraj Soni1 and Vishwanathan B Department of Pharmaceutical Chemistry, JSS College of Pharmacy, JSS University, S. S. Nagar, Mysore-570015, Karnataka, India Biochemistry & Analytical Biochemistry B i o c h e m i s t r y & A n a l y t i c a l B i o c h e m i s t r y ISSN: 2161-1009

Welcome message from author
This document is posted to help you gain knowledge. Please leave a comment to let me know what you think about it! Share it to your friends and learn new things together.
Transcript

Research Article Open Access
Tengli et al, Biochem Anal Biochem 2013, 2:2 DOI: 10.4172/2161-1009.1000130
Volume 2 • Issue 2 • 1000130Biochem Anal BiochemISSN:2161-1009 Biochem, an open access journal
Keywords: HPLC; Metformine; Pioglitazone; Glibenclamide;Gliclazide; Simultaneous estimation
IntroductionMetformin HCl is an antidiabetic drug. Chemically, it is 1,1-dimethyl
biguanide hydrochloride. Metformin decrease the gluconeogenisis and increases the glucose uptake by muscles and fat cells. It is indicated for the treatment of type II diabetes mellitus, used alone or in combination with sulfonylureas, alpha-glycosidase inhibitors, or insulin. It has fewer adverse effects and is generally tolerable and self limiting. Although its exact mechanism of action is not completely understood, it mainly has blood glucose-lowering activity which appears to be primarily through suppression of hepatic glucose output. Its therapeutic blood glucose-normalizing action is dependent on the presence of circulating insulin. Various methods have been reported for the analysis of metformine alone or its combination with other drugs in different dosage forms is capillary electrophoresis [1,2], HPLC [3,4], Liquid chromatography–mass spectrometry (LCMS), [5], spectrophotometric [6], High performance thin layer chromatography (HPTLC) [7] and spectrofluorometric method [8].
Pioglitazone is a thiazolidinedione antidiabetic agent, chemically it is (RS)-5-(4-[2-(5-ethylpyridin-2- yl)ethoxy]benzyl)thiazolidine-2,4-dione. It selectively stimulates the peroxisome proliferator-activated receptor gamma (PPAR-γ) and to a lesser extent PPAR-α. Pioglitazone modulates the transcription of the insulin-sensitive genes involved in the control of glucose and lipid metabolism in the muscle, adipose tissue, and in the liver. It is used for the treatment of type II diabetes mellitus either alone or in combination with other oral antidiabetic drugs. Various methods reported for the assay of pioglitazone alone or its combination with other drugs is HPLC [9-12], HPTLC [13], spectrophotometry [14,15], LCMS/MS [16], chemometrics [17] and voltametry [18].
Glibenclamide is a second generation sulphonyl urea oral hy-poglycemic agent, chemically it is 1-[4-[2-(chloro 2-methoxybenza-mido) ethyl]-benzenesulphonyl]-3cyclohexylurea, 5-chloro-N-[2-[4-[[[(cyclohexyl(amino)carbonyl]-amino]sulphonyl] phenyl] ethyl-2-methoxy benzamide. It is more potent than first generation sulfonyl ureas. It is used to assist to control mild to moderately severe type II diabetes mellitus that does not require insulin that can be adequately controlled by diet alone. It is drug of choice for initiating treatment in
noninsulin-dependent diabetes mellitus when diet and weight control fails. It stimulates the secretion and enhances the utilization of insulin by appropriate tissues. Different methods have been reported for the analysis of Glibenclamide alone or its combination with other drugs is HPLC [19-24], voltametric [25], spectophotometry [25] and LCMS/MS [26].
ExperimentalMaterials, reagents and chemicals
Working standards, Metformine, Glibenclamide, Pioglitazone and Gliclazide was from Ranbaxy laboratories, New Delhi, India. Potassium dihydrogen phosphate, orthophosphoric acid AR grade, HPLC grade Acetonitrile, methanol and water used were from Rankem, Mumbai. The pharmaceutical dosage form containing 500 mg MET, 15 mg PIOG and 5 mg GLIB, Triglycomet 520 mg, 20 tablets (USV Pharmaceuticals Ltd.) purchased from a local drug store. Gliclazide, which was employed as an internal standard (IS) was obtained from Ranbaxy Laboratories, New Delhi.
Equipment
The development and validation of the assay was performed on a Shimadzu LC2010 integrator a 4-liquid gradient HPLC system (Kyoto Japan), provided with high speed auto sampler, column oven, degasser and UV detector. LC solution software was used for data acquisition.
*Corresponding author: Anandkimar R. Tengli, Department of Pharmaceutical Chemistry, JSS College of Pharmacy, JSS University, S. S. Nagar, Mysore-570015, Karnataka, India, E-mail: [email protected]
Received February 28, 2013; Accepted March 26, 2013; Published March 29, 2013
Citation: Tengli AR, Gurupadayya BM, Soni N, Vishwanathan B (2013) Method Development and Validation of Metformine, Pioglitazone and Glibenclamide in Tablet Dosage Form by using RP-HPLC. Biochem Anal Biochem 2: 130. doi:10.4172/2161-1009.1000130
Copyright: © 2013 Tengli AR, et al. This is an open-access article distributed under the terms of the Creative Commons Attribution License, which permits unrestricted use, distribution, and reproduction in any medium, provided the original author and source are credited.
AbstractReverse phase high performance liquid chromatographic method has developed for the simultaneous estimation of
metformine, pioglitazone and glibenclamide in tablet dosage for using gliclazide as an internal standard. The separation was achieved at ambient temperature with low pressure gradient mode by using 5 µ size phenomenex luna CN (100R 250×4.60 (mm) column with mobile phase containing acetonitrile, water and buffer (0.5% potassium dihydrogen phosphate) pH 2.5 adjusted with orthophosphoic acid in the ratio of 60:20:20. The flow rate was 1 mL min-1 and eluent was monitored at 230 nm by using UV detector. The selected chromatographic conditions effectively separated Metformine, pioglitazone and Glibenclamide with the retention time of 2.2, 2.8 and 5.8 min respectively. The linearity range for metformine, pioglitazone and glibenclamide is found in the range of 50-300 µg mL-1, 1.5-9.0 µg mL-1 and 0.5-3.0 µg mL-1 respectively. The developed method was found to be accurate, simple, specific and reproducible. It can also be used for routine quality control analysis of these antidiabetic drugs in combinational dosage forms.
Method Development and Validation of Metformine, Pioglitazone and Glibenclamide in Tablet Dosage Form by using RP-HPLCAnandkimar R. Tengli*, Gurupadayya BM, Neeraj Soni1 and Vishwanathan BDepartment of Pharmaceutical Chemistry, JSS College of Pharmacy, JSS University, S. S. Nagar, Mysore-570015, Karnataka, India
Biochemistry & Analytical BiochemistryBi
oche
mist
ry & Analytical Biochem
istry
ISSN: 2161-1009

Citation: Tengli AR, Gurupadayya BM, Soni N, Vishwanathan B (2013) Method Development and Validation of Metformine, Pioglitazone and Glibenclamide in Tablet Dosage Form by using RP-HPLC. Biochem Anal Biochem 2: 130. doi:10.4172/2161-1009.1000130
Volume 2 • Issue 2 • 1000130Biochem Anal BiochemISSN:2161-1009 Biochem, an open access journal
Page 2 of 5
Chromatographic condition
The chromatographic column, phenomenex luna 5 µ CN 100R, 250×4.60 mm (5 micron size) column was used as stationary phase. The mobile phase was prepared with acetonitrile, water and buffer (60:20:20). Buffer solution was prepared by dissolving 0.5% potassium dihydrogen orthophosphate in 100 mL of water. The pH was adjusted to 2.5 with orthophosphoric acid; flow rate was 1 mL min-1 and injection volume was 20 µl. The detection was performed at 230 nm using UV detector at 25°C.
Preparation of standard solution
Separate stock solutions of 1000 µg mL-1 of metformine, pioglitazone and glibenclamide were prepared by dissolving in 25 mL HPLC grade methanol and diluted to 1000 mL with acetonitrile, then 1 mL of stock solution into a 10 mL of standard volumetric flask and diluted with acetonitrile. The prepared stock solutions were stored at 4°C and protected from light.
Preparation of linearity solution
Linearity solutions were freshly prepared from the stock solution by diluting with acetonitrile as 50, 100, 150, 200, 250 and 300 µg mL-1 of metformine, 1.5, 3, 4.5, 6, 7.5 and 9 µg mL-1 of pioglitazone and 0.5, 1, 1.5, 2, 2.5 and 3 µg mL-1 glibenclamide and IS (internal standard), respectively. Each solution was injected in triplicate and chromatographed under the same chromatographic conditions as specified above. Gliclazide (10 µg mL-1) was used as internal standard for determination of mixtures of metformine, pioglitazone and glibenclamide with Gliclazide. Linear relationships were obtained when drug to-internal standard peak-area ratios were plotted against the corresponding concentrations for each drug.
Preparation of sample solution for batch analysis
Average weight was calculated by weighing 20 tablets. The tablets were crushed into homogenous powder. A quantity of powder equivalent to one tablet containing 500 mg of metformine, 15 mg of pioglitazone and 5 mg of glibenclamide was transferred into a 100 mL volumetric flask. To this flask, 50 mL of methanol were added, and the solution was sonicated for 25 min with intermittent shaking. The solution was cooled to ambient temperature. Then the volume was made up with acetonitrile and centrifuged at 10,000 rpm for 10 min. The centrifuged solution filtered through 0.45 µm nylon filters (Millipore, Milford, MA, USA). From the filtered solution, aliquots of appropriate volume were transferred to 10 mL volumetric flasks and diluted to volume with acetonitrile to furnish the concentration range listed in table 1.
Analytical method validation
Specificity of the method: The terms selectivity and specificity are often used interchangeably. Specificity is the ability of the method to measure the analyte response in the presence of its potential impurities. This parameter was performed to know the retention time of each
drug in a mixture and in the sample to understand if any drug-drug interaction or drug-excipients interaction is present.
System suitability: System suitability test is used to verify that the resolution and reproducibility of the chromatographic systems are adequate for the analysis to be done. The tests are based on the facts that the equipments, electronics, samples to be analyzed constitute an integral system that can be evaluated as such. The limits for system suitability were set for theoretical plates, resolution and asymmetry.
Linear range: The linearity of the method was evaluated by analyzing different concentration of the drugs. According to ICH recommendations [25], at least five concentrations must be used. In this study, six concentrations were chosen in the ranges of 50-300 µg mL-1 metformine, 1.5-9.0 µg mL-1 pioglitazone and 0.5-3 µg mL-1 glibenclamide respectively.
Accuracy and precision: The accuracy of the method was determined by recovery experiments using the standard addition method. Each solution was injected in triplicate and percentage recovery was calculated. The precision of the method was assessed by studying intra-day and inter-day variation. In the intra-day studies, standard and sample solutions were analyzed in triplicate on the same day and percentage RSD was calculated. In case inter-day studies, standard and sample solutions were analyzed in triplicate on three consecutive days and percentage RSD were calculated.
Limits of detection (LOD) and limit quantitation (LOQ): In accordance with ICH recommendations [27], the approach based on the standard deviation of the response and the slope of the calibration plots was used to determine detection and quantification limits. LOD and LOQ values were estimated as [(standard deviation of repeatability)/(Slope of the regression equation)] by multiplying with 3.3 and 10 respectively. The values obtained are given in table 1.
Selectivity: The selectivity of the method was evaluated by assessing whether excipients present in the pharmaceutical formulations interfered with the analysis. A placebo for each tablet was prepared by mixing the respective excipients, and solutions were prepared by following the procedure described in the section on sample preparation. The commonly used tablet excipients did not interfere with the method.
Robustness: Robustness is a measure of capacity of analytical methods to remain unaffected by small but deliberate variation of the operating conditions. It was tested by studying the effect of changing mobile phase pH by ± 0.2, the amount of buffer in the mobile phase by ± 2%, and detector wavelength by ± 2 nm
Ruggedness: To test the ruggedness of the method, the analysis was done on different days and different chemists to check for any changes in the chromatograph. Percentage RSD for the retention time and area was calculated.
Results and DiscussionTo establish and validate an efficient method for analysis of
Metformine Pioglitazone Glibenclamide Gliclazide (IS)Retention time
(min)Peak area Retention time
(min)Peak area Retention time
(min)Peak area Retention time
(min)Peak area
Con. range 50-300 µg mL-1 1.5- 9 µg mL-1 0.5-3 µg mL-1 10 µg mL-1
Mean 2.24 3336282 2.82 3253041 5.85 3798394 6.74 2388208SD 0.0194 1372116 0.0147 1339617 0.0116 1705821 0.0126 1842.91RSD 0.8632 41.12709 0.5204 41.18045 0.1997 44.90902 0.1876 0.07716
Table 1: Results of system suitability study.

Citation: Tengli AR, Gurupadayya BM, Soni N, Vishwanathan B (2013) Method Development and Validation of Metformine, Pioglitazone and Glibenclamide in Tablet Dosage Form by using RP-HPLC. Biochem Anal Biochem 2: 130. doi:10.4172/2161-1009.1000130
Volume 2 • Issue 2 • 1000130Biochem Anal BiochemISSN:2161-1009 Biochem, an open access journal
Page 3 of 5
these drugs in pharmaceutical formulations, preliminary tests were performed with the objective of selecting optimum chromatographic conditions. The separation was tried using either column described previously in the literature or alternative stationary phases. The main problems encountered during these investigations were lack of resolution between metformine, pioglitazone, glibenclamide and IS. To solve these problems, three columns, C18, C8, and CN, were used for simultaneous determination of the drugs. The best resolution and peak shape, without excessive tailing, were obtained by use of the CN column. The effect of mobile phase composition, flow rate and pH were also studied. The best resolution with reasonable retention time was obtained with mobile phase containing acetonitrile, water and 0.5% of potassium dihydrogen phosphate buffer pH 2.5 adjusted with orthophosphoric acid (60:20:20) with 1.0 mL min-1 flow rate. To avoid multiple peaks of peptides on reversed phase columns, the pH must be controlled with buffers, for example potassium dihydrogen phosphate. A major reason for using a concentration of 0.5 mM was to achieve maximum sensitivity of UV detection at low wavelengths. Members of this class of antidiabetic drugs contain weak chromophores and
are characterized by low molar absorptive, so the detector was set at 230 nm to increase the sensitivity of the method. The specificity of the method is illustrated in figure 1 which indicates that separation of the compounds was complete. Average retention times ± standard deviation for IS, MET, PIOG and GLIB were 2.23785 ± 0.07850, 2.8217 ± 0.08578 and 5.8691 ± 0.017347 min, respectively, for six replicate analyses. In determination of accuracy and precision, recovery was 100 ± 3%, which indicates the method is accurate, and intra-day and inter-day variation, as RSD, were no more than 5.16%, indicating the method is precise. In determination of the robustness of the method, slight variation of mobile phase pH, amount of buffer, in the mobile phase, and detector wavelength had no significant effect on chromatographic resolution.
Method validation
System suitability: The RSD values of peak area and retention time for drugs and IS are within 2% indicating the suitability of the system (Table 2).
Linearity: The calibration curves were prepared by plotting the peak areas of the drug to IS which were linear in the range of 50-300,
N NH2N
NH
H3C
CH3
NH2
MetformineN O
NH
S
O
OPioglitazone
OCH3
ClNH
S
HN
HN
O
OO
O
Glabenclamide
(a)
(b)
(c)
Figure 1: Chemical structures of drugs.
Name of the drug Actual concentration (µg mL-1)
Intra-day Inter-dayFound concentration (µg mL-1) ± SD RSD (%) RME (%) Found concentration (µg mL-1) ± SD RSD (%) RME (%)
MET50 49.28 ± 0.4124 0.837 0.374 49.928 ± 0.053 0.105 0.047
100 99.88 ± 0.0525 0.052 0.023 99.876 ± 0.084 0.084 0.038150 149.90 ± 0.0746 0.049 0.022 149.92 ± 0.031 0.021 0.009
PIOG1.5 1.474 ± 0.018 1.232 0.551 1.456 ± 0.038 2.597 1.1623 2.920 ± 0.052 1.796 0.803 2.924 ± 0.048 1.651 0.738
4.5 4.446 ± 0.040 0.894 0.400 4.462 ± 0.024 0.535 0.239
GLIB0.5 0.484 ± 0.005 1.132 0.506 0.462 ± 0.024 5.168 2.3111.0 0.958 ± 0.022 2.263 1.012 0.972 ± 0.016 1.691 0.7561.5 1.480 ± 0.012 0.828 0.370 1.478 ± 0.011 0.741 0.331
Table 2: Intra-day and inter-day precision and accuracy of MET, PIOG and GLIB.
Citation: Tengli AR, Gurupadayya BM, Soni N, Vishwanathan B (2013) Method Development and Validation of Metformine, Pioglitazone and Glibenclamide in Tablet Dosage Form by using RP-HPLC. Biochem Anal Biochem 2: 130. doi:10.4172/2161-1009.1000130
Volume 2 • Issue 2 • 1000130Biochem Anal BiochemISSN:2161-1009 Biochem, an open access journal
Page 4 of 5
1.5-9 and 0.5-3 µg mL-1 MET, PIOG and GLIB, respectively. Peak area ratios and concentrations were subjected to least square linear regression analysis to calculate the calibration equations and correlation coefficients. The mean regression equations were found as Y=0.300x (R2=0.971, n=6), Y=0.300x (R²=0.971, n=6) and Y=354x (R²=0.97, n=6) for MET, PIOG and GLIB, respectively. y=ax+b where “y” is the peak area ratio of drugs, “a” is the slope, “b” is the intercept and “x” is the concentration of the measured solution in µg mL-1. The result shows that there is an excellent correlation between the peak area ratios and the concentrations of drugs in the range tested.
LOD and LOQ: The LOD was 0.003 µg mL-1 for MET, 0.02 µg mL-1 for PIOG and 0.015 µg mL-1 for GLIB at a signal to noise ratio of 3.1. The limit of quantification was determined as 0.05 MET, 0.2 µg mL-1 for PIOG and 0.05 µg mL-1 for GLIB at a signal to noise ratio of 10:1.
Precision: Intra-day precision was performed by relative standard deviation of five repeated assays of samples at the three concentration levels. Inter-day precision was determined by analyzing the same set of samples of five different days. The RSD values were found to be 0.021-0.837% for MET, 0.535-2.597% for PIOG and 0.741-5.168% for GLIB respectively, indicating good precision (Table 2).
Recovery: To examine the accuracy of the method, recovery studies were carried out by standard addition method [27,28]. The percent recovery of the added standard to the assay samples was
calculated from:( )1100Recovery% = X100u
a
c cc−
where C1 is the total concentration of analyte found; Cu is the concentration analyte present in the formulation; and Ca is the concentration added to the formulation. The average percent recoveries obtained as 98.0-100.04% indicate good accuracy of the method (Table 3)
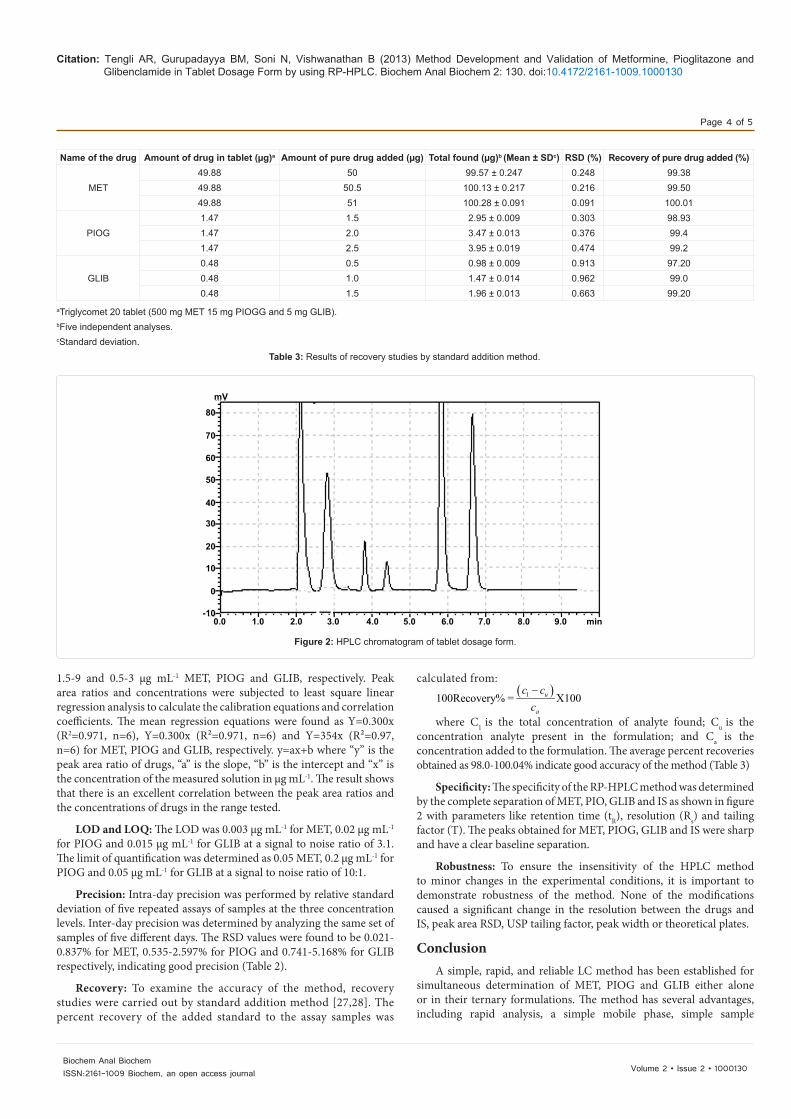
Specificity: The specificity of the RP-HPLC method was determined by the complete separation of MET, PIO, GLIB and IS as shown in figure 2 with parameters like retention time (tR), resolution (Rs) and tailing factor (T). The peaks obtained for MET, PIOG, GLIB and IS were sharp and have a clear baseline separation.
Robustness: To ensure the insensitivity of the HPLC method to minor changes in the experimental conditions, it is important to demonstrate robustness of the method. None of the modifications caused a significant change in the resolution between the drugs and IS, peak area RSD, USP tailing factor, peak width or theoretical plates.
Conclusion A simple, rapid, and reliable LC method has been established for
simultaneous determination of MET, PIOG and GLIB either alone or in their ternary formulations. The method has several advantages, including rapid analysis, a simple mobile phase, simple sample
Name of the drug Amount of drug in tablet (µg)a Amount of pure drug added (µg) Total found (µg)b (Mean ± SDc) RSD (%) Recovery of pure drug added (%)
MET49.88 50 99.57 ± 0.247 0.248 99.3849.88 50.5 100.13 ± 0.217 0.216 99.5049.88 51 100.28 ± 0.091 0.091 100.01
PIOG1.47 1.5 2.95 ± 0.009 0.303 98.931.47 2.0 3.47 ± 0.013 0.376 99.41.47 2.5 3.95 ± 0.019 0.474 99.2
GLIB0.48 0.5 0.98 ± 0.009 0.913 97.200.48 1.0 1.47 ± 0.014 0.962 99.00.48 1.5 1.96 ± 0.013 0.663 99.20
aTriglycomet 20 tablet (500 mg MET 15 mg PIOGG and 5 mg GLIB).bFive independent analyses. cStandard deviation.
Table 3: Results of recovery studies by standard addition method.
80
70
60
50
40
30
20
10
0
-100.0 1.0 2.0 3.0 4.0 5.0 6.0 7.0 8.0 9.0 min
mV
Figure 2: HPLC chromatogram of tablet dosage form.
Citation: Tengli AR, Gurupadayya BM, Soni N, Vishwanathan B (2013) Method Development and Validation of Metformine, Pioglitazone and Glibenclamide in Tablet Dosage Form by using RP-HPLC. Biochem Anal Biochem 2: 130. doi:10.4172/2161-1009.1000130
Volume 2 • Issue 2 • 1000130Biochem Anal BiochemISSN:2161-1009 Biochem, an open access journal
Page 5 of 5
preparation, and improved sensitivity. It is suitable for analysis of these antidiabetic agents in their ternary formulations in a single isocratic run, in contrast with previous methods. This makes the method suitable for routine analysis in quality-control laboratories.
Acknowledgement
The authors would like to thank JSS University Mysore, India, JSS College of Pharmacy Mysore, Karnataka, India for providing all facilities to complete this research work.
References
1. Lai EP, Feng SY (2006) Solid phase extraction--non-aqueous capillary electrophoresis for determination of metformin, phenformin and glyburide in human plasma. J Chromatogr B Analyt Technol Biomed Life Sci 843: 94-99.
2. Ceren Y (2005) Method development and validation for the simultaneous determination of rosiglitazone and metformine in pharmaceutical preparations by capillary zone electrophrosis. Analytica Chemica Acta 549: 88-95.
3. Vasudevan M, Ravi J, Ravisankar S, Suresh B (2001) ION-pair liquid chromatography technique for the estimation of metformin in its multicomponent dosage forms. J Pharm Biomed Anal 25: 77-84.
4. Yao J, Shi YQ, Li ZR, Jin SH (2007) Development of a RP-HPLC method for screening potentially counterfeit anti-diabetic drugs. J Chromatogr B Analyt Technol Biomed Life Sci 853: 254-259.
5. Shyamala M (2011) Validated RP-HPLC for simultaneous estimation of sitagliptin phosphate and metformine hydrochloride in tablet dosage form. American J Pharma Tech Rese 2: 2249-2287.
6. Chaturvedi RSPK (2008) Simultaneous spectrophotometric estimation and validation of three component tablet formulation containing pioglitazone hydrochlorthiazide, metformine hydrochloride and glibenclamide. Analytical Letters12: 2133-2142.
7. Modi DK, Patel BH (2012) Simultaneous determination of metformine hydrochloride and glipizide in tablet formulation by HPTLC. J Liq Chromatogr Relat Technol 35: 28-39.
8. El-Bagary RI, Elkady EF, Ayoub BM (2011) Spectroflourometric and spectrophotometric methods for the determination of sitagliptin in binary mixture with metformine and ternary mixture with metformine and sitagliptin alkaline degradation product. Int J of Biomed Sci 7: 62-69.
9. Musmade PB, Talole KB, Deshpande PB, Karthik A, Pathak SM, et al. (2011) Novel liquid chromatographic method for simultaneous estimation of pioglitazone and glimepiride in rat plasma by solid phase extraction: application to preclinical pharmacokinetic studies. Arzneimittelforschung 1: 23-31.
10. Praveenkumar RB (2010) Method development and validation of simultaneous determination of pioglitazone and glimepiride in pharmaceutical dosage form by RP-HPLC. Int J Chem Tech Res 1: 50-63.
11. Navaneethan G, Karunakaran K, Elango KP (2011) Simultaneous estimation of pioglitazone, glimepiride and glimepiride impurities in combination drug product by a validated stability-indicating RP-HPLC method. J Chil Chem Soc 3: 815-818.
12. Venkatesh P, Harisudhan T, Choudhury H, Mullangi R, Srinivas NR (2006) Simultaneous estimation of six anti-diabetic drugs--glibenclamide, gliclazide, glipizide, pioglitazone, repaglinide and rosoglitazone: development of novel HPLC method for use in the analysis of pharmaceutical formulations and its application to human plasma assay. Biomed Chromatogr 20: 1043-1048.
13. Singh D, Dwivedi SC, Kushnoor A (2010) Development and validation of a HPTLC method for simultaneous estimation of pioglitazone and glimepiride in bulk and tablet dosage form. Int J biomed And Adv Res 2: 171-175.
14. Kishore L, Kaur N (2011) Estimation of pioglitazone and glimepiride in its pharmaceutical dosage form by spectrophotometric methods. Der Pharmacia Lettre 4: 276-284.
15. Indrajeet S, Khushboo M (2011) Analytical method development and validation for the simultaneous estimation of pioglitazone and glimepiride in tablet dosage form by multiwavelength spectroscopy. J Applied Pharma Sci 6: 159-161.
16. Pinaki S, Uttam (2009) BLC-MS-MS development and validation for simultaneous quantitation of metformine, glimepiride and pioglitazone in human plasma and its application to a bioequivalence study. Chromatographia 11-12: 1243-1250.
17. Hegazy MA, El-Ghobashy MR, Yehia AM, Mostafa AA (2009) Simultaneous determination of metformine hydrochlorthiazide and pioglitazone hydrochloride in binary mixture and in their trnary mixture with pioglitazone acid degradate using spectrophotometric and chemometric methods. Drug Test Anal 1: 339-349.
18. Badawy WA, El-Ries MA, Mahdi IM (2010) Electrochemical determination of some antidiabetic drugs for type 2 diabetic patients. Talanta 82: 106-112.
19. Uday KR, Anna PN (2011) Determination of glipizide, glibenclamide and gimepride in a tablet dosage form in the presence of metformine hydrochloride by ion pair reversed phase liquid chromatography technique. J Anal Bioanal Techniques 1:105
20. Emilsson H, Sjöberg S, Svedner M, Christenson I (1986) High performance liquid chromatographic determination of glibenclamide in human plasma. J Chromatogr 383: 93-102.
21. Bandarkar FS, Khattab IS (2010) Simultaneous estimation of glibenclamide, gliclazide and metformine hydrochloride from bulk and commercial products using a validated ultra fast liquid chromatographic technique. J Liq Chromatogr Relat Technol 33: 1814-1830.
22. Lakshmi KS, Rajesh T (2011) Separation and quantification of eight antidiabetic drugs on a high-performance liquid chromatography: its application to human plasma assay. ISRN Pharm 2011: 521353.
23. Yao J, Shi YQ, Li ZR, Jin SH (2007) Development of a RP-HPLC method for screening potentially counterfeit anti-diabetic drugs. J Chromatogr B Analyt Technol Biomed Life Sci 853: 254-259.
24. Aburuz S, Millership J, McElnay J (2005) The development and validation of liquid chromatography method for the simultaneous determination of metformin and glipizide, gliclazide, glibenclamide or glimperide in plasma. J Chromatogr B Analyt Technol Biomed Life Sci 817: 277-286.
25. Da Silva Fernandes R, da Costa FS, Valderrama P, Março PH, de Lima KM (2012) Non-destructive detection of adulterated tablets of glibenclamid using NIr and solid phase fluorescence spectroscopy and chemometric methods. J Pharm Biomed Anal 66: 85-90.
26. S Gao (2007) LC-MS/MS determination of glibenclamide in human plasma. Chinese Pharmaceutical 16: 1262-1274.
27. The European Agency for the Evaluation of Medicinal Products (2005) ICH Topic Q2R Note for guidance on validation of analytical procedures: methodology.
28. Ewing GW (1995) International Methods of Chemical Analysis, (5thedn), Lippincott-Raven, Philadelphia 484-486.
Citation: Tengli AR, Gurupadayya BM, Soni N, Vishwanathan B (2013) Method Development and Validation of Metformine, Pioglitazone and Glibenclamide in Tablet Dosage Form by using RP-HPLC. Biochem Anal Biochem 2: 130. doi:10.4172/2161-1009.1000130
Related Documents