Preventive Veterinary Medicine 102 (2011) 206–217 Contents lists available at ScienceDirect Preventive Veterinary Medicine j our na l ho me p age: ww w.elsevier.com/locate/prevetmed Metapopulation dynamics and determinants of H5N1 highly pathogenic avian influenza outbreaks in Indonesian poultry Matthew L. Farnsworth a,∗ , Stephanie Fitchett b , Muhammad Muharram Hidayat e , Caryl Lockhart c , Christopher Hamilton-West c , Eric Brum d , Stephen Angus d , Bagoes Poermadjaja e , Julio Pinto c a USDA-APHIS-VS-Centers for Epidemiology and Animal Health, 2150 Centre Avenue, Bldg. B, Mail Stop 2W4 Fort Collins, CO 80526 USA b School of Mathematical Sciences, University of Northern Colorado, Greeley, CO 80639, USA c Emergency Prevention System for Priority Animal and Plant Pests and Diseases/Global Early Warning and Response System (EMPRES/GLEWS), Animal Health Service, Animal Production and Health Division, Food and Agriculture Organization of the United Nations, Viale delle Terme di Caracalla, Rome 00153, Italy d Emergency Centre for Transboundary Animal Diseases (ECTAD), Food and Agriculture Organization of the United Nations, Menara Thamrin 7th Floor, Jl. M.H. Thamrin, Kav. 3, Jakarta 10250, Indonesia e Directorate General of Livestock and Animal Health Services, Ministry of Agriculture, Indonesia a r t i c l e i n f o Keywords: H5N1 highly pathogenic avian influenza PDSR Metapopulation dynamics Indonesia Spatial clustering Bayesian occurrence models a b s t r a c t In 2008, the Indonesian Government implemented a revised village-level Participatory Dis- ease Surveillance and Response (PDSR) program to gain a better understanding of both the magnitude and spatial distribution of H5N1 highly pathogenic avian influenza (HPAI) out- breaks in backyard poultry. To date, there has been considerable collection of data, but limited publically available analysis. This study utilizes data collected by the PDSR program between April 2008 and September 2010 for Java, Bali and the Lampung Province of Suma- tra. The analysis employs hierarchical Bayesian occurrence models to quantify spatial and temporal dynamics in backyard HPAI infection reports at the District level in 90 day time periods, and relates the probability of HPAI occurrence to PDSR-reported village HPAI infec- tion status and human and poultry density. The probability of infection in a District was assumed to be dependent on the status of the District in the previous 90 day time period, and described by either a colonization probability (the probability of HPAI infection in a District given there had not been infection in the previous 90 day time period) or a persis- tence probability (the probability of HPAI infection being maintained in the District from the previous to current 90 day period). Results suggest that the number of surveillance activi- ties in a district had little relationship to outbreak occurrence probabilities, but human and poultry densities were found to have non-linear relationships to outbreak occurrence prob- abilities. We found significant spatial dependency among neighboring districts, indicating that there are latent spatial processes that are not captured by the covariates available for this study, but which nonetheless impact outbreak dynamics. The results of this work may help improve understanding of the seasonal nature of H5N1 in poultry and the potential role of poultry density in enabling endemicity to occur, as well as to assist the Government of Indonesia target scarce resources to regions and time periods when outbreaks of HPAI in poultry are most likely to occur. Published by Elsevier B.V. ∗ Corresponding author. E-mail address: [email protected] (M.L. Farnsworth). 0167-5877/$ – see front matter. Published by Elsevier B.V. doi:10.1016/j.prevetmed.2011.07.008

Welcome message from author
This document is posted to help you gain knowledge. Please leave a comment to let me know what you think about it! Share it to your friends and learn new things together.
Transcript
Mp
MCPa
b
c
HId
Me
a
KHPMISB
0d
Preventive Veterinary Medicine 102 (2011) 206– 217
Contents lists available at ScienceDirect
Preventive Veterinary Medicine
j our na l ho me p age: ww w.elsev ier .com/ locate /prevetmed
etapopulation dynamics and determinants of H5N1 highlyathogenic avian influenza outbreaks in Indonesian poultry
atthew L. Farnswortha,∗, Stephanie Fitchettb, Muhammad Muharram Hidayate,aryl Lockhartc, Christopher Hamilton-Westc, Eric Brumd, Stephen Angusd, Bagoesoermadjajae, Julio Pintoc
USDA-APHIS-VS-Centers for Epidemiology and Animal Health, 2150 Centre Avenue, Bldg. B, Mail Stop 2W4 Fort Collins, CO 80526 USASchool of Mathematical Sciences, University of Northern Colorado, Greeley, CO 80639, USAEmergency Prevention System for Priority Animal and Plant Pests and Diseases/Global Early Warning and Response System (EMPRES/GLEWS), Animalealth Service, Animal Production and Health Division, Food and Agriculture Organization of the United Nations, Viale delle Terme di Caracalla, Rome 00153,
talyEmergency Centre for Transboundary Animal Diseases (ECTAD), Food and Agriculture Organization of the United Nations, Menara Thamrin 7th Floor, Jl..H. Thamrin, Kav. 3, Jakarta 10250, IndonesiaDirectorate General of Livestock and Animal Health Services, Ministry of Agriculture, Indonesia
r t i c l e i n f o
eywords:5N1 highly pathogenic avian influenzaDSRetapopulation dynamics
ndonesiapatial clusteringayesian occurrence models
a b s t r a c t
In 2008, the Indonesian Government implemented a revised village-level Participatory Dis-ease Surveillance and Response (PDSR) program to gain a better understanding of both themagnitude and spatial distribution of H5N1 highly pathogenic avian influenza (HPAI) out-breaks in backyard poultry. To date, there has been considerable collection of data, butlimited publically available analysis. This study utilizes data collected by the PDSR programbetween April 2008 and September 2010 for Java, Bali and the Lampung Province of Suma-tra. The analysis employs hierarchical Bayesian occurrence models to quantify spatial andtemporal dynamics in backyard HPAI infection reports at the District level in 90 day timeperiods, and relates the probability of HPAI occurrence to PDSR-reported village HPAI infec-tion status and human and poultry density. The probability of infection in a District wasassumed to be dependent on the status of the District in the previous 90 day time period,and described by either a colonization probability (the probability of HPAI infection in aDistrict given there had not been infection in the previous 90 day time period) or a persis-tence probability (the probability of HPAI infection being maintained in the District from theprevious to current 90 day period). Results suggest that the number of surveillance activi-ties in a district had little relationship to outbreak occurrence probabilities, but human andpoultry densities were found to have non-linear relationships to outbreak occurrence prob-abilities. We found significant spatial dependency among neighboring districts, indicatingthat there are latent spatial processes that are not captured by the covariates available for
this study, but which nonetheless impact outbreak dynamics. The results of this work mayhelp improve understanding of the seasonal nature of H5N1 in poultry and the potentialrole of poultry density in enabling endemicity to occur, as well as to assist the Governmentof Indonesia target scarce resources to regions and time periods when outbreaks of HPAIin poultry are most likely∗ Corresponding author.E-mail address: [email protected] (M.L. Farnsworth).
167-5877/$ – see front matter. Published by Elsevier B.V.oi:10.1016/j.prevetmed.2011.07.008
to occur.
Published by Elsevier B.V.
Veterina
M.L. Farnsworth et al. / Preventive1. Introduction
Since its emergence in Hong Kong in 1996, H5N1 HPAIhas spread to 66 countries and territories in Asia, Africaand Europe; with more than 12,000 reported outbreaksinvolving both poultry and wild birds (FAO, 2009). Asiahas reported 73% of those outbreaks, affecting Bhutan,Cambodia, Indonesia, Lao People’s Democratic Republic,Malaysia, Myanmar, People’s Republic of China, Thailandand Viet Nam. Although most of these countries have suc-cessfully used culling or vaccination to control or eradicatethe disease, H5N1 HPAI remains endemic in the countriesof Indonesia and Vietnam (Perry et al., 2009).
H5N1 HPAI was first reported in poultry in Indonesiain 2004 and since then outbreaks have continued toimpact domestic poultry populations and human healthin many parts of the country. As of early December 2010there have been 171 human cases reported, of which141 have been fatal (WHO, 5 December 2010). Approx-imately 60% of Indonesian households keep backyardpoultry, and in 2006 the Indonesian Government imple-mented a Participatory Disease Surveillance (PDS) programto improve knowledge and management of outbreaksoccurring in household (i.e., backyard) poultry (Normile,2007). The PDS approach is based on participatory meth-ods developed for research and disease surveillance insmall-scale community animal health programs, whichwere successfully applied for the Global Rinderpest Eradi-cation Program of the Food and Agriculture Organizationof the United Nations (Mariner et al., 2003; Jost et al.,2007). In Indonesia the PDS concept was extended toinclude Participatory Disease Response (PDR), to allow arapid identification and response to H5N1 HPAI outbreaks(Jost et al., 2007; Azhar et al., 2010).
When the PDS program was initiated, surveillance andreporting were focused on households in 12 districts inJava to detect outbreaks meeting the definition of ‘suddendeath outbreak’ and which returned positive results for theAnigen® type A influenza rapid test. Initially, surveillanceand response activities were performed by different teams(PDS and PDR, respectively). When the geographic extent ofthe program was broadened (to include Bali, Java, Sumatra,Sulawesi and Kalimantan) the surveillance and responseactivities were merged into individual PDSR teams (Azharet al., 2010). However, after realizing that outbreak man-agement was not as effective at the household level, in April2008 the PDS program shifted to village-level surveillanceand management (Perry et al., 2009).
The activities of PDSR includes a combination of ran-dom and targeted active surveillance, passive surveillancebased on events reported to government, and follow-upvisits to villages where a potential or actual outbreak haspreviously occurred. At each visit epidemiological data iscollected through participatory approaches involving resi-dents of the focal village. PDSR officers have a set of six toolsfor prevention and response: (i) information, education,and communication (IEC); (ii) focal culling with or without
compensation; (iii) poultry confinement and species sep-aration; (iv) application of biosecurity measures, such ascleaning and disinfection; (v) movement control measures;and (vi) vaccination (Perry et al., 2009).ry Medicine 102 (2011) 206– 217 207
Since its inception the PDSR program has collected alarge amount of data, but to date no publically availablestudy has quantified the spatial and temporal outbreakdynamics or attempted to understand the role of puta-tive risk factors, such as human and poultry populations,in structuring outbreak dynamics.
The Indonesian poultry sector is divided into four cat-egories. Sector 1 is comprised of industrial, verticallyintegrated, production systems that implement mid- tohigh-level biosecurity measures and market products com-mercially. Sector 2 production is commercial productionthat implements biosecurity measures similar to Sector 1,but with production on a smaller scale with products soldthrough slaughterhouses or live markets. Sector 3 is com-prised of small commercial poultry businesses which aresimilar to those in Sector 2, but which typically have lowerlevels of biosecurity and with birds that are usually soldthrough live bird markets. Sector 4, which is the focus ofthe PDSR program and the current study, is classified asvillage or backyard poultry production, often a subsistenceor side-business enterprise, with no biosecurity measuresand products mainly consumed locally (Perry et al., 2009;Azhar et al., 2010). Because Sector 3 and Sector 4 productionare believed to often occur in close geographic proximity,experts suspect that HPAI is transmitted between thesesectors (Sims et al., 2005; Azhar et al., 2010), contributingto the difficulty in controlling the disease.
Poultry density per unit area is expected to increaseas the structure becomes progressively more industrial-ized (i.e., from Sector 4 to Sector 1), so it is reasonableto expect poultry density to have a non-linear effect onoutbreak probabilities, whereby the probability of occur-rence initially increases with poultry density, but thendecreases as density becomes high enough to be repre-sentative of the high biosecurity industrialized productionsectors. We might expect a similar relationship betweenhuman density and outbreak probabilities, albeit for some-what different reasons. As human population densitiesincrease in rural settings, backyard poultry (and thus thepotential for disease occurrence) is likely to increase aswell. However, when human density becomes very high (asin densely populated urban areas) poultry is more likely tobe produced commercially and externally than by backyardproduction, leading to lower outbreak probabilities.
It might be the case that the surveillance activities andoutcomes themselves are indicative of outbreak dynam-ics. For example, in Districts where there have alreadybeen many infected villages detected, one might predicthigher overall outbreak activity. This work is being con-ducted to also quantitatively assess how PDSR activitiesmight influence outbreak dynamics, based on the surveil-lance outcome data. Such work has not been undertaken ina formal model-based structure. A better understanding ofthe strength of the relationship between surveillance activ-ities and outbreak patterns in time and space, along withan understanding of how human and poultry populationsare related to colonization and persistence of outbreaks,
may allow more optimal allocation of the scarce resourcesavailable for controlling HPAI in Indonesia.Occurrence estimation procedures were initiallydeveloped for quantifying species presence or absence
2 Veterina
(foTsd2dHawdiwwiHwtomodf
2
2
clvrotaTAcratvSlaavpawrcCnmwpd
08 M.L. Farnsworth et al. / Preventive
MacKenzie, 2006) and have become well establishedor estimating metapopulation dynamics such as col-nization and persistence (Royle and Dorazio, 2008).here is increasing interest among ecologists for applyinguch approaches to understanding the metapopulationynamics of disease (Thomson et al., 2008; Cooch et al.,010; McClintock et al., 2010). In this study we take aynamic state-space modeling approach for estimating5N1 HPAI district-level outbreak occurrence probabilitiess a function of colonization and persistence processes,hich themselves are informed by human and poultryensity and surveillance activities. Outbreak colonization
s defined as the probability that an outbreak of H5N1 HPAIill be reported given that no outbreaks were reportedithin the previous time interval. Outbreak persistence
s defined as the probability that an outbreak of H5N1PAI will be reported given that one or more outbreaksere reported within the previous time interval. Taken
ogether, colonization and persistence define the totalutbreak probability. Hierarchical Bayesian occurrenceodels that take into account space–time dynamics of
utbreaks offers an opportunity to better model outbreakynamics and to subsequently provide better informationor improving surveillance and control measures.
. Materials and methods
.1. Data collection
The PDSR database contains records of surveillance,ontrol and prevention activities implemented at the vil-age level. Each recorded surveillance activity represents aisit to a village for one of three reasons; as a response to aeport of suspected HPAI events in the village, for randomr risk-based active surveillance, or for a scheduled visito determine the infection status of the village following
visit in which suspected or confirmed cases were found.he PDSR data used in this study was collected betweenpril 2008 and September 2010. Most confirmed positiveases of HPAI were the result of passive surveillance: aeport of suspected HPAI that was then followed up andctively investigated. Each record in the database identifieshe village, the date of the visit, the geographic center of theillage, and an HPAI status indicator: Infected, Suspect(14),uspect(60), Controlled, or Apparently Free. An infected vil-age (infected status) was defined as a village within whichn HPAI compatible event had occurred within last 60 daysnd with a positive rapid Anigen® rapid test at the time ofisit. A village was defined as Suspect(14) when there noositive rapid tests at the time of a visit despite having hadn HPAI compatible event within the last 14 days. A villageas defined as Suspect(60) when there were no positive
apid tests at the time of a visit despite having had an HPAIompatible event within the last 60 days. A village receivedontrolled status if, on follow-up investigation, there wereo HPAI compatible events for 14 days following imple-
entation of control measures. An Apparently Free villageas one in which there were no HPAI compatible eventsresent at the time of the visit or within the previous 60ays.ry Medicine 102 (2011) 206– 217
2.2. Data formatting
The Indonesian Directorate General of Livestock andAnimal Health Services (DGLAHS) provided a geo-referenced database reflecting active and passive PDSRactivities occurring between April 2008 and September2010 in villages throughout Indonesia forming part of thedonor funded project implemented by the Food and Agri-culture Organization of the United Nations (FAO). Our studyused the reported outcomes, and associated locations anddates, for the 38,454 surveillance activities recorded forall Districts on the islands of Java and Bali, along withthe Province of Lampung on the island of Sumatra (Brumet al., 2008). Although data were available across a broaderarea of Indonesia we chose to focus our analysis on theseDistricts because the majority (66%) of outbreaks in thedatabase occurred there and this study area encompassesthat portion of Indonesia probably most responsible formaintaining the virus in poultry populations (Perry et al.,2009) (see Fig. 1).
We used the reported outcomes of surveillance activi-ties to identify when and where outbreaks had occurredamong villages within the study area. Although surveil-lance activities were reported at the village level, weaggregated the original data to reflect the outbreak sta-tus at the District level, resulting in an average of 143.1villages/District (1st quartile = 73, 3rd quartile = 190). Thiswas done because we were interested in understandingdynamics and determinants of outbreaks over a relativelylarge area and the use of village level data resulted intoo few outbreaks per village for meaningful analysisat that resolution within the dynamic modeling frame-work described below. Additionally, given the endemic andwidespread nature of H5N1 HPAI outbreaks in Indonesia,we wished to make recommendations for improving out-break management at a scale that would be of use to theDGLAHS; this would not have been the case for analysisresults at the village level.
For the modeling approach described below, the timeseries must be aggregated to regular intervals. From a sta-tistical estimation perspective the choice of time windowfor aggregation is arbitrary. However, from an epidemio-logical perspective, we chose to aggregate the data intoten 90-day time periods spanning the range of the studybecause the World Animal Health Organization (OIE) hasrecommended that a 90 day period without any out-break signs must occur before a location can be declaredDisease Free (OIE, 2010). Thus, we determined if an out-break was recorded in the database anywhere in a districtduring each 90-day time period and used this as ourpresence/absence response variable in the hierarchicaldynamic models described below. Because we were inter-ested in understanding how the probability of an outbreakbeing reported at one time period was influenced by theother PDSR-reported outcomes (i.e., number of villagesreported Controlled, Suspect(14), Suspect(60), and DiseaseFree) during the previous time period, the time-dependent
covariates reported in the PDSR database had to be aggre-gated to match the same spatial and temporal scale asthat of the outbreak data. Specifically, for each District and90 day time window we examined how the total number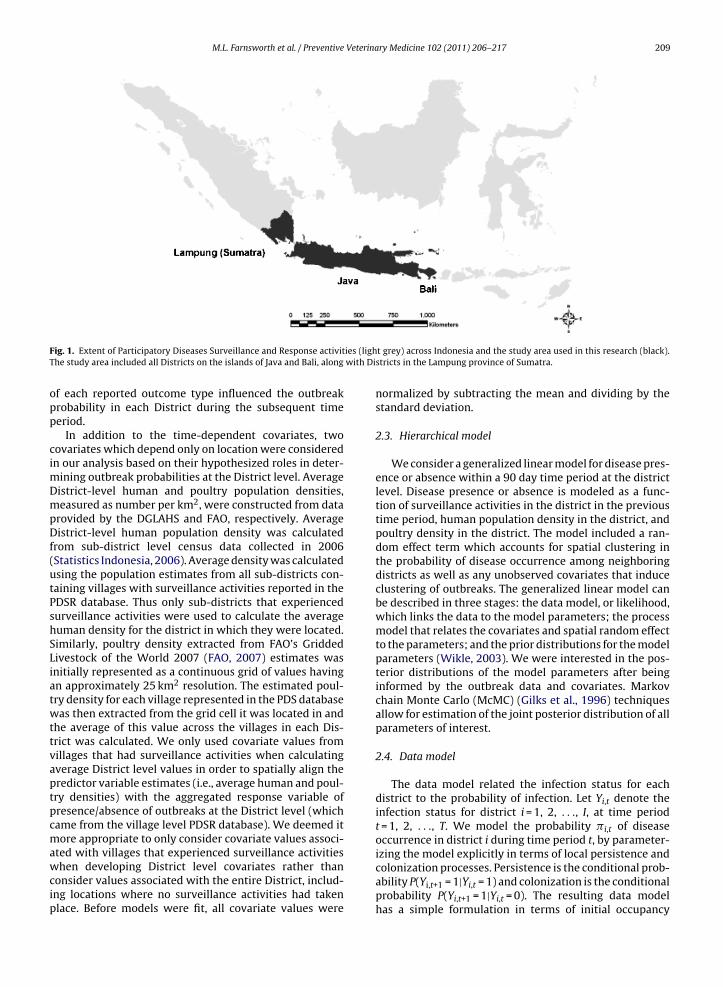
M.L. Farnsworth et al. / Preventive Veterinary Medicine 102 (2011) 206– 217 209
ies (ligh with Di
Fig. 1. Extent of Participatory Diseases Surveillance and Response activitThe study area included all Districts on the islands of Java and Bali, along
of each reported outcome type influenced the outbreakprobability in each District during the subsequent timeperiod.
In addition to the time-dependent covariates, twocovariates which depend only on location were consideredin our analysis based on their hypothesized roles in deter-mining outbreak probabilities at the District level. AverageDistrict-level human and poultry population densities,measured as number per km2, were constructed from dataprovided by the DGLAHS and FAO, respectively. AverageDistrict-level human population density was calculatedfrom sub-district level census data collected in 2006(Statistics Indonesia, 2006). Average density was calculatedusing the population estimates from all sub-districts con-taining villages with surveillance activities reported in thePDSR database. Thus only sub-districts that experiencedsurveillance activities were used to calculate the averagehuman density for the district in which they were located.Similarly, poultry density extracted from FAO’s GriddedLivestock of the World 2007 (FAO, 2007) estimates wasinitially represented as a continuous grid of values havingan approximately 25 km2 resolution. The estimated poul-try density for each village represented in the PDS databasewas then extracted from the grid cell it was located in andthe average of this value across the villages in each Dis-trict was calculated. We only used covariate values fromvillages that had surveillance activities when calculatingaverage District level values in order to spatially align thepredictor variable estimates (i.e., average human and poul-try densities) with the aggregated response variable ofpresence/absence of outbreaks at the District level (whichcame from the village level PDSR database). We deemed itmore appropriate to only consider covariate values associ-ated with villages that experienced surveillance activities
when developing District level covariates rather thanconsider values associated with the entire District, includ-ing locations where no surveillance activities had takenplace. Before models were fit, all covariate values weret grey) across Indonesia and the study area used in this research (black).stricts in the Lampung province of Sumatra.
normalized by subtracting the mean and dividing by thestandard deviation.
2.3. Hierarchical model
We consider a generalized linear model for disease pres-ence or absence within a 90 day time period at the districtlevel. Disease presence or absence is modeled as a func-tion of surveillance activities in the district in the previoustime period, human population density in the district, andpoultry density in the district. The model included a ran-dom effect term which accounts for spatial clustering inthe probability of disease occurrence among neighboringdistricts as well as any unobserved covariates that induceclustering of outbreaks. The generalized linear model canbe described in three stages: the data model, or likelihood,which links the data to the model parameters; the processmodel that relates the covariates and spatial random effectto the parameters; and the prior distributions for the modelparameters (Wikle, 2003). We were interested in the pos-terior distributions of the model parameters after beinginformed by the outbreak data and covariates. Markovchain Monte Carlo (McMC) (Gilks et al., 1996) techniquesallow for estimation of the joint posterior distribution of allparameters of interest.
2.4. Data model
The data model related the infection status for eachdistrict to the probability of infection. Let Yi,t denote theinfection status for district i = 1, 2, . . ., I, at time periodt = 1, 2, . . ., T. We model the probability �i,t of diseaseoccurrence in district i during time period t, by parameter-izing the model explicitly in terms of local persistence and
colonization processes. Persistence is the conditional prob-ability P(Yi,t+1 = 1|Yi,t = 1) and colonization is the conditionalprobability P(Yi,t+1 = 1|Yi,t = 0). The resulting data modelhas a simple formulation in terms of initial occupancy
2 Veterina
po
Y
a
Y
Wto
2
aiddr(
l
wpomifitce1ccpt
attd
2
wTeotcptCtdi
10 M.L. Farnsworth et al. / Preventive
robability, local persistence probabilities, and local col-nization probabilities, as follows:
i,1∼Bernoulli(� ) for i = 1, 2, . . . , I (1)
nd
i,t+1|Yi,t∼Bernoulli(�i,t) for t = 2, 3, . . . , T (2)
e model the probability �i,t of disease occurrence inerms of colonization and persistence using the logarithmf the odds ratio, as described below.
.5. Process model
The process component of the model relates the prob-bility of infection �i,t occurring in district i during timenterval t to persistence, colonization, and to covariatesescribing surveillance activities and human and poultryensities. To constrain the infection probabilities to theange [0,1], we model the logarithm of the odds of infectionthe standard logit transformation). That is,
ogit(�i,t) = log
(�i,t
1 − �i,t
)= ˛t + ϕtYi,t−1 + xT
i,tˇ1
+ xTi,tˇ2Yi,t+1 + �i (3)
here ˛t is the logarithm of the odds of colonization fromeriod t to period t + 1, ˛t + ϕt is the logarithm of the oddsf persistence from period t to period t + 1, xT
itis the 1 by
row vector (xi,t1, xi,t2, . . ., xi,tm) of covariates for district in time period t, ˇ1 is an m by 1 vector of regression coef-cients corresponding to the m covariates for district i inime period t capturing the effects of the covariates on theolonization probability, Yi,t−1 is the observed state of dis-ase in district i and time period t − 1, and ˇ2 is an m by
vector of regression coefficients corresponding to the movariates for district i in time period t that allows for theovariates to have different effects on the colonization andersistence probabilities. More precisely, ˇ1 + ˇ2 captureshe effects of the covariates on persistence probabilities.
To capture any latent spatial clustering that is notccounted for by the covariates, and to understandhe importance of the spatial characteristics relative tohe covariates, a spatial random effect term � i (furtherescribed below) is included in the general model.
.6. Prior and posterior distributions
The analysis is fully Bayesian, so prior distributionsere specified for all model parameters in the hierarchy.
he spatial random effect, modeled by � i, was of inter-st because it models the latent spatial dependency ofccurrence of the disease in neighboring districts by cap-uring spatial variation that is not accounted for by theovariates. The spatially structured variation in infectionrobability � i was modeled by an intrinsic Gaussian condi-ional autoregressive (CAR) process (Besag et al., 1991). The
AR model assumes that � i is related to � j for the districtshat are neighbors of district i, and conditionally indepen-ent of districts other than its neighbors. More precisely,f i+ denotes the set of neighbors of district i, ni+ denotes
ry Medicine 102 (2011) 206– 217
the number of neighbors of district i, and �2� denotes the
variance for all districts, then
�i
∣∣ �i+ ∼ Normal
⎛⎝ 1
ni+
∑j in i+
�j,�2
�
ni+
⎞⎠ (4)
In this model, district j is a neighbor of district i if and onlyif the two districts share a border. For all models,˛t wasdescribed by a flat prior (i.e., (−Inf, Inf)) due to the sumto zero constraint placed on the CAR random effect. Forthe remaining model parameters we assigned the followingprior distributions:
� ∼Unif(0, 1)ϕt∼Norm(0, 100)ˇj∼Norm(0, 100)�2
�∼Unif(0, 100)
The covariates do not have a direct interpretation interms of their effects on outbreak probabilities (Royle andDorazio, 2008), but rather they influence the estimated out-break probabilities through their effects on colonizationand persistence probabilities.
2.7. Candidate models
To identify those variable combinations which cor-responded best to district level outbreak patterns inspace and time we developed a candidate set (Table 1)of twenty-four outbreak occurrence models using theequations above; twelve generalized linear mixed mod-els (GLMM’s, Models 1–12) and twelve generalized linearmodels (GLM’s, Models 13–24). The GLM’s were analogousto the twelve GLMM’s except that each GLM omitted therandom effect term that captures latent spatially depen-dent processes influencing outbreak dynamics amongneighboring districts. This term acted as a surrogate forlocal spatial processes that could not be observed, such asmovement of poultry between neighboring districts, butwhich could nevertheless be modeled to understand theimportance of unobserved local spatial processes in struc-turing outbreak dynamics. All models were fit using anMCMC procedure implemented in WinBUGS (Lunn et al.,2000) software. Models were run for 50,000 iterations aftera burn-in period of 100,000 iterations to ensure conver-gence of all posterior distributions. We retained every 5thsample from the 50,000 post burn-in iterations to reduceautocorrelation, resulting in 10,000 samples, which weused to estimate the marginal posterior distributions formodel parameters. We used three MCMC chains with dis-persed initial values for the prior distributions and appliedthe Brooks, Gelman, and Rubin (BGR) diagnostic statistic(available in WinBUGS) to assess convergence of the pos-terior distributions.
We used Deviance Information Criteria (Spiegelhalteret al., 2002) to rank the candidate set of models. The modelwith the smallest DIC was considered to be the model that
would best predict a replicate dataset which has the samestructure as that currently observed. DIC was calculated as:DICw = −2 × log(p(y|�)) + 2 × pD (6)
M.L. Farnsworth et al. / Preventive Veterinary Medicine 102 (2011) 206– 217 211
Table 1Candidate set of models for the colonization and persistence of highly pathogenic avian influenza H5N1 reported within the Participatory Disease Surveil-lance and Response program in Indonesia between 2008 and 2010. All twelve models were also fit without a second-order conditional autoregressive (CAR)spatial random effect term to determine the importance of local spatial dependency on outbreak probabilities. Thus, a total of 24 candidate models wereconsidered in the analysis. Suspect represents models that included both Suspect(14) and Suspect(60) variables.
1 Base + CAR2 Base + Suspect + CAR3 Base + Controlled + Suspect + CAR4 Base + Controlled + Disease Free + CAR5 Base + Controlled + Suspect + Apparently Free + CAR6 Base + Controlled + Suspect + Controlled × Suspect + CAR7 Base + PoultDens + PoultDens2 + CAR8 Base + HumDens + HumDens2 + CAR9 Base + HumDens + HumDens2 + PoultDens + PoultDens2 + CAR
10 Base + HumDens + HumDens2 + PoultDens + PoultDens2 + HumDens × PoultDens + CAR11 Base + Controlled + HumDens + HumDens2 + PoultDens + PoultDens2 + HumDens × PoultDens + CAR12 Base + All Surveillance + HumDens + HumDens2 + PoultDens + PoultDens2 + HumDens × PoultDens + CAR
odels;
y densitd-order
Base = baseline colonization and persistence probabilities included in all mused as covariates; PoultDens and PoultDens2 = poultry density and poultrsquared; CAR = Conditional autoregressive spatial random effect for secon
where log(p(y|�)) is the point estimate of the devianceobtained by substituting the posterior means � of the modelparameters in the natural logarithm of the likelihood func-tion and pD is the effective number of parameters, which iscalculated as the posterior mean of the deviance minus thedeviance of the posterior means. We calculated posteriormodel weights using a metric known as DIC weights (DICw)to gauge the support for each model as the best posteriorpredictive model in the candidate set. The DIC weights arean informal measure of model support which are approxi-mately analogous to AIC weights and are calculated for eachmodel as:
DICw = exp(−(1/2)×�DIC)∑exp(−(1/2)×�DIC)
(7)
where �DIC equals the difference in DIC values betweenthe top model in the candidate set and the model beingconsidered. The sum of the DICw across all models beingconsidered is one. Thus, the closer a DICw is to one thegreater the support for that model being selected as thetop model in the candidate set.
We were interested in the parameter estimates associ-ated with the covariates included in the top model selectedby DIC. Specifically, we wished to understand how thenumber of surveillance activities and village-level HPAIinfection status reported in one 90-day time period influ-enced the outbreak probability for each district duringthe subsequent time period. In addition, we modeled theinfluence of human and poultry population densities onoutbreak probabilities for each district using a combinationof linear and quadratic terms.
We generated Receiver Operating Characteristics (ROC)curves for the top model for each time period and cal-culated the area under the curve to assess the model’sability to discriminate districts reporting outbreaks (sen-sitivity) from those which did not report any outbreakswithin a given 90 day period (1 – specificity) (Hosmer and
Lemeshow, 2000). Area under the curve values between0.7 and 0.8 are considered to have acceptable discrimina-tion, values ranging between 0.8 and 0.9 are said to haveexcellent discriminatory capability, and values greater thanSuspect, Controlled, and Apparently Free = surveillance activity outcomesy squared; HumDens and HumDens2 = human density and human density
neighbors.
0.9 have an outstanding discrimination ability (Hosmer andLemeshow, 2000).
3. Results
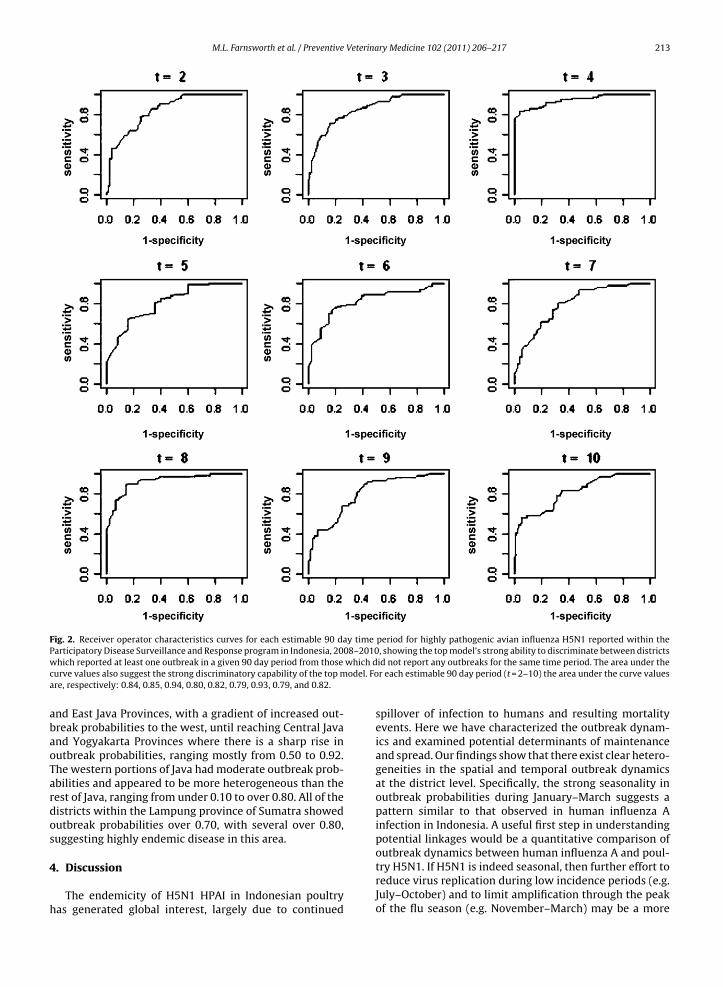
All models converged to the target distributions basedon BGR diagnostics. Based on DIC the model with thegreatest predictive support (Table 2) for estimating theprobability that a district would report at least one out-break within a 90 day period was Model 11 (DICw = 0.89),whose components are shown in Table 1. This model hadalmost 90% of the DICw, with the second best model hav-ing a DICw of 0.065, indicating very little support for anymodel in the candidate set except Model 11. The ROC curvesand associated area under the curve calculations for eachestimable time period (Fig. 2) show the strong ability of thetop model to discriminate districts reporting an outbreakwithin a 90 day period (sensitivity) from those which didnot report any outbreaks in the same period (1 – speci-ficity). In general, there was greatest support for modelswhich considered human and poultry density versus thosethat did not, with the exception of Model 11 which alsoincluded the Controlled village status variable from thesurveillance data. Models without CAR terms effectivelyhad no support in the data, suggesting that latent spatialprocesses operating among neighboring districts played aprominent role in structuring the spatial distribution ofoutbreak occurrence probabilities within 90 day periods.
In addition to the baseline colonization and persistenceterms and CAR spatial effects, the top model containedsignificant support for effects of human density, poultrydensity, and the number of villages reported with Con-trolled status within a district during the previous 90 dayperiod (Table 3). Parameter estimates from the top modelthat are not shown in Table 3 had a substantial proportionof their posterior probability overlapping zero (for exam-ple, the human × poultry interaction term). Linear effectsof human density on outbreak colonization probabilities
were observed, with the highest colonization probabilityof 0.63 occurring at a human density of 6250/km2 (Fig. 3a).This is a relatively low density in comparison to districtswith large urban populations, such as Jakarta, but higher
212 M.L. Farnsworth et al. / Preventive Veterinary Medicine 102 (2011) 206– 217
Table 2DIC model selection results for models of the colonization and persistence of highly pathogenic avian influenza H5N1 reported within the ParticipatoryDisease Surveillance and Response program in Indonesia between 2008 and 2010. The top model, with nearly 90% of the total posterior model weight wasModel 11. That model included the baseline effects of colonization and persistence on estimating outbreak probabilities for each district and 90-day timeperiod, as well as linear and non-linear terms for human and poultry densities, and an effect for the number of villages designated as Controlled in theprevious 90-day time period.
Model Pd DIC DICw Model Pd DIC DICw
Human andpoultry
11 62.427 1359.02 0.891 23 34.555 1430.09 3.29E−1610 64.871 1364.25 0.065 22 24.276 1441.52 1.08E−18
9 61.617 1365.06 0.044 20 27.931 1443.01 5.14E−198 65.814 1375.66 0.0002 21 26.455 1443.86 3.36E−19
12 65.005 1378.78 4.56E−05 19 22.332 1455.82 8.51E−227 60.449 1379.20 3.69E−05 24 22.265 1462.65 2.79E−23
Base 1 76.625 1390.17 1.53E−07 15 26.331 1466.61 3.86E−24Surveillance 3 59.577 1392.96 3.80E−08 13 22.282 1468.28 1.67E−24
6 63.194 1394.20 2.04E−08 18 30.102 1468.86 1.25E−244 64.866 1395.06 1.33E−08 14 22.458 1470.51 5.49E−255 59.070 1396.29 7.19E−09 16 22.300 1482.07 1.69E−272 64.703 1397.53 3.86E−09 17 22.200 1481.09 1.36E−27
Model, model number corresponding to Table 1 models and associated variables;DICw, DIC weights. These translate to an ad hoc measure of posterior model probmodel in the candidate set.
Table 3Posterior parameter estimates for (normalized) covariates in the topmodel (Model 11) of colonization and persistence of highly pathogenicavian influenza H5N1 reported within the Participatory Disease Surveil-lance and Response program in Indonesia between 2008 and 2010.Variable shows the name of the variable being considered, with theMetapopulation process it affects shown in parenthesis. Mean is the pos-terior mean of the parameter estimate and 2.5% and 97.5% define the cutoffvalues for the 95% credible interval around the estimated mean.
Variable Mean 2.5% 97.5%
Human density (colonization) 1.042 −0.1997 2.395Human density2 (colonization) −1.785 −3.322 −0.491Human density (persistence) 0.557 −0.849 1.970Human density2 (persistence) −0.068 −1.590 1.500Poultry density (colonization) 1.226 0.248 2.317Poultry density2 (colonization) −1.472 −2.604 −0.458Poultry density (persistence) 1.623 .4344 2.795Poultry density2 (persistence) −1.083 −2.206 0.065Human × poultry (colonization) −0.085 −0.677 0.458Human × poultry (persistence) −0.696 −1.457 0.052
tscptaamoopo9tpd
rv
2010 and 2009, respectively, supporting the general tem-
Control (colonization) 0.083 −0.113 0.274Control (persistence) 0.098 0.039 0.159
han most of the rural districts considered. Poultry den-ity exhibited significant linear and non-linear effects onolonization and persistence probabilities (Table 3), witheak colonization probabilities seen at poultry densitieshat were close to half of that for peak persistence prob-bilities (Fig. 3b). The curves shown in Fig. 2b suggests thatt a relatively low poultry density of 2375/km2 outbreaksaximize their colonization potential with a probability
f 0.59 within a district which had not experienced anutbreak in the previous 90 day interval, but that higheroultry densities of 4325/km2 are necessary to maximizeutbreak persistence at a probability of 0.68 across multiple0 day intervals, and that as density increases coloniza-ion probabilities drop off precipitously while persistencerobabilities remain relatively high at all but the highestensities.
The number of villages reported with Controlled statusecorded within a district in the previous 90 day inter-al was positively related to the persistence probability
Pd, effective number of parameters; DIC, Deviance Information Criteria;abilities that the model being considered is the best posterior predictive
for outbreaks in the subsequent 90 day interval (
= 1.10,CI = (1.04, 1.17)). The parameter estimate for this variabletranslates into a 34% increase in the odds of at least oneoutbreak being reported within a district during a 90 dayinterval for every ten Controlled villages reported withinthe same district during the previous 90 day interval.
Fig. 4 maps the posterior distribution of CAR effects,where positive/negative reflects the sign of the mean of theeffect for a given district, and where “weak” indicates thatthe 95% credible interval overlapped zero, while “strong”indicates the interval did not include zero. The posteriordistribution of clustering represents residual spatial struc-ture not accounted for by other covariates in the model;although we cannot identify the underlying cause of thestructure we can nevertheless quantify its strength. Theseresults suggest that additional spatially structured risk fac-tors, which were unaccounted for by covariates in ourmodels, are helping drive the clustering of high and lowoutbreak probabilities at the district scale.
Finally, we estimated the mean outbreak probabilityover time, averaging over all Districts in the study area(Fig. 5a), and the mean outbreak probability in space, aver-aging over all time windows (Fig. 5b), to identify thosetimes and locations which may be at greatest risk of experi-encing outbreaks in the future. Our results indicate strongtemporal and spatial heterogeneity in outbreak probabil-ities across the study area. We observed seasonal trendsin which there was a marked increase in annual outbreakprobabilities in the January–March interval, maintained athigh levels during the April–June interval in 2009, followedby precipitous declines as the year advanced through theJuly–September and October–December intervals in both2009 and 2010. Although we do not have data to estimateoutbreak probabilities during the first half of 2008, theJuly–September and October–December intervals in 2008had outbreak probabilities similar to the same periods in
poral outbreak pattern reported elsewhere (Farnsworthet al., 2010). Fig. 4b shows the lowest average outbreakprobabilities over time (ranging from 0.17 to 0.60) in Bali
M.L. Farnsworth et al. / Preventive Veterinary Medicine 102 (2011) 206– 217 213
Fig. 2. Receiver operator characteristics curves for each estimable 90 day time period for highly pathogenic avian influenza H5N1 reported within theParticipatory Disease Surveillance and Response program in Indonesia, 2008–2010, showing the top model’s strong ability to discriminate between districts
which dodel. Fo
which reported at least one outbreak in a given 90 day period from thosecurve values also suggest the strong discriminatory capability of the top mare, respectively: 0.84, 0.85, 0.94, 0.80, 0.82, 0.79, 0.93, 0.79, and 0.82.
and East Java Provinces, with a gradient of increased out-break probabilities to the west, until reaching Central Javaand Yogyakarta Provinces where there is a sharp rise inoutbreak probabilities, ranging mostly from 0.50 to 0.92.The western portions of Java had moderate outbreak prob-abilities and appeared to be more heterogeneous than therest of Java, ranging from under 0.10 to over 0.80. All of thedistricts within the Lampung province of Sumatra showedoutbreak probabilities over 0.70, with several over 0.80,suggesting highly endemic disease in this area.
4. Discussion
The endemicity of H5N1 HPAI in Indonesian poultryhas generated global interest, largely due to continued
id not report any outbreaks for the same time period. The area under ther each estimable 90 day period (t = 2–10) the area under the curve values
spillover of infection to humans and resulting mortalityevents. Here we have characterized the outbreak dynam-ics and examined potential determinants of maintenanceand spread. Our findings show that there exist clear hetero-geneities in the spatial and temporal outbreak dynamicsat the district level. Specifically, the strong seasonality inoutbreak probabilities during January–March suggests apattern similar to that observed in human influenza Ainfection in Indonesia. A useful first step in understandingpotential linkages would be a quantitative comparison ofoutbreak dynamics between human influenza A and poul-
try H5N1. If H5N1 is indeed seasonal, then further effort toreduce virus replication during low incidence periods (e.g.July–October) and to limit amplification through the peakof the flu season (e.g. November–March) may be a more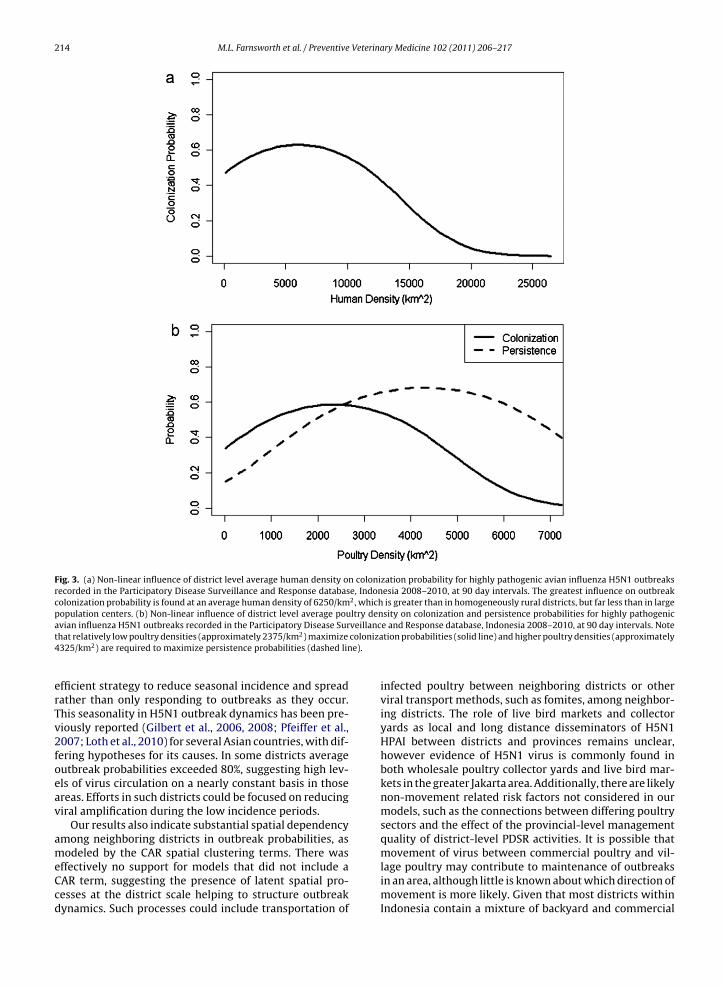
214 M.L. Farnsworth et al. / Preventive Veterinary Medicine 102 (2011) 206– 217
Fig. 3. (a) Non-linear influence of district level average human density on colonization probability for highly pathogenic avian influenza H5N1 outbreaksrecorded in the Participatory Disease Surveillance and Response database, Indonesia 2008–2010, at 90 day intervals. The greatest influence on outbreakcolonization probability is found at an average human density of 6250/km2, which is greater than in homogeneously rural districts, but far less than in largepopulation centers. (b) Non-linear influence of district level average poultry density on colonization and persistence probabilities for highly pathogenicavian influenza H5N1 outbreaks recorded in the Participatory Disease Surveillance and Response database, Indonesia 2008–2010, at 90 day intervals. Notet coloniza4 e).
erTv2foeav
ameCcd
hat relatively low poultry densities (approximately 2375/km2) maximize
325/km2) are required to maximize persistence probabilities (dashed lin
fficient strategy to reduce seasonal incidence and spreadather than only responding to outbreaks as they occur.his seasonality in H5N1 outbreak dynamics has been pre-iously reported (Gilbert et al., 2006, 2008; Pfeiffer et al.,007; Loth et al., 2010) for several Asian countries, with dif-ering hypotheses for its causes. In some districts averageutbreak probabilities exceeded 80%, suggesting high lev-ls of virus circulation on a nearly constant basis in thosereas. Efforts in such districts could be focused on reducingiral amplification during the low incidence periods.
Our results also indicate substantial spatial dependencymong neighboring districts in outbreak probabilities, asodeled by the CAR spatial clustering terms. There was
ffectively no support for models that did not include aAR term, suggesting the presence of latent spatial pro-esses at the district scale helping to structure outbreakynamics. Such processes could include transportation of
tion probabilities (solid line) and higher poultry densities (approximately
infected poultry between neighboring districts or otherviral transport methods, such as fomites, among neighbor-ing districts. The role of live bird markets and collectoryards as local and long distance disseminators of H5N1HPAI between districts and provinces remains unclear,however evidence of H5N1 virus is commonly found inboth wholesale poultry collector yards and live bird mar-kets in the greater Jakarta area. Additionally, there are likelynon-movement related risk factors not considered in ourmodels, such as the connections between differing poultrysectors and the effect of the provincial-level managementquality of district-level PDSR activities. It is possible thatmovement of virus between commercial poultry and vil-
lage poultry may contribute to maintenance of outbreaksin an area, although little is known about which direction ofmovement is more likely. Given that most districts withinIndonesia contain a mixture of backyard and commercial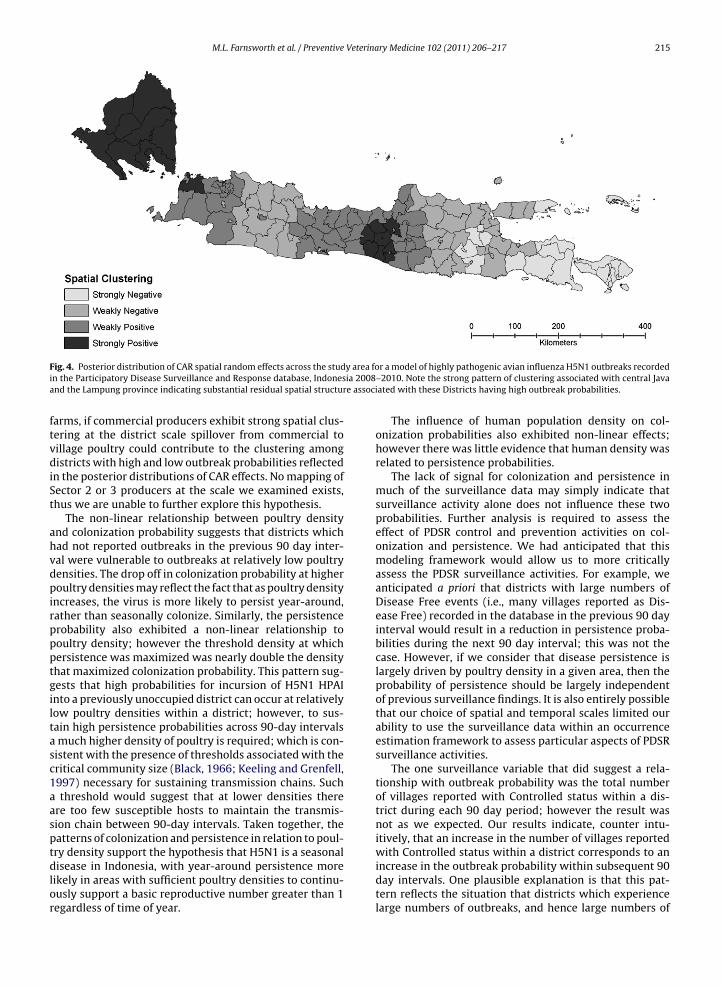
M.L. Farnsworth et al. / Preventive Veterinary Medicine 102 (2011) 206– 217 215
y area foia 2008e associ
Fig. 4. Posterior distribution of CAR spatial random effects across the studin the Participatory Disease Surveillance and Response database, Indonesand the Lampung province indicating substantial residual spatial structur
farms, if commercial producers exhibit strong spatial clus-tering at the district scale spillover from commercial tovillage poultry could contribute to the clustering amongdistricts with high and low outbreak probabilities reflectedin the posterior distributions of CAR effects. No mapping ofSector 2 or 3 producers at the scale we examined exists,thus we are unable to further explore this hypothesis.
The non-linear relationship between poultry densityand colonization probability suggests that districts whichhad not reported outbreaks in the previous 90 day inter-val were vulnerable to outbreaks at relatively low poultrydensities. The drop off in colonization probability at higherpoultry densities may reflect the fact that as poultry densityincreases, the virus is more likely to persist year-around,rather than seasonally colonize. Similarly, the persistenceprobability also exhibited a non-linear relationship topoultry density; however the threshold density at whichpersistence was maximized was nearly double the densitythat maximized colonization probability. This pattern sug-gests that high probabilities for incursion of H5N1 HPAIinto a previously unoccupied district can occur at relativelylow poultry densities within a district; however, to sus-tain high persistence probabilities across 90-day intervalsa much higher density of poultry is required; which is con-sistent with the presence of thresholds associated with thecritical community size (Black, 1966; Keeling and Grenfell,1997) necessary for sustaining transmission chains. Sucha threshold would suggest that at lower densities thereare too few susceptible hosts to maintain the transmis-sion chain between 90-day intervals. Taken together, thepatterns of colonization and persistence in relation to poul-try density support the hypothesis that H5N1 is a seasonal
disease in Indonesia, with year-around persistence morelikely in areas with sufficient poultry densities to continu-ously support a basic reproductive number greater than 1regardless of time of year.r a model of highly pathogenic avian influenza H5N1 outbreaks recorded–2010. Note the strong pattern of clustering associated with central Javaated with these Districts having high outbreak probabilities.
The influence of human population density on col-onization probabilities also exhibited non-linear effects;however there was little evidence that human density wasrelated to persistence probabilities.
The lack of signal for colonization and persistence inmuch of the surveillance data may simply indicate thatsurveillance activity alone does not influence these twoprobabilities. Further analysis is required to assess theeffect of PDSR control and prevention activities on col-onization and persistence. We had anticipated that thismodeling framework would allow us to more criticallyassess the PDSR surveillance activities. For example, weanticipated a priori that districts with large numbers ofDisease Free events (i.e., many villages reported as Dis-ease Free) recorded in the database in the previous 90 dayinterval would result in a reduction in persistence proba-bilities during the next 90 day interval; this was not thecase. However, if we consider that disease persistence islargely driven by poultry density in a given area, then theprobability of persistence should be largely independentof previous surveillance findings. It is also entirely possiblethat our choice of spatial and temporal scales limited ourability to use the surveillance data within an occurrenceestimation framework to assess particular aspects of PDSRsurveillance activities.
The one surveillance variable that did suggest a rela-tionship with outbreak probability was the total numberof villages reported with Controlled status within a dis-trict during each 90 day period; however the result wasnot as we expected. Our results indicate, counter intu-itively, that an increase in the number of villages reportedwith Controlled status within a district corresponds to an
increase in the outbreak probability within subsequent 90day intervals. One plausible explanation is that this pat-tern reflects the situation that districts which experiencelarge numbers of outbreaks, and hence large numbers of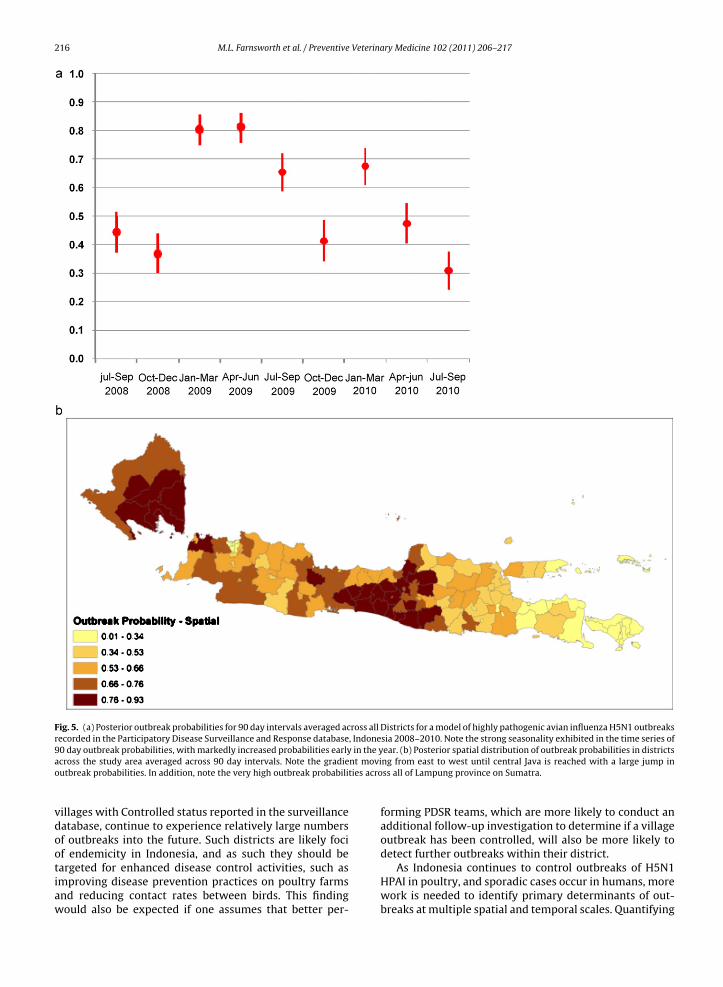
216 M.L. Farnsworth et al. / Preventive Veterinary Medicine 102 (2011) 206– 217
Fig. 5. (a) Posterior outbreak probabilities for 90 day intervals averaged across all Districts for a model of highly pathogenic avian influenza H5N1 outbreaksrecorded in the Participatory Disease Surveillance and Response database, Indonesia 2008–2010. Note the strong seasonality exhibited in the time series of90 day outbreak probabilities, with markedly increased probabilities early in the year. (b) Posterior spatial distribution of outbreak probabilities in districtsa nt movio ties acro
vdootiaw
cross the study area averaged across 90 day intervals. Note the gradieutbreak probabilities. In addition, note the very high outbreak probabili
illages with Controlled status reported in the surveillanceatabase, continue to experience relatively large numbersf outbreaks into the future. Such districts are likely focif endemicity in Indonesia, and as such they should be
argeted for enhanced disease control activities, such asmproving disease prevention practices on poultry farmsnd reducing contact rates between birds. This findingould also be expected if one assumes that better per-ng from east to west until central Java is reached with a large jump inss all of Lampung province on Sumatra.
forming PDSR teams, which are more likely to conduct anadditional follow-up investigation to determine if a villageoutbreak has been controlled, will also be more likely todetect further outbreaks within their district.
As Indonesia continues to control outbreaks of H5N1HPAI in poultry, and sporadic cases occur in humans, morework is needed to identify primary determinants of out-breaks at multiple spatial and temporal scales. Quantifying
Veterina
M.L. Farnsworth et al. / Preventiveoutbreak dynamics is a necessary first step for makingrecommendations that can improve targeted disease man-agement efforts. Here we have shown one such approachwhich allowed us to not only characterize disease dynam-ics at relevant spatial and temporal scales, but also to testhypotheses regarding determinants of outbreaks, includ-ing highlighting the importance of latent spatial risk factorsfor which we do not currently have data. This work shouldpoint the way for other research investigations whichseek to understand the dynamics, and, more importantly,the drivers of H5N1 HPAI colonization and persistence inIndonesia and other countries.
Acknowledgements
We wish to thank Philip Riggs for his contributionsto graphics development and helpful discussions and twoanonymous reviewers and the editor for helpful comments.
References
Azhar, M., Lubis, A.S., Siregar, E.S., Alders, R.G., Brum, E., McGrane,J., Morgan, I., Roeder, P., 2010. Participatory Disease Surveillanceand Response in Indonesia: strengthening Veterinary Services andEmpowering Communities to prevent and Control Highly PathogenicAvian Influenza. Avian Dis. 54, 749–753.
Besag, J., York, J., Mollie, A., 1991. Bayesian image-restoration, with 2applications in spatial statistics. Ann. Inst. Stat. Math. 43, 1–20.
Black, F.L., 1966. Measles endemicity in insular populations: criticalcommunity size and its evolutionary implication. J. Theor. Biol. 11,207–211.
Brum, E., Muhibullah, Alders, R., 2008. Participatory tools as ameans to empower communities to prevent and control HPAI inIndonesia , Toolkit for community-based management of avian andhuman influenza in Asia International Federation of Red Cross andRed Crescent Societies Bangkok, Thailand, pp. 116–120.
Cooch, E.G., Conn, P.B., Ellner, S.P., Dobson, A.P., Pollock, K.H., 2010. Diseasedynamics in wild populations: modeling and estimation: a review. J.Ornithol., 152.
FAO, 2009. Emergency Prevention System; Food and Agricultural Orga-nization. Global animal disease information system. Food andAgriculture Organisation of the United Nations, Animal Health Ser-vice, Animal Production and Health Division. Rome. Available at:http://empres-i.fao.org/empres-i/home.
FAO, 2007. In: Wint, G.R.W., Robinson, T.P. (Eds.), Gridded Livestock of theWorld. Rome, p. 131.
Farnsworth, M.L., Hamilton-West, C., Fitchett, S., Newman, S.H., de la
Rocque, S., De Simone, L., Lubroth, J., Pinto, J., 2010. Comparingnational and global data collection systems for reporting, outbreaksof H5N1 HPAI. Prev. Vet. Med. 95, 175–185.Gilbert, M., Chaitaweesub, P., Parakamawongsa, T., Premashtira, S.,Tiensin, T., Kalpravidh, W., Wagner, H., Slingenbergh, J., 2006.
ry Medicine 102 (2011) 206– 217 217
Free-grazing ducks and highly pathogenic avian influenza, Thailand.Emerg. Infect. Dis. 12, 227–234.
Gilbert, M., Xiao, X., Pfeiffer, D.U., Epprecht, M., Boles, S., Czarnecki,C., Chaitaweesub, P., Kalpravidh, W., Minh, P.Q., Otte, M.J., Mar-tin, V., Slingenbergh, J., 2008. Mapping H5N1 highly pathogenicavian influenza risk in Southeast Asia. Proc. Natl. Acad. Sci. 105,4769–4774.
Gilks, W.R., Richardson, S., Spiegelhalter, D.J., 1996. Markov Chain MonteCarlo in Practice. Chapman & Hall, London.
Hosmer, D.W., Lemeshow, S., 2000. Applied Logistic Regression. Wiley,New York.
Jost, C.G., Mariner, J.C., Roeder, P.L., Sawitri, E., Macgregor-Skinner, G.J.,2007. Participatory epidemiology in disease surveillance and research.Rev. Sci. Tech. Off. Int. Epiz. 26, 537–549.
Keeling, M.J., Grenfell, B.T., 1997. Disease extinction and community size:modeling the persistence of measles. Science 275, 65–67.
Loth, L., Gilbert, M., Osmani, M.G., Kalam, A.M., Xiao, X., 2010. Risk factorsand clusters of Highly Pathogenic Avian Influenza H5N1 outbreaks inBangladesh. Prev. Vet. Med. 96, 104–113.
Lunn, D.J., Thomas, A., Best, N., Spiegelhalter, D., 2000. WinBUGS—aBayesian modelling framework: concepts, structure, and extensibility.Stat. Comput. 10, 325–337.
MacKenzie, D.I., 2006. Occupancy Estimation and Modeling: Inferring Pat-terns and Dynamics of Species Occurrence. Elsevier/Academic Press,Burlington, MA.
Mariner, J.C., Jeggo, M.H., van’t Klooster, G.G.M., Geiger, R., Roeder,P.L., 2003. Rinderpest surveillance performance monitoringusing quantifiable indicators. Rev. Sci. Tech. Off. Int. Epiz. 22,837–847.
McClintock, B.T., Nichols, J.D., Bailey, L.L., MacKenzie, D.I., Kendall, W.L.,Franklin, A.B., 2010. Seeking a second opinion: uncertainty in diseaseecology. Ecol. Lett. 13, 659–674.
Normile, D., 2007. Indonesia taps village wisdom to fight bird flu. Science315, 30–33.
OIE, 2010. Terrestrial Animal Health Code, 19th ed. World Organisationfor Animal Health (OIE, ISBN 92-9044-677-3).
Perry, B., Isa, K.M., Tarazona, C., 2009. Independent Evaluation ofFAO’s Participatory Disease Surveillance and Response Programme inIndonesia. FAO Evaluation Service , July 2009, p. 92.
Pfeiffer, D.U., Minh, P.Q., Martin, V., Epprecht, M., Otte, M.J., 2007. An anal-ysis of the spatial and temporal patterns of highly pathogenic avianinfluenza occurrence in Vietnam using national surveillance data. Vet.J. 174, 302–309.
Royle, J.A., Dorazio, R.M., 2008. Hierarchical Modeling and Inference inEcology: The Analysis of Data From Populations, Metapopulations, andCommunities. Academic Amsterdam, Boston.
Sims, L.D., Domenech, J., Benigno, C., Kahn, S., Kamata, A., Lubroth, J., Mar-tin, V., Roeder, R., 2005. Origin and evolution of highly pathogenicH5N1 avian influenza in Asia. Vet. Rec. 157, 159–164.
Spiegelhalter, D.J., Best, N.G., Carlin, B.R., van der Linde, A., 2002. Bayesianmeasures of model complexity and fit. J. Roy. Stat. Soc. B 64,583–616.
Statistics Indonesia – Indonesian Census, 2006. Jakarta,
http://www.bps.go.id/.Thomson, D.L., Cooch, E.G., Conroy, M.J. (Eds.), 2008. Modeling Demo-graphic Processes in Marked Populations. Springer, New York.
Wikle, C.K., 2003. Hierarchical Bayesian models for predicting the spreadof ecological processes. Ecology 84, 1382–1394.
Related Documents