Welcome message from author
This document is posted to help you gain knowledge. Please leave a comment to let me know what you think about it! Share it to your friends and learn new things together.
Transcript


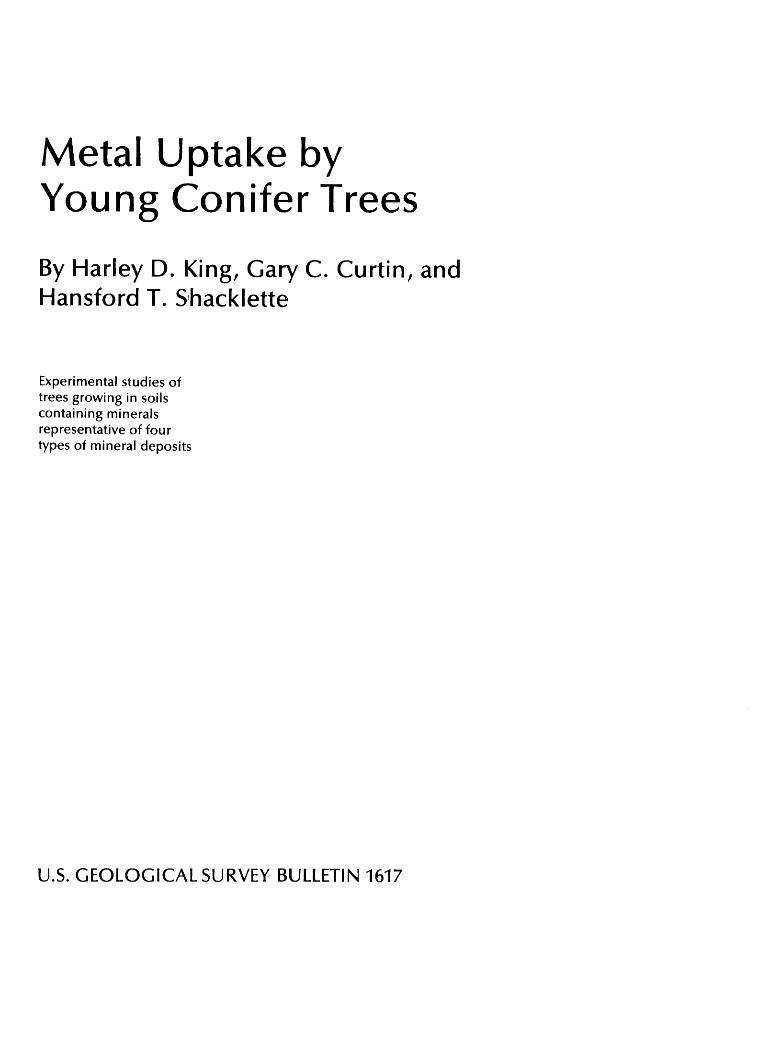
Metal Uptake by Young Conifer Trees
By Harley D. King, Gary C. Curtin, and Hansford T. S~hacklette
Experimental studies of trees growing in soils containing minerals representative of four types of mineral deposits
U.S. GEOLOGICAL SURVEY BULLETIN 1617

UNITED STATES DEPARTMENT OF THE INTERIOR
WILLIAM P. CLARK, Secretary
U.S. GEOLOGICAL SURVEY
Dallas L. Peck, Director
UNITED STATES GOVERNMENT PRINTING OFFICE, WASHINGTON: 1984
For sale by the Branch of Distribution U.S. Geological Survey 604 South Pickett Street Alexandria, VA 22304
Library of Congress Cataloging in Publication Data
King, Harley D. Metal uptake by young conifer trees
(U.S. Geological Survey bulletin ; 1617) Supt. of Docs. no.: 119.3:1617
1. Plants, Effect of metals on. 2. Conifers-Physiology. 3. Conifers-Composition. 4. Conifers-Rocky Mountains Region-Soils. 5. Plant translocation. 6. Biogeochemical prospecting. I. Curtin, Gary C., 1935- . II. Shacklette, Hansford T. Ill. Title. IV. Series. QE75.B9 no. 1617 557.3s [585' .2041335] 84--600084 [QK753.M47]
CONTENTS
Abstract 1 Introduction 1 Organization of the experiments 2
Trees used, and experimental treatments 2 Soils and minerals used, and preparation of potting mixtures 3
Laboratory procedures and analytical methods 4 Plants 4 Soils 4
Results 5 Growth and condition of the trees 5 Analysis of seedlings as received from the nursery 5 Uptake of metals by the trees 6
Antimony 7 Arsenic 18 Bismuth 18 Copper 18 Gold 18 Lead 19 Mercury 19 Molybdenum 19 Silver 19 Tin 20 Tungsten 20 Zinc 20
Effects of species differences in metal uptake by coniferous trees 20 Differences in element concentrations among leaves, stems, and roots 21 Differences in element uptake by 7-year-old trees versus seedlings 21
Conclusions 21 References cited 22
FIGURES
1-5. Photographs showing: 1. A part of the experimental plot, showing the spacing of the seedlings and
the depth to which the pots were buried 2 2. Arrangement of the groups of trees in the plot 3 3. Trees at the conclusion of the study 6 4. Soil from the pot in which a lodgepole pine tree grew 6 5. Rootlets of lodgepole pine with mycorrhizae 6
Contents Ill

IV Contents
TABlES
1. The mineral groups and amounts of minerals added to each pot 3 2. Approximate lower limits of determination of element concentrations by analyti
cal methods used in this study 5 3. Analyses of natural potting soil used in the experiments 5
4-9. Element concentrations and percent ash of: 4. Seedling trees 7 5. Control trees (Group V) 8 6. Group I trees 10 7. Group II trees 12 8. Group III trees 14 9. Group IV trees 16
METRIC-INCH-POUND EQUIVALENTS
Metric unit
millimeter (mm) centimeter (em) meter (m) kilometer (km) gram (g) centimete~ ( cm2
)
degree Celsius (°C)
Inch-pound equivalent
0.04 inch (in.) .39 inch (in.)
3.28 feet (ft) .62 mile (mi) .035 ounce (oz) .16 inch2 (in. 2
)
[degree Fahrenheit CF)-32]/1.8

Metal Uptake by Young Conifer Trees
By Harley D. King, Gary C. Curtin, and Hansford T. Shacklette
Abstract
Nursery-grown seedlings of lodgepole pine, engelmann spruce, and douglas-fir were planted in clay pots in soil obtained from a coniferous forest, to which we added unweathered minerals representing four types of ore deposits . The four types of ore deposits and added minerals were: (1) Carlin-Cortez-arsenopyrite, cervantite, scheelite, metallic gold, and tetrahedrite; (2) high temperature-molybdenite, bismuthite, cassiterite, and scheelite; (3) low to moderate temperature-argentite, tetrahedrite, cerussite, anglesite, azurite, hydrozincite, metallic gold, and metallic mercury; and (4) gold deposits-metallic gold. Pots of seedlings in four experimental groups (each representative of one of the four types of ore deposits and minerals) and one control group were buried to the tops of the pot rims in a ponderosa pine and douglas-fir forest at 2,134 m (7,000 ft) elevation in the Central Rocky Mountains of Colorado. The trees grew here for 7 years with no artificial watering or fertil izing. At the end of this period, the trees were removed from the pots and divided into leaf, stem, and root fractions , which were each analyzed for their element content.
All trees survived the experiment and grew at a normal rate with no ind ications of metal toxicity. Analyses showed an increase of most added metals in the leaves, stems, and roots of trees of each experimental group.
These experiments demonstrated that the elements in unweathered minerals that were added to natural soils became soluble by natural processes and were taken up by tree roots, and then translocated to stems and leaves in a period of 7 years under normal environmental conditions of the Central Rocky Mountain region.
INTRODUCTION
The biogeochemical method of prospecting for mineral deposits depends on the ability of plants to take up elements in amounts that reflect their concentrations in supporting substrates, which in tum have been influenced by nearby mineral deposits. An element, to be taken up by plant roots, must occur in the substrate in a form that
is available, and this form is extremely variable (Brooks, 1972, p. 95). Only a small amount of the total element content of soil is in a form that is soluble and that can be absorbed by roots and translocated throughout the plant. The chemical stability of the ore minerals in the soil zone of weathering varies greatly and ranges, for example, from very stable gold, to barite and cassiterite, which are stable, to the fairly stable minerals scheelite and wolframite, to the unstable minerals arsenopyrite and molybdenite (Andrews-Jones, 1968).
The nature of the biosphere strongly affects mineral weathering because many organisms, particularly bacteria and filamentous fungi, increase the solubility of minerals (Pauli, 1968). The higher order plants produce carbon dioxide and organic acids that are secreted at the soil/root interface, and these compounds may attack the minerals. Some plants also excrete hydrocyanic acid, which, in the root zone, has been shown to solubilize metallic gold (Shacklette and others, 1970). Mycorrhiza, a symbiotic association of filamentous fungi and plant roots, is suspected of producing hydrocyanic acid (Shacklette, 1974, p. 41), and this association is particularly common on roots of coniferous trees. Certain millipedes and larvae of moths that inhabit soil are known to produce hydrocyanic acid (Lakin and others, 1974). Baker (1978) reported that humic acid can dissolve, complex, and transport gold .
In experiments cited by Harley and Smith ( 1983, p. 225), three shrub species were grown in sand culture; one group of three species was inoculated with mycorrhizal fungi, another group of three species was not. Plants in the group that was not inoculated, therefore, had no mycorrhiza on their roots, did not grow well, and many died after various concentrations of zinc sulfate and copper sulfate in solution were added to the sand. The inoculated plants, which developed mycorrhiza on their roots, grew well in the same concentrations of the two metallic compounds previously mentioned. The stems and leaves of the plants without mycorrhiza contained higher concentrations of zinc and copper than did those of the plants with mycorrhiza because the two metals in the latter were
Introduction

held in the mycorrhizal growth on the roots, and therefore could not pass up the stems and into the leaves. Read ( 1983) suggested that heavy metals become bound to the carboxyl groups in the pectic interfacial matrix between fungus and host roots, and therefore do not pass into the root cells. The ability of plants with root mycorrhiza to colonize mine spoil heaps and other areas contaminated with heavy metals, and their ability to grow better in various habitats with high concentrations of potentially toxic ions than do plants without mycorrhiza have been reported by many investigators (Harley and Smith, 1983).
The physical factors active in the weathering process are well known and include the action of water as a solvent and in the freeze/thaw cycle, the ion exchange properties of clay minerals, and other factors.
The experiments reported herein were designed to provide some measure of the effects of weathering on ore minerals and their uptake by trees under natural conditions in the Central Rocky Mountain region. The minerals selected commonly occur in four different types of ore deposits. For measuring the uptake of metals in these minerals, we chose young coniferous trees that were native to this region which, by analysis of their tissues, might indicate a time frame for mobility of metals in minerals that were added to the soil of the trees. Measurements are in metric system; both meters and feet are given for altitudes shown in feet on a topographic map; measurements cited from other sources are given in their system of units. A conversion table follows the table of contents.
We thank chemists E. F. Cooley for analyzing the samples by emission spectroscopy, and T. F. Harms for determining the mercury concentrations. Special gratitude
Figure 1. A part of the experimental plot, showing the spacing of the seedlings and the depth to which the pots were buried. Photographed through the wire-mesh exclosure in June 1973, at the beginning of the second growing season.
2 Metal Uptake by Conifers
is extended to R. E. Van Loenen, who provided a plot for growing the trees on his mountain property and protected the plot from disturbances during the 7 years of the study.
ORGANIZATION OF THE EXPERIMENTS
The experiments were organized to test the response of conifer species to the addition to the soil of certain metals in their mineral compound or elemental form. The trees were grown in an environment that closely resembles the natural conditions of tree growth on forested land in the Central Rocky Mountain region, except for the confinement of the tree roots in pots and the abnormal concentration of metals in soils of the experimental groups of trees.
Trees Used, and Experimental Treatments
Twenty seedling trees each of lodgepole pine (Pinus contorta Dougl. var. latifolia Engelm.), engelmann spruce (Picea engelmannii (Parry) Engelm.), and douglas-fir (Pseudotsuga menziesii (Mirb.) Franco) were obtained from the Colorado State Nursery in January 1972. These trees were rooted in soil enclosed in cardboard tubes. One seedling of each species was divided into leaf (needle), stem, and root sections, which were saved for analysis at the conclusion of the study. Four seedlings of each species were assigned to each of four experimental groups (I, II, III, and IV), and three seedlings of each species formed the control group (V). We removed the cardboard tubes from the seedlings and planted each tree in a clay pot 8 in. in diameter at the top, using the soil mixtures described herein. Each pot had a drainage hole in the bottom. The soil was then saturated with tap water; we did not water the trees again during the 7 years of the experiment.
We planted the trees in a plot in the edge of a douglas-fir and ponderosa pine forest at about 2,134 m (7 ,000 ft) altitude in the upper drainage basin of Turkey Creek, Jefferson County, Colo. The plot was in a slight drainage depression that was filled with snow to a depth of about 80 em when the pots were taken to the site on January 18, 1972. The snow was removed, holes were dug for the pots in the partly frozen soil, and the pots were placed in the holes so that their tops were about even with the soil surface (fig. 1). The snow was shoveled back onto the plot, and an exclusion wire fence was erected around the plot. The arrangement of the experimental groups within the plot is shown in figure 2. The trees received no further attention during the 7 years of the experiment, except annual inspections during spring

or summer to remove fallen tree limbs and other debris from the plot, and to stake some trees that had been bent down by snow.
At the conclusion of the experiment in September 1978, the pots were lifted from the plot and brought back to the laboratory in Denver, Colo., where the trees were removed from the pots, the soil carefully removed from the tree roots, and each tree separated into leaves, stems, and roots. All trees survived the experiment, and the roots of most trees were confined to the soil within the pots.
Soils and Minerals Used, and Preparation of Potting Mixtures
The soil used in the experiment was obtained from a coniferous forest on Squaw Pass, in the Colorado Front Range, about 40 km west of Denver, Colo., at an elevation of 2,984 m (9,790 ft). Soil at the collection site is developing from colluvium composed primarily of weathered biotite gneiss, and is classified as an inceptisol (Soil Survey Staff, 1975) because it is poorly developed and lacks a well-defined illuvial , clay-rich horizon. The soil was sieved with a stainless-steel screen having 6-mm average diameter openings, and the minus-6-mm fraction was used in the experiment. Fifty-seven splits of the soil, each weighing 3,000 g, were used for potting the seedlings. Another split of the soil was saved for analysis.
The ore minerals used in the experiment were commercially obtained, and, with the exception of gold and mercury, were in the form in which they occurred naturally. Information on the exact composition of the miner-
Figure 2. Arrangement of the groups of trees in the plot. The control group, V, of nine trees is in the background. The four experimental groups are (left to right and front to rear) Ill, IV, . I, and II. Within each of the four groups, the rows are (left to right) lodgepole pine, engelmann spruce, and douglas-fir. Photographed at the conclusion of the experiment. The pots, whose tops are 8 in. in diameter, indicate scale.
als (other than for gold and mercury) was not obtained. Some of the minerals may contain various elemental impurities or admixtures, or may vary in composition as discussed in standard mineralogy texts. For example, in tetrahedrite, (Cu,Fe,Zn,Ag) 12Sb4S13 , copper is always predominant; however, considerable substitution takes place that results in variable concentrations of iron, zinc, silver, lead, and mercury. The antimony in tetrahedrite may be replaced by arsenic in various proportions.
Some of the minerals were obtained as crystals, whereas others were in a granular or powdery form. Crystals were crushed in a chipmunk jaw crusher and sieved to minus 0.2 mm. The amounts added to each pot are shown in table 1. The minerals for each group were combined and mixed well.
Table 1. The mineral groups and amounts of minerals added to each pot
Experimental group
Group I. Minerals representing Carlin-Cortez-type deposits
Amount per pot (in grams)
Arsenopyrite, FeAsS---------------- 26.2
Cervantite, Sb2o4------------------ 21.4
Scheelite, cawo4------------------- 7.0 Tetrahedrite, (Cu,Fe,Zn,Ag) 12sb4s13 20.3
Gold, Au, metallic----------------- .03
Total---------------------------- 74.93
Group II. Minerals representing high-temperature deposits
Molybdenite, MoS2------------------ 18.1
Bismuthite, (Bi0) 2co3-------------- 27.5
Cassiterite, Sn02------------------ 22.3
Scheelite, Cawo4------------------- 7.1
Total---------------------------- 75.0
Group III. Minerals representing lowto moderate-temperature deposits
Argentite, Ag2S-------------------Tetrahedrite, (Cu,Fe,Zn,Ag) 12sb4S13
Cerussite, PbC03------------------Anglesite, PbS04------------------Azurite, Cu3(C0 3)2·(0H)2----------Hydrozincite, zn5(0H) 6(C03)2------Gold, Au, metallic----------------Mercury, Hg, metallic--------------
Total----------------------------
Group IV. Gold deposits
Gold, Au, metallic-----------------
12.8
15.6
18.3 18.3 18.2 6.7
.03
.09
90.02
0.03
Organization of Experiments 3

The gold was obtained as sheets 0.0007 in. thick, 30 mm by 75 mm, and weighing 0.75 g. The sheets were cut into small squares about 1 to 2 mm on a side, and the amount added to each pot was approximately 0.03 g. The surface area of sheet gold added to the pots was approximately 2 cm2
.
Mixtures of the ore minerals and soils were prepared individually for each pot by combining the splits of ore minerals with 3,000 g of soil and mixing well in polyethylene buckets. These mixtures were used as the soil medium in planting the seedlings of the experimental groups. Soil with no added minerals was used in the nine control seedling pots.
Minerals that contain antimony, arsenic, gold, and tungsten were used for Group I because these elements are found in anomalous amounts in Carlin-Cortez disseminated gold deposits, Nevada (Erickson and others, 1964; Erickson and others, 1966; Wells and others 1969). Minerals containing these elements at Carlin are arsenopyrite, realgar, orpiment, stibnite, scheelite, and gold (Radtke and others, 1972; Harris and Radtke, 1976). Warren and Hajek (1973, p. 124) summarized this type of deposit as follows: "A Carlin-Cortez type of gold deposit may be considered as an epithermal type of mineralization where vein development is relatively unimportant and finely disseminated gold occurs in replacement bodies predominantly in sedimentary rocks containing significant amounts of calcium and accompanied with anomalous amounts of barium, strontium, arsenic, antimony, mercury and copper." The minerals used for Group I include arsenopyrite (FeAsS) for arsenic; cervantite (Sb20 4), a secondary mineral formed by the oxidation of stibnite, and tetrahedrite ((Cu,Fe,Zn,Ag) 12Sb4S13) for antimony; scheelite (CaW04 ) for tungsten; and metallic gold for gold.
Minerals used for Group II are found in high-temperature deposits and include molybdenite (MoS2); bismuthite ((Bi0hC03)-a secondary mineral formed by the alteration of bismuthinite, native bismuth, and other primary bismuth minerals; cassiterite (Sn02); and scheelite (CaW04). Elements of interest in this group are bismuth, molybdenum, tin, and tungsten. Minerals used for Group III, which represent low- to moderate-temperature deposits, include argentite (Ag2S); tetrahedrite ((Cu,Fe,Zn,Ag)12Sb4S13); cerussite (PbC03), a supergene lead mineral formed by the action of carbonated waters on galena; anglesite (PbS04), a secondary mineral usually formed by the oxidation of galena; azurite (Cu3(C03h·(0Hh), a secondary mineral chiefly formed by the action of carbonated waters on other copper minerals; hydrozincite (Zn5(0H)6(C03h), a secondary mineral formed by the alteration of sphalerite; metallic gold (Au); and metallic mercury (Hg). Elements of interest in this group include copper, gold, mercury, lead, silver, and zinc.
4 Metal Uptake by Conifers
LABORATORY PROCEDURES AND ANALYTICAL METHODS
Plants
Roots were washed to remove remnants of the soil mixture by shaking them in beakers filled with tap water and placing them in an ultrasonic-cleaner (generator output frequency, 25 KHZ) water bath for about 4 minutes each. Root samples to which soil still adhered were washed additionally by repeating the same technique. Although the samples were washed until all visible soil was removed, in many of the samples concealed particles of soil could still have been present beneath the thin, loosely attached, and often cracked outer layer of the roots, thus contaminating the samples. All samples were dried in an oven at 35°C.
Stems and roots were cut into small pieces with pruning shears, and were ground in a Wiley mill. 1 Splits of leaves, stems, and roots were ashed in a muffle furnace during a 24-hour period, while the temperature increased slowly at a rate of about 50°C per hour to a maximum of 550°C, and stayed at that temperature for most of the remaining time.
Ash samples of roots were sieved with a screen having 0.119-mm average diameter openings, and some small amount of plus-0 .119-mm-diameter sand was removed from most samples. Ash samples of leaves, stems, and roots were pulverized and homogenized by shaking vigorously for 2 minutes in 1-oz plastic containers to which two 6-mm-diameter glass balls had been added.
The ash samples were analyzed for 32 elements by a semiquantitative emission spectrographic method described by Mosier (1972) and modified by Curry and others (1975). Plant analyses for mercury were made using the Hatch and Ott (1968) method, with modifications by T. F. Harms (U.S. Geological Survey, unpub. data). The limit of determination for each element using these methods is given in table 2.
Soils
Soils were sieved, and the minus-80-mesh fraction was pulverized to minus 100 mesh and analyzed for 31 elements by a semiquantitative emission spectrographic method outlined by Grimes and Marranzino ( 1968). Soils analyzed include the natural potting soil and soil from three of the control pots after 7 years of tree growth. Results are given in table 3.
1 Any use of trade names is for descriptive purposes only and does not imply endorsement by the U.S. Geological Survey.

Table 2. Approximate lower limits of determination of element concentrations in plant samples by analytical methods used in this study
[Analysis by the semiquantitative emission spectrographic method, except as indicated. Values given in parts per million, except where percent is indicated]
Ag----- 0.5 Mg, pet 0.01 As----- 200 Mo----- 5 Au----- 2 Mn, pet .001 8------ 5 Na, pet .005 Ba----- 20 Ni----- 5
Be----- .5 Pb----- 1 Bi---- - 1 Sb----- 50 Cd----- 1 Sn----- 5 Co----- 5 Sr, pet .01 Cr----- 5 Ti, pet .001
Cu----- 1 V------ 5 Fe, pet .005 W------ 50 Ge1---- 2 Y------ 10 Hg ---- .02 Zn, pet .01 La----- 20 Zr----- 10
1Analyzed by a modification of the Hatch and Ott method ( 1968).
RESULTS
Growth and Condition of the Trees
The three tree species used in this study naturally grow slowly when young. The average height of the tallest 25 percent of douglas-fir seedlings at a forest site in Colorado was reported by Fowells (1965, p. 549) as 32.6 in. at 7 years of age. He also stated that roots of lodgepole pine seedlings grow slowly (p . 376), and that both root growth and shoot growth of engelmann spruce were slow. Five-year-old seedlings averaged less than 1 in . in height when grown under natural conditions (p. 302). Judging from these findings, the growth rates of the trees in our experiments seem not to have been reduced by the minerals added to the soils or by confinement of the roots in pots. At the conclusion of our study, the approximate heights of the tallest trees of each species were as follows: lodgepole pine, 65 em; douglas-fir, 60 em; and engelmann spruce, 52 em. Variation occurred in the growth rate of trees within a species , regardless of which experimental procedure was used, and the variation in growth of the contr~ group of trees fell within this range of variation (fig. 3).
The amount of soil used per pot seemed adequate for the root growth for 7 years; no trees were potbound (pots tightly packed with roots), and only a few pine trees
Table 3. Analyses of natural potting soil used in the experiments to which no minerals were added
[Concentrations given in parts per million, except where percent is indicated. Leaders ( --), element was not detected in the sample]
Element
Ag----As----Au-----8------Ba-----
Be----Bi--- -Cd----Co----Cr-----
Cu----Fe, pet La----Mg, pc t Mo-----
Mn, pet Ni- - --Pb----Sb----Sn-----
Sr, pet Ti, pet V------W-----Y------Zn, pet Zr-----
Soil removed from control pots after 7 years of tree growth
Natural Engelmann Lodgepole Douglas-potting spruce pine fir soil
20 20 50 100 700 500 700 700
2 2 2 2
15 20 20 20 70 150 150 150
50 70 70 70 7 7 7 7
150 100 100 100 1.5 1.5 1.5 1.5
.2 .07 .07 .07 20 50 50 50 70 70 70 70
.02 .02 .03 .03
.5 .5 .5 .5 50 100 150 100
70 70 30 30
300 200 200 150
had produced root growth extending a few centimeters through the pot holes (fig. 4). Pine trees (and probably also spruce and douglas-fir) have a short root-hair zone (Bold, 1967, p. 518) which limits the absorption of elements from the soil solution that surrounds their roots. Mycorrhizal fungi, however, invade the root cells and form a symbiotic association, termed a mycorrhiza, that increases the absorptive ability of the root system. When the soil was removed from the pots, abundant mycorrhizae were observed at the pot/soil interface (figs. 4 and 5) in some pots.
Analysis of Seedlings as Received from the Nursery
One seedling tree of each of the three conifer species was divided into leaf, stem, and root samples at
Results 5

the beginning of the study, and these samples were held, without further preparation, in plastic bags at room temperature until the conclusion of the experiments and then randomly interspersed with the experimental samples when submitted to the laboratory for analysis. The analyses are given in table 4. The seedling analyses can be compared to analyses of the control group of trees (table 5), which had grown 7 years longer than the seedlings, to provide a measure of changes in element concentrations that may have occurred with age. The number of samples in both groups is too small for conclusive comparisons to be made; however, some of the stronger differences or similarities between the groups may indicate tendencies for element absorption that either change or remain nearly constant with the age of the trees.
Uptake of Metals by the Trees
The uptake of metals is demonstrated by comparisons of the elements in samples of experimental trees with those of the control trees that grew in soils to which no minerals were added. The possibility of contamination of the root samples of Groups I-IV by the minerals added to the soils greatly reduced the usefulness of some root samples for measuring element absorption from the soil solution. Contamination by adhering soil is suspected, but not proven, of the samples of experimental trees if concentrations of the added elements in root samples greatly exceed concentrations found in root samples of the control trees. If the root-sample analyses within a group of four replicates range widely, the highest value probably repre-
Figure 3. Trees at the conclusion of the study. The three rows of trees selected to show height are (left to right) lodgepole pine, engelmann spruce, and douglas-fir. The pots, whose tops are 8 in. in diameter, indicate scale.
6 Metal Uptake by Conifers
Figure 4. Soil (inverted) from the pot in which a lodgepole pine tree grew. The dark lines on the soil surface are rootlets; the irregular white lines at the soil summit are the mycelium of a mycorrhizal fungus. Several roots are shown that grew through the drainage hole in the pot. The pots, whose tops are 8 in. in diameter, indicate scale.
sents contamination of a single sample, and the lower values may more nearly represent concentrations taken up by the roots. If values for leaves, stems, and roots in a set of replicates are all high compared to those of the corresponding control samples, little or no root contamination is suggested. The greatest reliance was placed on analyses of the stem and leaf samples, because their contamination by minerals added to the soils is unlikely.
Figure 5. Rootlets of lodgepole pine with mycorrhizae. The hyphae (filamentous strands of the fungus), although too small to be seen in this photograph, are indicated by the masses of fine soil particles that have adhered to the rootlets. Where no mycorrhizal fungi ocd:lr on the rootlets, no soil adheres.

Analyses of leaves, stems, and roots of the three conifer species in the control group and the experimental groups are given in tables 5-9. Discussions of species characteristics in respect to uptake of elements of greatest interest in mineral exploration follow.
Antimony
Antimony was added as cervantite and tetrahedrite to Group I soils and as tetrahedrite to Group III soils. This element was not detected in the natural potting soil (table 3), in soil removed from pots of the control group of trees (table 3), or in any tissues of trees that grew in soil to which no antimony had been added. It was, however, found in leaves of seedling trees as received from the nursery (table 4) and in roots of Group IT trees (table 7).
Analyses of Group I (table 6) showed no antimony in the conifer leaves, some in stems of spruce (50-700 ppm) and douglas-fir (200 ppm), and some (50 ppm) in one sample of pine stems. Roots of pine and douglas-fir contained high (2,000->5,000 ppm) antimony concentrations. One spruce-root sample contained a high amount of antimony (5,000 ppm), whereas low values (200-700 ppm) were obtained for the other three samples. For one spruce tree a value of 700 ppm was obtained for both stems and roots, suggesting negligible root contamination for that sample.
Analyses of Group III (table 8) showed antimony in two samples of douglas-fir leaves (50 ppm), and in stems of pine (50-150 ppm) and douglas-fir (50 ppm), but not in stems of spruce. Generally, root-sample values were lower for this group than for Group I. The higher values for both groups are probably influenced by contamination.
Table 4. Element concentrations and percent ash of seedling trees as received from the nursery
[One tree of each species was analyzed. Concentrations expressed as parts per million in ash, except where percent is indicated. Leaders ( --), element was not detected in the sample]
Species of tree
Lodgepole pine Engelmann spruce Douglas-fir Element, or ash Leaves Stems Roots Leaves Stems Roots Leaves Stems Roots
Ag------ 5 1.5 5 2 5 5 2 1 As------Au------8------- 1,000 500 200 1,000 500 200 1,000 500 200 Ba------ 300 500 1,000 1,000 3,000 3,000 1,000 700 2,000
Be------ 3 2 300 Bi------ >500 70 >500 70 10 >500 100 5 Cd------ 30 100 5 50 200 50 50 200 50 Co------ 10 20 20 10 20 30 20 20 20 Cr------ 5 20 50 30 50 70 70 20 50
Cu------ 150 150 70 100 200 100 200 200 150 Fe, pet- 1 2 3 1 2 >5 1.5 1 >5 Ge------ 10 La------ 20 20 100 50 30 100 30 30 100 Mg, pet- 3 3 1 3 5 3 5 3 3
Mo------ 50 100 30 30 5 10 10 20 70 Mn, pet- .7 .3 .3 >1 1 .15 >1 1 .7 Na, pet- . 7 .5 .5 .3 .7 .5 .5 .5 .5 Ni------ 50 30 30 50 70 50 100 70 50 Pb------ 500 100 20 300 500 150 500 500 50
Sb------ 100 50 100 Sn------ 100 15 5 50 20 10 50 30 70 Sr, pet- .07 .07 .03 .5 .5 .2 .5 .3 .2 Ti, pet- .15 .2 .7 .3 .3 1 .1 .2 1 V------- 30 100 300 70 150 500 50 50 500
W-------Y------- 10 50 10 50 70 10 50 Zn, pet- .2 .2 .2 .3 .5 .3 .2 .3 .3 Zr------ 10 100 1,000 30 200 1,000 10 100 1,000 Ash, pet dry wt.- 4.9 3.3 9.7 5.8 3.2 8.8 2.7 2.2 6.1
Results 7

Table 5. Element concentrations and percent ash of control trees (Group V) grown in soil with no added minerals
[Concentrations expressed as parts per million in ash, except where percent is indicated. Leaders(--), element was not detected in the sample]
Species of tree
Element, Lodgepole pine Engelmann spruce Douglas-fir
Repli-or ash cate Leaves Stems Roots Leaves Stems Roots Leaves Stems Roots
Ag------ 1 2 5 10 1 3 30 5 1.5 10 2 1 1.5 50 1 2 50 5 2 10 3 2 5 10 1 3 10 5 3 20
As-··---- 1 2 3
Au------ 1 2 3
8------- 1 >1,000 500 300 1,000 500 500 >1,000 500 700 2 1,000 300 500 500 300 500 1,500 300 500 3 >1,000 500 300 1,000 500 300 >1,000 500 300
Ba------ 1 200 5,000 700 1,500 5,000 5,000 1,000 5,000 3,000 2 100 300 700 700 2,000 5,000 1,000 3,000 7,000 3 200 500 700 5,000 5,000 2,000 700 5,000 3,000
Be------ 1 2 <.5 3 5 2 1 2 5 3 3 2 3
Bi------ 1 200 70 30 100 50 20 100 50 10 2 15 10 50 100 30 10 200 50 10 3 50 30 10 70 50 10 200 70 20
Cd------ 1 20 50 50 1 50 20 10 100 200 2 20 1 10 20 10 70 50 3 20 200 20 10 50 50 20 100 20
Co------ 1 10 10 20 <5 20 20 <5 10 30 2 50 10 50 10 10 30 3 10 20 20 10 20 30 10 20 30
Cr------ 1 5 <5 20 5 15 70 5 20 70 2 50 5 50 5 5 70 3 5 20 70 10 10 50 7 15 70
Cu------ 1 200 200 200 100 200 500 100 300 700 2 100 100 500 100 150 700 100 500 500 3 200 200 300 100 200 200 150 500 500
Fe, pet- 1 .5 .7 2 .5 2 5 .3 1 3 2 .5 .3 5 .3 .5 5 .5 .5 5 3 1 2 5 1.5 1 5 .7 1 5
Ge------ 1 100 50 100 70 2 20 30 100 3 50 30 100
Hg------ 1 .05 .03 .20 .04 .04 .15 .04 .03 .12 2 .03 .04 .09 .04 .04 .18 .03 .04 .16 3 .04 .04 .16 .05 .04 .14 .04 .04 .20
La------ 1 20 20 100 20 20 100 20 20 200 2 50 100 <20 20 100 3 20 20 30 20 30 50 20 20 100
8 Metal Uptake by Conifers

Table 5. Element concentrations and percent ash of control trees (Group V)-Continued
Species of tree
Element, Lodgepole pine Engelmann spruce Douglas-fir
Repli-or ash cate Leaves Stems Roots Leaves Stems Roots Leaves Stems Roots
Mg, pet- 1 5 5 3 3 5 5 3 3 5 2 2 3 3 3 3 3 3 5 5 3 5 7 3 5 5 5 3 5 3
Mo------ 1 50 50 50 10 10 50 10 100 20 2 30 20 100 15 5 50 10 5 100 3 100 7 20 10 10 50 50 30 70
Mn, pet- 1 1 .3 .15 .3 .5 .3 1 .5 .3 2 1 .5 .3 1 1 1 .5 .7 .15 3 .7 .7 .2 1 .5 .2 >1 1 .3
Na, pet- 1 .3 .3 .2 .2 .5 .7 .2 .5 .5 2 .15 .2 .5 .2 .3 .5 .2 .5 .7 3 .5 .5 .5 .3 .7 .5 .2 .5 .7
Ni------ 1 50 30 50 20 30 50 30 30 50 2 30 20 70 10 20 70 20 20 100 3 50 100 50 30 50 50 20 30 70
Pb------ 1 500 300 30 300 1,000 50 200 700 100 2 20 50 70 200 700 70 300 1,000 50 3 300 500 50 300 1,000 70 300 700 100
Sb------ 1 2 3
Sn------ 1 15 10 5 10 10 10 30 5 10 2 30 10 15 5 15. 10 10 3 5 7 10 15 15 10 30 20 10
Sr, pet- 1 .02 .05 .07 .15 .3 .5 .15 .5 .3 2 .01 .05 .2 .1 .1 .3 .2 .3 .3 3 .05 .07 .2 .2 .2 .2 .1 .3 .3
Ti, pet- 1 .07 .1 .2 .07 .7 .5 .05 .2 .7 2 .05 .07 .5 .05 .1 .5 .1 .15 .5 3 .1 .1 .5 .15 .2 .5 .1 .2 .5
V------- 1 30 20 700 30 70 700 20 50 700 2 20 10 1,000 20 20 1,000 20 30 1,000 3 50 50 500 50 70 700 50 50 1,000
W------- 1 2 3 100
Y------- 1 30 <10 50 10 50 2 50 50 <10 50 3 <10 <10 20 <10 50
Zn, pet- 1 .3 .5 .1 .3 2 .5 .2 1.5 .2 2 .1 .1 .2 .3 .5 .3 .3 2 .3 3 .5 1.5 .2 .3 2 .2 .3 1 .3
Zr------ 1 10 20 100 20 30 100 <10 50 100 2 <10 20 100 10 20 500 10 20 300 3 20 20 150 50 70 500 50 30 150
Ash, pet dry wt.- 1 3.0 1.9 2.0 3.9 3.0 3.9 2.9 1.9 2.0
2 2.0 2.0 3.7 3.0 2.0 3.9 2.0 2.0 3.5 3 3.0 2.0 7.6 4.0 3.0 5.1 3.0 2.0 4.0
Results 9
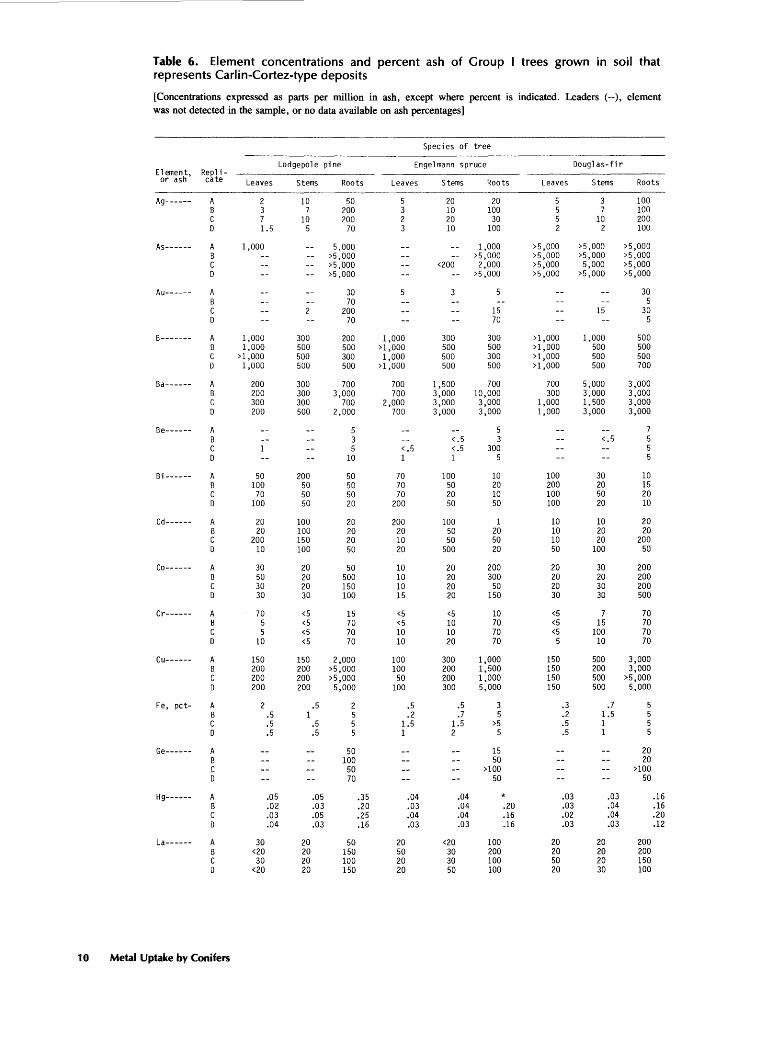
Table 6. Element concentrations and percent ash of Group I trees grown in soil that represents Carlin-Cortez-type deposits
[Concentrations expressed as parts per million in ash, except where percent is indicated. Leaders ( --), element was not detected in the sample, or no data available on ash percentages]
Species of tree
Lodgepole pine Engel mann spruce Oougl as-fir Element, Repl i-or ash cate Leaves Stems Roots Leaves Stems Roots Leaves Stems Roots
Ag------ A 2 10 50 5 20 20 5 3 100 B 3 7 200 3 10 100 5 7 100 c 7 10 200 2 20 30 5 10 200 0 1.5 5 70 3 10 100 2 2 100
As------ A 1,000 5,000 1,000 >5 ,000 >5 ,000 >5,000 B >5 ,000 >5 '000 >5,000 >5, 000 >5,000 c >5 ,000 <200 2,000 >5 ,000 5,000 >5,000 0 >5 ,000 >5 ,000 >5 ,000 >5 ,000 >5 ,000
Au------ A 30 30 B 70 5 c 200 15 15 30 0 70 70 5
8------- A 1,000 300 200 1,000 300 300 > 1,000 1,000 500 B 1,000 500 500 >1 ,000 500 500 >1 ,000 500 500 c > 1 ,000 500 300 1,000 500 300 >1 ,000 500 500 0 1,000 500 500 > 1 ,000 500 500 > 1 ,000 500 700
Ba------ A 200 300 700 700 1,500 700 700 5,000 3,000 B 200 300 3,000 700 3,000 10,000 300 3,000 3,000 c 300 300 700 2,000 3,000 3,000 1,000 1,500 3,000 0 200 500 2,000 700 3,000 3,000 1,000 3,000 3,000
Be------ A 5 5 7 B 3 < .5 3 < .5 5 c 5 < .5 < .5 300 5 0 10 1 1 5 5
Bi------ A 50 200 50 70 100 10 100 30 10 B 100 50 50 70 50 20 200 20 15 c 70 50 50 70 20 10 100 50 20 0 100 50 20 200 50 50 100 20 10
Cd------ A 20 100 20 200 100 1 10 10 20 B 20 100 20 20 50 20 10 20 20 c 200 150 20 10 50 50 10 20 200 0 10 100 50 20 500 20 50 100 50
Co------ A 30 20 50 10 20 200 20 30 200 B 50 20 500 10 20 300 20 20 200 c 30 20 150 10 20 50 20 30 200 0 30 30 100 15 20 150 30 30 500
Cr------ A 70 <5 15 <5 <5 10 <5 7 70 B 5 <5 70 <5 10 70 <5 15 70 c 5 <5 70 10 10 70 <5 100 70 0 10 <5 70 10 20 70 5 10 70
Cu------ A 150 150 2,000 100 300 1,000 150 500 3,000 B 200 200 >5,000 100 200 1,500 150 200 3,000 c 200 200 >5,000 50 200 1,000 150 500 >5,000 0 200 200 5,000 100 300 5,000 150 500 5,000
Fe, pet- A 2 .5 2 .5 .5 3 .3 .7 B .5 1 5 .2 .7 5 .2 1.5 c .5 .5 5 1.5 1.5 >5 .5 1 0 .5 .5 5 1 2 5 .5 1
Ge------ A 50 15 20 B 100 50 20 c 50 >100 >100 0 70 50 50
Hg------ A .05 .05 .35 .04 .04 * .03 .03 .16 B .02 .03 .20 .03 .04 .20 .03 .04 .16 c .03 .05 .25 .04 .04 .16 .02 .04 .20 0 .04 .03 .16 .03 .03 .16 .03 .03 .12
La------ A 30 20 50 20 <20 100 20 20 200 B <20 20 150 50 30 200 20 20 200 c 30 20 100 20 30 100 50 20 150 0 <20 20 150 20 50 100 20 30 100
1 0 Metal Uptake by Conifers
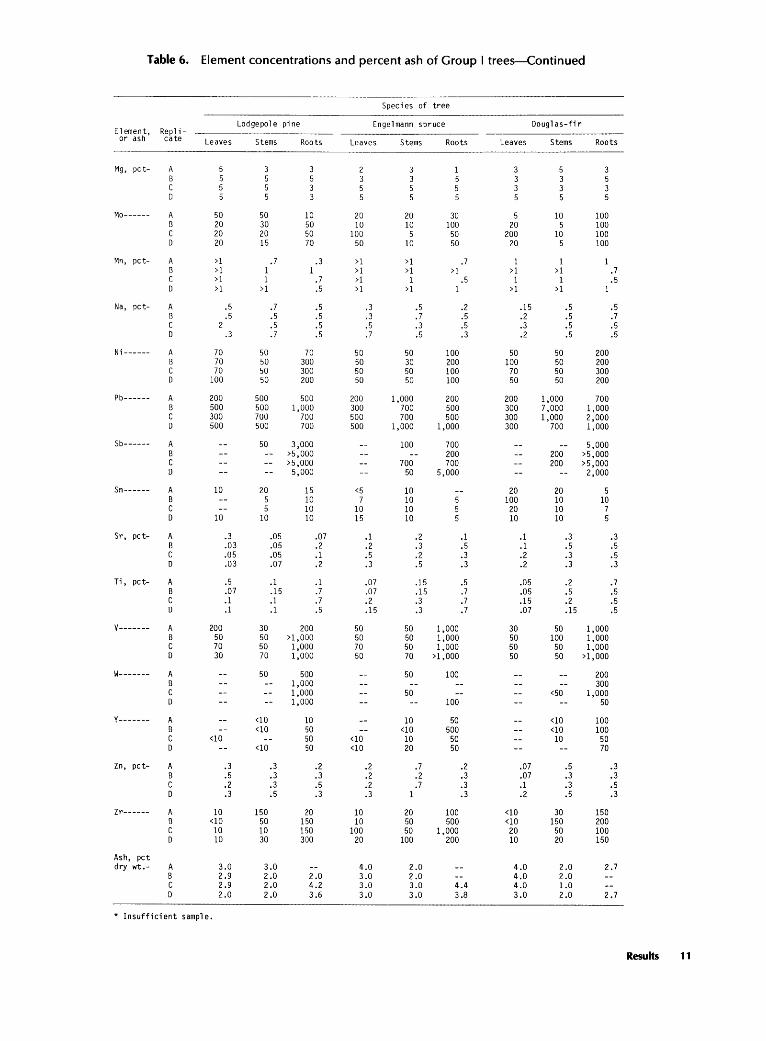
Table 6. Element concentrations and percent ash of Group I trees-Continued
Species of tree
Lodgepole pine Enge 1 mann spruce Douglas-fir Element, Repl i-or ash cate Leaves Stems Roots Leaves Stems Roots Leaves Stems Roots
Mg, pet- A 1 B 5 c 5 D 5
Mo------ A 50 50 10 20 20 30 5 10 100 B 20 30 50 10 10 100 20 5 100 c 20 20 50 100 5 50 200 10 100 D 20 15 70 50 10 50 20 5 100
Mn, pet- A >1 . 7 .3 >1 >1 .7 1 1 1 B > 1 1 1 >1 >1 >1 >1 >1 .7 c >1 1 . 7 >1 1 .5 1 1 .5 D > 1 > 1 .5 >1 > 1 1 >1 > 1 1
Na, pet- A .5 • 7 .5 .3 .5 .2 .15 .5 .5 B .5 .5 .5 .3 • 7 .5 .2 .5 .7 c 2 .5 .5 .5 .3 .5 .3 .5 .5 D .3 • 7 .5 .7 .5 .3 .2 .5 .5
Ni ------ A 70 50 70 50 50 100 50 50 200 B 70 50 300 50 30 200 100 50 200 c 70 50 300 50 50 100 70 50 300 D 100 50 200 50 50 100 50 50 200
Pb------ A 200 500 500 200 1,000 200 200 1,000 700 B 500 500 1,000 300 700 500 300 7,000 1,000 c 300 700 700 500 700 500 300 1,000 2,000 D 500 500 700 500 1,000 1,000 300 700 1,000
Sb------ A 50 3,000 100 700 5,000 B >5 '000 200 200 >5,000 c >5 ,000 700 700 200 >5 ,000 D 5,000 50 5,000 2,000
Sn------ A 10 20 15 <5 10 20 20 5 B 5 10 7 10 100 10 10 c 5 10 10 10 20 10 7 D 10 10 10 15 10 10 10 5
Sr, pet- A .3 .05 .07 .1 .2 .1 .1 .3 .3 B .03 .05 .2 .2 .3 .5 .1 .5 .5 c .05 .05 .1 .5 .2 .3 .2 .3 .5 D .03 .07 .2 .3 .5 .3 .2 .3 .3
Ti, pet- A .5 .1 .1 .07 .15 .5 .05 .2 . 7 B .07 .15 .7 .07 .15 .7 .05 .5 .5 c .1 .1 .7 .2 .3 .7 .15 .2 .5 D .1 .1 .5 .15 .3 • 7 .07 .15 .5
V------- A 200 30 200 50 50 1,000 30 50 1,000 B 50 50 >1 ,000 50 50 1,000 50 100 1,000 c 70 50 1,000 70 50 1,000 50 50 1,000 D 30 70 1,000 50 70 >1 ,000 50 50 >1 ,000
W------- A 50 500 50 100 200 B 1,000 300 c 1,000 50 <50 1,000 D 1,000 100 50
y ------- A <10 10 10 50 <10 100 B <10 50 <10 500 <10 100 c <10 !50 <10 10 50 10 50 D <10 50 <10 20 50 70
Zn, pet- A .3 .3 .2 .2 .7 .2 .07 .5 .3 B .5 .3 .3 .2 .2 .3 .07 .3 .3 c .2 .3 .5 .2 .7 .3 .1 .3 .5 D .3 .5 .3 .3 1 .3 .2 .5 .3
Zr------ A 10 150 :20 10 20 100 <10 30 150 B <10 50 150 10 50 500 <10 150 200 c 10 10 1!50 100 50 1,000 20 50 100 D 10 30 300 20 100 200 10 20 150
Ash, pet dry wt.- A 3.0 3.0 4.0 2.0 4.0 2.0 2. 7
B 2.9 2.0 2.0 3.0 2.0 4.0 2.0 c 2.9 2.0 4.2 3.0 3.0 4.4 4.0 1.0 D 2.0 2.0 3.6 3.0 3.0 3.8 3.0 2.0 2. 7
* Insufficient sample.
Results 11

Table 7. Element concentrations and percent ash of Group II trees grown in soil that represents high-temperature deposits
[Concentrations expressed as parts per million in ash, except where percent is indicated. Leaders (-), element was not detected in the sample, or no data available on ash percentages]
Species of tree
Lodgepo 1 e pine Engel mann spruce Douglas-fir Element, Repl i-or ash cate Leaves Stems Roots Leaves Stems Roots Leaves Stems Roots
Ag------ A 1 2 100 1 2 150 5 2 100 B 2 5 200 2 5 200 2 1.5 150 c 2 5 70 .2 2 100 2 2 70 D 3 5 20 .5 2 200 3 2 100
As------ A 200 200 B c D
Au------ A B c D
B------- A >1 ,000 500 300 >1 ,000 300 >1 ,000 >1 ,000 300 500 B >1 ,000 500 500 >1 ,000 500 500 > 1,000 500 1,000 c 1,000 500 500 1,000 300 1,000 >1 ,000 500 500 D >1,000 1,000 200 > 1,000 300 1,000 >1 ,000 500 500
Ba------ A 500 500 1,500 2,000 5,000 500 700 1,000 1,000 B 200 300 700 2,000 15,000 3,000 1,500 5,000 3,000 c 300 300 1,000 3,000 2,000 2,000 3,000 3,000 3,000 D 200 500 500 5,000 5,000 5,000 2,000 3,000 3,000
Be------ A 3 1.5 500 B 2 5 2 c 1 2 2 D 3 2 300
Bi------ A 70 300 >500 100 500 >500 100 200 >500 B 100 >500 >500 100 >500 >500 200 >500 >500 c 100 500 >500 100 300 >500 100 500 >500 D 70 >500 >500 100 >500 >500 100 >500 >500
Cd------ A 15 30 100 10 30 50 10 200 50 B 20 20 10 2 200 50 50 100 200 c 20 100 50 50 20 50 10 100 20 D 20 200 2 20 200 1 100 100
Co------ A 15 10 50 10 15 50 15 15 30 B 20 20 50 <5 20 50 <5 10 30 c 10 10 50 10 50 20 50 D 10 10 30 10 15 30 <5 10 50
Cr------ A 5 <5 50 5 5 150 <5 <5 30 B 10 5 70 <5 10 70 10 70 c 5 <5 50 5 <5 70 10 70 D 7 7 20 <5 10 70 <5 5 70
Cu------ A 150 150 700 100 200 500 150 500 500 B 100 200 500 100 200 1,000 100 500 700 c 150 200 500 100 150 500 100 200 500 D 150 150 200 100 200 700 100 300 500
Fe, pet- A . 7 .3 5 .5 .5 3 .3 .3 B 1 .5 5 .5 1 5 .2 1 c .3 .5 >5 1 .5 5 .5 1 D .7 1 3 .5 1 3 .2 .1
Ge------ A >100 50 B >100 100 100 c 70 70 50 D >100 50
Hg------ A .03 .03 .16 .03 .03 .20 .03 .03 .18 B .04 .03 .20 .04 .04 .25 .03 .04 .20 c .04 .04 .10 .04 .03 .20 .03 .04 .25 D .03 .03 .16 .03 .03 .25 .04 .03 .20
La------ A 20 <20 100 20 20 150 20 <20 100 B 20 20 100 20 30 100 20 20 100 c <20 <20 100 30 20 100 20 20 50 D 30 30 150 30 <20 100 20 20 100
12 Metal Uptake by Conifers
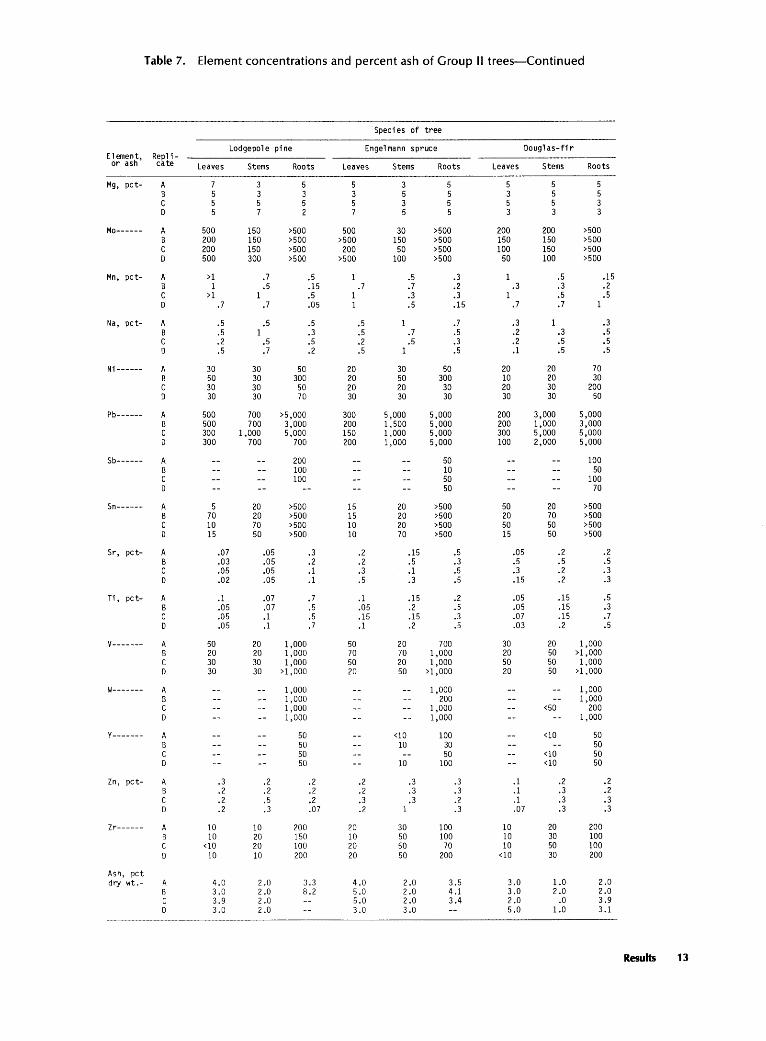
Table 7. Element concentrations and percent ash of Group II trees-Continued
Species of tree
Lodgepole pine Engel mann spruce Douglas-fir Element, Repl i-or ash cate Leaves Stems Roots Leaves Stems Roots Leaves Stems Roots
Mg, pet- A 7 3 5 5 5 5 B 5 5 5 3 5 5 c 5 3 5 5 5 3 D 5 5 5 3 3 3
Mo------ A 500 150 >500 500 30 >500 200 200 >500 B 200 150 >500 >500 150 >500 150 150 >500 c 200 150 >500 200 50 >500 100 150 >500 D 500 300 >500 >500 100 >500 50 100 >500
Mn, pet- A >1 .7 .5 1 .5 .3 1 .5 .15 B 1 .5 .15 . 7 .7 .2 .3 .3 .2 c >1 1 .5 1 .3 .3 1 .5 .5 D .7 .7 .05 1 .5 .15 .7 .7 1
Na, pet- A .5 .5 .5 .5 1 .7 .3 1 .3 B .5 1 .3 .5 .7 .5 .2 .3 .5 c .2 .5 .5 .2 .5 .3 .2 .5 .5 D .5 .7 .2 .5 1 .5 .1 .5 .5
Ni ------ A 30 30 50 20 30 50 20 20 70 B 50 30 300 20 50 300 10 20 30 c 30 30 50 20 20 30 20 30 200 D 30 30 70 30 30 30 30 30 50
Pb------ A 500 700 >5,000 300 5,000 5,000 200 3,000 5,000 B 500 700 3,000 200 1 '500 5,000 200 1,000 3,000 c 300 1,000 5,000 150 1,000 5,000 300 5,000 5,000 D 300 700 700 200 1,000 5,000 100 2,000 5,000
Sb------ A 200 50 100 B 100 10 50 c 100 50 100 D 50 70
Sn------ A 5 20 >500 15 20 >500 50 20 >500 B 70 20 >500 15 20 >500 20 70 >500 c 10 70 >500 10 20 >500 50 50 >500 D 15 50 >500 10 70 >500 15 50 >500
Sr, pet- A .07 .05 .3 .2 .15 .5 .05 .2 .2 B .03 .05 .2 .2 .5 .3 .5 .5 .5 c .05 .05 .1 .3 .1 .5 .3 .2 .3 D .02 .05 .1 .5 .3 .5 .15 .2 .3
Ti, pet- A .1 .07 • 7 .1 .15 .2 .05 .15 .5 B .05 .07 .5 .05 .2 .5 .OS .15 .3 c .05 .1 .5 .15 .15 .3 .07 .15 .7 D .OS .1 . 7 .1 .2 .5 .03 .2 .5
V------- A 50 20 1,000 50 20 700 30 20 1,000 B 20 20 1,000 70 70 1,000 20 50 >1 ,000 c 30 30 1,000 50 20 1,000 50 50 1,000 D 30 30 >1 ,000 20 50 > 1 ,000 20 50 >1 ,000
W------- A 1,000 1,000 1,000 B 1,000 200 1,000 c 1,000 1,000 <50 200 D 1,000 1,000 1,000
y ------- A 50 <10 100 <10 50 B 50 10 30 50 c 50 50 <10 50 D 50 10 100 <10 50
Zn, pet- A .3 .2 .2 .2 .3 .3 .1 .2 .2 B .2 .2 .2 .2 .3 .3 .1 .3 .2 c .2 .5 .2 .3 .3 .2 .1 .3 .3 D .2 .3 .07 .2 1 .3 .07 .3 .3
Zr------ A 10 10 200 20 30 100 10 20 200 B 10 20 150 10 50 100 10 30 100 c <10 20 lOCI 20 50 70 10 50 100 D 10 10 200 20 50 200 <10 30 200
Ash, pet dry wt.- A 4.0 2.0 :u 4.0 2.0 3.5 3.0 1.0 2.0
B 3.0 2.0 8.2 5.0 2.0 4.1 3.0 2.0 2.0 c 3.9 2 .0 5.0 2.0 3.4 2.0 .0 3.9 D 3.0 2.0 3.0 3.0 5.0 1.0 3.1
Results 13

Table 8. Element concentrations and percent ash of Group Ill trees grown in soil that represents low- to moderate- temperature deposits
[Concentrations expressed as parts per million in ash, except where percent is indicated. Leaders (-), element was not detected in the sample, or no data available on ash percentages]
Species of tree
Lodgepole pine Engelmann spruce Oougl as-fir Element, Repl i-or ash cate Leaves Stems Roots Leaves Stems Roots Leaves Stems Roots
Ag------ A 2 15 70 .5 .3 30 10 3 100 B .5 5 70 1 7 70 5 10 50 c 3 10 15 5 .5 5 10 5 20 0 5 7 15 2 2 50 5 2 100
As------ A B 500 500 c 0 500 200
Au------ A 7 30 15 B 30 10 c 0 10 100
B------- A 700 1,000 300 700 500 300 >1 ,000 500 300 B 700 500 500 1,000 500 500 >1 ,000 300 500 c >1 ,000 500 200 1,000 200 200 >1 ,000 1,000 500 0 1,000 700 200 1,000 300 500 >1 ,000 500 300
Ba------ A 200 700 3,000 3,000 3,000 1,500 1,000 3,000 2,000 B 200 700 2,000 2,000 3,000 5,000 2,000 1,500 2,000 c 300 700 700 2,000 1,000 1,000 700 3,000 2,000 0 200 1,000 300 2,000 3,000 3,000 1,000 2,000 3,000
Be------ A 2 3 300 B 2 3 2 c 1 1 2 0 < .5 1 2 5
B i ------ A 20 10 500 20 10 50 20 20 20 B <1 20 150 30 70 50 50 20 20 c 20 20 50 10 15 20 20 50 0 20 15 30 20 30 30 20 20 30
Cd------ A 20 500 20 20 20 300 100 100 100 B 300 200 200 100 50 20 100 200 c 50 500 2 1 50 300 300 0 20 50 1 10 10 100 20 50 100
Co------ A 10 20 50 <5 10 30 20 15 50 B 10 30 <5 10 30 10 10 50 c 10 20 30 20 15 30 50 0 10 50 30 10 20 20 20 50
Cr------ A 10 70 5 10 50 10 10 70 B 5 70 5 10 70 <5 <5 30 c 10 5 20 10 10 5 50 70 0 <5 20 10 5 70 5 10 70
Cu------ A 150 500 5,000 100 200 >5,000 150 500 >5,000 B 70 1,000 >5,000 100 200 >5,000 150 1,000 >5,000 c 150 150 2,000 100 100 1,000 100 500 5,000 0 150 500 1,000 100 200 >5,000 100 500 5,000
Fe, pet- A .3 1 3 1 1 5 .5 1 >5 B .3 1 5 1 1.5 5 .5 .3 5 c .5 .5 3 .5 .5 2 1 2 5 0 .2 3 2 .5 1 5 .5 .7 5
Ge------ A 70 100 70 B 50 >100 100 c 2 0 50 50 50
Hg------ A .12 .25 20 .30 .55 12 .40 .30 14 B .16 .25 16 .20 .14 14 .30 .25 13 c .20 .18 25 .10 .16 3.0 .25 .20 4.5 0 .07 .20 2.5 .10 .14 4.5 .16 .12 12
La------ A 20 20 100 20 20 50 50 30 100 B 20 70 20 20 150 20 50 50 c 20 20 150 20 50 20 50 100 0 20 20 50 20 20 100 20 30 50
14 Metal Uptake by Conifers

Table 8. Element concentrations and percent ash of Group Ill trees-Continued
Species of tree
Element, Lodgepole pine Engelmann spruce Douglas-fir
Repl i-or ash cate Leaves Stems Roots Leaves Stems Roots Leaves Stems Roots
Mg, pet- A 3 5 3 5 3 B 2 !i 3 5 5 5 c 5 L5 3 1 3 5 D 3 ll 3 5 3 5
Mo------ A 30 30 150 50 15 50 5 30 150 B <5 30 100 <5 50 100 20 5 50 c 20 30 70 10 30 10 10 100 D 10 20 20 20 10 50 10 150
Mn, pet- A 1 .5 .3 1 .5 .2 >1 1 .3 B .2 .3 .5 1 .3 .2 .7 .5 .5 c .7 .5 .15 .5 .3 .07 1 .7 .5 D 1 >1 .05 .5 .2 .2 >1 1 .5
Na, pet- A .5 .7 .5 .2 .5 .5 .5 1.5 1 B .15 1 1.5 .5 1 .7 .5 1 .5 c 1 1 .3 .3 .15 .15 .2 .5 1 D .7 5 .15 .3 1 .5 .2 1 1
Ni ------ A 30 30 70 20 30 50 30 20 70 B 15 30 50 20 30 100 20 20 300 c 30 20 70 20 15 50 20 50 70 D 20 50 31) 20 20 50 20 30 70
Pb------ A 300 3,000 5,000 200 >5,000 >5,000 500 3,000 >5,000 B 50 5,000 >5,000 300 1,500 >5,000 300 5,000 5,000 c 500 500 1,000 200 150 500 500 1,000 >5,000 D 500 700 700 300 1,500 >5,000 200 700 >5,000
Sb------ A 150 5,000 2,000 2,000 B 50 3,000 5,000 50 2,000 c 50 1,000 300 50 50 3,000 D 1,000 2,000 50 3,000
Sn------ A 5 50 10 10 15 10 20 7 B 20 20 10 10 15 20 10 15 c 7 10 10 10 20 10 D 10 20 5 10 15 10 7 10
Sr, pet- A .05 .1 .3 .3 .2 .1 .3 .2 .2 B .02 .1 .3 .2 .2 .5 .2 .2 .2 c .07 .2 .2 .2 .1 .1 .15 .2 .2 D .02 .07 .05 .2 .1 .3 .2 .3 .2
Ti, pet- A .1 .15 .7 .1 .2 .7 .1 .15 . 7 B .05 .2 .7 .15 .2 .7 .07 .07 .7 c .1 .2 1 .1 .15 .7 .1 .3 .7 D .1 .5 .5 .1 .15 1 .07 .1 .7
V------- A 30 20 1,000 50 50 700 100 50 1,000 B 10 50 >1,000 50 50 1,000 30 20 >1,000 c 30 50 > 1,000 20 10 500 50 50 1,000 D 20 150 1,000 20 50 >1,000 50 50 1,000
W------- A B c D
Y------- A 50 <10 <10 20 10 50 B 50 <10 50 50 c 70 20 20 30 D 10 20 <10 50 <10 100
Zn, pet- A 2 >2 >2 1.5 2 1 >2 >2 B .2 >2 >2 2 2 >2 .3 2 >2 c >2 >2 1 .5 .2 .3 1 2 >2 D 2 >2 .3 . 7 1 2 2 1.5 >2
Zr------ A 10 50 500 20 50 200 20 50 1,000 B 100 300 20 70 500 10 20 200 c 10 20 200 10 10 100 30 100 200 D 20 100 30 10 50 700 10 20 500
Ash, pet dry wt.- A 3.0 1.0 5.3 4.0 2.0 4.0 4.0 1.0 3.1
B 2.0 2.0 6.7 3.0 2.0 1.7 3.0 1.0 c 3.0 2 .0 3.6 4.0 2.0 2.8 4.0 1.0 2.1 D 2.0 2.0 6.8 4.0 3.0 4.6 4.0 1.0 4.1
Results 15

Table 9. Element concentrations and percent ash of Group IV trees grown in soil to which only gold leaf was added
[Concentrations expressed as parts per million in ash, except where percent is indicated. Leaders (-), element was not detected in the sample]
Species of tree
Lodgepole pine Engelmann spruce Douglas-fir Element, Repl i-or ash cate Leaves Stems Roots Leaves Stems Roots Leaves Stems Roots
Ag------ A 2 20 1 20 5 2 10 B 2 3 .5 20 2 .1 15 c .5 5 1 20 3 2 20 D 5 3 2 30 2 1.5 15
As------ A B c D
Au------ A 70 20 <2 70 B 30 20 50 c 15 70 200 D 3 20 50
8------- A 1,000 500 300 1,000 300 300 >1 ,000 500 300 B 1,000 500 200 1,000 300 500 >1 ,000 200 500 c 1,000 700 500 1,000 300 300 >1 ,000 500 500 D 1,000 500 200 1,000 300 300 >1 ,000 500 500
Ba------ A 200 300 1,000 3,000 3,000 2,000 3,000 3,000 2,000 8 100 500 300 3,000 1,000 3,000 500 1,000 2,000 c 300 500 1,000 3,000 2,000 3,000 1,500 5,000 2,000 D 200 300 300 3,000 5,000 3,000 2,000 3,000 2,000
Be------ A 300 5 B 2 5 c < .5 3 3 D 200 < .5 2
8i ------ A 30 10 50 50 15 20 50 20 20 B 20 20 5 20 10 20 30 20 c 20 15 50 50 15 20 50 20 30 D 50 20 5 70 10 20 50 20 20
Cd------ A 10 20 20 70 50 20 10 50 50 8 30 100 2 20 10 10 30 c 20 50 10 10 20 50 5 200 2 D 20 70 2 10 50 10 200 20
Co------ A 10 10 30 <5 20 30 10 10 50 B 10 20 20 50 10 50 c 10 10 30 <5 10 30 10 20 50 D <5 10 20 <5 10 50 10 20 30
Cr------ A 5 5 70 10 70 7 70 B <10 7 10 5 70 <5 70 c 10 10 70 10 70 5 10 70 D 5 <5 5 10 70 <5 10 50
Cu------ A 150 200 500 70 150 300 150 500 500 8 150 200 100 100 200 700 100 150 700 c 100 200 300 70 200 200 100 500 1,000 D 150 200 100 100 200 500 100 300 500
Fe, pc,:t- A .5 .5 5 ,7 1 <5 1 1 5 B .3 1 3 ,5 .3 5 .2 .5 5 c .5 1 3 1 .1 5 ,5 1 5 D .7 .5 3 .5 1 5 .5 1 5
Ge--~--- A lOO 100 100 a 20 1 0 c 70 100 100 D lO 70 00
Hg------ A .03 .Q4 .25 ,03 .03 .14 .03 .02 .18 8 .03 .02 .25 ,06 .04 .14 .04 .03 .16 c .04 .03 .us ,04 ,03 .16 .05 .04 .20 D .03 .03 .16 .04 ,02 .12 .04 .04 .14
La------ A 20 20 50 20 20 100 20 20 100 ~ 20 ~0 100 20 <20 100 <20 100 c 20 30 100 20 20 100 20 20 50 D 30 20 50 30 30 150 20 20 100
16 Metal Uptake by Conifers

Table 9. Element concentrations and percent ash of Group IV trees-Continued
Species of tree
Element, Lodgepole pine Engelmann spruce Douglas-fir
Repl i-or ash cate Leaves Stems Roots Leaves Stems Roots Leaves Stems Roots
Mg, pet- A 5 5 3 5 5 3 3 B 5 1 2 5 3 2 5 c 10 5 3 5 5 7 3 D 5 .7 3 5 3 3 3
Mo------ A 20 20 7'0 30 10 150 10 15 50 B 20 20 20 20 10 50 10 10 100 c 20 20 200 30 10 50 20 10 50 D 70 20 30 30 10 50 <5 10 100
Mn, pet- A .5 .2 .2 1 .5 .2 .7 .3 .1 B 1 .7 .07 1 .3 .2 .2 .2 .15 c 1 1 .15 .7 . 7 .2 .7 1 .5 D .7 .5 .05 1 1 >1 . 7 1 .3
Na, pet-- A .7 1.5 .5 .3 .5 .5 .5 • 7 .5 B .5 .5 • 2 .5 1 .5 .7 .3 .5 c .5 .7 .5 .5 1 .5 .5 .5 .5 D .5 • 7 .07 .5 .7 .5 .5 .5 .5
Ni------ A 20 20 so 30 50 50 20 20 50 B 50 50 30 20 20 70 10 15 70 c 20 20 70 20 20 50 20 30 50 D 20 20 30 20 20 70 20 30 50
Pb------ A 500 500 l!iO 200 700 50 300 700 70 B 500 700 20 200 700 100 500 70 50 c 500 500 !iO 300 1,000 200 200 1,000 100 D 500 500 10 500 700 100 300 1,000 70
Sb------ A <!iO B c D
Sn------ A 10 10 15 5 5 5 10 5 B 5 5 10 5 5 7 c 5 10 10 15 10 150 10 5 D 10 10 10 5 5 5 10 10
Sr, pet- A .03 .05 .2 .2 .15 .3 .5 .3 .2 B .02 .07 .1 .3 .1 .5 .07 .15 .3 c .03 .07 .5 .2 .15 .3 .3 .5 .3 D .02 .05 .07 .3 .2 .3 .3 .5 .2
Ti, pet- A .05 .1 .5 .1 .15 ,7 .1 .1 .7 B .03 .1 1 .07 .07 • 7 .05 .1 .3 c .1 .15 .7 .1 .2 .7 .1 .2 .3 0 .1 .07 .7 .1 .15 ,5 .05 .2 .5
V------- A 20 20 1,000 30 50 1,000 20 50 1,000 B 20 20 1,000 20 20 >1,000 <10 20 1,000 c 20 50 >1 ,000 50 50 1,000 20 50 500 D 30 30 700 30 50 1,000 20 50 1,000
W------- A B c 0
y ------- A <10 50 <10 50 50 B 30 70 50 c <10 50 <10 <10 50 <10 !50 D <10 30 <10 50 <lO so
Zn, pet- A .2 .3 .2 .5 ,5 .2 ,3 1 .3 B .2 .5 .07 .3 .5 .3 .15 .07 .3 c .3 .2 .1 .2 .5 .3 .2 .7 .3 D .2 .3 .07 .3 1 .2 .07 ,3 .2
Zr------ A 10 20 100 20 20 300 20 30 300 B 10 20 100 20 10 500 10 20 300 c 10 20 300 10 50 200 20 50 150 0 10 10 100 20 20 500 10 50 200
Ash, pet dry wt.- A 2.0 1.0 4.7 5,0 2.0 6.4 3.0 2.0 4.9
B 2.0 2.0 5.5 4.0 2.0 5.4 3.0 1.0 4.1 c 2.0 1.0 5.1 3.0 3.0 4.0 4.0 2 .Q 4.0 D 3.0 1.0 6.0 4.0 3.0 2.1 3.0 l,O 3.8
Results 17

Arsenic
Arsenic was added as arsenopyrite to Group I soils. No arsenic was found in the natural potting soil (table 3), in soil removed from pots of the control group of trees (table 3), or in tissues of the seedling trees as received from the nursery and the control group of trees (tables 4 and 5).
Analyses of Group I (table 6) showed arsenic in leaves of only one sample of pine (1 ,000 ppm) and in stems of one sample of spruce ( <200 ppm), but in roots of all samples of all species (1,000-->5,000 ppm). All samples of douglas-fir in Group I contained 5,000 ppm or greater concentrations of arsenic. These results demonstrate the remarkable ability of douglas-fir to accumulate arsenic, as was pointed out by Warren and others (1968), and indicate the practical use of douglas-frr as a biogeochemical indicator for arsenic, a pathfinder element in prospecting for gold. Roots, but not stems or leaves, of engelmann spruce and lodgepole pine possibly could be used as arsenic indicators. Soil contamination of root samples may not be an important factor in the high arsenic levels in roots of these conifers (1 ,000-->5,000 ppm), as both the leaves and stems of douglas-fir contained as much arsenic as was found in the root samples or more.
Bismuth
Bismuth was added as bismuthite to Group II soils. This element was not found in the natural potting soil or in the soil removed from control pots (table 2). Bismuth concentrations of > 500 ppm were found in leaves of seedling trees as received from the nursery (table 4), but much less was found in their stems and roots (<50 to 100 ppm). In trees of the control group (table 5), bismuth generally was more concentrated in leaves and stems than in roots. The results for bismuth show abnormally high values for nearly all samples of all organs for all groups, including the control group. Bismuth values for leaves and stems of these species of conifer trees rarely exceed 1 ppm (G. C. Curtin and H. D. King, unpub. data). A possible explanation for the high values of bismuth in most samples is that the bismuth mineral added to Group II soil was solubilized and dispersed into the soils of other groups in the growing plot.
Analyses of Group II (table 7) showed high levels of bismuth (>500 ppm) in samples of all roots. Stem samples of these trees contained more bismuth (200->500 ppm) than was found in corresponding leaf samples (7~ 200 ppm), and the bismuth levels in both generally were higher than in leaves and stems from soils having no added bismuth (<1-200 ppm).
18 Metal Uptake by Conifers
Copper
Copper was added as tetrahedrite to Group I soils, and as tetrahedrite and azurite to Group III soils. Copper was found in the natural potting soil and soils of the control plants !n amounts ranging from 50 to 70 ppm (table 3). Copper in the seedling trees ranged from 70 to 200 ppm (table 4), the lower concentrations being in the roots. Trees of the control group (table 5) generally contained copper concentrations in leaves, stems, and roots that were somewhat higher than those found in the seedling trees.
Analyses of Groups I and III (tables 6 and 8, respectively) did not show an increase in copper levels in stems and leaves above concentrations found in the control trees (table 5), but much higher levels accumulated in the roots (5,000 ppm and greater). This high concentration of copper in the root samples probably represents the effects of soil contamination.
Gold
Gold was added as gold leaf to soils of Groups I, III, and IV. Gold was not detected in the natural potting soil or in the control group soils (table 3). It also was not detected in the seedling trees (table 4) or in the control group of trees (table 5).
Analyses of Group I (table 6) showed gold in one stem sample each of pine, spruce, and douglas-fir (2, 3, and 15 ppm, respectively); in one leaf sample of spruce (5 ppm); and in all but one root sample (5-200 ppm). Gold was not found in leaves, stems, or roots of the Group II trees (table 7) to which no gold was added.
Analyses of Group III trees (table 8) showed gold in only one sample of spruce stems (10 ppm) and two samples of douglas-fir stems (2 and 5 ppm), but in roots of six samples (7-100 ppm). In the analyses of Group IV trees (table 9), only five samples of stems contained gold (<2-15 ppm), whereas all but one root sample contained gold (2-200 ppm).
In a study of gold in 2-year-old stems of pine (Pinus radiata Don.) that grew around old mine workings in Tasmania, Australia, Baker (1981, p. 8) reported gold values as much as 4.8 ppm, whereas trees outside the area of mine workings averaged 0.05 ppm. Baker's values for gold in trees at the mine workings correspond to our three values of 2, 3, and 5 ppm for gold in pine stems from soils to which gold leaf had been added.
In summary, these experiments demonstrate that metallic gold can be solubilized in favorable soil environments and can be translocated from roots to stems. The mechanisms regulating the absorption of gold by the conifer species are still imperfectly understood, but are discussed below.

The soil of Groups I, III, and IV was carefully broken up and searched for remnants of added gold leaf. Several pieces of gold leaf were recovered; some had edges that appeared to have been eroded during the 7 years that the trees grew in the pots. Analyses of stems and roots of some trees that grew in this soil (tables 6, 8, and 9) clearly demonstrate that gold was absorbed by the tree roots. Gold must be in a soluble form to enter plant tissues-particulate gold, even as a colloidal suspension, is not taken up by plants (Shacklette and others, 1970). The possible methods by which gold enters biogeochemical cycling were discussed by Lakin and others (1974), and experiments on the absorption of gold by plants were described by Shacklette and others (1970). The active role of humic acids in dissolving, complexing, and transporting gold was discussed by Ong and Swanson (1969), Curtin and others (1970), and Baker (1978). The utilization of humus-rich forest soil in geochemic:al exploration for gold was described by Curtin and others (1968), and a review of the absorption of gold by plants was given by Girling and Peterson (1980). Kelly and Cloke (1961) proposed methods for the solubilization of gold in near-surface environments that were independent of biologic processes.
One method of gold solubilization that is likely to occur in the rooting zone of soils is the production by various plants and other organisms of cyanoglycosides and of enzymes that hydrolize the glycosides to produce hydrogen cyanide. Although more than a thousand cyanogenic plants are known, none grew in or near the pots of conifers used in this study. Some soil fungi are cyanogenic, but mycorrhizae are not known to have this property, although Shacklette (1974, p. 41) reported some evidence of cyanogenic ability of mycorrhizae associated with an herbaceous plant species. The solubilization of gold in the present experiments may have been caused by cyanogenic fungi or other organisms in the soil, by the action of humic acids in the soil solution, or by other processes that are unknown.
Lead
Lead was added as cerussite and anglesite to Group lll soils. The tetrahedrite, added to Groups I and II, may contain lead. A lead concentration of 70 ppm was found in natural potting soil and in soil removed from pots of the control group at the end of the study (table 3). Lead concentration in the seedling trees (table 4) was lowest in root samples, ranging from 20 to 150 ppm; lead concentrations in leaves and stems ranged from 100 to 500 ppm. Lead concentrations in trees of the control group (table 5) were somewhat higher than those in seedling trees.
The lead content of Group Ill trees (table 8) was generally greater in stems, and notably greater in roots,
than in the same plant organs from the control group (table 5). The increased lead concentration in roots may have been caused by soil contamination of the root samples. The lead content of roots from Group I trees (table 6) and from Group II trees (table 7) to which no lead was added, except possibly in tetrahedrite as noted above, was much higher than in roots from the control group.
Mercury
Mercury was added as metallic mercury to Group III soils. Neither soils nor seedling trees were analyzed for this element. Mercury was detected in all parts of all other trees sampled in this study. The mercury in leaves and stems of the control group trees (table 5) had ranges similar to those of all experimental groups to which no mercury had been added. But mercury levels in the stems and leaves of trees that grew in soil to which mercury had been added were as much as ten-fold higher than those of the control group. Mercury values in roots were an order of magnitude higher than leaf and stem values in all groups to which no mercury had been added. Levels of mercury in roots of the Group III trees were high (as much as 25 ppm); these high concentrations may be partly the result of soil contamination.
Metallic mercury, being insoluble in water, cannot enter tree roots; therefore, this element must have been converted to a soluble compound, most probably by soil microorganisms.
Molybdenum
Molybdenum was added as molybdenite to Group II soils. It was not found in the natural potting soil, or in soil removed from pots of the control group (table 3). Molybdenum was detected in all samples of seedling trees and in all tree samples of the control group in concentrations ranging from 5 to 100 ppm (table 4).
Analyses of Group II trees (table 7) showed more molybdenum in all organs than was found in corresponding organs of the control group of trees. Root-sample values were all > 500 ppm molybdenum and probably represent some contamination. Leaf samples generally had higher values than did stem samples. Trees in the other experimental groups (1, III, and IV) had molybdenum values similar to those of trees in the control group.
Silver
Silver was added as tetrahedrite to Group I soils and as argentite and tetrahedrite to Group Ill soils. Silver was not detected in the natural potting soil or in soil removed from pots of the control group (table 3). All sam-
Results 19
pies of the seedling trees (table 4) contained silver (1-5 ppm), with most of the highest concentrations in the leaves. All trees of the control group (table 5) had highest values (10-50 ppm) in the roots.
Analyses of Groups I and ill (tables 6 and 8, respectively) showed silver in concentrations ranging from 0.3 to 200 ppm, with highest values (15-200 ppm) generally in the roots. Most root samples were probably somewhat contaminated, as reflected by the difference between silver values for roots of trees in the control group (table 5) and those from soil having added silver. The leaves of one spruce tree, however, contained as much silver (5 ppm) as was found in roots of the same tree (table 8), which indicated that the root sample had not been contaminated by soil. Judging from analyses of root samples of the control group of trees, roots of these conifers are expected to have higher silver values than are leaves and stems.
Other experimental groups to which various minerals, but no silver, had been added showed different trends in silver concentrations in the trees. Silver values of Group IV trees (table 9) were similar to those of trees in the control group. Silver values for stems and leaves of Group II trees (table 7) were generally lower than those of Group III trees (table 8), but root values of Group II trees tended to be higher.
Tin
Tin was added as cassiterite to Group II soils. None was found in the natural potting soil or in soils removed from pots of the control group of trees (table 3). Tin was found in all samples of seedling trees (table 4) in concentrations ranging from 5 to 100 ppm, and in most tree samples of the control group (table 5) in concentrations ranging from 5 to 30 ppm.
Tin concentrations in Group II trees (table 7) tended to be somewhat higher in leaves and stems than in the same organs of trees in the control group; however, the roots contained so much more tin (>500 ppm) than was found in roots of the control group (5-30 ppm) that soil contamination of the root samples seems a certainty.
Tin in trees of Groups I, III, and IV (tables 6, 8, and 9, respectively) was found in concentrations similar to those of the control group of trees.
Tungsten
Tungsten was added as scheelite to soils of Groups I and II. No tungsten was found in the natural potting soil or in soils removed from pots of the control group of trees (table 3). Tree seedlings (table 4), trees in the control group (table 5), and trees in Groups III and IV (tables 8 and 9, respectively) likewise contained no detec-
20 Metal Uptake by Conifers
tible tungsten, with the exception of one sample of douglas-fir stem in the control group (100 ppm).
Group II trees (table 7) contained tungsten only in roots (200-1 ,000 ppm), and tungsten was detected below measurable concentrations (<50 ppm) in one sample of douglas-fir stems. Group I trees (table 5) contained tungsten in most root samples (50-1,000 ppm) and in stems of four tree samples (<50-50 ppm). Tungsten was not found in any leaf sample of this study.
The tungsten found in root samples may have resulted largely from soil contamination of the samples. The tungsten concentrations found in the few stem samples are noteworthy in that this element is seldom reported in analyses of any plant material.
Zinc
Zinc was added as hydrozincite and as tetrahedrite to Group III soils and as tetrahedrite to Group I soils. Zinc was not found in the natural potting soil or in soils removed from pots of the control-group trees (table 3). This element was found in all samples of seedling trees, ranging from 0.2 to 0.5 percent (table 4), and in trees of the control group, ranging from 0.1 to 2 percent (table 5).
Group ill trees (table 8) contained zinc concentrations of 0.2->2 percent, with values for roots generally at or near the upper limit of this range. Soil contamination probably did not contribute greatly to these root values.
Zinc concentrations in trees of Groups I, II, and IV (tables 6, 7, and 9, respectively) were similar to those found in trees of the control group (table 5).
Effects of Species Differences in Metal Uptake by Coniferous Trees
The small number of replicate sar.:.tples used in this study was insufficient to evaluate metal uptake by different species with a high degree of confidence. Some apparent species differences, however, are so consistent in the experiments that they are worth mentioning.
The ability of douglas-fir stems and leaves to concentrate arsenic has been discussed. The contrasts in arsenic uptake between this species and lodgepole pine and engelmann spruce are striking, considering that the three species are in the same family (Pinaceae) and share many physiological properties. It is also noteworthy that in Groups II and III, to which various metals, but no arsenic, were added to the soils (table 7 and 8, respectively), only douglas-fir accumulated arsenic to measurable levels in some root and stem samples. Douglas-fir would be classified in the Kovalevskii system ( 1979) as a "nonbarrier species" to arsenic.

The apparent inability of lodgepole pine to accumulate high concentrations of barium is suggested by results of this study. Although barium was not added to soils of any experimental group, it was present in the natural potting soil and in soil removed from pots of the control group in concentrations ranging from 500 to 700 ppm (table 3). Lodgepole pine consistently contained low concentrations of this element, compared to higher concentrations found in engelmann spruce and douglas-fir. Using the terminology of Kovalevskii ( 1979), lodgepole pine would be classified as a "high barrier species" in respect to barium.
Differences in Element Concentrations among Leaves, Stems, and Roots
The three conifer species tend to concentrate bismuth in decreasing amounts in leaves, stems, and roots (tables 4, 5, 6, and 9) if the soils contain low concentrations of bismuth. If the trees are grown in soil with added bismuth, the tendency is reversed (Group II, table 7). If grown in soils with various metals, but no bismuth added (Group III, table 8), the trees did not show a clear trend to concentrate bismuth in any organs.
Lead tends to be more concentrated in stems than in leaves of trees whether lead was added or not. Lead in the root samples was greatly increased in the trees growing on soils to which lead was added (Group Ill), but the increase may have been caused by soil contamination.
Zirconium commonly was more concentrated in stems than in leaves in the control group of trees as well as in all experimental groups. Many root samples had concentrations of this element that were as much as or greater than the concentrations found in the natural potting soils (table 3).
Differences in Element Uptake by 7-year-old Trees versus Seedlings
Element contents of the seedling trees as received from the nursery (table 4) were compared with those of the control group of trees (table 5) and the experimental groups (tables 6-9), which had grown for 7 years.
Antimony was found in leaves of all seedling trees (50---100 ppm), but not in most leaves or other organs of older trees. Antimony was found in leaves of only two trees grown in soils to which antimony had been added (Group III, table 8).
Bismuth concentrations were much higher in seedling leaves than in the 7-year-old trees of all groups, including those that grew in soils to which bismuth had been added (Group II, table 7).
The silver values in leaves of lodgepole pine and engelmann spruce seedling trees were higher than those in the stems, whereas in the 7-year-old trees of the control group and in most samples of the experimental groups the stems contained more silver than the leaves. Douglasfir contained more silver in leaves than in stems of most samples, regardless of the age of the trees.
Tin values were much higher (50---100 ppm) in samples of seedling tree leaves than in samples of all other leaves that were analyzed, except some leaf samples from trees (Group II, table 7) growing in soil to which tin had been added (50---70 ppm).
The zirconium levels in seedling tree roots were much higher ( 1 ,000 ppm) than in all other roots analyzed (20---500 ppm), except in two samples of roots (1 ,000 ppm each) in groups to which various elements (but no zirconium) had been added to the soil (Groups I and III, tables 6 and 8, respectively).
The causes of the higher concentrations of the above elements in certain organs of seedling trees are not known. It is unlikely that these elements occurred in appreciable quantities in insecticides, fungicides, or fertilizers that may have been used at the tree nursery, nor was contamination of the seedling trees with this group of elements probable in ordinary growing and other cultural practices.
CONCLUSIONS
Seedling trees of ponderosa pine, engelmann spruce, and douglas-fir grew normally in soil having anomalous concentrations of metals that are characteristic of four types of mineral deposits. The general response of the trees was an increase in the metallic elements in leaves and stems, and in roots of some samples, as compared to control groups of trees grown in soils with no added metals. These results demonstrate that unweathered minerals added to soils released their metals in a soluble form available to the trees within a 7 -year period, under normal weathering conditions of soil materials in the Central Rocky Mountain region of the United States.
In general, no great differences in uptake of metals were found among the three species of trees. Douglas-fir, however, showed a remarkable ability to concentrate arsenic in leaves and stems, and lodgepole pine was found to be greatly limited in the absorption of barium. Differences among the concentrations of metals in leaves compared to stems were indicated by higher barium and bismuth values in leaves, but differences in other element values were erratic. Although samples of roots commonly had high concentrations of most metals, the contamination of the root samples by ore minerals that were added to the soil obscured any evidence that the high values found were entirely of elements within the root tissues.
Conclusions 21

Higher concentrations of antimony, bismuth, silver, tin, and zirconium were found in the seedlings than in the 7-year-old trees. The reasons for these differences are not known.
Mercury in leaves and stems of trees grown in soil containing mercury (Group Ill) was as much as 10 times higher than in those grown in soil containing no mercury. The mercury level of the roots was increased a thousand fold, but a greater part of this increase may have been caused by contamination of the samples. The mercury most likely was converted to an organic compound by soil organisms before it was taken up by the roots.
Metallic gold added to the soil resulted in an increase of gold in only some organs of a few tree samples. No gold was detected in the seedlings, the control group, or in Group II trees.
The role of mycorrhizae in metal uptake may explain the survival of the trees that grew in above-normal concentrations of metals, and the high concentrations of these metals found in roots of these plants. Thus, the presence or absence of effective mycorrhizae may be one of perhaps many factors that determine whether a plant is a barrier or a nonbarrier species for particular elements in the substrate.
The results of this experiment may have a variety of applications in biogeochemical exploration for mineral deposits. The results provide some guidelines for interpreting metal concentrations that might be found in the various organs of similar species of conifer trees growing in soils over concealed or unknown mineral deposits of the types simulated in this experiment. The results also show that young conifer trees are capable of accumulating highly anomalous amounts of metals within short periods of time and may be useful as a sample medium in biogeochemical investigations.
REFERENCES CITED
Andrews-Jones, D. A., 1968, The application of geochemical techniques to mineral exploration: Mineral Industries Bulletin, v. 11, no. 6, p. 1-31.
Baker, W. E., 1978, The role of humic acid in the transport of gold: Geochirnica et Cosmochimica Acta, v. 42, p. 645-649.
---1981, A biogeochemical approach to gold prospecting in N.E. Tasmania, Australia, in Precious Metals in the Northern Cordillera, Symposium, Vancouver, 1981, Programme and Abstract: Vancouver, Century Press Ltd., p. 7-9.
Bold, H. C., 1967, Morphology of plants (3rd ed.): New York, Harper & Row, 668 p.
Brooks, R. R., 1972, Geobotany and biogeochemistry in mineral exploration: New York, Harper & Row, 290 p.
Curry, K. J., Cooley, E. F., and Dietrich, J. A., 1975, An automatic filter positioner device for emission spectroscopy: Applied Spectroscopy, v. 29, no. 3, p. 274-275.
22 Metal Uptake by Conifers
Curtin, G. C., Lakin, H. W., and Hubert, A. E., 1970, The mobility of gold in mull (forest humus layer) in Geological Survey Research 1970: U.S. Geological Survey Professional Paper 700-C, p. C127-C129.
Curtin, G. C., Lakin, H. W., Neuerburg, G. J., and Hubert, A. E., 1%8, Utilization of humus-rich forest soil (mull) in geochemical exploration for gold: U.S. Geological Survey Circular 562, 11 p.
Erickson, R. L., Masursky, Harold, Marranzino, A. P., Oda, Uteana, and Janes, W. W., 1964, Geochemical anomalies in the lower plate of the Roberts thrust, near Cortez, Nevada, in Geological Survey Research 1964: U.S. Geological Survey Professional Paper 501-B, p. B92-B94.
Erickson, R. L., Van Sickle, G. H., Nakagawa, H. M., McCarthy, J. H., Jr., and Leong, K. W., 1966, Gold geochemical anomaly in the Cortez district, Nevada: U.S. Geological Survey Circular 534, 9 p.
Powells, H. A., 1965, Silvics of forest trees of the United States: Agriculture Handbook No. 271, Forest Service, U.S. Department of Agriculture, 762 p.
Girling, C. A., and Peterson, P. J., 1980, Gold in plants: Gold Bulletin, v. 13, p. 151-157.
Grimes, D. J. , and Marranzino, A. P. , 1968, Direct -currect arc and alternating-current spark emission spectrographic field methods for the semiquantitative analysis of geologic materials: U.S. Geological Survey Circular 591, 6 p.
Harley, J. L., and Smith, S. E., 1983, Mycorrhizal symbiosis: New York, Academic Press Ltd., 483 p.
Harris, Michael, and Radtke, A. S., 1976, Statistical study of selected trace elements with reference to geology and genesis of the Carlin gold deposit, Nevada: U.S. Geological Survey Professional Paper 960, 21 p.
Hatch, W. R., and Ott, W. L., 1968, Determination of submicrogram quantities of mercury by atomic absorption spectrophotometry: Analytical Chemistry, v. 40, no. 14, p. 2085-2086.
Kelly, W. C., and Cloke, P. L., 1961, The solubility of gold in near-surface environments: Michigan Academy of Science, Arts, and Letters Papers, v. XLIV, p. 19-30.
Kovalevskii, A. L., 1979, Biogeochemical exploration for mineral deposits: New Delhi, Amerind Publishing Co. Pvt. Ltd., 136 p.
Lakin, H. W., Curtin, G. C., and Hubert, A. E., 1974, Geochemistry of gold in the weathering cycle: U.S. Geological Survey Bulletin 1330, 80 p.
Mosier, E. L., 1972, A method for semiquantitative spectrographic analysis of plant ash for use in biogeochemical and environmental studies: Applied Spectroscopy, v. 26, no. 6, p. 636-641.
Ong, H. T., and Swanson, V. E., 1969, Natural organic acids in the transportation, deposition and concentration of gold: Colorado School of Mines Quarterly, v. 64, p. 395-425.
Pauli, F. W., 1968, Some recent developments in biogeochemical research: The Geological Association of Canada Proceedings, v. 19, p. 45-49.
Radtke, A. S., Heropoulos, C., Fabbi, B. P., Scheiner, B. J., and Essington, G. M., 1972, Data on major and minor elements in host rocks and ores, Carlin gold deposit, Nevada: Economic Geology, v. 67, no. 7. p. 975-978.
Read, D. J., 1983, The biology of mycorrhiza in the Ericales: NACOM, Proceedings, 5th: Canadian Journal of Botany, v. 61, no. 3, p. 985-1004.
Shacklette, H. T., 1974, Tests for cyanide in some native and naturalized plants of the United States, in Lakin, H. W., and others, Geochemistry of gold in the weathering cycle: U.S. Geological Survey Bulletin 1330, p. 38-47.
Shacklette, H. T., Lakin, H. W., Hubert, A. E., and Curtin, G. C., 1970, Absorption of gold by plants: U.S. Geological Survey Bulletin 1314--B, 23 p.
Soil Survey Staff, 1975, Soil taxonomy: U.S. Department of Agriculture, Agriculture Handbook No. 436, 754 p.
1:( U.S. GOVERNMENT PRINTING OFFICE: 1985---576-049/20,010 REGION NO.8
Warren, H. V., Delavault, R. E., and Barakso, J. J., 1968, The arsenic content of Douglas ftr as a guide to some gold, silver and base metal deposits: The Canadian Mining and Metallurgical (CIM) Bulletin for July 1968, p. 860-866.
Warren, H. V., and Hajek, J. H., 1973, An attempt to discover a "Carlin-Cortez" type of gold deposit in British Columbia: Western Miner, October 1973, p. 124--134.
Wells, J. D., Stoiser, L. R., and Elliott, J. E., 1969, Geology and geochemistry of the Cortez gold deposit, Nevada: Economic Geology, v. 64, no. 5, p. 526-537.
References Cited 23


Related Documents