G T T C C C C G G A C C T A C A A T T C C G G G G G T T G G G G G G G A A G G G G G G G G G A A G T T T T T C C C C G G G G T G G G G G G A A T T T T C C G G G G T G G G G G G A A T T T T C T C A G G G G A A T T C A G G G G A A T A T A T T A T A T T A T A T T A T A T T A A A A T C C C C C C C C C C C C C C G FACULTAT DE CIÈNCIES BIOLÒGIQUES DIRECTORS: Prof. Andrés Moya Dr. Giuseppe D'Auria Valencia, 2016 Metagenomics of the Human Gut Microbiome Directed by the Flow Cytometry PhD thesis of Mária Džunková

Welcome message from author
This document is posted to help you gain knowledge. Please leave a comment to let me know what you think about it! Share it to your friends and learn new things together.
Transcript
G
T
T
C
C
CC
G
GAC
C
T
A
C AA
T
TC
C
G GG
G
GT
T
GG
G
G
G
GG
A
A
G
G
G
G
G
GG
G
G
A
A
G
T
TTT
TC
CC
C
G GG
GT
G
G
GG
G
G
A
A
TTT
TC C
G GG
GT
G
G
GG
G
G
A
A
TTT
TC
T
C A
G
G
GG A
AT
T
C A
G
G
GG A
AT A
T
A
T
T
AT
ATT
A
T
ATT
A
T
ATT
A
A
A
A
TC
C
C
C
C
C
C
C
C
C
C
C
C
C
G
FACULTAT DE CIÈNCIES BIOLÒGIQUES
DIRECTORS:Prof. Andrés MoyaDr. Giuseppe D'Auria
Valencia, 2016
Metagenomics of theHuman Gut MicrobiomeDirected by the Flow Cytometry PhD thesis ofMária Džunková


UNIVERSITY OF VALENCIA
Faculty of Biological Sciences
Valencian Region Foundation for the Promotion of Health and Biomedical
Research (FISABIO) - Public Health
METAGENOMICSOF THE HUMAN GUT MICROBIOME
DIRECTED BY THE FLOW CYTOMETRY
PhD thesis of
Mária Džunková
Directors
Prof. Andrés Moya
Dr. Giuseppe D’Auria
Valencia, Spain, 2016

Certificado
Prof. Andrés Moya, Catedrático del Departamento de Genética de la Universitat de València, y Dr.
Giuseppe D’Auria, investigador del Área de Genómica y Salud de la Fundación para el Fomento de la
Investigación Sanitaria y Biomédica (FISABIO) de la Comunidad Valenciana, certifican que la memoria
titulada "Metegenomics of the human gut microbiome directed by the flow cytometry" ha sido realizada bajo
su dirección por Mária Džunková para optar al grado de Doctor Internacional por la Universidad de Valencia.
Y para que así conste, firman el presente certificado:
en Valencia, 4 de Marzo, 2016.
Prof. Andrés Moya Dr. Giuseppe D’Auria
PhD student signature: Mária Džunková

AcknowledgementI would like to express my heart-whole gratitude to my supervisors Prof. Andrés Moya and Dr. Giuseppe
D’Auria for guiding me during 5.5 years of my Ph.D. thesis. Dr. D’Auria was an excellent tutor and it is
difficult to enumerate all the things I have learned from him. Especially, I am very grateful that he has taught
me to enjoy working on challenging and apparently difficult projects. Prof. Moya was an excellent group
leader role model for me. I was very lucky that I got the opportunity to do my PhD with them.
Moreover, I would like to thank the following people for:
• guidance during my temporary research stay on Harvard: Prof. Ciaran Kelly and Dr. Xianhua Chen
from Beth Israel Deaconess Medical Center (BIDMC) of Harvard Medical School, Boston, USA
• assistance with my flow cytometry experiments: Ana Flores from the Faculty of Pharmacy, University of
Valencia (UV) and John Tigges and Vasilis Toxavidis from BIDMC
• 454 and Illumina sequencing: Dr. Núria Jiménez and Llúcia Martínez from FISABIO - Public Health,
Valencia
• assistance with Sanger sequencing: Dr. Manuela Torres from FISABIO; Central Service for Experimental
Research team of UV and the DNA Sequencing Core team of Brigham and Women’s Hospital of Harvard
Medical School, Boston, USA
• assistance with programming scripts: Alejandro Artacho, Jorge Francisco Vázquez-Castellanos and
Rodrigo García from FISABIO
• collection of fecal samples from patients: Kelsey Shields and Joshua Hansen from BIDMC
• assistance with preparation of culture media: Concepción Hueso from FISABIO
• providing bacterial isolates: Dr. Carles Úbeda, Ana Djukovic and Sandrine Isaac from FISABIO
• teaching me working with Digital Microdissector: Dr. Victoria Petkova from BIDMC
• collaboration on the article associated with the chapter about adaptation of sequencing protocols for
sequencing of limited DNA samples: Dr. Marc Garcia-Garcerà from Institut Pasteur, Paris, France and
Prof. Francesc Calafell from Institute of Evolution Biology, University Pompeu Fabra, Barcelona, Spain
• collaboration of the article associated with the chapter about selective inhibitory effect of 8HQ: Dr. Jitka
Nováková, Dr. Šárka Musilová, Dr. Eva Vlková and Prof. Ladislav Kokoška from the Czech University
of Life Sciences in Prague
• collaboration on the articles associated with the chapter about the active and IgA-coated cells sorting:
Dr. Francecs Peris-Bondia from Université Libre de Bruxelles, Brussels, Belgium, Prof. Amparo Latorre,
Dr. Alex Mira and Áurea Simón-Soro from FISABIO - Public Health, Valencia; Maria Carmen Collado
from The Institute of Agrochemistry and Food Technology, Valencia and Dr. Shauna Culshaw from the
School of Dentistry in Glasgow, United Kingdom
• emotional support: Erick Steve Giron Peña

This thesis has been written in the LaTeX environment. It contains hypertext links (marked by light blue
color) connecting to the referred sections, figures, tables, acronyms glossary and bibliography within this
thesis. The hypertext links are also connected to the on-line sources: the chemical product reference numbers
are connected with the websites selling those products and the bibliography references are connected to the
websites containing the cited articles.
The thesis contains appendix with detailed laboratory protocols and examples of programming scripts
allowing the readers to follow the performed work.

Contents
1 General Introduction 10
1.1 The human gut . . . . . . . . . . . . . . . . . . . . . . . . . . . . . . . . . . . . . . . . . . . . . . . 12
1.1.1 Anatomy of the human intestinal tract . . . . . . . . . . . . . . . . . . . . . . . . . . . . . 12
1.1.2 Gut microbiome . . . . . . . . . . . . . . . . . . . . . . . . . . . . . . . . . . . . . . . . . . 12
1.2 Identification of gut bacteria and viruses . . . . . . . . . . . . . . . . . . . . . . . . . . . . . . . . 15
1.2.1 Sequencing approaches for gut microbiome studies . . . . . . . . . . . . . . . . . . . . . . 15
1.2.2 Microbial taxonomic distribution of the gut . . . . . . . . . . . . . . . . . . . . . . . . . . 19
1.2.3 Taxonomic composition of the gut viruses . . . . . . . . . . . . . . . . . . . . . . . . . . . 23
1.3 Fluorescent activated cell sorting (FACS) of the gut microbiome . . . . . . . . . . . . . . . . . . . 26
1.3.1 Method description . . . . . . . . . . . . . . . . . . . . . . . . . . . . . . . . . . . . . . . . 26
1.3.2 Applications of flow cytometry in microbiology . . . . . . . . . . . . . . . . . . . . . . . . 29
2 Objectives of the thesis 35
3 Active and IgA-coated cells sorting in Clostridium difficile infection 39
3.1 Introduction . . . . . . . . . . . . . . . . . . . . . . . . . . . . . . . . . . . . . . . . . . . . . . . . 41
3.1.1 C. difficile infection . . . . . . . . . . . . . . . . . . . . . . . . . . . . . . . . . . . . . . . . 41
3.1.2 Coating of gut bacteria by secretory immunoglobulin A . . . . . . . . . . . . . . . . . . . 42
3.1.3 Activity of bacteria in the human gut . . . . . . . . . . . . . . . . . . . . . . . . . . . . . . 43
3.2 Objectives . . . . . . . . . . . . . . . . . . . . . . . . . . . . . . . . . . . . . . . . . . . . . . . . . 45
3.3 Methods . . . . . . . . . . . . . . . . . . . . . . . . . . . . . . . . . . . . . . . . . . . . . . . . . . 46
3.3.1 Samples preparation . . . . . . . . . . . . . . . . . . . . . . . . . . . . . . . . . . . . . . . 46
3.3.2 Sequencing and data analysis . . . . . . . . . . . . . . . . . . . . . . . . . . . . . . . . . . 48
3.4 Results . . . . . . . . . . . . . . . . . . . . . . . . . . . . . . . . . . . . . . . . . . . . . . . . . . . 51
3.4.1 Load of C. difficile specific 16S rDNA, toxin A and toxin B genes detected by qPCR . . . 51
3.4.2 Proportions of active and IgA coated bacteria . . . . . . . . . . . . . . . . . . . . . . . . . 51
3.4.3 The overall bacterial composition of the active fraction of the bacterial cell culture . . . 52
3.4.4 Bacterial composition of the four separated fractions . . . . . . . . . . . . . . . . . . . . . 53
3.5 Discussion . . . . . . . . . . . . . . . . . . . . . . . . . . . . . . . . . . . . . . . . . . . . . . . . . 57
3.6 Conclusions . . . . . . . . . . . . . . . . . . . . . . . . . . . . . . . . . . . . . . . . . . . . . . . . 61
4 Selective inhibitory effect of 8-hydroxyquinoline on C. difficile 63
4.1 Introduction . . . . . . . . . . . . . . . . . . . . . . . . . . . . . . . . . . . . . . . . . . . . . . . . 65
4.1.1 Effects of antibiotics on bacterial growth . . . . . . . . . . . . . . . . . . . . . . . . . . . . 65
4.1.2 Selective antibacterial effect of 8-hydroxyquinoline . . . . . . . . . . . . . . . . . . . . . . 67
4.2 Objectives . . . . . . . . . . . . . . . . . . . . . . . . . . . . . . . . . . . . . . . . . . . . . . . . . 68
4.3 Methods . . . . . . . . . . . . . . . . . . . . . . . . . . . . . . . . . . . . . . . . . . . . . . . . . . 70
4.3.1 Bacterial strains, growth conditions and inoculum . . . . . . . . . . . . . . . . . . . . . . 70
4.3.2 Hybridization of the co-culture with specific fluorescent probes . . . . . . . . . . . . . . 71
4.4 Results . . . . . . . . . . . . . . . . . . . . . . . . . . . . . . . . . . . . . . . . . . . . . . . . . . . 72
4.4.1 Microbiological assays . . . . . . . . . . . . . . . . . . . . . . . . . . . . . . . . . . . . . . 72
4.4.2 FC analysis of a mixed co-culture . . . . . . . . . . . . . . . . . . . . . . . . . . . . . . . . 72
4.5 Discussion . . . . . . . . . . . . . . . . . . . . . . . . . . . . . . . . . . . . . . . . . . . . . . . . . 75
4.6 Conclusions . . . . . . . . . . . . . . . . . . . . . . . . . . . . . . . . . . . . . . . . . . . . . . . . 76
5 Genetic diversity of C. difficile separated by FACS 77
5.1 Introduction . . . . . . . . . . . . . . . . . . . . . . . . . . . . . . . . . . . . . . . . . . . . . . . . 79
5.1.1 Methods for identification of C. difficile strains . . . . . . . . . . . . . . . . . . . . . . . . 79
5.1.2 C. difficile virulence genes . . . . . . . . . . . . . . . . . . . . . . . . . . . . . . . . . . . . 80
5.1.3 Whole genome comparison of C. difficile strains . . . . . . . . . . . . . . . . . . . . . . . . 82
5.2 Objectives . . . . . . . . . . . . . . . . . . . . . . . . . . . . . . . . . . . . . . . . . . . . . . . . . 85
5.3 Methods . . . . . . . . . . . . . . . . . . . . . . . . . . . . . . . . . . . . . . . . . . . . . . . . . . 86
5.3.1 Sample preparation . . . . . . . . . . . . . . . . . . . . . . . . . . . . . . . . . . . . . . . . 86
5.3.2 Sequence data analysis . . . . . . . . . . . . . . . . . . . . . . . . . . . . . . . . . . . . . . 89
5.3.3 Confirmation of the SNPs . . . . . . . . . . . . . . . . . . . . . . . . . . . . . . . . . . . . 89
5.4 Results . . . . . . . . . . . . . . . . . . . . . . . . . . . . . . . . . . . . . . . . . . . . . . . . . . . 92
5.4.1 An increase of the proportion of C. difficile . . . . . . . . . . . . . . . . . . . . . . . . . . . 92
5.4.2 Comparison with C. difficile reference genomes . . . . . . . . . . . . . . . . . . . . . . . . 93
5.4.3 Detection of SNPs in PaLoc region . . . . . . . . . . . . . . . . . . . . . . . . . . . . . . . 95
5.5 Discussion . . . . . . . . . . . . . . . . . . . . . . . . . . . . . . . . . . . . . . . . . . . . . . . . . 98
5.6 Conclusions . . . . . . . . . . . . . . . . . . . . . . . . . . . . . . . . . . . . . . . . . . . . . . . . 101
6 Adaptation of the sequencing protocols to limited DNA samples coming from FACS 102
6.1 Introduction . . . . . . . . . . . . . . . . . . . . . . . . . . . . . . . . . . . . . . . . . . . . . . . . 104
6.1.1 DNA amount needed for sequencing . . . . . . . . . . . . . . . . . . . . . . . . . . . . . . 104
6.1.2 Whole genome amplification methods . . . . . . . . . . . . . . . . . . . . . . . . . . . . . 107
6.1.3 Attempts to sequence less DNA . . . . . . . . . . . . . . . . . . . . . . . . . . . . . . . . . 110
6.2 Objectives . . . . . . . . . . . . . . . . . . . . . . . . . . . . . . . . . . . . . . . . . . . . . . . . . 111
6.3 Methods . . . . . . . . . . . . . . . . . . . . . . . . . . . . . . . . . . . . . . . . . . . . . . . . . . 112
6.3.1 Sequencing library preparation . . . . . . . . . . . . . . . . . . . . . . . . . . . . . . . . . 112
6.3.2 Quantitative PCR . . . . . . . . . . . . . . . . . . . . . . . . . . . . . . . . . . . . . . . . . 115
6.3.3 Sequence analysis . . . . . . . . . . . . . . . . . . . . . . . . . . . . . . . . . . . . . . . . . 117
6.4 Results . . . . . . . . . . . . . . . . . . . . . . . . . . . . . . . . . . . . . . . . . . . . . . . . . . . 119
6.4.1 E. coli genome mapping . . . . . . . . . . . . . . . . . . . . . . . . . . . . . . . . . . . . . 119
6.4.2 Analysis of unassigned reads . . . . . . . . . . . . . . . . . . . . . . . . . . . . . . . . . . 120
6.5 Discussion . . . . . . . . . . . . . . . . . . . . . . . . . . . . . . . . . . . . . . . . . . . . . . . . . 124
6.6 Conclusions . . . . . . . . . . . . . . . . . . . . . . . . . . . . . . . . . . . . . . . . . . . . . . . . 126
7 Viral metagenomics directed by flow cytometry 128
7.1 Introduction . . . . . . . . . . . . . . . . . . . . . . . . . . . . . . . . . . . . . . . . . . . . . . . . 130
7.1.1 Difficulties in shotgun sequencing of viromes . . . . . . . . . . . . . . . . . . . . . . . . . 130
7.1.2 FACS of viruses . . . . . . . . . . . . . . . . . . . . . . . . . . . . . . . . . . . . . . . . . . 132
7.2 Objectives . . . . . . . . . . . . . . . . . . . . . . . . . . . . . . . . . . . . . . . . . . . . . . . . . 133
7.3 Methods . . . . . . . . . . . . . . . . . . . . . . . . . . . . . . . . . . . . . . . . . . . . . . . . . . 134
7.3.1 Viral sample preparation . . . . . . . . . . . . . . . . . . . . . . . . . . . . . . . . . . . . . 134
7.3.2 Data analysis . . . . . . . . . . . . . . . . . . . . . . . . . . . . . . . . . . . . . . . . . . . . 137
7.4 Results . . . . . . . . . . . . . . . . . . . . . . . . . . . . . . . . . . . . . . . . . . . . . . . . . . . 139
7.4.1 Sequencing results . . . . . . . . . . . . . . . . . . . . . . . . . . . . . . . . . . . . . . . . 139
7.4.2 Analysis of the large contigs . . . . . . . . . . . . . . . . . . . . . . . . . . . . . . . . . . . 140
7.4.3 Analysis of unassembled reads . . . . . . . . . . . . . . . . . . . . . . . . . . . . . . . . . 142
7.5 Discussion . . . . . . . . . . . . . . . . . . . . . . . . . . . . . . . . . . . . . . . . . . . . . . . . . 143
7.6 Conclusions . . . . . . . . . . . . . . . . . . . . . . . . . . . . . . . . . . . . . . . . . . . . . . . . 145
8 General discussion 147
9 General conclusions 156
10 Resumen en Castellano 160
11 Appendix: Laboratory protocols 168
11.1 Amplification of 16S rDNA for Illumina sequencing . . . . . . . . . . . . . . . . . . . . . . . . . 170
11.2 Cloning and sequencing by the Sanger method . . . . . . . . . . . . . . . . . . . . . . . . . . . . 171
11.3 Collection and fixation of bacterial cells from fecal samples . . . . . . . . . . . . . . . . . . . . . 173
11.4 Cultivation and fixation of C. difficile . . . . . . . . . . . . . . . . . . . . . . . . . . . . . . . . . . 174
11.5 Extraction of DNA from bacterial samples . . . . . . . . . . . . . . . . . . . . . . . . . . . . . . . 175
11.6 Hybridization of bacteria by specific 16S rDNA probes . . . . . . . . . . . . . . . . . . . . . . . . 176
11.7 Positive control preparation for quantification of 454 libraries by qPCR . . . . . . . . . . . . . . 178
11.8 Purification of human gut virome . . . . . . . . . . . . . . . . . . . . . . . . . . . . . . . . . . . . 180
11.9 Purification of samples by magnetic beads . . . . . . . . . . . . . . . . . . . . . . . . . . . . . . . 181
11.10qPCR quantification of DNA fragments in 454 libraries . . . . . . . . . . . . . . . . . . . . . . . 182
11.11qPCR quantification of C. difficile genes toxin A, toxin B, specific 16S rDNA . . . . . . . . . . . . 185
11.12Shotgun 454 libraries for limited DNA samples . . . . . . . . . . . . . . . . . . . . . . . . . . . . 187
11.13Staining of bacterial DNA and RNA . . . . . . . . . . . . . . . . . . . . . . . . . . . . . . . . . . . 189
11.14Staining of IgA coated cells . . . . . . . . . . . . . . . . . . . . . . . . . . . . . . . . . . . . . . . . 190
12 Appendix: Programming scripts 192
12.1 Bayesian networks and extraction of Markov blankets . . . . . . . . . . . . . . . . . . . . . . . . 194
12.2 Canonical correspondence analysis with "envfit" function . . . . . . . . . . . . . . . . . . . . . . 197
12.3 Checking for presence of 454 adaptors . . . . . . . . . . . . . . . . . . . . . . . . . . . . . . . . . 199
12.4 Fold-change comparison of genera proportions in bacterial fractions pairs . . . . . . . . . . . . . 201

12.5 Mapping of reads on a reference genome . . . . . . . . . . . . . . . . . . . . . . . . . . . . . . . . 203
12.6 Sequence processing by Prinseq . . . . . . . . . . . . . . . . . . . . . . . . . . . . . . . . . . . . . 204
12.7 Setting a polygonal gate for FC plots . . . . . . . . . . . . . . . . . . . . . . . . . . . . . . . . . . 205
12.8 Visualization of annotated ORFs in a contig . . . . . . . . . . . . . . . . . . . . . . . . . . . . . . 206
12.9 Visualization of the whole genome coverage . . . . . . . . . . . . . . . . . . . . . . . . . . . . . . 207
13 Appendix: Abstracts of other publications not related to the thesis 208
14 Bibliography 218
15 Glossary 246

Chapter1General Introduction

General Introduction
1.1 The human gut
1.1.1 Anatomy of the human intestinal tract
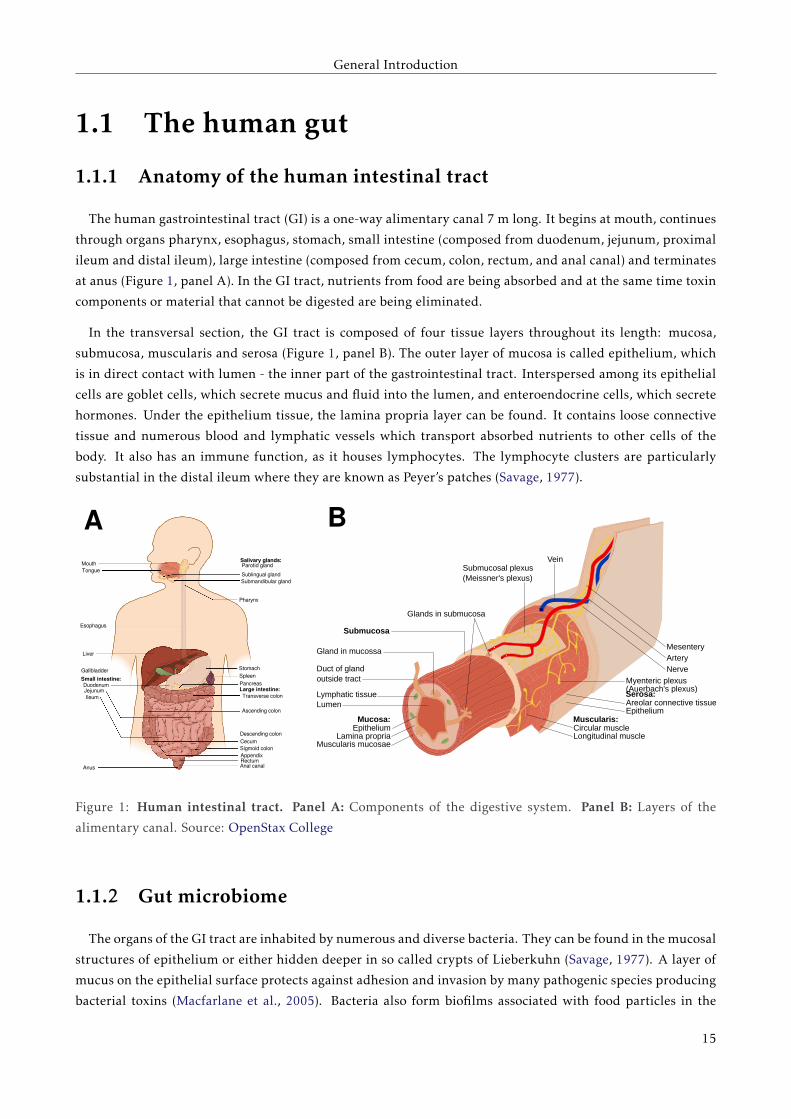
The human gastrointestinal tract (GI) is a one-way alimentary canal 7 m long. It begins at mouth, continues
through organs pharynx, esophagus, stomach, small intestine (composed from duodenum, jejunum, proximal
ileum and distal ileum), large intestine (composed from cecum, colon, rectum, and anal canal) and terminates
at anus (Figure 1, panel A). In the GI tract, nutrients from food are being absorbed and at the same time toxin
components or material that cannot be digested are being eliminated.
In the transversal section, the GI tract is composed of four tissue layers throughout its length: mucosa,
submucosa, muscularis and serosa (Figure 1, panel B). The outer layer of mucosa is called epithelium, which
is in direct contact with lumen - the inner part of the gastrointestinal tract. Interspersed among its epithelial
cells are goblet cells, which secrete mucus and fluid into the lumen, and enteroendocrine cells, which secrete
hormones. Under the epithelium tissue, the lamina propria layer can be found. It contains loose connective
tissue and numerous blood and lymphatic vessels which transport absorbed nutrients to other cells of the
body. It also has an immune function, as it houses lymphocytes. The lymphocyte clusters are particularly
substantial in the distal ileum where they are known as Peyer’s patches (Savage, 1977).
Mucosa:Epithelium
Lamina propriaMuscularis mucosae
Lymphatic tissueLumen
Duct of glandoutside tract
Gland in mucossa
Submucosa
Muscularis:Circular muscleLongitudinal muscle
Serosa:Areolar connective tissueEpithelium
Myenteric plexus(Auerbach's plexus)
NerveArteryMesentery
Glands in submucosa
Submucosal plexus(Meissner's plexus)
Vein
A B
MouthTongue
Salivary glands:Parotid gland
Sublingual glandSubmandibular gland
Pharynx
Esophagus
Liver
Gallbladder
Small intestine:DuodenumJejunumIleum
Anus
Stomach
Spleen
PancreasLarge intestine:
Transverse colon
Ascending colon
Descending colon
CecumSigmoid colonAppendixRectumAnal canal
Figure 1: Human intestinal tract. Panel A: Components of the digestive system. Panel B: Layers of the
alimentary canal. Source: OpenStax College
1.1.2 Gut microbiome
The organs of the GI tract are inhabited by numerous and diverse bacteria. They can be found in the mucosal
structures of epithelium or either hidden deeper in so called crypts of Lieberkuhn (Savage, 1977). A layer of
mucus on the epithelial surface protects against adhesion and invasion by many pathogenic species producing
bacterial toxins (Macfarlane et al., 2005). Bacteria also form biofilms associated with food particles in the
15
General Introduction
lumen (Van Wey et al., 2011). The total microbial load of the intestine is 1013 - 1014 microorganisms, which
collectively contain at least 100 ×more genes than the human genome (Gill et al., 2006).
The interaction between humans and microorganisms inhabiting their bodies can be described as symbiotic
relation in three different forms (Moya et al., 2008; Hooper and Gordon, 2001):
• Parasitic (pathogenic) bacteria: they increase their fitness (the ability to both survive and reproduce),
while the fitness of human hosts is decreased.
• Mutualistic relationship: humans and the microorganism benefit from this relation.
• Commensal bacteria: their fitness is increasing without affecting humans.
In the human gut, numerous viruses can be found, too. The majority of them are bacteriophages, the viruses
that attack bacteria (Minot et al., 2013). Rohwer (2003) estimated that if each of the bacterial host have at least
10 different phages, the number of phages in the human gut might be 109.
The recent studies suggested that the colonization of the human gut has intrauterine origin (Gosalbes et al.,
2013). The bacterial composition of the earliest microbiome is influenced by the way of delivery. The major
compositional changes in early childhood occur when the breastfeeding frequency decreases and the milk is
substituted by solid food (Koenig et al., 2011).
The species composition of the gut microbiota varies between individuals. However, the common basic
microbial functions can be found in all humans (HMPC, 2012):
• Metabolism of exfoliated epithelial cells and mucins:
Bacteria metabolize exfoliated epithelial cells and mucins to produce multiple metabolites that influence
intestinal epithelial function (Macfarlane et al., 2005).
• Metabolism of partially digested food:
The gut bacteria contain genes involved in metabolism of sucrose, starch, glycans, arabinose, mannose,
xylose, etc. This metabolism results in synthesis of methane, vitamins, isoprenoids, and short-chain fatty
acids, such as butyrate (Gill et al., 2006). It means that the gut bacteria influence energy balance of the
host.
• Detoxification of xenobiotics:
Bacteria can metabolize xenobiotics, including therapeutic drugs, antibiotics, and diet-derived bioactive
compounds, such as plant-derived phenolics. It means that the bacteria may influence the absorption
of medicaments (Gill et al., 2006). Unfortunately, microbial xenobiotic metabolism remains a largely
underexplored component of the pharmacology (Haiser and Turnbaugh, 2013).
• Modulation of intestinal architecture:
Bacteria also promote vessel formation in the intestinal epithelium by modulating tissue factor signaling
(Reinhardt et al., 2012). The most prominent feature of germ-free animals is a greatly enlarged cecum
(Wostmann, 1981).
• Increase of the intestinal motility:
Bacterial metabolites are incorporated in the serotonine pathway modulating intestinal motility (Yano
et al., 2015).
16
General Introduction
• Protection against intestinal injury:
Bacterial metabolites enhance barrier integrity and facilitate wound repair after injury (Rakoff-Nahoum
and Medzhitov, 2008). For example, Bacteroides thetaiotaomicron increases the resistance of the gut
to injury by inducing the expression of molecules which are involved in maintenance of junctional
complexes in the epithelium allowing cells to withstand shearing forces (Hooper et al., 2001). Also
several Lactobacillus strains firm tight junctions between epithelial cells, resulting in reduced epithelial
permeability (Lutgendorff et al., 2008).
• Regulation of pathogen invasion:
It was demonstrated that some intestinal infections (e.g. caused by Salmonella) are regulated not only by
human immune system, but also by the gut microbes which produces bacteriocins and other inhibiting
metabolites, or by competition with the pathogens for nutrients and space (Endt et al., 2010).
• Interaction with human immune system:
Peyer’s patches, mesenteric lymph nodes and numerous lymphoid follicles form intestinal lymphoid
tissues. They generate microbiome-reactive IgA-producing B cells. It was found that a peptidoglycan
from Gram-negative bacteria (such as Bacteroides fragilis) is necessary to induce genesis of intestinal
lymphoid tissues. The maturation of intestinal lymphoid tissues into B-cells clusters requires subsequent
detection of bacteria by toll-like receptors. In the absence of intestinal lymphoid tissues, the composition
of the intestinal bacterial community is profoundly altered. It means that the bacterial commensals and
the human immune system communicate to generate adaptive lymphoid tissues and together maintain
intestinal homeostasis (Bouskra et al., 2008; Mazmanian et al., 2005).
• Modulation of behavior and brain functions:
Using measures of motor activity and anxiety-like behavior in germ-free mice compared to mice with
controlled microbiota composition, differences in expression of genes in the brain metabolic pathways
have been detected. Increased motor activity and reduced anxiety was observed in germ-free mice (Heijtz
et al., 2011; Bercik et al., 2011). Probiotic bacteria were found to correct some behavioral alterations in
autism (Hsiao et al., 2013).
17
General Introduction
1.2 Identification of gut bacteria and viruses
1.2.1 Sequencing approaches for gut microbiome studies
Whole genome sequencing
In bacterial genomics, whole genome sequence comes usually from DNA extracted from one colony
considering it as the most reliable approximation to study the isolate or strain. The genetic information of
bacteria is stored in a nucleoid (a bacterial chromosome) and in plasmids. During the DNA extraction process,
the cells are disrupted by chemical agents and DNA is purified from proteins and other organic residues
(Ausubel et al., 1992). For plasmid DNA recovery, protocols focused on circular DNA extraction must be
applied (Birnboim and Doly, 1979).
Circularization adaptor Circularization adaptor
DNA fragment of several kilobases
Circularized DNA fragment
of several kilobases
Circularization of long DNA fragment is followed by fragmentation into pieces of
length suitable for sequencing
Circularization adaptor Circularization adaptor
DNA fragment of several kilobases
Circularized DNAfragment
of se eral kilobases
SAMPLE DNA
Circularized DNAfragment
of several kilobases
Circularization of long DNA fragmentis followed by fragmentation into pieces of
length suitable for sequencing
Circularized DNAfragment
of several kilobases
Circularization of long DNA fragmentis followed by fragmentation into pieces of
length suitable for sequencing
Sequencingadaptor
Sequencingadaptor
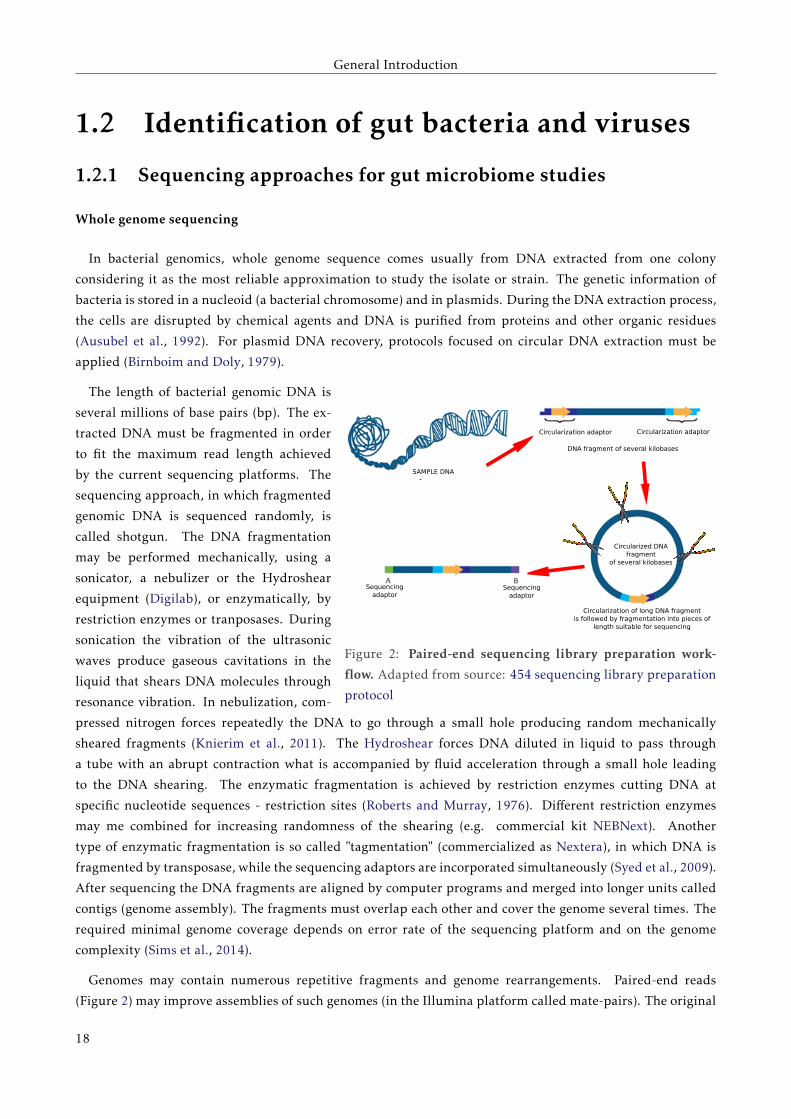
Figure 2: Paired-end sequencing library preparation work-
flow. Adapted from source: 454 sequencing library preparation
protocol
The length of bacterial genomic DNA is
several millions of base pairs (bp). The ex-
tracted DNA must be fragmented in order
to fit the maximum read length achieved
by the current sequencing platforms. The
sequencing approach, in which fragmented
genomic DNA is sequenced randomly, is
called shotgun. The DNA fragmentation
may be performed mechanically, using a
sonicator, a nebulizer or the Hydroshear
equipment (Digilab), or enzymatically, by
restriction enzymes or tranposases. During
sonication the vibration of the ultrasonic
waves produce gaseous cavitations in the
liquid that shears DNA molecules through
resonance vibration. In nebulization, com-
pressed nitrogen forces repeatedly the DNA to go through a small hole producing random mechanically
sheared fragments (Knierim et al., 2011). The Hydroshear forces DNA diluted in liquid to pass through
a tube with an abrupt contraction what is accompanied by fluid acceleration through a small hole leading
to the DNA shearing. The enzymatic fragmentation is achieved by restriction enzymes cutting DNA at
specific nucleotide sequences - restriction sites (Roberts and Murray, 1976). Different restriction enzymes
may me combined for increasing randomness of the shearing (e.g. commercial kit NEBNext). Another
type of enzymatic fragmentation is so called "tagmentation" (commercialized as Nextera), in which DNA is
fragmented by transposase, while the sequencing adaptors are incorporated simultaneously (Syed et al., 2009).
After sequencing the DNA fragments are aligned by computer programs and merged into longer units called
contigs (genome assembly). The fragments must overlap each other and cover the genome several times. The
required minimal genome coverage depends on error rate of the sequencing platform and on the genome
complexity (Sims et al., 2014).
Genomes may contain numerous repetitive fragments and genome rearrangements. Paired-end reads
(Figure 2) may improve assemblies of such genomes (in the Illumina platform called mate-pairs). The original
18
General Introduction
genomic DNA is cut into longer pieces , e.g. 20 kbp long by the Hydroshear, and circularization adaptors
allowing formation of DNA circles are attached to its ends. These circularized molecules are then fragmented
as in the case of common sequencing library preparation. The specialized magnetic beads select the fragments
than contain the circularization adaptor, while the fragments without this adaptor are removed. The fragments
containing the circularization adaptors are ligated to the normal sequencing adaptors and sequenced. The
pair-ends connected by the circularization adaptor are in the original genome sequence present with the
distance of 20 kbp, what helps to order the contigs previously obtained by the common shotgun sequencing.
In the present time (2015), there are 54,468 genomes of 3,270 different bacterial species deposited in
the National Center for Biotechnology Information (NCBI), from which 122 species are sequenced with
the coverage and precision sufficient for labeling them as the reference genomes. The remaining genomes
are partial assemblies containing genomic sequence covering 10-90 % of the whole genome sequence.
The majority of the sequenced genomes belongs to the phyla Proteobacteria, followed by Firmicutes and
Actinobacteria (Tatusova et al., 2014).
The genomes deposited in the databases can be used as backbone for mapping of obtained reads.
Applications are very wide. Differences between sequenced bacterial strains can be studied on the level of the
single nucleotide polymorphism (SNP) (Kuroda et al., 2010). In addition, comparison of different sequenced
strains belonging to the same species can be performed, thus the species pan-genome would be calculated. It
would be composed of a "core genome" containing genes present in all strains, and of a "dispensable genome"
containing genes present in two or more strains and genes unique to the single strains (Medini et al., 2005).
Metagenomics
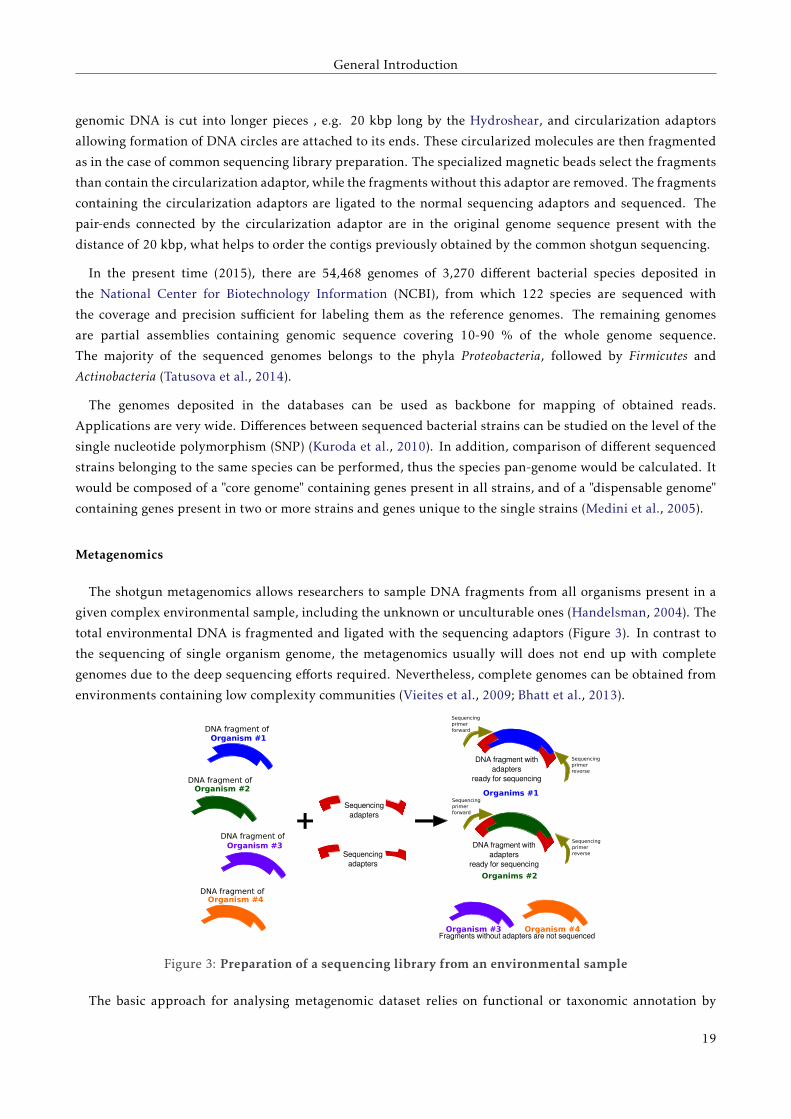
The shotgun metagenomics allows researchers to sample DNA fragments from all organisms present in a
given complex environmental sample, including the unknown or unculturable ones (Handelsman, 2004). The
total environmental DNA is fragmented and ligated with the sequencing adaptors (Figure 3). In contrast to
the sequencing of single organism genome, the metagenomics usually will does not end up with complete
genomes due to the deep sequencing efforts required. Nevertheless, complete genomes can be obtained from
environments containing low complexity communities (Vieites et al., 2009; Bhatt et al., 2013).
+
Sequencingprimerreverse
Sequencingprimer forward
Sequencingprimerreverse
Sequencingprimerforward
Organism #1DNA fragment of
Organism #2DNA fragment of
DNA fragment ofOrganism #3
DNA fragment ofOrganism #4
Organims #1
Organims #2
DNA fragment with adapters
ready for sequencing
DNA fragment with adapters
ready for sequencing
Organism #3 Organism #4Fragments without adapters are not sequenced
Sequencing adapters
Sequencing adapters
Figure 3: Preparation of a sequencing library from an environmental sample
The basic approach for analysing metagenomic dataset relies on functional or taxonomic annotation by
19
General Introduction
comparison with databases of completed bacterial genomes. However, when a metagenomic sequence is
aligned to such a database, its sequence can match a large list of potential organisms especially when
a conserved sequence is queried. Nowadays, numerous computational algorithms for estimation of the
taxonomic content have been published (Huson et al., 2007). The species diversity in a metagenomic sample
can be estimated also by grouping the sequences according to their GC content or oligonucleotide frequencies
(short string of nucleotides, e.g. 4 or 6 bp) (Teeling et al., 2004). Theoretically, samples from the same genomic
origin should present equivalent or similar oligonucleotide content, so analysis of oligonucleotides frequencies
should allow the discrimination of samples with potential contamination (Willner et al., 2009). It is also
possible to detect novel organisms (Dodsworth et al., 2013).
When the metagenomic sequences are assembled into contigs, a deeper analysis can be performed. For
example, proteins encoded in open reading frames (ORFs) may be detected and compared with databases of
protein sequences containing the information about their functions (Hunter et al., 2012). The comparison
of the results of the taxonomic assignation and the annotation of ORF gives a more complete picture of
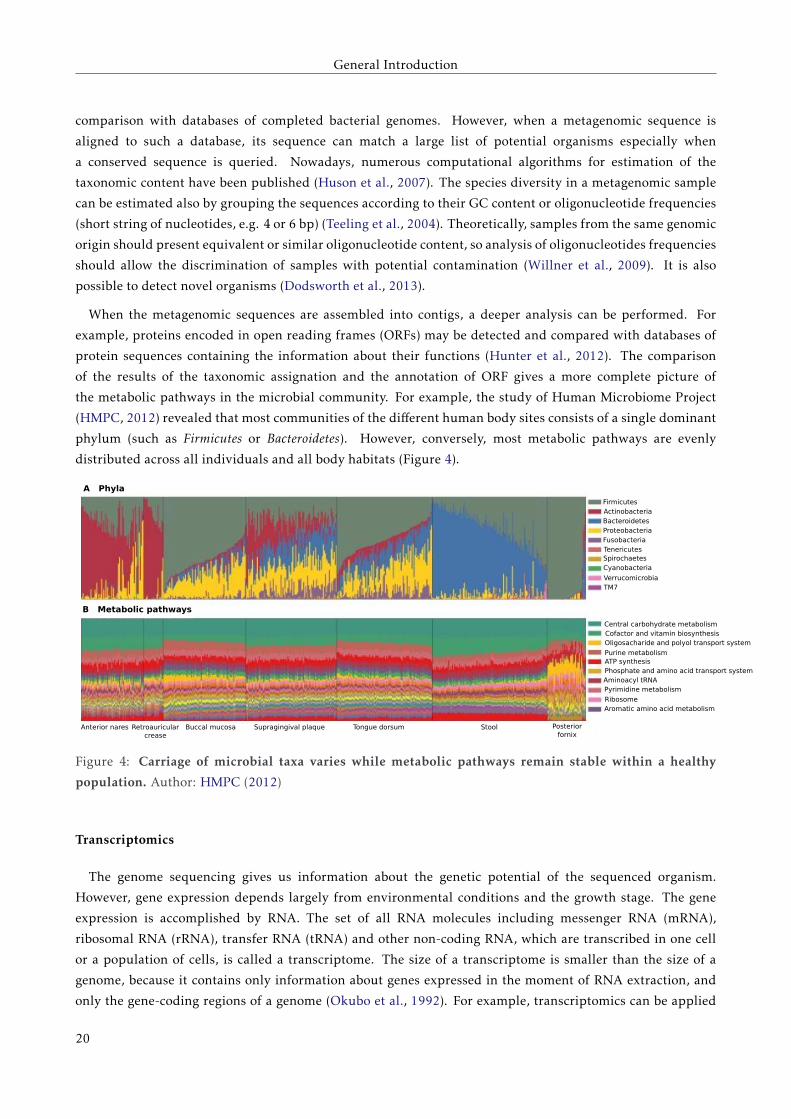
the metabolic pathways in the microbial community. For example, the study of Human Microbiome Project
(HMPC, 2012) revealed that most communities of the different human body sites consists of a single dominant
phylum (such as Firmicutes or Bacteroidetes). However, conversely, most metabolic pathways are evenly
distributed across all individuals and all body habitats (Figure 4).
FirmicutesActinobacteriaBacteroidetesProteobacteriaFusobacteriaTenericutesSpirochaetesCyanobacteria
VerrucomicrobiaTM7
Central carbohydrate metabolismCofactor and vitamin biosynthesisOligosacharide and polyol transport system
Purine metabolismATP synthesisPhosphate and amino acid transport systemAminoacyl tRNAPyrimidine metabolism
Aromatic amino acid metabolismRibosome
A Phyla
B Metabolic pathways
Anterior nares Retroauricular crease
Buccal mucosa Supragingival plaque Tongue dorsum Stool Posterior fornix
Figure 4: Carriage of microbial taxa varies while metabolic pathways remain stable within a healthy
population. Author: HMPC (2012)
Transcriptomics
The genome sequencing gives us information about the genetic potential of the sequenced organism.
However, gene expression depends largely from environmental conditions and the growth stage. The gene
expression is accomplished by RNA. The set of all RNA molecules including messenger RNA (mRNA),
ribosomal RNA (rRNA), transfer RNA (tRNA) and other non-coding RNA, which are transcribed in one cell
or a population of cells, is called a transcriptome. The size of a transcriptome is smaller than the size of a
genome, because it contains only information about genes expressed in the moment of RNA extraction, and
only the gene-coding regions of a genome (Okubo et al., 1992). For example, transcriptomics can be applied
20
General Introduction
to bacterial isolates cultured in certain conditions. Moroever, it can also reveal the dynamics of the gene
expression in microbial communities over time (Vieites et al., 2009).
Total RNA5'
5'
AAAA 3'
5' AAAA 3'
3'
T7 Oligo(dT) Primer
AAAA–3'
cDNA
AAAA-T7–3'TTTT-T7–5'
dsDNA transcript
TTTT-T7
TTTT-T7–5'
TTTT-T7+
Reverse Transcription to Synthesize First Strand cDNA
Polyadenylation of Template RNA
Second Strand cDNA Synthesis
PAP
5'
3'
5'
3'
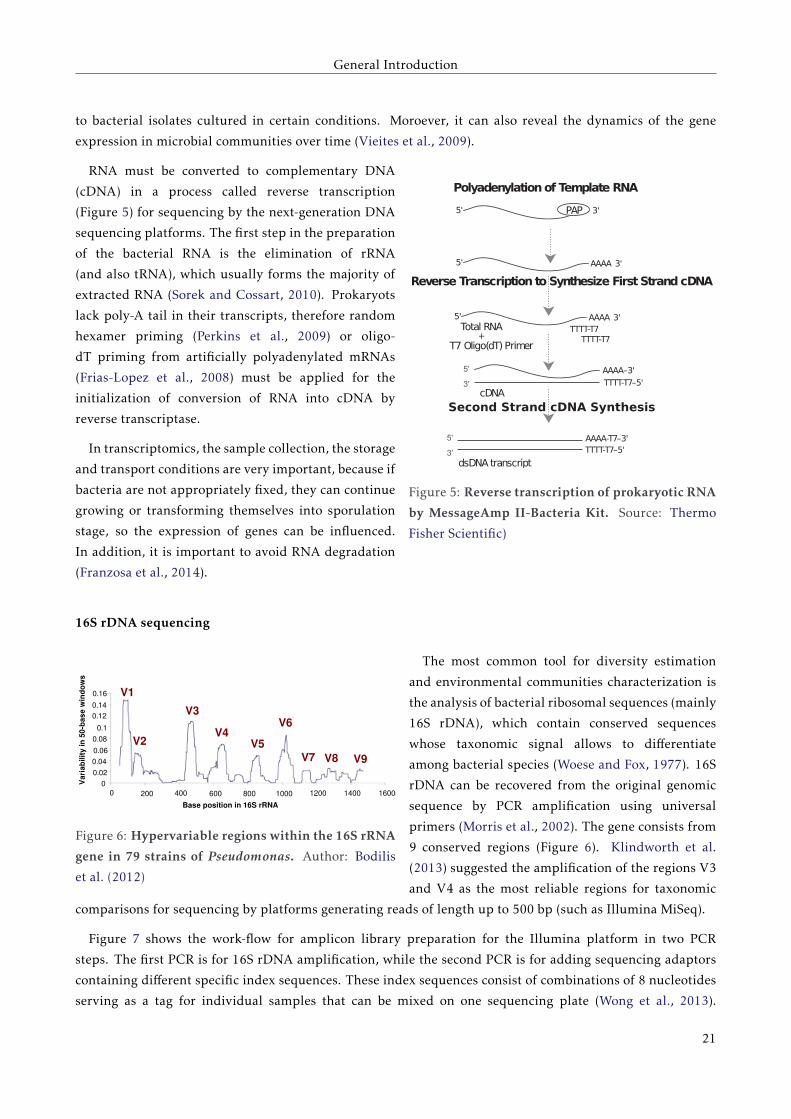
Figure 5: Reverse transcription of prokaryotic RNA
by MessageAmp II-Bacteria Kit. Source: Thermo
Fisher Scientific)
RNA must be converted to complementary DNA
(cDNA) in a process called reverse transcription
(Figure 5) for sequencing by the next-generation DNA
sequencing platforms. The first step in the preparation
of the bacterial RNA is the elimination of rRNA
(and also tRNA), which usually forms the majority of
extracted RNA (Sorek and Cossart, 2010). Prokaryots
lack poly-A tail in their transcripts, therefore random
hexamer priming (Perkins et al., 2009) or oligo-
dT priming from artificially polyadenylated mRNAs
(Frias-Lopez et al., 2008) must be applied for the
initialization of conversion of RNA into cDNA by
reverse transcriptase.
In transcriptomics, the sample collection, the storage
and transport conditions are very important, because if
bacteria are not appropriately fixed, they can continue
growing or transforming themselves into sporulation
stage, so the expression of genes can be influenced.
In addition, it is important to avoid RNA degradation
(Franzosa et al., 2014).
16S rDNA sequencing
V1
V2
V3
V4V5
V6
V7 V8 V9
Va
ria
bili
ty in
50
-ba
se
win
do
ws
0
0.02
0.04
0.06
0.08
0.1
0.12
0.14
0.16
0 200 400 600 800 1000 1200 1400 1600
Base position in 16S rRNA
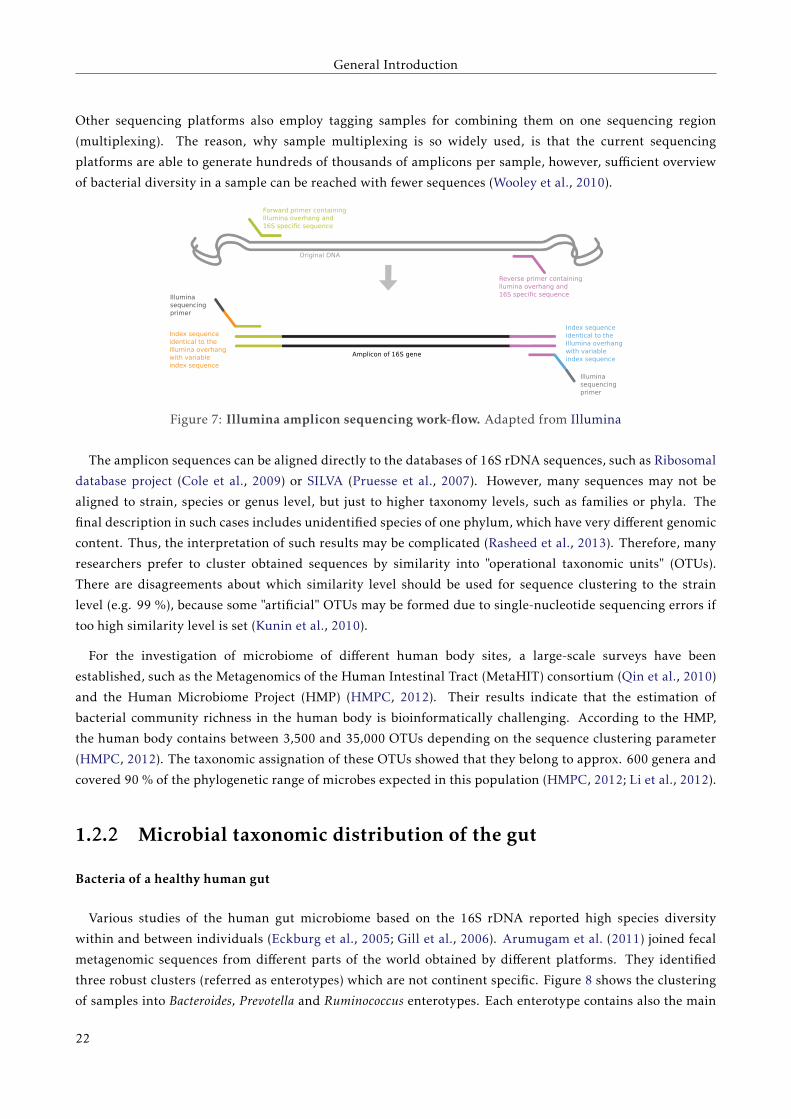
Figure 6: Hypervariable regions within the 16S rRNA
gene in 79 strains of Pseudomonas. Author: Bodilis
et al. (2012)
The most common tool for diversity estimation
and environmental communities characterization is
the analysis of bacterial ribosomal sequences (mainly
16S rDNA), which contain conserved sequences
whose taxonomic signal allows to differentiate
among bacterial species (Woese and Fox, 1977). 16S
rDNA can be recovered from the original genomic
sequence by PCR amplification using universal
primers (Morris et al., 2002). The gene consists from
9 conserved regions (Figure 6). Klindworth et al.
(2013) suggested the amplification of the regions V3
and V4 as the most reliable regions for taxonomic
comparisons for sequencing by platforms generating reads of length up to 500 bp (such as Illumina MiSeq).
Figure 7 shows the work-flow for amplicon library preparation for the Illumina platform in two PCR
steps. The first PCR is for 16S rDNA amplification, while the second PCR is for adding sequencing adaptors
containing different specific index sequences. These index sequences consist of combinations of 8 nucleotides
serving as a tag for individual samples that can be mixed on one sequencing plate (Wong et al., 2013).
21
General Introduction
Other sequencing platforms also employ tagging samples for combining them on one sequencing region
(multiplexing). The reason, why sample multiplexing is so widely used, is that the current sequencing
platforms are able to generate hundreds of thousands of amplicons per sample, however, sufficient overview
of bacterial diversity in a sample can be reached with fewer sequences (Wooley et al., 2010).
Forward primer containingIllumina overhang and 16S specific sequence
Reverse primer containingllumina overhang and 16S specific sequence
Original DNA
Amplicon of 16S gene
Index sequenceidentical to the Illumina overhangwith variable index sequence
Illumina sequencing primer
Index sequenceidentical to the Illumina overhangwith variable index sequence
Illumina sequencing primer
Figure 7: Illumina amplicon sequencing work-flow. Adapted from Illumina
The amplicon sequences can be aligned directly to the databases of 16S rDNA sequences, such as Ribosomal
database project (Cole et al., 2009) or SILVA (Pruesse et al., 2007). However, many sequences may not be
aligned to strain, species or genus level, but just to higher taxonomy levels, such as families or phyla. The
final description in such cases includes unidentified species of one phylum, which have very different genomic
content. Thus, the interpretation of such results may be complicated (Rasheed et al., 2013). Therefore, many
researchers prefer to cluster obtained sequences by similarity into "operational taxonomic units" (OTUs).
There are disagreements about which similarity level should be used for sequence clustering to the strain
level (e.g. 99 %), because some "artificial" OTUs may be formed due to single-nucleotide sequencing errors if
too high similarity level is set (Kunin et al., 2010).
For the investigation of microbiome of different human body sites, a large-scale surveys have been
established, such as the Metagenomics of the Human Intestinal Tract (MetaHIT) consortium (Qin et al., 2010)
and the Human Microbiome Project (HMP) (HMPC, 2012). Their results indicate that the estimation of
bacterial community richness in the human body is bioinformatically challenging. According to the HMP,
the human body contains between 3,500 and 35,000 OTUs depending on the sequence clustering parameter
(HMPC, 2012). The taxonomic assignation of these OTUs showed that they belong to approx. 600 genera and
covered 90 % of the phylogenetic range of microbes expected in this population (HMPC, 2012; Li et al., 2012).
1.2.2 Microbial taxonomic distribution of the gut
Bacteria of a healthy human gut
Various studies of the human gut microbiome based on the 16S rDNA reported high species diversity
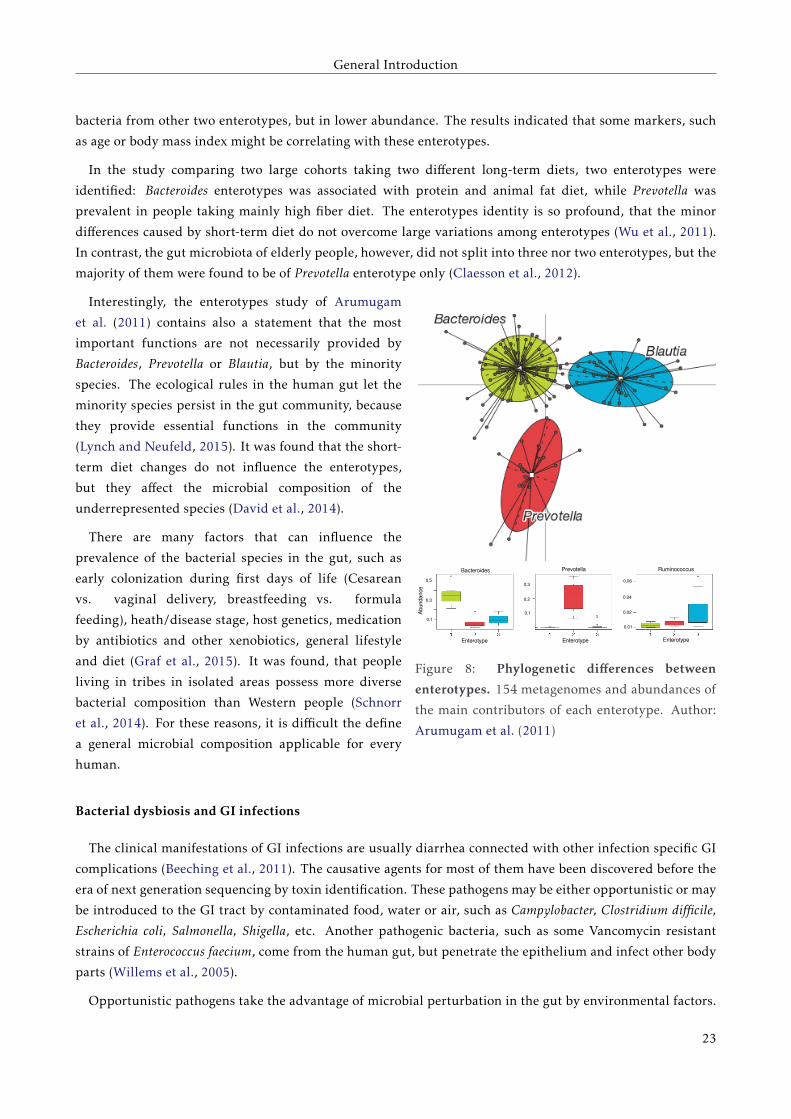
within and between individuals (Eckburg et al., 2005; Gill et al., 2006). Arumugam et al. (2011) joined fecal
metagenomic sequences from different parts of the world obtained by different platforms. They identified
three robust clusters (referred as enterotypes) which are not continent specific. Figure 8 shows the clustering
of samples into Bacteroides, Prevotella and Ruminococcus enterotypes. Each enterotype contains also the main
22
General Introduction
bacteria from other two enterotypes, but in lower abundance. The results indicated that some markers, such
as age or body mass index might be correlating with these enterotypes.
In the study comparing two large cohorts taking two different long-term diets, two enterotypes were
identified: Bacteroides enterotypes was associated with protein and animal fat diet, while Prevotella was
prevalent in people taking mainly high fiber diet. The enterotypes identity is so profound, that the minor
differences caused by short-term diet do not overcome large variations among enterotypes (Wu et al., 2011).
In contrast, the gut microbiota of elderly people, however, did not split into three nor two enterotypes, but the
majority of them were found to be of Prevotella enterotype only (Claesson et al., 2012).
Abundance
Bacteroides
Enterotype
Prevotella Ruminococcus
Enterotype Enterotype
0.3
0.2
0.5
0.3
0.1
0.1
0.06
0.04
0.02
0.01
Figure 8: Phylogenetic differences between
enterotypes. 154 metagenomes and abundances of
the main contributors of each enterotype. Author:
Arumugam et al. (2011)
Interestingly, the enterotypes study of Arumugam
et al. (2011) contains also a statement that the most
important functions are not necessarily provided by
Bacteroides, Prevotella or Blautia, but by the minority
species. The ecological rules in the human gut let the
minority species persist in the gut community, because
they provide essential functions in the community
(Lynch and Neufeld, 2015). It was found that the short-
term diet changes do not influence the enterotypes,
but they affect the microbial composition of the
underrepresented species (David et al., 2014).
There are many factors that can influence the
prevalence of the bacterial species in the gut, such as
early colonization during first days of life (Cesarean
vs. vaginal delivery, breastfeeding vs. formula
feeding), heath/disease stage, host genetics, medication
by antibiotics and other xenobiotics, general lifestyle
and diet (Graf et al., 2015). It was found, that people
living in tribes in isolated areas possess more diverse
bacterial composition than Western people (Schnorr
et al., 2014). For these reasons, it is difficult the define
a general microbial composition applicable for every
human.
Bacterial dysbiosis and GI infections
The clinical manifestations of GI infections are usually diarrhea connected with other infection specific GI
complications (Beeching et al., 2011). The causative agents for most of them have been discovered before the
era of next generation sequencing by toxin identification. These pathogens may be either opportunistic or may
be introduced to the GI tract by contaminated food, water or air, such as Campylobacter, Clostridium difficile,
Escherichia coli, Salmonella, Shigella, etc. Another pathogenic bacteria, such as some Vancomycin resistant
strains of Enterococcus faecium, come from the human gut, but penetrate the epithelium and infect other body
parts (Willems et al., 2005).
Opportunistic pathogens take the advantage of microbial perturbation in the gut by environmental factors.
23
General Introduction
Such a perturbation can lead to the overgrowth ("bloom") of some of the underrepresented species (Segata
et al., 2011). Figure 9 shows two possible scenarios occurring during microbial perturbation. If the
perturbation leads to the positive selection of pathogens, the dysbiosis may end up in vicious cycle in which
perturbation-induced blooms increase disease onset probability. In the more positive scenario, the first
perturbation might result in a spread of perturbation-resistance genes among the intestinal microbiota, so
the ecosystem gets stabilized with novel composition which is able to resist possible diseases (Stecher et al.,
2013).
Stability
Stability
Originalecosystem
E1
Originalecosystem
E1
Perturbation
PerturbationX
Bloom
Bloom
Bloom
Vicious cycle
Adaptation, evolution(HGT)
Adaptation, evolution(HGT)
Resistance toX
Repeatedperturbation
X
Disease
Stability loss
Stability gainowing to
adaptation
Ecosystem E1*
A
B
Figure 9: Perturbation-induced destabilization (panel
A) and stabilization (panel B) of intestinal ecosystems
Author: Stecher et al. (2013)
The single species GI infections can be treated
by antibiotics, but they are useful only to a certain
point. For example, in the case of C. difficile in-
fection, it was observed that repeated treatments
by Vancomycin and Metronidazole do not provide
satisfactory treatment results and have caused the
emergence of Vancomycin-resistant Enterococcus
(Al-Nassir et al., 2008). The metabolomic analyses
showed that antibiotic treatment decreases levels
of secondary bile acids, glucose, free fatty acids
and dipeptides, while it causes an increase of
primary bile acids and sugar alcohols. Some op-
portunistic pathogens can take the advantage of
specific metabolites which become more abundant
after antibiotic treatment. They may use primary
bile acid taurocholate for germination, and carbon
sources such as mannitol, fructose, sorbitol,
raffinose and stachyose for growth (Theriot et al.,
2014). Microbiota disturbed by the antibiotic
treatment may also produce increasing levels of
sialic acid, which may be used for the expansion
of opportunistic pathogens (Ley, 2014).
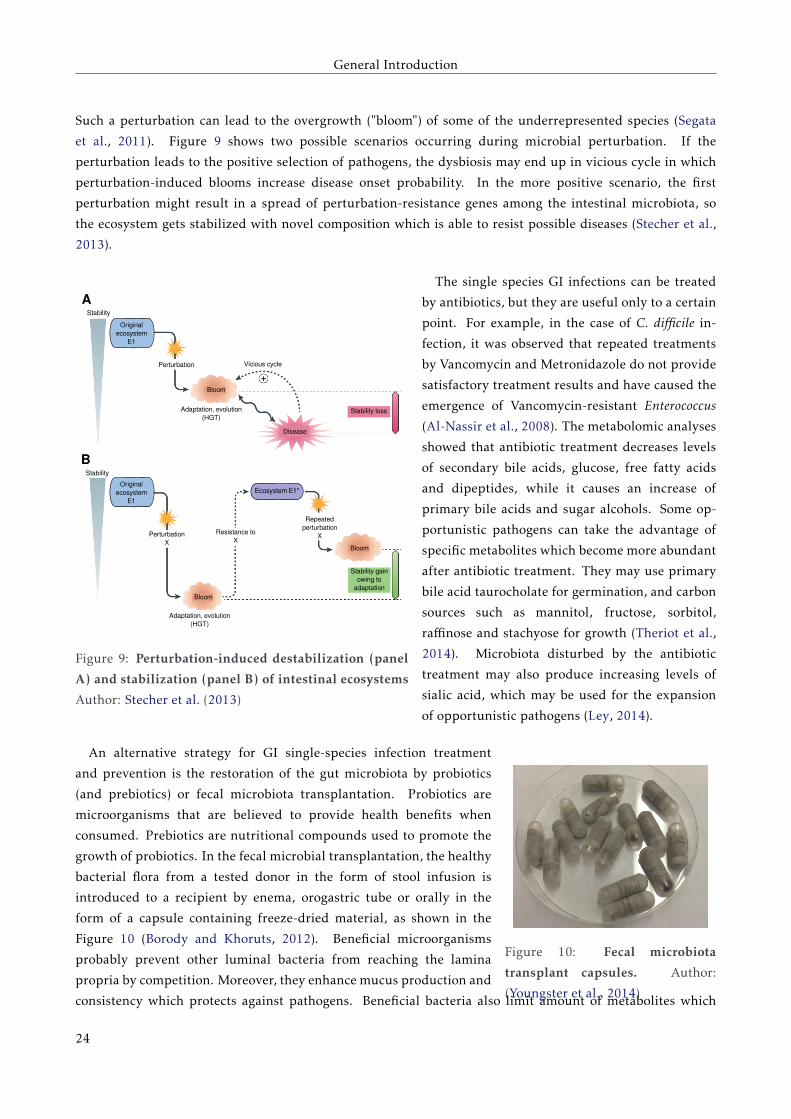
Figure 10: Fecal microbiota
transplant capsules. Author:
(Youngster et al., 2014)
An alternative strategy for GI single-species infection treatment
and prevention is the restoration of the gut microbiota by probiotics
(and prebiotics) or fecal microbiota transplantation. Probiotics are
microorganisms that are believed to provide health benefits when
consumed. Prebiotics are nutritional compounds used to promote the
growth of probiotics. In the fecal microbial transplantation, the healthy
bacterial flora from a tested donor in the form of stool infusion is
introduced to a recipient by enema, orogastric tube or orally in the
form of a capsule containing freeze-dried material, as shown in the
Figure 10 (Borody and Khoruts, 2012). Beneficial microorganisms
probably prevent other luminal bacteria from reaching the lamina
propria by competition. Moreover, they enhance mucus production and
consistency which protects against pathogens. Beneficial bacteria also limit amount of metabolites which
24
General Introduction
may be misused by pathogens. In addition, they stimulate the mucosal immune system to secrete protective
secretory IgA, protective defensins and bacteriocins into the lumen (Fedorak, 2010). On the other hand, fecal
transplantation therapy includes many unsolved issues, such as selection of the transplant donor selection.
Recently undesired metabolical changes caused by introduced microorganisms by fecal transplantation have
been reported (Gregory et al., 2014; Merenstein et al., 2014).
Bacterial dysbiosis and GI disorders
The metabolic pathways of the gut bacteria are connected to pathways of host’s metabolism, meaning that
bacteria may influence the onset of several human non-infectious diseases. There are numerous studies
focused on associations between the composition of the human gut microbiota and the diverse diseases
affecting different parts of human body (Sjögren et al., 2012), behavior (Hsiao et al., 2013) or onset of allergies
(Trompette et al., 2014). In most of these studies, no single causative species are being identified, however,
the differences in the overall bacterial composition have been found. The detection is mostly performed
by comparison of bacterial composition of fecal samples of large cohorts of affected patients and healthy
volunteers (Guinane and Cotter, 2013). The majority of these studies try to explain the onset of GI diseases,
such as irritable bowel syndrome (IBS), inflammatory bowel disease (IBD), systemic diseases, such as type 2
diabetes and obesity, as well as the onset of colorectal cancer. The studies investigating bacterial dysbiosis and
GI diseases reviewed in the study of Guinane and Cotter (2013) are shown in Table 1.
IBS is characterized by abdominal pain or discomfort and altered bowel habits. Recent studies have
identified susceptibility genes for IBS. They are involved in the innate immunity and recognition of bacteria
and also in maintaining the integrity of the intestinal barrier (Ohman and Simrén, 2013). A longitudinal
study showed that quick shifts in the global pattern of gene expression is associated with acute diarrhea in IBS
(Durbán et al., 2013). The IBS pathogenesis might be connected to the overgrowth of bacteria adhesing to the
bowel wall (Ghoshal et al., 2012).
IBD has two forms: Crohn’s disease (CD) and ulcerative colitis (UC) (Loftus, 2004). It is characterized by
a chronic inflammation of the GI tract. The two forms of IBD differ in their symptoms and inflammation
patterns. The GI inflammation in CD is more segmental and is probably a result of interaction of the host’s
genetics with the microbial population. UC is characterized by the inflammation of the lining of the colon.
Both forms have been associated with overall dysbiosis in the gut, specifically by overgrowth of microbes
involved in development of mucosal lesions (Lepage et al., 2011; Manichanh et al., 2012).
Intestinal bacteria may also promote colorectal cancer tumorigenesis. Mice infected by recombinant E. coli
strain, which possessed a polyketide synthase pathogenicity island encoding a genotoxin, developed tumors,
while mutants lacking this protein remained unaffected (Arthur et al., 2012). In addition, the tumorigenes of
colorectal cancer may be enhanced by Fusobacterium through an inflammatory mechanism (Kostic et al., 2012).
Obesity is a syndrome that is caused by prolonged imbalance between energy intake and expenditure and
is often connected to diabetes type 2. The causes are unhealthy lifestyle and diet, but also gut microbiota
may play a role in its onset (Turnbaugh et al., 2006). The first study showed that increased ratios of
Firmicutes/Bacteroidetes is connected to obesity, however, recent studies showed that the onset of obesity does
not depend on prevalence of exact phylogenetic groups, but on the metabolites they produce (Murphy et al.,
2010; Clarke et al., 2012; Fei and Zhao, 2012).
25
General Introduction
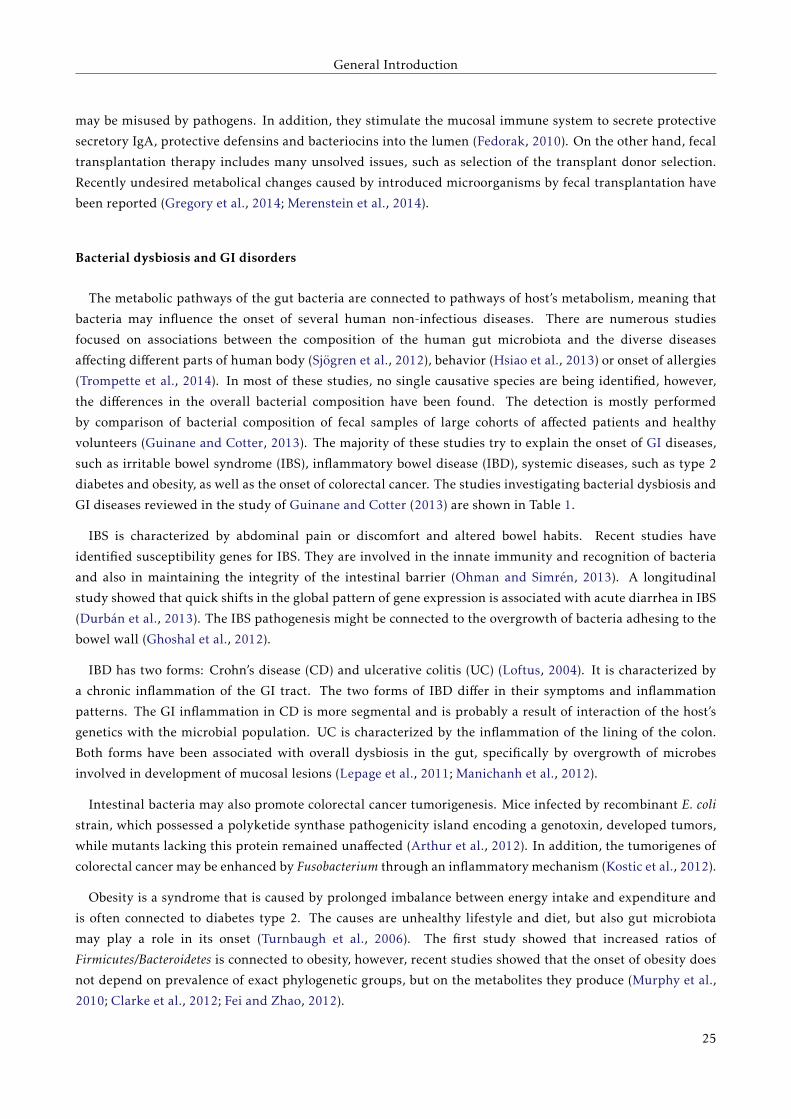
Table 1 demonstrates that further research is necessary to conclude which exact bacterial communities are
causing studied GI diseases. Some researchers determine the bacterial taxonomy up to genus level, while
others work only with phyla-level diversity, what results in discrepancies between studies. An example is
the decreased Bacteroidetes proportion associated with obesity by phyla-level comparison, while in contrast
genus-level analysis showed that increased Bacteroides proportion mat be linked to obesity. Another example
is Ruminococcus: its increased proportion has been associated with IBS, while its decreased proportion has
been associated with obesity. Therefore, according to the present stage of knowledge, the definition of a
healthy microbiota is difficult (Guinane and Cotter, 2013).
Table 1: Microbial associations with chronic intestinal diseases. Author: Guinane and Cotter (2013)
Increased Decreased
Irritable bowel syndrome
Clostridium Bacteroides
Dorea Bifidobacterium
Firmicutes:Bacteroidetes ratio Faecalibacterium
Gammaproteobacteria
Haemophilus influenzae
Ruminococcus
Inflammatory bowel disease
bacterial numbers in mucosa bacterial diversity
γ-Proteobacteria Bacteroidetes
Clostridium Faecalibacterium prausnitzii
Enterobacteraceae Firmicutes
adherent invasive Escherichia coli Lachnospiracheae
Phascolarctobacterium
Roseburia
Colorectal cancerpolyketide synthase containing E. coli
Fusobacterium spp.
Obesity
Actinobacteria bacterial diversity
Bacteroides Bifidobacterium
Firmicutes:Bacteroidetes ratio Methanobrevibacter
Prevotellaceae Ruminococcus flavefaciens
Diabetes type 2
Akkermansia muciniphilia Eubacterium spp.
Bacteroides Faecalibacterium spp.
Clostridium Firmicutes
E. coli Roseburia spp.
Eggerthella lenta
1.2.3 Taxonomic composition of the gut viruses
Viruses of the healthy gut
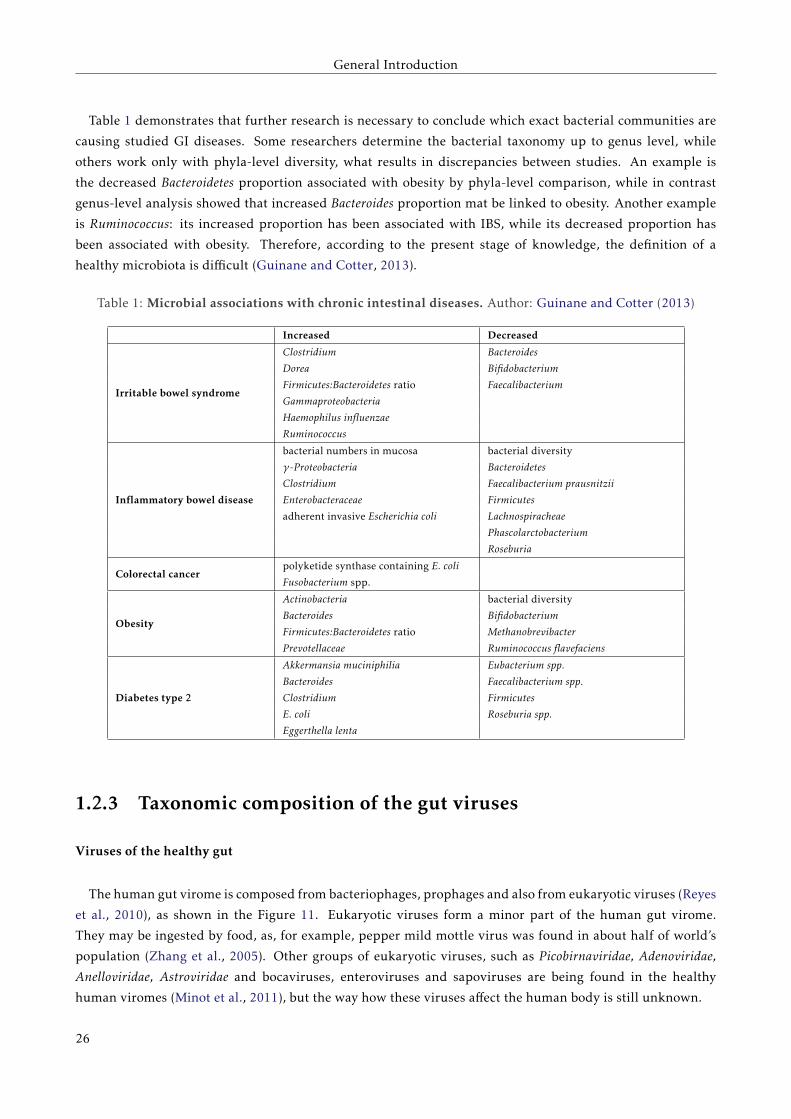
The human gut virome is composed from bacteriophages, prophages and also from eukaryotic viruses (Reyes
et al., 2010), as shown in the Figure 11. Eukaryotic viruses form a minor part of the human gut virome.
They may be ingested by food, as, for example, pepper mild mottle virus was found in about half of world’s
population (Zhang et al., 2005). Other groups of eukaryotic viruses, such as Picobirnaviridae, Adenoviridae,
Anelloviridae, Astroviridae and bocaviruses, enteroviruses and sapoviruses are being found in the healthy
human viromes (Minot et al., 2011), but the way how these viruses affect the human body is still unknown.
26
General Introduction
ssRNA virusesssDNA virusesRetrovirusesdsDNA virusesssDNA viruses
Siphoviridae
PodoviridaeMyoviridae
Gammaproteobacteria
Delta/epsilonproteobacteriaBetaproteobacteriaAlphaproteobacteriaErysipelotrichi
Clostridia
Bacilli
BacteroidiaActinobacteria
Euk
aryo
ticvi
ruse
sP
hage
sP
rop
hage
s
1 1 1 1 1 1 1 1 1 1 1 1 1 1 1 1 2 2 2 2 2 2 2 2 2 23 3 3 3 3 3 3 3 3 3
T1 T1 T1 T1T2 T2 T2 T2M M M MF1 F2 F3 F4
R R R R R
100 % 50 % 0 %
Figure 11: Viral diversity of four families (F1-F4) of
monozygotic twins (T1 and T2) and their mothers (M).
Author: Reyes et al. (2010)
Bacteriophages and prophages are more
common in the human gut than the
eukaryotic viruses. It is estimated that
the number of bacteriophages outnumbers
10 × the number of bacteria. The genomes
of bacteria and bacteriophages in the
human gut form a complicated network in
which one bacterial group can be predated
by 1-5 different phages (Waller et al.,
2014). Interestingly, the mutation rates of
bacteriophages are orders of magnitude
higher than in bacteria, so new phages are
emerging constantly (De Paepe et al., 2014a)
indicating that the GI tract hosts a dynamic
community structure, characterized by
predator-prey interactions connected to the
horizontal gene transfer (Minot et al., 2011).
Bacteriophages contribute actively to the
emergence of a novel gene combinations
in bacteria by the horizontal gene transfer
(De Paepe et al., 2014a). Therefore, the
composition of the bacterial and viral metagenomes are closely connected.
Diet can change the viral composition up to certain level (Minot et al., 2011), similarly as in the case of
bacteria (Graf et al., 2015). Analysis of possible proteins encoded in ORFs detected in viromes revealed a high
functional diversity which differs from the bacterial metagenome. ORFs detected in the gut viromes contain
numerous proteins related to the horizontal gene transfer, mainly genes included in DNA replication and
repair (Reyes et al., 2010).
Despite the fact that the viral composition among individuals is very different (Figure 11), 90 % of people
have in common one recently discovered Bacteroides bacteriophage. It was assembled from joined sequence
data from previously published viromes. Its genome is 97 kbp long and it encodes proteins that do not have
matches to any known sequences in the databases, which is the reason why it had not been detected before
(Dutilh et al., 2014).
Viral dysbiosis and GI diseases
Eukaryotic viruses affecting directly humans hosts cause usually GI infections with wide variety of
clinical presentations, usually diarrhea. The causative agents for the most common GI infections are
rotavirus (Dennehy, 2000) and norovirus (Glass et al., 2009) which are transmitted by fecal-oral contact, by
contaminated surfaces and hands and may be spreads also via air (Dennehy, 2000; Glass et al., 2009).
As the bacteriophages modulate the diversity of the human gut microbiota, they can also influence the
development of the human immune system (Cario, 2013) and contribute to the health and disease of the host
(Focà et al., 2015; Cario, 2013). There are four possible ways, how phages regulate the composition of gut
27
General Introduction
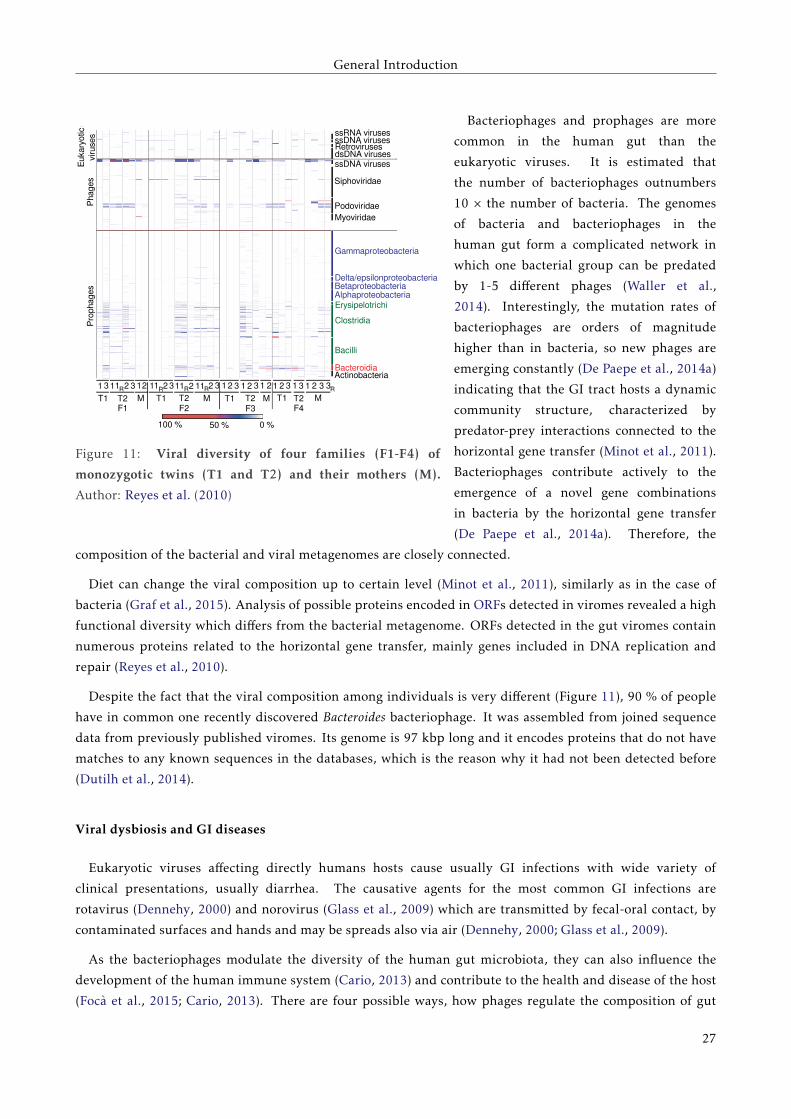
bacteria and so influence the onset of several GI disorders, described in the Figure 12.
In the "Kill the winner" way of action, the phages infect only those bacterial species which have overgrown
and reached the threshold above which phages can predate them. These bacteria will be lysed, so the bacterial
community will be shifted back to normal (Parsons et al., 2012). In the "Kill the relative" strategy, phages are
growing within phage susceptible strain in lysogenic cycles. The bacteriophages will finally kill the relative
bacterial strains (Brown et al., 2006).
A
B
C
D
Kill the winner
Invade the relative
Community shuffling
Kill the relative
Perturbation(Drugs, Pollutatns, Stress,
Pathogens...)
- : Phage-sensitive Strain displacement
Return to equilibriumPhage killingSpecies proliferationDiverse microbiota
Healthy microbiota
- : Phage-sensitive + : Prophage invasion
DysbiosisProphage induction
Stress
Immune system
Figure 12: Four different ways how bacteriophages
influence bacterial composition of the human gut. Author:
De Paepe et al. (2014b)
In the moments when gut encounters
environmental stress, phages can be induced
more in mutualistic bacteria than in pathogenic
bacteria, so finally the bacteriophage
contribute to the intestinal dysbiosis by
diminishing the ratio of mutualistic bacteria
and pathogens (Mills et al., 2013). This
theory is being confirmed by viral studies in
different GI diseases, for example it was found
that the mucus of CD patients has 30× fold
enrichment of virus-like particles (3×10 9)
than the mucus of healthy controls (Lepage
et al., 2008). Finally, the 4th model present
a scheme where bacteriophages infect hosts,
but without lysing them - the lysogeny is
established so the way for horizontal gene
transfer opens. Antibiotic treatment, for
example, expands the interactions between
phage and bacterial species, leading to a highly
connected phage-bacteria network for horizontal gene transfer (Modi et al., 2013).
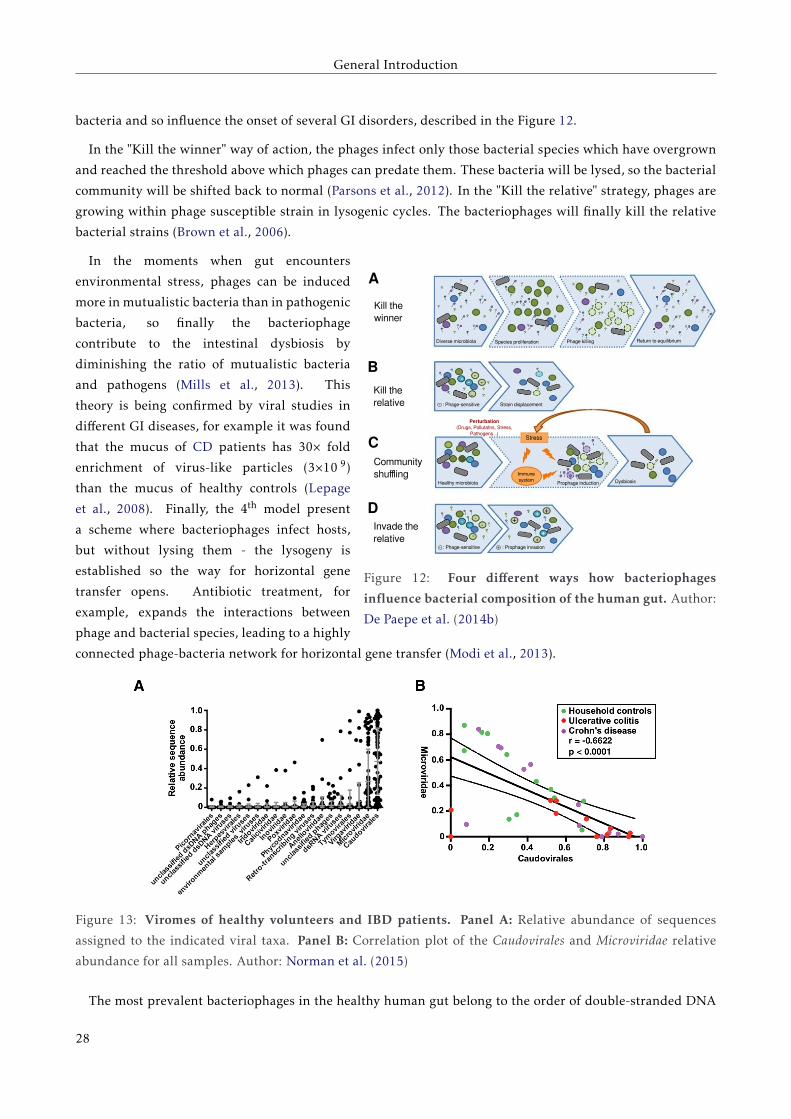
Figure 13: Viromes of healthy volunteers and IBD patients. Panel A: Relative abundance of sequences
assigned to the indicated viral taxa. Panel B: Correlation plot of the Caudovirales and Microviridae relative
abundance for all samples. Author: Norman et al. (2015)
The most prevalent bacteriophages in the healthy human gut belong to the order of double-stranded DNA
28

General Introduction
viruses Caudovirales (Podoviridae, Siphoviridae and Myoviridae) and Microviridae order of single-stranded DNA
(Reyes et al., 2010; Minot et al., 2013; Reyes et al., 2010; Norman et al., 2015), as shown in the panel A of
the Figure 13. The panel B of the Figure 13 shows that the altered ratio of Caudovirales/Microviridae may be
the one of the factors involved in the pathogenesis of IBD (Lawlor and Moss, 2010). The increased richness of
Caudovirales was associated with the both forms of IBD - CD and UC (Norman et al., 2015).
29
General Introduction
1.3 Fluorescent activated cell sorting (FACS)of the gut microbiome
1.3.1 Method description
Flow cytometry (FC) is a laser-based, biophysical technology employed in cell counting and sorting by
suspending cells in a stream of fluid and passing them by an electronic detection apparatus. It allows
simultaneous multiparametric analysis of the physical and chemical characteristics in the range of thousands
of particles per second. The forerunner to today’s flow cell sorters was the apparatus of M. J. Fultyler
allowing to separate resuspended cells on basis of electronically measured volumes of droplets (Fulwyler,
1965). Kamentsky and Melamed (1967) have improved this equipment, so it was possible to separate the cells
according to their optical properties measured simultaneously at four different wavelengths. Five years later,
Bonner et al. (1972) published a report of the first fluorescence activated cell sorter sorting differently stained
populations of cells.
Fluorescent cell staining
A
B
Wavelength, nm
Rel
ativ
e in
tens
ity
Absorption(excitation)
Stokes shift
Emission
Spectral overlap
400 500 600 700 800
400 500 600 700
UV IR
Wavelength (nm)
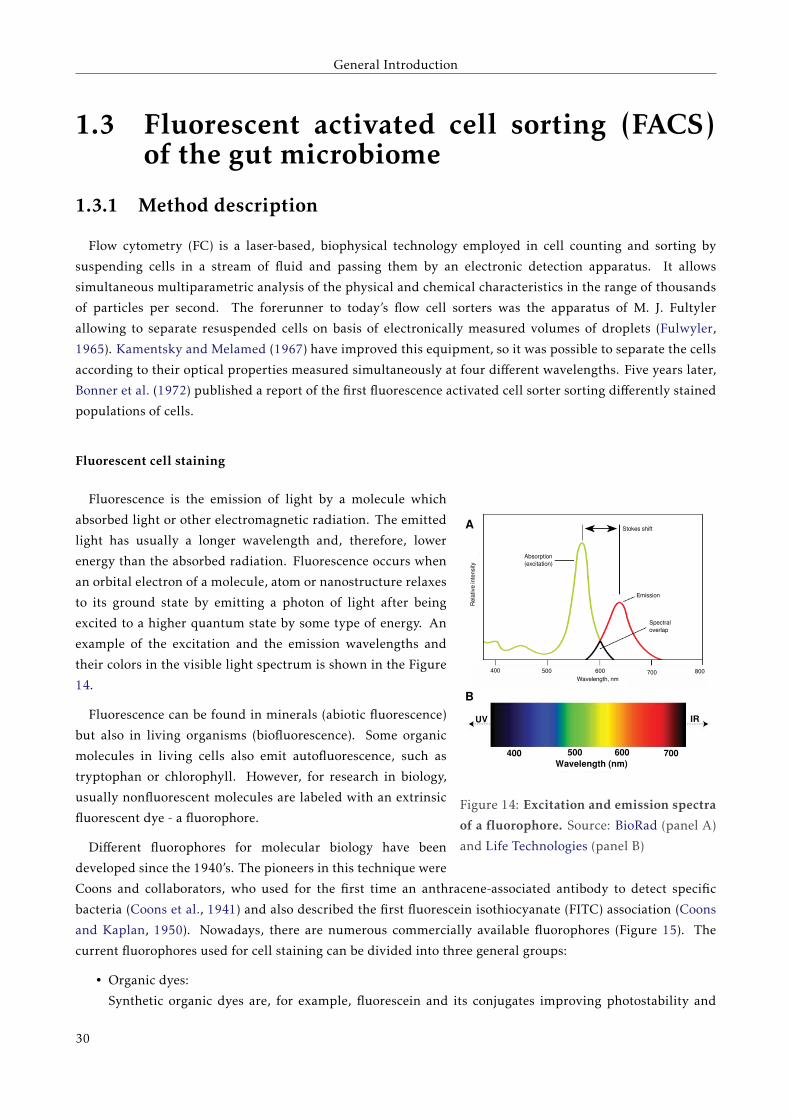
Figure 14: Excitation and emission spectra
of a fluorophore. Source: BioRad (panel A)
and Life Technologies (panel B)
Fluorescence is the emission of light by a molecule which
absorbed light or other electromagnetic radiation. The emitted
light has usually a longer wavelength and, therefore, lower
energy than the absorbed radiation. Fluorescence occurs when
an orbital electron of a molecule, atom or nanostructure relaxes
to its ground state by emitting a photon of light after being
excited to a higher quantum state by some type of energy. An
example of the excitation and the emission wavelengths and
their colors in the visible light spectrum is shown in the Figure
14.
Fluorescence can be found in minerals (abiotic fluorescence)
but also in living organisms (biofluorescence). Some organic
molecules in living cells also emit autofluorescence, such as
tryptophan or chlorophyll. However, for research in biology,
usually nonfluorescent molecules are labeled with an extrinsic
fluorescent dye - a fluorophore.
Different fluorophores for molecular biology have been
developed since the 1940’s. The pioneers in this technique were
Coons and collaborators, who used for the first time an anthracene-associated antibody to detect specific
bacteria (Coons et al., 1941) and also described the first fluorescein isothiocyanate (FITC) association (Coons
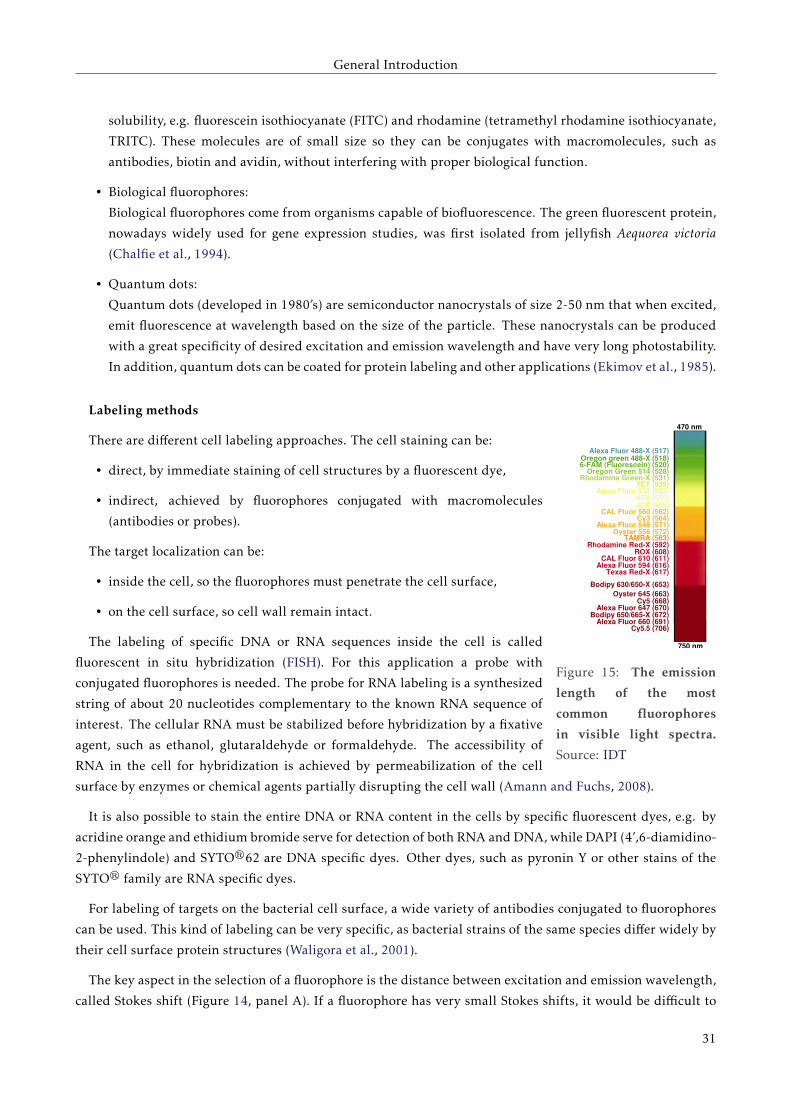
and Kaplan, 1950). Nowadays, there are numerous commercially available fluorophores (Figure 15). The
current fluorophores used for cell staining can be divided into three general groups:
• Organic dyes:
Synthetic organic dyes are, for example, fluorescein and its conjugates improving photostability and
30
General Introduction
solubility, e.g. fluorescein isothiocyanate (FITC) and rhodamine (tetramethyl rhodamine isothiocyanate,
TRITC). These molecules are of small size so they can be conjugates with macromolecules, such as
antibodies, biotin and avidin, without interfering with proper biological function.
• Biological fluorophores:
Biological fluorophores come from organisms capable of biofluorescence. The green fluorescent protein,
nowadays widely used for gene expression studies, was first isolated from jellyfish Aequorea victoria
(Chalfie et al., 1994).
• Quantum dots:
Quantum dots (developed in 1980’s) are semiconductor nanocrystals of size 2-50 nm that when excited,
emit fluorescence at wavelength based on the size of the particle. These nanocrystals can be produced
with a great specificity of desired excitation and emission wavelength and have very long photostability.
In addition, quantum dots can be coated for protein labeling and other applications (Ekimov et al., 1985).
Alexa Fluor 488-X (517)Oregon green 488-X (518)6-FAM (Fluorescein) (520)
Rhodamine Green-X (531)TET (539)
Alexa Fluor 532 (553)HEX (555)JCE (555)
CAL Fluor 560 (562)Cy3 (564)
Alexa Fluor 546 (571)Oyster 556 (572)
TAMRA (583)
Oregon Green 514 (528)
Rhodamine Red-X (592)ROX (608)
CAL Fluor 610 (611)Alexa Fluor 594 (616)
Texas Red-X (617)
Bodipy 630/650-X (653)Oyster 645 (663)
Cy5 (668)Alexa Fluor 647 (670)
Bodipy 650/665-X (672)Alexa Fluor 660 (691)
Cy5.5 (706)
750 nm
470 nm
Figure 15: The emission
length of the most
common fluorophores
in visible light spectra.
Source: IDT
Labeling methods
There are different cell labeling approaches. The cell staining can be:
• direct, by immediate staining of cell structures by a fluorescent dye,
• indirect, achieved by fluorophores conjugated with macromolecules
(antibodies or probes).
The target localization can be:
• inside the cell, so the fluorophores must penetrate the cell surface,
• on the cell surface, so cell wall remain intact.
The labeling of specific DNA or RNA sequences inside the cell is called
fluorescent in situ hybridization (FISH). For this application a probe with
conjugated fluorophores is needed. The probe for RNA labeling is a synthesized
string of about 20 nucleotides complementary to the known RNA sequence of
interest. The cellular RNA must be stabilized before hybridization by a fixative
agent, such as ethanol, glutaraldehyde or formaldehyde. The accessibility of
RNA in the cell for hybridization is achieved by permeabilization of the cell
surface by enzymes or chemical agents partially disrupting the cell wall (Amann and Fuchs, 2008).
It is also possible to stain the entire DNA or RNA content in the cells by specific fluorescent dyes, e.g. by
acridine orange and ethidium bromide serve for detection of both RNA and DNA, while DAPI (4’,6-diamidino-
2-phenylindole) and SYTOr62 are DNA specific dyes. Other dyes, such as pyronin Y or other stains of the
SYTOr family are RNA specific dyes.
For labeling of targets on the bacterial cell surface, a wide variety of antibodies conjugated to fluorophores
can be used. This kind of labeling can be very specific, as bacterial strains of the same species differ widely by
their cell surface protein structures (Waligora et al., 2001).
The key aspect in the selection of a fluorophore is the distance between excitation and emission wavelength,
called Stokes shift (Figure 14, panel A). If a fluorophore has very small Stokes shifts, it would be difficult to
31
General Introduction
distinguish the emitted fluorescence from the excitation light, because the wavelengths greatly overlap. In the
experiments with multiple fluorophore staining, the emission wavelengths of the fluorophores should not be
overlapping.
Fluorophore detection in a given experiment can be obscured by high background fluorescence, which is
mostly caused by insufficient removal of non-bound fluorescent probe or by the sample autofluorescence.
The thorough washing or reducing the concentration of fluorescent probe may help to reduce background
fluorescence.
The opposite problem is the low fluorescence which can be solved by adjusting the concentration of the
fluorophore or by applying different amplification methods, which must be, however, performed carefully in
the case of living cells, as extreme concentration of a fluorophore can induce death. Low fluorescence can be
caused also by photobleaching which is an irreversible destruction of fluorophores due to prolonged exposure
to the excitation light. If manipulation time with fluorophore detection equipment cannot be reduced, antifade
reagents protecting against photobleaching can be used or the switching to a more photostable fluorophore
should be considered.
Fluorescence activated cell sorters
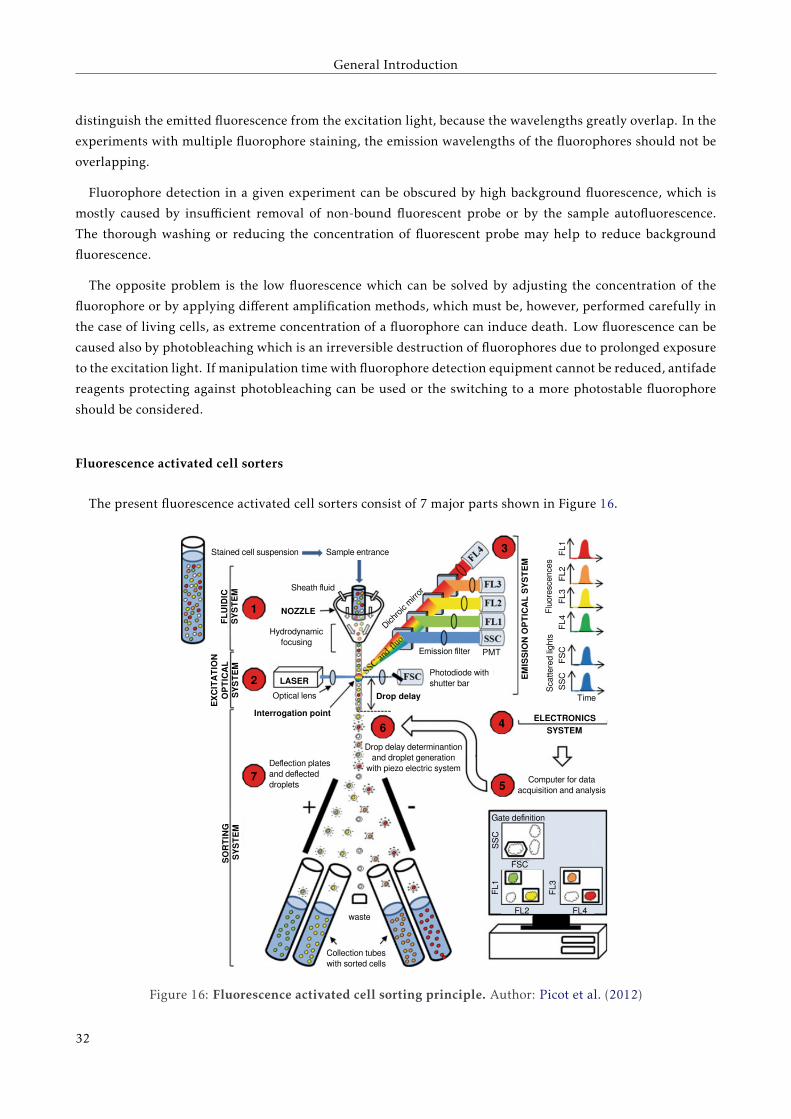
The present fluorescence activated cell sorters consist of 7 major parts shown in Figure 16.
Photodiode with shutter bar
Emission filter
Hydrodynamic focusing
Sheath fluid
Stained cell suspension Sample entrance
Dichro
ic m
irror
Optical lens
Deflection platesand deflecteddroplets
Drop delay determinantion and droplet generation
with piezo electric system
waste
Collection tubeswith sorted cells
Computer for dataacquisition and analysis
SY
ST
EM
SO
RT
ING
EX
CIT
AT
ION
OP
TIC
AL
SY
ST
EM
FL
UID
ICS
YS
TE
M
EM
ISS
ION
OP
TIC
AL
SY
ST
EM
Flu
ores
cenc
esS
catt
ered
ligh
ts
FL
1F
L2
FL
3F
L4
FS
CS
SC
Time
ELECTRONICS
SYSTEM
NOZZLE
LASER
Interrogation point
Drop delay
Gate definition
SS
CF
L1
FL2
FSC
FL
3
FL4
PMT
1
2
3
4
5
6
7
Figure 16: Fluorescence activated cell sorting principle. Author: Picot et al. (2012)
32
General Introduction
Cells in a salt buffer pass through a nozzle containing a unit for hydrodynamic focusing (Figure 16, point 1).
In the next point - in the quartz chamber or in the air at the nozzle exit - the intersection between excitation
light source and cells occurs (Figure 16, point 2). The majority of the current cytometers can be equipped with
up to 4 different excitation sources, however some can have up to ten. The excitation light sources are mainly
lasers, however some analyzers still use mercury arc-lamps for UV-excitation.
When a cell pass through the excitation source, the laser beam is refracted in all directions (Figure 16,
point 3). Light diffusion at small angles is collected in the axis of the leaser beam by a photodiode or by a
photomultiplier tube; it is called forward scatter light (FSC) and correlates with relative size of the cells. Light
diffusion at small angels (side scatter light, SSC) is collected at 90 ◦of the laser beam, as well as fluorescent
signals. SSC is a combination of diffusion, reflection and refraction caused by cell structural complexity. The
emitted light is reflected by dichroic mirrors which transmit light signals to different detectors collecting
specific fluorescence of different wavelengths. The light signal received by the detectors is amplified and
digitalized.
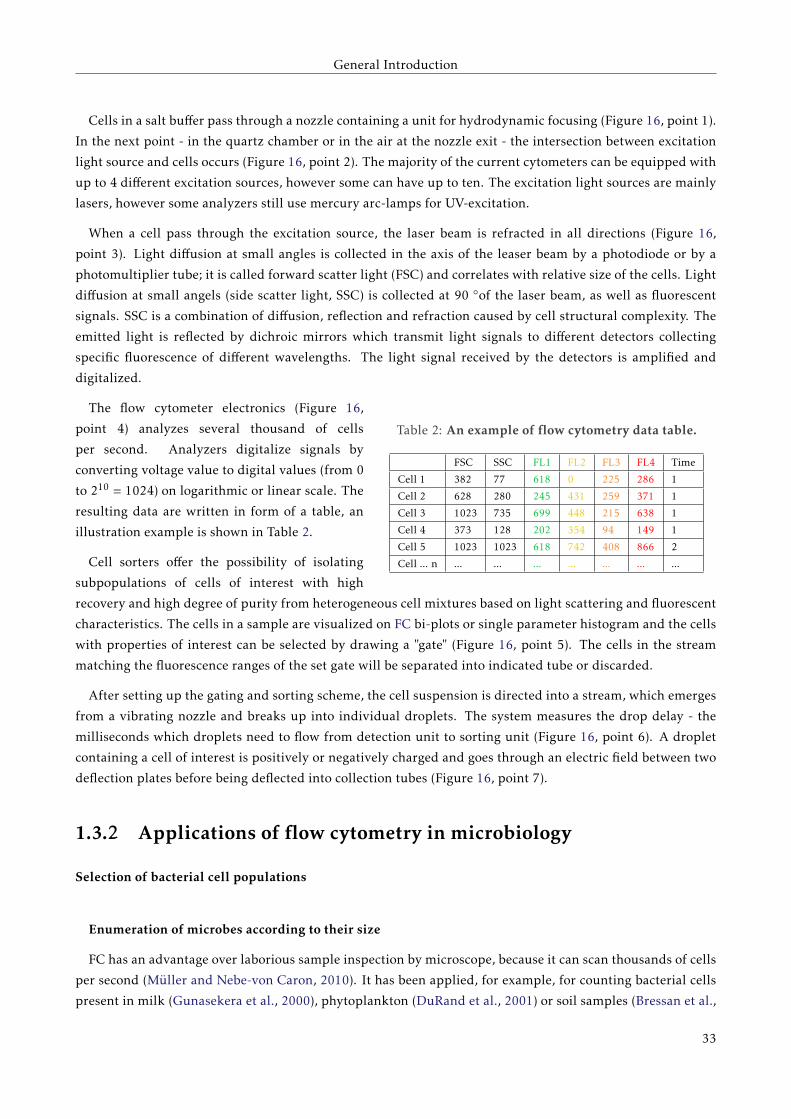
Table 2: An example of flow cytometry data table.
FSC SSC FL1 FL2 FL3 FL4 Time
Cell 1 382 77 618 0 225 286 1
Cell 2 628 280 245 431 259 371 1
Cell 3 1023 735 699 448 215 638 1
Cell 4 373 128 202 354 94 149 1
Cell 5 1023 1023 618 742 408 866 2
Cell ... n ... ... ... ... ... ... ...
The flow cytometer electronics (Figure 16,
point 4) analyzes several thousand of cells
per second. Analyzers digitalize signals by
converting voltage value to digital values (from 0
to 210 = 1024) on logarithmic or linear scale. The
resulting data are written in form of a table, an
illustration example is shown in Table 2.
Cell sorters offer the possibility of isolating
subpopulations of cells of interest with high
recovery and high degree of purity from heterogeneous cell mixtures based on light scattering and fluorescent
characteristics. The cells in a sample are visualized on FC bi-plots or single parameter histogram and the cells
with properties of interest can be selected by drawing a "gate" (Figure 16, point 5). The cells in the stream
matching the fluorescence ranges of the set gate will be separated into indicated tube or discarded.
After setting up the gating and sorting scheme, the cell suspension is directed into a stream, which emerges
from a vibrating nozzle and breaks up into individual droplets. The system measures the drop delay - the
milliseconds which droplets need to flow from detection unit to sorting unit (Figure 16, point 6). A droplet
containing a cell of interest is positively or negatively charged and goes through an electric field between two
deflection plates before being deflected into collection tubes (Figure 16, point 7).
1.3.2 Applications of flow cytometry in microbiology
Selection of bacterial cell populations
Enumeration of microbes according to their size
FC has an advantage over laborious sample inspection by microscope, because it can scan thousands of cells
per second (Müller and Nebe-von Caron, 2010). It has been applied, for example, for counting bacterial cells
present in milk (Gunasekera et al., 2000), phytoplankton (DuRand et al., 2001) or soil samples (Bressan et al.,
33
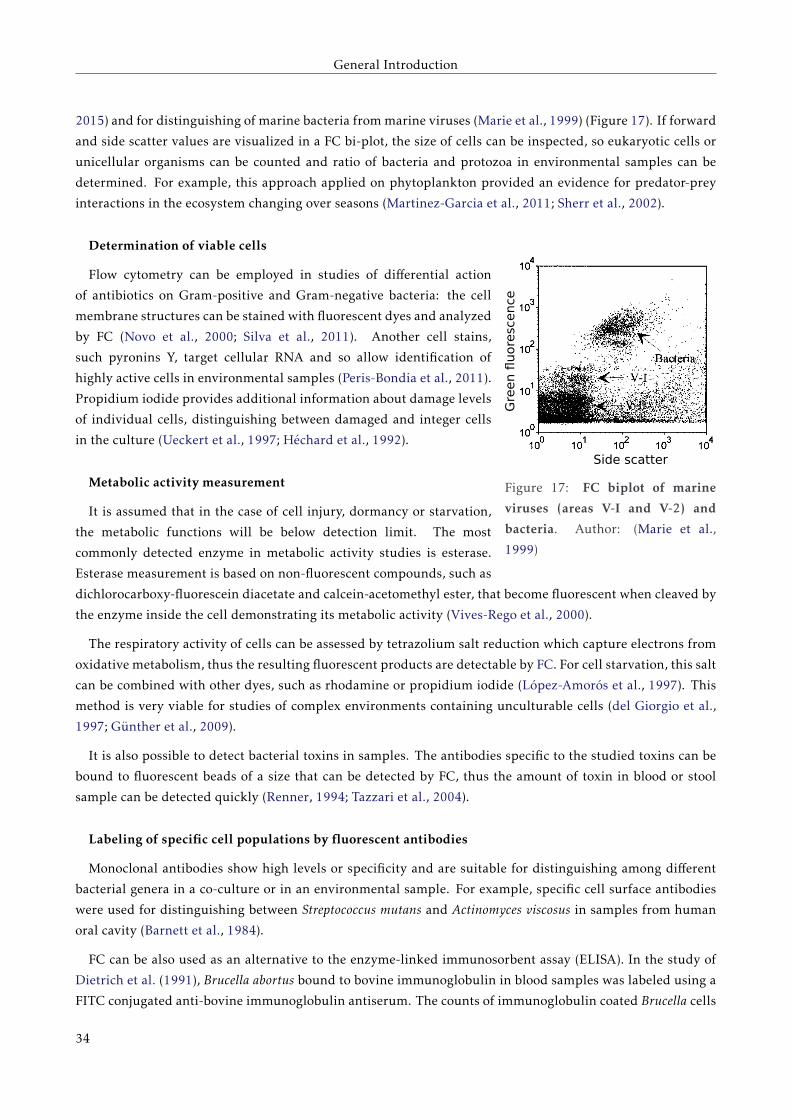
General Introduction
2015) and for distinguishing of marine bacteria from marine viruses (Marie et al., 1999) (Figure 17). If forward
and side scatter values are visualized in a FC bi-plot, the size of cells can be inspected, so eukaryotic cells or
unicellular organisms can be counted and ratio of bacteria and protozoa in environmental samples can be
determined. For example, this approach applied on phytoplankton provided an evidence for predator-prey
interactions in the ecosystem changing over seasons (Martinez-Garcia et al., 2011; Sherr et al., 2002).
Gre
en fl
uore
scen
ce
Side scatter
Figure 17: FC biplot of marine
viruses (areas V-I and V-2) and
bacteria. Author: (Marie et al.,
1999)
Determination of viable cells
Flow cytometry can be employed in studies of differential action
of antibiotics on Gram-positive and Gram-negative bacteria: the cell
membrane structures can be stained with fluorescent dyes and analyzed
by FC (Novo et al., 2000; Silva et al., 2011). Another cell stains,
such pyronins Y, target cellular RNA and so allow identification of
highly active cells in environmental samples (Peris-Bondia et al., 2011).
Propidium iodide provides additional information about damage levels
of individual cells, distinguishing between damaged and integer cells
in the culture (Ueckert et al., 1997; Héchard et al., 1992).
Metabolic activity measurement
It is assumed that in the case of cell injury, dormancy or starvation,
the metabolic functions will be below detection limit. The most
commonly detected enzyme in metabolic activity studies is esterase.
Esterase measurement is based on non-fluorescent compounds, such as
dichlorocarboxy-fluorescein diacetate and calcein-acetomethyl ester, that become fluorescent when cleaved by
the enzyme inside the cell demonstrating its metabolic activity (Vives-Rego et al., 2000).
The respiratory activity of cells can be assessed by tetrazolium salt reduction which capture electrons from
oxidative metabolism, thus the resulting fluorescent products are detectable by FC. For cell starvation, this salt
can be combined with other dyes, such as rhodamine or propidium iodide (López-Amorós et al., 1997). This
method is very viable for studies of complex environments containing unculturable cells (del Giorgio et al.,
1997; Günther et al., 2009).
It is also possible to detect bacterial toxins in samples. The antibodies specific to the studied toxins can be
bound to fluorescent beads of a size that can be detected by FC, thus the amount of toxin in blood or stool
sample can be detected quickly (Renner, 1994; Tazzari et al., 2004).
Labeling of specific cell populations by fluorescent antibodies
Monoclonal antibodies show high levels or specificity and are suitable for distinguishing among different
bacterial genera in a co-culture or in an environmental sample. For example, specific cell surface antibodies
were used for distinguishing between Streptococcus mutans and Actinomyces viscosus in samples from human
oral cavity (Barnett et al., 1984).
FC can be also used as an alternative to the enzyme-linked immunosorbent assay (ELISA). In the study of
Dietrich et al. (1991), Brucella abortus bound to bovine immunoglobulin in blood samples was labeled using a
FITC conjugated anti-bovine immunoglobulin antiserum. The counts of immunoglobulin coated Brucella cells
34

General Introduction
were compared with non coated Brucella cells, thus the level of immunological responses was determined by
direct visualization of immunologically recognized bacterial cells.
The labeling through antibodies with intracellular targets can be also performed. These kind of assays are
commonly used for studies of gene expression (Vestvik et al., 2013).
The labeling by specific antibodies is more time effective and more specific than classical culture methods.
The most difficult task in cell labeling through fluorescent antibodies is the laboratory preparation of
lipopolysachharide monoclonal antibodies specific for cell surface of the bacterial species of choice (Evans
et al., 1990).
Labeling of specific cell populations by fluorescent oligonucleotides
The gene for 16S rRNA subunit provides high level of conservation, which made it especially useful for
recognition of specific bacteria in FC (Amann and Fuchs, 2008). However, the selection of 16S rRNA probes
for FISH might be tricky, as the ribosome contains areas which are not equally accessible along the whole
length of the sequence (Figure 18).
Class I: 81-100%
Class II: 61-80%
Class III: 41-60%
Class IV: 21-40%
Class V: 6-20 %
Class VI: 0-5%
50
100
150
200
250
300
350
400
450 500550
600
650
700
750
800
850
900
950
1000
1050
1100
1150
1200
1250
1300
13501400
1450
1500
15'
3'1542
24
26
28
217
3
13
15
50 48
47
43
25
23
22 21
27
29
1918 20
1
164
5
6
7
12
14
EUB338
11
8
9
10
49
33
3231
30
34
36
3738
41 40
39
4244
45
35
46
Figure 18: Distribution
of relative fluorescence
intensities of oligonucleo-
tide probes on a 16S rRNA
secondary structure model.
It is standardized to that of
the brightest probe Eco1482
and divided into brightness
classes (I-VI). The standard
bacterial probe Eub338 is
also shown. Black numbers
indicate structure helix and
blue number nucleotide
position of the gene. Author:
Fuchs et al. (1998)
35
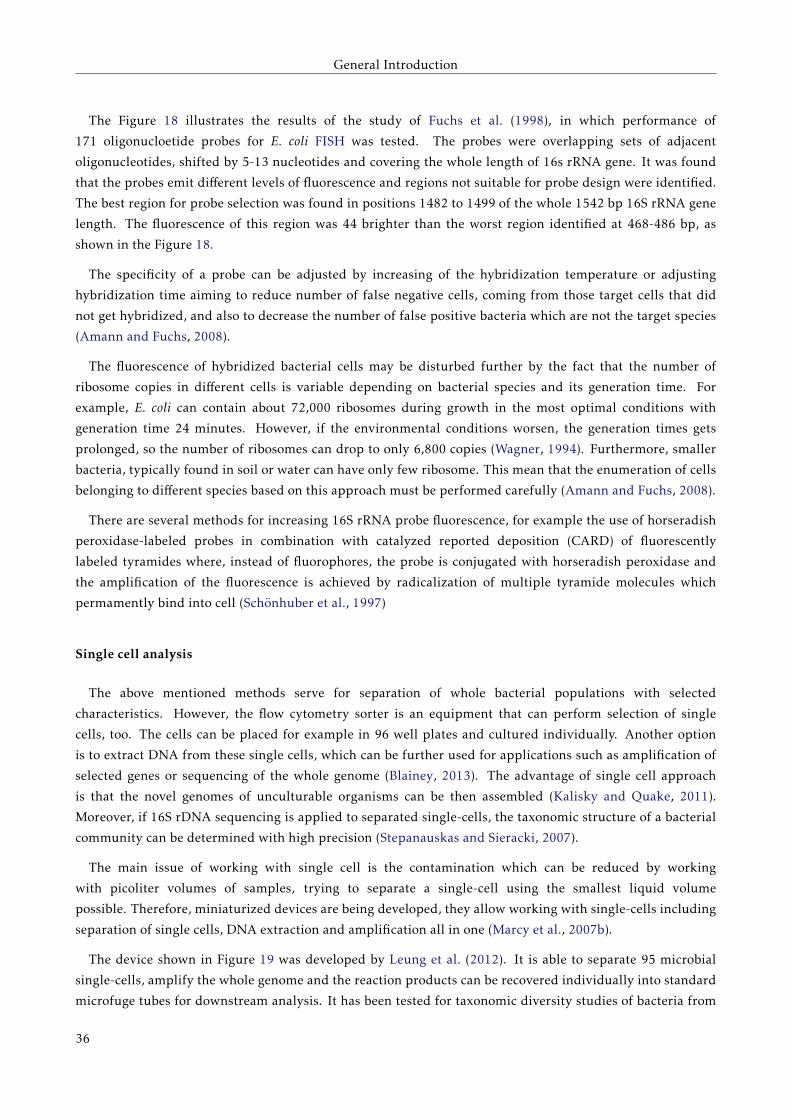
General Introduction
The Figure 18 illustrates the results of the study of Fuchs et al. (1998), in which performance of
171 oligonucloetide probes for E. coli FISH was tested. The probes were overlapping sets of adjacent
oligonucleotides, shifted by 5-13 nucleotides and covering the whole length of 16s rRNA gene. It was found
that the probes emit different levels of fluorescence and regions not suitable for probe design were identified.
The best region for probe selection was found in positions 1482 to 1499 of the whole 1542 bp 16S rRNA gene
length. The fluorescence of this region was 44 brighter than the worst region identified at 468-486 bp, as
shown in the Figure 18.
The specificity of a probe can be adjusted by increasing of the hybridization temperature or adjusting
hybridization time aiming to reduce number of false negative cells, coming from those target cells that did
not get hybridized, and also to decrease the number of false positive bacteria which are not the target species
(Amann and Fuchs, 2008).
The fluorescence of hybridized bacterial cells may be disturbed further by the fact that the number of
ribosome copies in different cells is variable depending on bacterial species and its generation time. For
example, E. coli can contain about 72,000 ribosomes during growth in the most optimal conditions with
generation time 24 minutes. However, if the environmental conditions worsen, the generation times gets
prolonged, so the number of ribosomes can drop to only 6,800 copies (Wagner, 1994). Furthermore, smaller
bacteria, typically found in soil or water can have only few ribosome. This mean that the enumeration of cells
belonging to different species based on this approach must be performed carefully (Amann and Fuchs, 2008).
There are several methods for increasing 16S rRNA probe fluorescence, for example the use of horseradish
peroxidase-labeled probes in combination with catalyzed reported deposition (CARD) of fluorescently
labeled tyramides where, instead of fluorophores, the probe is conjugated with horseradish peroxidase and
the amplification of the fluorescence is achieved by radicalization of multiple tyramide molecules which
permamently bind into cell (Schönhuber et al., 1997)
Single cell analysis
The above mentioned methods serve for separation of whole bacterial populations with selected
characteristics. However, the flow cytometry sorter is an equipment that can perform selection of single
cells, too. The cells can be placed for example in 96 well plates and cultured individually. Another option
is to extract DNA from these single cells, which can be further used for applications such as amplification of
selected genes or sequencing of the whole genome (Blainey, 2013). The advantage of single cell approach
is that the novel genomes of unculturable organisms can be then assembled (Kalisky and Quake, 2011).
Moreover, if 16S rDNA sequencing is applied to separated single-cells, the taxonomic structure of a bacterial
community can be determined with high precision (Stepanauskas and Sieracki, 2007).
The main issue of working with single cell is the contamination which can be reduced by working
with picoliter volumes of samples, trying to separate a single-cell using the smallest liquid volume
possible. Therefore, miniaturized devices are being developed, they allow working with single-cells including
separation of single cells, DNA extraction and amplification all in one (Marcy et al., 2007b).
The device shown in Figure 19 was developed by Leung et al. (2012). It is able to separate 95 microbial
single-cells, amplify the whole genome and the reaction products can be recovered individually into standard
microfuge tubes for downstream analysis. It has been tested for taxonomic diversity studies of bacteria from
36
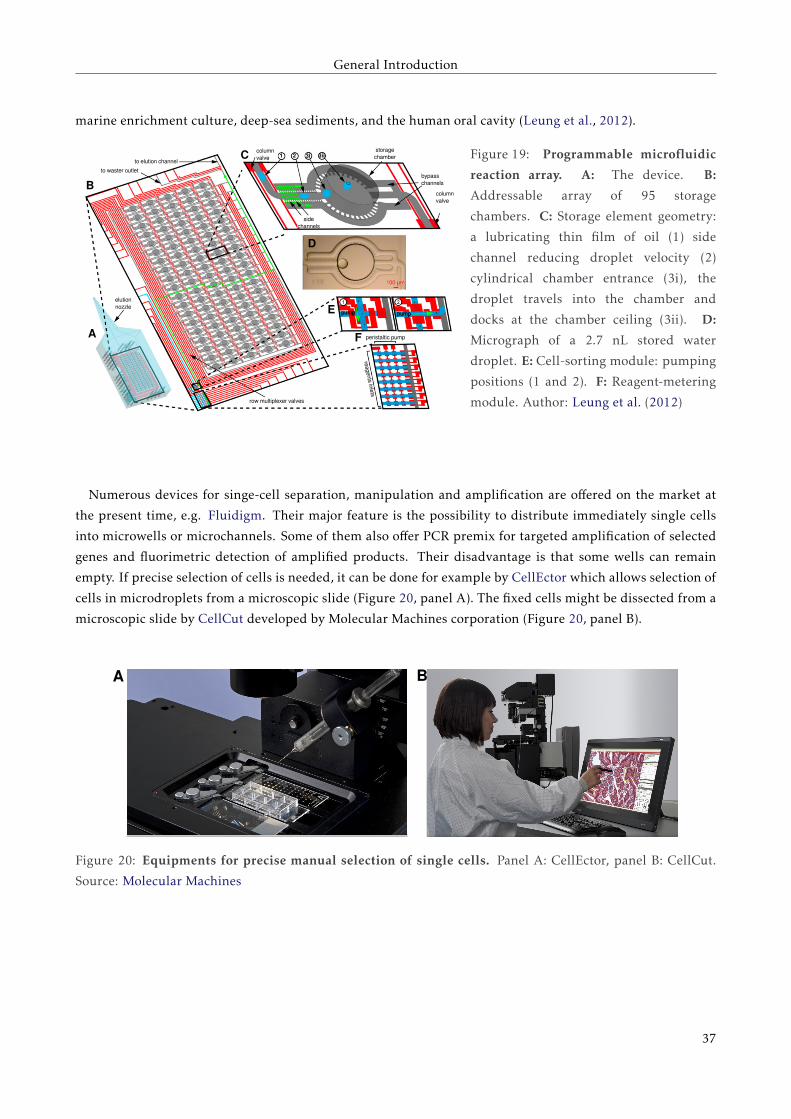
General Introduction
marine enrichment culture, deep-sea sediments, and the human oral cavity (Leung et al., 2012).
to elution channel
to waster outlet
columnvalve
storage chamber
bypasschannels
columnvalve
side channels
pump pump
peristaltic pump
reagents inlets
row multiplexer valves
elutionnozzle
A
B
C
E
F
D
1 2 3i 3ii Figure 19: Programmable microfluidic
reaction array. A: The device. B:
Addressable array of 95 storage
chambers. C: Storage element geometry:
a lubricating thin film of oil (1) side
channel reducing droplet velocity (2)
cylindrical chamber entrance (3i), the
droplet travels into the chamber and
docks at the chamber ceiling (3ii). D:
Micrograph of a 2.7 nL stored water
droplet. E: Cell-sorting module: pumping
positions (1 and 2). F: Reagent-metering
module. Author: Leung et al. (2012)
Numerous devices for singe-cell separation, manipulation and amplification are offered on the market at
the present time, e.g. Fluidigm. Their major feature is the possibility to distribute immediately single cells
into microwells or microchannels. Some of them also offer PCR premix for targeted amplification of selected
genes and fluorimetric detection of amplified products. Their disadvantage is that some wells can remain
empty. If precise selection of cells is needed, it can be done for example by CellEctor which allows selection of
cells in microdroplets from a microscopic slide (Figure 20, panel A). The fixed cells might be dissected from a
microscopic slide by CellCut developed by Molecular Machines corporation (Figure 20, panel B).
A B
Figure 20: Equipments for precise manual selection of single cells. Panel A: CellEctor, panel B: CellCut.
Source: Molecular Machines
37


Chapter2Objectives of the thesis

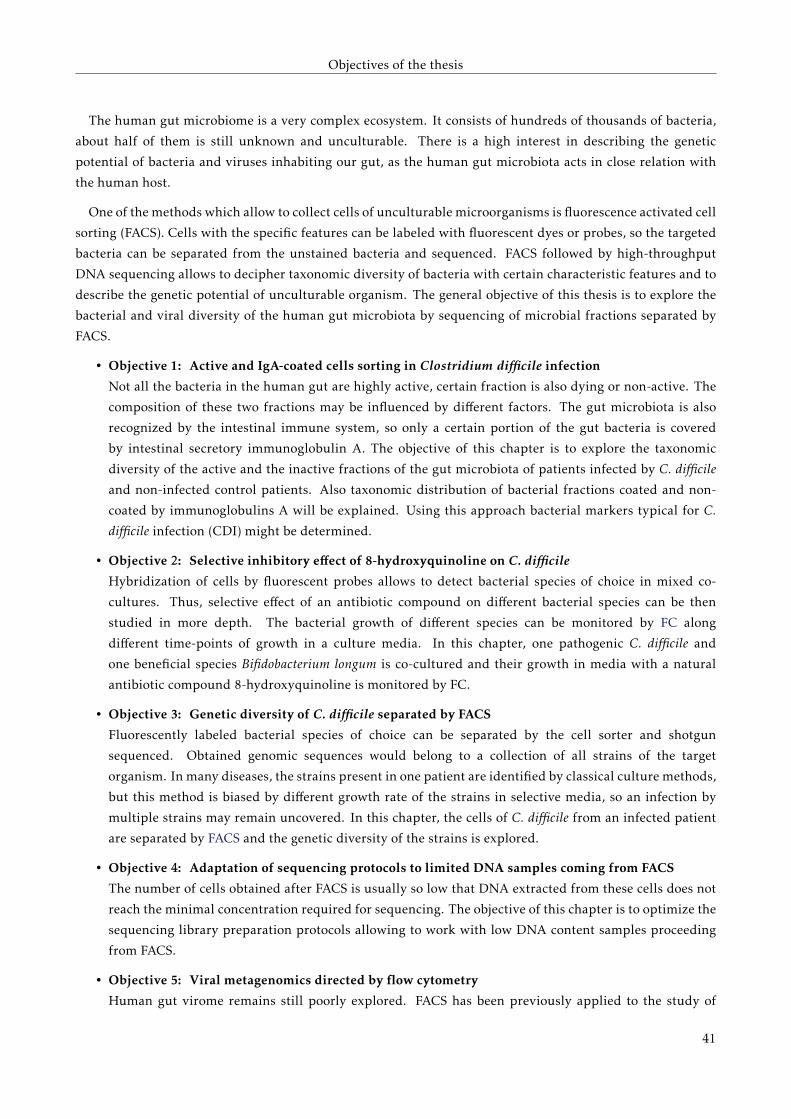
Objectives of the thesis
The human gut microbiome is a very complex ecosystem. It consists of hundreds of thousands of bacteria,
about half of them is still unknown and unculturable. There is a high interest in describing the genetic
potential of bacteria and viruses inhabiting our gut, as the human gut microbiota acts in close relation with
the human host.
One of the methods which allow to collect cells of unculturable microorganisms is fluorescence activated cell
sorting (FACS). Cells with the specific features can be labeled with fluorescent dyes or probes, so the targeted
bacteria can be separated from the unstained bacteria and sequenced. FACS followed by high-throughput
DNA sequencing allows to decipher taxonomic diversity of bacteria with certain characteristic features and to
describe the genetic potential of unculturable organism. The general objective of this thesis is to explore the
bacterial and viral diversity of the human gut microbiota by sequencing of microbial fractions separated by
FACS.
• Objective 1: Active and IgA-coated cells sorting in Clostridium difficile infection
Not all the bacteria in the human gut are highly active, certain fraction is also dying or non-active. The
composition of these two fractions may be influenced by different factors. The gut microbiota is also
recognized by the intestinal immune system, so only a certain portion of the gut bacteria is covered
by intestinal secretory immunoglobulin A. The objective of this chapter is to explore the taxonomic
diversity of the active and the inactive fractions of the gut microbiota of patients infected by C. difficile
and non-infected control patients. Also taxonomic distribution of bacterial fractions coated and non-
coated by immunoglobulins A will be explained. Using this approach bacterial markers typical for C.
difficile infection (CDI) might be determined.
• Objective 2: Selective inhibitory effect of 8-hydroxyquinoline on C. difficile
Hybridization of cells by fluorescent probes allows to detect bacterial species of choice in mixed co-
cultures. Thus, selective effect of an antibiotic compound on different bacterial species can be then
studied in more depth. The bacterial growth of different species can be monitored by FC along
different time-points of growth in a culture media. In this chapter, one pathogenic C. difficile and
one beneficial species Bifidobacterium longum is co-cultured and their growth in media with a natural
antibiotic compound 8-hydroxyquinoline is monitored by FC.
• Objective 3: Genetic diversity of C. difficile separated by FACS
Fluorescently labeled bacterial species of choice can be separated by the cell sorter and shotgun
sequenced. Obtained genomic sequences would belong to a collection of all strains of the target
organism. In many diseases, the strains present in one patient are identified by classical culture methods,
but this method is biased by different growth rate of the strains in selective media, so an infection by
multiple strains may remain uncovered. In this chapter, the cells of C. difficile from an infected patient
are separated by FACS and the genetic diversity of the strains is explored.
• Objective 4: Adaptation of sequencing protocols to limited DNA samples coming from FACS
The number of cells obtained after FACS is usually so low that DNA extracted from these cells does not
reach the minimal concentration required for sequencing. The objective of this chapter is to optimize the
sequencing library preparation protocols allowing to work with low DNA content samples proceeding
from FACS.
• Objective 5: Viral metagenomics directed by flow cytometry
Human gut virome remains still poorly explored. FACS has been previously applied to the study of
41

Objectives of the thesis
marine viral populations, but it has not been used for separation of viruses from human fecal samples
yet. In this chapter, the viral sample previously filtered through 0.2 µm pores will be enriched. Selected
viral particles will be sequenced on the 454 platform and annotated.
42
Chapter3Active and IgA-coated cells sorting in
Clostridium difficile infection
Associated original articles:
Džunková, M., Moya, A., Vázquez-Castellanos, J.F., Artacho, A., Chen, X., Kelly, C., D’Auria: Active and
secretory IgA-coated bacterial fractions explain dysbiosis patterns in Clostridium difficile infection. Under
revision.
Simón-Soro, Á., D’Auria, G., Collado, M.C., Džunková, M., Culshaw, S., Mira, A. (2015): Revealing microbial
recognition by specific antibodies. BMC Microbiology15: 132.
D’Auria, G., Peris-Bondia, F., Džunková, M., Mira, A., Collado, M.C., Latorre, A., Moya, A. (2013): Active
and secreted IgA-coated bacterial fractions from the human gut reveal an under-represented microbiota core.
Scientific Reports 3: 3515.

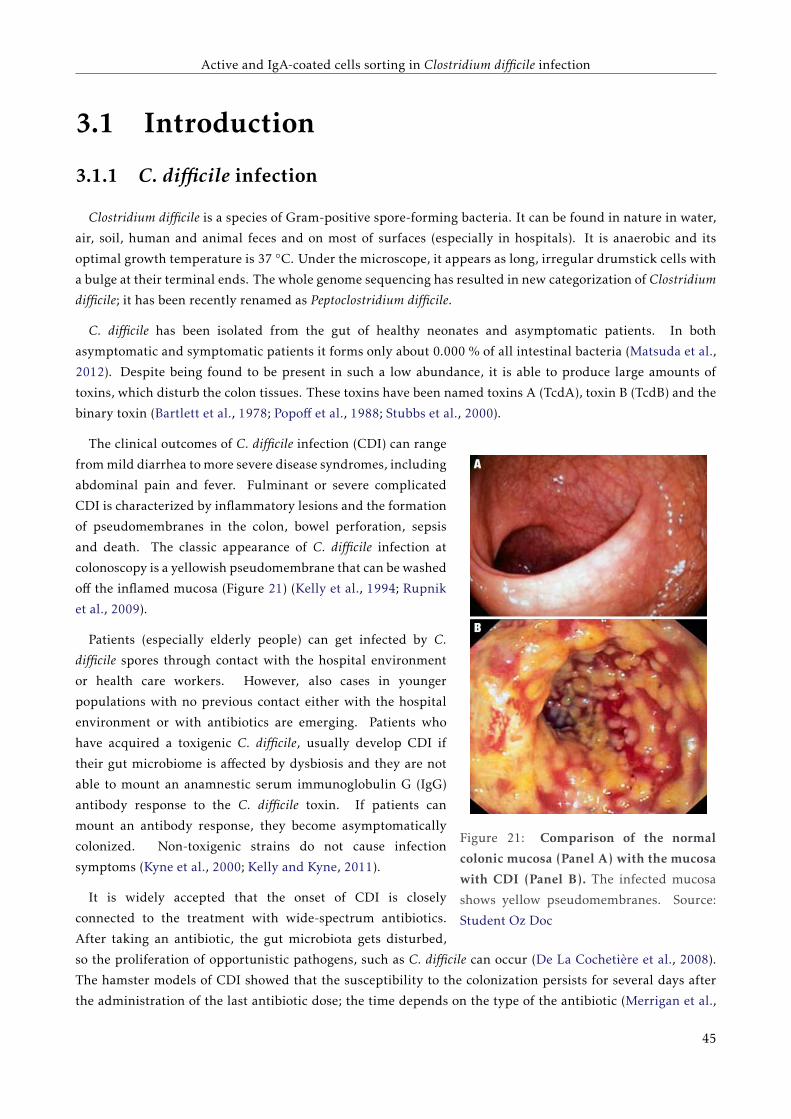
Active and IgA-coated cells sorting in Clostridium difficile infection
3.1 Introduction
3.1.1 C. difficile infection
Clostridium difficile is a species of Gram-positive spore-forming bacteria. It can be found in nature in water,
air, soil, human and animal feces and on most of surfaces (especially in hospitals). It is anaerobic and its
optimal growth temperature is 37 ◦C. Under the microscope, it appears as long, irregular drumstick cells with
a bulge at their terminal ends. The whole genome sequencing has resulted in new categorization of Clostridium
difficile; it has been recently renamed as Peptoclostridium difficile.
C. difficile has been isolated from the gut of healthy neonates and asymptomatic patients. In both
asymptomatic and symptomatic patients it forms only about 0.000 % of all intestinal bacteria (Matsuda et al.,
2012). Despite being found to be present in such a low abundance, it is able to produce large amounts of
toxins, which disturb the colon tissues. These toxins have been named toxins A (TcdA), toxin B (TcdB) and the
binary toxin (Bartlett et al., 1978; Popoff et al., 1988; Stubbs et al., 2000).
Figure 21: Comparison of the normal
colonic mucosa (Panel A) with the mucosa
with CDI (Panel B). The infected mucosa
shows yellow pseudomembranes. Source:
Student Oz Doc
The clinical outcomes of C. difficile infection (CDI) can range
from mild diarrhea to more severe disease syndromes, including
abdominal pain and fever. Fulminant or severe complicated
CDI is characterized by inflammatory lesions and the formation
of pseudomembranes in the colon, bowel perforation, sepsis
and death. The classic appearance of C. difficile infection at
colonoscopy is a yellowish pseudomembrane that can be washed
off the inflamed mucosa (Figure 21) (Kelly et al., 1994; Rupnik
et al., 2009).
Patients (especially elderly people) can get infected by C.
difficile spores through contact with the hospital environment
or health care workers. However, also cases in younger
populations with no previous contact either with the hospital
environment or with antibiotics are emerging. Patients who
have acquired a toxigenic C. difficile, usually develop CDI if
their gut microbiome is affected by dysbiosis and they are not
able to mount an anamnestic serum immunoglobulin G (IgG)
antibody response to the C. difficile toxin. If patients can
mount an antibody response, they become asymptomatically
colonized. Non-toxigenic strains do not cause infection
symptoms (Kyne et al., 2000; Kelly and Kyne, 2011).
It is widely accepted that the onset of CDI is closely
connected to the treatment with wide-spectrum antibiotics.
After taking an antibiotic, the gut microbiota gets disturbed,
so the proliferation of opportunistic pathogens, such as C. difficile can occur (De La Cochetière et al., 2008).
The hamster models of CDI showed that the susceptibility to the colonization persists for several days after
the administration of the last antibiotic dose; the time depends on the type of the antibiotic (Merrigan et al.,
45
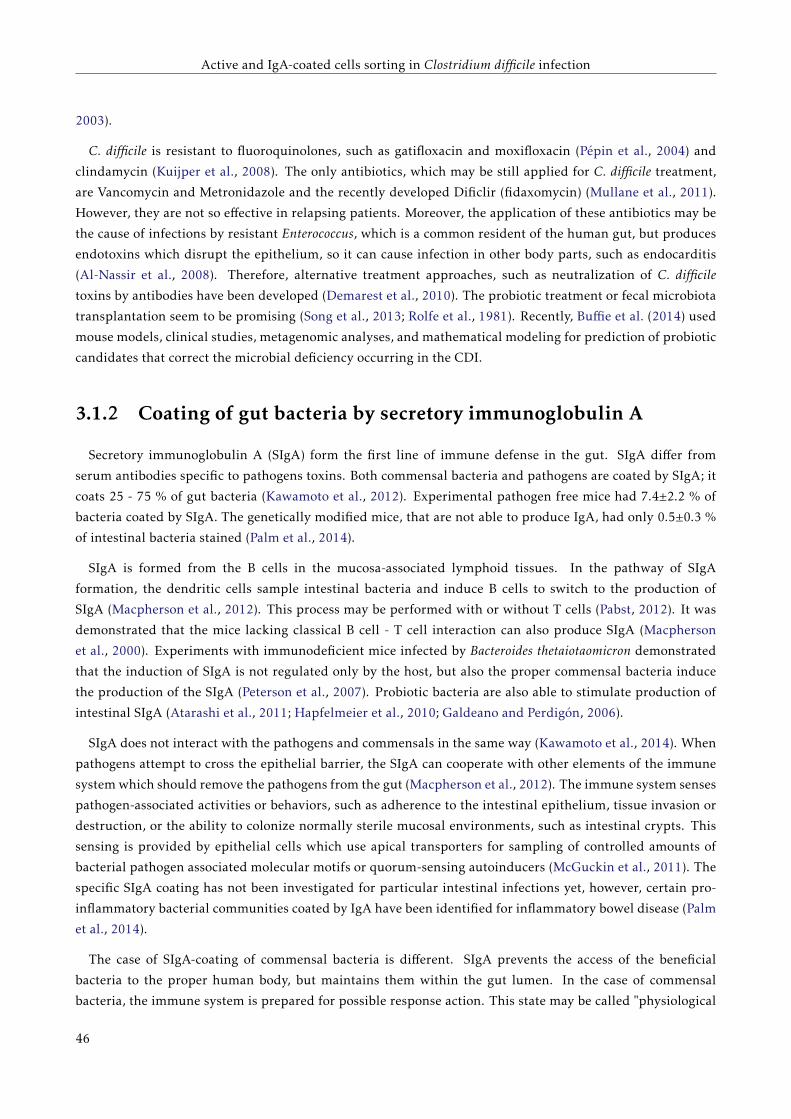
Active and IgA-coated cells sorting in Clostridium difficile infection
2003).
C. difficile is resistant to fluoroquinolones, such as gatifloxacin and moxifloxacin (Pépin et al., 2004) and
clindamycin (Kuijper et al., 2008). The only antibiotics, which may be still applied for C. difficile treatment,
are Vancomycin and Metronidazole and the recently developed Dificlir (fidaxomycin) (Mullane et al., 2011).
However, they are not so effective in relapsing patients. Moreover, the application of these antibiotics may be
the cause of infections by resistant Enterococcus, which is a common resident of the human gut, but produces
endotoxins which disrupt the epithelium, so it can cause infection in other body parts, such as endocarditis
(Al-Nassir et al., 2008). Therefore, alternative treatment approaches, such as neutralization of C. difficile
toxins by antibodies have been developed (Demarest et al., 2010). The probiotic treatment or fecal microbiota
transplantation seem to be promising (Song et al., 2013; Rolfe et al., 1981). Recently, Buffie et al. (2014) used
mouse models, clinical studies, metagenomic analyses, and mathematical modeling for prediction of probiotic
candidates that correct the microbial deficiency occurring in the CDI.
3.1.2 Coating of gut bacteria by secretory immunoglobulin A
Secretory immunoglobulin A (SIgA) form the first line of immune defense in the gut. SIgA differ from
serum antibodies specific to pathogens toxins. Both commensal bacteria and pathogens are coated by SIgA; it
coats 25 - 75 % of gut bacteria (Kawamoto et al., 2012). Experimental pathogen free mice had 7.4±2.2 % of
bacteria coated by SIgA. The genetically modified mice, that are not able to produce IgA, had only 0.5±0.3 %
of intestinal bacteria stained (Palm et al., 2014).
SIgA is formed from the B cells in the mucosa-associated lymphoid tissues. In the pathway of SIgA
formation, the dendritic cells sample intestinal bacteria and induce B cells to switch to the production of
SIgA (Macpherson et al., 2012). This process may be performed with or without T cells (Pabst, 2012). It was
demonstrated that the mice lacking classical B cell - T cell interaction can also produce SIgA (Macpherson
et al., 2000). Experiments with immunodeficient mice infected by Bacteroides thetaiotaomicron demonstrated
that the induction of SIgA is not regulated only by the host, but also the proper commensal bacteria induce
the production of the SIgA (Peterson et al., 2007). Probiotic bacteria are also able to stimulate production of
intestinal SIgA (Atarashi et al., 2011; Hapfelmeier et al., 2010; Galdeano and Perdigón, 2006).
SIgA does not interact with the pathogens and commensals in the same way (Kawamoto et al., 2014). When
pathogens attempt to cross the epithelial barrier, the SIgA can cooperate with other elements of the immune
system which should remove the pathogens from the gut (Macpherson et al., 2012). The immune system senses
pathogen-associated activities or behaviors, such as adherence to the intestinal epithelium, tissue invasion or
destruction, or the ability to colonize normally sterile mucosal environments, such as intestinal crypts. This
sensing is provided by epithelial cells which use apical transporters for sampling of controlled amounts of
bacterial pathogen associated molecular motifs or quorum-sensing autoinducers (McGuckin et al., 2011). The
specific SIgA coating has not been investigated for particular intestinal infections yet, however, certain pro-
inflammatory bacterial communities coated by IgA have been identified for inflammatory bowel disease (Palm
et al., 2014).
The case of SIgA-coating of commensal bacteria is different. SIgA prevents the access of the beneficial
bacteria to the proper human body, but maintains them within the gut lumen. In the case of commensal
bacteria, the immune system is prepared for possible response action. This state may be called "physiological
46
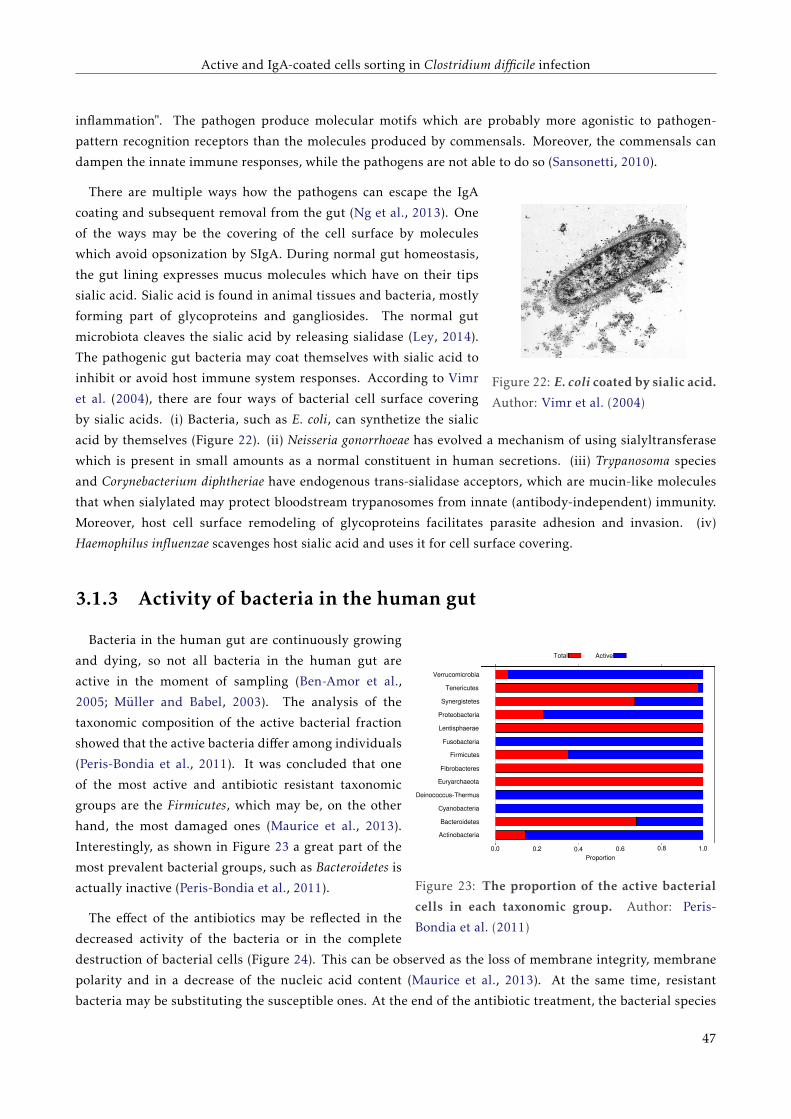
Active and IgA-coated cells sorting in Clostridium difficile infection
inflammation". The pathogen produce molecular motifs which are probably more agonistic to pathogen-
pattern recognition receptors than the molecules produced by commensals. Moreover, the commensals can
dampen the innate immune responses, while the pathogens are not able to do so (Sansonetti, 2010).
Figure 22: E. coli coated by sialic acid.
Author: Vimr et al. (2004)
There are multiple ways how the pathogens can escape the IgA
coating and subsequent removal from the gut (Ng et al., 2013). One
of the ways may be the covering of the cell surface by molecules
which avoid opsonization by SIgA. During normal gut homeostasis,
the gut lining expresses mucus molecules which have on their tips
sialic acid. Sialic acid is found in animal tissues and bacteria, mostly
forming part of glycoproteins and gangliosides. The normal gut
microbiota cleaves the sialic acid by releasing sialidase (Ley, 2014).
The pathogenic gut bacteria may coat themselves with sialic acid to
inhibit or avoid host immune system responses. According to Vimr
et al. (2004), there are four ways of bacterial cell surface covering
by sialic acids. (i) Bacteria, such as E. coli, can synthetize the sialic
acid by themselves (Figure 22). (ii) Neisseria gonorrhoeae has evolved a mechanism of using sialyltransferase
which is present in small amounts as a normal constituent in human secretions. (iii) Trypanosoma species
and Corynebacterium diphtheriae have endogenous trans-sialidase acceptors, which are mucin-like molecules
that when sialylated may protect bloodstream trypanosomes from innate (antibody-independent) immunity.
Moreover, host cell surface remodeling of glycoproteins facilitates parasite adhesion and invasion. (iv)
Haemophilus influenzae scavenges host sialic acid and uses it for cell surface covering.
3.1.3 Activity of bacteria in the human gut
Verrucomicrobia
Tenericutes
Synergistetes
Proteobacteria
Lentisphaerae
Fusobacteria
Firmicutes
Fibrobacteres
Euryarchaeota
Deinococcus-Thermus
Cyanobacteria
Bacteroidetes
Actinobacteria
Total Active
Proportion
0.0 0.2 0.4 0.6 0.8 1.0
Figure 23: The proportion of the active bacterial
cells in each taxonomic group. Author: Peris-
Bondia et al. (2011)
Bacteria in the human gut are continuously growing
and dying, so not all bacteria in the human gut are
active in the moment of sampling (Ben-Amor et al.,
2005; Müller and Babel, 2003). The analysis of the
taxonomic composition of the active bacterial fraction
showed that the active bacteria differ among individuals
(Peris-Bondia et al., 2011). It was concluded that one
of the most active and antibiotic resistant taxonomic
groups are the Firmicutes, which may be, on the other
hand, the most damaged ones (Maurice et al., 2013).
Interestingly, as shown in Figure 23 a great part of the
most prevalent bacterial groups, such as Bacteroidetes is
actually inactive (Peris-Bondia et al., 2011).
The effect of the antibiotics may be reflected in the
decreased activity of the bacteria or in the complete
destruction of bacterial cells (Figure 24). This can be observed as the loss of membrane integrity, membrane
polarity and in a decrease of the nucleic acid content (Maurice et al., 2013). At the same time, resistant
bacteria may be substituting the susceptible ones. At the end of the antibiotic treatment, the bacterial species
47
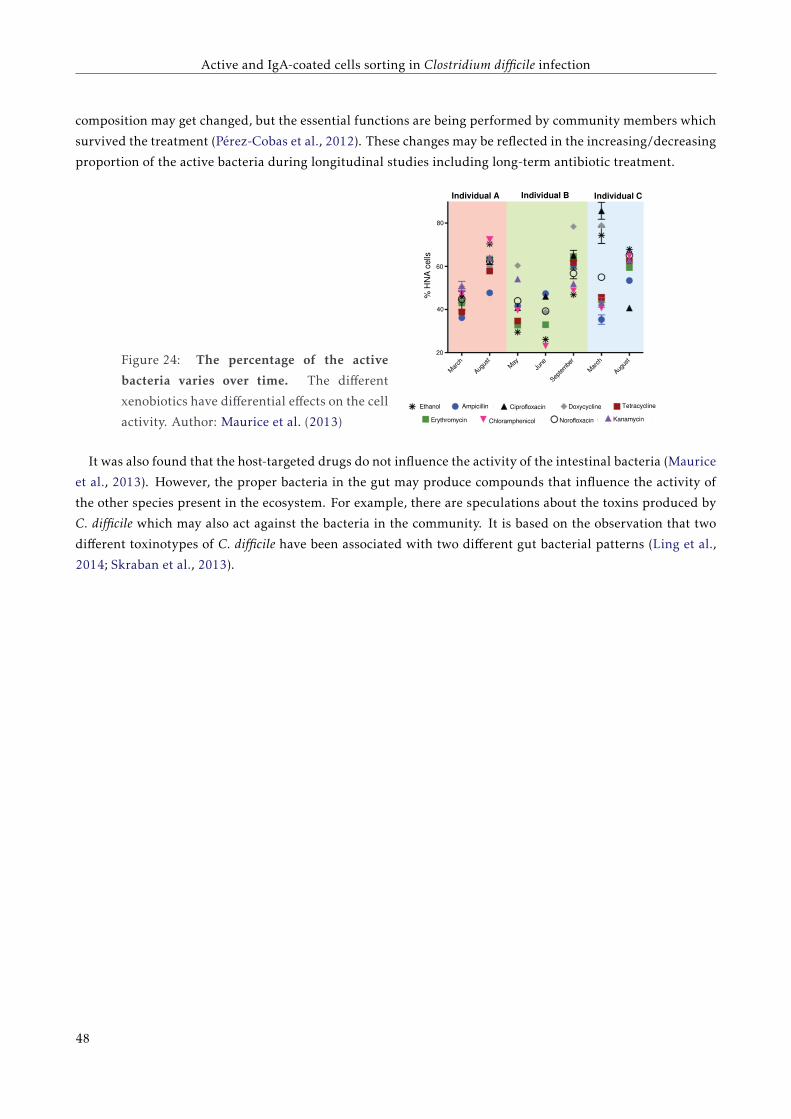
Active and IgA-coated cells sorting in Clostridium difficile infection
composition may get changed, but the essential functions are being performed by community members which
survived the treatment (Pérez-Cobas et al., 2012). These changes may be reflected in the increasing/decreasing
proportion of the active bacteria during longitudinal studies including long-term antibiotic treatment.
Figure 24: The percentage of the active
bacteria varies over time. The different
xenobiotics have differential effects on the cell
activity. Author: Maurice et al. (2013)Ethanol Ampicillin Ciprofloxacin Doxycycline Tetracycline
KanamycinNorofloxacinChloramphenicolErythromycin
Individual A Individual B Individual C
Marc
h
AugustM
ayJu
ne
Septem
ber
Marc
h
August
% H
NA
cel
ls
80
60
40
20
It was also found that the host-targeted drugs do not influence the activity of the intestinal bacteria (Maurice
et al., 2013). However, the proper bacteria in the gut may produce compounds that influence the activity of
the other species present in the ecosystem. For example, there are speculations about the toxins produced by
C. difficile which may also act against the bacteria in the community. It is based on the observation that two
different toxinotypes of C. difficile have been associated with two different gut bacterial patterns (Ling et al.,
2014; Skraban et al., 2013).
48
Active and IgA-coated cells sorting in Clostridium difficile infection
3.2 ObjectivesCDI is associated with the use of the high-spectrum antibiotics, as it possesses several antibiotic resistant
genes and is able to benefit from the metabolic changes occurring in the microbiome disrupted by antibiotics.
In the daily clinical practice multiple combinations of antibiotics are applied to the patients and they often
suffer from additional intestinal complications as well, so the microbial composition of the patient’s gut can
be disrupted by multiple additional factors. There have been attempts to define the taxonomic composition of
the gut microbiota typical for CDI patients, however the results remain elusive. Interestingly, in the studies,
in which the overall gut microbial composition of the CDI+ and CDI- groups are compared by metagenomics,
the species of C. difficile is not differentiating the two groups, because C. difficile may be detected also in
asymptomatic patients. Moreover, the proportion of C. difficile in the symptomatic and asymptomatic patients
is very low, sometimes undetectable in metagenomic analysis. It suggests that despite being one of the minority
species in the infected gut, C. difficile is able to produce significant amounts of toxin and damage the gut
tissues.
As it seems that the overall bacterial composition typical for CDI cannot be defined, we aimed to determine
microbial patterns typical for CDI by studying active gut bacteria and bacteria coated by unspecific intestinal
SIgA. We hypothesized that C. difficile might be distinguishing CDI+ and CDI- patients in some these microbial
fractions, independently on the antibiotic treatment taken.
We aimed to detect which bacteria are active during the antibiotic treatment which consequently leads to the
development of CDI. We hypothesized that even if different kinds of antibiotics have been used, the patients
with CDI must have a common bacterial cores of active and dead intestinal bacteria. Similarly, the patients
without CDI may have a community of active bacteria which protect them from the CDI. We aimed to detect
which of gut bacteria are recognized by SIgA. Hypothetically, if some of them are able to escape immune
responses, they would be present in the fraction of bacteria not opsonized by SIgA. In contrast, bacteria
recognized by the immune system will be coated by SIgA.
FACS will be used for sorting of bacteria which are opsonized by SIgA in the work presented in this chapter.
The taxonomic composition of IgA opsonized and non-opsonized bacterial will be detected by 16S rRNA
sequencing. Our objective is to find statistically relevant correlations between microbial composition of these
fractions and the patients’ medical data.
49
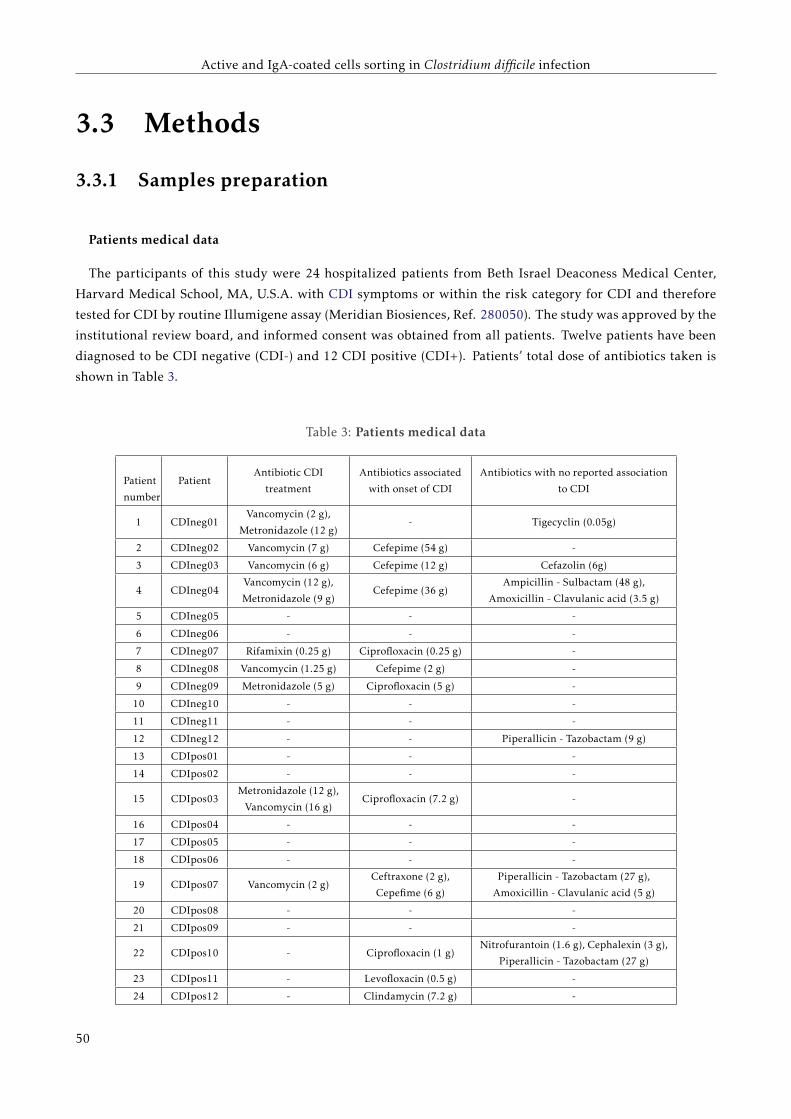
Active and IgA-coated cells sorting in Clostridium difficile infection
3.3 Methods
3.3.1 Samples preparation
Patients medical data
The participants of this study were 24 hospitalized patients from Beth Israel Deaconess Medical Center,
Harvard Medical School, MA, U.S.A. with CDI symptoms or within the risk category for CDI and therefore
tested for CDI by routine Illumigene assay (Meridian Biosiences, Ref. 280050). The study was approved by the
institutional review board, and informed consent was obtained from all patients. Twelve patients have been
diagnosed to be CDI negative (CDI-) and 12 CDI positive (CDI+). Patients’ total dose of antibiotics taken is
shown in Table 3.
Table 3: Patients medical data
Patient
number
PatientAntibiotic CDI
treatment
Antibiotics associated
with onset of CDI
Antibiotics with no reported association
to CDI
1 CDIneg01Vancomycin (2 g),
Metronidazole (12 g)- Tigecyclin (0.05g)
2 CDIneg02 Vancomycin (7 g) Cefepime (54 g) -
3 CDIneg03 Vancomycin (6 g) Cefepime (12 g) Cefazolin (6g)
4 CDIneg04Vancomycin (12 g),
Metronidazole (9 g)Cefepime (36 g)
Ampicillin - Sulbactam (48 g),
Amoxicillin - Clavulanic acid (3.5 g)
5 CDIneg05 - - -
6 CDIneg06 - - -
7 CDIneg07 Rifamixin (0.25 g) Ciprofloxacin (0.25 g) -
8 CDIneg08 Vancomycin (1.25 g) Cefepime (2 g) -
9 CDIneg09 Metronidazole (5 g) Ciprofloxacin (5 g) -
10 CDIneg10 - - -
11 CDIneg11 - - -
12 CDIneg12 - - Piperallicin - Tazobactam (9 g)
13 CDIpos01 - - -
14 CDIpos02 - - -
15 CDIpos03Metronidazole (12 g),
Vancomycin (16 g)Ciprofloxacin (7.2 g) -
16 CDIpos04 - - -
17 CDIpos05 - - -
18 CDIpos06 - - -
19 CDIpos07 Vancomycin (2 g)Ceftraxone (2 g),
Cepefime (6 g)
Piperallicin - Tazobactam (27 g),
Amoxicillin - Clavulanic acid (5 g)
20 CDIpos08 - - -
21 CDIpos09 - - -
22 CDIpos10 - Ciprofloxacin (1 g)Nitrofurantoin (1.6 g), Cephalexin (3 g),
Piperallicin - Tazobactam (27 g)
23 CDIpos11 - Levofloxacin (0.5 g) -
24 CDIpos12 - Clindamycin (7.2 g) -
50
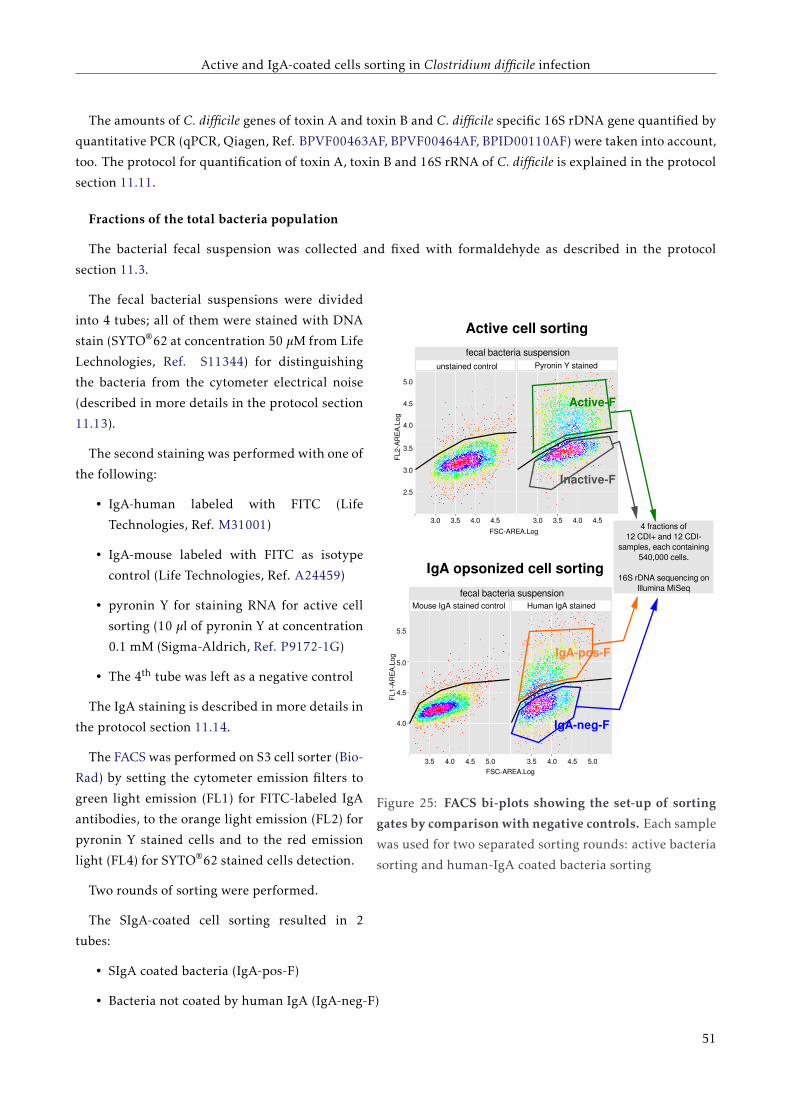
Active and IgA-coated cells sorting in Clostridium difficile infection
The amounts of C. difficile genes of toxin A and toxin B and C. difficile specific 16S rDNA gene quantified by
quantitative PCR (qPCR, Qiagen, Ref. BPVF00463AF, BPVF00464AF, BPID00110AF) were taken into account,
too. The protocol for quantification of toxin A, toxin B and 16S rRNA of C. difficile is explained in the protocol
section 11.11.
Fractions of the total bacteria population
The bacterial fecal suspension was collected and fixed with formaldehyde as described in the protocol
section 11.3.
5.0
4.5
4.0
3.5
3.0
2.5
3.0 3.5 4.0 4.5 3.0 3.5 4.0 4.5
FL
2-A
RE
A.L
og
FSC-AREA.Log
Active cell sorting
Active-F
Inactive-F
unstained control Pyronin Y stained
fecal bacteria suspension
5.5
5.0
4.5
4.0
3.5 4.0 4.5 5.0 3.5 4.0 4.5 5.0
FL
1-A
RE
A.L
og
FSC-AREA.Log
IgA opsonized cell sorting
IgA-pos-F
IgA-neg-F
Mouse IgA stained control Human IgA stained
4 fractions of 12 CDI+ and 12 CDI-
samples, each containing 540,000 cells.
16S rDNA sequencing onIllumina MiSeq
fecal bacteria suspension
Figure 25: FACS bi-plots showing the set-up of sorting
gates by comparison with negative controls. Each sample
was used for two separated sorting rounds: active bacteria
sorting and human-IgA coated bacteria sorting
The fecal bacterial suspensions were divided
into 4 tubes; all of them were stained with DNA
stain (SYTO®62 at concentration 50 µM from Life
Lechnologies, Ref. S11344) for distinguishing
the bacteria from the cytometer electrical noise
(described in more details in the protocol section
11.13).
The second staining was performed with one of
the following:
• IgA-human labeled with FITC (Life
Technologies, Ref. M31001)
• IgA-mouse labeled with FITC as isotype
control (Life Technologies, Ref. A24459)
• pyronin Y for staining RNA for active cell
sorting (10 µl of pyronin Y at concentration
0.1 mM (Sigma-Aldrich, Ref. P9172-1G)
• The 4th tube was left as a negative control
The IgA staining is described in more details in
the protocol section 11.14.
The FACS was performed on S3 cell sorter (Bio-
Rad) by setting the cytometer emission filters to
green light emission (FL1) for FITC-labeled IgA
antibodies, to the orange light emission (FL2) for
pyronin Y stained cells and to the red emission
light (FL4) for SYTO®62 stained cells detection.
Two rounds of sorting were performed.
The SIgA-coated cell sorting resulted in 2
tubes:
• SIgA coated bacteria (IgA-pos-F)
• Bacteria not coated by human IgA (IgA-neg-F)
51
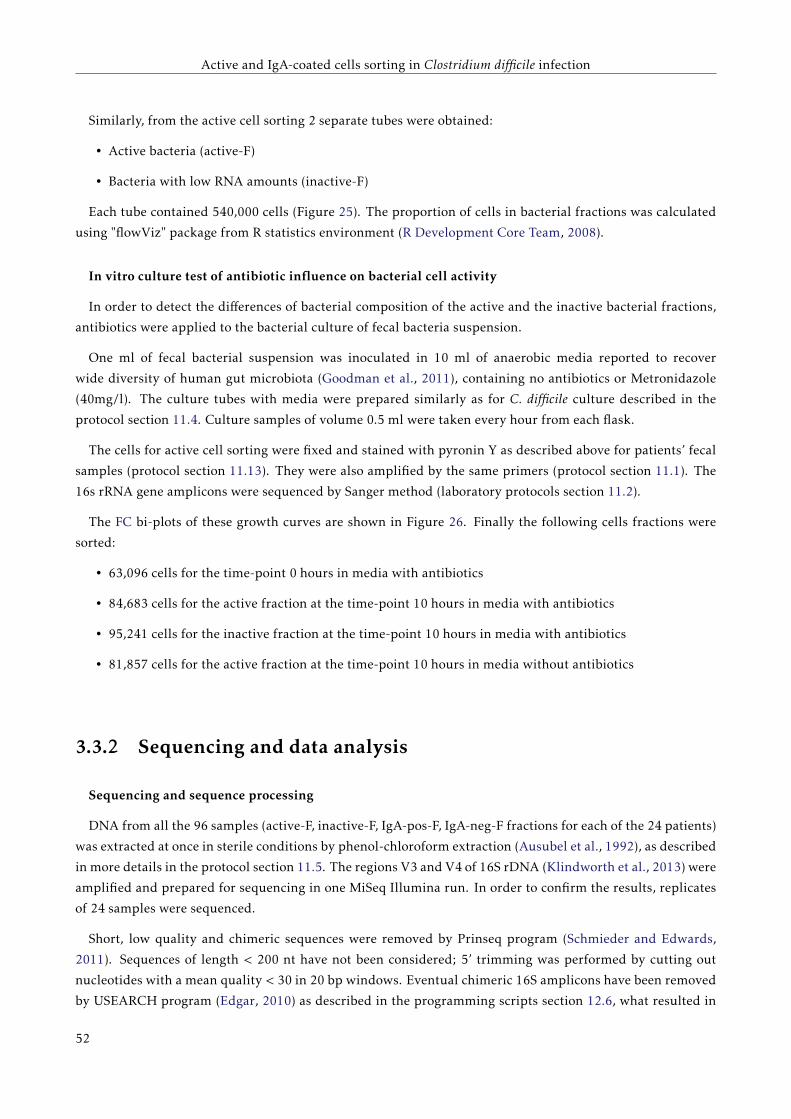
Active and IgA-coated cells sorting in Clostridium difficile infection
Similarly, from the active cell sorting 2 separate tubes were obtained:
• Active bacteria (active-F)
• Bacteria with low RNA amounts (inactive-F)
Each tube contained 540,000 cells (Figure 25). The proportion of cells in bacterial fractions was calculated
using "flowViz" package from R statistics environment (R Development Core Team, 2008).
In vitro culture test of antibiotic influence on bacterial cell activity
In order to detect the differences of bacterial composition of the active and the inactive bacterial fractions,
antibiotics were applied to the bacterial culture of fecal bacteria suspension.
One ml of fecal bacterial suspension was inoculated in 10 ml of anaerobic media reported to recover
wide diversity of human gut microbiota (Goodman et al., 2011), containing no antibiotics or Metronidazole
(40mg/l). The culture tubes with media were prepared similarly as for C. difficile culture described in the
protocol section 11.4. Culture samples of volume 0.5 ml were taken every hour from each flask.
The cells for active cell sorting were fixed and stained with pyronin Y as described above for patients’ fecal
samples (protocol section 11.13). They were also amplified by the same primers (protocol section 11.1). The
16s rRNA gene amplicons were sequenced by Sanger method (laboratory protocols section 11.2).
The FC bi-plots of these growth curves are shown in Figure 26. Finally the following cells fractions were
sorted:
• 63,096 cells for the time-point 0 hours in media with antibiotics
• 84,683 cells for the active fraction at the time-point 10 hours in media with antibiotics
• 95,241 cells for the inactive fraction at the time-point 10 hours in media with antibiotics
• 81,857 cells for the active fraction at the time-point 10 hours in media without antibiotics
3.3.2 Sequencing and data analysis
Sequencing and sequence processing
DNA from all the 96 samples (active-F, inactive-F, IgA-pos-F, IgA-neg-F fractions for each of the 24 patients)
was extracted at once in sterile conditions by phenol-chloroform extraction (Ausubel et al., 1992), as described
in more details in the protocol section 11.5. The regions V3 and V4 of 16S rDNA (Klindworth et al., 2013) were
amplified and prepared for sequencing in one MiSeq Illumina run. In order to confirm the results, replicates
of 24 samples were sequenced.
Short, low quality and chimeric sequences were removed by Prinseq program (Schmieder and Edwards,
2011). Sequences of length < 200 nt have not been considered; 5’ trimming was performed by cutting out
nucleotides with a mean quality < 30 in 20 bp windows. Eventual chimeric 16S amplicons have been removed
by USEARCH program (Edgar, 2010) as described in the programming scripts section 12.6, what resulted in
52
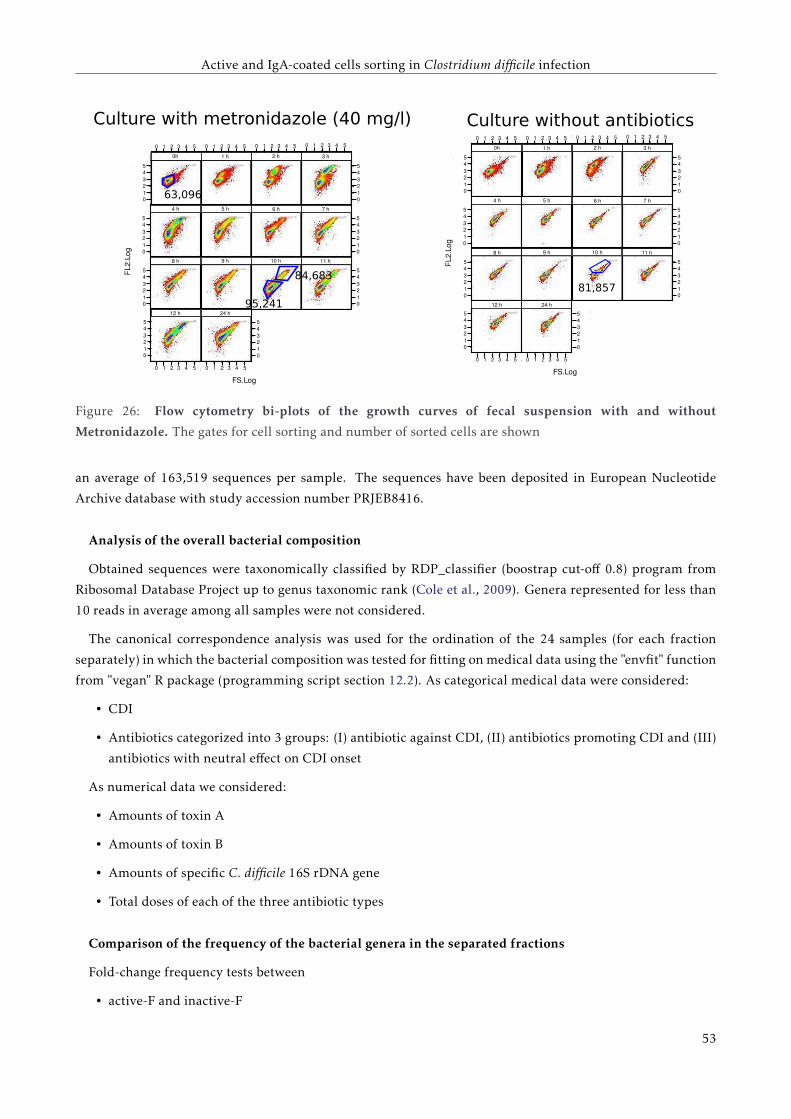
Active and IgA-coated cells sorting in Clostridium difficile infection
012345
012345
012345
012345
012345
012345
012345
012345
0 1 2 3 4 5 0 1 2 3 4 5 0 1 2 3 4 5 0 1 2 3 4 5
0 1 2 3 4 5 0 1 2 3 4 5
FL2.Log
FS.Log
0h 1 h 2 h 3 h
4 h 5 h 6 h 7 h
8 h 9 h 10 h 11 h
12 h 24 h
Culture with metronidazole (40 mg/l)
012345
012345
012345
012345
012345
012345
012345
012345
0 1 2 3 4 5 0 1 2 3 4 5 0 1 2 3 4 5 0 1 2 3 4 5
0 1 2 3 4 5 0 1 2 3 4 5
FL2.Log
FS.Log
0h 1 h 2 h 3 h
4 h 5 h 6 h 7 h
8 h 9 h 10 h 11 h
12 h 24 h
63,096
84,683
95,241
81,857
Culture without antibiotics
Figure 26: Flow cytometry bi-plots of the growth curves of fecal suspension with and without
Metronidazole. The gates for cell sorting and number of sorted cells are shown
an average of 163,519 sequences per sample. The sequences have been deposited in European Nucleotide
Archive database with study accession number PRJEB8416.
Analysis of the overall bacterial composition
Obtained sequences were taxonomically classified by RDP_classifier (boostrap cut-off 0.8) program from
Ribosomal Database Project up to genus taxonomic rank (Cole et al., 2009). Genera represented for less than
10 reads in average among all samples were not considered.
The canonical correspondence analysis was used for the ordination of the 24 samples (for each fraction
separately) in which the bacterial composition was tested for fitting on medical data using the "envfit" function
from "vegan" R package (programming script section 12.2). As categorical medical data were considered:
• CDI
• Antibiotics categorized into 3 groups: (I) antibiotic against CDI, (II) antibiotics promoting CDI and (III)
antibiotics with neutral effect on CDI onset
As numerical data we considered:
• Amounts of toxin A
• Amounts of toxin B
• Amounts of specific C. difficile 16S rDNA gene
• Total doses of each of the three antibiotic types
Comparison of the frequency of the bacterial genera in the separated fractions
Fold-change frequency tests between
• active-F and inactive-F
53
Active and IgA-coated cells sorting in Clostridium difficile infection
• IgA-pos-F and IgA-neg-F
were performed by the R package "edgeR", shown in programming scripts section 12.4.
Statistically significant associations of the medical data with the statistically significant fold-change increase
of bacterial genera in one of the compared fraction pairs (p < 0.01, Benjamini-Hochberg correction) have been
visualized in a Bayesian network (a graphical probabilistic model) by R package "bnlearn", explained in details
in the programming scripts section 12.1. The nodes of the network (Figure 32) corresponded to the occurrence
of bacterial genera in the four fractions, CDI and the three types of antibiotic treatment (excluding antibiotics
started on the day of the sample collection). Only bacterial genera increased significantly in at least 5 patients
in one of the compared fraction pairs were included in the network. The connecting arcs represented a mutual
associations rather than causality. In order to determine which bacteria predict the behavior of a selected
node, a subset called Markov blanket can be extracted (Pearl, 1988), in our case the nodes corresponding to
the three types of antibiotics and CDI were dissected. The dissection of Markov blankets is also shown in the
programming scripts section 12.1.
54

Active and IgA-coated cells sorting in Clostridium difficile infection
3.4 Results
3.4.1 Load of C. difficile specific 16S rDNA, toxin A and toxin B genesdetected by qPCR
The qPCR assay detected specific C. difficile 16s rDNA sequences in 16 samples of the patients cohort; it
formed 0.0001 % - 0.881 % of total gut microbiota.
Four of these patients were considered clinically CDI- by Illumigene assay and the absence of toxin genes
was confirmed also by qPCR, indicating that these patients were colonized by non-toxigenic C. difficile strains.
In six CDI+ patients, the burdens of toxin A gene were 1.4 - 5 times lower than burdens of toxin B genes,
suggesting that these patients might be colonized by A+B+ and A-B+ toxinotypes Table 4.
Table 4: Proportion of cells belonging to C. difficile and containing toxin A genes or toxin B genes
Sample name (CDI
negative samples)
16S
rDNAToxin A Toxin B
Sample name (CDI
positive samples )
16S
rDNAToxin A Toxin B
CDIneg01 - - - CDIpos01 0.0972 0.0012 0.0012
CDIneg02 - - - CDIpos02 0.1091 0.0003 0.0010
CDIneg03 0.0002 - - CDIpos03 0.8580 0.0055 0.0054
CDIneg04 0.0008 - - CDIpos04 0.0013 0.0010 0.0012
CDIneg05 - - - CDIpos05 0.0044 0.0002 0.0010
CDIneg06 0.0002 - - CDIpos06 0.8881 0.0071 0.0100
CDIneg07 0.0001 - - CDIpos07 0.0262 0.0002 0.0001
CDIneg08 - - - CDIpos08 0.0406 0.0004 0.0010
CDIneg09 - - - CDIpos09 0.0021 0.0002 0.0001
CDIneg10 - - - CDIpos10 0.0029 0.0002 0.0010
CDIneg11 - - - CDIpos11 0.0001 0.0001 0.0001
CDIneg12 - - - CDIpos12 0.0284 0.0002 0.0010
3.4.2 Proportions of active and IgA coated bacteria
The results of fluorescent cell counting indicated that not all active bacteria were coated by IgA: the
proportion of cells belonging to the IgA-pos-F was lower (39.67 ± 7.73 %) than the proportion of cells
belonging to the active-F (63.02 ± 5.56 %). The outlying samples for IgA-pos-F were more homogeneous
in active-F proportion (Figure 27). The mouse-IgA control allowed to remove non-specifically labeled bacteria
(31.05 ±2.43 % of all bacteria).
Despite the fact that the proportion of active-F was significantly lower in the patients undertaking antibiotic
treatment (56.79 ± 4.79 %) than in the patients without antibiotics (69.25 ± 4.24 %, t-test, p = 0.0473, Figure
27, panel C), the active-F proportion range was wide in the both groups (40.26 - 83.87 % and 48.46 - 87.7 %,
respectively).
55
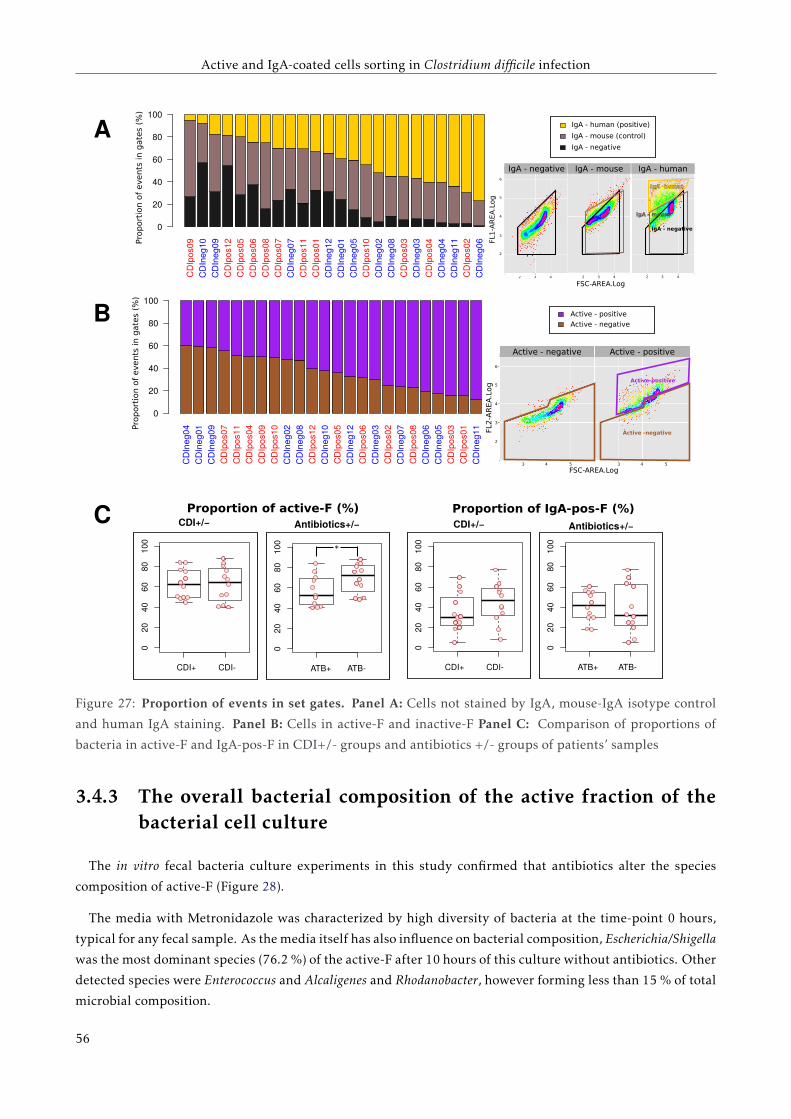
Active and IgA-coated cells sorting in Clostridium difficile infection
CD
Ipos
09C
DIn
eg10
CD
Ineg
09C
DIp
os12
CD
Ipos
05C
DIp
os06
CD
Ipos
08C
DIp
os07
CD
Ineg
07C
DIp
os11
CD
Ipos
01C
DIn
eg12
CD
Ineg
01C
DIn
eg05
CD
Ipos
10C
DIn
eg02
CD
Ineg
08C
DIp
os03
CD
Ineg
03C
DIp
os04
CD
Ineg
04C
DIn
eg11
CD
Ipos
02C
DIn
eg06
0
20
40
60
80
100
6
2 3 4 2 3 4 2 3 4
FSC-AREA.Log
FL1
-AR
EA
.Log 5
4
3
2
Pro
port
ion o
f events
in g
ate
s (%
)
IgA - human (positive)
IgA - mouse (control)
IgA - negative
CD
Ineg
04C
DIn
eg01
CD
Ineg
09C
DIp
os07
CD
Ipos
11C
DIp
os04
CD
Ipos
09C
DIp
os10
CD
Ineg
02C
DIn
eg08
CD
Ipos
12C
DIn
eg10
CD
Ipos
05C
DIn
eg12
CD
Ipos
06C
DIn
eg03
CD
Ipos
02C
DIn
eg07
CD
Ipos
08C
DIn
eg06
CD
Ineg
05C
DIp
os03
CD
Ipos
01C
DIn
eg11
0
20
40
60
80
100
FSC-AREA.Log
FL2
-AR
EA
.Log
6
5
4
3
2
3 4 5 3 4 5
Active - negative Active - positive
Active -negative
Active-positive
Pro
port
ion o
f events
in g
ate
s (%
)
Active - positive
Active - negative
IgA -human
IgA - negative
IgA - mouse
IgA - humanIgA - mouse
CDI+/− Antibiotics+/−Proportion of active-F (%)
CDI+/− Antibiotics+/−Proportion of IgA-pos-F (%)
CDI+ CDI-
020
4060
8010
0
●
●
●
●
●●●
●
●
●
●
●
●
●
●
●
●●
●
●
●●
●
●
●
●
●
ATB+ ATB-
020
4060
8010
0
●
●
●
●
●
●
●
●●
●
●
●
●
●
●
●
●●
●●
●
●●
●
*
●●
●
●
●
●
●● ●
●●
CDI+ CDI-
020
4060
8010
0
●
●●
●
●
●
●
●
●
●
●
●●
●
●●
●●●●
●
●
●
●●
●
●
●
●
●
ATB+ ATB-
020
4060
8010
0
●
●
●
●
●●
●
●
●●
●
●
●
●●
●●
●●
●
●
●
●
●
●
●
●
●●
●
●
●
●●
●
●
●●
●
A
B
C
IgA - negative
Figure 27: Proportion of events in set gates. Panel A: Cells not stained by IgA, mouse-IgA isotype control
and human IgA staining. Panel B: Cells in active-F and inactive-F Panel C: Comparison of proportions of
bacteria in active-F and IgA-pos-F in CDI+/- groups and antibiotics +/- groups of patients’ samples
3.4.3 The overall bacterial composition of the active fraction of thebacterial cell culture
The in vitro fecal bacteria culture experiments in this study confirmed that antibiotics alter the species
composition of active-F (Figure 28).
The media with Metronidazole was characterized by high diversity of bacteria at the time-point 0 hours,
typical for any fecal sample. As the media itself has also influence on bacterial composition, Escherichia/Shigella
was the most dominant species (76.2 %) of the active-F after 10 hours of this culture without antibiotics. Other
detected species were Enterococcus and Alcaligenes and Rhodanobacter, however forming less than 15 % of total
microbial composition.
56
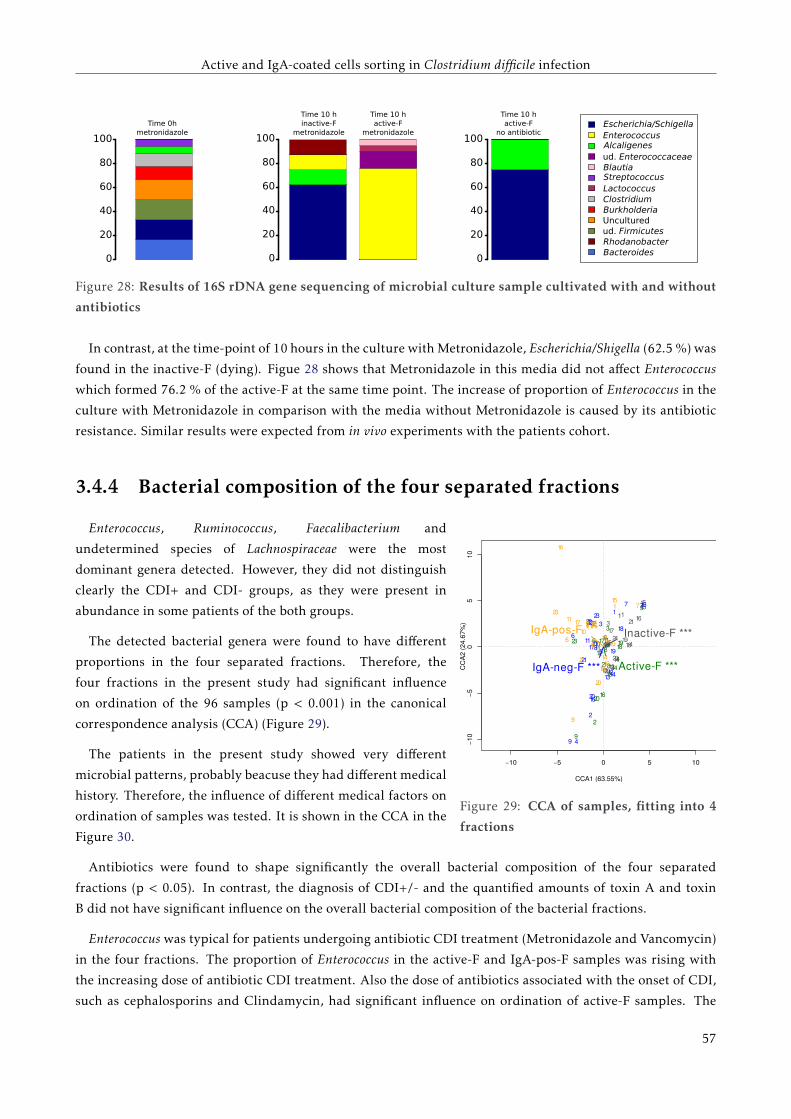
Active and IgA-coated cells sorting in Clostridium difficile infection
Rhodanobacter
Blautia
Lactococcus
ud. Enterococcaceae
Enterococcus
Streptococcus
Alcaligenes
ClostridiumBurkholderia
ud. Firmicutes
Escherichia/Schigella
Bacteroides
Uncultured
100
80
60
40
20
0
100
80
60
40
20
0
100
80
60
40
20
0
Time 0hmetronidazole
Time 10 hinactive-F
metronidazole
Time 10 hactive-F
metronidazole
Time 10 hactive-F
no antibiotic
Figure 28: Results of 16S rDNA gene sequencing of microbial culture sample cultivated with and without
antibiotics
In contrast, at the time-point of 10 hours in the culture with Metronidazole, Escherichia/Shigella (62.5 %) was
found in the inactive-F (dying). Figue 28 shows that Metronidazole in this media did not affect Enterococcus
which formed 76.2 % of the active-F at the same time point. The increase of proportion of Enterococcus in the
culture with Metronidazole in comparison with the media without Metronidazole is caused by its antibiotic
resistance. Similar results were expected from in vivo experiments with the patients cohort.
3.4.4 Bacterial composition of the four separated fractions
−10 −5 0 5 10
−10
−50
510
CCA1 (63.55%)
CC
A2 (2
4.67
%)
1
2
3
456
7
8
9
1011
121314
15
16
17
1819
20
2122
23
24
1
2
3
4
56
7
8
9
10 11
12
1314
15
16
171819
20
21
22
23 24
1
2
3
4
5
6
7
8
9
1011
121314
15
16
17
18
19
20
21
2223
24
1
2
3 45
6
7
8
9
10
11
12
1314
15
16
17
18
19
20
21
22
23
24Inactive-F ***IgA-pos-F ***
Active-F ***IgA-neg-F ***
Figure 29: CCA of samples, fitting into 4
fractions
Enterococcus, Ruminococcus, Faecalibacterium and
undetermined species of Lachnospiraceae were the most
dominant genera detected. However, they did not distinguish
clearly the CDI+ and CDI- groups, as they were present in
abundance in some patients of the both groups.
The detected bacterial genera were found to have different
proportions in the four separated fractions. Therefore, the
four fractions in the present study had significant influence
on ordination of the 96 samples (p < 0.001) in the canonical
correspondence analysis (CCA) (Figure 29).
The patients in the present study showed very different
microbial patterns, probably beacuse they had different medical
history. Therefore, the influence of different medical factors on
ordination of samples was tested. It is shown in the CCA in the
Figure 30.
Antibiotics were found to shape significantly the overall bacterial composition of the four separated
fractions (p < 0.05). In contrast, the diagnosis of CDI+/- and the quantified amounts of toxin A and toxin
B did not have significant influence on the overall bacterial composition of the bacterial fractions.
Enterococcus was typical for patients undergoing antibiotic CDI treatment (Metronidazole and Vancomycin)
in the four fractions. The proportion of Enterococcus in the active-F and IgA-pos-F samples was rising with
the increasing dose of antibiotic CDI treatment. Also the dose of antibiotics associated with the onset of CDI,
such as cephalosporins and Clindamycin, had significant influence on ordination of active-F samples. The
57
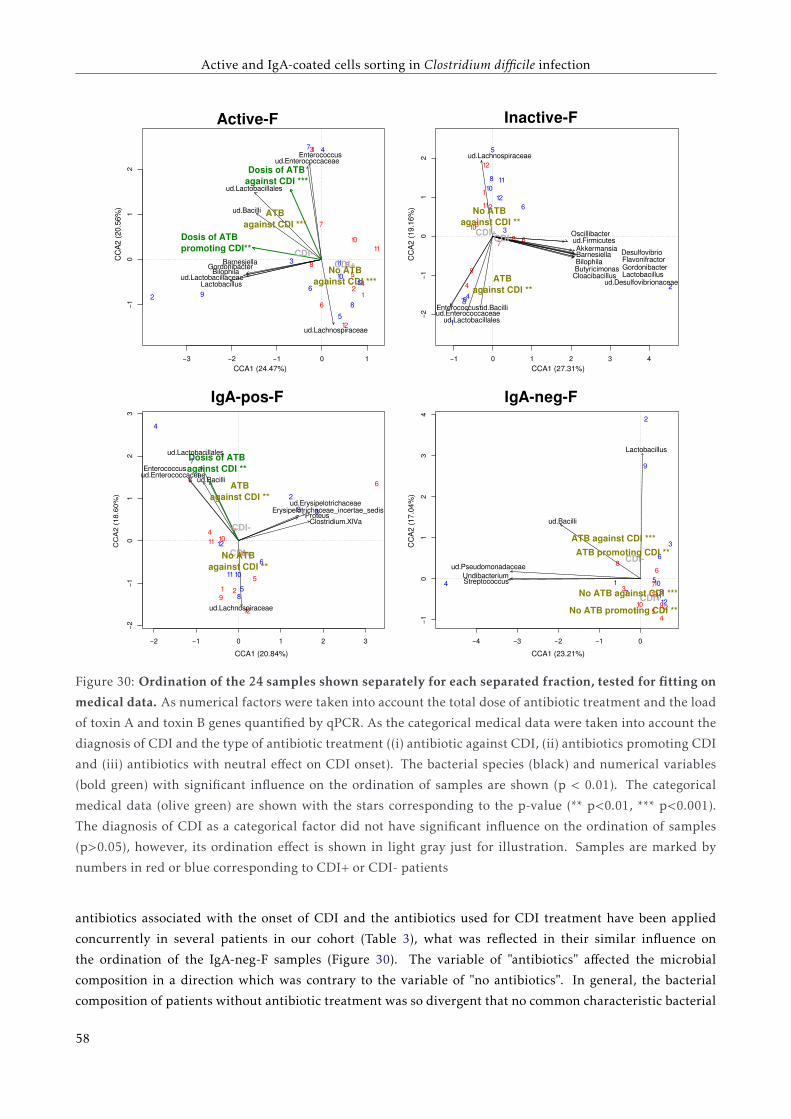
Active and IgA-coated cells sorting in Clostridium difficile infection
68
ud.Bacilli
39Erysipelotrichaceae_incertae_sedisProteus
−1 0 1 2 3 4
−2−1
01
2
CCA1 (27.31%)
CC
A2 (1
9.16
%)
1
2
3
4
5
6
7
8
9
1011
121
2
3
4
5
678
9
10
11
12
CDI+CDI-
ATB against CDI **
Dosis of ATB promoting CDI**
−3 −2 −1 0 1
−10
12
CCA1 (24.47%)
CCA2
(20.
56%
)
1
2
3
4
5
6
7
89
10
11
121
2
3
45
6
7
8 9
1011
12
Dosis of ATB against CDI ***
ATB against CDI ***
CDI-
Enterococcusud.Enterococcaceae
ud.Lactobacillales
ud.Bacilli
BarnesiellaGordonibacterBilophila
ud.LactobacillaceaeLactobacillus
ud.Lachnospiraceae
CDI+No ATB
against CDI ***
CDI+
−2 −1 0 1 2 3
−2−1
01
23
CCA1 (20.84%)
CC
A2
(18.
60%
)
1
2
4
5
7
8
1011
12
1 2
3
4
5
6
7
9
1011
12
CDI-
Dosis of ATB against CDI **
CDI-
−4 −3 −2 −1 0
−10
12
34
CCA1 (23.21%)
CC
A2 (1
7.04
%)
1
2
3
4 5
6
7 8
9
1011
1212
3
45
6
7
8
91011
12
ATB against CDI ***
ATB promoting CDI **
Active-F Inactive-F
IgA-pos-F IgA-neg-F
ud.Lachnospiraceae
Enterococcusud.Enterococcaceaeud.Lactobacillales
ud.Bacilli
Oscillibacterud.Firmicutes
ud.DesulfovibrionaceaeLactobacillusGordonibacterFlavonifractorDesulfovibrio
CloacibacillusButyricimonasBilophilaBarnesiellaAkkermansia
No ATB against CDI **
ud.Lactobacillales
Enterococcus
ATB against CDI **
ud.Lachnospiraceae
ud.Erysipelotrichaceae
Clostridium.XlVa
ud.Enterococcaceae
No ATB against CDI ** ud.Pseudomonadaceae
UndibacteriumStreptococcus
ud.Bacilli
Lactobacillus
No ATB promoting CDI **CDI+No ATB against CDI ***
Figure 30: Ordination of the 24 samples shown separately for each separated fraction, tested for fitting on
medical data. As numerical factors were taken into account the total dose of antibiotic treatment and the load
of toxin A and toxin B genes quantified by qPCR. As the categorical medical data were taken into account the
diagnosis of CDI and the type of antibiotic treatment ((i) antibiotic against CDI, (ii) antibiotics promoting CDI
and (iii) antibiotics with neutral effect on CDI onset). The bacterial species (black) and numerical variables
(bold green) with significant influence on the ordination of samples are shown (p < 0.01). The categorical
medical data (olive green) are shown with the stars corresponding to the p-value (** p<0.01, *** p<0.001).
The diagnosis of CDI as a categorical factor did not have significant influence on the ordination of samples
(p>0.05), however, its ordination effect is shown in light gray just for illustration. Samples are marked by
numbers in red or blue corresponding to CDI+ or CDI- patients
antibiotics associated with the onset of CDI and the antibiotics used for CDI treatment have been applied
concurrently in several patients in our cohort (Table 3), what was reflected in their similar influence on
the ordination of the IgA-neg-F samples (Figure 30). The variable of "antibiotics" affected the microbial
composition in a direction which was contrary to the variable of "no antibiotics". In general, the bacterial
composition of patients without antibiotic treatment was so divergent that no common characteristic bacterial
58
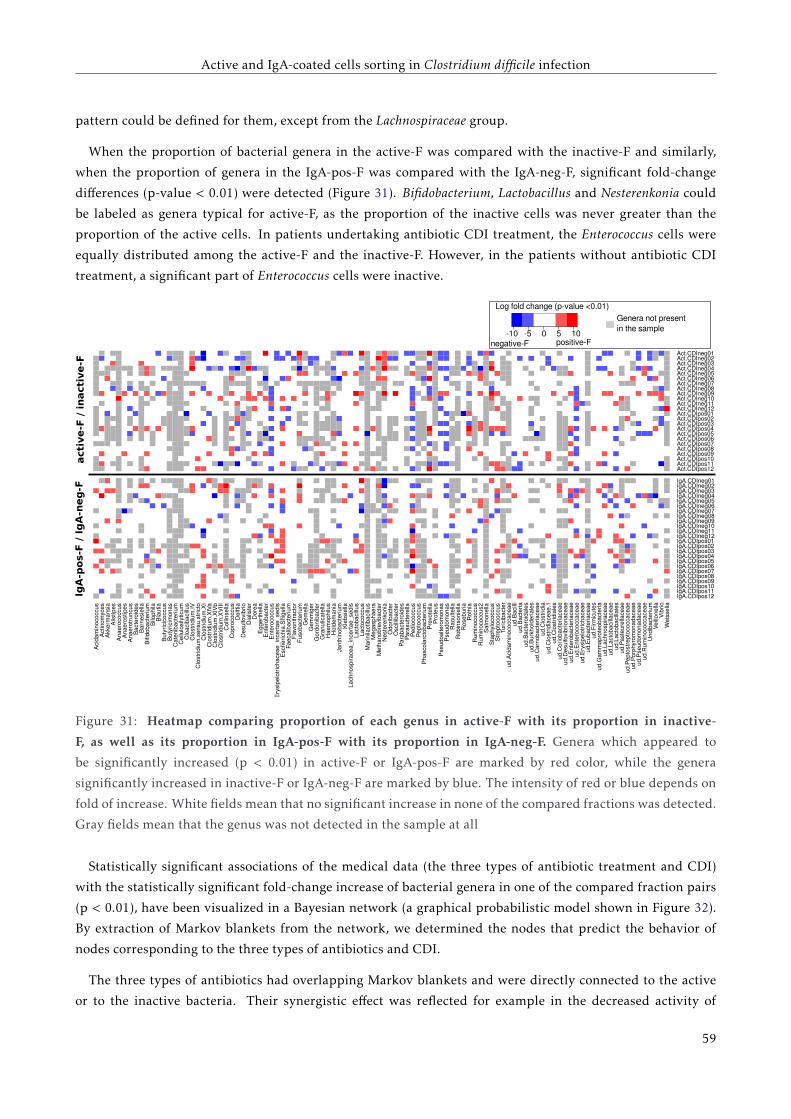
Active and IgA-coated cells sorting in Clostridium difficile infection
pattern could be defined for them, except from the Lachnospiraceae group.
When the proportion of bacterial genera in the active-F was compared with the inactive-F and similarly,
when the proportion of genera in the IgA-pos-F was compared with the IgA-neg-F, significant fold-change
differences (p-value < 0.01) were detected (Figure 31). Bifidobacterium, Lactobacillus and Nesterenkonia could
be labeled as genera typical for active-F, as the proportion of the inactive cells was never greater than the
proportion of the active cells. In patients undertaking antibiotic CDI treatment, the Enterococcus cells were
equally distributed among the active-F and the inactive-F. However, in the patients without antibiotic CDI
treatment, a significant part of Enterococcus cells were inactive.
acti
ve-F
/ in
acti
ve-F
IgA
-pos-F
/ I
gA
-neg
-F
Acid
amin
ococ
cus
Actin
omyc
esAk
kerm
ansi
aAl
istip
esAn
aero
cocc
usAn
aero
stip
esAn
aero
trunc
usBa
cter
oide
sBa
rnes
iella
Bifid
obac
teriu
mBi
loph
ilaBl
autia
Buty
ricic
occu
sBu
tyric
imon
asC
aten
ibac
teriu
mC
ellu
losi
lytic
umC
loac
ibac
illus
Clo
strid
ium
.IVC
lost
ridiu
m.s
ensu
.stri
cto
Clo
strid
ium
.XI
Clo
strid
ium
.XlV
aC
lost
ridiu
m.X
lVb
Clo
strid
ium
.XVI
IIC
ollin
sella
Cop
roco
ccus
Del
ftia
Des
ulfo
vibr
ioD
ialis
ter
Dor
eaEg
gerth
ella
Ente
roba
cter
Ente
roco
ccus
Erys
ipel
otric
hace
ae_i
ncer
tae_
sedi
sEs
cher
ichi
a.Sh
igel
laFa
ecal
ibac
teriu
mFl
avon
ifrac
tor
Fuso
bact
eriu
mG
emel
laG
emm
iger
Gor
doni
bact
erG
ranu
licat
ella
Hae
mop
hilu
sH
olde
man
iaJa
nthi
noba
cter
ium
Kleb
siel
laLa
chno
spira
cea_
ince
rtae_
sedi
sLa
ctob
acillu
sLa
ctoc
occu
sM
arin
ilact
ibac
illus
Meg
asph
aera
Met
hano
brev
ibac
ter
Nes
tere
nkon
iaO
dorib
acte
rO
scilli
bact
erPa
raba
cter
oide
sPa
rasu
ttere
llaPe
dioc
occu
sPe
ptoc
occu
sPh
asco
larc
toba
cter
ium
Prev
otel
laPr
oteu
sPs
eudo
alte
rom
onas
Pseu
dom
onas
Rao
ulte
llaR
obin
soni
ella
Ros
ebur
iaR
othi
aR
umin
ococ
cus
Rum
inoc
occu
s2Sa
lmon
ella
Stap
hylo
cocc
usSt
rept
ococ
cus
Log fold change (p-value <0.01)
-10 -5 0 5 10negative-F positive-F
Genera not present in the sample
IgA.CDIpos12IgA.CDIpos11IgA.CDIpos10IgA.CDIpos09IgA.CDIpos08IgA.CDIpos07IgA.CDIpos06IgA.CDIpos05IgA.CDIpos04IgA.CDIpos03IgA.CDIpos02IgA.CDIpos01IgA.CDIneg12IgA.CDIneg11IgA.CDIneg10IgA.CDIneg09IgA.CDIneg08IgA.CDIneg07IgA.CDIneg06IgA.CDIneg05IgA.CDIneg04IgA.CDIneg03IgA.CDIneg02IgA.CDIneg01
Act.CDIpos12Act.CDIpos11Act.CDIpos10Act.CDIpos09Act.CDIpos08Act.CDIpos07Act.CDIpos06Act.CDIpos05Act.CDIpos04Act.CDIpos03Act.CDIpos02Act.CDIpos01Act.CDIneg12Act.CDIneg11Act.CDIneg10Act.CDIneg09Act.CDIneg08Act.CDIneg07Act.CDIneg06Act.CDIneg05Act.CDIneg04Act.CDIneg03Act.CDIneg02Act.CDIneg01
Turic
ibac
ter
ud.A
cida
min
ococ
cace
aeud
.Bac
illiud
.Bac
teria
ud.B
acte
roid
ales
ud.B
urkh
olde
riale
sud
.Car
noba
cter
iace
aeud
.Clo
strid
iaud
.Clo
strid
iace
ae.1
ud.C
lost
ridia
les
ud.C
orio
bact
eria
ceae
ud.D
esul
fovi
brio
nace
aeud
.Ent
erob
acte
riace
aeud
.Ent
eroc
occa
ceae
ud.E
rysi
pelo
trich
acea
eud
.Eub
acte
riace
aeud
.Firm
icut
esud
.Gam
map
rote
obac
teria
ud.L
achn
ospi
race
aeud
.Lac
toba
cilla
ceae
ud.L
acto
baci
llale
sud
.Pas
teur
ella
ceae
ud.P
epto
stre
ptoc
occa
ceae
ud.P
orph
yrom
onad
acea
eud
.Pse
udom
onad
acea
eud
.Rum
inoc
occa
ceae
Und
ibac
teriu
mVe
illone
llaVi
brio
Wei
ssel
la
Figure 31: Heatmap comparing proportion of each genus in active-F with its proportion in inactive-
F, as well as its proportion in IgA-pos-F with its proportion in IgA-neg-F. Genera which appeared to
be significantly increased (p < 0.01) in active-F or IgA-pos-F are marked by red color, while the genera
significantly increased in inactive-F or IgA-neg-F are marked by blue. The intensity of red or blue depends on
fold of increase. White fields mean that no significant increase in none of the compared fractions was detected.
Gray fields mean that the genus was not detected in the sample at all
Statistically significant associations of the medical data (the three types of antibiotic treatment and CDI)
with the statistically significant fold-change increase of bacterial genera in one of the compared fraction pairs
(p < 0.01), have been visualized in a Bayesian network (a graphical probabilistic model shown in Figure 32).
By extraction of Markov blankets from the network, we determined the nodes that predict the behavior of
nodes corresponding to the three types of antibiotics and CDI.
The three types of antibiotics had overlapping Markov blankets and were directly connected to the active
or to the inactive bacteria. Their synergistic effect was reflected for example in the decreased activity of
59
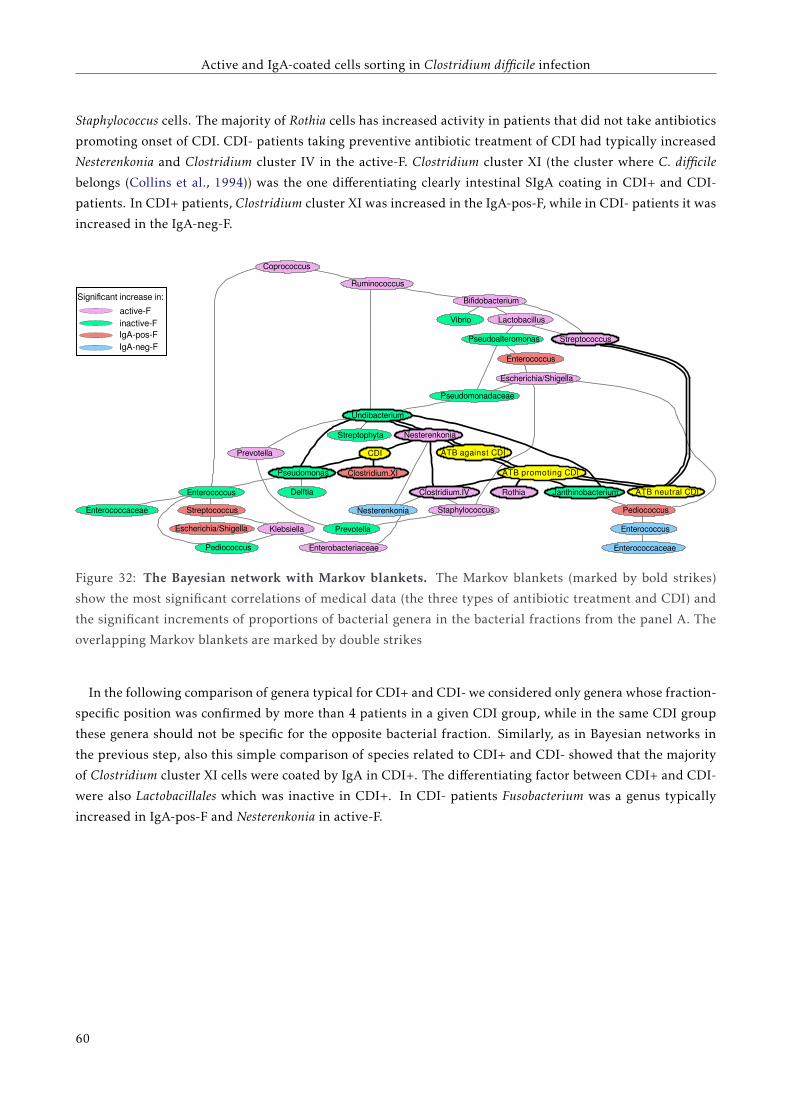
Active and IgA-coated cells sorting in Clostridium difficile infection
Staphylococcus cells. The majority of Rothia cells has increased activity in patients that did not take antibiotics
promoting onset of CDI. CDI- patients taking preventive antibiotic treatment of CDI had typically increased
Nesterenkonia and Clostridium cluster IV in the active-F. Clostridium cluster XI (the cluster where C. difficile
belongs (Collins et al., 1994)) was the one differentiating clearly intestinal SIgA coating in CDI+ and CDI-
patients. In CDI+ patients, Clostridium cluster XI was increased in the IgA-pos-F, while in CDI- patients it was
increased in the IgA-neg-F.
active-F
inactive-FIgA-pos-F
IgA-neg-F
Coprococcus
Prevotella
Enterococcus
Streptococcus
Escherichia/Shigella
Enterococcaceae
Pediococcus
Klebsiella
Enterobacteriaceae
Prevotella
Delftia
Pseudomonas
Streptophyta
Undibacterium
Nesterenkonia
Clostridium.XI
Nesterenkonia
Clostridium.IV
Staphylococcus
CDI ATB against CDI
ATB promoting CDI
Rothia Janthinobacterium ATB neutral CDI
Pediococcus
Enterococcus
Enterococcaceae
Pseudomonadaceae
Escherichia/Shigella
Enterococcus
StreptococcusPseudoalteromonas
Lactobacillus
Bifidobacterium
Vibrio
Ruminococcus
Significant increase in:
Figure 32: The Bayesian network with Markov blankets. The Markov blankets (marked by bold strikes)
show the most significant correlations of medical data (the three types of antibiotic treatment and CDI) and
the significant increments of proportions of bacterial genera in the bacterial fractions from the panel A. The
overlapping Markov blankets are marked by double strikes
In the following comparison of genera typical for CDI+ and CDI- we considered only genera whose fraction-
specific position was confirmed by more than 4 patients in a given CDI group, while in the same CDI group
these genera should not be specific for the opposite bacterial fraction. Similarly, as in Bayesian networks in
the previous step, also this simple comparison of species related to CDI+ and CDI- showed that the majority
of Clostridium cluster XI cells were coated by IgA in CDI+. The differentiating factor between CDI+ and CDI-
were also Lactobacillales which was inactive in CDI+. In CDI- patients Fusobacterium was a genus typically
increased in IgA-pos-F and Nesterenkonia in active-F.
60
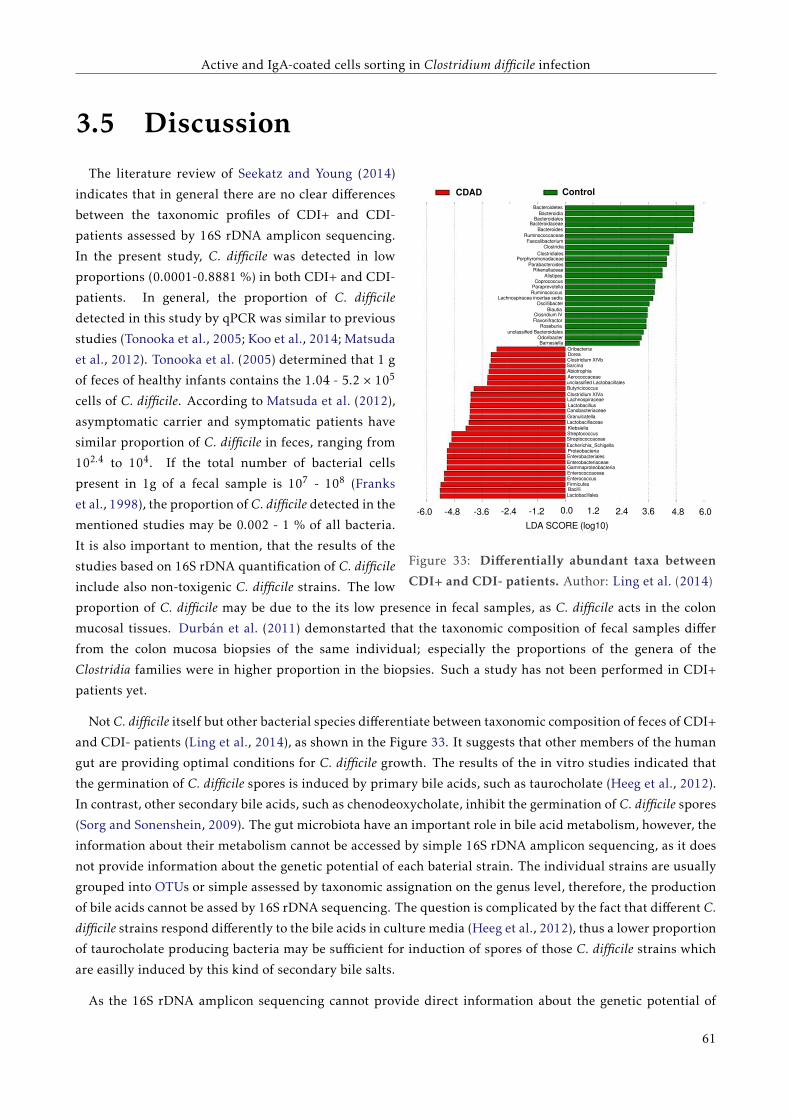
Active and IgA-coated cells sorting in Clostridium difficile infection
3.5 Discussion
BacteroidiaBacteroidales
Bacteroidaceae
RuminococcaceaeFaecalibacterium
Clostridia
ClostridialesPorphyromonadaceae
RikenallaceaeAlistipes
Coprococcus
Bacteroides
Parabacteroides
ParaprevotellaRuminococcus
Lachnospiracea incertae sedisOscillibacter
BlautiaClosridium IVFlavonifractor
Roseburiaunclassified Bacteroidales
OdoribacterBarnesiella
OribacteriumDoreaClostridium XIVbSarcinaAbiotrophiaAerococcaceaeunclassified LactobacillalesButyricicoccusClostridium XIVaLachnospiraceae
CanobacteriaceaeLactobacillus
GranulcatellaLactobacillaceaeKlebsiellaStreptococcusStreptococcaceaeEscherichia_SchigellaProteobacteriaEnterobacterialesEnterobacteriaceaeGammaproteobacteriaEnterococcaceaeEnterococcusFirmicutesBacilli
Lactobacillales
Bacteroidetes
-6.0 -4.8 -3.6 -2.4 -1.2 0.0 1.2 2.4 3.6 4.8 6.0
LDA SCORE (log10)
CDAD Control
Figure 33: Differentially abundant taxa between
CDI+ and CDI- patients. Author: Ling et al. (2014)
The literature review of Seekatz and Young (2014)
indicates that in general there are no clear differences
between the taxonomic profiles of CDI+ and CDI-
patients assessed by 16S rDNA amplicon sequencing.
In the present study, C. difficile was detected in low
proportions (0.0001-0.8881 %) in both CDI+ and CDI-
patients. In general, the proportion of C. difficile
detected in this study by qPCR was similar to previous
studies (Tonooka et al., 2005; Koo et al., 2014; Matsuda
et al., 2012). Tonooka et al. (2005) determined that 1 g
of feces of healthy infants contains the 1.04 - 5.2 × 10⁵
cells of C. difficile. According to Matsuda et al. (2012),
asymptomatic carrier and symptomatic patients have
similar proportion of C. difficile in feces, ranging from
102.4 to 104. If the total number of bacterial cells
present in 1g of a fecal sample is 107 - 108 (Franks
et al., 1998), the proportion of C. difficile detected in the
mentioned studies may be 0.002 - 1 % of all bacteria.
It is also important to mention, that the results of the
studies based on 16S rDNA quantification of C. difficile
include also non-toxigenic C. difficile strains. The low
proportion of C. difficile may be due to the its low presence in fecal samples, as C. difficile acts in the colon
mucosal tissues. Durbán et al. (2011) demonstarted that the taxonomic composition of fecal samples differ
from the colon mucosa biopsies of the same individual; especially the proportions of the genera of the
Clostridia families were in higher proportion in the biopsies. Such a study has not been performed in CDI+
patients yet.
Not C. difficile itself but other bacterial species differentiate between taxonomic composition of feces of CDI+
and CDI- patients (Ling et al., 2014), as shown in the Figure 33. It suggests that other members of the human
gut are providing optimal conditions for C. difficile growth. The results of the in vitro studies indicated that
the germination of C. difficile spores is induced by primary bile acids, such as taurocholate (Heeg et al., 2012).
In contrast, other secondary bile acids, such as chenodeoxycholate, inhibit the germination of C. difficile spores
(Sorg and Sonenshein, 2009). The gut microbiota have an important role in bile acid metabolism, however, the
information about their metabolism cannot be accessed by simple 16S rDNA amplicon sequencing, as it does
not provide information about the genetic potential of each baterial strain. The individual strains are usually
grouped into OTUs or simple assessed by taxonomic assignation on the genus level, therefore, the production
of bile acids cannot be assed by 16S rDNA sequencing. The question is complicated by the fact that different C.
difficile strains respond differently to the bile acids in culture media (Heeg et al., 2012), thus a lower proportion
of taurocholate producing bacteria may be sufficient for induction of spores of those C. difficile strains which
are easilly induced by this kind of secondary bile salts.
As the 16S rDNA amplicon sequencing cannot provide direct information about the genetic potential of
61
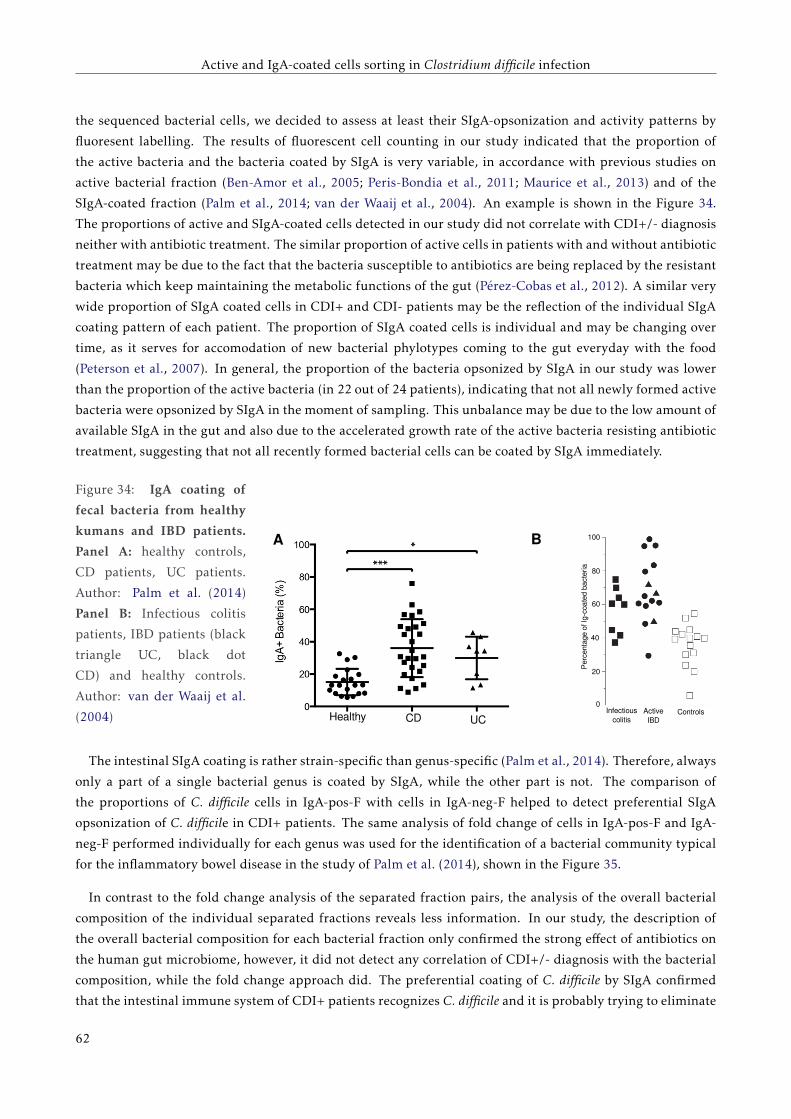
Active and IgA-coated cells sorting in Clostridium difficile infection
the sequenced bacterial cells, we decided to assess at least their SIgA-opsonization and activity patterns by
fluoresent labelling. The results of fluorescent cell counting in our study indicated that the proportion of
the active bacteria and the bacteria coated by SIgA is very variable, in accordance with previous studies on
active bacterial fraction (Ben-Amor et al., 2005; Peris-Bondia et al., 2011; Maurice et al., 2013) and of the
SIgA-coated fraction (Palm et al., 2014; van der Waaij et al., 2004). An example is shown in the Figure 34.
The proportions of active and SIgA-coated cells detected in our study did not correlate with CDI+/- diagnosis
neither with antibiotic treatment. The similar proportion of active cells in patients with and without antibiotic
treatment may be due to the fact that the bacteria susceptible to antibiotics are being replaced by the resistant
bacteria which keep maintaining the metabolic functions of the gut (Pérez-Cobas et al., 2012). A similar very
wide proportion of SIgA coated cells in CDI+ and CDI- patients may be the reflection of the individual SIgA
coating pattern of each patient. The proportion of SIgA coated cells is individual and may be changing over
time, as it serves for accomodation of new bacterial phylotypes coming to the gut everyday with the food
(Peterson et al., 2007). In general, the proportion of the bacteria opsonized by SIgA in our study was lower
than the proportion of the active bacteria (in 22 out of 24 patients), indicating that not all newly formed active
bacteria were opsonized by SIgA in the moment of sampling. This unbalance may be due to the low amount of
available SIgA in the gut and also due to the accelerated growth rate of the active bacteria resisting antibiotic
treatment, suggesting that not all recently formed bacterial cells can be coated by SIgA immediately.
Figure 34: IgA coating of
fecal bacteria from healthy
kumans and IBD patients.
Panel A: healthy controls,
CD patients, UC patients.
Author: Palm et al. (2014)
Panel B: Infectious colitis
patients, IBD patients (black
triangle UC, black dot
CD) and healthy controls.
Author: van der Waaij et al.
(2004)
A B
Healthy CD UCInfectious
colitisActive
IBDControls
Per
cent
age
of Ig
-coa
ted
bac
teri
a
100
80
60
40
20
0
The intestinal SIgA coating is rather strain-specific than genus-specific (Palm et al., 2014). Therefore, always
only a part of a single bacterial genus is coated by SIgA, while the other part is not. The comparison of
the proportions of C. difficile cells in IgA-pos-F with cells in IgA-neg-F helped to detect preferential SIgA
opsonization of C. difficile in CDI+ patients. The same analysis of fold change of cells in IgA-pos-F and IgA-
neg-F performed individually for each genus was used for the identification of a bacterial community typical
for the inflammatory bowel disease in the study of Palm et al. (2014), shown in the Figure 35.
In contrast to the fold change analysis of the separated fraction pairs, the analysis of the overall bacterial
composition of the individual separated fractions reveals less information. In our study, the description of
the overall bacterial composition for each bacterial fraction only confirmed the strong effect of antibiotics on
the human gut microbiome, however, it did not detect any correlation of CDI+/- diagnosis with the bacterial
composition, while the fold change approach did. The preferential coating of C. difficile by SIgA confirmed
that the intestinal immune system of CDI+ patients recognizes C. difficile and it is probably trying to eliminate
62
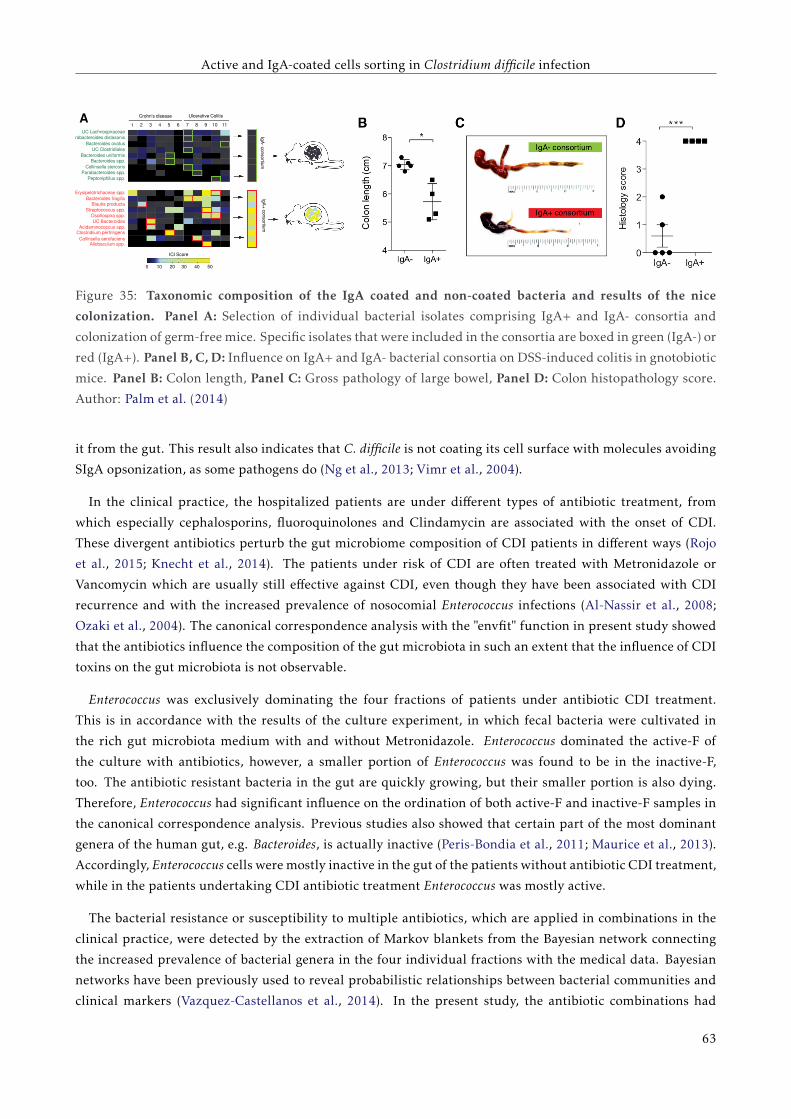
Active and IgA-coated cells sorting in Clostridium difficile infection
AUC Lachnospiraceae
Parabacteroides distasonisBacteroides ovatus
UC ClostridialesBacteroides uniformis
Bacteroides spp.Collinsella stercoris
Parabacteroides spp.Peptoniphilus spp.
Erysipelotrichaceae spp.Bacteroides fragilis
Blautia productaStreptococcus spp.
Oscillospira spp. UC Bacteroides
Acidaminococcus spp.Clostridiium perfringens
Collinsella aerofaciensAllobaculum spp.
Crohn's disease Ulcerative Colitis
1 2 3 4 5 6 7 8 9 10 11
ICI Score
0 10 20 30 40 50
IgA
+ consortium
IgA
- consortium
Figure 35: Taxonomic composition of the IgA coated and non-coated bacteria and results of the nice
colonization. Panel A: Selection of individual bacterial isolates comprising IgA+ and IgA- consortia and
colonization of germ-free mice. Specific isolates that were included in the consortia are boxed in green (IgA-) or
red (IgA+). Panel B, C, D: Influence on IgA+ and IgA- bacterial consortia on DSS-induced colitis in gnotobiotic
mice. Panel B: Colon length, Panel C: Gross pathology of large bowel, Panel D: Colon histopathology score.
Author: Palm et al. (2014)
it from the gut. This result also indicates that C. difficile is not coating its cell surface with molecules avoiding
SIgA opsonization, as some pathogens do (Ng et al., 2013; Vimr et al., 2004).
In the clinical practice, the hospitalized patients are under different types of antibiotic treatment, from
which especially cephalosporins, fluoroquinolones and Clindamycin are associated with the onset of CDI.
These divergent antibiotics perturb the gut microbiome composition of CDI patients in different ways (Rojo
et al., 2015; Knecht et al., 2014). The patients under risk of CDI are often treated with Metronidazole or
Vancomycin which are usually still effective against CDI, even though they have been associated with CDI
recurrence and with the increased prevalence of nosocomial Enterococcus infections (Al-Nassir et al., 2008;
Ozaki et al., 2004). The canonical correspondence analysis with the "envfit" function in present study showed
that the antibiotics influence the composition of the gut microbiota in such an extent that the influence of CDI
toxins on the gut microbiota is not observable.
Enterococcus was exclusively dominating the four fractions of patients under antibiotic CDI treatment.
This is in accordance with the results of the culture experiment, in which fecal bacteria were cultivated in
the rich gut microbiota medium with and without Metronidazole. Enterococcus dominated the active-F of
the culture with antibiotics, however, a smaller portion of Enterococcus was found to be in the inactive-F,
too. The antibiotic resistant bacteria in the gut are quickly growing, but their smaller portion is also dying.
Therefore, Enterococcus had significant influence on the ordination of both active-F and inactive-F samples in
the canonical correspondence analysis. Previous studies also showed that certain part of the most dominant
genera of the human gut, e.g. Bacteroides, is actually inactive (Peris-Bondia et al., 2011; Maurice et al., 2013).
Accordingly, Enterococcus cells were mostly inactive in the gut of the patients without antibiotic CDI treatment,
while in the patients undertaking CDI antibiotic treatment Enterococcus was mostly active.
The bacterial resistance or susceptibility to multiple antibiotics, which are applied in combinations in the
clinical practice, were detected by the extraction of Markov blankets from the Bayesian network connecting
the increased prevalence of bacterial genera in the four individual fractions with the medical data. Bayesian
networks have been previously used to reveal probabilistic relationships between bacterial communities and
clinical markers (Vazquez-Castellanos et al., 2014). In the present study, the antibiotic combinations had
63
Active and IgA-coated cells sorting in Clostridium difficile infection
synergistic effect on decreased activity of Staphylococcus and Rothia, what reflected antibiotic susceptibility of
these genera (Liu et al., 2011; von Eiff et al., 1995). Bayesian network also revealed that the CDI- patients
had typically increased activity of cells belonging to Clostridium cluster IV. This cluster is formed mainly
by commensal Clostridia which have been found to maintain gut homeostasis and often mark the difference
between CDI+ and CDI- gut microbiomes (Lopetuso et al., 2013). The immune system of CDI- does not have to
fight against C. difficile, therefore other bacteria, such as Fusobacterium, have been found typically increased in
their SIgA coated fractions. Despite the fact that the presence of Fusobacterium was associated in some studies
with various diseases, including inflammatory bowel disease or colon cancer, its role remains unexplained,
because it also belongs to the most prevalent genera of the gut of healthy individuals (Sommer and Bäckhed,
2013). Interestingly, Lactobacillus was found to be inactive in CDI+ patients. It has been found to have an
inhibitory effect against C. difficile growth and therefore it was selected for the probiotic CDI treatment for
clinical studies (Gao et al., 2010; Rolfe et al., 1981). The results of the present study indicated that one of the
factors allowing proliferation of C. difficile may be the absence of active Lactobacillus in the gut.
64
Active and IgA-coated cells sorting in Clostridium difficile infection
3.6 ConclusionsIn clinical practice, hospitalized patients take different types of antibiotics. Despite being on the same
risk of CDI onset (being hospitalized at the same department, taking similar antibiotics) some of the patients
develop CDI and some do not. The detection of C. difficile from feces is not a marker for CDI patients, because
also non-toxigenic C. difficile strains exist. Therefore, after numerous metagenomic studies the definition of a
microbiome susceptible to CDI remains elusive.
Our results indicate that the differences in microbial composition of CDI+ and CDI- patients cannot be
detected by a simple comparison of the proportion of the most prevalent bacterial groups, because the overall
bacterial composition is influenced more significantly by antibiotics than by CDI. However, the fractionation
of the gut microbiota according to their activity and SIgA opsonization provides more information on
bacterial dysbiosis during CDI. When the proportions of SIgA-coated and non-SIgA-coated bacterial cells
were compared for each genus, we have found that the abundant SIgA-coating of Clostridium cluster XI (the
C. difficile cluster) is a marker for CDI+ patients. When the proportions of active and inactive gut bacteria for
each genus were compared, a greater part of beneficial Lactobacillales and Clostridium cluster IV were found
dying in CDI+ patients.
The excessive coating of C. difficile (Clostridium cluster XI) by intestinal SIgA and decreased activity
of beneficial bacteria are the markers of CDI, independently on the overall bacterial composition of gut
microbiota which is, on the other hand, shaped mostly by antibiotics. The results showed that C. difficile
is being recognized by the intestinal immune system, meaning that this pathogen does not use the metabolites
of the proliferating antibiotic resistant bacteria for covering its cell surface against SIgA opsonization. On
the other hand, the CDI onset is connected to decreased activity of bacterial species which under normal
conditions produce molecules inhibiting growth of C. difficile.
65

Chapter4Selective inhibitory effect of
8-hydroxyquinoline on C. difficile
Associated original articles:
Novakova, J., Džunková, M., Musilova, A., Vlkova, E., Kokoska, L., Moya, A., D’Auria, G. (2014) Selective
growth-inhibitory effect of 8-hydroxyquinoline towards Clostridium difficile and Bifidobacterium longum subsp.
longum in co-culture analyzed by flow cytometry. Journal of Medical Microbiology 63: 1663-9.
JN and MD contributed equally to work

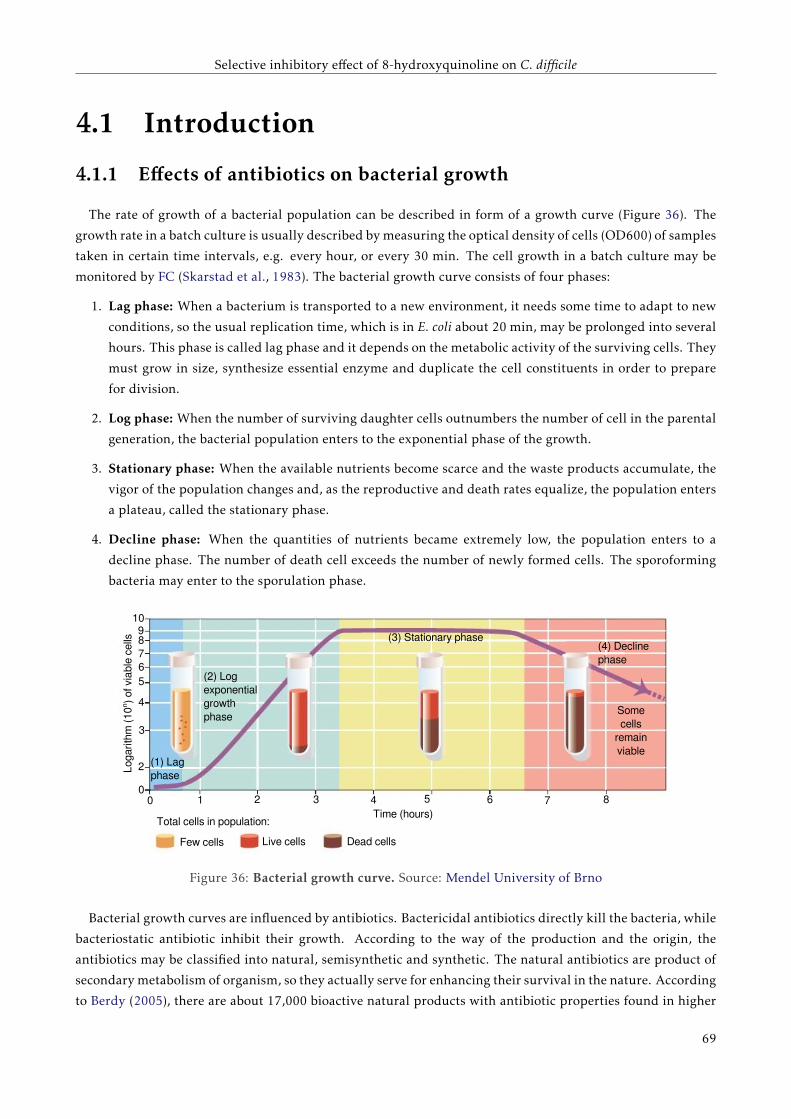
Selective inhibitory effect of 8-hydroxyquinoline on C. difficile
4.1 Introduction
4.1.1 Effects of antibiotics on bacterial growth
The rate of growth of a bacterial population can be described in form of a growth curve (Figure 36). The
growth rate in a batch culture is usually described by measuring the optical density of cells (OD600) of samples
taken in certain time intervals, e.g. every hour, or every 30 min. The cell growth in a batch culture may be
monitored by FC (Skarstad et al., 1983). The bacterial growth curve consists of four phases:
1. Lag phase: When a bacterium is transported to a new environment, it needs some time to adapt to new
conditions, so the usual replication time, which is in E. coli about 20 min, may be prolonged into several
hours. This phase is called lag phase and it depends on the metabolic activity of the surviving cells. They
must grow in size, synthesize essential enzyme and duplicate the cell constituents in order to prepare
for division.
2. Log phase: When the number of surviving daughter cells outnumbers the number of cell in the parental
generation, the bacterial population enters to the exponential phase of the growth.
3. Stationary phase: When the available nutrients become scarce and the waste products accumulate, the
vigor of the population changes and, as the reproductive and death rates equalize, the population enters
a plateau, called the stationary phase.
4. Decline phase: When the quantities of nutrients became extremely low, the population enters to a
decline phase. The number of death cell exceeds the number of newly formed cells. The sporoforming
bacteria may enter to the sporulation phase.
Few cells Live cells Dead cells
Total cells in population:Time (hours)
Log
arith
m (
10
n ) of
via
ble
cel
ls
0
2
3
4
56789
10
0 1 2 3 4 5 6 7 8
(1) Lagphase
(2) Logexponentialgrowthphase
(3) Stationary phase(4) Decline phase
Some cells
remain viable
Figure 36: Bacterial growth curve. Source: Mendel University of Brno
Bacterial growth curves are influenced by antibiotics. Bactericidal antibiotics directly kill the bacteria, while
bacteriostatic antibiotic inhibit their growth. According to the way of the production and the origin, the
antibiotics may be classified into natural, semisynthetic and synthetic. The natural antibiotics are product of
secondary metabolism of organism, so they actually serve for enhancing their survival in the nature. According
to Berdy (2005), there are about 17,000 bioactive natural products with antibiotic properties found in higher
69
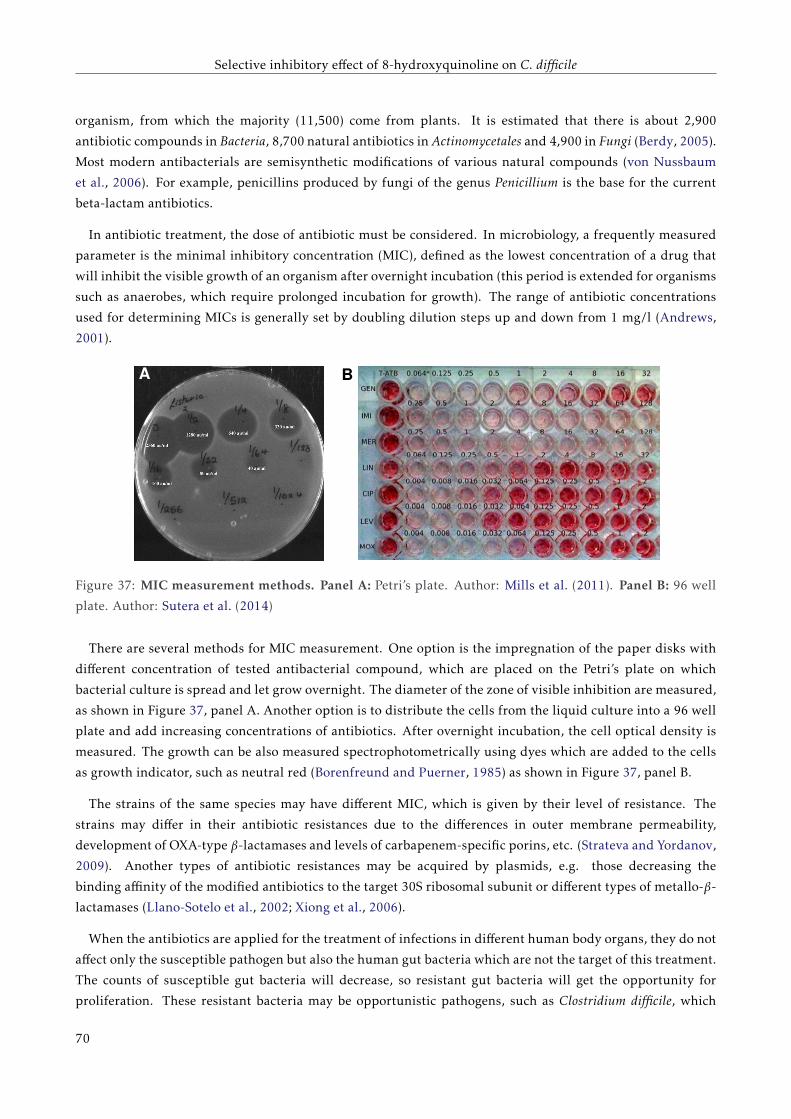
Selective inhibitory effect of 8-hydroxyquinoline on C. difficile
organism, from which the majority (11,500) come from plants. It is estimated that there is about 2,900
antibiotic compounds in Bacteria, 8,700 natural antibiotics in Actinomycetales and 4,900 in Fungi (Berdy, 2005).
Most modern antibacterials are semisynthetic modifications of various natural compounds (von Nussbaum
et al., 2006). For example, penicillins produced by fungi of the genus Penicillium is the base for the current
beta-lactam antibiotics.
In antibiotic treatment, the dose of antibiotic must be considered. In microbiology, a frequently measured
parameter is the minimal inhibitory concentration (MIC), defined as the lowest concentration of a drug that
will inhibit the visible growth of an organism after overnight incubation (this period is extended for organisms
such as anaerobes, which require prolonged incubation for growth). The range of antibiotic concentrations
used for determining MICs is generally set by doubling dilution steps up and down from 1 mg/l (Andrews,
2001).
A B
Figure 37: MIC measurement methods. Panel A: Petri’s plate. Author: Mills et al. (2011). Panel B: 96 well
plate. Author: Sutera et al. (2014)
There are several methods for MIC measurement. One option is the impregnation of the paper disks with
different concentration of tested antibacterial compound, which are placed on the Petri’s plate on which
bacterial culture is spread and let grow overnight. The diameter of the zone of visible inhibition are measured,
as shown in Figure 37, panel A. Another option is to distribute the cells from the liquid culture into a 96 well
plate and add increasing concentrations of antibiotics. After overnight incubation, the cell optical density is
measured. The growth can be also measured spectrophotometrically using dyes which are added to the cells
as growth indicator, such as neutral red (Borenfreund and Puerner, 1985) as shown in Figure 37, panel B.
The strains of the same species may have different MIC, which is given by their level of resistance. The
strains may differ in their antibiotic resistances due to the differences in outer membrane permeability,
development of OXA-type β-lactamases and levels of carbapenem-specific porins, etc. (Strateva and Yordanov,
2009). Another types of antibiotic resistances may be acquired by plasmids, e.g. those decreasing the
binding affinity of the modified antibiotics to the target 30S ribosomal subunit or different types of metallo-β-
lactamases (Llano-Sotelo et al., 2002; Xiong et al., 2006).
When the antibiotics are applied for the treatment of infections in different human body organs, they do not
affect only the susceptible pathogen but also the human gut bacteria which are not the target of this treatment.
The counts of susceptible gut bacteria will decrease, so resistant gut bacteria will get the opportunity for
proliferation. These resistant bacteria may be opportunistic pathogens, such as Clostridium difficile, which
70
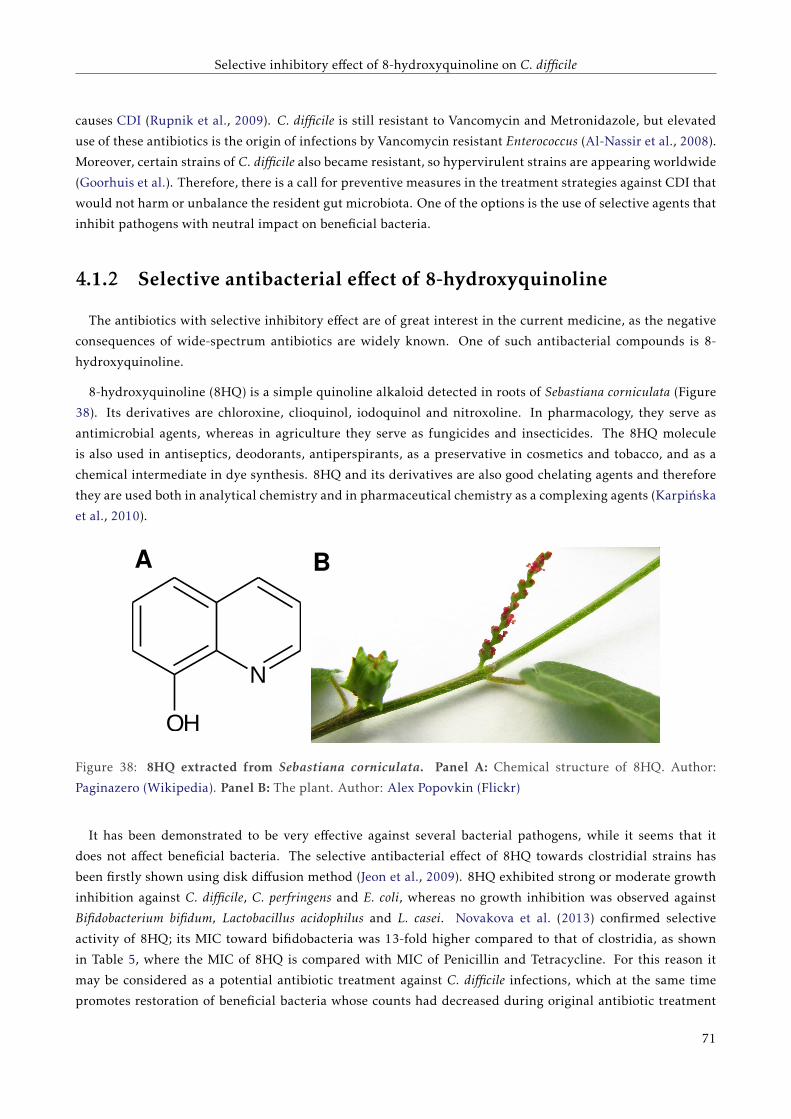
Selective inhibitory effect of 8-hydroxyquinoline on C. difficile
causes CDI (Rupnik et al., 2009). C. difficile is still resistant to Vancomycin and Metronidazole, but elevated
use of these antibiotics is the origin of infections by Vancomycin resistant Enterococcus (Al-Nassir et al., 2008).
Moreover, certain strains of C. difficile also became resistant, so hypervirulent strains are appearing worldwide
(Goorhuis et al.). Therefore, there is a call for preventive measures in the treatment strategies against CDI that
would not harm or unbalance the resident gut microbiota. One of the options is the use of selective agents that
inhibit pathogens with neutral impact on beneficial bacteria.
4.1.2 Selective antibacterial effect of 8-hydroxyquinoline
The antibiotics with selective inhibitory effect are of great interest in the current medicine, as the negative
consequences of wide-spectrum antibiotics are widely known. One of such antibacterial compounds is 8-
hydroxyquinoline.
8-hydroxyquinoline (8HQ) is a simple quinoline alkaloid detected in roots of Sebastiana corniculata (Figure
38). Its derivatives are chloroxine, clioquinol, iodoquinol and nitroxoline. In pharmacology, they serve as
antimicrobial agents, whereas in agriculture they serve as fungicides and insecticides. The 8HQ molecule
is also used in antiseptics, deodorants, antiperspirants, as a preservative in cosmetics and tobacco, and as a
chemical intermediate in dye synthesis. 8HQ and its derivatives are also good chelating agents and therefore
they are used both in analytical chemistry and in pharmaceutical chemistry as a complexing agents (Karpińska
et al., 2010).
N
OH
A B
Figure 38: 8HQ extracted from Sebastiana corniculata. Panel A: Chemical structure of 8HQ. Author:
Paginazero (Wikipedia). Panel B: The plant. Author: Alex Popovkin (Flickr)
It has been demonstrated to be very effective against several bacterial pathogens, while it seems that it
does not affect beneficial bacteria. The selective antibacterial effect of 8HQ towards clostridial strains has
been firstly shown using disk diffusion method (Jeon et al., 2009). 8HQ exhibited strong or moderate growth
inhibition against C. difficile, C. perfringens and E. coli, whereas no growth inhibition was observed against
Bifidobacterium bifidum, Lactobacillus acidophilus and L. casei. Novakova et al. (2013) confirmed selective
activity of 8HQ; its MIC toward bifidobacteria was 13-fold higher compared to that of clostridia, as shown
in Table 5, where the MIC of 8HQ is compared with MIC of Penicillin and Tetracycline. For this reason it
may be considered as a potential antibiotic treatment against C. difficile infections, which at the same time
promotes restoration of beneficial bacteria whose counts had decreased during original antibiotic treatment
71
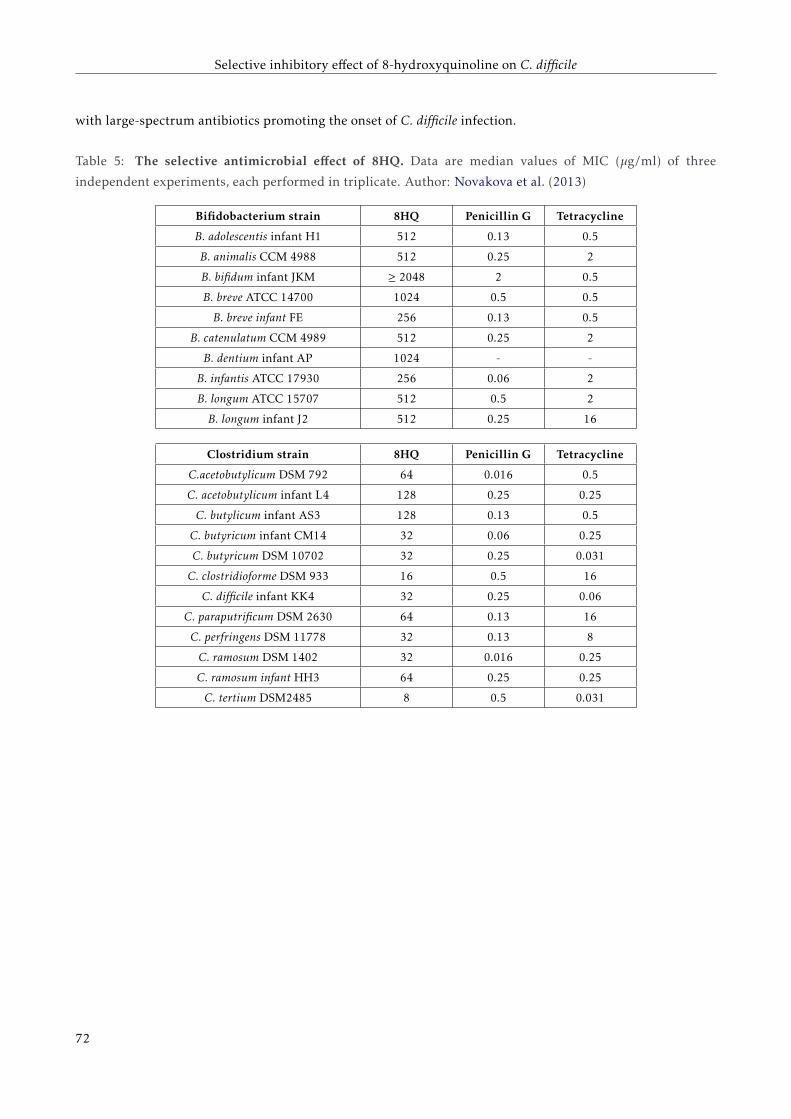
Selective inhibitory effect of 8-hydroxyquinoline on C. difficile
with large-spectrum antibiotics promoting the onset of C. difficile infection.
Table 5: The selective antimicrobial effect of 8HQ. Data are median values of MIC (µg/ml) of three
independent experiments, each performed in triplicate. Author: Novakova et al. (2013)
Bifidobacterium strain 8HQ Penicillin G Tetracycline
B. adolescentis infant H1 512 0.13 0.5
B. animalis CCM 4988 512 0.25 2
B. bifidum infant JKM ≥ 2048 2 0.5
B. breve ATCC 14700 1024 0.5 0.5
B. breve infant FE 256 0.13 0.5
B. catenulatum CCM 4989 512 0.25 2
B. dentium infant AP 1024 - -
B. infantis ATCC 17930 256 0.06 2
B. longum ATCC 15707 512 0.5 2
B. longum infant J2 512 0.25 16
Clostridium strain 8HQ Penicillin G Tetracycline
C.acetobutylicum DSM 792 64 0.016 0.5
C. acetobutylicum infant L4 128 0.25 0.25
C. butylicum infant AS3 128 0.13 0.5
C. butyricum infant CM14 32 0.06 0.25
C. butyricum DSM 10702 32 0.25 0.031
C. clostridioforme DSM 933 16 0.5 16
C. difficile infant KK4 32 0.25 0.06
C. paraputrificum DSM 2630 64 0.13 16
C. perfringens DSM 11778 32 0.13 8
C. ramosum DSM 1402 32 0.016 0.25
C. ramosum infant HH3 64 0.25 0.25
C. tertium DSM2485 8 0.5 0.031
72
Selective inhibitory effect of 8-hydroxyquinoline on C. difficile
4.2 ObjectivesThere are thousands of antibiotic compounds in the nature. Some of them, as 8HQ, have been demonstrated
to have selective antibacterial properties. These selective properties are usually tested on individual cultures
of different bacterial species and strains, however it is impossible to determine the selective action of these
antibiotics to different strains growing in a co-culture.
If it is not possible to distinguish between two bacterial species grown in co-culture by simple microscopical
observation of their morphology, their 16S rRNA may be hybridized by fluorescently labeled probes and so the
proportion of each species may calculated by visualization by the fluorescent microscope. However, counting
of cells by FC is more effective than microscopic visualization of a small aliquot of cells, because FC is more
sensitive and can process large number of cells per second. Small populations of distinct cells in a sample
containing thousands of cells can be detected by FC.
The selective antibacterial effect of 8HQ will be studied on a co-culture of C. difficile with Bifidobacterium
longum subsp. longum monitored by FC. Since the culture methods commonly used for selectivity testing (e.g.
agar dilution or broth microdilution method) do not allow detailed study of this aspect, FC combined with
FISH may be useful for the monitoring of the two populations dynamics in individual and mixed cultures.
The experiment will be performed in media with and without 8HQ. For evaluation of the FC results, the
growth rate data will be compared with measurements of optical density of the cultures.
This work aims to explain in more detail growth dynamics of co-culture of two species in media with
antibiotic agent with selective activity against one of them.
73
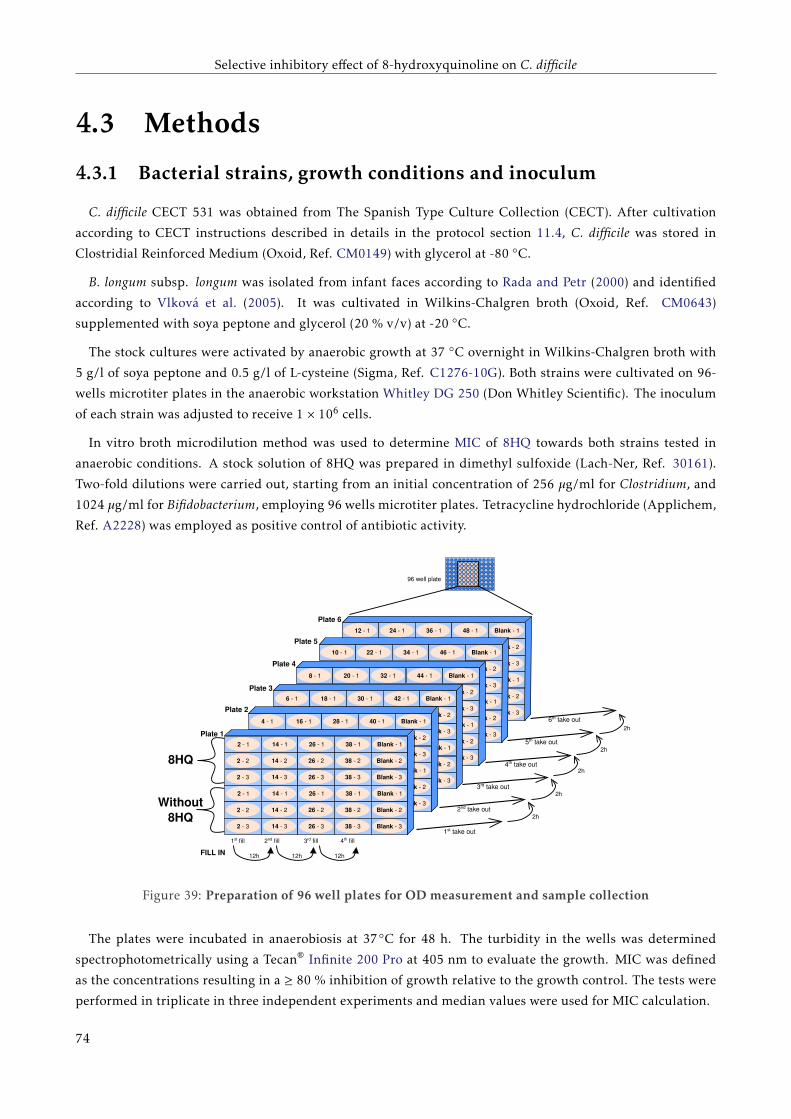
Selective inhibitory effect of 8-hydroxyquinoline on C. difficile
4.3 Methods
4.3.1 Bacterial strains, growth conditions and inoculum
C. difficile CECT 531 was obtained from The Spanish Type Culture Collection (CECT). After cultivation
according to CECT instructions described in details in the protocol section 11.4, C. difficile was stored in
Clostridial Reinforced Medium (Oxoid, Ref. CM0149) with glycerol at -80 ◦C.
B. longum subsp. longum was isolated from infant faces according to Rada and Petr (2000) and identified
according to Vlková et al. (2005). It was cultivated in Wilkins-Chalgren broth (Oxoid, Ref. CM0643)
supplemented with soya peptone and glycerol (20 % v/v) at -20 ◦C.
The stock cultures were activated by anaerobic growth at 37 ◦C overnight in Wilkins-Chalgren broth with
5 g/l of soya peptone and 0.5 g/l of L-cysteine (Sigma, Ref. C1276-10G). Both strains were cultivated on 96-
wells microtiter plates in the anaerobic workstation Whitley DG 250 (Don Whitley Scientific). The inoculum
of each strain was adjusted to receive 1 × 10⁶ cells.
In vitro broth microdilution method was used to determine MIC of 8HQ towards both strains tested in
anaerobic conditions. A stock solution of 8HQ was prepared in dimethyl sulfoxide (Lach-Ner, Ref. 30161).
Two-fold dilutions were carried out, starting from an initial concentration of 256 µg/ml for Clostridium, and
1024 µg/ml for Bifidobacterium, employing 96 wells microtiter plates. Tetracycline hydrochloride (Applichem,
Ref. A2228) was employed as positive control of antibiotic activity.
Blank - 1
Blank - 2
Blank - 3
Blank - 1
Blank - 2
Blank - 3
12 - 1 24 - 1 36 - 1 48 - 1
Plate 1
Plate 2
Plate 3
Plate 4
Plate 5
Plate 6
1st fill 2nd fill 3rd fill 4th fill
12h 12h 12hFILL IN
2h
2h
2h
2h
2h
96 well plate
10 - 1 22 - 1 34 - 1 46 - 1 Blank - 1
Blank - 2
Blank - 3
Blank - 1
Blank - 2
Blank - 3
8 - 1 20 - 1 32 - 1 44 - 1 Blank - 1
Blank - 2
Blank - 3
Blank - 1
Blank - 2
Blank - 3
6 - 1 18 - 1 30 - 1 42 - 1 Blank - 1
Blank - 2
Blank - 3
Blank - 1
Blank - 2
Blank - 3
4 - 1 16 - 1 28 - 1 40 - 1 Blank - 1
Blank - 2
Blank - 3
Blank - 1
Blank - 2
Blank - 3
2 - 1
2 - 2
2 - 3
2 - 1
2 - 2
2 - 3
14 - 1
14 - 2
14 - 3
14 - 1
14 - 2
14 - 3
26 - 1
26 - 2
26 - 3
26 - 1
26 - 2
26 - 3
38 - 1
38 - 2
38 - 3
38 - 1
38 - 2
38 - 3
Blank - 1
Blank - 2
Blank - 3
Blank - 1
Blank - 2
Blank - 3
8HQ
Without 8HQ
1st take out
2nd take out
3rd take out
4th take out
5th take out
6th take out
Figure 39: Preparation of 96 well plates for OD measurement and sample collection
The plates were incubated in anaerobiosis at 37◦C for 48 h. The turbidity in the wells was determined
spectrophotometrically using a Tecan® Infinite 200 Pro at 405 nm to evaluate the growth. MIC was defined
as the concentrations resulting in a ≥ 80 % inhibition of growth relative to the growth control. The tests were
performed in triplicate in three independent experiments and median values were used for MIC calculation.
74
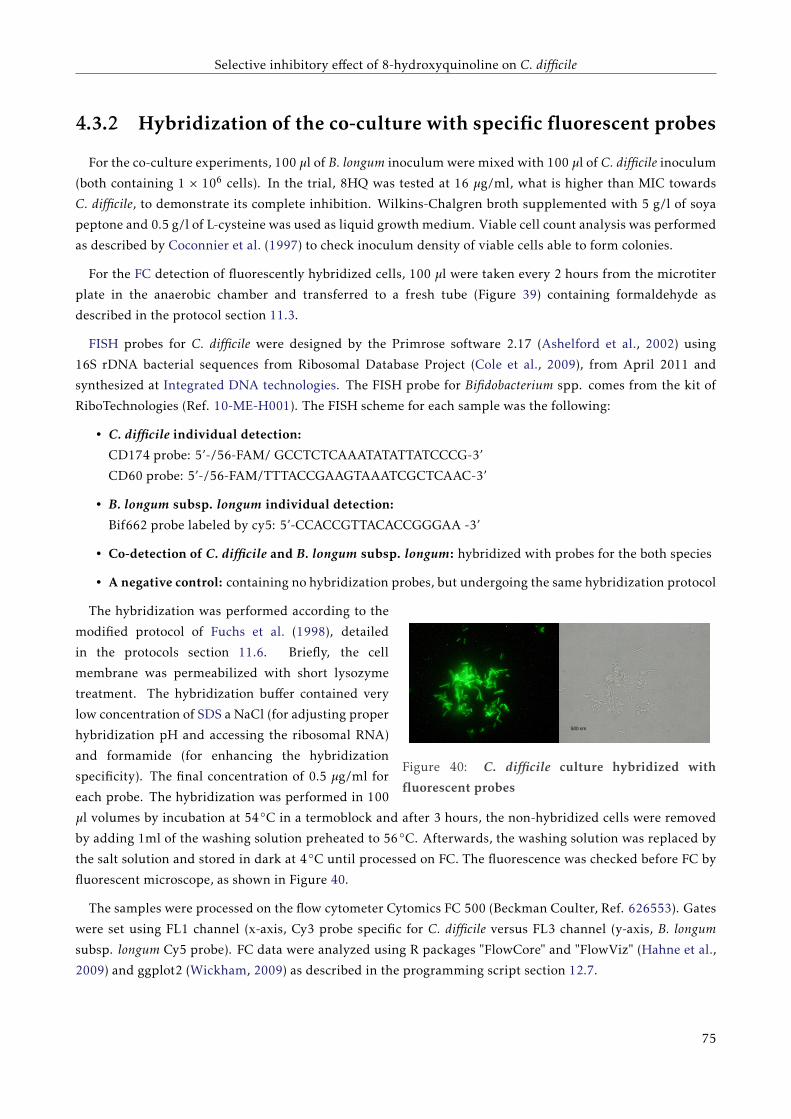
Selective inhibitory effect of 8-hydroxyquinoline on C. difficile
4.3.2 Hybridization of the co-culture with specific fluorescent probes
For the co-culture experiments, 100 µl of B. longum inoculum were mixed with 100 µl of C. difficile inoculum
(both containing 1 × 10⁶ cells). In the trial, 8HQ was tested at 16 µg/ml, what is higher than MIC towards
C. difficile, to demonstrate its complete inhibition. Wilkins-Chalgren broth supplemented with 5 g/l of soya
peptone and 0.5 g/l of L-cysteine was used as liquid growth medium. Viable cell count analysis was performed
as described by Coconnier et al. (1997) to check inoculum density of viable cells able to form colonies.
For the FC detection of fluorescently hybridized cells, 100 µl were taken every 2 hours from the microtiter
plate in the anaerobic chamber and transferred to a fresh tube (Figure 39) containing formaldehyde as
described in the protocol section 11.3.
FISH probes for C. difficile were designed by the Primrose software 2.17 (Ashelford et al., 2002) using
16S rDNA bacterial sequences from Ribosomal Database Project (Cole et al., 2009), from April 2011 and
synthesized at Integrated DNA technologies. The FISH probe for Bifidobacterium spp. comes from the kit of
RiboTechnologies (Ref. 10-ME-H001). The FISH scheme for each sample was the following:
• C. difficile individual detection:
CD174 probe: 5’-/56-FAM/ GCCTCTCAAATATATTATCCCG-3’
CD60 probe: 5’-/56-FAM/TTTACCGAAGTAAATCGCTCAAC-3’
• B. longum subsp. longum individual detection:
Bif662 probe labeled by cy5: 5’-CCACCGTTACACCGGGAA -3’
• Co-detection of C. difficile and B. longum subsp. longum: hybridized with probes for the both species
• A negative control: containing no hybridization probes, but undergoing the same hybridization protocol
500 nm
Figure 40: C. difficile culture hybridized with
fluorescent probes
The hybridization was performed according to the
modified protocol of Fuchs et al. (1998), detailed
in the protocols section 11.6. Briefly, the cell
membrane was permeabilized with short lysozyme
treatment. The hybridization buffer contained very
low concentration of SDS a NaCl (for adjusting proper
hybridization pH and accessing the ribosomal RNA)
and formamide (for enhancing the hybridization
specificity). The final concentration of 0.5 µg/ml for
each probe. The hybridization was performed in 100
µl volumes by incubation at 54◦C in a termoblock and after 3 hours, the non-hybridized cells were removed
by adding 1ml of the washing solution preheated to 56◦C. Afterwards, the washing solution was replaced by
the salt solution and stored in dark at 4◦C until processed on FC. The fluorescence was checked before FC by
fluorescent microscope, as shown in Figure 40.
The samples were processed on the flow cytometer Cytomics FC 500 (Beckman Coulter, Ref. 626553). Gates
were set using FL1 channel (x-axis, Cy3 probe specific for C. difficile versus FL3 channel (y-axis, B. longum
subsp. longum Cy5 probe). FC data were analyzed using R packages "FlowCore" and "FlowViz" (Hahne et al.,
2009) and ggplot2 (Wickham, 2009) as described in the programming script section 12.7.
75
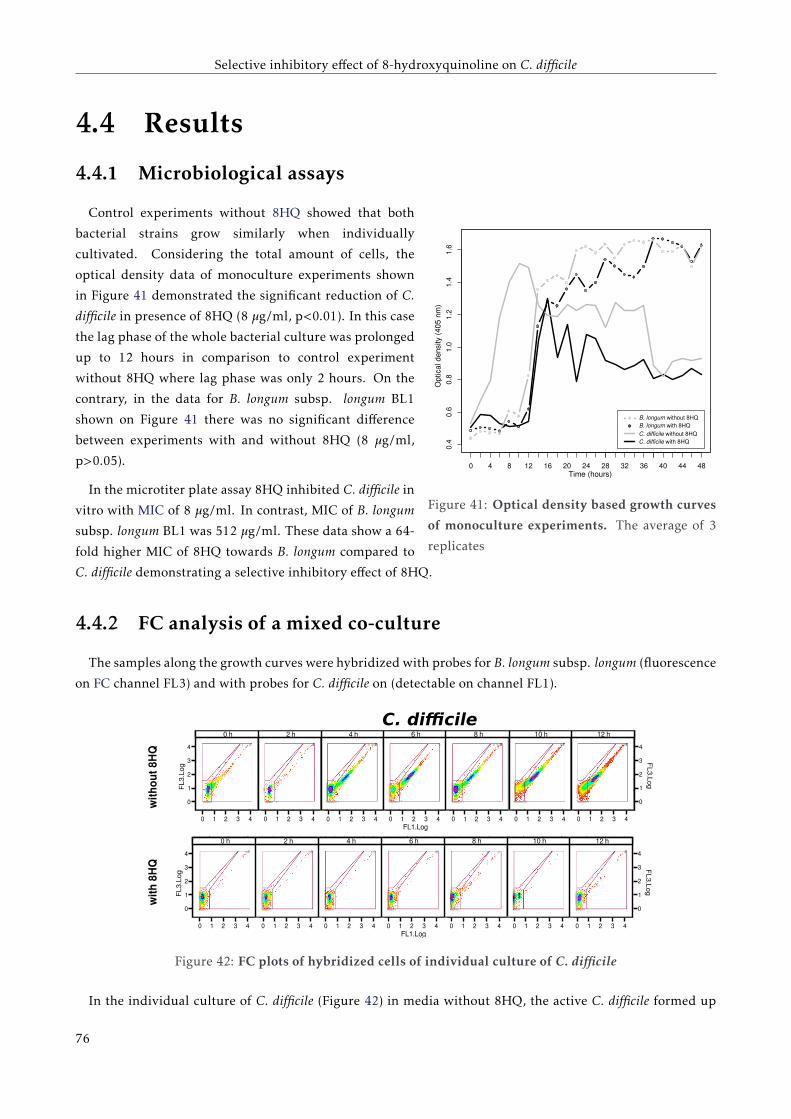
Selective inhibitory effect of 8-hydroxyquinoline on C. difficile
4.4 Results
4.4.1 Microbiological assays
0.4
0.6
0.8
1.0
1.2
1.4
1.6
0 4 8 12 16 20 24 28 32 36 40 44 48Time (hours)
Opt
ical
dens
ity(4
05nm
)
B. longum without 8HQB. longum with 8HQC. difficile without 8HQC. difficile with 8HQ
Figure 41: Optical density based growth curves
of monoculture experiments. The average of 3
replicates
Control experiments without 8HQ showed that both
bacterial strains grow similarly when individually
cultivated. Considering the total amount of cells, the
optical density data of monoculture experiments shown
in Figure 41 demonstrated the significant reduction of C.
difficile in presence of 8HQ (8 µg/ml, p<0.01). In this case
the lag phase of the whole bacterial culture was prolonged
up to 12 hours in comparison to control experiment
without 8HQ where lag phase was only 2 hours. On the
contrary, in the data for B. longum subsp. longum BL1
shown on Figure 41 there was no significant difference
between experiments with and without 8HQ (8 µg/ml,
p>0.05).
In the microtiter plate assay 8HQ inhibited C. difficile in
vitro with MIC of 8 µg/ml. In contrast, MIC of B. longum
subsp. longum BL1 was 512 µg/ml. These data show a 64-
fold higher MIC of 8HQ towards B. longum compared to
C. difficile demonstrating a selective inhibitory effect of 8HQ.
4.4.2 FC analysis of a mixed co-culture
The samples along the growth curves were hybridized with probes for B. longum subsp. longum (fluorescence
on FC channel FL3) and with probes for C. difficile on (detectable on channel FL1).
wit
h 8
HQ
0
1
2
3
4
0
1
2
3
4
0 1 2 3 4 0 1 2 3 4 0 1 2 3 4 0 1 2 3 4 0 1 2 3 4 0 1 2 3 4 0 1 2 3 4
0 h 2 h 4 h 6 h 8 h 10 h 12 h
FL1.Log
FL
3.L
og
FL
3.L
og
wit
ho
ut
8HQ
0
1
2
3
4
0
1
2
3
4
0 1 2 3 4 0 1 2 3 4 0 1 2 3 4 0 1 2 3 4 0 1 2 3 4 0 1 2 3 4 0 1 2 3 4
0 h 2 h 4 h 6 h 8 h 10 h 12 h
FL1.Log
FL
3.L
og
FL
3.L
og
A C. difficile
Figure 42: FC plots of hybridized cells of individual culture of C. difficile
In the individual culture of C. difficile (Figure 42) in media without 8HQ, the active C. difficile formed up
76
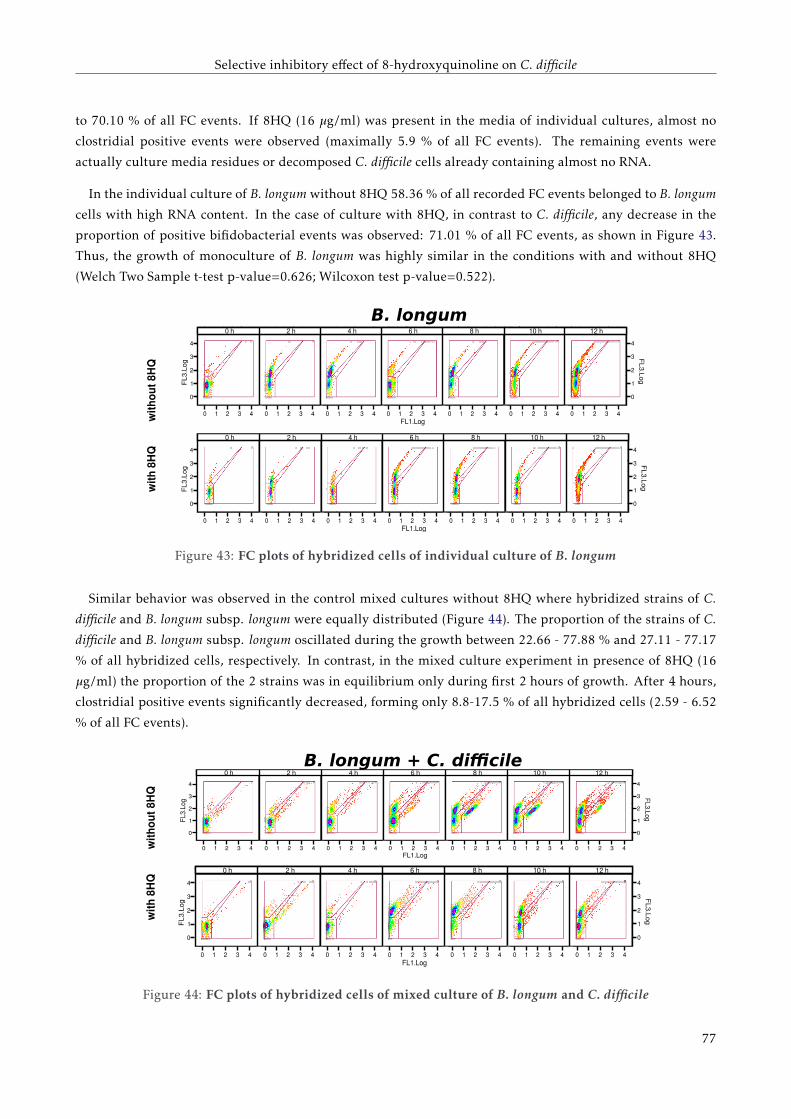
Selective inhibitory effect of 8-hydroxyquinoline on C. difficile
to 70.10 % of all FC events. If 8HQ (16 µg/ml) was present in the media of individual cultures, almost no
clostridial positive events were observed (maximally 5.9 % of all FC events). The remaining events were
actually culture media residues or decomposed C. difficile cells already containing almost no RNA.
In the individual culture of B. longum without 8HQ 58.36 % of all recorded FC events belonged to B. longum
cells with high RNA content. In the case of culture with 8HQ, in contrast to C. difficile, any decrease in the
proportion of positive bifidobacterial events was observed: 71.01 % of all FC events, as shown in Figure 43.
Thus, the growth of monoculture of B. longum was highly similar in the conditions with and without 8HQ
(Welch Two Sample t-test p-value=0.626; Wilcoxon test p-value=0.522).
B
0
1
2
3
4
0
1
2
3
4
0 1 2 3 4 0 1 2 3 4 0 1 2 3 4 0 1 2 3 4 0 1 2 3 4 0 1 2 3 4 0 1 2 3 4
0 h 2 h 4 h 6 h 8 h 10 h 12 h
FL1.Log
FL
3.L
og
FL
3.L
og
0
1
2
3
4
0
1
2
3
4
0 1 2 3 4 0 1 2 3 4 0 1 2 3 4 0 1 2 3 4 0 1 2 3 4 0 1 2 3 4 0 1 2 3 4
0 h 2 h 4 h 6 h 8 h 10 h 12 h
FL1.Log
FL
3.L
og
FL
3.L
og
wit
h 8
HQ
w
ith
ou
t 8H
Q
B. longum
Figure 43: FC plots of hybridized cells of individual culture of B. longum
Similar behavior was observed in the control mixed cultures without 8HQ where hybridized strains of C.
difficile and B. longum subsp. longum were equally distributed (Figure 44). The proportion of the strains of C.
difficile and B. longum subsp. longum oscillated during the growth between 22.66 - 77.88 % and 27.11 - 77.17
% of all hybridized cells, respectively. In contrast, in the mixed culture experiment in presence of 8HQ (16
µg/ml) the proportion of the 2 strains was in equilibrium only during first 2 hours of growth. After 4 hours,
clostridial positive events significantly decreased, forming only 8.8-17.5 % of all hybridized cells (2.59 - 6.52
% of all FC events).
C
0
1
2
3
4
0
1
2
3
4
0 1 2 3 4 0 1 2 3 4 0 1 2 3 4 0 1 2 3 4 0 1 2 3 4 0 1 2 3 4 0 1 2 3 4
0 h 2 h 4 h 6 h 8 h 10 h 12 h
FL1.Log
FL
3.L
og
FL
3.L
og
0
1
2
3
4
0
1
2
3
4
0 1 2 3 4 0 1 2 3 4 0 1 2 3 4 0 1 2 3 4 0 1 2 3 4 0 1 2 3 4 0 1 2 3 4
0 h 2 h 4 h 6 h 8 h 10 h 12 h
FL1.Log
FL3
.Log
FL3.Log
B. longum + C. difficile
wit
h 8
HQ
w
ith
ou
t 8H
Q
Figure 44: FC plots of hybridized cells of mixed culture of B. longum and C. difficile
77
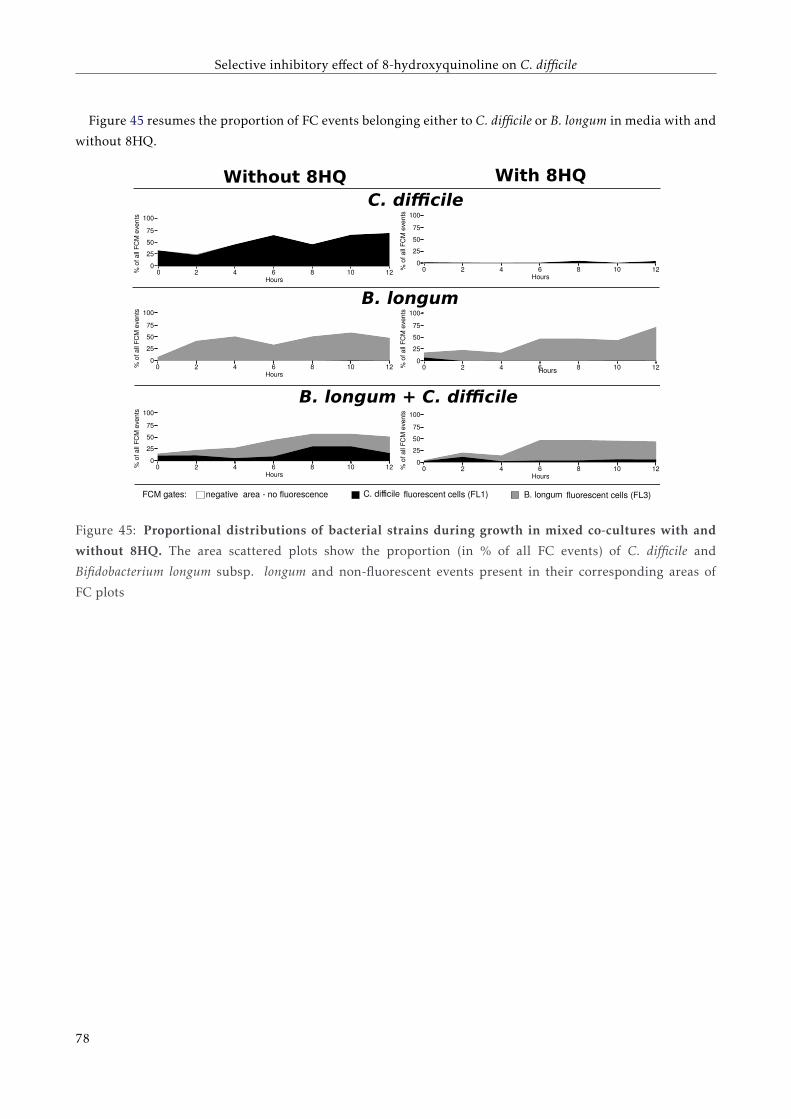
Selective inhibitory effect of 8-hydroxyquinoline on C. difficile
Figure 45 resumes the proportion of FC events belonging either to C. difficile or B. longum in media with and
without 8HQ.
100
75
50
25
00 2 4 6 8 10 12%
of
all
FC
M e
ven
ts
Hours
100
75
50
25
00 2 4 6 8 10 12%
of
all
FC
M e
ven
ts
Hours
100
75
50
25
00 2 4 6 8 10 12%
of
all
FC
M e
ven
ts
Hours
100
75
50
25
00 2 4 6 8 10 12%
of
all
FC
M e
ven
ts
Hours
100
75
50
25
00 2 4 6 8 10 12%
of
all
FC
M e
ven
ts
Hours
100
75
50
25
00 2 4 6 8 10 12%
of
all
FC
M e
ven
ts
Hours
fluorescent cells (FL1) fluorescent cells (FL3)negative area - no fluorescenceFCM gates: C. difficile B. longum
C. difficile
B. longum
B. longum + C. difficile
Without 8HQ With 8HQ
Figure 45: Proportional distributions of bacterial strains during growth in mixed co-cultures with and
without 8HQ. The area scattered plots show the proportion (in % of all FC events) of C. difficile and
Bifidobacterium longum subsp. longum and non-fluorescent events present in their corresponding areas of
FC plots
78
Selective inhibitory effect of 8-hydroxyquinoline on C. difficile
4.5 DiscussionThe present study represents an extension of the previous work of Novakova et al. (2013) where the selective
inhibitory activity of 8HQ towards 10 bifidobacterial and 12 clostridial strains in monocultures was shown.
The MIC of B. longum strains in both studies was 512 µg/ml whereas C. difficile infant isolate tested in the
previous study showed MIC of 32 µg/ml while the MIC of its type strain in the present study was even lower,
8 µg/ml.
In the present work, the selective action of 8HQ was confirmed also in a co-culture of one bifidobacterial
and one clostridial strain. The present findings supports the potential use of this molecule for therapeutic use
against CDI. 8HQ does not have negative effects on bifidobacterial strains which are considered as part of the
resident microbiota and being employed for CDI treatment (Selinger et al., 2013).
Up to now, the mechanism of 8HQ selectivity has not been elucidated. 8HQ has chelating activity, it
scavenges the metallic cations from its environment meanwhile the reactive oxygen species are formed. The
chelated metals become unavailable for enzymes and so certain metabolic processes are inhibited (Chobot
et al., 2011). 8HQ was found to inhibit polymerase activity by chelating the dissociate cations Mn2+ and
Mg2+, what results of inhibition of synthesis of ribosomal and polydisperse RNA. These are inhibited more
than 5S RNA and tRNA which may be the explanation why protein synthesis is not inhibited inmediatelly
(Fraser and Creanor, 1975). In relation to our results it could be suggested that 8HQ causes the selective RNA
polymerase inhibition because of the different ability of bifidobacteria and clostridia to accumulate metallic
ions.
Most likely the oxidative stress defense systems of the C. difficile and B. longum strains are also different.
The genome sequencing of C. difficile showed that it has several proteins putatively involved in the oxidative
stress response, such as putative manganese superoxide dismutase (CD1631), several putative manganese
catalases (CD1567, CD0598, and CD2401), even though vegetative cells of C. difficile display no catalase
activity (Sebaihia et al., 2006). On the other hand, B. longum usually does not possess manganese catalase
activity (He et al., 2012), however, these properties are strain dependent. The role of metalloenzymes in these
systems should be exploited profoundly in connection with the different acquisition of metallic ions by these
bacterial species to explain the mechanism of 8HQ selective antibacterial action.
79
Selective inhibitory effect of 8-hydroxyquinoline on C. difficile
4.6 Conclusions8HQ has selective inhibitory activity against C. difficile, while it does not affect the growth of B. longum.
It suggest that 8HQ can be potentially used as a molecule for C. difficile infection treatment. Molecules with
selective activity against C. difficile have a great potential in CDI treatment, as the protection of the normal
gut microbiota is the key factor for CDI recurrence prevention. In contrast, broad spectrum conventional
antibiotics currently used for CDI treatment perturb the normal microbiota and often cause CDI recurrence
or infections by other antibiotic resistant opportunistic pathogens.
FC analysis of cells hybridized with specific probes was used to study selective action of antibacterial
substance 8HQ towards beneficial and pathogenic bacterial strains grown in vitro in a mixed co-culture. The
combination of the sensitivity and specificity of fluorescent probes with FC analysis of thousands of bacterial
cells in seconds seems to be a powerful approach for studying bacterial population growth dynamics. FC
confirmed that 8HQ does not influence negatively the growth of beneficial B. longum at the same time as it
inhibited the opportunistic pathogen C. difficile for its first 12 hours of growth.
80
Chapter5Genetic diversity of C. difficile separated by
FACS
Associated original articles:
Džunková, M., Moya, A., Chen, X., Kelly, C., D’Auria, G.: Infection by multiple Clostridium difficile strains
detected by whole genome sequencing of FACS-separated bacteria. In preparation.

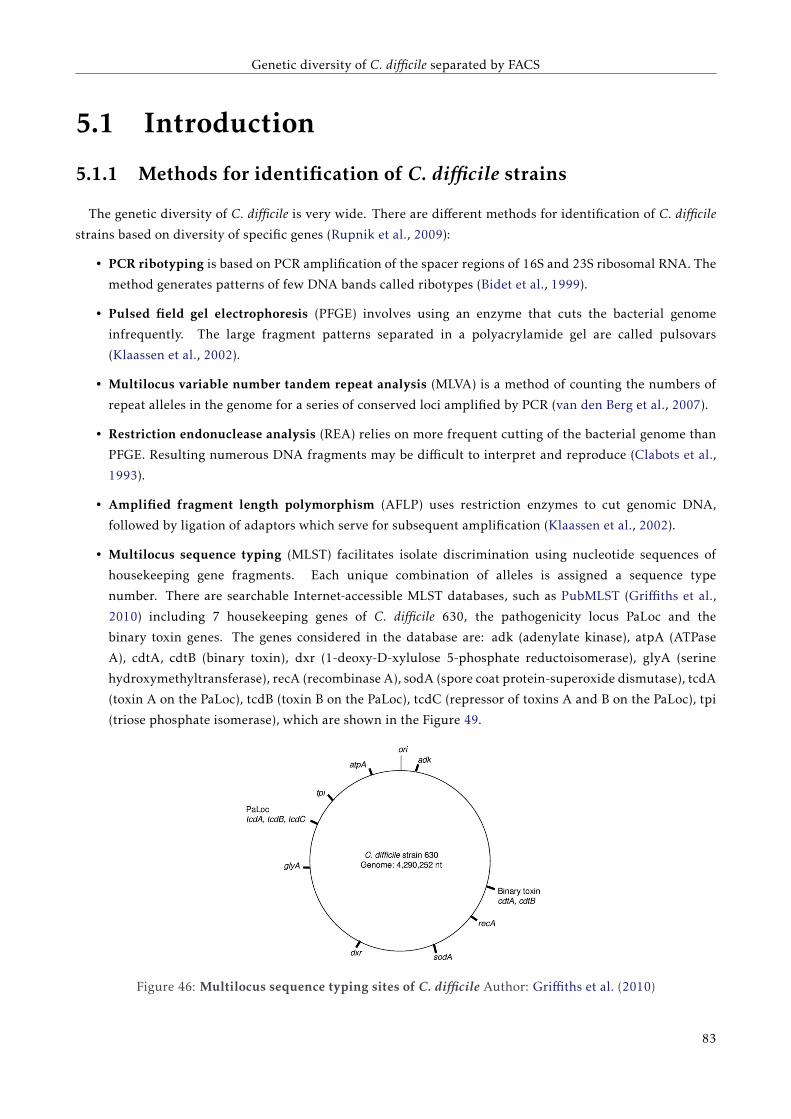
Genetic diversity of C. difficile separated by FACS
5.1 Introduction
5.1.1 Methods for identification of C. difficile strains
The genetic diversity of C. difficile is very wide. There are different methods for identification of C. difficile
strains based on diversity of specific genes (Rupnik et al., 2009):
• PCR ribotyping is based on PCR amplification of the spacer regions of 16S and 23S ribosomal RNA. The
method generates patterns of few DNA bands called ribotypes (Bidet et al., 1999).
• Pulsed field gel electrophoresis (PFGE) involves using an enzyme that cuts the bacterial genome
infrequently. The large fragment patterns separated in a polyacrylamide gel are called pulsovars
(Klaassen et al., 2002).
• Multilocus variable number tandem repeat analysis (MLVA) is a method of counting the numbers of
repeat alleles in the genome for a series of conserved loci amplified by PCR (van den Berg et al., 2007).
• Restriction endonuclease analysis (REA) relies on more frequent cutting of the bacterial genome than
PFGE. Resulting numerous DNA fragments may be difficult to interpret and reproduce (Clabots et al.,
1993).
• Amplified fragment length polymorphism (AFLP) uses restriction enzymes to cut genomic DNA,
followed by ligation of adaptors which serve for subsequent amplification (Klaassen et al., 2002).
• Multilocus sequence typing (MLST) facilitates isolate discrimination using nucleotide sequences of
housekeeping gene fragments. Each unique combination of alleles is assigned a sequence type
number. There are searchable Internet-accessible MLST databases, such as PubMLST (Griffiths et al.,
2010) including 7 housekeeping genes of C. difficile 630, the pathogenicity locus PaLoc and the
binary toxin genes. The genes considered in the database are: adk (adenylate kinase), atpA (ATPase
A), cdtA, cdtB (binary toxin), dxr (1-deoxy-D-xylulose 5-phosphate reductoisomerase), glyA (serine
hydroxymethyltransferase), recA (recombinase A), sodA (spore coat protein-superoxide dismutase), tcdA
(toxin A on the PaLoc), tcdB (toxin B on the PaLoc), tcdC (repressor of toxins A and B on the PaLoc), tpi
(triose phosphate isomerase), which are shown in the Figure 49.
Figure 46: Multilocus sequence typing sites of C. difficile Author: Griffiths et al. (2010)
83
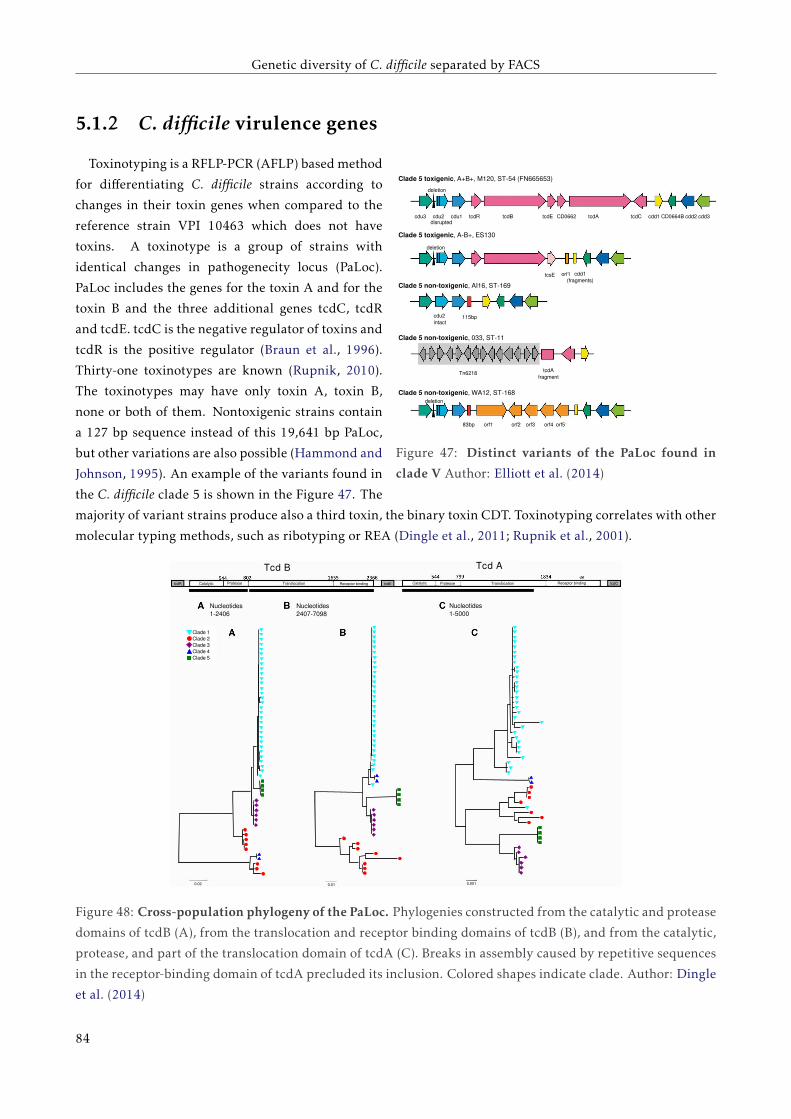
Genetic diversity of C. difficile separated by FACS
5.1.2 C. difficile virulence genes
Clade 5 toxigenic, A+B+, M120, ST-54 (FN665653)
Clade 5 toxigenic, A-B+, ES130
Clade 5 non-toxigenic, AI16, ST-169
Clade 5 non-toxigenic, 033, ST-11
Clade 5 non-toxigenic, WA12, ST-168
cdu3 cdu2 cdu1 tcdR tcdB tcdE CD0662 tcdA tcdC cdd1 CD0664B cdd2 cdd3
deletion
disrupted
deletion
tcsE orf1 cdd1(fragments)
cdu2intact
115bp
Tn6218 tcdAfragment
83bp orf1 orf2 orf3 orf4 orf5
deletion
Figure 47: Distinct variants of the PaLoc found in
clade V Author: Elliott et al. (2014)
Toxinotyping is a RFLP-PCR (AFLP) based method
for differentiating C. difficile strains according to
changes in their toxin genes when compared to the
reference strain VPI 10463 which does not have
toxins. A toxinotype is a group of strains with
identical changes in pathogenecity locus (PaLoc).
PaLoc includes the genes for the toxin A and for the
toxin B and the three additional genes tcdC, tcdR
and tcdE. tcdC is the negative regulator of toxins and
tcdR is the positive regulator (Braun et al., 1996).
Thirty-one toxinotypes are known (Rupnik, 2010).
The toxinotypes may have only toxin A, toxin B,
none or both of them. Nontoxigenic strains contain
a 127 bp sequence instead of this 19,641 bp PaLoc,
but other variations are also possible (Hammond and
Johnson, 1995). An example of the variants found in
the C. difficile clade 5 is shown in the Figure 47. The
majority of variant strains produce also a third toxin, the binary toxin CDT. Toxinotyping correlates with other
molecular typing methods, such as ribotyping or REA (Dingle et al., 2011; Rupnik et al., 2001).
Nucleotides1-2406
Nucleotides2407-7098
Nucleotides1-5000
Tcd B Tcd A
tcdR tcdCReceptor bindingTranslocationProteaseCatalytictcdECatalytic Protease Translocation Receptor binding
Clade 1Clade 2Clade 3Clade 4Clade 5
0.02 0.01 0.001
Figure 48: Cross-population phylogeny of the PaLoc. Phylogenies constructed from the catalytic and protease
domains of tcdB (A), from the translocation and receptor binding domains of tcdB (B), and from the catalytic,
protease, and part of the translocation domain of tcdA (C). Breaks in assembly caused by repetitive sequences
in the receptor-binding domain of tcdA precluded its inclusion. Colored shapes indicate clade. Author: Dingle
et al. (2014)
84
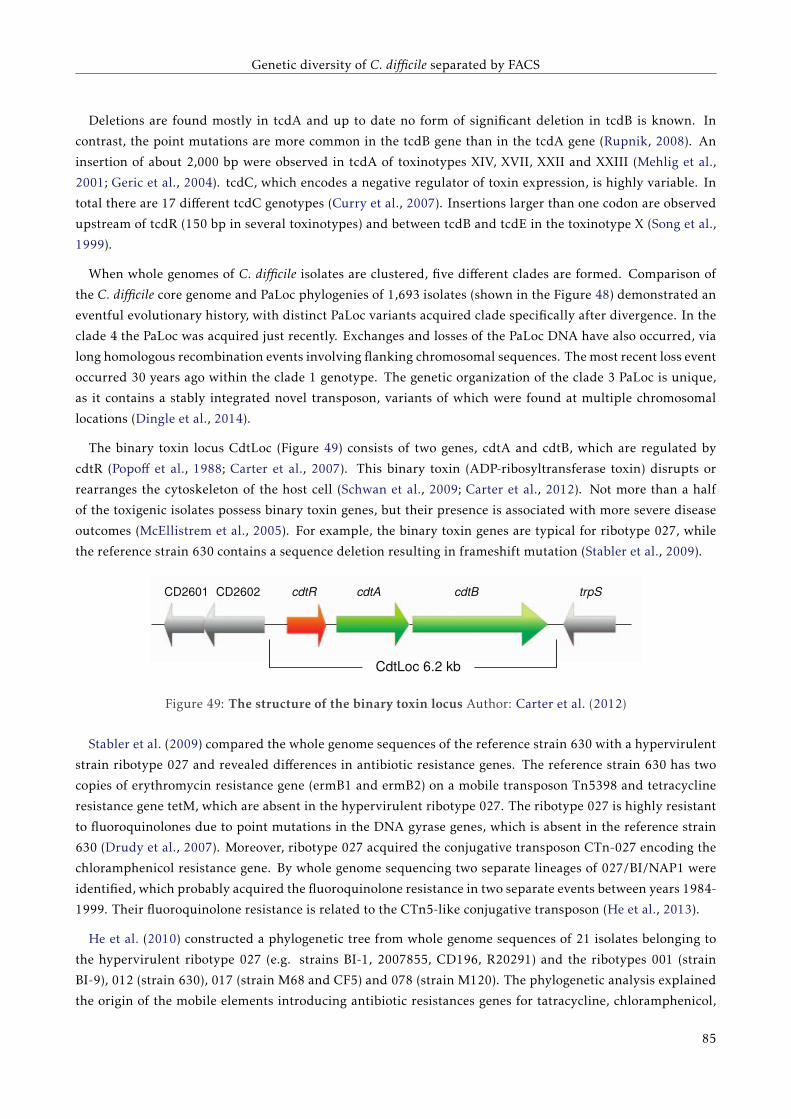
Genetic diversity of C. difficile separated by FACS
Deletions are found mostly in tcdA and up to date no form of significant deletion in tcdB is known. In
contrast, the point mutations are more common in the tcdB gene than in the tcdA gene (Rupnik, 2008). An
insertion of about 2,000 bp were observed in tcdA of toxinotypes XIV, XVII, XXII and XXIII (Mehlig et al.,
2001; Geric et al., 2004). tcdC, which encodes a negative regulator of toxin expression, is highly variable. In
total there are 17 different tcdC genotypes (Curry et al., 2007). Insertions larger than one codon are observed
upstream of tcdR (150 bp in several toxinotypes) and between tcdB and tcdE in the toxinotype X (Song et al.,
1999).
When whole genomes of C. difficile isolates are clustered, five different clades are formed. Comparison of
the C. difficile core genome and PaLoc phylogenies of 1,693 isolates (shown in the Figure 48) demonstrated an
eventful evolutionary history, with distinct PaLoc variants acquired clade specifically after divergence. In the
clade 4 the PaLoc was acquired just recently. Exchanges and losses of the PaLoc DNA have also occurred, via
long homologous recombination events involving flanking chromosomal sequences. The most recent loss event
occurred 30 years ago within the clade 1 genotype. The genetic organization of the clade 3 PaLoc is unique,
as it contains a stably integrated novel transposon, variants of which were found at multiple chromosomal
locations (Dingle et al., 2014).
The binary toxin locus CdtLoc (Figure 49) consists of two genes, cdtA and cdtB, which are regulated by
cdtR (Popoff et al., 1988; Carter et al., 2007). This binary toxin (ADP-ribosyltransferase toxin) disrupts or
rearranges the cytoskeleton of the host cell (Schwan et al., 2009; Carter et al., 2012). Not more than a half
of the toxigenic isolates possess binary toxin genes, but their presence is associated with more severe disease
outcomes (McEllistrem et al., 2005). For example, the binary toxin genes are typical for ribotype 027, while
the reference strain 630 contains a sequence deletion resulting in frameshift mutation (Stabler et al., 2009).
trpScdtBcdtAcdtRCD2602
CdtLoc 6.2 kb
CD2601
Figure 49: The structure of the binary toxin locus Author: Carter et al. (2012)
Stabler et al. (2009) compared the whole genome sequences of the reference strain 630 with a hypervirulent
strain ribotype 027 and revealed differences in antibiotic resistance genes. The reference strain 630 has two
copies of erythromycin resistance gene (ermB1 and ermB2) on a mobile transposon Tn5398 and tetracycline
resistance gene tetM, which are absent in the hypervirulent ribotype 027. The ribotype 027 is highly resistant
to fluoroquinolones due to point mutations in the DNA gyrase genes, which is absent in the reference strain
630 (Drudy et al., 2007). Moreover, ribotype 027 acquired the conjugative transposon CTn-027 encoding the
chloramphenicol resistance gene. By whole genome sequencing two separate lineages of 027/BI/NAP1 were
identified, which probably acquired the fluoroquinolone resistance in two separate events between years 1984-
1999. Their fluoroquinolone resistance is related to the CTn5-like conjugative transposon (He et al., 2013).
He et al. (2010) constructed a phylogenetic tree from whole genome sequences of 21 isolates belonging to
the hypervirulent ribotype 027 (e.g. strains BI-1, 2007855, CD196, R20291) and the ribotypes 001 (strain
BI-9), 012 (strain 630), 017 (strain M68 and CF5) and 078 (strain M120). The phylogenetic analysis explained
the origin of the mobile elements introducing antibiotic resistances genes for tatracycline, chloramphenicol,
85
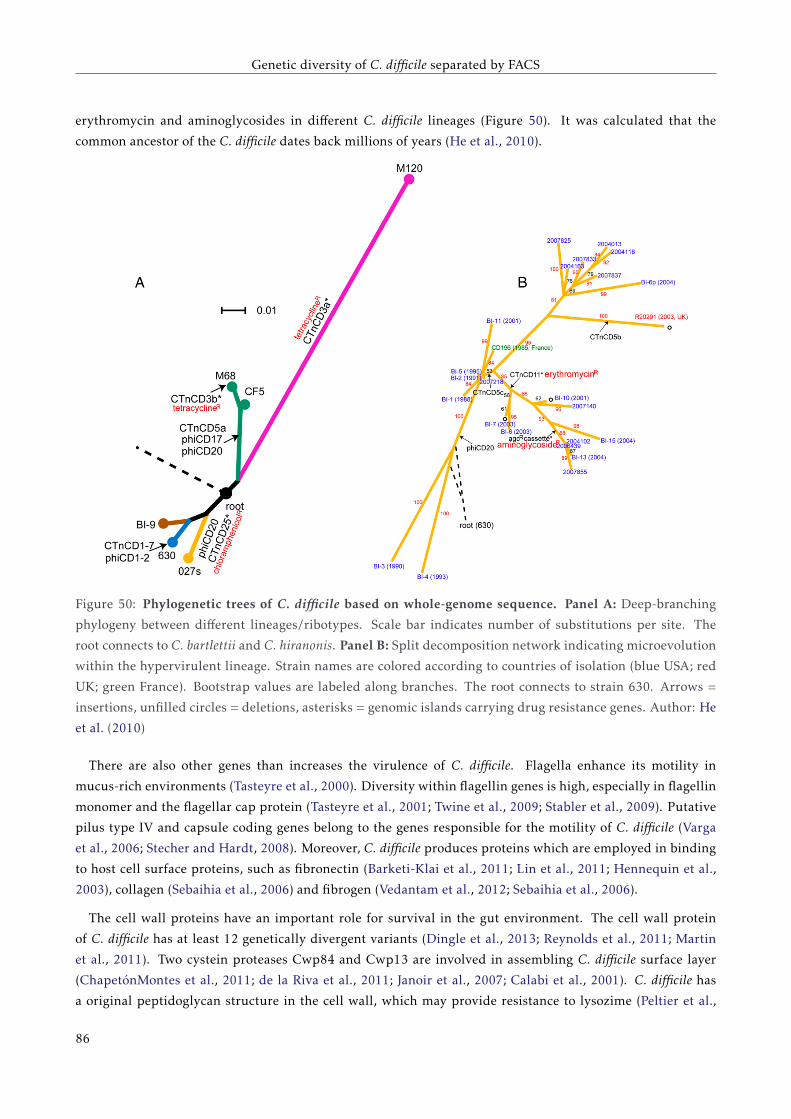
Genetic diversity of C. difficile separated by FACS
erythromycin and aminoglycosides in different C. difficile lineages (Figure 50). It was calculated that the
common ancestor of the C. difficile dates back millions of years (He et al., 2010).
Figure 50: Phylogenetic trees of C. difficile based on whole-genome sequence. Panel A: Deep-branching
phylogeny between different lineages/ribotypes. Scale bar indicates number of substitutions per site. The
root connects to C. bartlettii and C. hiranonis. Panel B: Split decomposition network indicating microevolution
within the hypervirulent lineage. Strain names are colored according to countries of isolation (blue USA; red
UK; green France). Bootstrap values are labeled along branches. The root connects to strain 630. Arrows =
insertions, unfilled circles = deletions, asterisks = genomic islands carrying drug resistance genes. Author: He
et al. (2010)
There are also other genes than increases the virulence of C. difficile. Flagella enhance its motility in
mucus-rich environments (Tasteyre et al., 2000). Diversity within flagellin genes is high, especially in flagellin
monomer and the flagellar cap protein (Tasteyre et al., 2001; Twine et al., 2009; Stabler et al., 2009). Putative
pilus type IV and capsule coding genes belong to the genes responsible for the motility of C. difficile (Varga
et al., 2006; Stecher and Hardt, 2008). Moreover, C. difficile produces proteins which are employed in binding
to host cell surface proteins, such as fibronectin (Barketi-Klai et al., 2011; Lin et al., 2011; Hennequin et al.,
2003), collagen (Sebaihia et al., 2006) and fibrogen (Vedantam et al., 2012; Sebaihia et al., 2006).
The cell wall proteins have an important role for survival in the gut environment. The cell wall protein
of C. difficile has at least 12 genetically divergent variants (Dingle et al., 2013; Reynolds et al., 2011; Martin
et al., 2011). Two cystein proteases Cwp84 and Cwp13 are involved in assembling C. difficile surface layer
(ChapetónMontes et al., 2011; de la Riva et al., 2011; Janoir et al., 2007; Calabi et al., 2001). C. difficile has
a original peptidoglycan structure in the cell wall, which may provide resistance to lysozime (Peltier et al.,
86
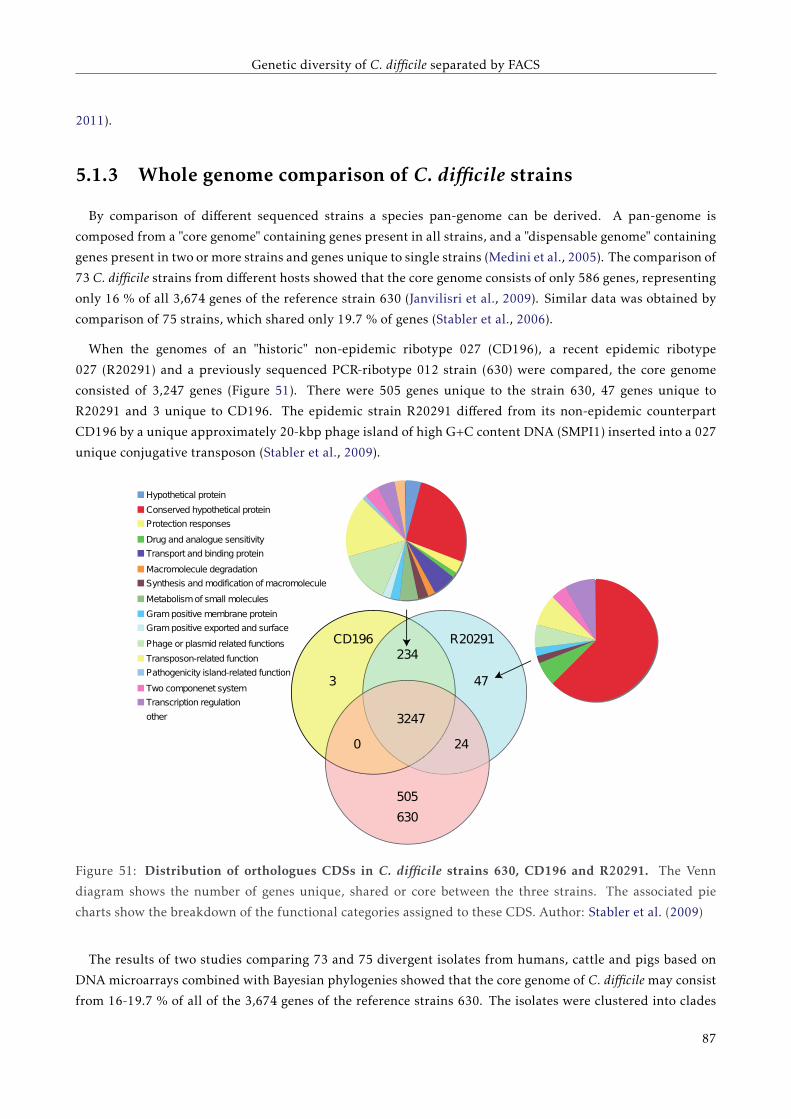
Genetic diversity of C. difficile separated by FACS
2011).
5.1.3 Whole genome comparison of C. difficile strains
By comparison of different sequenced strains a species pan-genome can be derived. A pan-genome is
composed from a "core genome" containing genes present in all strains, and a "dispensable genome" containing
genes present in two or more strains and genes unique to single strains (Medini et al., 2005). The comparison of
73 C. difficile strains from different hosts showed that the core genome consists of only 586 genes, representing
only 16 % of all 3,674 genes of the reference strain 630 (Janvilisri et al., 2009). Similar data was obtained by
comparison of 75 strains, which shared only 19.7 % of genes (Stabler et al., 2006).
When the genomes of an "historic" non-epidemic ribotype 027 (CD196), a recent epidemic ribotype
027 (R20291) and a previously sequenced PCR-ribotype 012 strain (630) were compared, the core genome
consisted of 3,247 genes (Figure 51). There were 505 genes unique to the strain 630, 47 genes unique to
R20291 and 3 unique to CD196. The epidemic strain R20291 differed from its non-epidemic counterpart
CD196 by a unique approximately 20-kbp phage island of high G+C content DNA (SMPI1) inserted into a 027
unique conjugative transposon (Stabler et al., 2009).
CD196
630
R20291
3247
234
24
505
3 47
Hypothetical protein
Conserved hypothetical protein
Protection responses
Drug and analogue sensitivity
Transport and binding protein
Macromolecule degradation
Synthesis and modification of macromolecule
Metabolism of small molecules
Gram positive membrane protein
Gram positive exported and surface
Phage or plasmid related functions
Transposon-related function
Pathogenicity island-related function
Two componenet system
Transcription regulation
other
0
Figure 51: Distribution of orthologues CDSs in C. difficile strains 630, CD196 and R20291. The Venn
diagram shows the number of genes unique, shared or core between the three strains. The associated pie
charts show the breakdown of the functional categories assigned to these CDS. Author: Stabler et al. (2009)
The results of two studies comparing 73 and 75 divergent isolates from humans, cattle and pigs based on
DNA microarrays combined with Bayesian phylogenies showed that the core genome of C. difficile may consist
from 16-19.7 % of all of the 3,674 genes of the reference strains 630. The isolates were clustered into clades
87
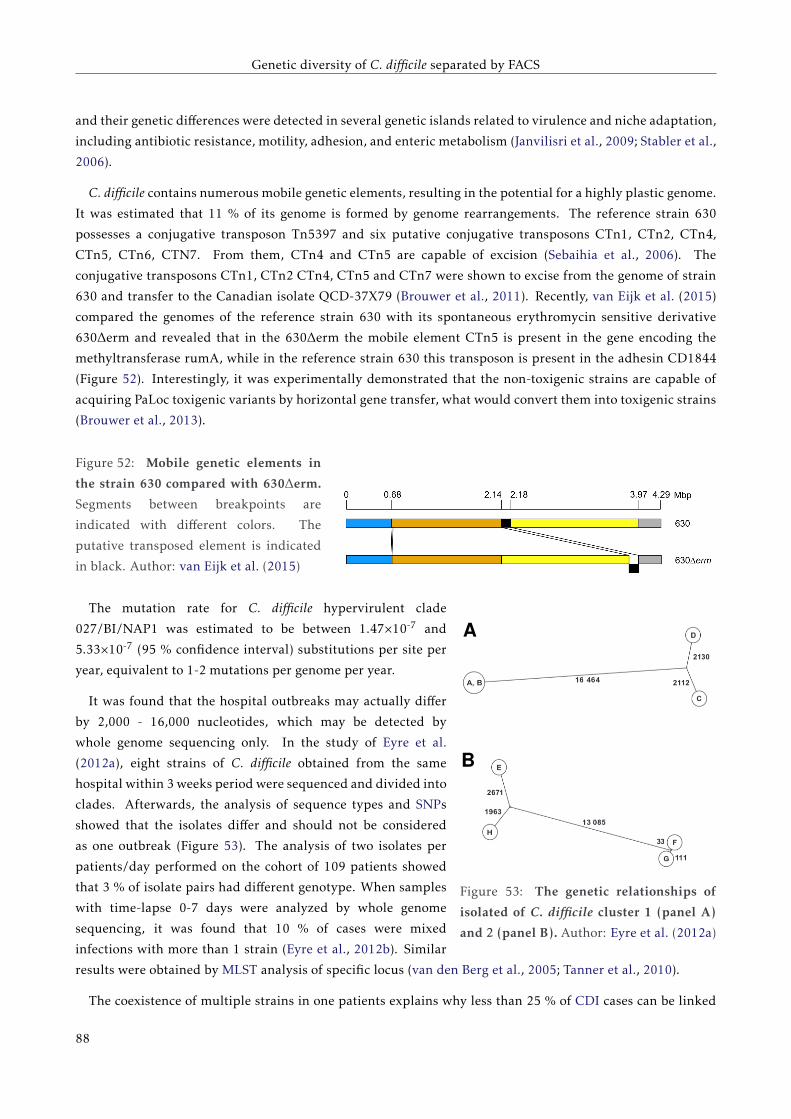
Genetic diversity of C. difficile separated by FACS
and their genetic differences were detected in several genetic islands related to virulence and niche adaptation,
including antibiotic resistance, motility, adhesion, and enteric metabolism (Janvilisri et al., 2009; Stabler et al.,
2006).
C. difficile contains numerous mobile genetic elements, resulting in the potential for a highly plastic genome.
It was estimated that 11 % of its genome is formed by genome rearrangements. The reference strain 630
possesses a conjugative transposon Tn5397 and six putative conjugative transposons CTn1, CTn2, CTn4,
CTn5, CTn6, CTN7. From them, CTn4 and CTn5 are capable of excision (Sebaihia et al., 2006). The
conjugative transposons CTn1, CTn2 CTn4, CTn5 and CTn7 were shown to excise from the genome of strain
630 and transfer to the Canadian isolate QCD-37X79 (Brouwer et al., 2011). Recently, van Eijk et al. (2015)
compared the genomes of the reference strain 630 with its spontaneous erythromycin sensitive derivative
630∆erm and revealed that in the 630∆erm the mobile element CTn5 is present in the gene encoding the
methyltransferase rumA, while in the reference strain 630 this transposon is present in the adhesin CD1844
(Figure 52). Interestingly, it was experimentally demonstrated that the non-toxigenic strains are capable of
acquiring PaLoc toxigenic variants by horizontal gene transfer, what would convert them into toxigenic strains
(Brouwer et al., 2013).
Figure 52: Mobile genetic elements in
the strain 630 compared with 630∆erm.
Segments between breakpoints are
indicated with different colors. The
putative transposed element is indicated
in black. Author: van Eijk et al. (2015)
A
B
Figure 53: The genetic relationships of
isolated of C. difficile cluster 1 (panel A)
and 2 (panel B). Author: Eyre et al. (2012a)
The mutation rate for C. difficile hypervirulent clade
027/BI/NAP1 was estimated to be between 1.47×10⁻⁷ and
5.33×10⁻⁷ (95 % confidence interval) substitutions per site per
year, equivalent to 1-2 mutations per genome per year.
It was found that the hospital outbreaks may actually differ
by 2,000 - 16,000 nucleotides, which may be detected by
whole genome sequencing only. In the study of Eyre et al.
(2012a), eight strains of C. difficile obtained from the same
hospital within 3 weeks period were sequenced and divided into
clades. Afterwards, the analysis of sequence types and SNPs
showed that the isolates differ and should not be considered
as one outbreak (Figure 53). The analysis of two isolates per
patients/day performed on the cohort of 109 patients showed
that 3 % of isolate pairs had different genotype. When samples
with time-lapse 0-7 days were analyzed by whole genome
sequencing, it was found that 10 % of cases were mixed
infections with more than 1 strain (Eyre et al., 2012b). Similar
results were obtained by MLST analysis of specific locus (van den Berg et al., 2005; Tanner et al., 2010).
The coexistence of multiple strains in one patients explains why less than 25 % of CDI cases can be linked
88

Genetic diversity of C. difficile separated by FACS
to a previous case with the same strain type within the same hospital (Walker et al., 2012). For that reason,
if a genome epidemiological study is based on comparison of only one isolate from each patient, exclusion of
transmission and determination of a origin of an outbreak may be impaired (Eyre et al., 2013a; Didelot et al.,
2012).
89
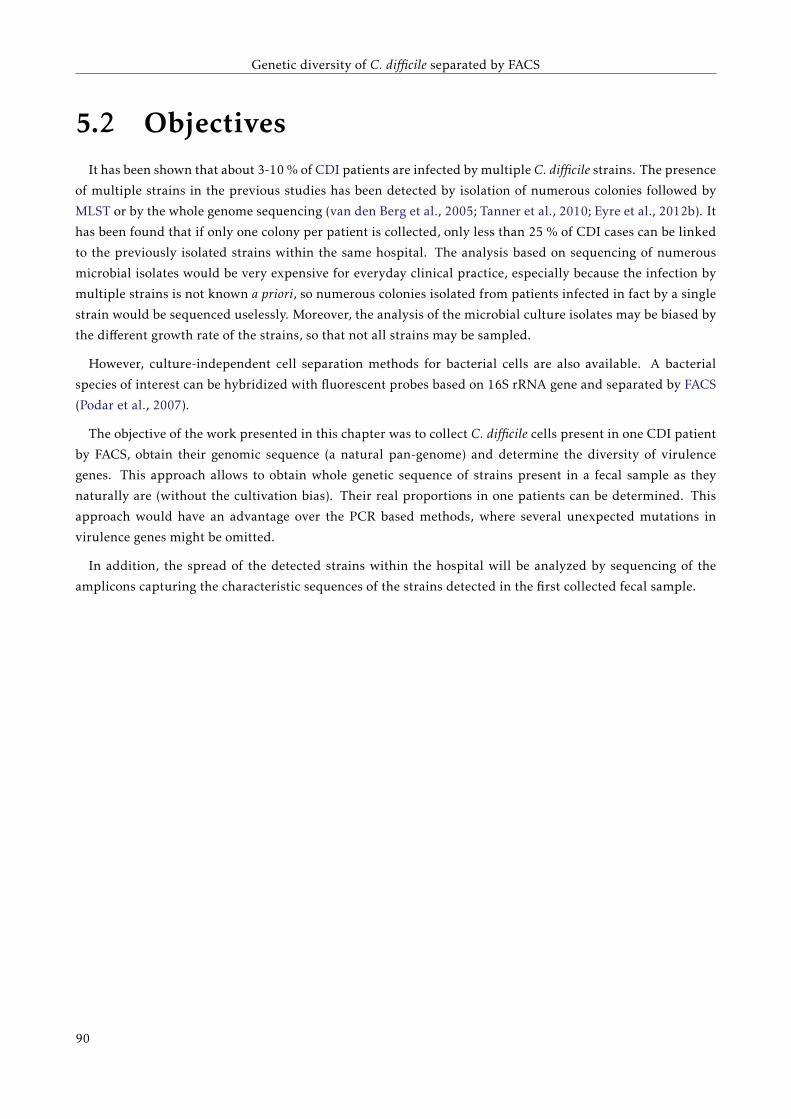
Genetic diversity of C. difficile separated by FACS
5.2 ObjectivesIt has been shown that about 3-10 % of CDI patients are infected by multiple C. difficile strains. The presence
of multiple strains in the previous studies has been detected by isolation of numerous colonies followed by
MLST or by the whole genome sequencing (van den Berg et al., 2005; Tanner et al., 2010; Eyre et al., 2012b). It
has been found that if only one colony per patient is collected, only less than 25 % of CDI cases can be linked
to the previously isolated strains within the same hospital. The analysis based on sequencing of numerous
microbial isolates would be very expensive for everyday clinical practice, especially because the infection by
multiple strains is not known a priori, so numerous colonies isolated from patients infected in fact by a single
strain would be sequenced uselessly. Moreover, the analysis of the microbial culture isolates may be biased by
the different growth rate of the strains, so that not all strains may be sampled.
However, culture-independent cell separation methods for bacterial cells are also available. A bacterial
species of interest can be hybridized with fluorescent probes based on 16S rRNA gene and separated by FACS
(Podar et al., 2007).
The objective of the work presented in this chapter was to collect C. difficile cells present in one CDI patient
by FACS, obtain their genomic sequence (a natural pan-genome) and determine the diversity of virulence
genes. This approach allows to obtain whole genetic sequence of strains present in a fecal sample as they
naturally are (without the cultivation bias). Their real proportions in one patients can be determined. This
approach would have an advantage over the PCR based methods, where several unexpected mutations in
virulence genes might be omitted.
In addition, the spread of the detected strains within the hospital will be analyzed by sequencing of the
amplicons capturing the characteristic sequences of the strains detected in the first collected fecal sample.
90
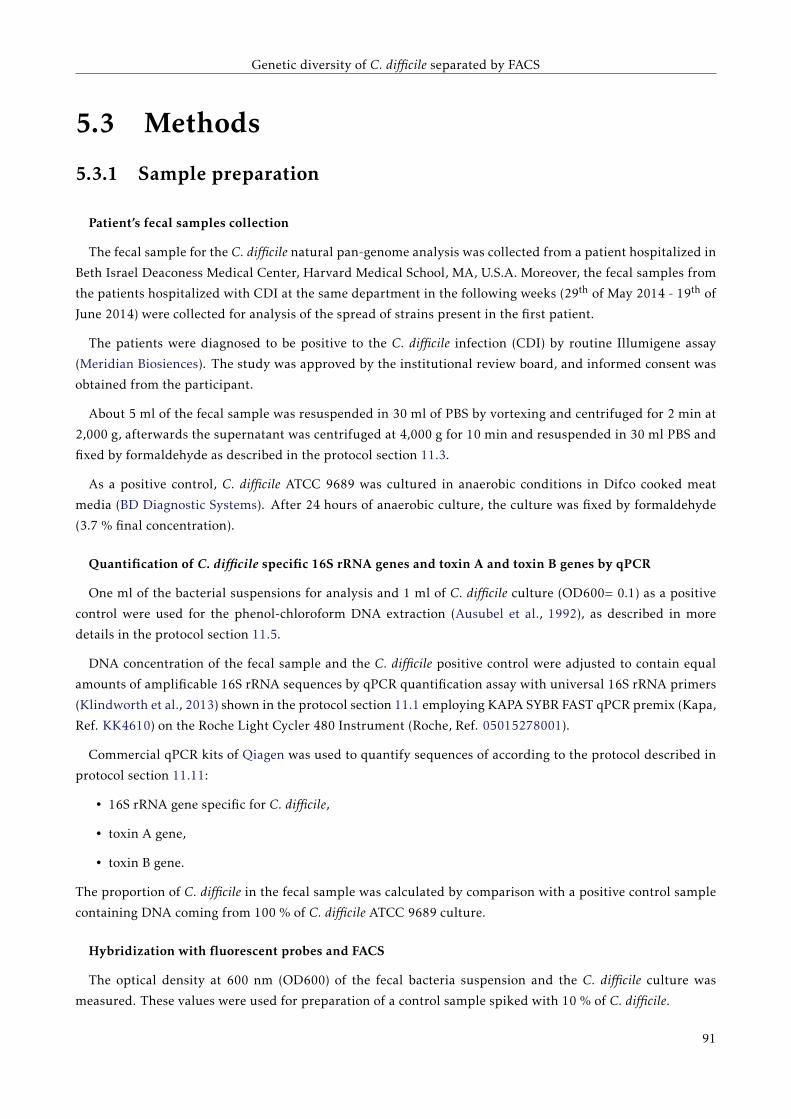
Genetic diversity of C. difficile separated by FACS
5.3 Methods
5.3.1 Sample preparation
Patient’s fecal samples collection
The fecal sample for the C. difficile natural pan-genome analysis was collected from a patient hospitalized in
Beth Israel Deaconess Medical Center, Harvard Medical School, MA, U.S.A. Moreover, the fecal samples from
the patients hospitalized with CDI at the same department in the following weeks (29th of May 2014 - 19th of
June 2014) were collected for analysis of the spread of strains present in the first patient.
The patients were diagnosed to be positive to the C. difficile infection (CDI) by routine Illumigene assay
(Meridian Biosiences). The study was approved by the institutional review board, and informed consent was
obtained from the participant.
About 5 ml of the fecal sample was resuspended in 30 ml of PBS by vortexing and centrifuged for 2 min at
2,000 g, afterwards the supernatant was centrifuged at 4,000 g for 10 min and resuspended in 30 ml PBS and
fixed by formaldehyde as described in the protocol section 11.3.
As a positive control, C. difficile ATCC 9689 was cultured in anaerobic conditions in Difco cooked meat
media (BD Diagnostic Systems). After 24 hours of anaerobic culture, the culture was fixed by formaldehyde
(3.7 % final concentration).
Quantification of C. difficile specific 16S rRNA genes and toxin A and toxin B genes by qPCR
One ml of the bacterial suspensions for analysis and 1 ml of C. difficile culture (OD600= 0.1) as a positive
control were used for the phenol-chloroform DNA extraction (Ausubel et al., 1992), as described in more
details in the protocol section 11.5.
DNA concentration of the fecal sample and the C. difficile positive control were adjusted to contain equal
amounts of amplificable 16S rRNA sequences by qPCR quantification assay with universal 16S rRNA primers
(Klindworth et al., 2013) shown in the protocol section 11.1 employing KAPA SYBR FAST qPCR premix (Kapa,
Ref. KK4610) on the Roche Light Cycler 480 Instrument (Roche, Ref. 05015278001).
Commercial qPCR kits of Qiagen was used to quantify sequences of according to the protocol described in
protocol section 11.11:
• 16S rRNA gene specific for C. difficile,
• toxin A gene,
• toxin B gene.
The proportion of C. difficile in the fecal sample was calculated by comparison with a positive control sample
containing DNA coming from 100 % of C. difficile ATCC 9689 culture.
Hybridization with fluorescent probes and FACS
The optical density at 600 nm (OD600) of the fecal bacteria suspension and the C. difficile culture was
measured. These values were used for preparation of a control sample spiked with 10 % of C. difficile.
91
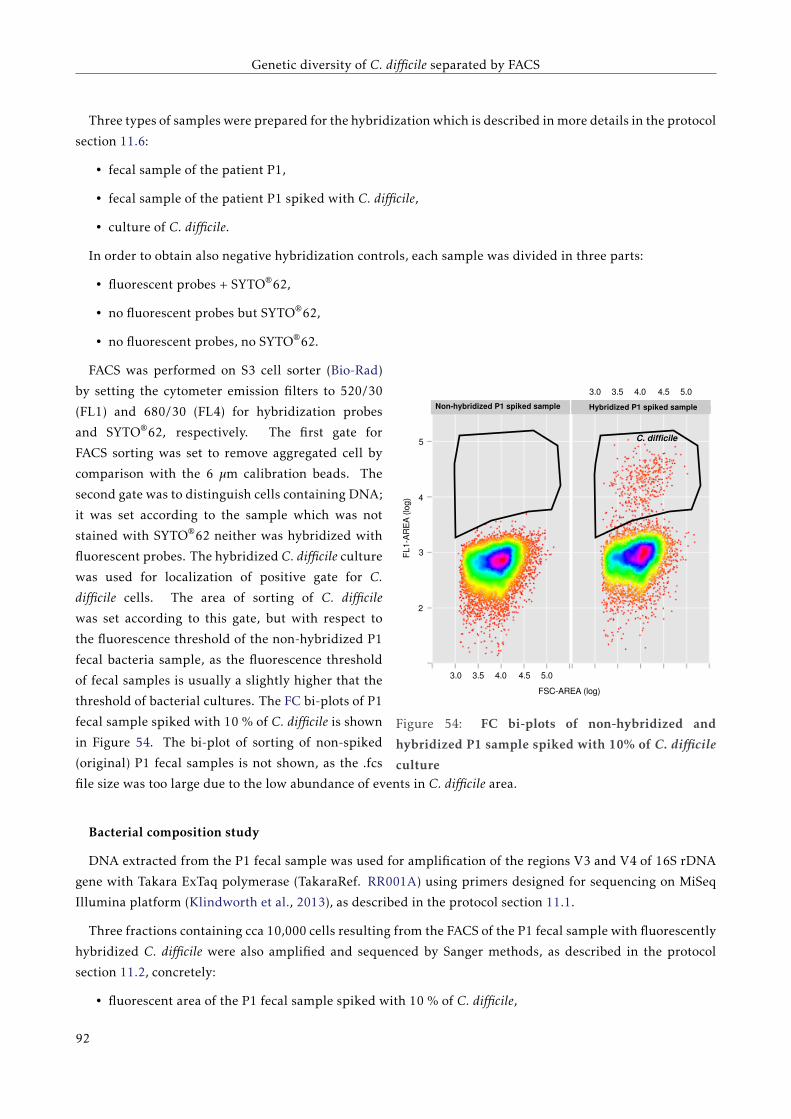
Genetic diversity of C. difficile separated by FACS
Three types of samples were prepared for the hybridization which is described in more details in the protocol
section 11.6:
• fecal sample of the patient P1,
• fecal sample of the patient P1 spiked with C. difficile,
• culture of C. difficile.
In order to obtain also negative hybridization controls, each sample was divided in three parts:
• fluorescent probes + SYTO®62,
• no fluorescent probes but SYTO®62,
• no fluorescent probes, no SYTO®62.
Non-hybridized P1 spiked sample Hybridized P1 spiked sample
3.0 3.5 4.0 4.5 5.0
3.0 3.5 4.0 4.5 5.0
5
4
3
2
FL
1-A
RE
A (
log)
FSC-AREA (log)
C. difficile
Figure 54: FC bi-plots of non-hybridized and
hybridized P1 sample spiked with 10% of C. difficile
culture
FACS was performed on S3 cell sorter (Bio-Rad)
by setting the cytometer emission filters to 520/30
(FL1) and 680/30 (FL4) for hybridization probes
and SYTO®62, respectively. The first gate for
FACS sorting was set to remove aggregated cell by
comparison with the 6 µm calibration beads. The
second gate was to distinguish cells containing DNA;
it was set according to the sample which was not
stained with SYTO®62 neither was hybridized with
fluorescent probes. The hybridized C. difficile culture
was used for localization of positive gate for C.
difficile cells. The area of sorting of C. difficile
was set according to this gate, but with respect to
the fluorescence threshold of the non-hybridized P1
fecal bacteria sample, as the fluorescence threshold
of fecal samples is usually a slightly higher that the
threshold of bacterial cultures. The FC bi-plots of P1
fecal sample spiked with 10 % of C. difficile is shown
in Figure 54. The bi-plot of sorting of non-spiked
(original) P1 fecal samples is not shown, as the .fcs
file size was too large due to the low abundance of events in C. difficile area.
Bacterial composition study
DNA extracted from the P1 fecal sample was used for amplification of the regions V3 and V4 of 16S rDNA
gene with Takara ExTaq polymerase (TakaraRef. RR001A) using primers designed for sequencing on MiSeq
Illumina platform (Klindworth et al., 2013), as described in the protocol section 11.1.
Three fractions containing cca 10,000 cells resulting from the FACS of the P1 fecal sample with fluorescently
hybridized C. difficile were also amplified and sequenced by Sanger methods, as described in the protocol
section 11.2, concretely:
• fluorescent area of the P1 fecal sample spiked with 10 % of C. difficile,
92
Genetic diversity of C. difficile separated by FACS
• fluorescent area of the P1 fecal sample (C. difficile sample = CD-sample),
• non-fluorescent area of the P1 fecal sample.
Sequence quality assessment was carried out by using PRINSEQ program (Schmieder and Edwards, 2011).
Sequences of length < 200 nt have not been considered; 5’ trimming was performed cutting out nucleotides
with a mean quality < 30 in 20 bp windows. Eventual chimeric 16S amplicons have been removed by
USEARCH program (Edgar, 2010). After sequence processing, the sequences were taxonomically classified
by RDP classifier program from Ribosomal Database Project up to genus taxonomic rank (Cole et al., 2009).
Sequencing of the C. difficile FACS separated sample
DNA coming from the FACS fraction containing 10,000 C. difficile cells separated from the P1 fecal sample
was extracted according to the protocol described in details in the protocol section 11.5. The sample
was processed with Nextera XT (Illumina) sequencing library preparation protocol, despite the fact that it
contained DNA amount indetectable by Picogreen assay (Life Technologies, Ref.P11496).
DNA amount present in the library was quantified employing KAPA SYBR FAST qPCR premix (Kapa, Ref.
KK4610) on the Roche Light Cycler 480 Instrument (Roche, Ref. 05015278001), using the following Illumina
sequencing adaptor primers amplifying the fragments of the sequencing library:
• PCR premix:
12.5 µl Kapa SYBR® mix 2 ×
1 µl 10 mM Illumina forward primer: 5’ - AAT GAT ACG GCG ACC ACC GAG A - 3’
1 µl 10mM Illumina reverse primer: 5’- CAA GCA GAA GAC GGC ATA CGA G - 3’
9.5 µl water
1 µl DNA / water
• PCR program:
Initialization step:
95◦C 3 min
Denaturation, annealing and elongation steps in 40 repetitions:
95◦C 15 sec
65◦C 20 sec
72◦C 45 sec
Cool down to 40◦C
The concentration of the prepared Illumina library was compared with control samples which have been
previously sequenced successfully on MiSeq platform. It was confirmed that the library contained sufficient
DNA amount for sequencing.
Afterwards, the sample has been sequenced on one entire flowcell on Illumina MiSeq platform.
93
Genetic diversity of C. difficile separated by FACS
5.3.2 Sequence data analysis
The paired-end reads were joined by fastq-join program from "ea-utils" package (Aronesty, 2013), while the
non-joined reads were also used in the following analysis. Short sequences (< 50 bp) and low quality sequences
(entropy < 70; quality in 10 bp windows < 25; presence of N per read > 5) were removed from the analysis, as
shown in the programming script section 12.6.
The sequences were mapped to the genome of Peptoclostridium (Clostridium) difficile reference strain 630
(GenBank assembly accession GCA_000009205.1) by Bowtie2 using the parameters default for "very-fast"
mapping of only the most similar reads, requiring that the entire read align from one end to the other
(Langmead and Salzberg, 2012). The exact command is shown in the programming script section 12.5, where
the resulting output is converted into "bam". Information in the .bam file was used for plotting the whole
genome coverage by R package "RSamtools" (Li et al., 2009; Morgan et al., 2015) as shown in the programming
script section 12.9. In addition, the resulting mapping was visualized in Integrative Genomics Viewer software
(Robinson et al., 2011), where the potential SNPs sites were spotted.
Moreover, the reads were also mapped to the complete genomes representing the different clades identified
by whole genome sequencing in the study of (He et al., 2010) shown in the Figure 50. These strains were the
only complete C. difficile genome assemblies available at that moment (April 2015) in public databases (NCBI):
• BI9 (ribotype 001)
• CF5 (ribotype 017)
• M68 (ribotype 017)
• R20291 (ribotype 027)
• 2007855 (ribotype 027)
• BI1 (ribotype 027)
• CD196 (historical ribotype 027)
• M120 (ribotype 078)
The reads, which were not mapped to the reference strain 630, were assembled by Ray metagenome
assembler (Boisvert et al., 2012) by the following command:
1 $ ray -k 31 -minimum-contig-length 300 -p forward.fastq reverse.fastq -o name
The obtained assembled sequences were aligned with e-value 1×10-100 to the database containing all the
262 complete or partial genome assemblies of C. difficile available on NCBI in June 2015. The strain with the
major number of hits was considered to be the potentially most genetically similar to the obtained sequences.
The original whole genome shotgun reads were mapped to the resulting most similar strain by bowtie2, as
explained above (see also the script in the sections 12.5 and 12.9).
94
Genetic diversity of C. difficile separated by FACS
5.3.3 Confirmation of the SNPs
One pair of primers was desiged to confirm the presence of the SNPs detected in the genomic sequence of
the FACS-sorted C. difficile cells. The online tool Primer-BLAST was used for design of primers suitable for
Illumina MiSeq amplicon sequencing (amplicon size 300-550 bp). The setting for primer melting temperatures
(Tm) were the following: minimal Tm 60◦C, optimal Tm 62◦C, maximal Tm 65◦C. The primers contained
Illumina-specific adaptor sequences allowing multiplexing. The specificity of the primers was checked by
comparison with the "nr" database of NCBI.
The DNA extracted from the original patients’ fecal samples was used as template for the PCRs. The
amplicons were prepared according to the Illumina amplicon sequencing protocol with slight modifications:
• PCR premix:
2.5 µl DNA (or water for the negative control)
5 µl forward B primer 1µM 5’- TCG TCG GCA GCG TCA GAT GTG TAT AAG AGA CAG TCA ACG
TAG AGG AGA CTT ATC CTG G -3’
5 µl reverse B primer 1µM 5’- GTC TCG TGG GCT CGG AGA TGT GTA TAA GAG ACA GCA ATC
CTT TCC TCA ACA ATT TGC GT -3’
12.5 µl 2× KAPA HiFi HotStart ReadyMix
• PCR program:
Initiation step:
95◦C for 3 min
Denaturation, annealing and elongation steps in 35 cycles:
95◦C for 30 sec
55◦C for 30 sec
72◦C for 30 sec
Final elongation:
72◦C for 5 min
Final hold at 4◦C
Two replicates of each PCR were prepared and were pooled in order to capture more genetic diversity and
avoid effect of PCR amplification bias.
The PCR products have been purified and the sequencing index adaptors have been added by secondary PCR
according to manufacturer’s instruction described in Illumina MiSeq sequencing library preparation protocol.
The obtained Illumina amplicon paired-end reads were joined by fastq-join program from "ea-utils" package
(Aronesty, 2013). Low quality sequences (entropy < 70; quality in 10 bp windows < 25; presence of N per
read > 0) were removed from the analysis, as shown in the programming script section 12.6. In addition,
amplicons were filtered for their length, keeping only sequences with the exact amplicon length and +/- 1bp
of the expected amplicon length: 410-412 bp.
95
Genetic diversity of C. difficile separated by FACS
For the amplicon analysis, the reference amplicon was prepared by excision from the reference C. difficile
630 genome. The obtained amplicon sequences were mapped to the reference amplicon by Bowtie2 program,
as described in the programming script section 12.5 and analyzed by the program VarScan (Koboldt et al.,
2012) using the following command:
1 $ samtools mpileup -f amplicon.fasta amplic.bowtieveryfastsorted.bam | java -jar VarScan.
v2.3.9.jar pileup2snp --min-var-freq 0.01
PCR of the site where SNP variations were detected were performed with the remaining 11 CDI positive
samples from BIDMC collected within three weeks after the collection of the first investigated patient P1.
96
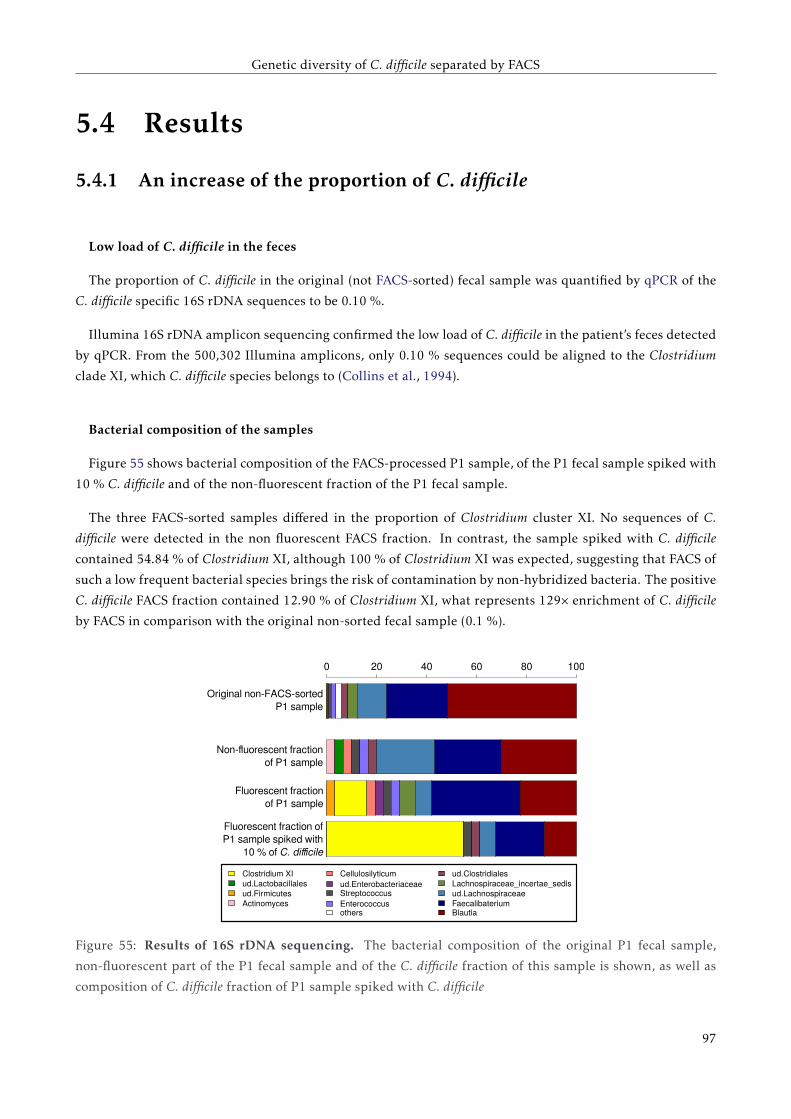
Genetic diversity of C. difficile separated by FACS
5.4 Results
5.4.1 An increase of the proportion of C. difficile
Low load of C. difficile in the feces
The proportion of C. difficile in the original (not FACS-sorted) fecal sample was quantified by qPCR of the
C. difficile specific 16S rDNA sequences to be 0.10 %.
Illumina 16S rDNA amplicon sequencing confirmed the low load of C. difficile in the patient’s feces detected
by qPCR. From the 500,302 Illumina amplicons, only 0.10 % sequences could be aligned to the Clostridium
clade XI, which C. difficile species belongs to (Collins et al., 1994).
Bacterial composition of the samples
Figure 55 shows bacterial composition of the FACS-processed P1 sample, of the P1 fecal sample spiked with
10 % C. difficile and of the non-fluorescent fraction of the P1 fecal sample.
The three FACS-sorted samples differed in the proportion of Clostridium cluster XI. No sequences of C.
difficile were detected in the non fluorescent FACS fraction. In contrast, the sample spiked with C. difficile
contained 54.84 % of Clostridium XI, although 100 % of Clostridium XI was expected, suggesting that FACS of
such a low frequent bacterial species brings the risk of contamination by non-hybridized bacteria. The positive
C. difficile FACS fraction contained 12.90 % of Clostridium XI, what represents 129× enrichment of C. difficile
by FACS in comparison with the original non-sorted fecal sample (0.1 %).
BlautiaFaecalibateriumud.LachnospiraceaeLachnospiraceae_incertae_sedisud.Clostridiales
othersEnterococcusStreptococcusud.EnterobacteriaceaeCellulosilyticumClostridium XI
ud.Lactobacillalesud.FirmicutesActinomyces
0 20 40 60 80 100
Original non-FACS-sorted P1 sample
Non-fluorescent fraction of P1 sample
Fluorescent fraction of P1 sample
Fluorescent fraction of P1 sample spiked with
10 % of C. difficile
Figure 55: Results of 16S rDNA sequencing. The bacterial composition of the original P1 fecal sample,
non-fluorescent part of the P1 fecal sample and of the C. difficile fraction of this sample is shown, as well as
composition of C. difficile fraction of P1 sample spiked with C. difficile
97
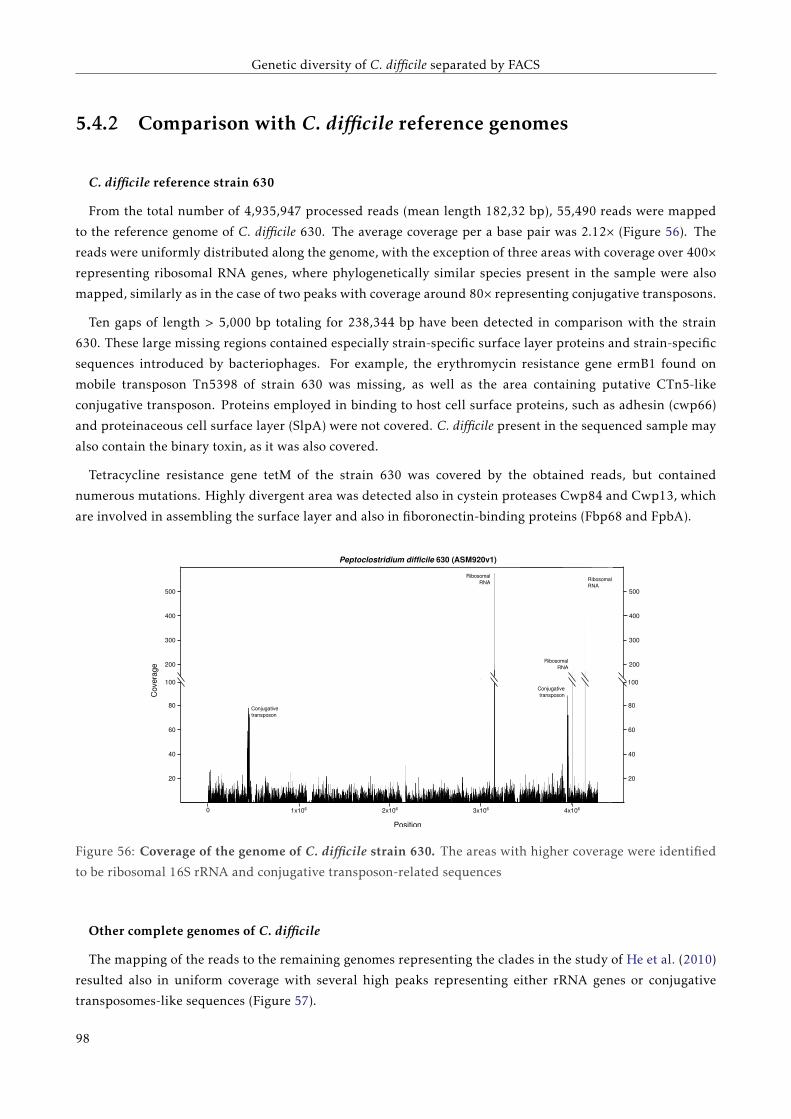
Genetic diversity of C. difficile separated by FACS
5.4.2 Comparison with C. difficile reference genomes
C. difficile reference strain 630
From the total number of 4,935,947 processed reads (mean length 182,32 bp), 55,490 reads were mapped
to the reference genome of C. difficile 630. The average coverage per a base pair was 2.12× (Figure 56). The
reads were uniformly distributed along the genome, with the exception of three areas with coverage over 400×representing ribosomal RNA genes, where phylogenetically similar species present in the sample were also
mapped, similarly as in the case of two peaks with coverage around 80× representing conjugative transposons.
Ten gaps of length > 5,000 bp totaling for 238,344 bp have been detected in comparison with the strain
630. These large missing regions contained especially strain-specific surface layer proteins and strain-specific
sequences introduced by bacteriophages. For example, the erythromycin resistance gene ermB1 found on
mobile transposon Tn5398 of strain 630 was missing, as well as the area containing putative CTn5-like
conjugative transposon. Proteins employed in binding to host cell surface proteins, such as adhesin (cwp66)
and proteinaceous cell surface layer (SlpA) were not covered. C. difficile present in the sequenced sample may
also contain the binary toxin, as it was also covered.
Tetracycline resistance gene tetM of the strain 630 was covered by the obtained reads, but contained
numerous mutations. Highly divergent area was detected also in cystein proteases Cwp84 and Cwp13, which
are involved in assembling the surface layer and also in fiboronectin-binding proteins (Fbp68 and FpbA).
100
80
60
40
20
100
80
60
40
20
0 1x10⁶ 2x10⁶ 3x10⁶ 4x10⁶
Cov
erag
e
Position
Ribosomal RNA
Ribosomal RNA
Conjugative transposon
Ribosomal RNA
Conjugative transposon
Peptoclostridium difficile 630 (ASM920v1)
200
300
400
500
200
300
400
500
Figure 56: Coverage of the genome of C. difficile strain 630. The areas with higher coverage were identified
to be ribosomal 16S rRNA and conjugative transposon-related sequences
Other complete genomes of C. difficile
The mapping of the reads to the remaining genomes representing the clades in the study of He et al. (2010)
resulted also in uniform coverage with several high peaks representing either rRNA genes or conjugative
transposomes-like sequences (Figure 57).
98
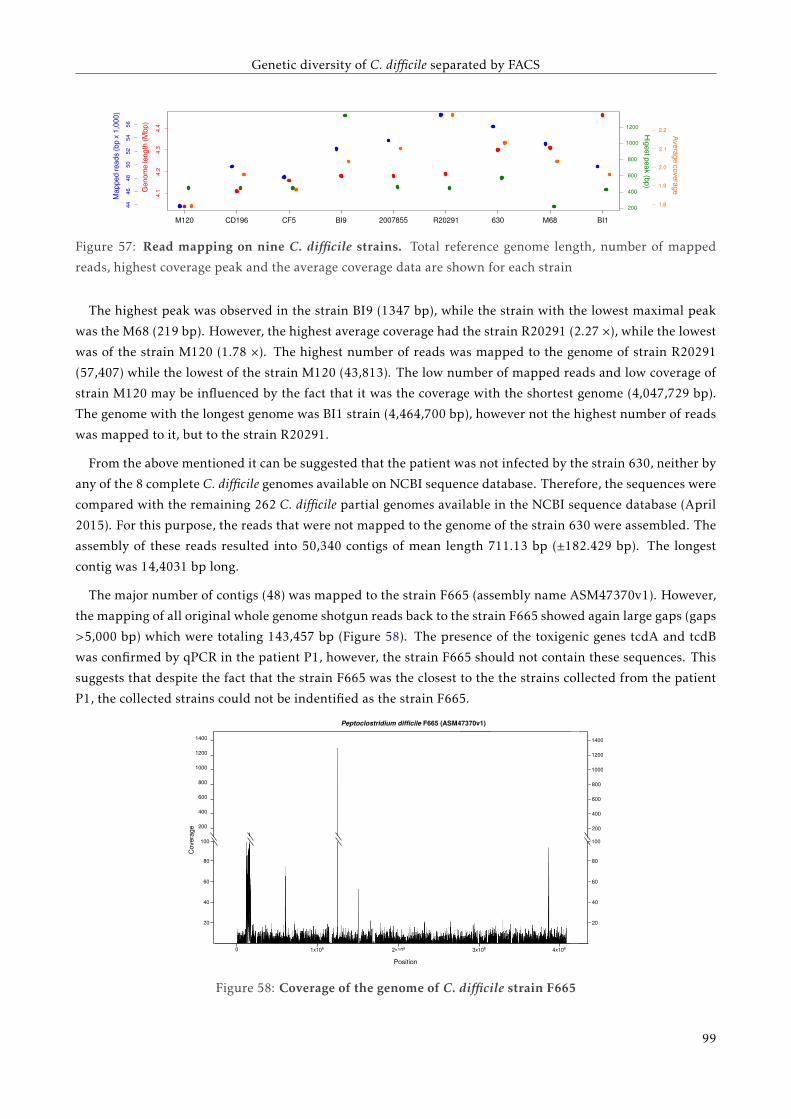
Genetic diversity of C. difficile separated by FACS
●
●
●
● ●●
●●
●
4.1
4.2
4.3
4.4
Gen
ome
leng
th (
Mb
p)
M120 CD196 CF5 BI9 2007855 R20291 630 M68 BI1
●
●
●
●
●
●
●
●
●
4446
4850
5254
56
Map
ped
rea
ds
(bp
x 1
,00
0)
● ● ●
●
● ●
●
●
●
200
400
600
800
1000
1200
Hig
est peak (b
p)
●
●
●
●
●
●
●
●
●
1.8
1.9
2.0
2.1
2.2 Averag
e coverage
Figure 57: Read mapping on nine C. difficile strains. Total reference genome length, number of mapped
reads, highest coverage peak and the average coverage data are shown for each strain
The highest peak was observed in the strain BI9 (1347 bp), while the strain with the lowest maximal peak
was the M68 (219 bp). However, the highest average coverage had the strain R20291 (2.27 ×), while the lowest
was of the strain M120 (1.78 ×). The highest number of reads was mapped to the genome of strain R20291
(57,407) while the lowest of the strain M120 (43,813). The low number of mapped reads and low coverage of
strain M120 may be influenced by the fact that it was the coverage with the shortest genome (4,047,729 bp).
The genome with the longest genome was BI1 strain (4,464,700 bp), however not the highest number of reads
was mapped to it, but to the strain R20291.
From the above mentioned it can be suggested that the patient was not infected by the strain 630, neither by
any of the 8 complete C. difficile genomes available on NCBI sequence database. Therefore, the sequences were
compared with the remaining 262 C. difficile partial genomes available in the NCBI sequence database (April
2015). For this purpose, the reads that were not mapped to the genome of the strain 630 were assembled. The
assembly of these reads resulted into 50,340 contigs of mean length 711.13 bp (±182.429 bp). The longest
contig was 14,4031 bp long.
The major number of contigs (48) was mapped to the strain F665 (assembly name ASM47370v1). However,
the mapping of all original whole genome shotgun reads back to the strain F665 showed again large gaps (gaps
>5,000 bp) which were totaling 143,457 bp (Figure 58). The presence of the toxigenic genes tcdA and tcdB
was confirmed by qPCR in the patient P1, however, the strain F665 should not contain these sequences. This
suggests that despite the fact that the strain F665 was the closest to the the strains collected from the patient
P1, the collected strains could not be indentified as the strain F665.
100
80
60
40
20
100
80
60
40
20
0 1x10⁶ 2x10⁶ 3x10⁶ 4x10⁶
Coverage
Position
Peptoclostridium difficile F665 (ASM47370v1)
200
400
1000
600
800
1200
1400
200
400
1000
600
800
1200
1400
Figure 58: Coverage of the genome of C. difficile strain F665
99
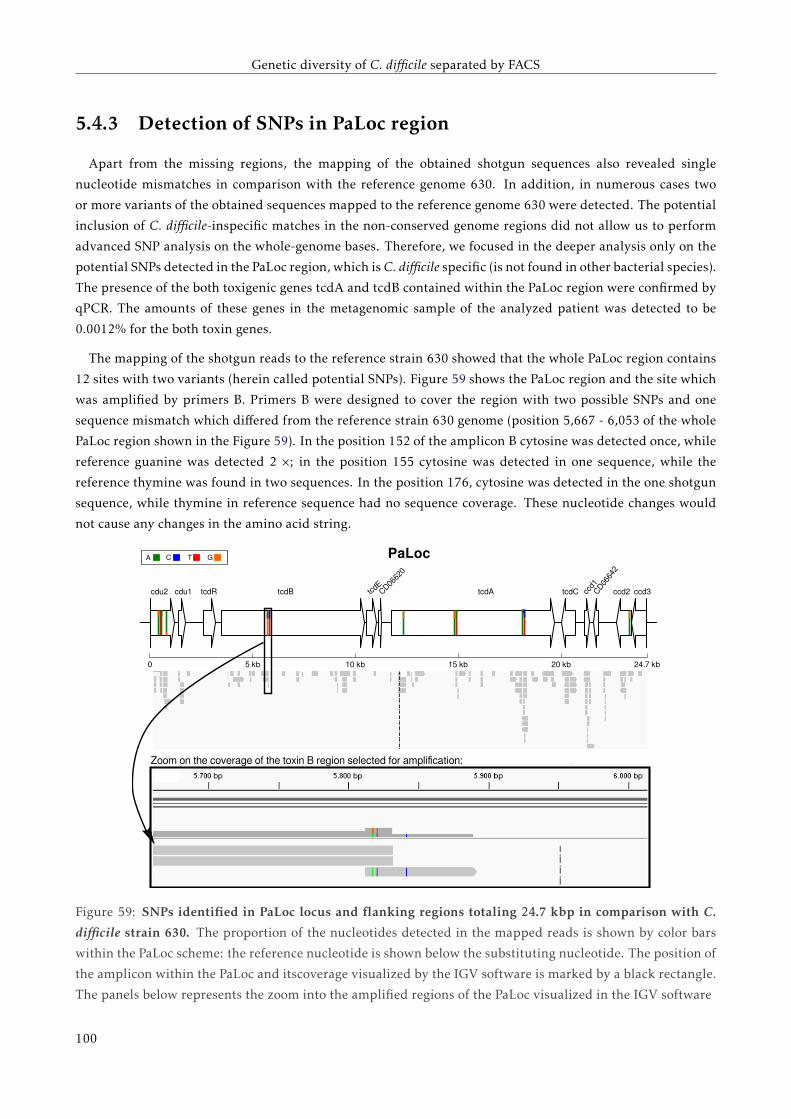
Genetic diversity of C. difficile separated by FACS
5.4.3 Detection of SNPs in PaLoc region
Apart from the missing regions, the mapping of the obtained shotgun sequences also revealed single
nucleotide mismatches in comparison with the reference genome 630. In addition, in numerous cases two
or more variants of the obtained sequences mapped to the reference genome 630 were detected. The potential
inclusion of C. difficile-inspecific matches in the non-conserved genome regions did not allow us to perform
advanced SNP analysis on the whole-genome bases. Therefore, we focused in the deeper analysis only on the
potential SNPs detected in the PaLoc region, which is C. difficile specific (is not found in other bacterial species).
The presence of the both toxigenic genes tcdA and tcdB contained within the PaLoc region were confirmed by
qPCR. The amounts of these genes in the metagenomic sample of the analyzed patient was detected to be
0.0012% for the both toxin genes.
The mapping of the shotgun reads to the reference strain 630 showed that the whole PaLoc region contains
12 sites with two variants (herein called potential SNPs). Figure 59 shows the PaLoc region and the site which
was amplified by primers B. Primers B were designed to cover the region with two possible SNPs and one
sequence mismatch which differed from the reference strain 630 genome (position 5,667 - 6,053 of the whole
PaLoc region shown in the Figure 59). In the position 152 of the amplicon B cytosine was detected once, while
reference guanine was detected 2 ×; in the position 155 cytosine was detected in one sequence, while the
reference thymine was found in two sequences. In the position 176, cytosine was detected in the one shotgun
sequence, while thymine in reference sequence had no sequence coverage. These nucleotide changes would
not cause any changes in the amino acid string.
cdu2 cdu1 tcdR tcdB tcdEtcdA tcdC ccd2 ccd3CD06620
CD0664
2
ccd1
5 kb 10 kb 15 kb 20 kb 24.7 kb0
PaLocA C T G
Zoom on the coverage of the toxin B region selected for amplification:
Figure 59: SNPs identified in PaLoc locus and flanking regions totaling 24.7 kbp in comparison with C.
difficile strain 630. The proportion of the nucleotides detected in the mapped reads is shown by color bars
within the PaLoc scheme: the reference nucleotide is shown below the substituting nucleotide. The position of
the amplicon within the PaLoc and itscoverage visualized by the IGV software is marked by a black rectangle.
The panels below represents the zoom into the amplified regions of the PaLoc visualized in the IGV software
100
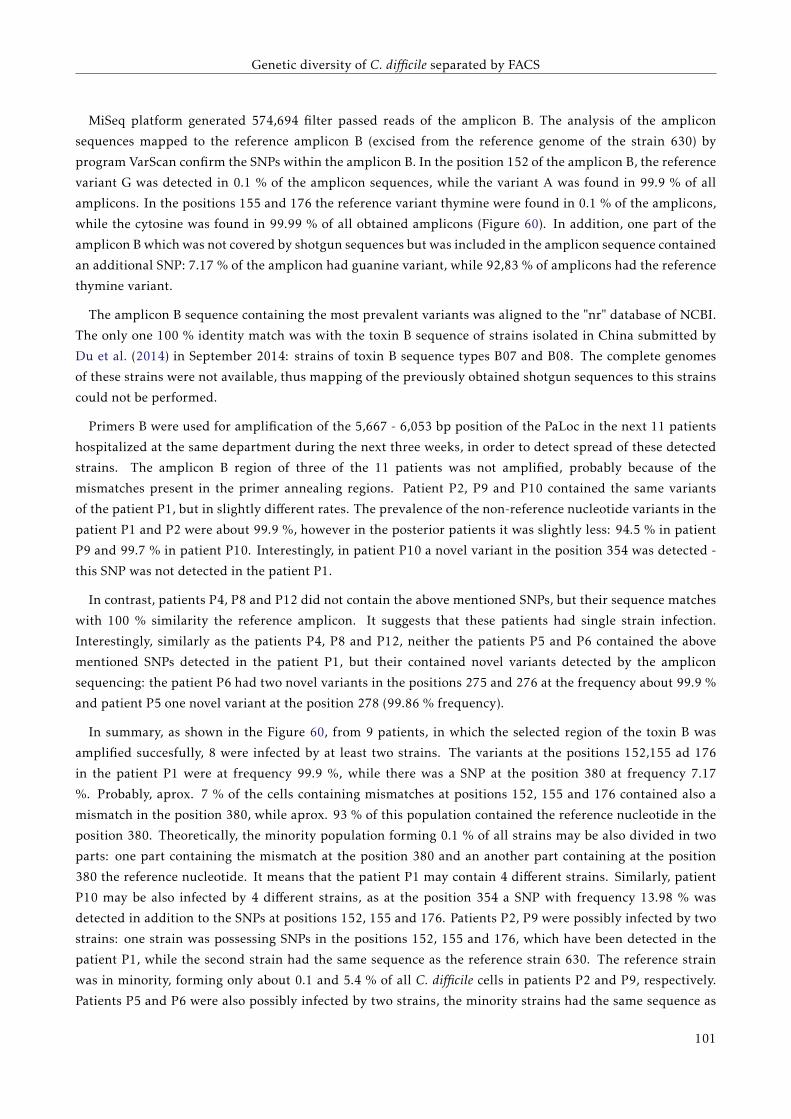
Genetic diversity of C. difficile separated by FACS
MiSeq platform generated 574,694 filter passed reads of the amplicon B. The analysis of the amplicon
sequences mapped to the reference amplicon B (excised from the reference genome of the strain 630) by
program VarScan confirm the SNPs within the amplicon B. In the position 152 of the amplicon B, the reference
variant G was detected in 0.1 % of the amplicon sequences, while the variant A was found in 99.9 % of all
amplicons. In the positions 155 and 176 the reference variant thymine were found in 0.1 % of the amplicons,
while the cytosine was found in 99.99 % of all obtained amplicons (Figure 60). In addition, one part of the
amplicon B which was not covered by shotgun sequences but was included in the amplicon sequence contained
an additional SNP: 7.17 % of the amplicon had guanine variant, while 92,83 % of amplicons had the reference
thymine variant.
The amplicon B sequence containing the most prevalent variants was aligned to the "nr" database of NCBI.
The only one 100 % identity match was with the toxin B sequence of strains isolated in China submitted by
Du et al. (2014) in September 2014: strains of toxin B sequence types B07 and B08. The complete genomes
of these strains were not available, thus mapping of the previously obtained shotgun sequences to this strains
could not be performed.
Primers B were used for amplification of the 5,667 - 6,053 bp position of the PaLoc in the next 11 patients
hospitalized at the same department during the next three weeks, in order to detect spread of these detected
strains. The amplicon B region of three of the 11 patients was not amplified, probably because of the
mismatches present in the primer annealing regions. Patient P2, P9 and P10 contained the same variants
of the patient P1, but in slightly different rates. The prevalence of the non-reference nucleotide variants in the
patient P1 and P2 were about 99.9 %, however in the posterior patients it was slightly less: 94.5 % in patient
P9 and 99.7 % in patient P10. Interestingly, in patient P10 a novel variant in the position 354 was detected -
this SNP was not detected in the patient P1.
In contrast, patients P4, P8 and P12 did not contain the above mentioned SNPs, but their sequence matches
with 100 % similarity the reference amplicon. It suggests that these patients had single strain infection.
Interestingly, similarly as the patients P4, P8 and P12, neither the patients P5 and P6 contained the above
mentioned SNPs detected in the patient P1, but their contained novel variants detected by the amplicon
sequencing: the patient P6 had two novel variants in the positions 275 and 276 at the frequency about 99.9 %
and patient P5 one novel variant at the position 278 (99.86 % frequency).
In summary, as shown in the Figure 60, from 9 patients, in which the selected region of the toxin B was
amplified succesfully, 8 were infected by at least two strains. The variants at the positions 152,155 ad 176
in the patient P1 were at frequency 99.9 %, while there was a SNP at the position 380 at frequency 7.17
%. Probably, aprox. 7 % of the cells containing mismatches at positions 152, 155 and 176 contained also a
mismatch in the position 380, while aprox. 93 % of this population contained the reference nucleotide in the
position 380. Theoretically, the minority population forming 0.1 % of all strains may be also divided in two
parts: one part containing the mismatch at the position 380 and an another part containing at the position
380 the reference nucleotide. It means that the patient P1 may contain 4 different strains. Similarly, patient
P10 may be also infected by 4 different strains, as at the position 354 a SNP with frequency 13.98 % was
detected in addition to the SNPs at positions 152, 155 and 176. Patients P2, P9 were possibly infected by two
strains: one strain was possessing SNPs in the positions 152, 155 and 176, which have been detected in the
patient P1, while the second strain had the same sequence as the reference strain 630. The reference strain
was in minority, forming only about 0.1 and 5.4 % of all C. difficile cells in patients P2 and P9, respectively.
Patients P5 and P6 were also possibly infected by two strains, the minority strains had the same sequence as
101
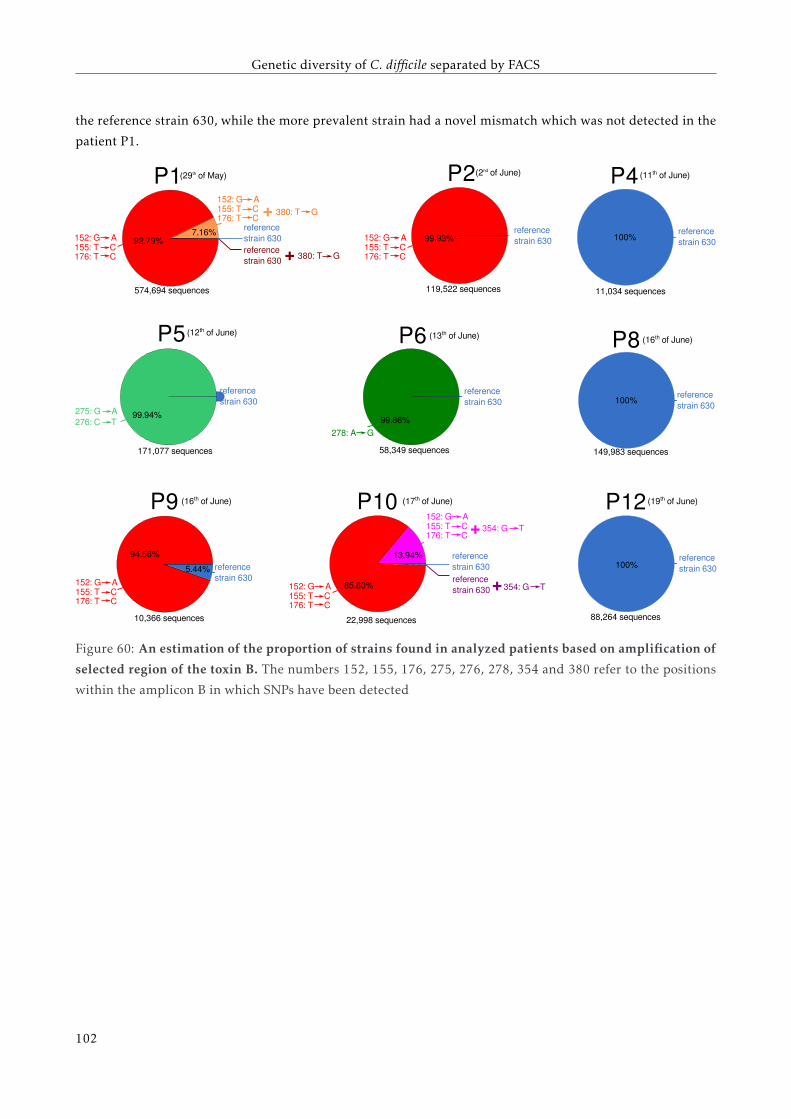
Genetic diversity of C. difficile separated by FACS
the reference strain 630, while the more prevalent strain had a novel mismatch which was not detected in the
patient P1.
P1
152: G A155: T C176: T C
152: G A155: T C176: T C
380: T G
reference strain 630reference strain 630
+
+ 380: T G
(29th of May)
92.79% 7.16%
574,694 sequences 119,522 sequences 11,034 sequences
171,077 sequences 58,349 sequences 149,983 sequences
10,366 sequences 22,998 sequences 88,264 sequences
reference strain 630
P2
152: G A155: T C176: T C
(2nd of June)
99.93%
P4
reference strain 630
(11th of June)
100%
P5
reference strain 630
275: G A276: C T
(12th of June)
99.94%
P6
reference strain 630
278: A G
(13th of June)
99.86%
P8
reference strain 630
(16th of June)
100%
P9
reference strain 630152: G A
155: T C176: T C
(16th of June)
94.56%
5.44%
P12
reference strain 630
(19th of June)
100%
P10
152: G A155: T C176: T C
reference strain 630
152: G A155: T C176: T C
354: G T+
reference strain 630 354: G T+
(17th of June)
85.80%
13.94%
Figure 60: An estimation of the proportion of strains found in analyzed patients based on amplification of
selected region of the toxin B. The numbers 152, 155, 176, 275, 276, 278, 354 and 380 refer to the positions
within the amplicon B in which SNPs have been detected
102
Genetic diversity of C. difficile separated by FACS
5.5 Discussion
The infection by multiple C. difficile strains is quite common. Eyre et al. (2013b) and Didelot et al. (2012)
claimed the strains present in one patient usually differ in thousands of SNPs, which may be detected by
whole genome sequencing only. They claimed that for exact analysis of the origin of an infection spread, tens
of isolated colonies must be sequenced with high genome coverage. Despite the decreasing costs of genome
sequencing, this approach represents still important expenses which makes genome sequencing impossible to
be applied the routine diagnostics (Eyre et al., 2012b).
Different growth rate of the strains and their different requirements on nutrient and environmental
conditions are the major obstacle for retrieving isolates of different strains by the conventional microbial
culture. The major advantage of the FACS approach used in the herein presented work is that it recovers
multiple C. difficile strains at their real proportion, independently of their growth rate. Another advantage of
FACS is the reduction of the diagnostic time, as there is no need for microbial culture.
The herein presented approach serves as a preliminary screening of fecal samples whether they contain
multiple C. difficile strains or not. It operates with low genome coverage, which is, however, sufficient for
detection of possible SNPs sites. The presence of multiple strains was confirmed by a PCR amplifying a region
within the toxin B gene which contained SNPs detected by mapping of the shotgun sequences. FACS-based
isolation of C. difficile cells may reduce the cost of sequencing numerous isolated colonies without previous
certainty of multiple strain infection. However, if the FACS-separated samples were sequenced by sequencing
platform with higher throughput, such as Illumina HiSeq, complete genomes of the present strains could be
recovered, too.
The low genome coverage obtained in this study was sufficient for detection of possible SNPs positions. The
SNPs were confirmed by deep amplicon sequencing and showed that the patient P1 contains variants in the
toxin B that have been previously sequenced by Du et al. (2014) (Figure 61). The strains containing the same
SNPs come from the collection of 70 patients isolated in China. Du et al. (2014) in their study prepared custom
amplicons covering the whole sequence of the toxins A and B genes and created custom system for sequence
type clusterization. Their amplicons were of the length from 700 to 1,800 bp and were sequenced by Sanger
method from single culture isolates. It cannot be concluded that the collected strains of the sample P1 belong
to some of the Chinese isolates, as the full genomes of the Chinese collection were not available.
The multiple-strain infection screening based on whole genome shotgun sequencing of FACS-separated C.
difficile cells from patient’s feces is important, as the positions of SNPs in a genome are never known a priori.
Evidently, amplicons for standard MLST analysis may be also used (Griffiths et al., 2010), however multiple
strains infection may remain undetected, as the strains may differ by SNPs present in genome regions which
are not covered by the standard MLST amplicons (Didelot et al., 2012). It is also important to mention possible
PCR bias. The primers designed for amplification of the regions containing possible SNPs in one patient, may
not serve for amplification of the same region in other patients, as they may contain some additional nucleotide
variants in the primer annealing sites, what would result in no PCR amplification product or some sequence
variants may be omitted. This is probably the reason why no amplification product was obtained for the
patient P3, P7 and P11. Similarly, the strain proportions in individual patients calculated in this study may
be also biased by primer annealing sites differences. Therefore, the shotgun sequencing should be taken as a
gold standard for SNPs detection and strains proportion estimation.
103
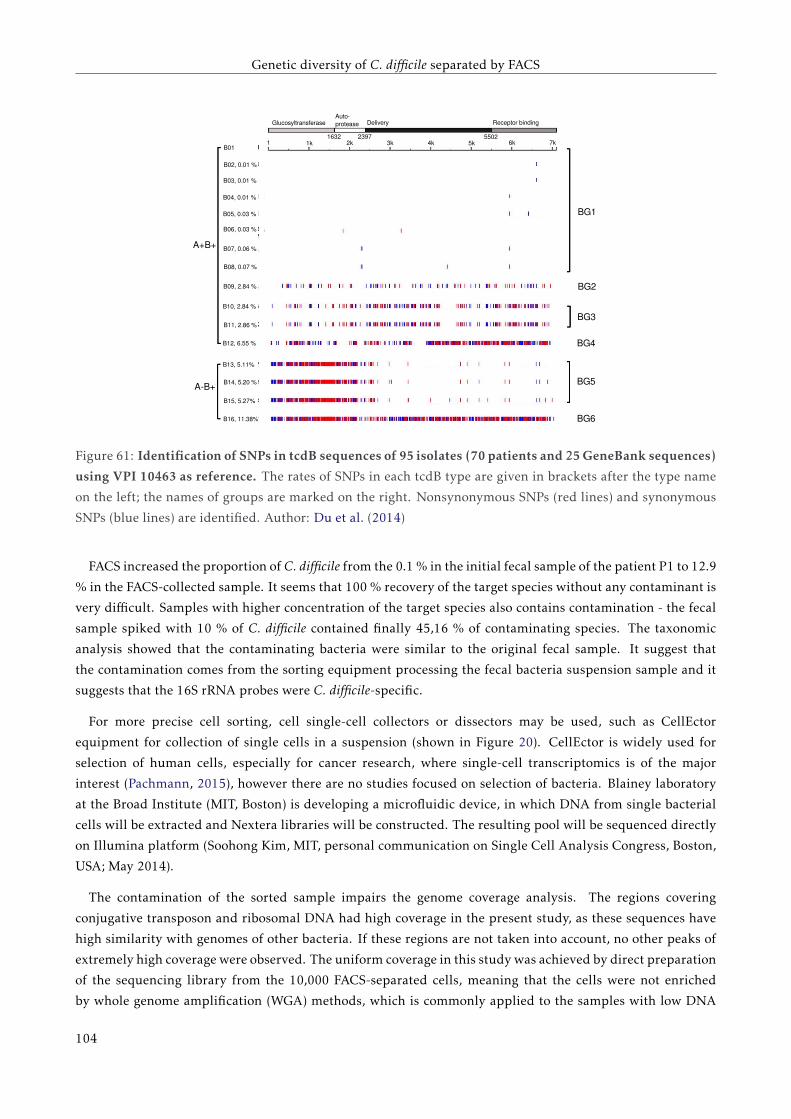
Genetic diversity of C. difficile separated by FACS
B02, 0.01 %
B03, 0.01 %
B04, 0.01 %
B05, 0.03 %
B06, 0.03 %
B07, 0.06 %
B08, 0.07 %
B09, 2.84 %
B10, 2.84 %
B11, 2.86 %
B12, 6.55 %
B13, 5.11%
B14, 5.20 %
B15, 5.27%
B16, 11.38%
B01
B02, 0.01 %
B03, 0.01 %
B04, 0.01 %
B05, 0.03 %
B06, 0.03 %
B07, 0.06 %
B08, 0.07 %
B09, 2.84 %
B10, 2.84 %
B11, 2.86 %
B12, 6.55 %
B13, 5.11%
B14, 5.20 %
B15, 5.27%
B16, 11.38%
Receptor bindingDeliveryAuto-proteaseGlucosyltransferase
1 1k 2k 3k 4k 5k 6k 7k550223971632
BG1
BG2
BG3
BG4
BG5
BG6
A+B+
A-B+
Figure 61: Identification of SNPs in tcdB sequences of 95 isolates (70 patients and 25 GeneBank sequences)
using VPI 10463 as reference. The rates of SNPs in each tcdB type are given in brackets after the type name
on the left; the names of groups are marked on the right. Nonsynonymous SNPs (red lines) and synonymous
SNPs (blue lines) are identified. Author: Du et al. (2014)
FACS increased the proportion of C. difficile from the 0.1 % in the initial fecal sample of the patient P1 to 12.9
% in the FACS-collected sample. It seems that 100 % recovery of the target species without any contaminant is
very difficult. Samples with higher concentration of the target species also contains contamination - the fecal
sample spiked with 10 % of C. difficile contained finally 45,16 % of contaminating species. The taxonomic
analysis showed that the contaminating bacteria were similar to the original fecal sample. It suggest that
the contamination comes from the sorting equipment processing the fecal bacteria suspension sample and it
suggests that the 16S rRNA probes were C. difficile-specific.
For more precise cell sorting, cell single-cell collectors or dissectors may be used, such as CellEctor
equipment for collection of single cells in a suspension (shown in Figure 20). CellEctor is widely used for
selection of human cells, especially for cancer research, where single-cell transcriptomics is of the major
interest (Pachmann, 2015), however there are no studies focused on selection of bacteria. Blainey laboratory
at the Broad Institute (MIT, Boston) is developing a microfluidic device, in which DNA from single bacterial
cells will be extracted and Nextera libraries will be constructed. The resulting pool will be sequenced directly
on Illumina platform (Soohong Kim, MIT, personal communication on Single Cell Analysis Congress, Boston,
USA; May 2014).
The contamination of the sorted sample impairs the genome coverage analysis. The regions covering
conjugative transposon and ribosomal DNA had high coverage in the present study, as these sequences have
high similarity with genomes of other bacteria. If these regions are not taken into account, no other peaks of
extremely high coverage were observed. The uniform coverage in this study was achieved by direct preparation
of the sequencing library from the 10,000 FACS-separated cells, meaning that the cells were not enriched
by whole genome amplification (WGA) methods, which is commonly applied to the samples with low DNA
104
Genetic diversity of C. difficile separated by FACS
concentration. WGA is prone for development of chimeras and GC amplification bias (Lasken and Stockwell,
2007), which is unacceptable in sequencing project in which SNPs and genome rearrangements differentiate
the studied bacterial strains. Due to WGA some genome regions may be overamplified with coverage of
hundreds or thousands, while other regions are unamplified. This discrepancy was not observed in the present
study. As no WGA were used, it may be concluded that the gaps observed after mapping of the shotgun
sequences to the reference genomes were due to their natural absence in the collected strains. Larger gaps
in the 630 genome indicated that the patient was not infected by the strain 630. It was difficult to determine
which of the 263 strains available in the online databases (August 2015) was genetically the most similar one to
the strains of the patient P1. Even the strain F665, which had the highest number of hits, was not completely
covered. Unfornatelly, the strains from China, determined by high-throughtput amplicon sequencing to be
the most similar to our patient’s strains, could not be used for mapping of our whole genome shotgun reads,
as the whole genome assemblies of these Chinese isolates were not available.
105
Genetic diversity of C. difficile separated by FACS
5.6 ConclusionsThe work performed in this section showed that sequencing of FACS-separated cells belonging to the target
C. difficile species may serve as a method for fast screening of the fecal samples for the presence of the multiple
strains. FACS allows to screen a great number of target cells, while in the culture-based methods, only one
colony is usually sequenced. The recent studies, in which more isolates were sequenced from one patients,
showed that the strains in one fecal sample may differ in thousands of SNPs. These mutations may not be
detected by ribotyping of toxinotyping methods and therefore may lead to the false conclusion that patient is
infected by only one strain.
On the other hand, the whole genome sequencing of tens of isolates as a diagnostic method may be expensive
if considered as a standard diagnostic procedure for the future. However, if the C. difficile cells are sorted by
FACS and sequenced as a metagenome enriched for the target species of C. difficile, the obtained sequences
may show whether SNPs variations are present in the strains. If the presence of multiple strains in one sample
is confirmed by PCR, the origin of the epidemiological outbreak may be tracked more easily.
In the studied sample, the infection by three of four C. difficile strains was detected by identification of SNPs
in the whole genome sequence of the cells separated by FACS. Possible SNPs in the selected region of the toxin
B were confirmed by PCR. Theoretically, the genomes of these C. difficile strains could be completed if a deeper
sequencing were performed.
The primers designed for amplification of the selected region of the toxin B were used for analysis of the
presence of the same variants in other patients hospitalized with C. difficile infection within the following three
weeks. Five of the 8 additionally amplified samples contained variants suggesting presence of 2-4 different
strains. Three of these five patients were probably infected by the same strain as the first patient (which was
used for FACS-seq analysis). Three of the 8 additionally analyzed patients were probably infected by only one
strain.
106
Chapter6Adaptation of the sequencing protocols to
limited DNA samples coming from FACS
Associated original articles:
Džunková, M., Garcia-Garcerà, M., Martínez-Priego, L., D’Auria, G., Calafell, F., Moya, A. (2014) Direct
sequencing from the minimal number of DNA molecules needed to fill a 454 picotiterplate. PLoS One. 9:
e97379+
MD and MGG contributed equally to the work

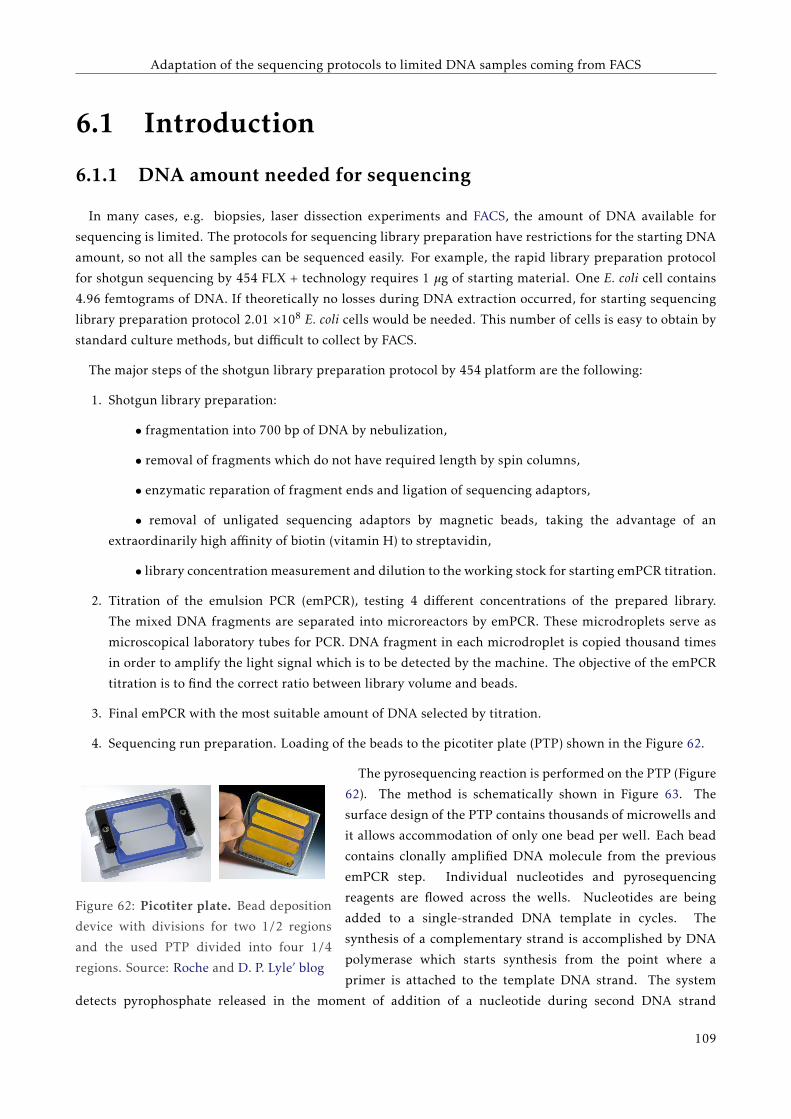
Adaptation of the sequencing protocols to limited DNA samples coming from FACS
6.1 Introduction
6.1.1 DNA amount needed for sequencing
In many cases, e.g. biopsies, laser dissection experiments and FACS, the amount of DNA available for
sequencing is limited. The protocols for sequencing library preparation have restrictions for the starting DNA
amount, so not all the samples can be sequenced easily. For example, the rapid library preparation protocol
for shotgun sequencing by 454 FLX + technology requires 1 µg of starting material. One E. coli cell contains
4.96 femtograms of DNA. If theoretically no losses during DNA extraction occurred, for starting sequencing
library preparation protocol 2.01 ×10⁸ E. coli cells would be needed. This number of cells is easy to obtain by
standard culture methods, but difficult to collect by FACS.
The major steps of the shotgun library preparation protocol by 454 platform are the following:
1. Shotgun library preparation:
• fragmentation into 700 bp of DNA by nebulization,
• removal of fragments which do not have required length by spin columns,
• enzymatic reparation of fragment ends and ligation of sequencing adaptors,
• removal of unligated sequencing adaptors by magnetic beads, taking the advantage of an
extraordinarily high affinity of biotin (vitamin H) to streptavidin,
• library concentration measurement and dilution to the working stock for starting emPCR titration.
2. Titration of the emulsion PCR (emPCR), testing 4 different concentrations of the prepared library.
The mixed DNA fragments are separated into microreactors by emPCR. These microdroplets serve as
microscopical laboratory tubes for PCR. DNA fragment in each microdroplet is copied thousand times
in order to amplify the light signal which is to be detected by the machine. The objective of the emPCR
titration is to find the correct ratio between library volume and beads.
3. Final emPCR with the most suitable amount of DNA selected by titration.
4. Sequencing run preparation. Loading of the beads to the picotiter plate (PTP) shown in the Figure 62.
Figure 62: Picotiter plate. Bead deposition
device with divisions for two 1/2 regions
and the used PTP divided into four 1/4
regions. Source: Roche and D. P. Lyle’ blog
The pyrosequencing reaction is performed on the PTP (Figure
62). The method is schematically shown in Figure 63. The
surface design of the PTP contains thousands of microwells and
it allows accommodation of only one bead per well. Each bead
contains clonally amplified DNA molecule from the previous
emPCR step. Individual nucleotides and pyrosequencing
reagents are flowed across the wells. Nucleotides are being
added to a single-stranded DNA template in cycles. The
synthesis of a complementary strand is accomplished by DNA
polymerase which starts synthesis from the point where a
primer is attached to the template DNA strand. The system
detects pyrophosphate released in the moment of addition of a nucleotide during second DNA strand
109
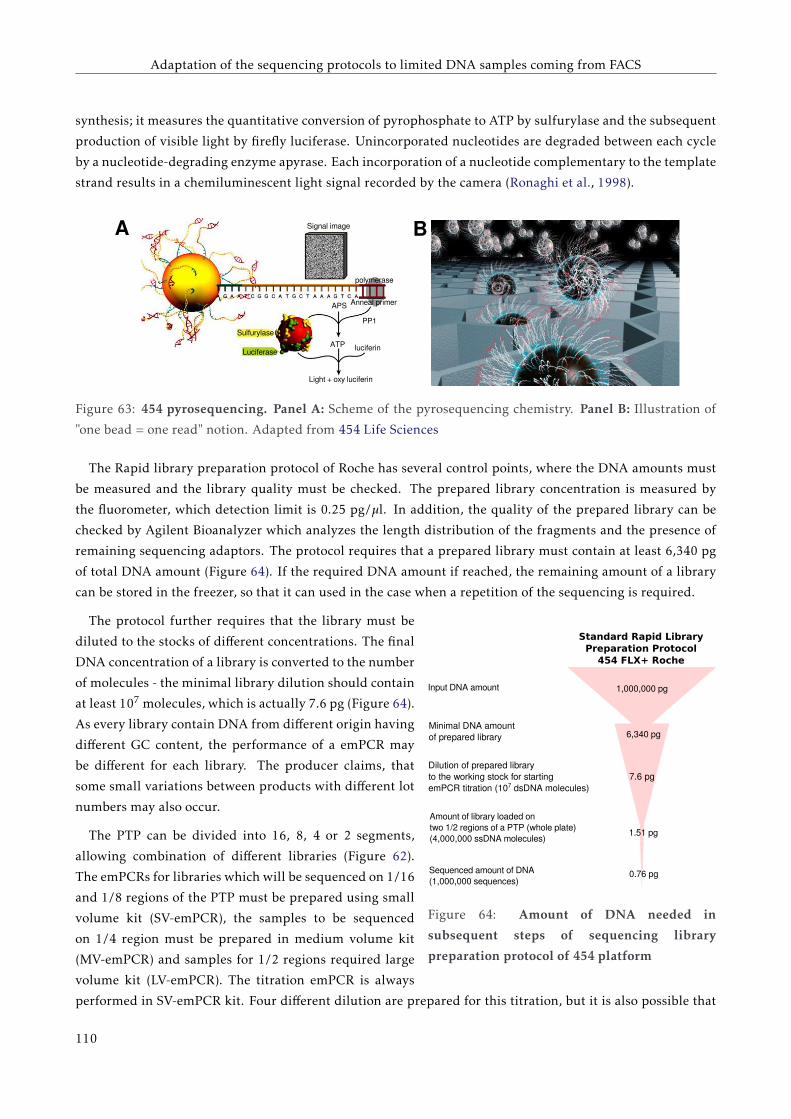
Adaptation of the sequencing protocols to limited DNA samples coming from FACS
synthesis; it measures the quantitative conversion of pyrophosphate to ATP by sulfurylase and the subsequent
production of visible light by firefly luciferase. Unincorporated nucleotides are degraded between each cycle
by a nucleotide-degrading enzyme apyrase. Each incorporation of a nucleotide complementary to the template
strand results in a chemiluminescent light signal recorded by the camera (Ronaghi et al., 1998).
A BSignal image
luciferin
Light + oxy luciferin
APS
ATP
PP1
Luciferase
Sulfurylase
polymerase
Anneal primer
Figure 63: 454 pyrosequencing. Panel A: Scheme of the pyrosequencing chemistry. Panel B: Illustration of
"one bead = one read" notion. Adapted from 454 Life Sciences
The Rapid library preparation protocol of Roche has several control points, where the DNA amounts must
be measured and the library quality must be checked. The prepared library concentration is measured by
the fluorometer, which detection limit is 0.25 pg/µl. In addition, the quality of the prepared library can be
checked by Agilent Bioanalyzer which analyzes the length distribution of the fragments and the presence of
remaining sequencing adaptors. The protocol requires that a prepared library must contain at least 6,340 pg
of total DNA amount (Figure 64). If the required DNA amount if reached, the remaining amount of a library
can be stored in the freezer, so that it can used in the case when a repetition of the sequencing is required.
7.6 pg
Minimal DNA amountof prepared library
Dilution of prepared libraryto the working stock for startingemPCR titration (107 dsDNA molecules)
Standard Rapid Library Preparation Protocol
454 FLX+ Roche
Amount of library loaded on two 1/2 regions of a PTP (whole plate)(4,000,000 ssDNA molecules)
Sequenced amount of DNA (1,000,000 sequences)
0.76 pg
1,000,000 pg
6,340 pg
Input DNA amount
1.51 pg
Figure 64: Amount of DNA needed in
subsequent steps of sequencing library
preparation protocol of 454 platform
The protocol further requires that the library must be
diluted to the stocks of different concentrations. The final
DNA concentration of a library is converted to the number
of molecules - the minimal library dilution should contain
at least 107 molecules, which is actually 7.6 pg (Figure 64).
As every library contain DNA from different origin having
different GC content, the performance of a emPCR may
be different for each library. The producer claims, that
some small variations between products with different lot
numbers may also occur.
The PTP can be divided into 16, 8, 4 or 2 segments,
allowing combination of different libraries (Figure 62).
The emPCRs for libraries which will be sequenced on 1/16
and 1/8 regions of the PTP must be prepared using small
volume kit (SV-emPCR), the samples to be sequenced
on 1/4 region must be prepared in medium volume kit
(MV-emPCR) and samples for 1/2 regions required large
volume kit (LV-emPCR). The titration emPCR is always
performed in SV-emPCR kit. Four different dilution are prepared for this titration, but it is also possible that
110
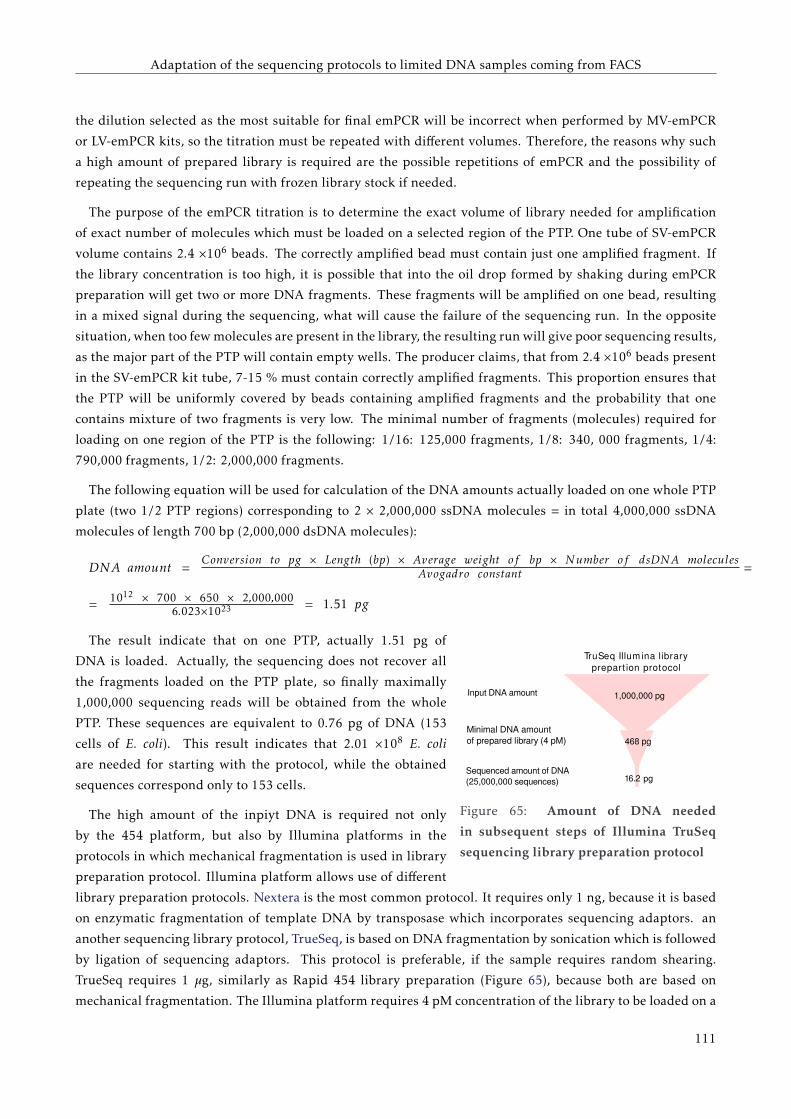
Adaptation of the sequencing protocols to limited DNA samples coming from FACS
the dilution selected as the most suitable for final emPCR will be incorrect when performed by MV-emPCR
or LV-emPCR kits, so the titration must be repeated with different volumes. Therefore, the reasons why such
a high amount of prepared library is required are the possible repetitions of emPCR and the possibility of
repeating the sequencing run with frozen library stock if needed.
The purpose of the emPCR titration is to determine the exact volume of library needed for amplification
of exact number of molecules which must be loaded on a selected region of the PTP. One tube of SV-emPCR
volume contains 2.4 ×10⁶ beads. The correctly amplified bead must contain just one amplified fragment. If
the library concentration is too high, it is possible that into the oil drop formed by shaking during emPCR
preparation will get two or more DNA fragments. These fragments will be amplified on one bead, resulting
in a mixed signal during the sequencing, what will cause the failure of the sequencing run. In the opposite
situation, when too few molecules are present in the library, the resulting run will give poor sequencing results,
as the major part of the PTP will contain empty wells. The producer claims, that from 2.4 ×10⁶ beads present
in the SV-emPCR kit tube, 7-15 % must contain correctly amplified fragments. This proportion ensures that
the PTP will be uniformly covered by beads containing amplified fragments and the probability that one
contains mixture of two fragments is very low. The minimal number of fragments (molecules) required for
loading on one region of the PTP is the following: 1/16: 125,000 fragments, 1/8: 340, 000 fragments, 1/4:
790,000 fragments, 1/2: 2,000,000 fragments.
The following equation will be used for calculation of the DNA amounts actually loaded on one whole PTP
plate (two 1/2 PTP regions) corresponding to 2 × 2,000,000 ssDNA molecules = in total 4,000,000 ssDNA
molecules of length 700 bp (2,000,000 dsDNA molecules):
DNA amount =Conversion to pg × Length (bp) × Average weight of bp × Number of dsDNA molecules
Avogadro constant =
= 1012 × 700 × 650 × 2,000,0006.023×1023 = 1.51 pg
Minimal DNA amountof prepared library (4 pM)
TruSeq Illum ina library prepart ion protocol
468 pg
Sequenced amount of DNA (25,000,000 sequences) 1 pg
1,000,000 pgInput DNA amount
6.2
Figure 65: Amount of DNA needed
in subsequent steps of Illumina TruSeq
sequencing library preparation protocol
The result indicate that on one PTP, actually 1.51 pg of
DNA is loaded. Actually, the sequencing does not recover all
the fragments loaded on the PTP plate, so finally maximally
1,000,000 sequencing reads will be obtained from the whole
PTP. These sequences are equivalent to 0.76 pg of DNA (153
cells of E. coli). This result indicates that 2.01 ×10⁸ E. coli
are needed for starting with the protocol, while the obtained
sequences correspond only to 153 cells.
The high amount of the inpiyt DNA is required not only
by the 454 platform, but also by Illumina platforms in the
protocols in which mechanical fragmentation is used in library
preparation protocol. Illumina platform allows use of different
library preparation protocols. Nextera is the most common protocol. It requires only 1 ng, because it is based
on enzymatic fragmentation of template DNA by transposase which incorporates sequencing adaptors. an
another sequencing library protocol, TrueSeq, is based on DNA fragmentation by sonication which is followed
by ligation of sequencing adaptors. This protocol is preferable, if the sample requires random shearing.
TrueSeq requires 1 µg, similarly as Rapid 454 library preparation (Figure 65), because both are based on
mechanical fragmentation. The Illumina platform requires 4 pM concentration of the library to be loaded on a
111
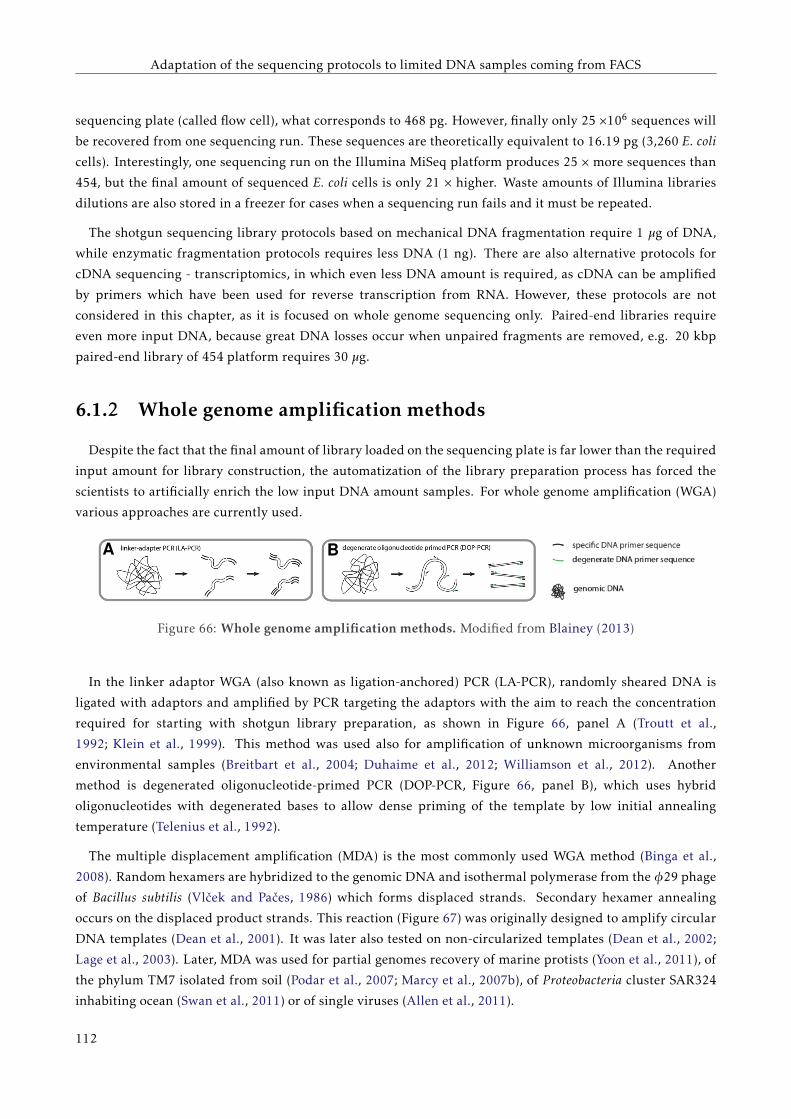
Adaptation of the sequencing protocols to limited DNA samples coming from FACS
sequencing plate (called flow cell), what corresponds to 468 pg. However, finally only 25 ×106 sequences will
be recovered from one sequencing run. These sequences are theoretically equivalent to 16.19 pg (3,260 E. coli
cells). Interestingly, one sequencing run on the Illumina MiSeq platform produces 25 × more sequences than
454, but the final amount of sequenced E. coli cells is only 21 × higher. Waste amounts of Illumina libraries
dilutions are also stored in a freezer for cases when a sequencing run fails and it must be repeated.
The shotgun sequencing library protocols based on mechanical DNA fragmentation require 1 µg of DNA,
while enzymatic fragmentation protocols requires less DNA (1 ng). There are also alternative protocols for
cDNA sequencing - transcriptomics, in which even less DNA amount is required, as cDNA can be amplified
by primers which have been used for reverse transcription from RNA. However, these protocols are not
considered in this chapter, as it is focused on whole genome sequencing only. Paired-end libraries require
even more input DNA, because great DNA losses occur when unpaired fragments are removed, e.g. 20 kbp
paired-end library of 454 platform requires 30 µg.
6.1.2 Whole genome amplification methods
Despite the fact that the final amount of library loaded on the sequencing plate is far lower than the required
input amount for library construction, the automatization of the library preparation process has forced the
scientists to artificially enrich the low input DNA amount samples. For whole genome amplification (WGA)
various approaches are currently used.
BA
Figure 66: Whole genome amplification methods. Modified from Blainey (2013)
In the linker adaptor WGA (also known as ligation-anchored) PCR (LA-PCR), randomly sheared DNA is
ligated with adaptors and amplified by PCR targeting the adaptors with the aim to reach the concentration
required for starting with shotgun library preparation, as shown in Figure 66, panel A (Troutt et al.,
1992; Klein et al., 1999). This method was used also for amplification of unknown microorganisms from
environmental samples (Breitbart et al., 2004; Duhaime et al., 2012; Williamson et al., 2012). Another
method is degenerated oligonucleotide-primed PCR (DOP-PCR, Figure 66, panel B), which uses hybrid
oligonucleotides with degenerated bases to allow dense priming of the template by low initial annealing
temperature (Telenius et al., 1992).
The multiple displacement amplification (MDA) is the most commonly used WGA method (Binga et al.,
2008). Random hexamers are hybridized to the genomic DNA and isothermal polymerase from the φ29 phage
of Bacillus subtilis (Vlček and Pačes, 1986) which forms displaced strands. Secondary hexamer annealing
occurs on the displaced product strands. This reaction (Figure 67) was originally designed to amplify circular
DNA templates (Dean et al., 2001). It was later also tested on non-circularized templates (Dean et al., 2002;
Lage et al., 2003). Later, MDA was used for partial genomes recovery of marine protists (Yoon et al., 2011), of
the phylum TM7 isolated from soil (Podar et al., 2007; Marcy et al., 2007b), of Proteobacteria cluster SAR324
inhabiting ocean (Swan et al., 2011) or of single viruses (Allen et al., 2011).
112
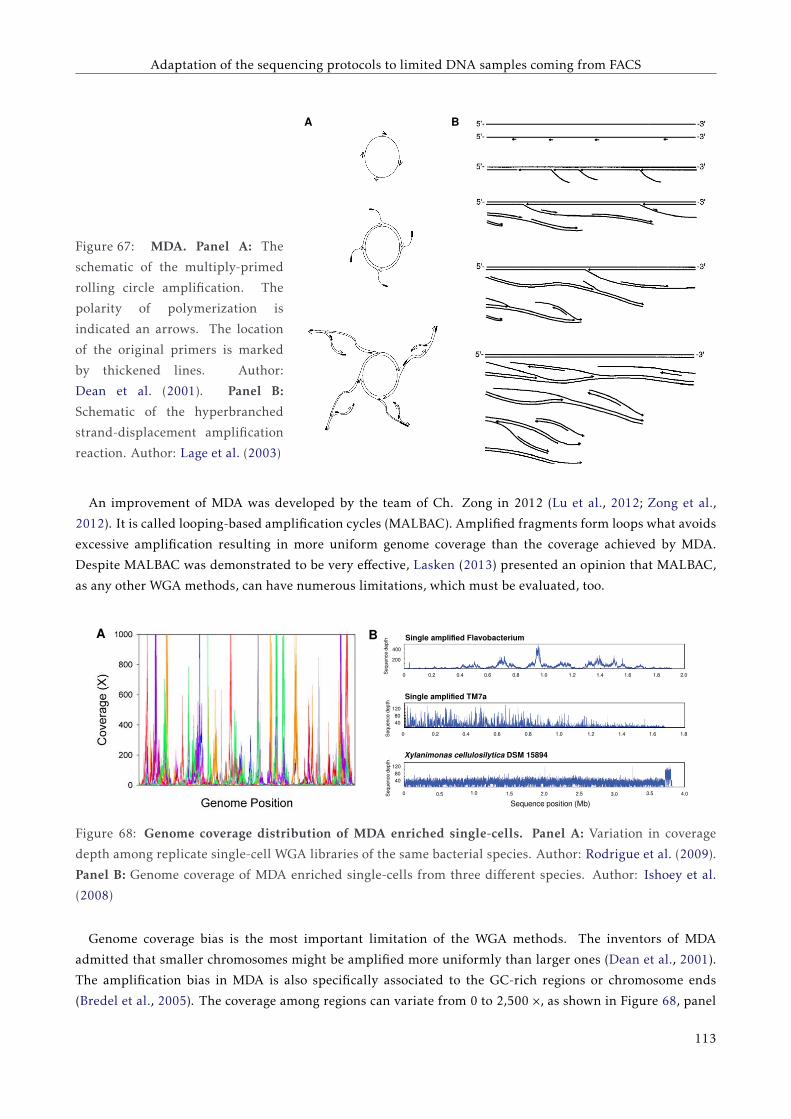
Adaptation of the sequencing protocols to limited DNA samples coming from FACS
Figure 67: MDA. Panel A: The
schematic of the multiply-primed
rolling circle amplification. The
polarity of polymerization is
indicated an arrows. The location
of the original primers is marked
by thickened lines. Author:
Dean et al. (2001). Panel B:
Schematic of the hyperbranched
strand-displacement amplification
reaction. Author: Lage et al. (2003)
A B
An improvement of MDA was developed by the team of Ch. Zong in 2012 (Lu et al., 2012; Zong et al.,
2012). It is called looping-based amplification cycles (MALBAC). Amplified fragments form loops what avoids
excessive amplification resulting in more uniform genome coverage than the coverage achieved by MDA.
Despite MALBAC was demonstrated to be very effective, Lasken (2013) presented an opinion that MALBAC,
as any other WGA methods, can have numerous limitations, which must be evaluated, too.
A BB Single amplified Flavobacterium
Single amplified TM7a
Xylanimonas cellulosilytica DSM 15894
Sequence position (Mb)
Seq
uenc
e d
epth
Seq
uenc
e d
epth
Seq
uenc
e d
epth
120
8040
400
200
120
8040
0 0.2 0.4 0.6 0.8 1.0 1.2 1.4 1.6 1.8 2.0
0 0.2 0.4 0.6 0.8 1.0 1.2 1.4 1.6 1.8
0 0.5 1.0 1.5 2.0 2.5 3.0 3.5 4.0
Figure 68: Genome coverage distribution of MDA enriched single-cells. Panel A: Variation in coverage
depth among replicate single-cell WGA libraries of the same bacterial species. Author: Rodrigue et al. (2009).
Panel B: Genome coverage of MDA enriched single-cells from three different species. Author: Ishoey et al.
(2008)
Genome coverage bias is the most important limitation of the WGA methods. The inventors of MDA
admitted that smaller chromosomes might be amplified more uniformly than larger ones (Dean et al., 2001).
The amplification bias in MDA is also specifically associated to the GC-rich regions or chromosome ends
(Bredel et al., 2005). The coverage among regions can variate from 0 to 2,500 ×, as shown in Figure 68, panel
113
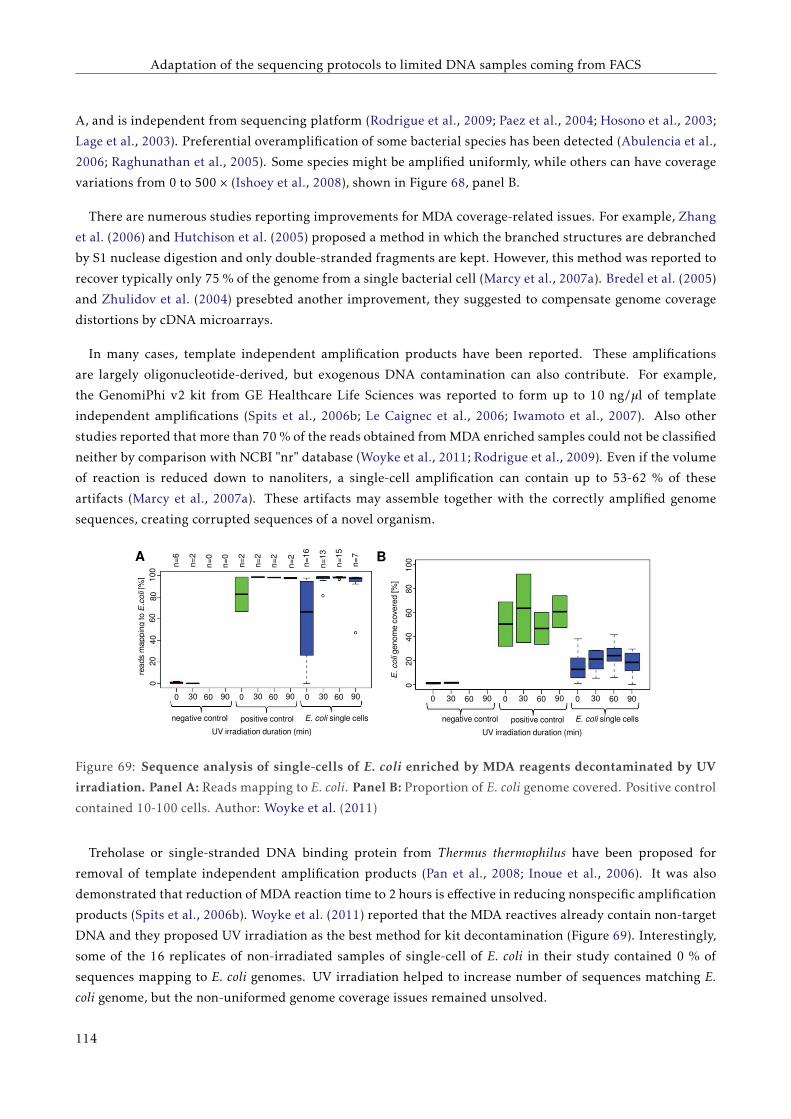
Adaptation of the sequencing protocols to limited DNA samples coming from FACS
A, and is independent from sequencing platform (Rodrigue et al., 2009; Paez et al., 2004; Hosono et al., 2003;
Lage et al., 2003). Preferential overamplification of some bacterial species has been detected (Abulencia et al.,
2006; Raghunathan et al., 2005). Some species might be amplified uniformly, while others can have coverage
variations from 0 to 500 × (Ishoey et al., 2008), shown in Figure 68, panel B.
There are numerous studies reporting improvements for MDA coverage-related issues. For example, Zhang
et al. (2006) and Hutchison et al. (2005) proposed a method in which the branched structures are debranched
by S1 nuclease digestion and only double-stranded fragments are kept. However, this method was reported to
recover typically only 75 % of the genome from a single bacterial cell (Marcy et al., 2007a). Bredel et al. (2005)
and Zhulidov et al. (2004) presebted another improvement, they suggested to compensate genome coverage
distortions by cDNA microarrays.
In many cases, template independent amplification products have been reported. These amplifications
are largely oligonucleotide-derived, but exogenous DNA contamination can also contribute. For example,
the GenomiPhi v2 kit from GE Healthcare Life Sciences was reported to form up to 10 ng/µl of template
independent amplifications (Spits et al., 2006b; Le Caignec et al., 2006; Iwamoto et al., 2007). Also other
studies reported that more than 70 % of the reads obtained from MDA enriched samples could not be classified
neither by comparison with NCBI "nr" database (Woyke et al., 2011; Rodrigue et al., 2009). Even if the volume
of reaction is reduced down to nanoliters, a single-cell amplification can contain up to 53-62 % of these
artifacts (Marcy et al., 2007a). These artifacts may assemble together with the correctly amplified genome
sequences, creating corrupted sequences of a novel organism.
A B
read
s m
app
ing
to E
.coli
[%]
E. co
li ge
nom
e co
vere
d [%
]
negative control positive control E. coli single cells
UV irradiation duration (min)
negative control positive control E. coli single cells
UV irradiation duration (min)
n=6
n=2
n=0
n=2
n=2
n=2
n=2
n=1
6
n=1
3
n=1
5
n=7
n=0
02
04
06
08
01
00
0 30 60 90 0 30 60 90 0 30 60 90
02
04
06
08
01
00
0 30 60 90 0 30 60 90 0 30 60 90
Figure 69: Sequence analysis of single-cells of E. coli enriched by MDA reagents decontaminated by UV
irradiation. Panel A: Reads mapping to E. coli. Panel B: Proportion of E. coli genome covered. Positive control
contained 10-100 cells. Author: Woyke et al. (2011)
Treholase or single-stranded DNA binding protein from Thermus thermophilus have been proposed for
removal of template independent amplification products (Pan et al., 2008; Inoue et al., 2006). It was also
demonstrated that reduction of MDA reaction time to 2 hours is effective in reducing nonspecific amplification
products (Spits et al., 2006b). Woyke et al. (2011) reported that the MDA reactives already contain non-target
DNA and they proposed UV irradiation as the best method for kit decontamination (Figure 69). Interestingly,
some of the 16 replicates of non-irradiated samples of single-cell of E. coli in their study contained 0 % of
sequences mapping to E. coli genomes. UV irradiation helped to increase number of sequences matching E.
coli genome, but the non-uniformed genome coverage issues remained unsolved.
114
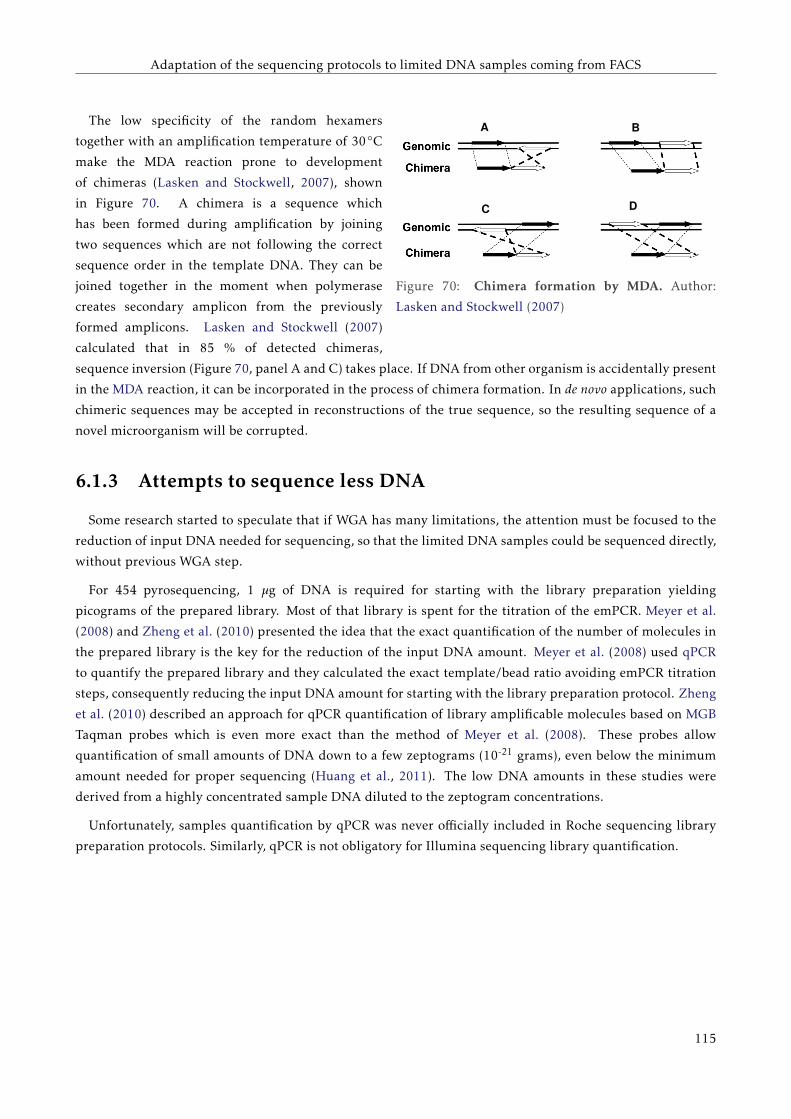
Adaptation of the sequencing protocols to limited DNA samples coming from FACS
A B
C D
Figure 70: Chimera formation by MDA. Author:
Lasken and Stockwell (2007)
The low specificity of the random hexamers
together with an amplification temperature of 30◦C
make the MDA reaction prone to development
of chimeras (Lasken and Stockwell, 2007), shown
in Figure 70. A chimera is a sequence which
has been formed during amplification by joining
two sequences which are not following the correct
sequence order in the template DNA. They can be
joined together in the moment when polymerase
creates secondary amplicon from the previously
formed amplicons. Lasken and Stockwell (2007)
calculated that in 85 % of detected chimeras,
sequence inversion (Figure 70, panel A and C) takes place. If DNA from other organism is accidentally present
in the MDA reaction, it can be incorporated in the process of chimera formation. In de novo applications, such
chimeric sequences may be accepted in reconstructions of the true sequence, so the resulting sequence of a
novel microorganism will be corrupted.
6.1.3 Attempts to sequence less DNA
Some research started to speculate that if WGA has many limitations, the attention must be focused to the
reduction of input DNA needed for sequencing, so that the limited DNA samples could be sequenced directly,
without previous WGA step.
For 454 pyrosequencing, 1 µg of DNA is required for starting with the library preparation yielding
picograms of the prepared library. Most of that library is spent for the titration of the emPCR. Meyer et al.
(2008) and Zheng et al. (2010) presented the idea that the exact quantification of the number of molecules in
the prepared library is the key for the reduction of the input DNA amount. Meyer et al. (2008) used qPCR
to quantify the prepared library and they calculated the exact template/bead ratio avoiding emPCR titration
steps, consequently reducing the input DNA amount for starting with the library preparation protocol. Zheng
et al. (2010) described an approach for qPCR quantification of library amplificable molecules based on MGB
Taqman probes which is even more exact than the method of Meyer et al. (2008). These probes allow
quantification of small amounts of DNA down to a few zeptograms (10-21 grams), even below the minimum
amount needed for proper sequencing (Huang et al., 2011). The low DNA amounts in these studies were
derived from a highly concentrated sample DNA diluted to the zeptogram concentrations.
Unfortunately, samples quantification by qPCR was never officially included in Roche sequencing library
preparation protocols. Similarly, qPCR is not obligatory for Illumina sequencing library quantification.
115
Adaptation of the sequencing protocols to limited DNA samples coming from FACS
6.2 ObjectivesSequencing platform require high amounts of DNA for preparation of a shotgun library, what is a limitation
for sequencing of samples containing low amounts of DNA, as those coming from FACS containing few
hundreds or few thousands of cells.
The most common method for overcoming this limitation is the enrichment of the input DNA by WGA,
which is usually MDA. However, MDA is prone to development of chimeric sequences, formation of non-
target amplifications and genome coverage bias, so the resulting genome assembly is usually presented in an
incomplete form, probably including erroneously assembled reads originated from non-target species.
Some investigations have been made for modification of the sequencing library preparation protocols with
the objective to allow sequencing of samples with lower DNA concentration. The most important point is the
exact quantification of the DNA molecules present in the prepared libraries, aiming to work with the minimal
number of molecules which might be loaded on a sequencing plate.
In the previously performed experiments of low DNA amount sequencing, even zeptogram amounts of
input DNA have been tested for quantification and sequencing, however these samples were actually dilutions
from a highly concentrated samples.
This work aims to obtain a 454 shotgun library for direct sequencing starting from the amount of DNA
needed for reaching exactly the minimal number of molecules required for filling the target region of the
sequencing plate. This will be performed starting from few thousand of E. coli cells obtained from FACS.
DNA from these cells will be extracted and the shotgun sequencing library will be prepared. In order to
perform a successful sequencing run, some modifications of the standard 454 protocol will be made. The
steps, in which DNA loss in the standard 454 protocol occurs, will be replaced by more sparing alternatives.
The resulting library will be quantified by qPCR, as the quantification limit of the standard quantification
methods recommended by 454 protocols will be probably above the concentration of the prepared library.
Moreover, qPCR is needed for quantification of exact number molecules which is important in avoiding DNA
losses in emPCR titration.
To assess whether direct sequencing can be proposed as an alternative to MDA, the same number of cells
will be enriched by MDA and processed by the same sequencing protocol. In order to avoid sampling bias,
20,000 E. coli cells will be separated by FACS, the DNA will be extracted and then split into halves to MDA
and direct sequencing samples. A replicate of this will be also prepared. Thus, the amplification bias caused
by MDA can be evaluated by comparison with direct sequencing.
116
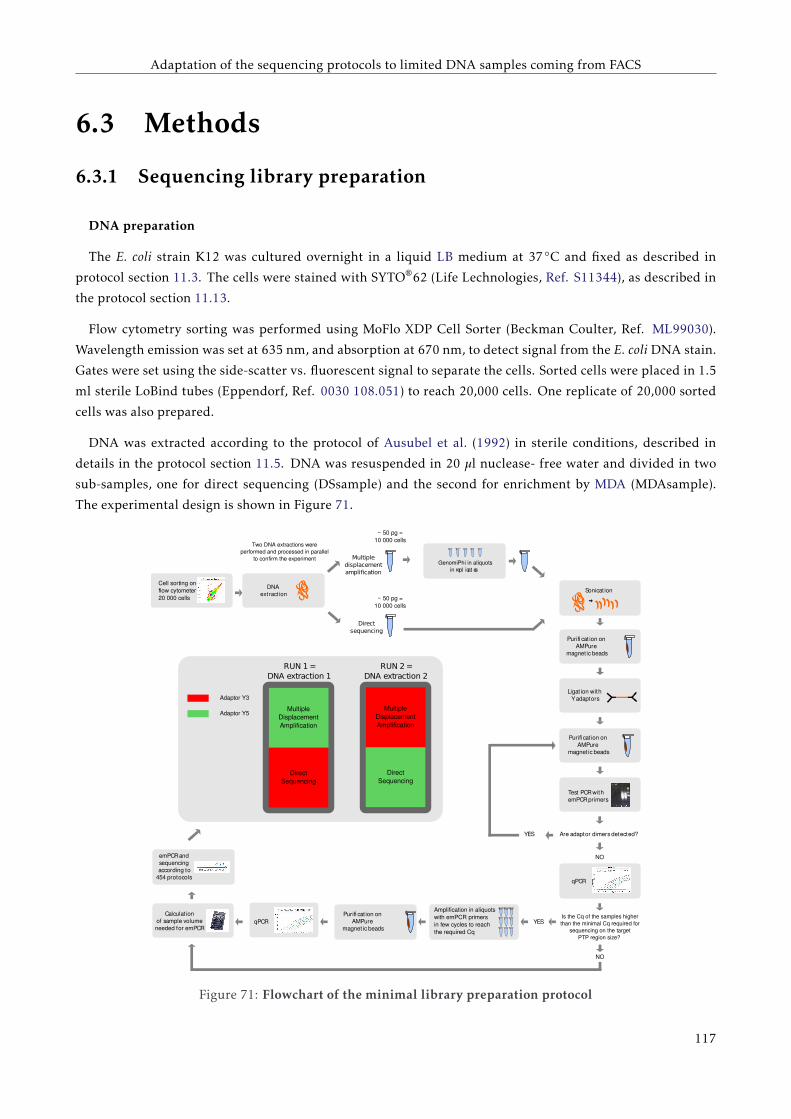
Adaptation of the sequencing protocols to limited DNA samples coming from FACS
6.3 Methods
6.3.1 Sequencing library preparation
DNA preparation
The E. coli strain K12 was cultured overnight in a liquid LB medium at 37◦C and fixed as described in
protocol section 11.3. The cells were stained with SYTO®62 (Life Lechnologies, Ref. S11344), as described in
the protocol section 11.13.
Flow cytometry sorting was performed using MoFlo XDP Cell Sorter (Beckman Coulter, Ref. ML99030).
Wavelength emission was set at 635 nm, and absorption at 670 nm, to detect signal from the E. coli DNA stain.
Gates were set using the side-scatter vs. fluorescent signal to separate the cells. Sorted cells were placed in 1.5
ml sterile LoBind tubes (Eppendorf, Ref. 0030 108.051) to reach 20,000 cells. One replicate of 20,000 sorted
cells was also prepared.
DNA was extracted according to the protocol of Ausubel et al. (1992) in sterile conditions, described in
details in the protocol section 11.5. DNA was resuspended in 20 µl nuclease- free water and divided in two
sub-samples, one for direct sequencing (DSsample) and the second for enrichment by MDA (MDAsample).
The experimental design is shown in Figure 71.
YES
Calculat ionof sample volumeneeded for emPCR
DNAext ract ion
qPCR YES
emPCRandsequencingaccording to
454 protocols
~ 50 pg =10 000 cells
Multipledisplacementamplification
~ 50 pg =10 000 cells
Directsequencing
GenomiPhi in aliquotsin repl icat es
Is the Cq of the samples higherthan the minimal Cq required for
sequencing on the targetPTP region size?
NO
MultipleDisplacementAmplification
DirectSequencing
RUN 1 =DNA extraction 1
MultipleDisplacementAmplification
DirectSequencing
RUN 2 =DNA extraction 2
Adaptor Y3
Adaptor Y5
Cell sorting onflow cytometer20 000 cells
Two DNA extractions wereperformed and processed in parallel
to confirm the experiment
Are adaptor dimers detected?
Ligat ion withY adaptors
qPCR
Sonicat ion
Test PCR withemPCRprimers
NO
Purifi cat ion onAMPure
magnet ic beads
Purifi cat ion onAMPure
magnet ic beads
Purifi cat ion onAMPure
magnet ic beads
Amplification in aliquotswith emPCR primersin few cycles to reachthe required Cq
Figure 71: Flowchart of the minimal library preparation protocol
117
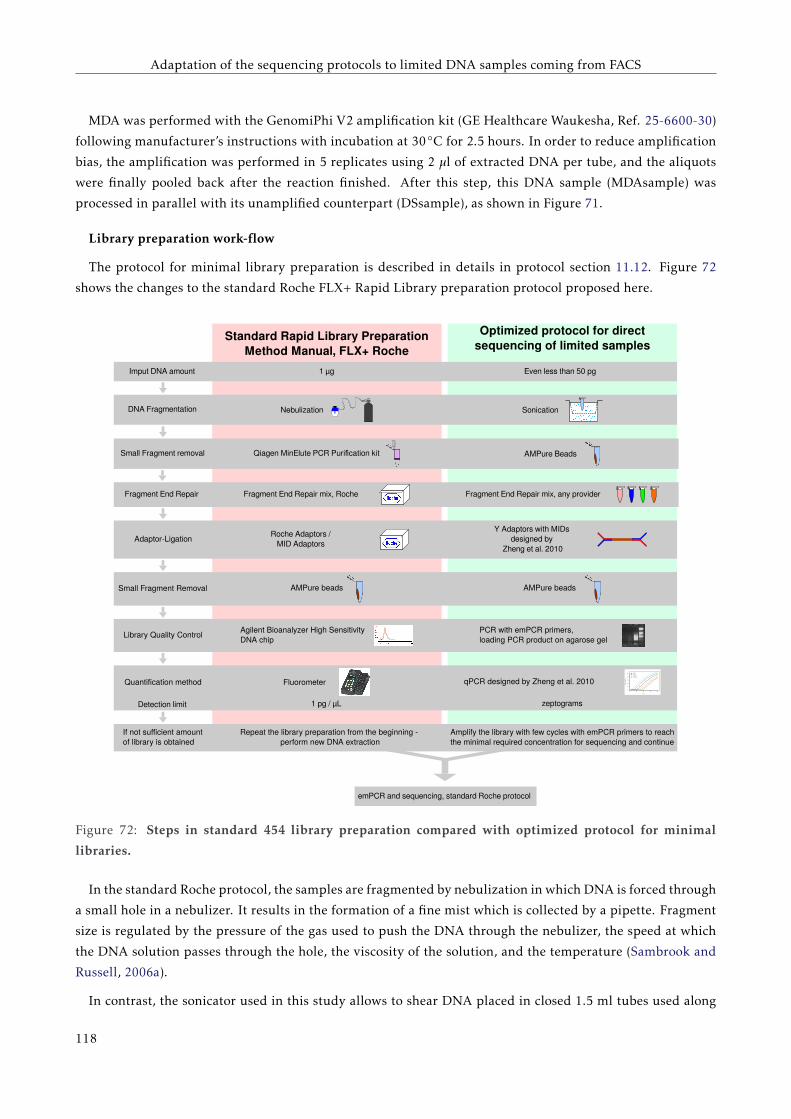
Adaptation of the sequencing protocols to limited DNA samples coming from FACS
MDA was performed with the GenomiPhi V2 amplification kit (GE Healthcare Waukesha, Ref. 25-6600-30)
following manufacturer’s instructions with incubation at 30◦C for 2.5 hours. In order to reduce amplification
bias, the amplification was performed in 5 replicates using 2 µl of extracted DNA per tube, and the aliquots
were finally pooled back after the reaction finished. After this step, this DNA sample (MDAsample) was
processed in parallel with its unamplified counterpart (DSsample), as shown in Figure 71.
Library preparation work-flow
The protocol for minimal library preparation is described in details in protocol section 11.12. Figure 72
shows the changes to the standard Roche FLX+ Rapid Library preparation protocol proposed here.
Standard Rapid Library Preparation Method Manual, FLX+ Roche
Optimized protocol for direct sequencing of limited samples
Imput DNA amount Even less than 50 pg 1 µg
Small Fragment removal AMPure BeadsQiagen MinElute PCR Purification kit
Nebulization SonicationDNA Fragmentation
Fragment End Repair Fragment End Repair mix, Roche Fragment End Repair mix, any provider
Adaptor-LigationRoche Adaptors /
MID Adaptors
Y Adaptors with MIDs designed by
Zheng et al. 2010
Library Quality Control Agilent Bioanalyzer High SensitivityDNA chip
PCR with emPCR primers, loading PCR product on agarose gel
Detection limit 1 pg / µL
Quantification method Fluorometer qPCR designed by Zheng et al. 201043 ng/µl
4.3 ng/µl
0.43 ng/µl
0.043 ng/µl
0.0043 ng/µl
0.00043 ng/µl
0 10 20 30 40
020
4060
8010
0
Cycles
floure
scen
ce (4
65-51
0)
zeptograms
emPCR and sequencing, standard Roche protocol
Small Fragment Removal AMPure beads AMPure beads
If not sufficient amount of library is obtained
Repeat the library preparation from the beginning - perform new DNA extraction
Amplify the library with few cycles with emPCR primers to reachthe minimal required concentration for sequencing and continue
Figure 72: Steps in standard 454 library preparation compared with optimized protocol for minimal
libraries.
In the standard Roche protocol, the samples are fragmented by nebulization in which DNA is forced through
a small hole in a nebulizer. It results in the formation of a fine mist which is collected by a pipette. Fragment
size is regulated by the pressure of the gas used to push the DNA through the nebulizer, the speed at which
the DNA solution passes through the hole, the viscosity of the solution, and the temperature (Sambrook and
Russell, 2006a).
In contrast, the sonicator used in this study allows to shear DNA placed in closed 1.5 ml tubes used along
118
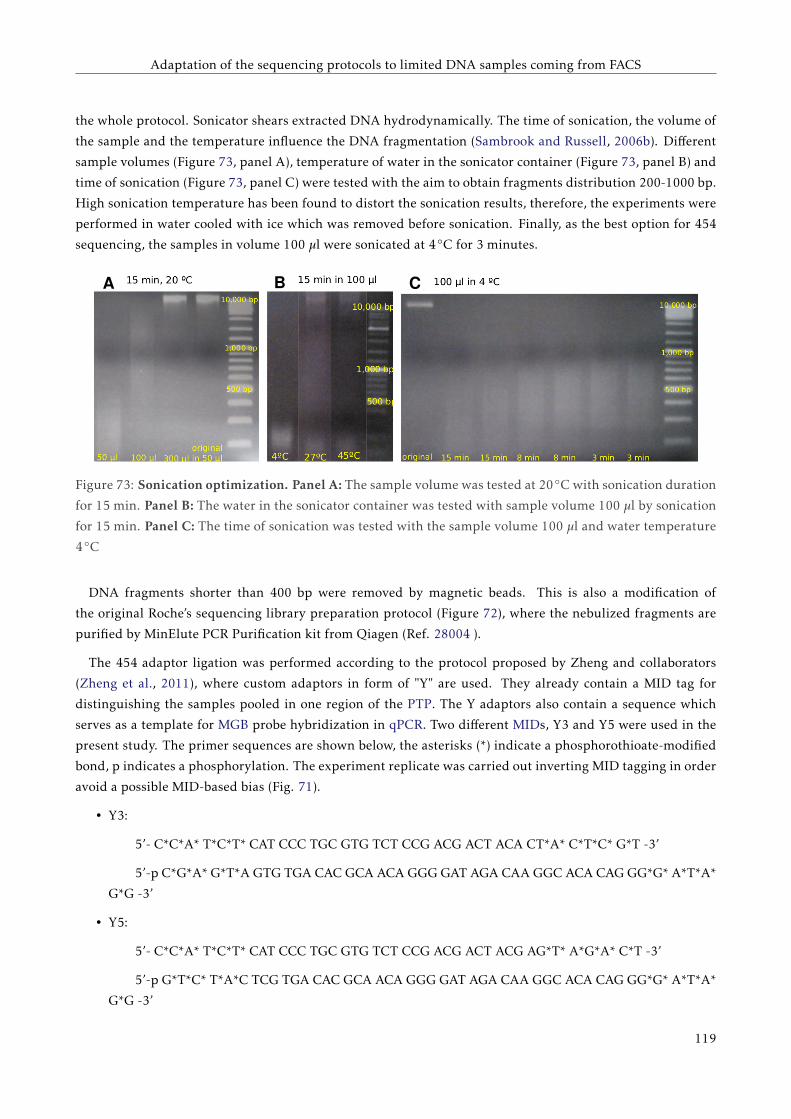
Adaptation of the sequencing protocols to limited DNA samples coming from FACS
the whole protocol. Sonicator shears extracted DNA hydrodynamically. The time of sonication, the volume of
the sample and the temperature influence the DNA fragmentation (Sambrook and Russell, 2006b). Different
sample volumes (Figure 73, panel A), temperature of water in the sonicator container (Figure 73, panel B) and
time of sonication (Figure 73, panel C) were tested with the aim to obtain fragments distribution 200-1000 bp.
High sonication temperature has been found to distort the sonication results, therefore, the experiments were
performed in water cooled with ice which was removed before sonication. Finally, as the best option for 454
sequencing, the samples in volume 100 µl were sonicated at 4◦C for 3 minutes.
CBA
Figure 73: Sonication optimization. Panel A: The sample volume was tested at 20◦C with sonication duration
for 15 min. Panel B: The water in the sonicator container was tested with sample volume 100 µl by sonication
for 15 min. Panel C: The time of sonication was tested with the sample volume 100 µl and water temperature
4◦C
DNA fragments shorter than 400 bp were removed by magnetic beads. This is also a modification of
the original Roche’s sequencing library preparation protocol (Figure 72), where the nebulized fragments are
purified by MinElute PCR Purification kit from Qiagen (Ref. 28004 ).
The 454 adaptor ligation was performed according to the protocol proposed by Zheng and collaborators
(Zheng et al., 2011), where custom adaptors in form of "Y" are used. They already contain a MID tag for
distinguishing the samples pooled in one region of the PTP. The Y adaptors also contain a sequence which
serves as a template for MGB probe hybridization in qPCR. Two different MIDs, Y3 and Y5 were used in the
present study. The primer sequences are shown below, the asterisks (*) indicate a phosphorothioate-modified
bond, p indicates a phosphorylation. The experiment replicate was carried out inverting MID tagging in order
avoid a possible MID-based bias (Fig. 71).
• Y3:
5’- C*C*A* T*C*T* CAT CCC TGC GTG TCT CCG ACG ACT ACA CT*A* C*T*C* G*T -3’
5’-p C*G*A* G*T*A GTG TGA CAC GCA ACA GGG GAT AGA CAA GGC ACA CAG GG*G* A*T*A*
G*G -3’
• Y5:
5’- C*C*A* T*C*T* CAT CCC TGC GTG TCT CCG ACG ACT ACG AG*T* A*G*A* C*T -3’
5’-p G*T*C* T*A*C TCG TGA CAC GCA ACA GGG GAT AGA CAA GGC ACA CAG GG*G* A*T*A*
G*G -3’
119
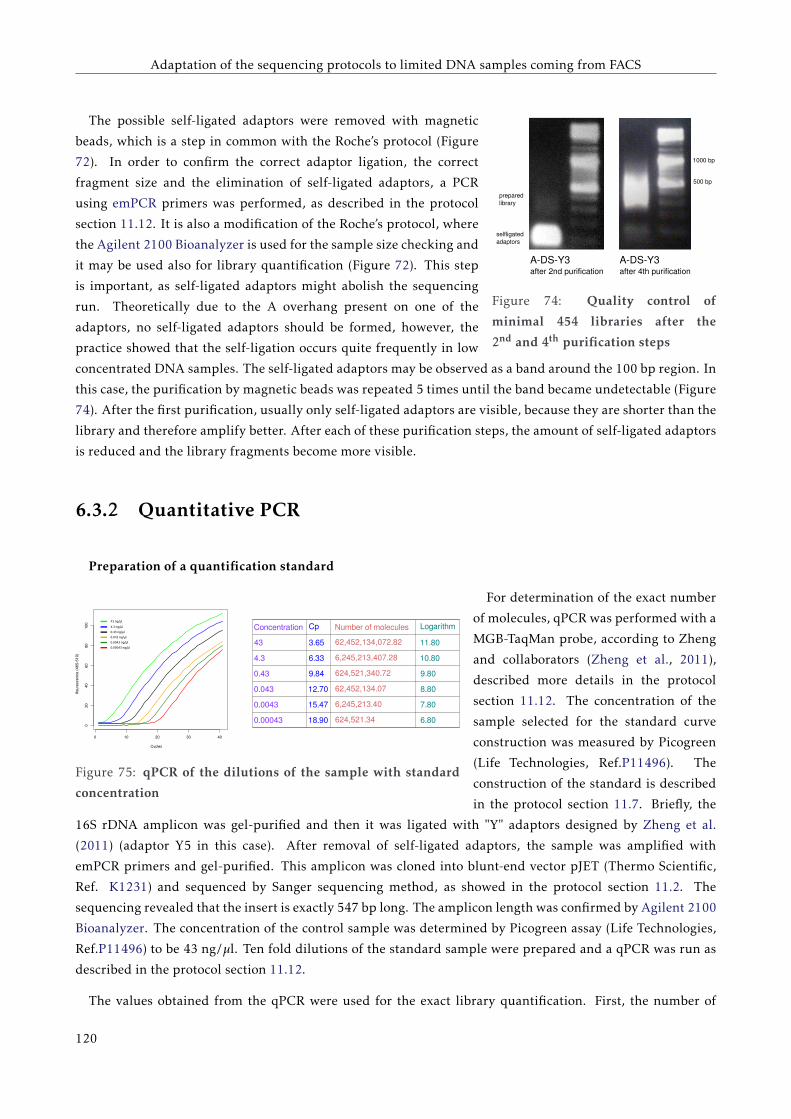
Adaptation of the sequencing protocols to limited DNA samples coming from FACS
selfligated adaptors
A-DS-Y3 after 4th purification
A-DS-Y3 after 2nd purification
preparedlibrary
500 bp
1000 bp
Figure 74: Quality control of
minimal 454 libraries after the
2nd and 4th purification steps
The possible self-ligated adaptors were removed with magnetic
beads, which is a step in common with the Roche’s protocol (Figure
72). In order to confirm the correct adaptor ligation, the correct
fragment size and the elimination of self-ligated adaptors, a PCR
using emPCR primers was performed, as described in the protocol
section 11.12. It is also a modification of the Roche’s protocol, where
the Agilent 2100 Bioanalyzer is used for the sample size checking and
it may be used also for library quantification (Figure 72). This step
is important, as self-ligated adaptors might abolish the sequencing
run. Theoretically due to the A overhang present on one of the
adaptors, no self-ligated adaptors should be formed, however, the
practice showed that the self-ligation occurs quite frequently in low
concentrated DNA samples. The self-ligated adaptors may be observed as a band around the 100 bp region. In
this case, the purification by magnetic beads was repeated 5 times until the band became undetectable (Figure
74). After the first purification, usually only self-ligated adaptors are visible, because they are shorter than the
library and therefore amplify better. After each of these purification steps, the amount of self-ligated adaptors
is reduced and the library fragments become more visible.
6.3.2 Quantitative PCR
Preparation of a quantification standard
43 ng/µl
4.3 ng/µl
0.43 ng/µl
0.043 ng/µl
0.0043 ng/µl
0.00043 ng/µl
0 10 20 30 40
020
4060
8010
0
Cycles
flour
esce
nce
(465
-510
)
Concentration
43
4.3
0.43
0.043
0.0043
0.00043
Cp
3.65
6.33
9.84
12.70
15.47
18.90
Number of molecules
62,452,134,072.82
6,245,213,407.28
624,521,340.72
62,452,134.07
6,245,213.40
624,521.34
Logarithm
11.80
10.80
9.80
8.80
7.80
6.80
Figure 75: qPCR of the dilutions of the sample with standard
concentration
For determination of the exact number
of molecules, qPCR was performed with a
MGB-TaqMan probe, according to Zheng
and collaborators (Zheng et al., 2011),
described more details in the protocol
section 11.12. The concentration of the
sample selected for the standard curve
construction was measured by Picogreen
(Life Technologies, Ref.P11496). The
construction of the standard is described
in the protocol section 11.7. Briefly, the
16S rDNA amplicon was gel-purified and then it was ligated with "Y" adaptors designed by Zheng et al.
(2011) (adaptor Y5 in this case). After removal of self-ligated adaptors, the sample was amplified with
emPCR primers and gel-purified. This amplicon was cloned into blunt-end vector pJET (Thermo Scientific,
Ref. K1231) and sequenced by Sanger sequencing method, as showed in the protocol section 11.2. The
sequencing revealed that the insert is exactly 547 bp long. The amplicon length was confirmed by Agilent 2100
Bioanalyzer. The concentration of the control sample was determined by Picogreen assay (Life Technologies,
Ref.P11496) to be 43 ng/µl. Ten fold dilutions of the standard sample were prepared and a qPCR was run as
described in the protocol section 11.12.
The values obtained from the qPCR were used for the exact library quantification. First, the number of
120
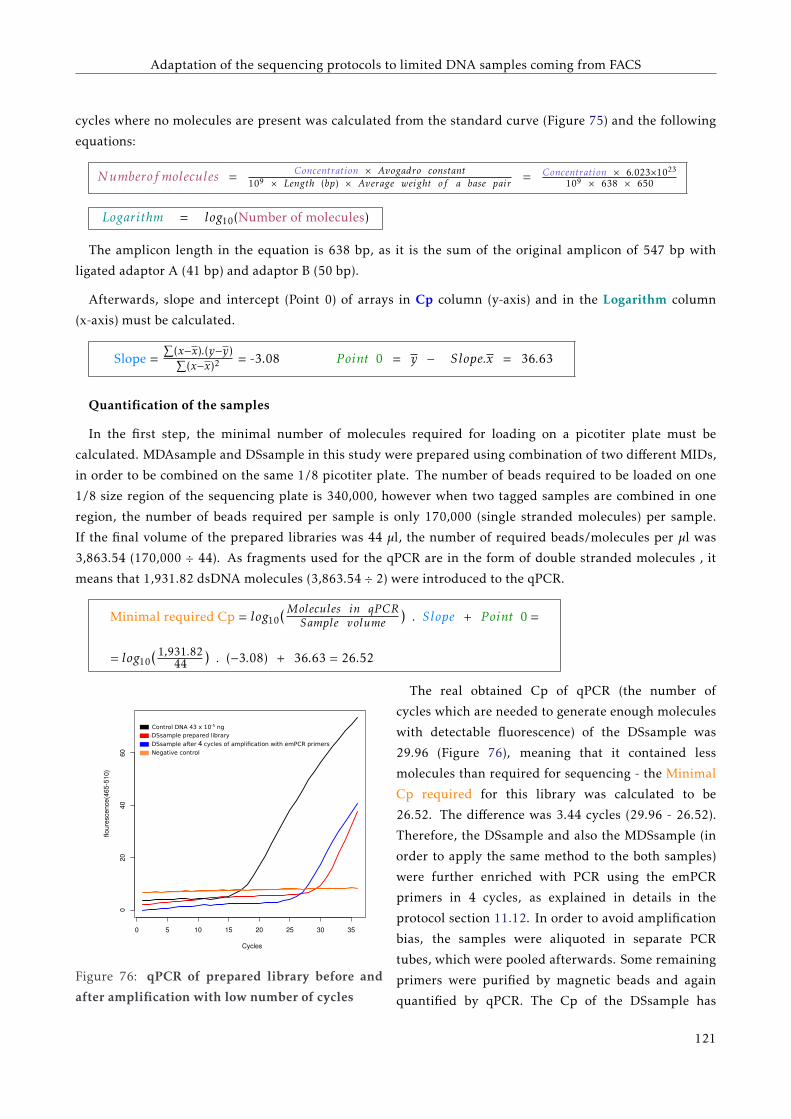
Adaptation of the sequencing protocols to limited DNA samples coming from FACS
cycles where no molecules are present was calculated from the standard curve (Figure 75) and the following
equations:
Numberof molecules = Concentration × Avogadro constant109 × Length (bp) × Average weight of a base pair
= Concentration × 6.023×10²³
109 × 638 × 650
Logarithm = log10(Number of molecules)
The amplicon length in the equation is 638 bp, as it is the sum of the original amplicon of 547 bp with
ligated adaptor A (41 bp) and adaptor B (50 bp).
Afterwards, slope and intercept (Point 0) of arrays in Cp column (y-axis) and in the Logarithm column
(x-axis) must be calculated.
Slope =∑
(x−x).(y−y)∑(x−x)2 = -3.08 P oint 0 = y − Slope.x = 36.63
Quantification of the samples
In the first step, the minimal number of molecules required for loading on a picotiter plate must be
calculated. MDAsample and DSsample in this study were prepared using combination of two different MIDs,
in order to be combined on the same 1/8 picotiter plate. The number of beads required to be loaded on one
1/8 size region of the sequencing plate is 340,000, however when two tagged samples are combined in one
region, the number of beads required per sample is only 170,000 (single stranded molecules) per sample.
If the final volume of the prepared libraries was 44 µl, the number of required beads/molecules per µl was
3,863.54 (170,000 ÷ 44). As fragments used for the qPCR are in the form of double stranded molecules , it
means that 1,931.82 dsDNA molecules (3,863.54 ÷ 2) were introduced to the qPCR.
= log10(1,931.8244 ) . (−3.08) + 36.63 = 26.52
Minimal required Cp = log10(Molecules in qP CRSample volume ) . Slope + P oint 0 =
0 5 10 15 20 25 30 35
020
4060
Cycles
flour
esce
nce(
465-
510)
Control DNA 43 x 10-5 ng
DSsample after 7 cycles of amplification with emPCR primers
DSsample prepared library
Negative control
4
Figure 76: qPCR of prepared library before and
after amplification with low number of cycles
The real obtained Cp of qPCR (the number of
cycles which are needed to generate enough molecules
with detectable fluorescence) of the DSsample was
29.96 (Figure 76), meaning that it contained less
molecules than required for sequencing - the Minimal
Cp required for this library was calculated to be
26.52. The difference was 3.44 cycles (29.96 - 26.52).
Therefore, the DSsample and also the MDSsample (in
order to apply the same method to the both samples)
were further enriched with PCR using the emPCR
primers in 4 cycles, as explained in details in the
protocol section 11.12. In order to avoid amplification
bias, the samples were aliquoted in separate PCR
tubes, which were pooled afterwards. Some remaining
primers were purified by magnetic beads and again
quantified by qPCR. The Cp of the DSsample has
121
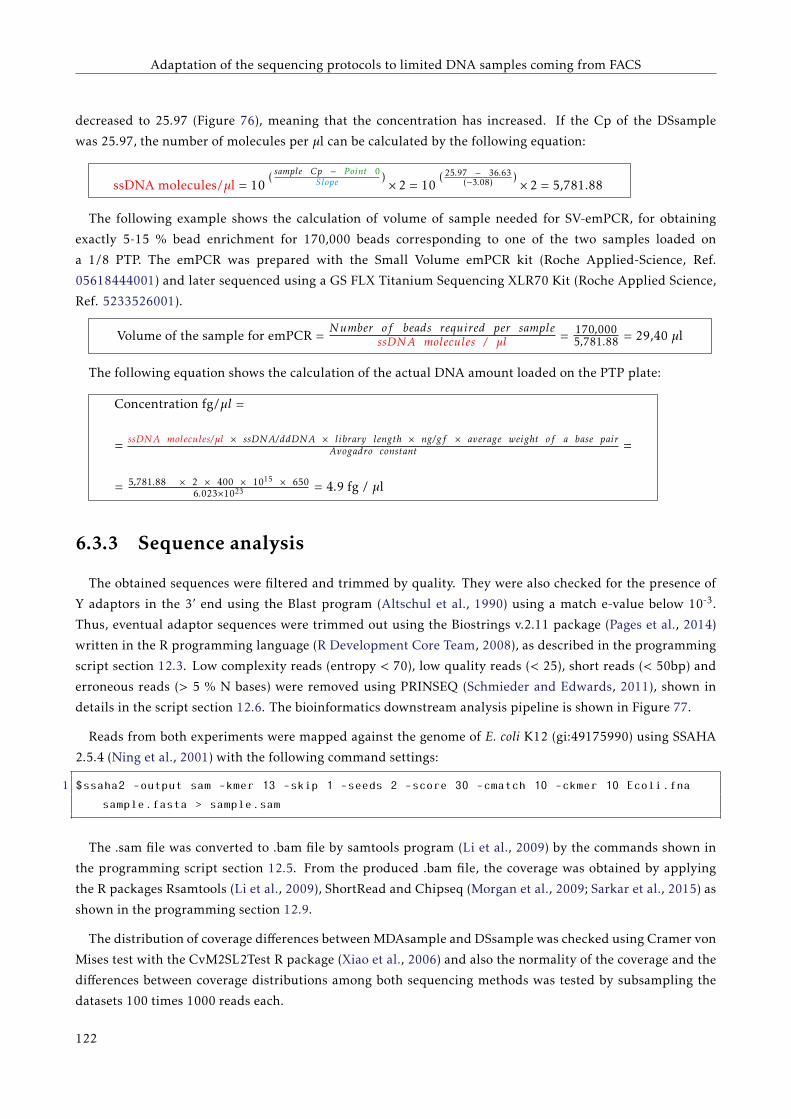
Adaptation of the sequencing protocols to limited DNA samples coming from FACS
decreased to 25.97 (Figure 76), meaning that the concentration has increased. If the Cp of the DSsample
was 25.97, the number of molecules per µl can be calculated by the following equation:
ssDNA molecules/µl = 10( sample Cp − P oint 0
Slope ) × 2 = 10( 25.97 − 36.63
(−3.08) ) × 2 = 5,781.88
The following example shows the calculation of volume of sample needed for SV-emPCR, for obtaining
exactly 5-15 % bead enrichment for 170,000 beads corresponding to one of the two samples loaded on
a 1/8 PTP. The emPCR was prepared with the Small Volume emPCR kit (Roche Applied-Science, Ref.
05618444001) and later sequenced using a GS FLX Titanium Sequencing XLR70 Kit (Roche Applied Science,
Ref. 5233526001).
Volume of the sample for emPCR =Number of beads required per sample
ssDNA molecules / µl = 170,0005,781.88 = 29,40 µl
The following equation shows the calculation of the actual DNA amount loaded on the PTP plate:
= 5,781.88 × 2 × 400 × 1015 × 6506.023×1023 = 4.9 fg / µl
= ssDNA molecules/µl × ssDNA/ddDNA × library length × ng/gf × average weight of a base pairAvogadro constant =
Concentration fg/µl =
6.3.3 Sequence analysis
The obtained sequences were filtered and trimmed by quality. They were also checked for the presence of
Y adaptors in the 3’ end using the Blast program (Altschul et al., 1990) using a match e-value below 10-3.
Thus, eventual adaptor sequences were trimmed out using the Biostrings v.2.11 package (Pages et al., 2014)
written in the R programming language (R Development Core Team, 2008), as described in the programming
script section 12.3. Low complexity reads (entropy < 70), low quality reads (< 25), short reads (< 50bp) and
erroneous reads (> 5 % N bases) were removed using PRINSEQ (Schmieder and Edwards, 2011), shown in
details in the script section 12.6. The bioinformatics downstream analysis pipeline is shown in Figure 77.
Reads from both experiments were mapped against the genome of E. coli K12 (gi:49175990) using SSAHA
2.5.4 (Ning et al., 2001) with the following command settings:
1 $ssaha2 -output sam -kmer 13 -skip 1 -seeds 2 -score 30 -cmatch 10 -ckmer 10 Ecoli.fna
sample.fasta > sample.sam
The .sam file was converted to .bam file by samtools program (Li et al., 2009) by the commands shown in
the programming script section 12.5. From the produced .bam file, the coverage was obtained by applying
the R packages Rsamtools (Li et al., 2009), ShortRead and Chipseq (Morgan et al., 2009; Sarkar et al., 2015) as
shown in the programming section 12.9.
The distribution of coverage differences between MDAsample and DSsample was checked using Cramer von
Mises test with the CvM2SL2Test R package (Xiao et al., 2006) and also the normality of the coverage and the
differences between coverage distributions among both sequencing methods was tested by subsampling the
datasets 100 times 1000 reads each.
122
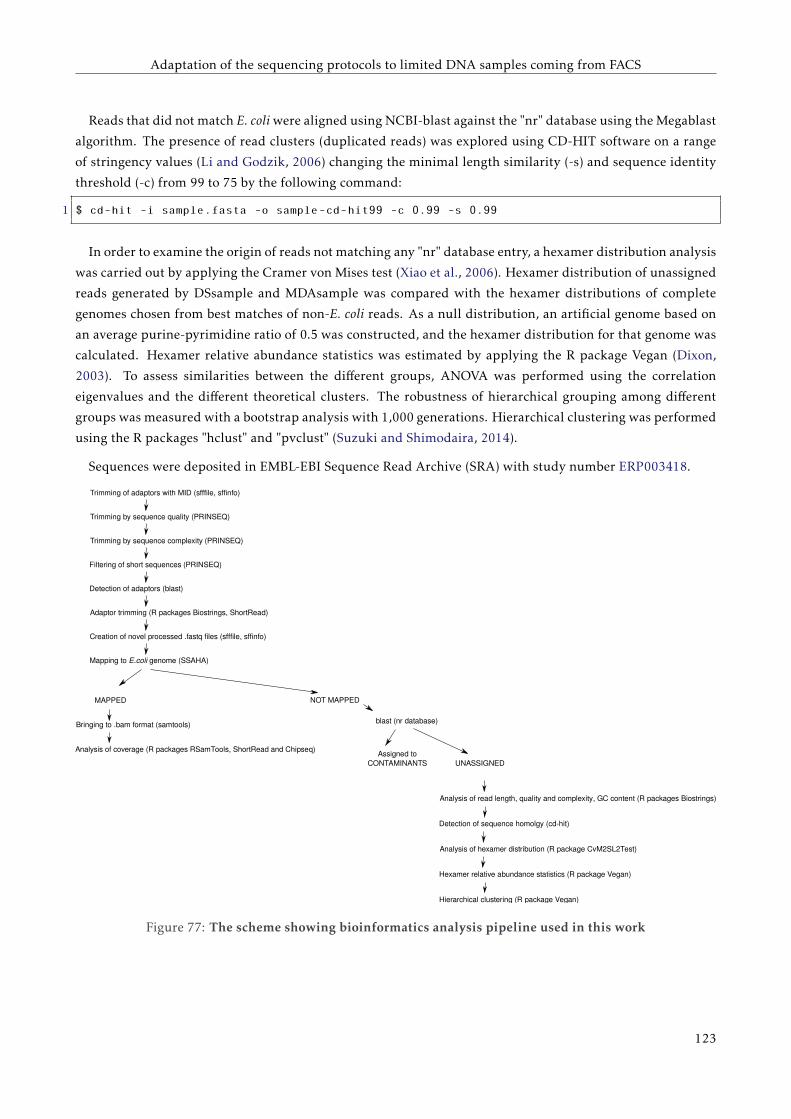
Adaptation of the sequencing protocols to limited DNA samples coming from FACS
Reads that did not match E. coli were aligned using NCBI-blast against the "nr" database using the Megablast
algorithm. The presence of read clusters (duplicated reads) was explored using CD-HIT software on a range
of stringency values (Li and Godzik, 2006) changing the minimal length similarity (-s) and sequence identity
threshold (-c) from 99 to 75 by the following command:
1 $ cd-hit -i sample.fasta -o sample-cd-hit99 -c 0.99 -s 0.99
In order to examine the origin of reads not matching any "nr" database entry, a hexamer distribution analysis
was carried out by applying the Cramer von Mises test (Xiao et al., 2006). Hexamer distribution of unassigned
reads generated by DSsample and MDAsample was compared with the hexamer distributions of complete
genomes chosen from best matches of non-E. coli reads. As a null distribution, an artificial genome based on
an average purine-pyrimidine ratio of 0.5 was constructed, and the hexamer distribution for that genome was
calculated. Hexamer relative abundance statistics was estimated by applying the R package Vegan (Dixon,
2003). To assess similarities between the different groups, ANOVA was performed using the correlation
eigenvalues and the different theoretical clusters. The robustness of hierarchical grouping among different
groups was measured with a bootstrap analysis with 1,000 generations. Hierarchical clustering was performed
using the R packages "hclust" and "pvclust" (Suzuki and Shimodaira, 2014).
Sequences were deposited in EMBL-EBI Sequence Read Archive (SRA) with study number ERP003418.
Trimming of adaptors with MID (sfffile, sffinfo)
Trimming by sequence quality (PRINSEQ)
Trimming by sequence complexity (PRINSEQ)
Filtering of short sequences (PRINSEQ)
Detection of adaptors (blast)
Adaptor trimming (R packages Biostrings, ShortRead)
Creation of novel processed .fastq files (sfffile, sffinfo)
Mapping to E.coli genome (SSAHA)
Bringing to .bam format (samtools)
Analysis of coverage (R packages RSamTools, ShortRead and Chipseq)
MAPPED NOT MAPPED
blast (nr database)
Assigned to CONTAMINANTS UNASSIGNED
Detection of sequence homolgy (cd-hit)
Analysis of read length, quality and complexity, GC content (R packages Biostrings)
Analysis of hexamer distribution (R package CvM2SL2Test)
Hexamer relative abundance statistics (R package Vegan)
Hierarchical clustering (R package Vegan)
Figure 77: The scheme showing bioinformatics analysis pipeline used in this work
123
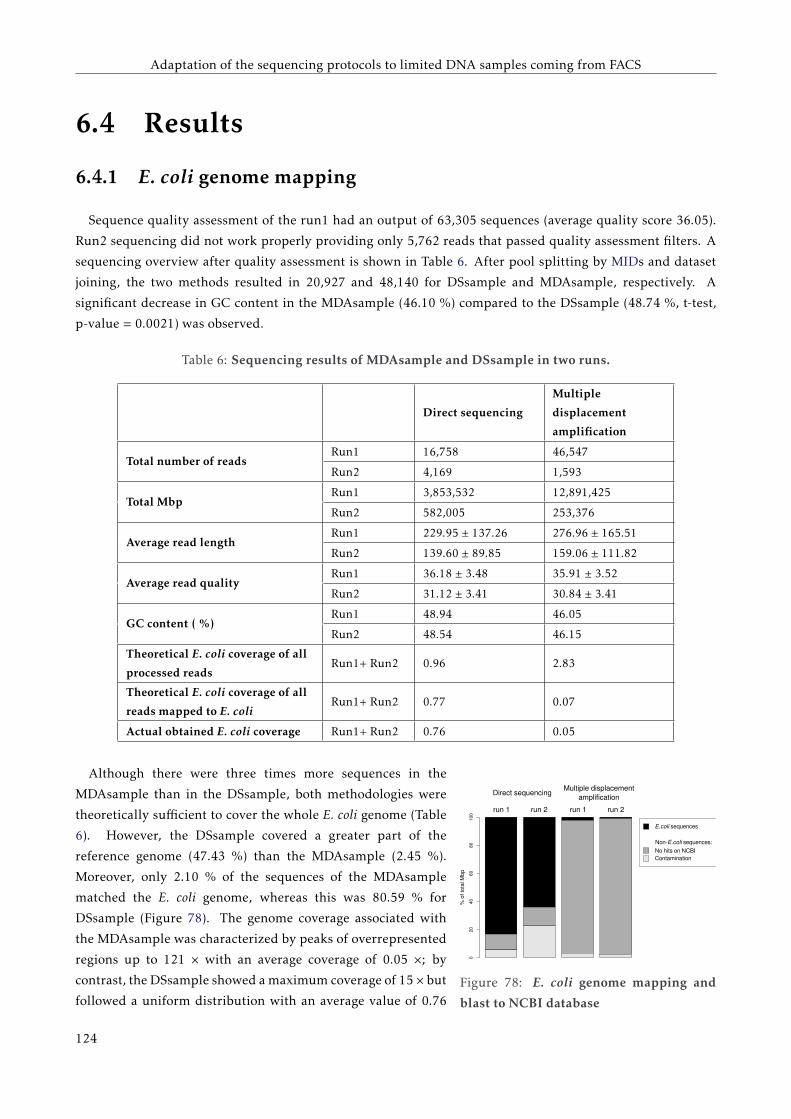
Adaptation of the sequencing protocols to limited DNA samples coming from FACS
6.4 Results
6.4.1 E. coli genome mapping
Sequence quality assessment of the run1 had an output of 63,305 sequences (average quality score 36.05).
Run2 sequencing did not work properly providing only 5,762 reads that passed quality assessment filters. A
sequencing overview after quality assessment is shown in Table 6. After pool splitting by MIDs and dataset
joining, the two methods resulted in 20,927 and 48,140 for DSsample and MDAsample, respectively. A
significant decrease in GC content in the MDAsample (46.10 %) compared to the DSsample (48.74 %, t-test,
p-value = 0.0021) was observed.
Table 6: Sequencing results of MDAsample and DSsample in two runs.
Direct sequencing
Multiple
displacement
amplification
Total number of readsRun1 16,758 46,547
Run2 4,169 1,593
Total MbpRun1 3,853,532 12,891,425
Run2 582,005 253,376
Average read lengthRun1 229.95 ± 137.26 276.96 ± 165.51
Run2 139.60 ± 89.85 159.06 ± 111.82
Average read qualityRun1 36.18 ± 3.48 35.91 ± 3.52
Run2 31.12 ± 3.41 30.84 ± 3.41
GC content ( %)Run1 48.94 46.05
Run2 48.54 46.15
Theoretical E. coli coverage of all
processed readsRun1+ Run2 0.96 2.83
Theoretical E. coli coverage of all
reads mapped to E. coliRun1+ Run2 0.77 0.07
Actual obtained E. coli coverage Run1+ Run2 0.76 0.05
020
4060
8010
0
Direct sequencingMultiple displacement
amplification
run 1 run 1run 2 run 2
% o
f tot
al M
bp
E.coli sequences
Non-E.coli sequences:
No hits on NCBIContamination
Figure 78: E. coli genome mapping and
blast to NCBI database
Although there were three times more sequences in the
MDAsample than in the DSsample, both methodologies were
theoretically sufficient to cover the whole E. coli genome (Table
6). However, the DSsample covered a greater part of the
reference genome (47.43 %) than the MDAsample (2.45 %).
Moreover, only 2.10 % of the sequences of the MDAsample
matched the E. coli genome, whereas this was 80.59 % for
DSsample (Figure 78). The genome coverage associated with
the MDAsample was characterized by peaks of overrepresented
regions up to 121 × with an average coverage of 0.05 ×; by
contrast, the DSsample showed a maximum coverage of 15 × but
followed a uniform distribution with an average value of 0.76
124
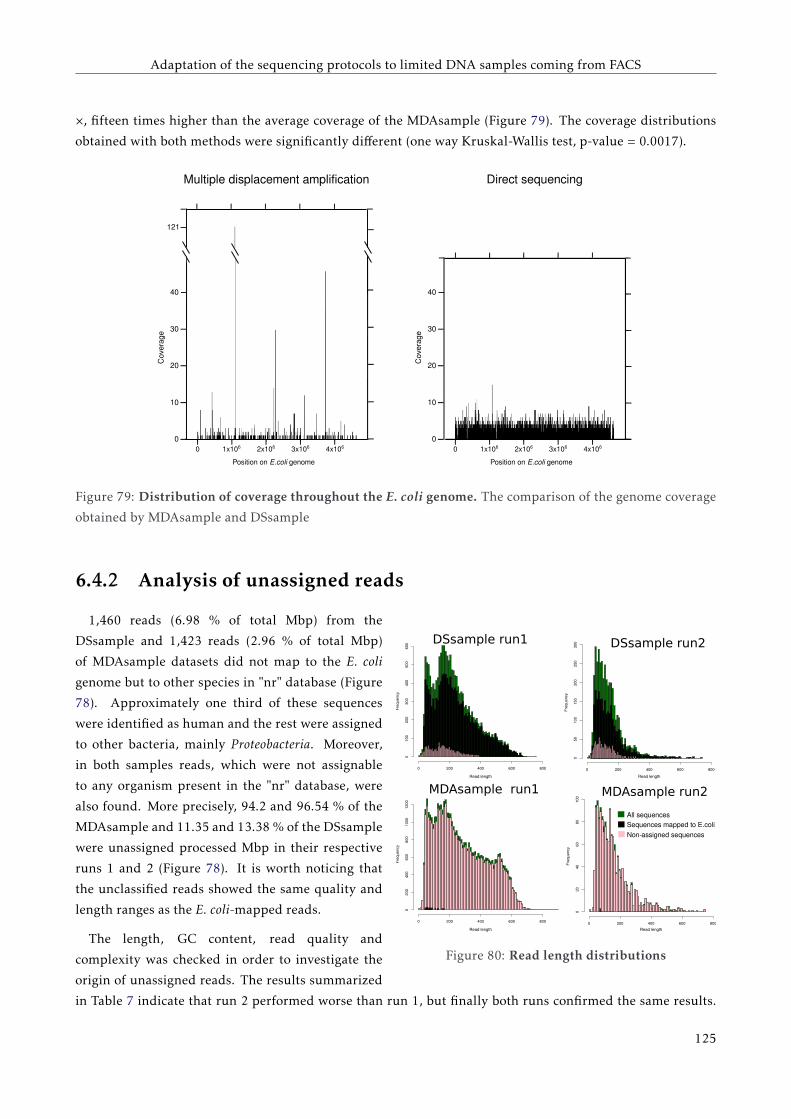
Adaptation of the sequencing protocols to limited DNA samples coming from FACS
×, fifteen times higher than the average coverage of the MDAsample (Figure 79). The coverage distributions
obtained with both methods were significantly different (one way Kruskal-Wallis test, p-value = 0.0017).
0 1x10⁶ 2x10⁶ 3x10⁶ 4x10⁶
Position on E.coli genome
0 1x10⁶ 2x10⁶ 3x10⁶ 4x10⁶
Position on E.coli genome
40
10
0
30
20Cov
erag
e
40
10
0
30
20Cov
erag
e
121
Multiple displacement amplification Direct sequencing
Figure 79: Distribution of coverage throughout the E. coli genome. The comparison of the genome coverage
obtained by MDAsample and DSsample
6.4.2 Analysis of unassigned reads
Freq
uenc
y
0 200 400 600 800
010
020
030
040
050
060
0
Freq
uenc
y
0 200 400 600 800
050
100
150
200
250
300
Read length Read length
Freq
uenc
y
0 200 400 600 800
020
040
060
080
010
0012
00
Freq
uenc
y
0 200 400 600 800
020
4060
8010
0
Non-assigned sequences
Sequences mapped to E.coli
All sequences
Read length Read length
DSsample run1 DSsample run2
MDAsample run1 MDAsample run2
Figure 80: Read length distributions
1,460 reads (6.98 % of total Mbp) from the
DSsample and 1,423 reads (2.96 % of total Mbp)
of MDAsample datasets did not map to the E. coli
genome but to other species in "nr" database (Figure
78). Approximately one third of these sequences
were identified as human and the rest were assigned
to other bacteria, mainly Proteobacteria. Moreover,
in both samples reads, which were not assignable
to any organism present in the "nr" database, were
also found. More precisely, 94.2 and 96.54 % of the
MDAsample and 11.35 and 13.38 % of the DSsample
were unassigned processed Mbp in their respective
runs 1 and 2 (Figure 78). It is worth noticing that
the unclassified reads showed the same quality and
length ranges as the E. coli-mapped reads.
The length, GC content, read quality and
complexity was checked in order to investigate the
origin of unassigned reads. The results summarized
in Table 7 indicate that run 2 performed worse than run 1, but finally both runs confirmed the same results.
125
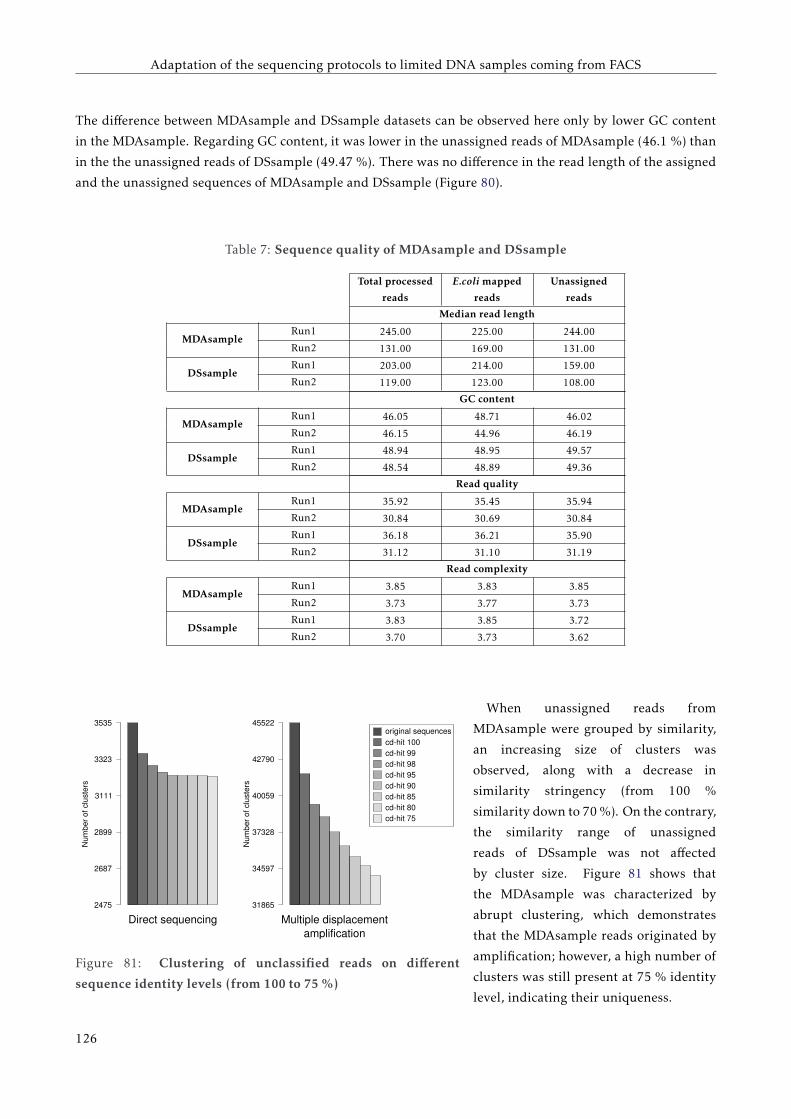
Adaptation of the sequencing protocols to limited DNA samples coming from FACS
The difference between MDAsample and DSsample datasets can be observed here only by lower GC content
in the MDAsample. Regarding GC content, it was lower in the unassigned reads of MDAsample (46.1 %) than
in the the unassigned reads of DSsample (49.47 %). There was no difference in the read length of the assigned
and the unassigned sequences of MDAsample and DSsample (Figure 80).
Table 7: Sequence quality of MDAsample and DSsample
Total processed
reads
E.coli mapped
reads
Unassigned
reads
Median read length
MDAsampleRun1 245.00 225.00 244.00
Run2 131.00 169.00 131.00
DSsampleRun1 203.00 214.00 159.00
Run2 119.00 123.00 108.00
GC content
MDAsampleRun1 46.05 48.71 46.02
Run2 46.15 44.96 46.19
DSsampleRun1 48.94 48.95 49.57
Run2 48.54 48.89 49.36
Read quality
MDAsampleRun1 35.92 35.45 35.94
Run2 30.84 30.69 30.84
DSsampleRun1 36.18 36.21 35.90
Run2 31.12 31.10 31.19
Read complexity
MDAsampleRun1 3.85 3.83 3.85
Run2 3.73 3.77 3.73
DSsampleRun1 3.83 3.85 3.72
Run2 3.70 3.73 3.62
3535
3323
3111
2899
2687
2475
45522
42790
40059
37328
34597
31865
Direct sequencing Multiple displacement amplification
original sequencescd-hit 100cd-hit 99cd-hit 98cd-hit 95cd-hit 90cd-hit 85cd-hit 80cd-hit 75
Num
ber o
f clu
ster
s
Num
ber o
f clu
ster
s
Figure 81: Clustering of unclassified reads on different
sequence identity levels (from 100 to 75 %)
When unassigned reads from
MDAsample were grouped by similarity,
an increasing size of clusters was
observed, along with a decrease in
similarity stringency (from 100 %
similarity down to 70 %). On the contrary,
the similarity range of unassigned
reads of DSsample was not affected
by cluster size. Figure 81 shows that
the MDAsample was characterized by
abrupt clustering, which demonstrates
that the MDAsample reads originated by
amplification; however, a high number of
clusters was still present at 75 % identity
level, indicating their uniqueness.
126
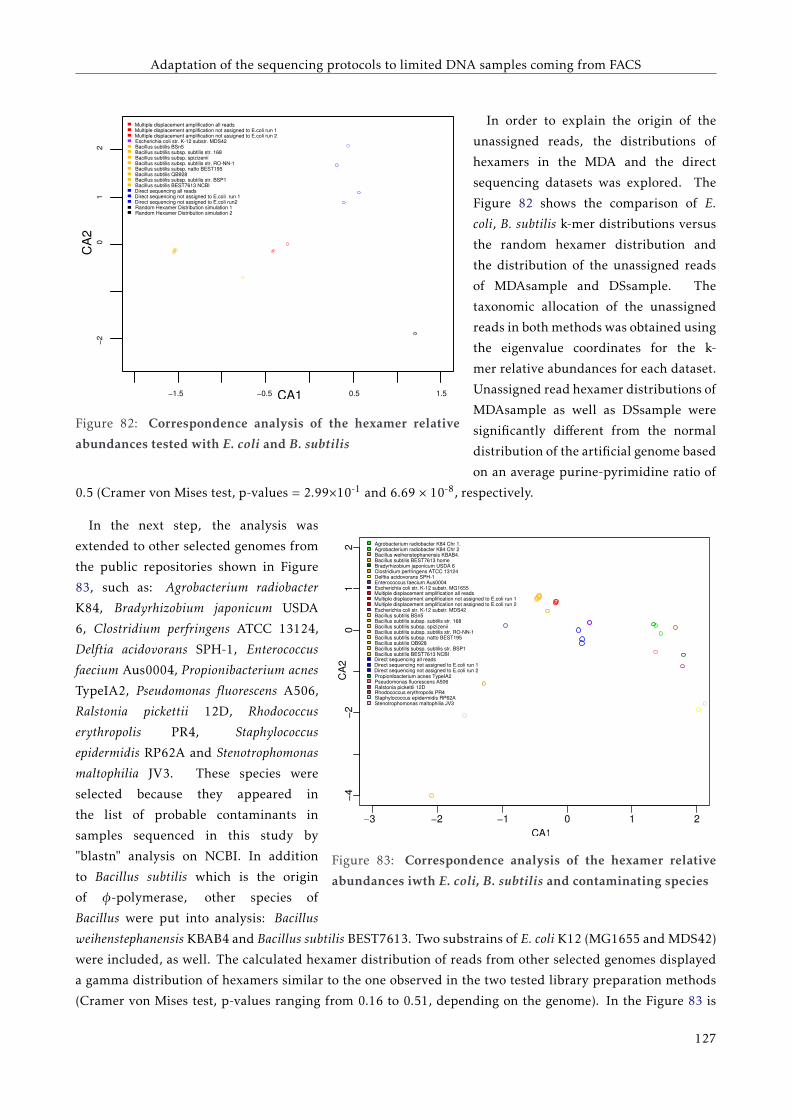
Adaptation of the sequencing protocols to limited DNA samples coming from FACS
−1.5 −0.5 0.5 1.5
−20
12
CA1
CA
2
GenomiPhi fGenomiPhi Not E. coli fGenomiPhi Not E. coli fEscherichia coli str. K-12 substr. MDS42Bacillus subtilis BSn5Bacillus subtilis subsp. subtilis str. 168Bacillus subtilis subsp. spizizeniiBacillus subtilis subsp. subtilis str. RO-NN-1Bacillus subtilis subsp. natto BEST195Bacillus subtilis QB928Bacillus subtilis subsp. subtilis str. BSP1Bacillus subtilis BEST7613 NCBIAmplification-free sequencingAmplification-free sequencing not assigned to E.coli 1Amplification-free sequencing not assigned to E coli 2Random Hexamer Distribution simulation 1Random Hexamer Distribution simulation 2
Direct sequencing all readsDirect sequencing not assigned to E.coli run 1Direct sequencing not assigned to E.coli run2
Multiple displacement amplification all readsMultiple displacement amplification not assigned to E.coli run 1Multiple displacement amplification not assigned to E.coli run 2
Figure 82: Correspondence analysis of the hexamer relative
abundances tested with E. coli and B. subtilis
In order to explain the origin of the
unassigned reads, the distributions of
hexamers in the MDA and the direct
sequencing datasets was explored. The
Figure 82 shows the comparison of E.
coli, B. subtilis k-mer distributions versus
the random hexamer distribution and
the distribution of the unassigned reads
of MDAsample and DSsample. The
taxonomic allocation of the unassigned
reads in both methods was obtained using
the eigenvalue coordinates for the k-
mer relative abundances for each dataset.
Unassigned read hexamer distributions of
MDAsample as well as DSsample were
significantly different from the normal
distribution of the artificial genome based
on an average purine-pyrimidine ratio of
0.5 (Cramer von Mises test, p-values = 2.99×10⁻¹ and 6.69 × 10⁻⁸, respectively.
−3 −2 −1 0 1 2
−4−2
01
2
CA1
CA
2
Agrobacterium radiobacter K84 Chr 1.Agrobacterium radiobacter K84 Chr 2Bacillus weihenstephanensis KBAB4.Bacillus subtilis BEST7613 homeBradyrhizobium japonicum USDA 6Clostridium perfringens ATCC 13124Delftia acidovorans SPH-1Enterococcus faecium Aus0004Escherichia coli str. K-12 substr. MG1655GenomiPhi fragmentsGenomiPhi Not E. coli fragments 1GenomiPhi Not E. coli fragments 2Escherichia coli str. K-12 substr. MDS42Bacillus subtilis BSn5Bacillus subtilis subsp. subtilis str. 168Bacillus subtilis subsp. spizizeniiBacillus subtilis subsp. subtilis str. RO-NN-1Bacillus subtilis subsp. natto BEST195Bacillus subtilis QB928Bacillus subtilis subsp. subtilis str. BSP1Bacillus subtilis BEST7613 NCBIAmplification-free sequencingAmplification-free sequencing not assigned to E.coli 1Amplification-free sequencing not assigned to E coli 2Propionibacterium acnes TypeIA2Pseudomonas fluorescens A506Ralstonia pickettii 12DRhodococcus erythropolis PR4Staphylococcus epidermidis RP62AStenotrophomonas maltophilia JV3
Multiple displacement amplification all readsMultiple displacement amplification not assigned to E.coli run 1Multiple displacement amplification not assigned to E.coli run 2
Direct sequencing all readsDirect sequencing not assigned to E.coli run 1Direct sequencing not assigned to E.coli run 2
Figure 83: Correspondence analysis of the hexamer relative
abundances iwth E. coli, B. subtilis and contaminating species
In the next step, the analysis was
extended to other selected genomes from
the public repositories shown in Figure
83, such as: Agrobacterium radiobacter
K84, Bradyrhizobium japonicum USDA
6, Clostridium perfringens ATCC 13124,
Delftia acidovorans SPH-1, Enterococcus
faecium Aus0004, Propionibacterium acnes
TypeIA2, Pseudomonas fluorescens A506,
Ralstonia pickettii 12D, Rhodococcus
erythropolis PR4, Staphylococcus
epidermidis RP62A and Stenotrophomonas
maltophilia JV3. These species were
selected because they appeared in
the list of probable contaminants in
samples sequenced in this study by
"blastn" analysis on NCBI. In addition
to Bacillus subtilis which is the origin
of φ-polymerase, other species of
Bacillus were put into analysis: Bacillus
weihenstephanensis KBAB4 and Bacillus subtilis BEST7613. Two substrains of E. coli K12 (MG1655 and MDS42)
were included, as well. The calculated hexamer distribution of reads from other selected genomes displayed
a gamma distribution of hexamers similar to the one observed in the two tested library preparation methods
(Cramer von Mises test, p-values ranging from 0.16 to 0.51, depending on the genome). In the Figure 83 is
127
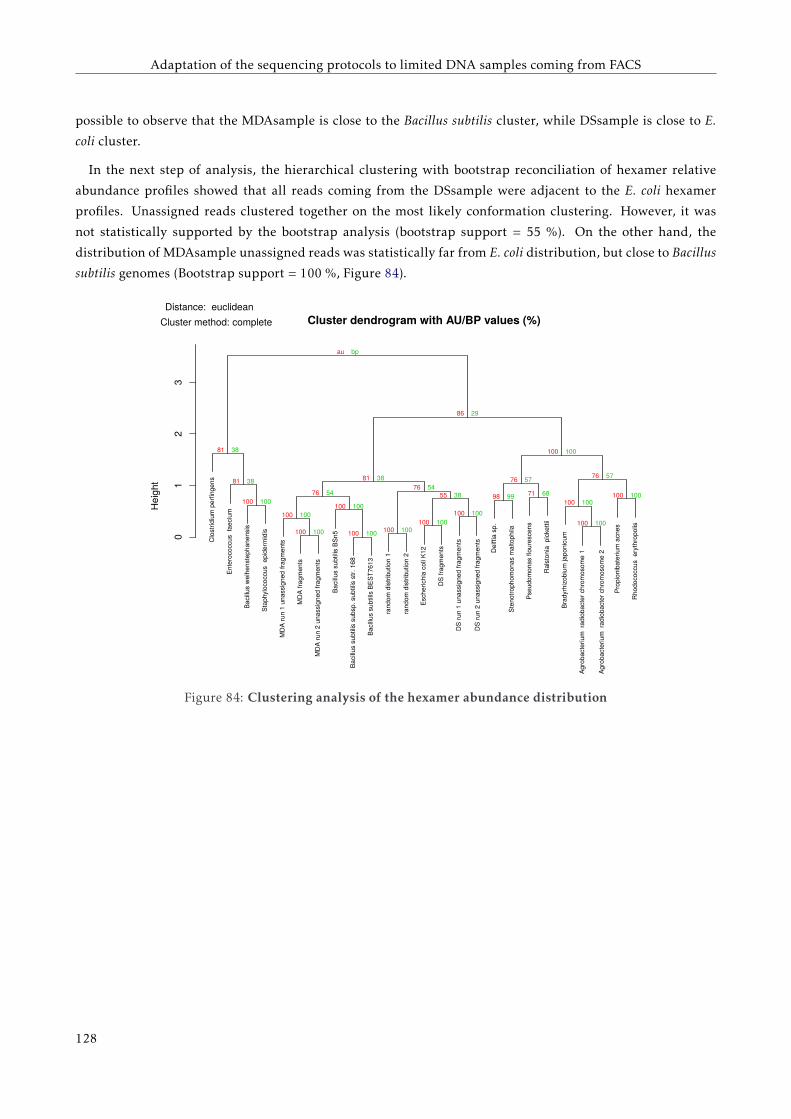
Adaptation of the sequencing protocols to limited DNA samples coming from FACS
possible to observe that the MDAsample is close to the Bacillus subtilis cluster, while DSsample is close to E.
coli cluster.
In the next step of analysis, the hierarchical clustering with bootstrap reconciliation of hexamer relative
abundance profiles showed that all reads coming from the DSsample were adjacent to the E. coli hexamer
profiles. Unassigned reads clustered together on the most likely conformation clustering. However, it was
not statistically supported by the bootstrap analysis (bootstrap support = 55 %). On the other hand, the
distribution of MDAsample unassigned reads was statistically far from E. coli distribution, but close to Bacillus
subtilis genomes (Bootstrap support = 100 %, Figure 84).
Clo
strid
ium
per
finge
ns
Ente
roco
ccus
fae
cium
Baci
llus
wei
hens
teph
anen
sis
Stap
hylo
cocc
us e
pide
rmid
is
MD
A ru
n 1
unas
sign
ed fr
agm
ents
MD
A fra
gmen
ts
MD
A ru
n 2
unas
sign
edfra
gmen
ts
Baci
llus
subt
ilis B
Sn5
Baci
llus
subt
ilis s
ubsp
. sub
tilis
str.
168
Baci
llus
subt
ilis B
EST7
613
rand
om d
istri
butio
n 1
Esch
eric
hia
coli
K12
DS
fragm
ents
DS
run
1 un
assi
gned
frag
men
ts
Del
ftia
sp.
Sten
otro
phom
onas
mal
toph
ila
Pseu
dom
onas
flou
resc
ens
Ral
ston
ia p
icke
ttii
Brad
yrhi
zobi
um ja
poni
cum
Agro
bact
eriu
m r
adio
bact
er c
hrom
osom
e 1
Prop
ioni
bate
rium
acn
es
Rho
doco
ccus
ery
thro
polis
01
23
Cluster dendrogram with AU/BP values (%)Cluster method: completeDistance: euclidean
Hei
ght
100100 100100100
100 100100 100100
9855 100717676
81 7681 76
10081
86
au
100100 100100100
100 100100 100100
9938 100685454
38 5738 57
10038
29
bp
rand
om d
istri
butio
n 2
DS
run
2 un
assi
gned
frag
men
ts
Agro
bact
eriu
m r
adio
bact
er c
hrom
osom
e 2
Figure 84: Clustering analysis of the hexamer abundance distribution
128
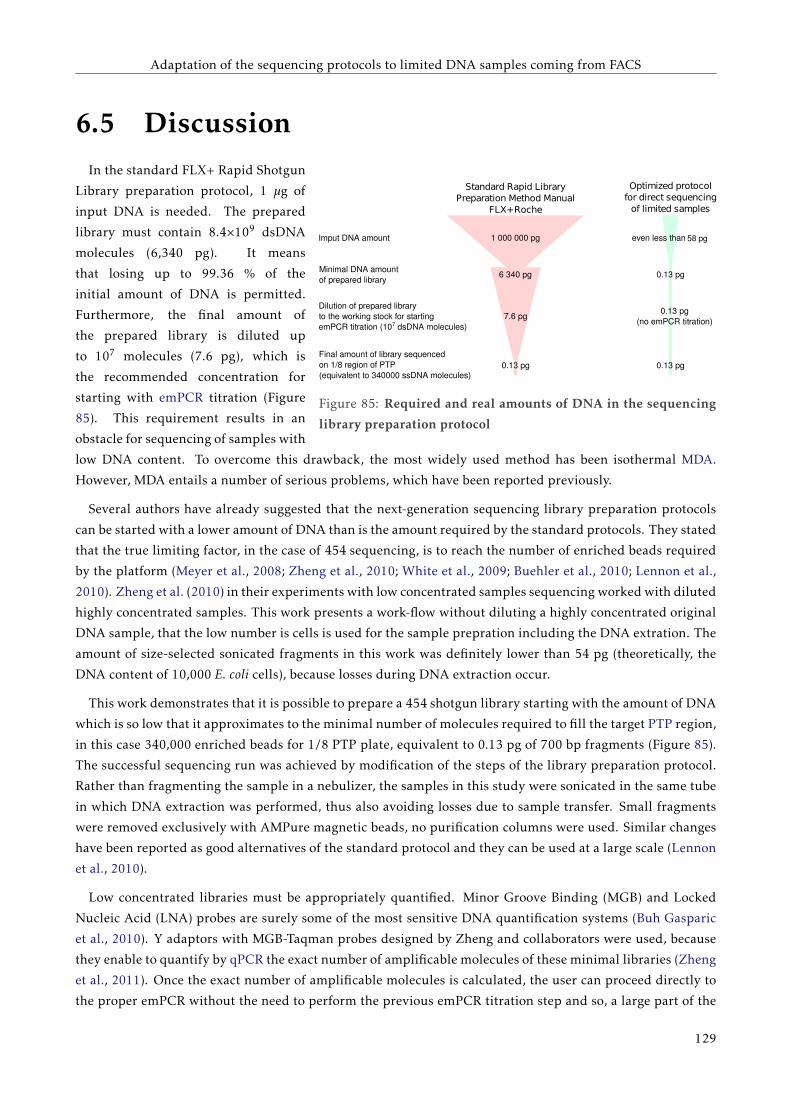
Adaptation of the sequencing protocols to limited DNA samples coming from FACS
6.5 Discussion
1 000 000 pg
6 340 pg
Standard Rapid LibraryPreparation Method Manual
FLX+ Roche
Optimized protocolfor direct sequencing
of limited samples
7.6 pg
0.13 pg
Imput DNA amount
Minimal DNA amountof prepared library
Dilution of prepared libraryto the working stock for startingemPCR titration (107 dsDNA molecules)
Final amount of library sequencedon 1/8 region of PTP(equivalent to 340000 ssDNA molecules)
even less than
0.13 pg
0.13 pg(no emPCR titration)
0.13 pg
58 pg
Figure 85: Required and real amounts of DNA in the sequencing
library preparation protocol
In the standard FLX+ Rapid Shotgun
Library preparation protocol, 1 µg of
input DNA is needed. The prepared
library must contain 8.4×10⁹ dsDNA
molecules (6,340 pg). It means
that losing up to 99.36 % of the
initial amount of DNA is permitted.
Furthermore, the final amount of
the prepared library is diluted up
to 107 molecules (7.6 pg), which is
the recommended concentration for
starting with emPCR titration (Figure
85). This requirement results in an
obstacle for sequencing of samples with
low DNA content. To overcome this drawback, the most widely used method has been isothermal MDA.
However, MDA entails a number of serious problems, which have been reported previously.
Several authors have already suggested that the next-generation sequencing library preparation protocols
can be started with a lower amount of DNA than is the amount required by the standard protocols. They stated
that the true limiting factor, in the case of 454 sequencing, is to reach the number of enriched beads required
by the platform (Meyer et al., 2008; Zheng et al., 2010; White et al., 2009; Buehler et al., 2010; Lennon et al.,
2010). Zheng et al. (2010) in their experiments with low concentrated samples sequencing worked with diluted
highly concentrated samples. This work presents a work-flow without diluting a highly concentrated original
DNA sample, that the low number is cells is used for the sample prepration including the DNA extration. The
amount of size-selected sonicated fragments in this work was definitely lower than 54 pg (theoretically, the
DNA content of 10,000 E. coli cells), because losses during DNA extraction occur.
This work demonstrates that it is possible to prepare a 454 shotgun library starting with the amount of DNA
which is so low that it approximates to the minimal number of molecules required to fill the target PTP region,
in this case 340,000 enriched beads for 1/8 PTP plate, equivalent to 0.13 pg of 700 bp fragments (Figure 85).
The successful sequencing run was achieved by modification of the steps of the library preparation protocol.
Rather than fragmenting the sample in a nebulizer, the samples in this study were sonicated in the same tube
in which DNA extraction was performed, thus also avoiding losses due to sample transfer. Small fragments
were removed exclusively with AMPure magnetic beads, no purification columns were used. Similar changes
have been reported as good alternatives of the standard protocol and they can be used at a large scale (Lennon
et al., 2010).
Low concentrated libraries must be appropriately quantified. Minor Groove Binding (MGB) and Locked
Nucleic Acid (LNA) probes are surely some of the most sensitive DNA quantification systems (Buh Gasparic
et al., 2010). Y adaptors with MGB-Taqman probes designed by Zheng and collaborators were used, because
they enable to quantify by qPCR the exact number of amplificable molecules of these minimal libraries (Zheng
et al., 2011). Once the exact number of amplificable molecules is calculated, the user can proceed directly to
the proper emPCR without the need to perform the previous emPCR titration step and so, a large part of the
129
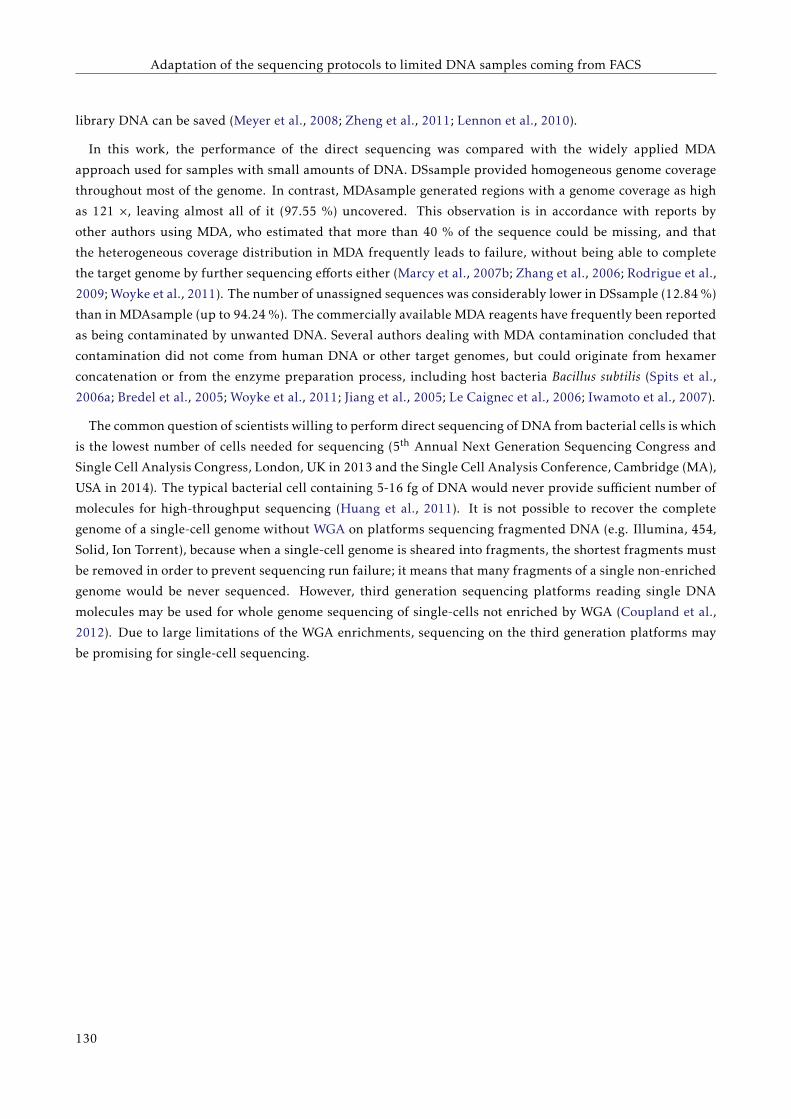
Adaptation of the sequencing protocols to limited DNA samples coming from FACS
library DNA can be saved (Meyer et al., 2008; Zheng et al., 2011; Lennon et al., 2010).
In this work, the performance of the direct sequencing was compared with the widely applied MDA
approach used for samples with small amounts of DNA. DSsample provided homogeneous genome coverage
throughout most of the genome. In contrast, MDAsample generated regions with a genome coverage as high
as 121 ×, leaving almost all of it (97.55 %) uncovered. This observation is in accordance with reports by
other authors using MDA, who estimated that more than 40 % of the sequence could be missing, and that
the heterogeneous coverage distribution in MDA frequently leads to failure, without being able to complete
the target genome by further sequencing efforts either (Marcy et al., 2007b; Zhang et al., 2006; Rodrigue et al.,
2009; Woyke et al., 2011). The number of unassigned sequences was considerably lower in DSsample (12.84 %)
than in MDAsample (up to 94.24 %). The commercially available MDA reagents have frequently been reported
as being contaminated by unwanted DNA. Several authors dealing with MDA contamination concluded that
contamination did not come from human DNA or other target genomes, but could originate from hexamer
concatenation or from the enzyme preparation process, including host bacteria Bacillus subtilis (Spits et al.,
2006a; Bredel et al., 2005; Woyke et al., 2011; Jiang et al., 2005; Le Caignec et al., 2006; Iwamoto et al., 2007).
The common question of scientists willing to perform direct sequencing of DNA from bacterial cells is which
is the lowest number of cells needed for sequencing (5th Annual Next Generation Sequencing Congress and
Single Cell Analysis Congress, London, UK in 2013 and the Single Cell Analysis Conference, Cambridge (MA),
USA in 2014). The typical bacterial cell containing 5-16 fg of DNA would never provide sufficient number of
molecules for high-throughput sequencing (Huang et al., 2011). It is not possible to recover the complete
genome of a single-cell genome without WGA on platforms sequencing fragmented DNA (e.g. Illumina, 454,
Solid, Ion Torrent), because when a single-cell genome is sheared into fragments, the shortest fragments must
be removed in order to prevent sequencing run failure; it means that many fragments of a single non-enriched
genome would be never sequenced. However, third generation sequencing platforms reading single DNA
molecules may be used for whole genome sequencing of single-cells not enriched by WGA (Coupland et al.,
2012). Due to large limitations of the WGA enrichments, sequencing on the third generation platforms may
be promising for single-cell sequencing.
130
Adaptation of the sequencing protocols to limited DNA samples coming from FACS
6.6 ConclusionsIn this work the direct sequencing method was used on the 454 Titanium platform starting from the minimal
amounts of input DNA without previous whole genome amplification. This approach could replace MDA in
many genome sequencing projects, even in studying previously uncharacterized organisms. Direct sequencing
provides unbiased, reliable and reproducible genetic information from any sample with a minimum amount
of starting material. In contrast to MDA, which is widely applied to projects dealing with limited amounts
of DNA, direct sequencing provides a homogeneous distribution of reads mapped to a reference genome,
avoiding low efficiency, chimera formation and amplification problems previously described in MDA.
Direct sequencing is a candidate to replace MDA in most projects in which cells obtained by FACS are
sequenced. The direct sequencing method reported in this work is estimated to lower the cost of library
preparation and to yield the maximum genetic information while simultaneously reducing sequencing efforts.
131

Chapter7Viral metagenomics directed by flow
cytometry
Associated original articles:
Džunková, M., D’Auria, G., Moya, A. (2015) Direct sequencing of human gut virome fractions obtained by
flow cytometry. Frontiers in Microbiology 6: 955
MD and GD contributed equally to the work

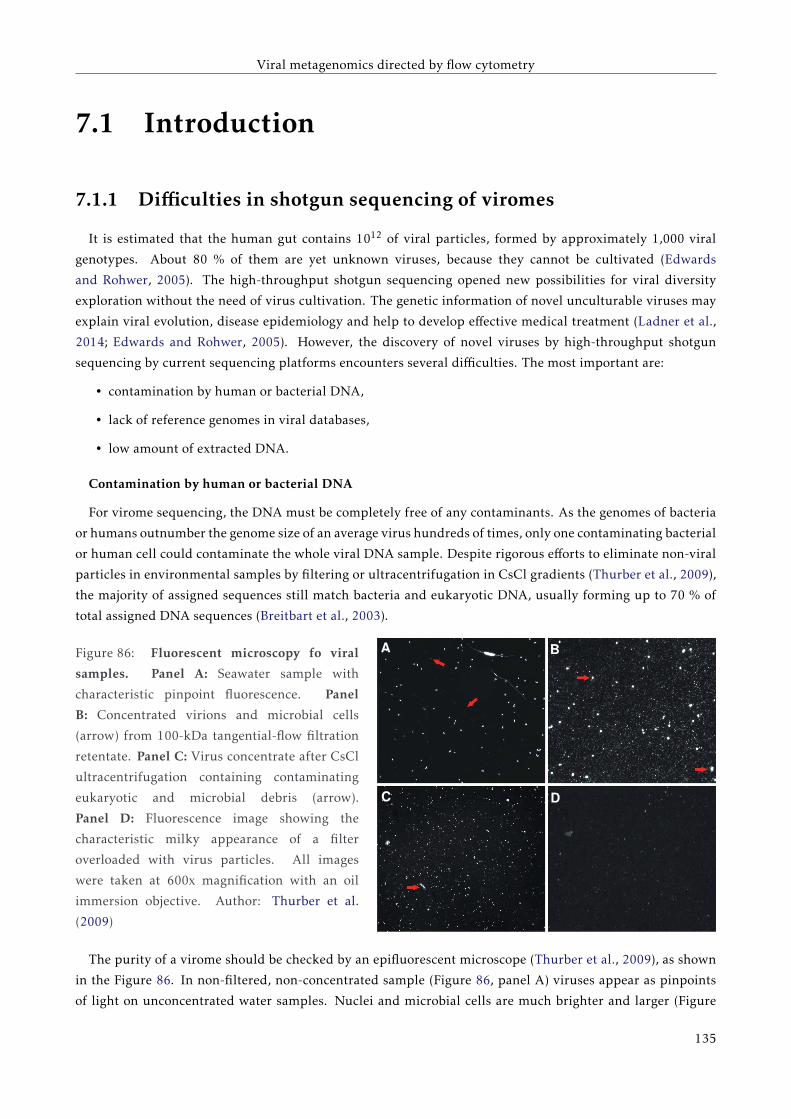
Viral metagenomics directed by flow cytometry
7.1 Introduction
7.1.1 Difficulties in shotgun sequencing of viromes
It is estimated that the human gut contains 1012 of viral particles, formed by approximately 1,000 viral
genotypes. About 80 % of them are yet unknown viruses, because they cannot be cultivated (Edwards
and Rohwer, 2005). The high-throughput shotgun sequencing opened new possibilities for viral diversity
exploration without the need of virus cultivation. The genetic information of novel unculturable viruses may
explain viral evolution, disease epidemiology and help to develop effective medical treatment (Ladner et al.,
2014; Edwards and Rohwer, 2005). However, the discovery of novel viruses by high-throughput shotgun
sequencing by current sequencing platforms encounters several difficulties. The most important are:
• contamination by human or bacterial DNA,
• lack of reference genomes in viral databases,
• low amount of extracted DNA.
Contamination by human or bacterial DNA
For virome sequencing, the DNA must be completely free of any contaminants. As the genomes of bacteria
or humans outnumber the genome size of an average virus hundreds of times, only one contaminating bacterial
or human cell could contaminate the whole viral DNA sample. Despite rigorous efforts to eliminate non-viral
particles in environmental samples by filtering or ultracentrifugation in CsCl gradients (Thurber et al., 2009),
the majority of assigned sequences still match bacteria and eukaryotic DNA, usually forming up to 70 % of
total assigned DNA sequences (Breitbart et al., 2003).
Figure 86: Fluorescent microscopy fo viral
samples. Panel A: Seawater sample with
characteristic pinpoint fluorescence. Panel
B: Concentrated virions and microbial cells
(arrow) from 100-kDa tangential-flow filtration
retentate. Panel C: Virus concentrate after CsCl
ultracentrifugation containing contaminating
eukaryotic and microbial debris (arrow).
Panel D: Fluorescence image showing the
characteristic milky appearance of a filter
overloaded with virus particles. All images
were taken at 600x magnification with an oil
immersion objective. Author: Thurber et al.
(2009)
A B
C D
The purity of a virome should be checked by an epifluorescent microscope (Thurber et al., 2009), as shown
in the Figure 86. In non-filtered, non-concentrated sample (Figure 86, panel A) viruses appear as pinpoints
of light on unconcentrated water samples. Nuclei and microbial cells are much brighter and larger (Figure
135
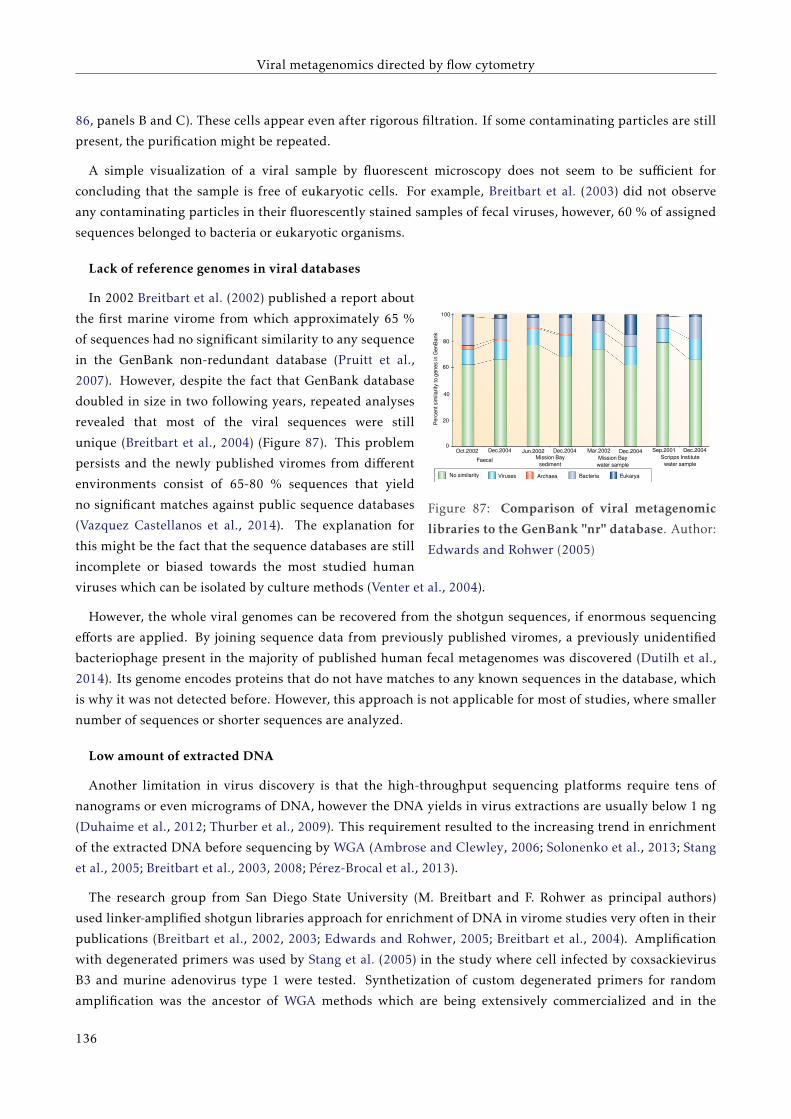
Viral metagenomics directed by flow cytometry
86, panels B and C). These cells appear even after rigorous filtration. If some contaminating particles are still
present, the purification might be repeated.
A simple visualization of a viral sample by fluorescent microscopy does not seem to be sufficient for
concluding that the sample is free of eukaryotic cells. For example, Breitbart et al. (2003) did not observe
any contaminating particles in their fluorescently stained samples of fecal viruses, however, 60 % of assigned
sequences belonged to bacteria or eukaryotic organisms.
Lack of reference genomes in viral databases
Per
cent
sim
ilari
ty to
gen
es in
Gen
Ban
k
100
80
60
40
20
0
No similarity Viruses Archaea Bacteria Eukarya
Oct.2002 Dec.2004 Jun.2002 Dec.2004 Mar.2002 Dec.2004 Sep.2001 Dec.2004
Faecal Mission Baysediment
Mission Baywater sample
Scripps Institutewater sample
Figure 87: Comparison of viral metagenomic
libraries to the GenBank "nr" database. Author:
Edwards and Rohwer (2005)
In 2002 Breitbart et al. (2002) published a report about
the first marine virome from which approximately 65 %
of sequences had no significant similarity to any sequence
in the GenBank non-redundant database (Pruitt et al.,
2007). However, despite the fact that GenBank database
doubled in size in two following years, repeated analyses
revealed that most of the viral sequences were still
unique (Breitbart et al., 2004) (Figure 87). This problem
persists and the newly published viromes from different
environments consist of 65-80 % sequences that yield
no significant matches against public sequence databases
(Vazquez Castellanos et al., 2014). The explanation for
this might be the fact that the sequence databases are still
incomplete or biased towards the most studied human
viruses which can be isolated by culture methods (Venter et al., 2004).
However, the whole viral genomes can be recovered from the shotgun sequences, if enormous sequencing
efforts are applied. By joining sequence data from previously published viromes, a previously unidentified
bacteriophage present in the majority of published human fecal metagenomes was discovered (Dutilh et al.,
2014). Its genome encodes proteins that do not have matches to any known sequences in the database, which
is why it was not detected before. However, this approach is not applicable for most of studies, where smaller
number of sequences or shorter sequences are analyzed.
Low amount of extracted DNA
Another limitation in virus discovery is that the high-throughput sequencing platforms require tens of
nanograms or even micrograms of DNA, however the DNA yields in virus extractions are usually below 1 ng
(Duhaime et al., 2012; Thurber et al., 2009). This requirement resulted to the increasing trend in enrichment
of the extracted DNA before sequencing by WGA (Ambrose and Clewley, 2006; Solonenko et al., 2013; Stang
et al., 2005; Breitbart et al., 2003, 2008; Pérez-Brocal et al., 2013).
The research group from San Diego State University (M. Breitbart and F. Rohwer as principal authors)
used linker-amplified shotgun libraries approach for enrichment of DNA in virome studies very often in their
publications (Breitbart et al., 2002, 2003; Edwards and Rohwer, 2005; Breitbart et al., 2004). Amplification
with degenerated primers was used by Stang et al. (2005) in the study where cell infected by coxsackievirus
B3 and murine adenovirus type 1 were tested. Synthetization of custom degenerated primers for random
amplification was the ancestor of WGA methods which are being extensively commercialized and in the
136
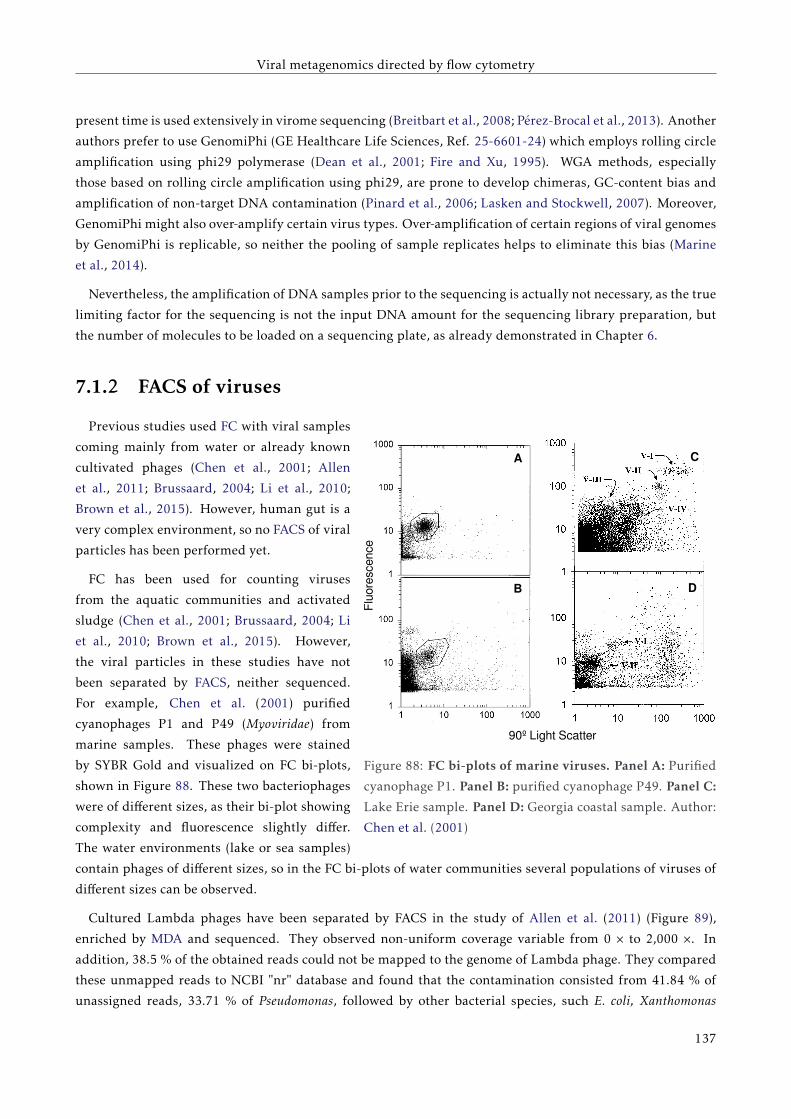
Viral metagenomics directed by flow cytometry
present time is used extensively in virome sequencing (Breitbart et al., 2008; Pérez-Brocal et al., 2013). Another
authors prefer to use GenomiPhi (GE Healthcare Life Sciences, Ref. 25-6601-24) which employs rolling circle
amplification using phi29 polymerase (Dean et al., 2001; Fire and Xu, 1995). WGA methods, especially
those based on rolling circle amplification using phi29, are prone to develop chimeras, GC-content bias and
amplification of non-target DNA contamination (Pinard et al., 2006; Lasken and Stockwell, 2007). Moreover,
GenomiPhi might also over-amplify certain virus types. Over-amplification of certain regions of viral genomes
by GenomiPhi is replicable, so neither the pooling of sample replicates helps to eliminate this bias (Marine
et al., 2014).
Nevertheless, the amplification of DNA samples prior to the sequencing is actually not necessary, as the true
limiting factor for the sequencing is not the input DNA amount for the sequencing library preparation, but
the number of molecules to be loaded on a sequencing plate, as already demonstrated in Chapter 6.
7.1.2 FACS of virusesF
luor
esce
nce
90º Light Scatter
A
B
C
D
Figure 88: FC bi-plots of marine viruses. Panel A: Purified
cyanophage P1. Panel B: purified cyanophage P49. Panel C:
Lake Erie sample. Panel D: Georgia coastal sample. Author:
Chen et al. (2001)
Previous studies used FC with viral samples
coming mainly from water or already known
cultivated phages (Chen et al., 2001; Allen
et al., 2011; Brussaard, 2004; Li et al., 2010;
Brown et al., 2015). However, human gut is a
very complex environment, so no FACS of viral
particles has been performed yet.
FC has been used for counting viruses
from the aquatic communities and activated
sludge (Chen et al., 2001; Brussaard, 2004; Li
et al., 2010; Brown et al., 2015). However,
the viral particles in these studies have not
been separated by FACS, neither sequenced.
For example, Chen et al. (2001) purified
cyanophages P1 and P49 (Myoviridae) from
marine samples. These phages were stained
by SYBR Gold and visualized on FC bi-plots,
shown in Figure 88. These two bacteriophages
were of different sizes, as their bi-plot showing
complexity and fluorescence slightly differ.
The water environments (lake or sea samples)
contain phages of different sizes, so in the FC bi-plots of water communities several populations of viruses of
different sizes can be observed.
Cultured Lambda phages have been separated by FACS in the study of Allen et al. (2011) (Figure 89),
enriched by MDA and sequenced. They observed non-uniform coverage variable from 0 × to 2,000 ×. In
addition, 38.5 % of the obtained reads could not be mapped to the genome of Lambda phage. They compared
these unmapped reads to NCBI "nr" database and found that the contamination consisted from 41.84 % of
unassigned reads, 33.71 % of Pseudomonas, followed by other bacterial species, such E. coli, Xanthomonas
137
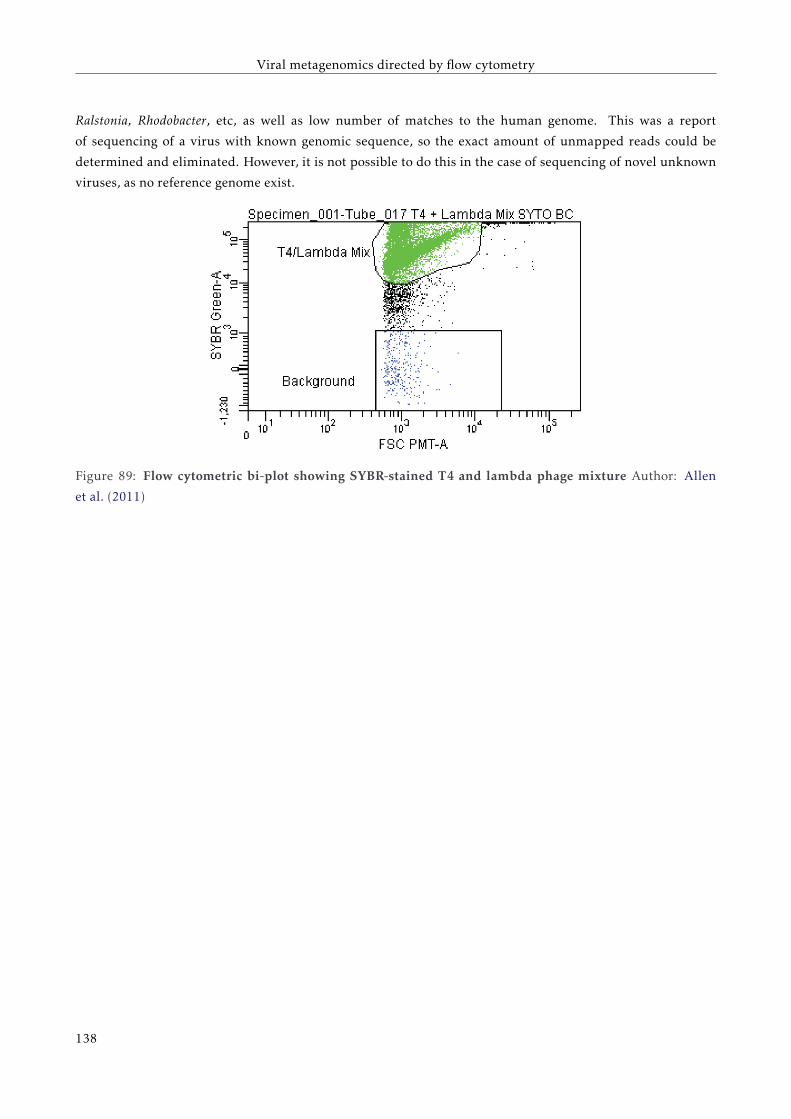
Viral metagenomics directed by flow cytometry
Ralstonia, Rhodobacter, etc, as well as low number of matches to the human genome. This was a report
of sequencing of a virus with known genomic sequence, so the exact amount of unmapped reads could be
determined and eliminated. However, it is not possible to do this in the case of sequencing of novel unknown
viruses, as no reference genome exist.
Figure 89: Flow cytometric bi-plot showing SYBR-stained T4 and lambda phage mixture Author: Allen
et al. (2011)
138
Viral metagenomics directed by flow cytometry
7.2 ObjectivesIt is estimated that the human gut contain a large number of yet unknown viruses. Due to the lack of
reference genomes in the databases and difficulties in sequencing of low DNA content samples, the sequence-
based description of novel viruses from the human gut remains difficult.
The objective of the work is to approach the human gut virome by the use of a FC-based approach avoiding
any WGA method. Moreover, in this chapter we propose a method for enhancing virome sequence assembly
improving the viral sample preparation before sequencing. It is hypothesized that the viral metagenomes can
be assembled more efficiently, if the virome samples is purified more deeply, thus human mitochondria and
bacterial cells may be eliminated. Therefore, FACS was employed for more precise detection of viral particles.
The DNA will be extracted directly from separated viral samples containing few hundreds of particles. We
overcome the DNA limitations obviously encountered when working with low amounts of DNA applying the
protocol developed in the previous Chapter 6.
This work represents the first attempt to apply FACS for sorting of viral particles from such an extremely
complex environment, as human fecal samples.
139
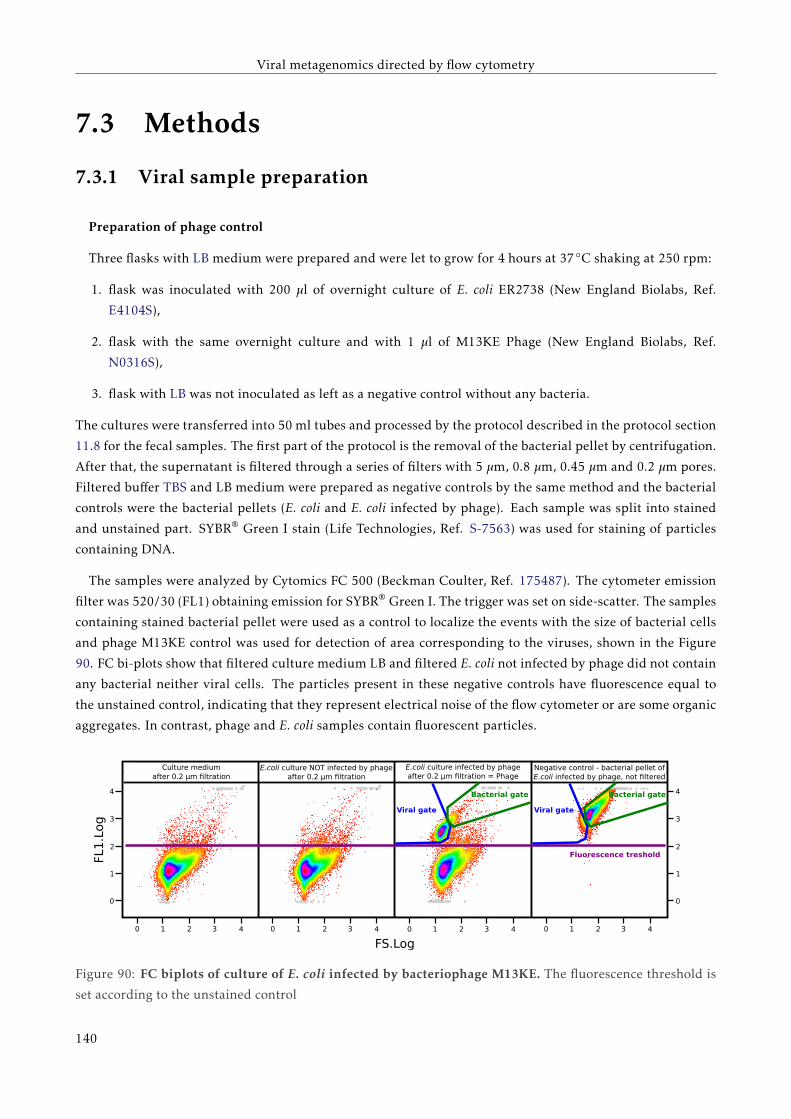
Viral metagenomics directed by flow cytometry
7.3 Methods
7.3.1 Viral sample preparation
Preparation of phage control
Three flasks with LB medium were prepared and were let to grow for 4 hours at 37◦C shaking at 250 rpm:
1. flask was inoculated with 200 µl of overnight culture of E. coli ER2738 (New England Biolabs, Ref.
E4104S),
2. flask with the same overnight culture and with 1 µl of M13KE Phage (New England Biolabs, Ref.
N0316S),
3. flask with LB was not inoculated as left as a negative control without any bacteria.
The cultures were transferred into 50 ml tubes and processed by the protocol described in the protocol section
11.8 for the fecal samples. The first part of the protocol is the removal of the bacterial pellet by centrifugation.
After that, the supernatant is filtered through a series of filters with 5 µm, 0.8 µm, 0.45 µm and 0.2 µm pores.
Filtered buffer TBS and LB medium were prepared as negative controls by the same method and the bacterial
controls were the bacterial pellets (E. coli and E. coli infected by phage). Each sample was split into stained
and unstained part. SYBR® Green I stain (Life Technologies, Ref. S-7563) was used for staining of particles
containing DNA.
The samples were analyzed by Cytomics FC 500 (Beckman Coulter, Ref. 175487). The cytometer emission
filter was 520/30 (FL1) obtaining emission for SYBR® Green I. The trigger was set on side-scatter. The samples
containing stained bacterial pellet were used as a control to localize the events with the size of bacterial cells
and phage M13KE control was used for detection of area corresponding to the viruses, shown in the Figure
90. FC bi-plots show that filtered culture medium LB and filtered E. coli not infected by phage did not contain
any bacterial neither viral cells. The particles present in these negative controls have fluorescence equal to
the unstained control, indicating that they represent electrical noise of the flow cytometer or are some organic
aggregates. In contrast, phage and E. coli samples contain fluorescent particles.
forward scatter
4 0 1 2 3 4 0 1 2 3 4 0 1 2 3 4
pellet non-stained Infected E. coli pellet stained Phage non-stained Phage stained
E. coli pellet
filtered non-stained LB filtered stained E. coli filtered non-stained E. coli filtered stained E. coli pellet non-stained
Infected E. coli pellet non-stained Infected E. coli pellet stained Phage non-stained Phage stained
E. coli filtered non-stained E. coli filtered stained E. coli pellet non-stained
pellet non-stained Infected E. coli pellet stained Phage non-stained Phage stained
0
1
2
3
4
4
LB filtered non-stained LB filtered stained E. coli filtered non-stained E. coli filtered stained E. coli
E. coli pellet stained Infected E. coli pellet non-stained Infected E. coli pellet stained Phage non-stained
forward scatter
fluor
esce
nce
0
1
2
3
4
0 1 2 3 4 0 1 2 3 4 0 1 2 3 4 0
E. coli pellet stained Infected E. coli pellet non-stained Infected E. coli pellet stained
Phage gate Infrected/non-infected E. coli pellet
0 1 2 3 40 1 2 3 4 0 1 2 3 4 0 1 2 3 4
4
3
2
1
0
4
3
2
1
0
Culture medium after 0.2 µm filtration
E.coli culture NOT infected by phageafter 0.2 µm filtration
E.coli culture infected by phageafter 0.2 µm filtration = Phage
Negative control - bacterial pellet of E.coli infected by phage, not filtered
Fluorescence treshold
Bacterial gate
Viral gate
Bacterial gate
Viral gate
FL1
.Log
FS.Log
Figure 90: FC biplots of culture of E. coli infected by bacteriophage M13KE. The fluorescence threshold is
set according to the unstained control
140
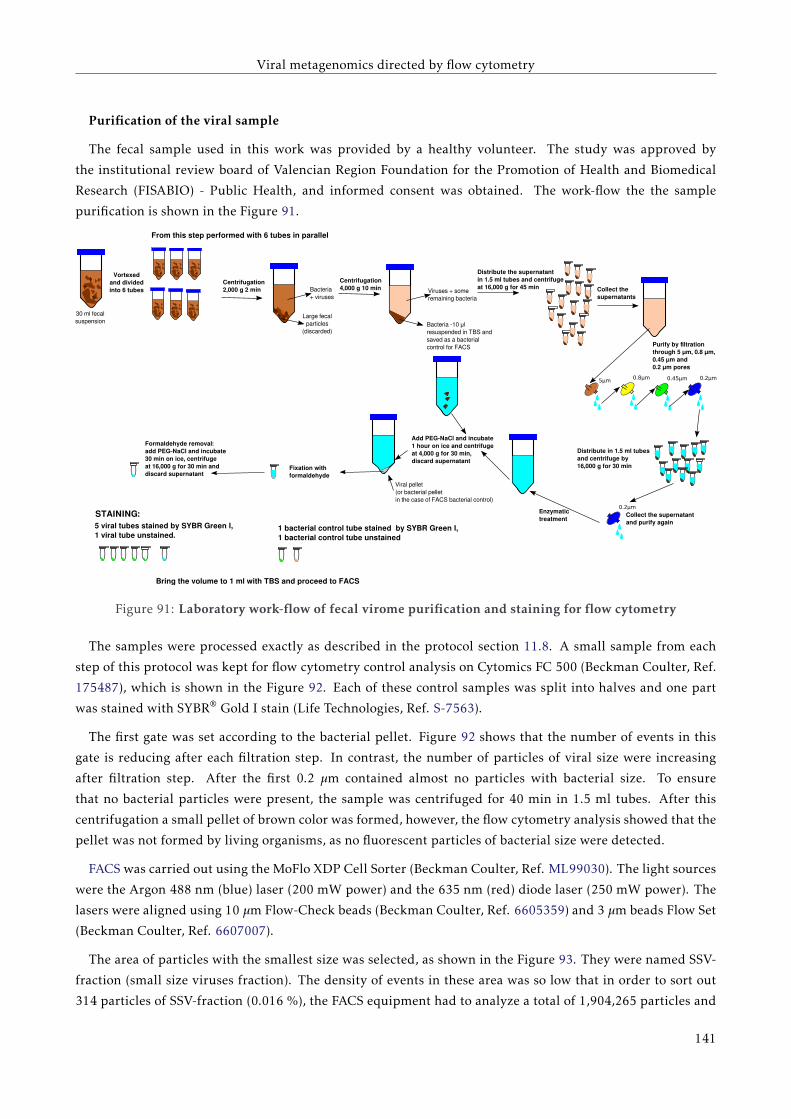
Viral metagenomics directed by flow cytometry
Purification of the viral sample
The fecal sample used in this work was provided by a healthy volunteer. The study was approved by
the institutional review board of Valencian Region Foundation for the Promotion of Health and Biomedical
Research (FISABIO) - Public Health, and informed consent was obtained. The work-flow the the sample
purification is shown in the Figure 91.
30 ml fecal suspension
Centrifugation2,000 g 2 min
Large fecal particles
(discarded)
Bacteria+ viruses
Centrifugation4,000 g 10 min Viruses + some
remaining bacteria
Bacteria -10 μlresuspended in TBS and saved as a bacterialcontrol for FACS
From this step performed with 6 tubes in parallel
Vortexed and divided into 6 tubes
Distribute the supernatant in 1.5 ml tubes and centrifuge at 16,000 g for 45 min Collect the
supernatants
Purify by filtrationthrough 5 μm, 0.8 μm, 0.45 μm and 0.2 μm pores
5µm 0.8µm 0.45µm 0.2µm
Distribute in 1.5 ml tubes and centrifuge by 16,000 g for 30 min
0.2µm
Collect the supernatant and purify again
Enzymatic treatment
Add PEG-NaCl and incubate 1 hour on ice and centrifuge at 4,000 g for 30 min,discard supernatant
Viral pellet(or bacterial pellet in the case of FACS bacterial control)
Fixation with formaldehyde
Formaldehyde removal: add PEG-NaCl and incubate 30 min on ice, centrifuge at 16,000 g for 30 min and discard supernatant
5 viral tubes stained by SYBR Green I, 1 viral tube unstained.
1 bacterial control tube stained by SYBR Green I,1 bacterial control tube unstained
Bring the volume to 1 ml with TBS and proceed to FACS
STAINING:
Figure 91: Laboratory work-flow of fecal virome purification and staining for flow cytometry
The samples were processed exactly as described in the protocol section 11.8. A small sample from each
step of this protocol was kept for flow cytometry control analysis on Cytomics FC 500 (Beckman Coulter, Ref.
175487), which is shown in the Figure 92. Each of these control samples was split into halves and one part
was stained with SYBR® Gold I stain (Life Technologies, Ref. S-7563).
The first gate was set according to the bacterial pellet. Figure 92 shows that the number of events in this
gate is reducing after each filtration step. In contrast, the number of particles of viral size were increasing
after filtration step. After the first 0.2 µm contained almost no particles with bacterial size. To ensure
that no bacterial particles were present, the sample was centrifuged for 40 min in 1.5 ml tubes. After this
centrifugation a small pellet of brown color was formed, however, the flow cytometry analysis showed that the
pellet was not formed by living organisms, as no fluorescent particles of bacterial size were detected.
FACS was carried out using the MoFlo XDP Cell Sorter (Beckman Coulter, Ref. ML99030). The light sources
were the Argon 488 nm (blue) laser (200 mW power) and the 635 nm (red) diode laser (250 mW power). The
lasers were aligned using 10 µm Flow-Check beads (Beckman Coulter, Ref. 6605359) and 3 µm beads Flow Set
(Beckman Coulter, Ref. 6607007).
The area of particles with the smallest size was selected, as shown in the Figure 93. They were named SSV-
fraction (small size viruses fraction). The density of events in these area was so low that in order to sort out
314 particles of SSV-fraction (0.016 %), the FACS equipment had to analyze a total of 1,904,265 particles and
141

Viral metagenomics directed by flow cytometry
the duration of the sorting was 8 hours. The cells were sorted into autoclaved LoBind 1.5 ml tubes (Eppendorf,
Ref. 0030 108.051).
0
1
2
3
4
2 3 4
FS.Log
FL1.Lo
g
0
1
2
3
4
0 1 2 3 4 0 1 2 3 4 0 1 2 3 4
after 1st
ugationPelet after 2nd
centrifugation
5µm
After 5 µmfiltration
0.8µm
After 0.8 µmfiltration
Pelet 30 mincentrifugation
0.45µm
After 0.45 µmfiltration
0.2µm
After first0.2 µm filtration
0.2µm
After second0.2 µm filtration
Pelet after 3rd
centrifugation
Before 5 µmfiltration
The most populated area of the stained sample "After second 0.2 µm filtration" The most populated area of the stained sample "Pelet after 1st centrifugation"
The most populated area of the non-stained sample "After second 0.2 µm filtration" The most populated area of the non-stained sample "Pelet after 1st centrifugation"
0 1 2 3 40 1 2 3 40 1 2 3 40 1 2 3 40 1 2 3 40 1 2 3 40 1 2 3 42 3 4
0 1 2 3 4 0 1 2 3 4 0 1 2 3 4 0 1 2 3 4 0 1 2 3 4 0 1 2 3 4 0 1 2 3 4 0 1 2 3 4 0 1 2 3 4 0 1 2 3 4
0
1
2
3
4
0 1 2 3 4
FS.Log
0
1
2
3
4
0 1 2 3 4 0 1 2 3 4 0 1 2
Pelet after 1st centrifugation Pelet after 2nd centrifugation Pelet after 3rd centrifugation Before 5 µm filtration After 5 µm filtration After 0.8 µm filtration After 0.45 µm filtration After first 0.2 µm filtration Pelet 30 min centrifugation After second 0.2 µm filtration TBS
Sta
ined
Not
sta
ined
Pelet after 1st
centrifugationPelet after 2nd
centrifugation
5µm
After 5 µmfiltration
0.8µm
After 0.8 µmfiltration
Pelet 30 mincentrifugation
0.45µm
After 0.45 µmfiltration
0.2µm
After first0.2 µm filtration
0.2µm
After second0.2 µm filtration
Pelet after 3rd
centrifugation
Before 5 µmfiltration
The most populated area of the stained sample "After second 0.2 µm filtration" The most populated area of the stained sample "Pelet after 1st centrifugation"
The most populated area of the non-stained sample "After second 0.2 µm filtration" The most populated area of the non-stained sample "Pelet after 1st centrifugatio
0 1 2 3 40 1 2 3 40 1 2 3 40 1 2 3 40 1 2 3 40 1 2 3 40 1 2 3 40 1 2 3 4
0 1 2 3 4 0 1 2 3 4 0 1 2 3 4 0 1 2 3 4 0 1 2 3 4 0 1 2 3 4 0 1 2 3 4 0 1 2 3 4 0 1 2 3 4 0 1 2
5µm
After 5 µmfiltration
0.8µm 0.45µm 0.2µm 0.2µm
Pellet afterbacterial centrifugation
in 50 ml tubes
Pellet afterbacterial centrifugation
in 1.5 ml tubes
Supernatant afterbacterial centrifugation
in 1.5 ml tubes
After 0.8 µmfiltration
After 0.45 µmfiltration
After first0.2 µm filtration
Pellet 30 mincentrifugation
After second0.2 µm filtration
FS.Log
Pellet 1st centrifugation Pellet 2nd centrifugation Supernatant 2nd centrifugation Filtrate 5 µm Filtrate 0.8 µm Filtrate 0.45 µm First filtrate 0.2 µm Pellet control centrifugation Second filtrate 0.2 µm Buffer TBS
Pellet 1st centrifugation Pellet 2nd centrifugation Supernatant 2nd centrifugation Filtrate 5 µm Filtrate 0.8 µm Filtrate 0.45 µm First filtrate 0.2 µm Pellet control centrifugation Second filtrate 0.2 µm Buffer TBS
The most populated area of the stained sample "Pellet 1st centrifugation"
The most populated area of the non-stained sample "Pellet 1st centrifugation"
The most populated area of the stained sample "Second filtrate 0.2 µm"
The most populated area of the non-stained sample "Second filtrate 0.2 µm"
Figure 92: FC biplots of each of step of virus purification protocol
Virus not stained Bacteria not stained Bacteria stained Virus stained
FL
1.L
og
FS.Log FS.Log FS.Log FS.Log
0
1
2
3
4
0 1 2 3 4 0 1 2 3 4 0 1 2 3 4 0 1 2 3 4
stained Bacteria stained Virus stained Virus stained - sorting
FL
1.Lo
g
g FS.Log FS.Log FS.Log
0
1
2
3
4
3 4 0 1 2 3 4 0 1 2 3 4 0 1 2 3 4
Fluorescence treshold
Viral gate Viral gate Viral gate
Bacterial gate
Bacterial gate
Bacterial gate
FS.Log
SSV-fraction
Figure 93: FACS of the fecal sample. The area of particles of the smallest size (SSV-fraction) was selected for
the sorting
DNA extraction and sequencing
DNA was extracted according to the protocol by Ausubel et al. (Ausubel et al., 1992) in sterile conditions
as described in the protocol section 11.5. For the shotgun library preparation, the standard protocol of the
manufacturer (Roche Applied Science) was replaced by the optimized protocol for limited DNA samples
described in the protocol section 11.12 and explained in more details in Chapter 6. Shortly, the DNA was
142
Viral metagenomics directed by flow cytometry
fragmented by sonicator, DNA fragments shorter than 300 bp were removed by Agencourt AMPure Beads
XP®(Beckman Coulter, Ref. A63880) and to the size-selected DNA fragments custom 454 adaptors were
ligated. The remaining adaptors were removed by repeated purification by Agencourt AMPure Beads XP®.
The adaptor Y5 adaptor was used for SSV-fraction library construction. The exact number of molecules present
in the 454 shotgun library concentration was determined by qPCR by probes specific for custom "Y" 454 library
adaptors, as described by Zheng et al. (2011), shown in details in the protocol section 11.10. The maximal Cp
corresponding to the minimal concentration of a library was calculated to be 24.59 (Chapter 6). However,
the Cp of the SSV-fraction library was 28.15, meaning that it contained 11,79 × less DNA (28.15 - 24.56 =
3.56; 23.56 = 11.79). Therefore, it was amplified by a PCR with low number of cycles and the resulting Cp
decreased to 23.79, meaning that the library concentration increased and it was 1.7 × higher than the minimal
concentration required for sequencing on 1/8 of a 454 PTP region. The emPCR and sequencing with GS FLX
Titanium Sequencing XLR70 Kit (Roche Applied Science, Ref. 05233526001) were performed by the standard
protocols on 1/8 of the 454 PTP.
7.3.2 Data analysis
Sequence processing
The sequences were filtered and trimmed by quality and adaptors were removed by Roche’s SFFINFO tool,
permitting 3 errors, as shown in the programming section 12.3. Afterwards, the sequences were double-
checked for the presence of Y adaptors in the 3’ with Biostrings v.2.11 package (Pages et al., 2014) for R
programming language (R Development Core Team, 2008), as also adaptors self-ligated dimers might have
been sequenced, too. Low complexity reads (entropy < 70), low quality reads (< 25), short reads (< 50bp) and
erroneous reads (> 5 % N bases) were removed using PRINSEQ (Schmieder and Edwards, 2011), shown in
details in the programming script section 12.6.
Sequences were deposited in EMBL-EBI Sequence Read Archive (SRA) with study number PRJEB7515.
Sequences were assembled with MIRA3 (Chevreux et al., 1999) using de-novo genome accurate 454 settings,
permitting to assemble as few as 2 reads per contig. The exact command for MIRA assembly was:
1 $ mira --project=virusl --job=denovo, genome, accurate, 454 454_SETTINGS -LR:ft=fasta -
AS:mrpc=2 --notraceinfo
Sequence annotation
The overview of the bioinformatic analysis performed in this work is shown in the Figure 94. The ORFs
(open reading frames) in the larger contigs (>1000 bp) were identified by Glimmer3 (Delcher et al., 1999) by
a script written in Perl programming language. The sequences were annotated by InterProScan online search
using all available approaches (Quevillon et al., 2005): BlastProDom, Coil, FPrintScan, Gene3D, HAMAP,
HMMPanther, HMMPfam, HMMPIR, HMMSmart, HMMTigr, PatternScan and ProfileScan, Seg, SignalPHMM,
Superfamily, TMHMM. InterPro combines individual strengths of these different annotation sources and
provides comprehensive information about protein families, domains and functional sites. The annotation was
performed online using script "iprscan_lwp.pl" available from InterPro website. The maps of ORFs detected in
143
Viral metagenomics directed by flow cytometry
contigs was constructed using genoPlotR (Guy et al., 2010) package in R programming language (an example
is shown in programming script section 12.8).
Sequence analysis
Sequencing adaptor trimming, removal of low quality reads
Sequence assembly with MIRA
Long contigs Short contigs, unassembled reads
Detection of ORFs
InterProScan database
blastx to "nr"
databaseACLAME database
blastn to "nr"
database
PhiSite database
Figure 94: Workflow diagrams of the data analysis
In addition, the larger contigs (>1,000
bp) were annotated using "blastx" algorithm
against "nr" database (Altschul et al., 1990).
To decide if a sequence can be classified as
virus/phage by "blastx", an approach already
used by Law et al. (2013) was used. According
to Law et al. (2013), to decide if a sequence
belongs to a virus, 100 best matches must be
revised. In addition, the same contigs were
analyzed by searching in ACLAME database of
mobile elements (Leplae et al., 2004).
Contigs shorter than 1,000 bp and
unassembled reads were annotated by "blastn"
to "nr" database using megablast algorithm
(Altschul et al., 1990). The taxonomy of the
best GI matches were retrieved by a script
written in the R programming language using
"ape" package (Paradis et al., 2004), as shown below:
1 library("ape")
2 blast <- read.table(file="list-of-GI.txt")
3 result<-apply(blast, MARGIN=1, FUN=function (x) attr(read.GenBank(x), "species"))
4 write.table (result, file="result.txt", sep="\t", quote=F)
The short contigs and the unassembled reads were also compared to the phiSITE database containing only
viral genomes (Klucar et al., 2010).
144
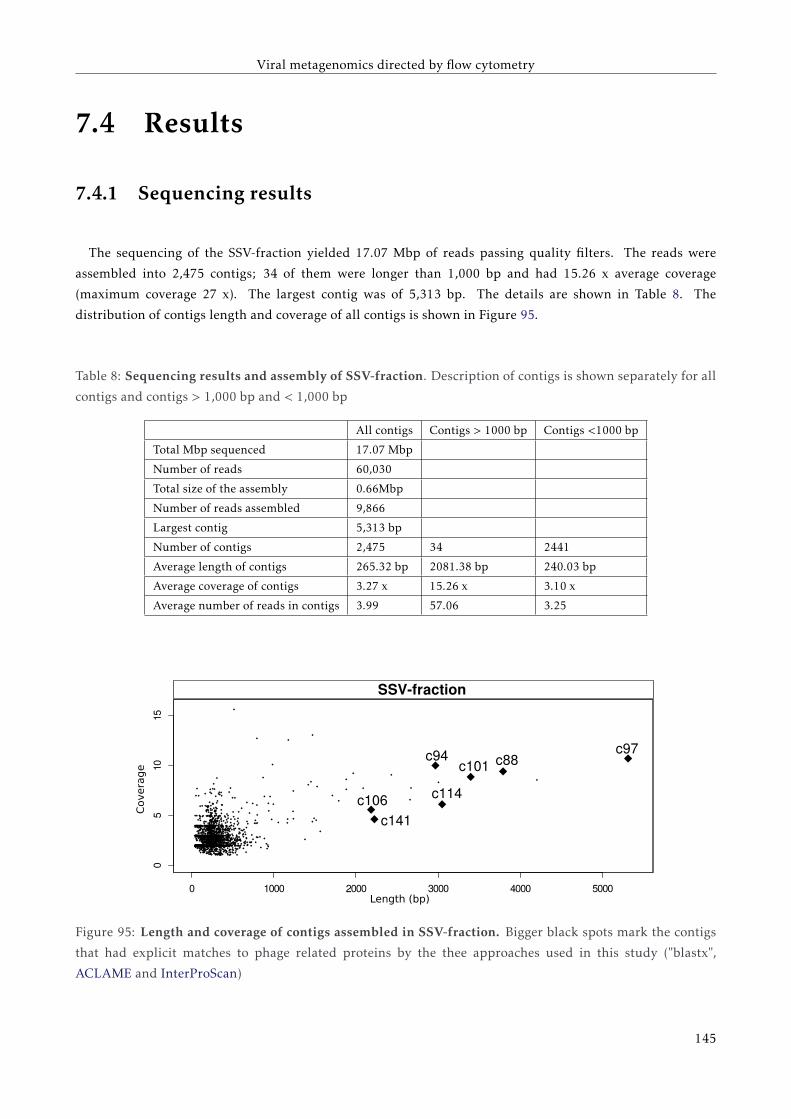
Viral metagenomics directed by flow cytometry
7.4 Results
7.4.1 Sequencing results
The sequencing of the SSV-fraction yielded 17.07 Mbp of reads passing quality filters. The reads were
assembled into 2,475 contigs; 34 of them were longer than 1,000 bp and had 15.26 x average coverage
(maximum coverage 27 x). The largest contig was of 5,313 bp. The details are shown in Table 8. The
distribution of contigs length and coverage of all contigs is shown in Figure 95.
Table 8: Sequencing results and assembly of SSV-fraction. Description of contigs is shown separately for all
contigs and contigs > 1,000 bp and < 1,000 bp
All contigs Contigs > 1000 bp Contigs <1000 bp
Total Mbp sequenced 17.07 Mbp
Number of reads 60,030
Total size of the assembly 0.66Mbp
Number of reads assembled 9,866
Largest contig 5,313 bp
Number of contigs 2,475 34 2441
Average length of contigs 265.32 bp 2081.38 bp 240.03 bp
Average coverage of contigs 3.27 x 15.26 x 3.10 x
Average number of reads in contigs 3.99 57.06 3.25
05
1015
0 1000 2000 3000 4000 5000
SSV-fraction
c97 c88 c101
c114
c94
c141
c106
Covera
ge
Length (bp)
Figure 95: Length and coverage of contigs assembled in SSV-fraction. Bigger black spots mark the contigs
that had explicit matches to phage related proteins by the thee approaches used in this study ("blastx",
ACLAME and InterProScan)
145
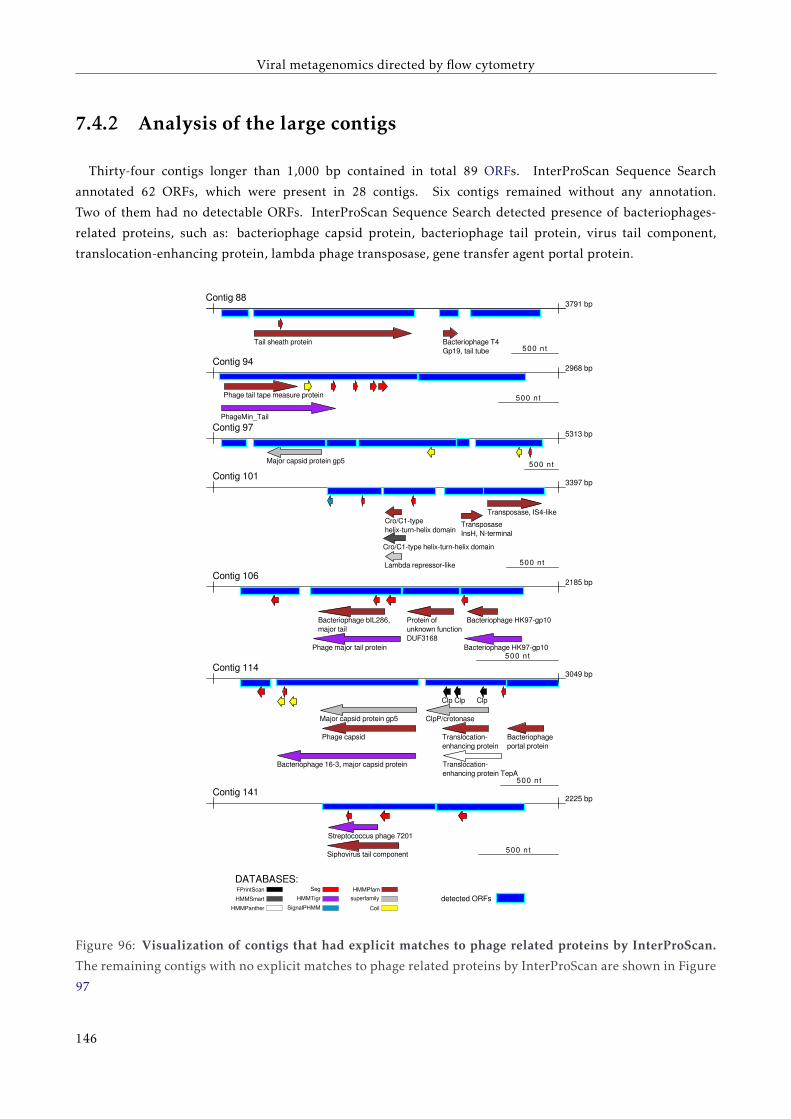
Viral metagenomics directed by flow cytometry
7.4.2 Analysis of the large contigs
Thirty-four contigs longer than 1,000 bp contained in total 89 ORFs. InterProScan Sequence Search
annotated 62 ORFs, which were present in 28 contigs. Six contigs remained without any annotation.
Two of them had no detectable ORFs. InterProScan Sequence Search detected presence of bacteriophages-
related proteins, such as: bacteriophage capsid protein, bacteriophage tail protein, virus tail component,
translocation-enhancing protein, lambda phage transposase, gene transfer agent portal protein.
HMMTigrHMMSmart
SignalPHMMHMMPanther
FPrintScan
DATABASES:
detected ORFsSeg
Coil
superfamily
HMMPfam
500 ntPhage tail tape measure protein
PhageMin_Tail
Contig 94
Contig 97
500 ntMajor capsid protein gp5
Contig 101
500 ntLambda repressor-like
Cro/C1-type helix-turn-helix domain
Cro/C1-type helix-turn-helix domain
Transposase InsH, N-terminal
Transposase, IS4-like
Contig 114
500 nt
Clp Clp Clp
Major capsid protein gp5 ClpP/crotonase
Bacteriophage 16-3, major capsid protein Translocation-enhancing protein TepA
Phage capsid Translocation-enhancing protein
Bacteriophageportal protein
500 nt
Contig 141
Siphovirus tail component
Streptococcus phage 7201
500 nt
Contig 88
Tail sheath protein Bacteriophage T4Gp19, tail tube
500 nt
Contig 106
Phage major tail protein
Bacteriophage HK97-gp10
Bacteriophage HK97-gp10
Bacteriophage bIL286, major tail
Protein of unknown function DUF3168
3791 bp
2968 bp
5313 bp
3397 bp
2185 bp
3049 bp
2225 bp
Figure 96: Visualization of contigs that had explicit matches to phage related proteins by InterProScan.
The remaining contigs with no explicit matches to phage related proteins by InterProScan are shown in Figure
97
146
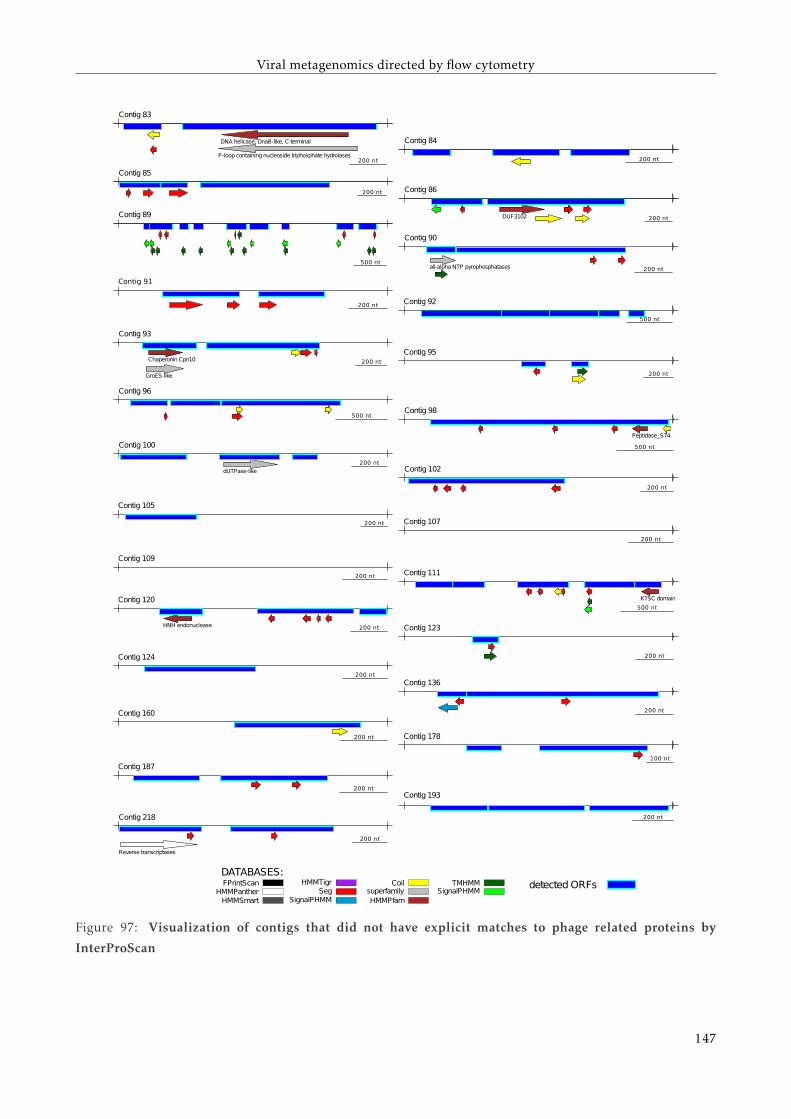
Viral metagenomics directed by flow cytometry
200 nt
Contig 84
200 nt
Contig 85
200 ntDUF3102
Contig 86
500 nt
Contig 89
200 ntall-alpha NTP pyrophosphatases
Contig 90
Contig 92
500 nt
200 nt
Contig 93
Chaperonin Cpn10
GroES-like
SignalPHMMTMHMMHMMTigr
HMMSmart SignalPHMMHMMPanther
FPrintScanDATABASES:
detected ORFsSeg
CoilsuperfamilyHMMPfam
200 nt
DNA helicase, DnaB-like, C-terminal
Contig 83
P-loop containing nucleoside triphosphate hydrolases
Contig 95
200 nt
Contig 96
500 nt
500 nt
Contig 98
Peptidase_S74
200 nt
Contig 100
dUTPase-like Contig 102
200 nt
200 nt
Contig 105
Contig 107
200 nt
200 nt
Contig 109
500 nt
Contig 111
KTSC domainContig 120
200 ntHNH endonuclease
Contig 124
200 nt
200 nt
Contig 136
Contig 160
200 nt Contig 178
100 nt
200 nt
Contig 187
Contig 193
200 ntContig 218
200 nt
Reverse transcriptases
Contig 123
200 nt
200 nt
Contig 91
Figure 97: Visualization of contigs that did not have explicit matches to phage related proteins by
InterProScan
147
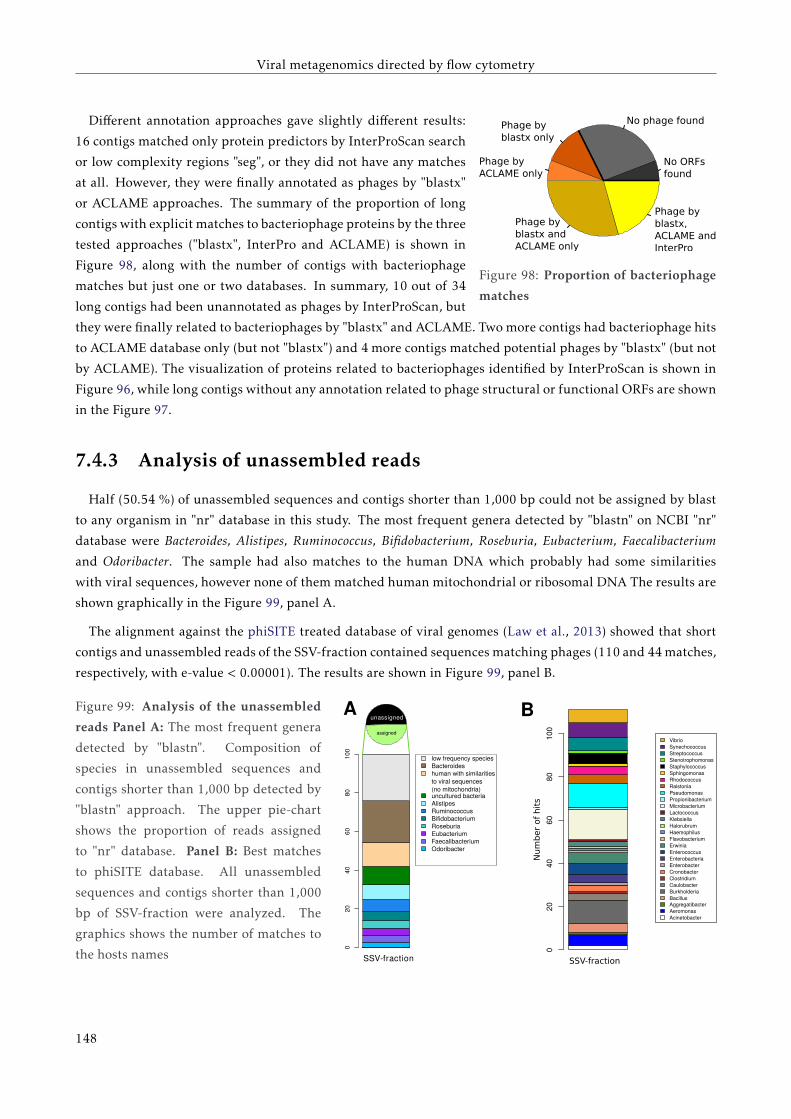
Viral metagenomics directed by flow cytometry
No phage found
No ORFs found
Phage byblastx, ACLAME and InterPro
Phage by blastx andACLAME only
Phage byACLAME only
Phage byblastx only
Figure 98: Proportion of bacteriophage
matches
Different annotation approaches gave slightly different results:
16 contigs matched only protein predictors by InterProScan search
or low complexity regions "seg", or they did not have any matches
at all. However, they were finally annotated as phages by "blastx"
or ACLAME approaches. The summary of the proportion of long
contigs with explicit matches to bacteriophage proteins by the three
tested approaches ("blastx", InterPro and ACLAME) is shown in
Figure 98, along with the number of contigs with bacteriophage
matches but just one or two databases. In summary, 10 out of 34
long contigs had been unannotated as phages by InterProScan, but
they were finally related to bacteriophages by "blastx" and ACLAME. Two more contigs had bacteriophage hits
to ACLAME database only (but not "blastx") and 4 more contigs matched potential phages by "blastx" (but not
by ACLAME). The visualization of proteins related to bacteriophages identified by InterProScan is shown in
Figure 96, while long contigs without any annotation related to phage structural or functional ORFs are shown
in the Figure 97.
7.4.3 Analysis of unassembled reads
Half (50.54 %) of unassembled sequences and contigs shorter than 1,000 bp could not be assigned by blast
to any organism in "nr" database in this study. The most frequent genera detected by "blastn" on NCBI "nr"
database were Bacteroides, Alistipes, Ruminococcus, Bifidobacterium, Roseburia, Eubacterium, Faecalibacterium
and Odoribacter. The sample had also matches to the human DNA which probably had some similarities
with viral sequences, however none of them matched human mitochondrial or ribosomal DNA The results are
shown graphically in the Figure 99, panel A.
The alignment against the phiSITE treated database of viral genomes (Law et al., 2013) showed that short
contigs and unassembled reads of the SSV-fraction contained sequences matching phages (110 and 44 matches,
respectively, with e-value < 0.00001). The results are shown in Figure 99, panel B.
Figure 99: Analysis of the unassembled
reads Panel A: The most frequent genera
detected by "blastn". Composition of
species in unassembled sequences and
contigs shorter than 1,000 bp detected by
"blastn" approach. The upper pie-chart
shows the proportion of reads assigned
to "nr" database. Panel B: Best matches
to phiSITE database. All unassembled
sequences and contigs shorter than 1,000
bp of SSV-fraction were analyzed. The
graphics shows the number of matches to
the hosts names
020
4060
8010
0
SSV-fraction
low frequency speciesBacteroideshuman with similarities to viral sequences (no mitochondria)uncultured bacteriaAlistipesRuminococcusBifidobacteriumRoseburiaEubacteriumFaecalibacteriumOdoribacter
assigned
unassigned unassigned
020
4060
8010
0
VibrioSynechococcusStreptococcusStenotrophomonasStaphylococcusSphingomonasRhodococcusRalstoniaPseudomonasPropionibacteriumMicrobacteriumLactococcusKlebsiellaHalorubrumHaemophilusFlavobacteriumErwiniaEnterococcusEnterobacteriaEnterobacterCronobacterClostridiumCaulobacterBurkholderiaBacillusAggregatibacterAeromonasAcinetobacter
Num
ber
of
hit
s
SSV-fraction
A B
148
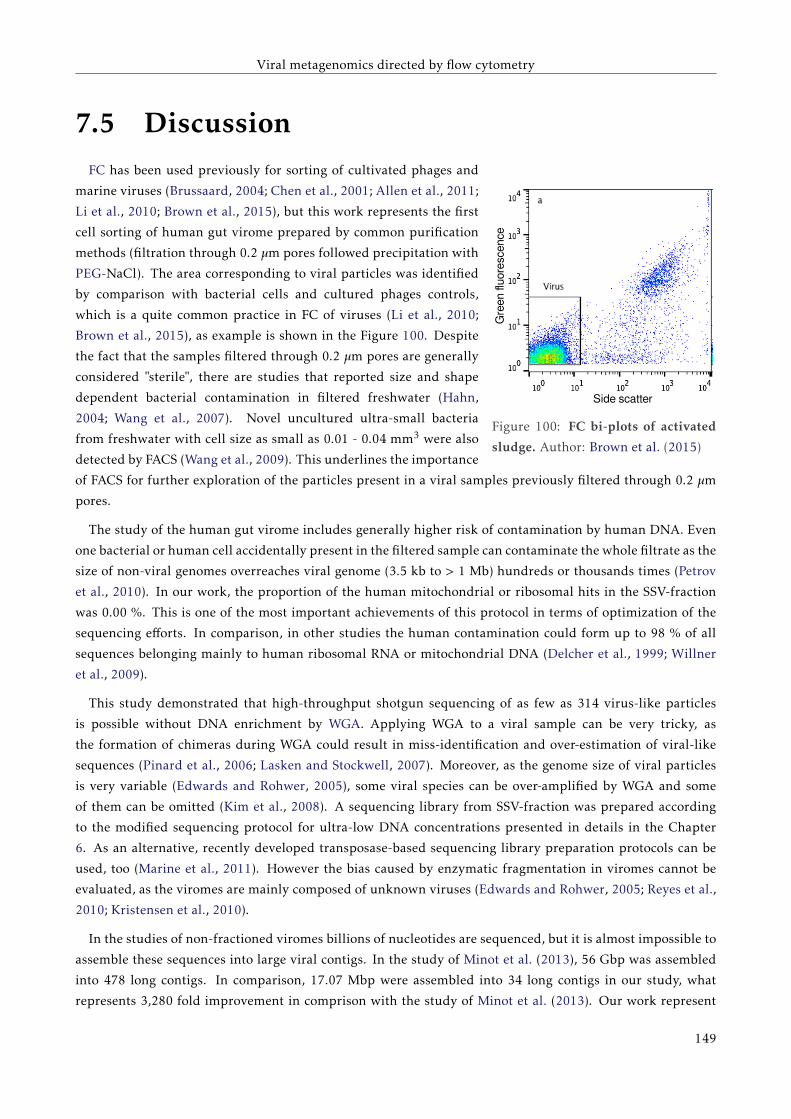
Viral metagenomics directed by flow cytometry
7.5 Discussion
Gre
en fl
uore
scen
ce
Side scatter
Figure 100: FC bi-plots of activated
sludge. Author: Brown et al. (2015)
FC has been used previously for sorting of cultivated phages and
marine viruses (Brussaard, 2004; Chen et al., 2001; Allen et al., 2011;
Li et al., 2010; Brown et al., 2015), but this work represents the first
cell sorting of human gut virome prepared by common purification
methods (filtration through 0.2 µm pores followed precipitation with
PEG-NaCl). The area corresponding to viral particles was identified
by comparison with bacterial cells and cultured phages controls,
which is a quite common practice in FC of viruses (Li et al., 2010;
Brown et al., 2015), as example is shown in the Figure 100. Despite
the fact that the samples filtered through 0.2 µm pores are generally
considered "sterile", there are studies that reported size and shape
dependent bacterial contamination in filtered freshwater (Hahn,
2004; Wang et al., 2007). Novel uncultured ultra-small bacteria
from freshwater with cell size as small as 0.01 - 0.04 mm3 were also
detected by FACS (Wang et al., 2009). This underlines the importance
of FACS for further exploration of the particles present in a viral samples previously filtered through 0.2 µm
pores.
The study of the human gut virome includes generally higher risk of contamination by human DNA. Even
one bacterial or human cell accidentally present in the filtered sample can contaminate the whole filtrate as the
size of non-viral genomes overreaches viral genome (3.5 kb to > 1 Mb) hundreds or thousands times (Petrov
et al., 2010). In our work, the proportion of the human mitochondrial or ribosomal hits in the SSV-fraction
was 0.00 %. This is one of the most important achievements of this protocol in terms of optimization of the
sequencing efforts. In comparison, in other studies the human contamination could form up to 98 % of all
sequences belonging mainly to human ribosomal RNA or mitochondrial DNA (Delcher et al., 1999; Willner
et al., 2009).
This study demonstrated that high-throughput shotgun sequencing of as few as 314 virus-like particles
is possible without DNA enrichment by WGA. Applying WGA to a viral sample can be very tricky, as
the formation of chimeras during WGA could result in miss-identification and over-estimation of viral-like
sequences (Pinard et al., 2006; Lasken and Stockwell, 2007). Moreover, as the genome size of viral particles
is very variable (Edwards and Rohwer, 2005), some viral species can be over-amplified by WGA and some
of them can be omitted (Kim et al., 2008). A sequencing library from SSV-fraction was prepared according
to the modified sequencing protocol for ultra-low DNA concentrations presented in details in the Chapter
6. As an alternative, recently developed transposase-based sequencing library preparation protocols can be
used, too (Marine et al., 2011). However the bias caused by enzymatic fragmentation in viromes cannot be
evaluated, as the viromes are mainly composed of unknown viruses (Edwards and Rohwer, 2005; Reyes et al.,
2010; Kristensen et al., 2010).
In the studies of non-fractioned viromes billions of nucleotides are sequenced, but it is almost impossible to
assemble these sequences into large viral contigs. In the study of Minot et al. (2013), 56 Gbp was assembled
into 478 long contigs. In comparison, 17.07 Mbp were assembled into 34 long contigs in our study, what
represents 3,280 fold improvement in comprison with the study of Minot et al. (2013). Our work represent
149
Viral metagenomics directed by flow cytometry
an approach for improvement of the assembly of the viral genomes by dividing the viral particles into groups
according to their size and DNA content, thus each group contains viral particles with similar morphology
and genome size. The viral diversity in these groups is reduced in comparison to the non-fractioned viromes
and theoretically, these fractions might be composed by viruses of one type only. It is then easier to assemble
separately DNA sequences coming from these fractions with reduced diversity than to assemble sequences
coming from billions of different organisms present in a non-fractioned virome. The present study explores
only one small fraction of the whole fecal virome, but optionally more different viral fractions can be separated
by FACS during one sorting session. DNA from these fractions can be sequenced and assembled separately,
thus much larger diversity of a virome can be captured.
The sequencing of single viruses is also possible (Allen et al., 2011), however to obtain sufficient genome
coverage, it is necessary to enrich their DNA by WGA. The recovery of a whole single viral genome without
WGA is not possible on platforms based on sequencing of fragmented DNA (e.g. Illumina, 454, Solid, Ion
Torrent), because when a single viral genome is sheared into fragments, the shortest fragments must be
removed in order to avoid sequencing run failure, it means that many fragments of a single viral genome
will never be sequenced. However, the third generation sequencing platforms reading single DNA molecules
can be applied for sequencing of single viral particles (Coupland et al., 2012).
The contigs longer than 1,000 bp in our study possessed mainly genes typical for bacteriophages. This
observation is in accordance with the results of many other studies investigating healthy individuals (Breitbart
et al., 2003; Minot et al., 2013; Breitbart et al., 2008; Wang et al., 2007; Reyes et al., 2010; Minot et al., 2012;
Wagner et al., 2013; Ogilvie et al., 2013), what emphasize the importance of bacteriophages in the human gut.
High prevalence of bacteriophages is also notable in conventional metagenomics data sets, which have been
estimated to form up to 17 % of microbial DNA recovered from feces (Wang et al., 2007; Reyes et al., 2010;
Ogilvie et al., 2013). On the other hand, authors sequencing cDNA from fecal samples of healthy volunteers
reported more eukaryotic viruses than bacteriophages, indicating that human viruses in feces might be rather
recovered by RNA extraction (Pérez-Brocal et al., 2013; Zhang et al., 2005).
Half (50.54 %) of unassembled sequences could not be assigned by "blastn" to any organism in "nr" database
in our study. This is a quite common observation in majority of virome studies, as the sequence databases
are biased towards the most studied human viruses and therefore the proportion of the sequences assigned to
viruses is reported between 1.5 - 76 % depending on sequence source (DNA/cDNA) and data analysis method
(Breitbart et al., 2008; Delcher et al., 1999; Wagner et al., 2013). "Blastn" matches belonged maily to bacteria,
concretely Bacteroides, Alistipes, Ruminococcus, Bifidobacterium, Roseburia, Eubacterium, Faecalibacterium and
Odoribacter. These genera were also detected in the viromes of Minot et al. (2013). The presence of bacterial
matches in viromes is very common (Finkbeiner et al., 2008; Reyes et al., 2012) and can be explained by the
fact that many phages are incorporated in the host genomes and therefore they are presented in the databases
as a part of a microbial genome (Ghosh et al., 2008). The reason for extensive presence of bacterial-like genes
in viromes might be caused by the presence of prophage-like particles Gene-Transfer Agents (GTA) which
are able to mediate horizontal gene transfer. In contrast to common bacteriophages, the amount of GTA is
insufficient to encode protein components of the particle itself and it contains random pieces of genome of
the producing cell (Wang et al., 2009; Lang et al., 2012). The presence of bacteriophages in the metagenomic
samples may be also accessed by clustered regularly interspaced short palindromic repeats analysis, as they
serve as a database of fragments derived from phage and plasmid genomes (Kristensen et al., 2010; Stern et al.,
2012).
150
Viral metagenomics directed by flow cytometry
7.6 ConclusionsThe results indicate that a filtered viral sample contains particles that can be further divided by FACS
into fractions according to their size and fluorescence. FACS coupled with the alternative sequencing library
preparation protocol omitting artificial DNA enrichment helps to overcome the reported limitations of WGA
methods.
Herein presented approach reduces enormously the sequencing force needed for assembling viral sequences
into larger contigs (thousands of times when compared to other virome studies). It also eliminates the
contamination by human mitochondria. This work demonstrated that the samples containing very low
amounts of DNA (as few as 314 viral particles) can be sequenced directly, without WGA, resulting in unbiased
and reliable sequences. The sequencing results indicate the presence of novel bacteriophages in the gut of a
healthy individual confirming their high diversity which still remains unexplored.
151


Chapter8General discussion

General discussion
The human gut contains millions of bacteria and viruses, which have numerous important functions, such
as nutrients metabolism and protection against pathogen invasion (Eckburg et al., 2005; Gill et al., 2006). The
diversity of the human gut is very individual (Arumugam et al., 2011). A great part of the gut microbes has
not been cultured yet, because it is very difficult to imitate the gut environmental conditions in the laboratory.
However, the genetic potential of the yet unknown and unculturable microbes can be determined by the
metagenomic sequencing (HMPC, 2012). The total DNA of the microbial community can be fragmented,
sequenced and aligned to the DNA/protein databases (shotgun metagenome sequencing) (Handelsman, 2004).
A general taxonomic diversity overview of a metagenomic sample can be obtained by amplification of the 16S
rRNA gene (Morris et al., 2002). However, as the most important genetic differences between strains are found
on the whole genome basis, the whole genome sequencing of isolated strains is also very important (Medini
et al., 2005).
Antibiotics cause the most important changes of the microbiome composition. They perturb the original
microbiome composition, which in some cases may lead to the activation of the opportunistic pathogens,
which have been suppressed by the normal bacterial community before antibiotic treatment. After antibiotic
treatment, a novel composition of the bacterial community is established and it may be more vulnerable to
the overgrowth of opportunistic pathogens. It may lead to the vicious cycle of recurrent intestinal infections
(Stecher et al., 2013).
One of such pathogens is Clostridium difficile. This pathogen produces high quantities of cytotoxins A and B
despite its low prevalence in the gut during infection (CDI) (Kelly et al., 1994; Rupnik et al., 2009). In addition,
the healthy gut may be colonized also by the non-toxigenic C. difficile and for that reason C. difficile usually does
not appear as the species differentiating CDI+ and CDI- patients in the conventional metagenomic analyses.
There have been numerous attempt to determine which is the microbial composition that makes the human gut
vulnerable to the CDI. However, the conclusions of the conventional metagenomics are very elusive (Seekatz
and Young, 2014).
The identification of the active bacterial species in CDI is essential for the explanation of the immune
recognition mechanisms in dysbiosis during CDI. However, the conventional metagenomic studies cannot
determine the taxonomic diversity of the active bacteria, because they take into account also dead and
quiescent bacteria as they are also present in the collected fecal samples (Ben-Amor et al., 2005; Peris-Bondia
et al., 2011; Maurice et al., 2013). Therefore, the common metagenomic studies cannot reveal whether the
activity of the commensal species inhibiting the growth of C. difficile decreases after antibiotic treatment.
And similarly, it cannot be determined which antibiotic resistant species got activated after initiation of the
antibiotic treatment. The detection of the activated antibiotic resistant species is also important, because they
may start to produce molecules promoting growth of C. difficile.
Moreover, for the explanation of infection processes connected to the dysbiosis, the immune system
recognition patterns must be also taken into account. The first line of defense in protecting the intestinal
epithelium from pathogens is formed by intestinal secretory immunoglobulin A (SIgA), which coats 25-75 %
of all gut bacteria, including the commensal and the pathogenic species (van der Waaij et al., 2004; Palm et al.,
2014). The SIgA opsonization of commensals and pathogens results in two different outcomes: the commensal
SIgA-coated bacteria are maintained within the gut lumen, while the SIgA-coated pathogens attempting to
cross the epithelial barrier are removed (Macpherson et al., 2012; Sansonetti, 2010). It was found that the
antibiotic treatment represents the "blooming" opportunity for specialized pathogens which are able to avoid
SIgA-opsonization by covering their cell surface by molecules produced by antibiotic resistant species (Ng
155
General discussion
et al., 2013; Vimr et al., 2004).
The microbial composition of the active bacterial fraction and of the fraction coated by SIgA can be
determined by 16S rDNA gene sequencing of cells selected by fluorescence activated cell sorting (FACS) (Palm
et al., 2014; Peris-Bondia et al., 2011; Maurice et al., 2013). FACS physically separates the cells which are
fluorescently labeled for selected specific features. Fecal samples from 12 CDI+ and 12 CDI- patients have
been processed by FACS in this study. The CDI+ groups contained patients with and also without antibiotic
treatment. Similarly, the patients from the CDI- were also taking antibiotics or not. Some patients were under
treatment by multiple antibiotics. This patients cohort represented the common clinical practice, in which
patients’ microbiota are under influence of different factors.
The results of the fluorescent cell counting indicated that the proportion of active bacteria and the bacteria
coated by SIgA is very variable. When the patients cohort was divided into group with and without antibiotic
treatment, similar proportions of active cells were observed in the both groups. It may be due to the fact that
the bacteria susceptible to antibiotics are being replaced by the resistant bacteria which keep maintaining the
metabolic functions of the gut. In general, the proportion of the bacteria opsonized by SIgA was lower than
the proportion of the active bacteria in the whole cohort, suggesting that not all recently formed bacterial cells
can be coated by SIgA immediately.
The analysis of the overall bacterial composition of the individual separated fractions revealed the robust
influence of antibiotics on the gut microbiota. The patients’ microbiota clustered according to the antibiotics,
but not according to the CDI diagnosis. The amounts of toxins quantified by qPCR have been taken into
account for analysis of the overall bacterial composition and it was concluded that the effect of antibiotics
is even stronger than the influence of the proper C. difficile toxins. Gut microbiota modulation by C. difficile
toxins has been already reported - the toxins may be directly acting on the gut microbiota or the microbiota is
changing indirectly due to the inflammation processes in the mucosa disrupted by the C. difficile toxins. This
is the first work in which the influence of C. difficile toxins and antibiotics on microbiota are compared.
FACS showed up to be a helpful tool for determination of dysbiosis patterns in patients with CDI, which
could not be discovered by the classical metagenomics. The results of the 16S rDNA sequencing showed that
each bacteria genus has a certain portion of cells which belong to the active fraction, while another portion is
inactive. The same is true for the bacterial SIgA coating. An example is Enterococcus resistant to Vancomycin
and Metronidazole which was quickly growing in patients under treatment by these antibiotics, meaning that
a great proportion of Enterococcus cells were active, while a smaller portion were also dying. This was observed
by in vitro culture experiments and also by patients’ fecal sample analysis. In contrast, in general, a greater
part of the most prevalent bacterial species, including Enterococcus, was actually inactive in patients without
antibiotic treatment.
The comparison of the bacterial proportions in the active and inactive fractions showed that the majority
of cells of the beneficial bacteria Lactobacillales and Clostridium cluster IV are inactive in patients infected by
CDI. These bacterial groups have been reported to have inhibitory activity against C. difficile (Gao et al., 2010).
It suggests that the growth of C. difficile may be suppressed in normal conditions by these beneficial bacteria,
while the decrease of their activity due to the environmental stress (antibiotics or other factors) induces the
"blooming" of C. difficile.
The comparison of the proportions of C. difficile cells in the fraction opsonized by SIgA with cells in the
non-opsonized fraction helped to identify its preferential coating by SIgA in this study. It confirmed that the
156
General discussion
intestinal immune system of CDI+ patients recognizes C. difficile, meaning that this species is not able to avoid
SIgA opsonization, as few specialized pathogens do (Vimr et al., 2004) In the CDI- patients, not C. difficile but
other bacteria, such as Fusobacterium, have been found typically increased in SIgA coated fractions.
The excessive coating of C. difficile (Clostridium cluster XI) by intestinal SIgA and decreased activity of the
beneficial bacteria are the markers of CDI, as they have been observed in the whole CDI+ group, independently
on the type of antibiotic treatment taken. These markers have been detected by comparison of the proportions
of each bacteria genus in the active and inactive fractions and also in the SIgA-coated and SIgA-not-coated
fraction. However, these markers could not be discovered by analysis of the total microbial community, as it is
shaped enormously by the antibiotic treatment what lead to the inability to distinguish among gut microbiome
of CDI+ and CDI- patients.
Vancomycin and Metronidazole are the most common treatment choice for the initial therapy of primary
CDI, but the persistence of spores leads to recurrent infections (Kelly et al., 1994). During the last decade,
numerous new resistant and hypervirulent strains have appeared worldwide (He et al., 2013). After antibiotic
treatment, the newly established microbial composition may be more vulnerable to CDI or may give the
green light for the overgrowth of other pathogens, such as the Vancomycin resistant Enterococcus (Willems
et al., 2005). Therefore, there is an interest in development of alternative strategies for CDI treatment and
prevention. The new treatment agent must have selective inhibitory activity against C. difficile, leaving the
remaining microbes unaffected. Recently, 8-hydroxyquinoline (8HQ), a simple quinoline alkaloid previously
detected in roots of Sebastiania corniculata, was demonstrated to be very effective against several bacterial
pathogens, including C. difficile, while other tested species, such as Bifidobacteria were not inhibited (Novakova
et al., 2013).
The culture methods commonly used for selectivity testing (e.g. agar dilution or broth microdilution
method) do not allow detailed study of the growth dynamics of bacterial populations in co-culture. The
selective antibacterial effect of 8HQ has been previously tested in vitro only in separate cell cultures (Novakova
et al., 2013).
The present study employed fluorescent in situ hybridization based on labeling genus specific 16S rRNA
sequences for distinguishing between co-cultured C. difficile and Bifidobacterium longum subsp. longum.
Fluorescent cell counting allowed to obtain exact proportions of the two species along time. The selective
action of 8HQ towards C. difficile was confirmed by counting hybridized cells in different time-points of the
growth curve.
The fluorescently hybridized bacterial species can be separated from the total bacterial community by FACS
and shotgun sequencing. We applied this approach to one patient with CDI in order to obtain collection
of all C. difficile cells present it his feces. CDI is a good model infection for such studies, as infections by
multiple C. difficile strains are being reported very often (Eyre et al., 2012b). The analysis based on ribotyping,
toxinotyping or MLST are based on analysis of one isolated colony per patient and are focused to specific
genome regions (Griffiths et al., 2010). It has been previously reported that the C. difficile strains present
in one patient usually differ in thousands of SNPs distributed along the whole genome sequence, thus the
conventional colony-PCR-based methods may lead to the false conclusion that patient is infected by only one
strain (Eyre et al., 2013b). However, the whole genome sequencing of hundreds of isolated colonies would
represent important expenses for routine diagnostic in public health. There is also another important concern:
the diagnostics based on the sequencing of isolated colonies may be biased by different growth rate and culture
157

General discussion
condition requirements of the different strains, thus there is a need for advanced diagnostic approaches.
Sequencing of C. difficile strains collected by FACS has several advantages over the sequencing of microbial
culture isolates. The major advantage of the FACS approach used in the present work is that it recovers
multiple C. difficile strains at their real proportion, independently of their growth rate. Another advantage of
FACS is the reduction of the diagnostic time, as there is no need for the microbial culture.
FACS can enrich the microbial sample for the target species. In our study, C. difficile proportion increased
129 ×. However, the separated fraction contained contaminating species. The taxonomic diversity of the
contaminating bacteria was actually the same as the original fecal sample, what suggest that the contamination
comes from the sorting equipment processing the fecal bacteria suspension sample. The proportion of species
related to the C. difficile was not increased in the contamination what confirmed that the probes were specific
for C. difficile. More precise cell selection equipment or microfluidic devices may reduce the contamination in
the natural C. difficile fraction.
The contamination of the FACS-sorted sample impaired the genome coverage analysis, as fragments of
many non-C. difficile species matched the highly conserved regions, such as 16S rDNA and conjugative
transposons of the reference 630 genome. However, apart from these highly covered regions, no other regions
with extremely high coverage were detected. This was achieved by direct preparation of the sequencing
library from the 10,000 FACS-separated cells, meaning that the cells were not enriched by whole genome
amplification (WGA) methods, which is commonly applied to the samples with low DNA concentration. WGA
is prone to development of chimeras and GC amplification bias (Lasken and Stockwell, 2007), which would be
unacceptable in strains genomes sequencing projects. As no WGA methods were used in this study, it may be
concluded that the gaps observed by mapping of the shotgun sequences to the reference genomes were due to
their natural absence.
The herein presented approach operates with low genome coverage, which is, however, sufficient for
detection of possible SNPs sites within the C. difficile-specific genome regions. It may serve as a preliminary
screening of fecal samples whether they contain multiple C. difficile strains or not. If the presence of SNPs
is detected, the strains genomes may be finished by deeper sequencing of the FACS-collected sample or
by sequencing of multiple microbial isolates (however, retrieving of these strains by microbial culture is
questionable due to the culture conditions bias).
The presence of multiple strains in one patient was confirmed by a PCR amplifying the region within the
toxin B gene which contained SNPs detected by mapping of the shotgun sequences. The same PCR was applied
to the 11 patients collected within the following three weeks after the collection of the fecal sample of the
first patient. The cohort contained patients with 4 possible sequence variants, with 2 sequence variants or
with just one sequence variant. No amplicons were obtained from two patients, what may be due to some
mismatches not detected by shotgun sequencing, present exactly at the position of the primer annealing sites,
thus disabling amplification of some of the sequence types. Therefore, the primers targeting SNPs in one
patient may not serve for amplification of the same region in other patients. The shotgun sequencing should
be taken as a gold standard for SNPs detection and strains proportion estimation. If only the PCR amplicons
analysis is taken into account, it can be concluded that the most prevalent strain in the patient No. 1 was
present in different proportions also in three out of next 11 patients collected within the three following
weeks at the same hospital department. In total eight different sequence types of the selected region within
the toxin B have been detected within the three weeks.
158
General discussion
It is difficult to conclude which of the 263 strains genomes available in the online databases was genetically
the most similar to the FACS-collected strains of the patient No. 1. Each of the complete C. difficile genomes
available on the databases contained large gaps (> 5 kbp), which encoded different clade-specific antibiotic
resistance genes. The partial genome with the highest number of sequence hits contained also large gaps after
the sequence mapping. However, the alignment of the amplicon of the toxin B showed that the variants present
in the FACS-collected strains have been previously sequenced by a Chinese team in September 2014. However,
the complete genomes of the matching Chinese isolates were not available, thus the presence of these Chinese
strains in the patient’s sample collected in Boston (MA) could not be confirmed.
As already mentioned above, the number of target cells sorted by FACS for sequencing is usually so low
that the FACS-collected samples do not generate the DNA amount required for starting with the sequencing
library preparation protocols developed by the next-generation sequencing platforms (e.g. 1 µg required by
Illumina MiSeq and 454 FLX+ for libraries prepared by mechanical fragmentation). The low amount of DNA
is usually enriched by WGA. The most commonly used WGA method is Multiple Displacement Amplification
(MDA) which employs random hexamers to extend genomic fragments by using the isothermal polymerase
from the φ29 phage of Bacillus subtilis (Allen et al., 2011; Podar et al., 2007). MDA reaction was found to
produce genome coverage bias which is mainly caused by different inter-primer distances, resulting in a low
coverage or even unamplified regions. In addition, regions of high GC content could also lead to amplification
bias. Finally, MDA reaction is prone to the amplification of template-free hexamer concatenations, to the
contamination by alien sequences, and to the formation of chimeric sequences (Lage et al., 2003; Bredel et al.,
2005). To overcome the limitations of MDA, a number of protocol improvements or novel bioinformatics
approaches have been developed (Woyke et al., 2011; Spits et al., 2006b). However, any of the improvements
cannot make artificial amplification completely appropriate for studies of unknown organism or for studies
where SNPs and genome rearrangements are of the interest, as there a great risk on working with non-sense
sequences.
In fact, the input amount of DNA required for starting with sequencing library preparation is actually
overestimated. Most of the input DNA (1 µg) for 454 sequencing is spent for the titration of the emulsion PCR
(emPCR), which involves mixing single-stranded library templates with DNA-capturing sepharose beads in an
oil emulsion, expecting thus to capture single sequences. Only about 0.000076 % of the initial DNA amount
required for 454 FLX+ library construction is loaded on the sequencing plate, meaning that the majority is
lost in the library preparation process or simply stored in a freezer. In the case of MiSeq platform, 0.00162 %
of the initial DNA amount required for TrueSeq libraries (mechanical DNA fragmentation) is loaded on the
flowcell.
It has been previously shown that the successful quantification of the number of molecules present in the
prepared sequencing library is essential for reduction of the amount of starting material needed to sequence
a DNA sample. The exact quantification of the number of amplificable molecules present in a library may be
performed using Minor Groove Binder Taqman probes (Buh Gasparic et al., 2010; Zheng et al., 2011). The
present study demonstrated that if the steps, in which the major DNA losses occur, are substituted by more
sparing ones, a library containing the minimal number of molecules required for loading on a sequencing
plate can be sequenced successfully. Rather than fragmenting the samples in a nebulizer, they were sonicated
in the same tube in which DNA extraction was performed, thus also avoiding losses due to sample transfer.
Small fragments were removed exclusively with AMPure magnetic beads and no purification columns were
used. By this way the library containing DNA extracted from 10,000 E. coli cell (counted by FACS) was
159
General discussion
sequenced. The extracted DNA amount was not measurable by the Picogreen assay, but it was definitely
lower than 54 pg (the theoretical DNA content of 10,000 E. coli cells), because losses during DNA extraction
occur. The only concentration control point was the final library quantification by qPCR which confirmed
that the constructed library contained the minimal number of DNA molecules required for loading on one 1/8
region of a sequencing plate.
The performance of the direct sequencing was compared with the widely applied MDA approach used
for samples with small amounts of DNA. Sample sequenced directly without MDA provided homogeneous
genome coverage throughout most of the E. coli genome. In contrast, MDA sample generated regions with a
extremely high genome coverage, leaving almost all of it uncovered. The number of unassigned sequences was
considerably lower in the sample sequenced directly without MDA, while up to 94.24 % of the MDA sample
was formed by unknown DNA sequences. By hexamer frequency analysis we concluded that these sequences
could originate from hexamer concatenation or from the enzyme preparation process, including host bacteria
Bacillus subtilis.
The sequences of the sample sequenced directly without MDA, which have been not mapped to the E.
coli genome (19.41 %), belonged mostly to the species contaminating buffers in the flow cytometer or to the
bacteria coming from the human skin. This is an important concern, which was also observed in the separation
of C. difficile cells by FACS in this work. It seems that contamination is an important issue in the common flow
cell sorters and cannot be completely eliminated by bleach which is generally used for equipment cleaning.
However, this issue underlines the importance of direct sample sequencing without artificial amplification
by MDA. If MDA is applied to a sample with certain proportion of undesired contaminating bacteria, their
sequences may be by amplification chimerically attached to the target species sequences. This makes MDA
especially risky for sequencing of genomes of unknown organisms separated from their original bacterial
community by FACS.
We have demonstrated, that it is possible to sequence DNA coming from as few as 10,000 bacterial cells.
The minimal number of cells required for starting with preparation of a sequencing library would depend
on the DNA extraction method. However, the study design must take into account that a typical bacterial
cell containing 5-16 fg of DNA would never provide a sufficient number of molecules for high-throughput
sequencing. It is not possible to recover a complete genome of a single-cell genome without WGA on platforms
sequencing fragmented DNA (e.g. Illumina, 454, Solid, Ion Torrent), because when a single-cell genome is
sheared into fragments, the shortest fragments must be removed in order to prevent sequencing run failure.
It means that many fragments of a single non-enriched genome would be never sequenced.
To address the question which is the minimum number of cells required for sequencing library preparation,
a theoretical calculation based on the minimal number of molecules loaded on a sequencing plate was
performed in this study. MiSeq Illumina platform generates 25,000,000 reads which correspond to the
DNA amount that could be extracted from 3,260 E. coli cells if no DNA losses during the DNA extraction
occurred. In the case of the 454 FLX+ (1,000,000 reads) it would be 153 cells. However, in the study design,
the DNA losses during the extraction protocol and library preparation protocol must be taken into account,
too. In contrast, in the Illumina library preparation protocol, the sequencing adaptors are attached by a PCR
reaction which actually increases the library concentration. Similarly, the concentration of a 454 library may
be increased by a PCR with sequencing adaptor primers. Theoretically, the number of cells for sequencing
on the 454 FLX+ platform should be higher than 153 cells (for sequencing on the whole sequencing plate).
However, it may be also lower, as the final library can be also amplified by few number of PCR cycles with
160
General discussion
library adaptors primers. In addition, the sequencing plate may be divided into smaller regions or numerous
samples may be multiplexed and pooled for sequencing on one sequencing plate, meaning that sequencing
of multiple samples on one plate would require less bacterial cells. Thus, it is difficult to estimate an exact
minimal number of bacterial cells required for a succesful sequencing run on the next-generation sequencing
platforms. Third generation sequencing platforms reading single DNA molecules (such as MinION) may be
used for direct whole genome sequencing of single bacterial cells.
As the minimal number of bacterial cells required for sequencing has not been exactly defined, we prepared
a sequencing run on the 454 FLX+ platform containing DNA from as few as 314 viral particles collected by
FACS. We focused on utilization of FACS for human gut viromics, as the sequencing of the viromes prepared by
the common purification protocols encounters several difficulties. The fecal samples are usually centrifuged
with the objective to remove bacterial fraction. The supernatant is filtered through a series of filters, in which
the 0.2 µm pores are the smallest ones and the obtained filtrate is concentrated by ultracentrifugation (Thurber
et al., 2009). However, a high proportion of human and bacterial matches is still being detected in such
purified viral samples (Breitbart et al., 2003). Viral DNA extraction results in a low DNA concentration,
which does not reach the minimal limit required for sequencing library preparation. Therefore, the viromes
are usually enriched by WGA (usually MDA), which is, however, prone to the development of chimeras and
amplification bias, as already mentioned above. In addition, as there is a very wide diversity of gut viral
species, very extensive sequencing efforts must be made for the assembling of whole viral genomes.
The present work describes an approach to improve human gut virome assembly by employing a more
precise preparation of a viral sample before sequencing in which the final viral particles selection is performed
by FACS. Particles present in a virome previously filtered through 0.2 µm pores were stained with a DNA
stain and visualized on the flow cytometery bi-plots. One group of viral particles with the smallest size was
selected and shotgun sequenced by the optimized sequencing library preparation protocols previously tested
with 10,000 E. coli cells. The DNA extracted from the FACS-sorted 314 viral particles of the selected fraction
was assembled into 34 contigs longer than 1,000 bp with the coverage of over 15 ×. This represents an increase
to the number of assembled long contigs per sequenced Gb in comparison with other studies where non-
fractioned viromes are sequenced. Seven of these contigs contained open reading frames (ORFs) with explicit
matches to proteins related to bacteriophages. The remaining contigs also possessed uncharacterized ORFs
with bacteriophage-related domains. The results confirmed the the high diversity of bacteriophages in the
healthy human gut.
However, it is also important to mention the presence of unassigned and unassembled sequences in the
sequenced virome fraction. About half of the unassembled reads in our study could not be assigned to any
organism, which is quite a common observation for the majority of virome studies. The reason for this is
that the sequence databases are biased toward the most studied human viruses, and therefore the proportion
of the sequences assigned to viruses is very variable and depends on sequence source (DNA/cDNA) and the
data analysis method. The bacterial matches are also very common in virome studies and can be explained by
the fact that many phages are incorporated in the host genomes and are therefore present on the databases as
parts of microbial genomes. The FACS-sorted virome sample presented in this study should be sequenced with
more depth in order to finish the complete genomes of these phages and to respond the question, whether the
detected bacteriophages in our study contained these unassigned sequences in their genomes or whether these
sequences formed the contamination of the flow cytometer equipment, commonly detected in our previous
studies.
161
General discussion
The results of the present study suggest that the particles, that are present in the filtered viromes, are
of very variable sizes and DNA content. The separation of a group of particles with similar size and DNA
content actually decreases the viral diversity in the sample and so allow to recover easily large pieces of
the viral genomes. Assembly of such a small number of particles results in long contigs without applying
large sequences efforts. Moreover, FACS of such a filtrate represents an effective tool for elimination of
contamination by human mitochondria and bacteria.
162

Chapter9General conclusions

General conclusions
1. The comparison of the taxonomic distribution of the two pair of fractions (SIgA-opsonized vs. non-
SIgA-opsonized and active vs. not active) allows to determine the dysbiosis patterns in CDI patients.
The beneficial bacterial groups, such as Lactobacillales and Clostridium IV group are mostly inactive in
CDI patients. These bacteria might supress the activity of C. difficile in healthy individuals in the risk
category. The majority of cells of C. difficile are opsonized by SIgA during CDI infection. It suggests that
C. difficile cannot avoid opsonization by SIgA as some specialized pathogens do.
2. C. difficile forms as few as 0.0001 % of all intestinal bacteria and is recognized by the immune system
as a common pathogen. However, when there is a decrease of beneficial bacteria activity due to the
environmental stress caused by antibiotics, it is able to produce high amounts of toxins and cause the
infection.
3. 8-hydroxyquinoline is a natural compound which seems to be promising for CDI treatment. Flow
cytometry analysis showed that it has selective inhibitory activity against C. difficile, while the growth of
beneficial Bifidobacterium longum grown in co-culture remains unaffected.
4. C. difficile infection can be caused by multiple strains. The analysis of single nucleotide polymorphism
in genomic sequences obtained from C. difficile cells separated directly from feces of a CDI patient by the
flow cytometry showed at least three genetic variants of the selected region of the toxin B gene. Three
of 11 patients hospitalized at the same department within the following month contained the genetic
variants detected in the first patient.
5. Shotgun sequencing of C. difficile strains present in one patients collected by flow cytometry may serve
as an initial screening for detection of infection by multiple strains as so reduce costs which would be
generated by sequencing of hundreds of culture isolates.
6. Despite the cell collection by flow cytometry usually result in low amounts of extracted DNA, these
samples can be sequenced by the high-throughput sequencing platforms, if optimized protocols are
used. The library prepared by an alternative protocol should contain the minimal number of DNA
molecules required for loading on a sequencing plate.
7. The DNA libraries prepared by alternative shotgun protocols generate better sequencing results than
libraries prepared from DNA enriched by the whole genome amplification by φ polymerase. φ
polymerase can generate up to 98 % of unreliable sequences which do not map to the references bacterial
genome, which is contrary to the results obtained by the alternative shotgun library preparation protocol.
8. Flow cytometry cell sorting coupled by the use of optimized shotgun sequencing protocols allows to
determine the genetic sequence of human viruses. It was shown that a healthy volunteer contains
numerous novel bacteriophages.
9. Low number of viral particles collected by flow cytometry improves the genome assembly. Moreover, the
contamination of viral filtrates, e.g. human mitochondria and bacteria is reduced.
10. Flow cytometry is a powerful tool for analysis of individual bacterial cells and viral particles. It can
be considered as an improving extension for the classical metagenomics, as the cell sorters preselect the
bacteria (viruses) with the pre-determined characteristics, so the non-target bacterial cells are eliminated
and excluded from the sequencing. The ability to reveal the genetic information of the target group of
microorganisms can be very helpful in addressing the biological questions related to the human gut
microbiome.
165


Chapter10Resumen en Castellano

Resumen en Castellano
Introducción
El tracto intestinal humano está poblado por 1013 - 1014 bacterias que en conjunto contienen 1,000 veces
más genes que el genoma humano (Gill et al., 2006). Varios estudios han confirmado que las bacterias del
intestino influyen en la salud del cuerpo humano (Macfarlane et al., 2005; Turnbaugh et al., 2006; Bercik et al.,
2011). Además de las bacterias, el intestino humano contiene millones de partículas virales, en su mayoría
bacteriófagos. Indirectamente, por lo tanto tambiÃľn influyen en la salud humana (Minot et al., 2013).
La composición microbiana varia con el individuo. Las especies más numerosas podrían definir tres grupos
de individuos: segÞn predominen Bacteroides, Prevotella o Ruminococcus (Arumugam et al., 2011). No
obstatne, las funciones más importantes pueden ser realizadas por especies minoritarias (Lynch and Neufeld,
2015). Durante el dasarrollo, la composición bacteriana en el intestino cambia por efecto de la dieta y el estilo
de vida. Los antibióticos provocan fuertes cambios también (Graf et al., 2015).
Es enorme la candidad de información que se ha descubierto en los últimos años sobre las bacterias
intestinales, aunque aún quedan muchas cuestiones abiertas. La secuenciación de ADN ha permitido conocer
el potencial genético de todas las bacterias en el cuerpo humano sin necesidad de cultivarlas. Se estima que
la mitad de las bacterias intestinales no se puede cultivar, pero se puede averiguar su función y aproximar su
taxonomía (Morgan et al., 2013).
Hay varios métodos para descifrar el potencial genético de las bacterias:
• Genómica bacteriana: se extrae ADN de las cepas aisladas y se fragmenta con enzimas de restricción
o mecánicamente con ultrasonido o ultra presión, ya que los secuenciadores de ADN (Illumina MiSeq
o 454 FLX+) no pueden leer la molécula de ADN entera. Las secuencias obtenidas se ensamblan para
reconstruir el genoma en su totalidad. El genoma bacteriano se cubre con secuencias solapantes para
obtener un ensamblaje correcto.
• Metagenómica: se extrae ADN de todo el conjunto de las bacterias obtenidas directamente de un
ambiente. El objetivo es descifrar las secuencias para ver cuáles son las principales rutas metabólicas
de ese ambiente e intentar determinar las principales familias bacterianas que son productoras de estos
metabolitos. Otra rama de la metagenómica es la transcriptómica, en la que se estudian solo los genes
expresados en el momento de recoger las muestras.
• Clasificación taxonómica - La secuenciación del gen 16S rRNA sirve para la identificación de especies
bacterianas. El gen se amplifica en la reacción PCR. El producto de la amplificación debe tener el tamaño
adecuado para su secuenciación.
Estos métodos de secuenciación de ADN se suelen aplicar a toda la comunidad bacteriana, pero existen
métodos de preselección de células bacterianas, como es el caso de la citometría de flujo. La citometría de flujo
es una metodología que permite separar fracciones de comunidades microbianas basándose en características
tales como el contenido celular de DNA, proteínas en la superficie celular o la taxonomía microbiana.
El citómetro de flujo detecta la fluorescencia emitida por las células marcadas con fluoróforos que indican
las características celulares de interés. Las células pueden ser marcadas directamente con un compuesto
químico fluorescente o indirectamente con los fluoróforos conjugados con macromoléculas, anticuerpos o
sondas (oligonucleótidos). Las células entran al citómetro de flujo en suspensión, se alinean y pasan una
detrás de otra a través de uno o varios láseres. Cada partícula desvía la luz en forma diferente y al absorber la
169
Resumen en Castellano
energía de láser, emite diferentes longitudes de onda que se filtran por un sistema de espejos. Las ondas son
recogidas por sensores que envían la información de intensidad a un ordenador. Dependiendo del citómetro y
de la muestra, el citómetro de flujo puede procesar datos de cientos de miles de células en unos minutos (Picot
et al., 2012).
Objetivos
El ADN de las células con características seleccionadas separadas por la citometría de flujo se pueden
secuenciar. Con este método obtendríamos más información que secuenciando la comunidad bacteriana no
fraccionada. Esta tesis está enfocada a la metagenómica del intestino humano dirigida por la citometría de
flujo. Los objetivos principales de esta tesis son los siguientes:
• Objetivo 1: Secuenciación de las bacterias activas y cubiertas con inmunoglobulina A secretora en
las muestras fecales de pacientes con infección por Clostridium difficile
El objetivo es explorar la diversidad taxonómica de las bacterias activas y opsonizadas por
inmunoglobulina A secretora que se separarán por la citometría de flujo. La infección por C. difficile
está relacionada con el uso de antibióticos de gran espectro. Con el método aplicado en esta tesis se
podrá detectar quÃľ especies se resisten al tratamiento antibiótico, ya que los resultados de los estudios
de microbiota total también incluyen las bacterias muertas. La perturbación microbiana puede estar
relacionada con cambios en los mecanismos de reconocimiento de bacterias por el sistema inmune, que
pueden influir el progreso de la infección. El objetivo 1 de esta tesis es explicar la disbiosis bacteriana
que está ocurriendo en el intestino de los pacientes infectados por C. difficile.
• Objetivo 2: Inhibición de C. difficile por 8-hidroxiquinoleína
La hibridación de células con sondas fluorescentes específicas ayuda a distinguir especies de bacterias
distintas en muestras ambientales o en un co-cultivo. El objetivo 2 de esta tesis es estudiar el efecto de
8-hidroxiquinoleína, que es un compuesto antibacteriano con efecto inhibidor selectivo contra C. difficile.
Se investigará por la citometría de flujo el crecimiento de C. difficile y Bifidobacterium longum cultivados
cuntamente en un medio conteniendo el 8-hidroxiquinoleína .
• Objetivo 3: Diversidad genética de C. difficile separado por citometría de flujo
Las células de C. difficile marcadas con sondas específicas serán separadas del resto de la comunidad
bacteriana intestinal por citometría de flujo. Se secuenciará ADN de todo el conjunto de cepas presentes
en heces de un paciente infectado. El objetivo 3 de esta tesis es detectar la infección por múltiples cepas
de C. difficile en un paciente evitando utilizar los métodos de cultivo tradicionales.
• Objetivo 4: Adaptación de protocolos de secuenciación masiva a las muestras procedentes de
citometría de flujo
Las muestras procedentes de citometría de flujo contienen normalmente una cantidad de ADN tan
baja que no cumplen con los requisitos de los protocolos de secuenciación masiva. Por eso todo el
contenido genético se suele enriquecer con la polimerasa Φ . Sin embargo, esa amplificación es la
causa de secuencias quiméricas o falta de regiones enteras. El objetivo 4 de esta tesis es optimizar los
protocolos de preparación de las librerías de secuenciación para poder secuenciar muestras procedentes
de la citometría de flujo. Los resultados se compararán con los resultados del ADN enriquecido con la
polimerasa Φ .
170
Resumen en Castellano
• Objetivo 5: Virómica del intestino humano dirigida por la citometría de flujo
El objetivo 5 de esta tesis es estudiar por citometría de flujo las partículas virales presentes en un filtrado
de muestras fecales. Se separará una fracción de partículas con el mismo tamaño y fluorescencia de ADN
y se secuenciarán usando el protocolo optimizado en el objetivo 4. Los genes se anotarán y se determinará
su origen.
Métodos
Las células bacterianas procedentes de heces se fijaban con formaldehido y se marcaban con SYTO®62 (Life
Lechnologies, Ref. S11344) para distinguir las células de otras partículas de tamaño similar que podían
permanecer en las heces después de la purificación bacteriana. Los virus, en el proyecto de secuenciación
de viroma, se marcaban con SYBR Green I (Life Technologies, Ref. S-7563). En los otros proyectos, las
bacterias activas se marcaban con pironina Y (Sigma-Aldrich, Ref. P9172-1G) que es específico para ARN;
las células opsonizadas con inmunoglobulina A secretora se marcaban con anticuerpos conjugados con FITC
(Life Technologies, Ref. A24459) y las células de C. difficile y B. longum se marcaban con sondas conjugadas
con fluorofóros de longitudes de emisión diferentes (FITC y Cy5).
Para la separación de células bacterianas o partículas virales se utilizaron los citómetros MoFlo XDP Cell
sorter de Beckman Coulter y S3 Cell Sorter de Bio-Rad. En el proyecto de secuenciación de fracciones de
bacterias activas y opsonizadas por inmunoglobulinas, se separaron 540,000 células de cada fracción de heces
en 12 pacientes infectados por C. difficile y 12 pacientes no infectados hospitalizados. En el estudio genómico
de C. difficile se separaron tan solo 10,000 células de heces de un paciente infectado y en el estudio de viroma
se separaron tan solo 314 partículas virales filtradas por poros de tamaño 0.2 µm de heces en un voluntario
sano. En los experimentos donde la separación física no era necesaria, se utilizó el citómetro Cytomics FC 500
de Beckman Coulter para contar las células y para visualizar su fluorescencia.
El ADN se extraía con el método de fenol-cloroformo donde se empleaba bromuro de
hexadeciltrimetilamonio, lisozima y proteinasa K (Ausubel et al., 1992). Para estudiar el gen 16S rRNA
se amplificaban los regiones V3 y V4 (Klindworth et al., 2013) y los amplicones se trataban según las
instrucciones de secuenciación por Illumina. En los estudios genómicos, el ADN se fragmentaba por
sonicación o usando el kit Nextera empleando la tagmentación. La secuenciación masiva se llevó a cabo en las
plataformas Illumina y 454 FLX+.
En general, las secuencias obtenidas se procesaban con el programa PRINSEQ (Schmieder and Edwards,
2011), que cortaba las secuencias según su calidad y eliminaba secuencias cortas o con baja entropia. En los
estudios taxonómicos, los amplicones de 16S rDNA se compararon con la base de datos "Ribosomal database
project" (Cole et al., 2009). En los estudios genómicos, las secuencias se compararon con las bases de datos de
NCBI usando algoritmos de "blastn" o "blastx" (Altschul et al., 1990) y en el caso de virómica con las bases de
datos ACLAME (Leplae et al., 2004) y phiSITE (Klucar et al., 2010). Las secuencias genómicas se ensamblaron
con el programa MIRA4 (Chevreux et al., 1999) y los "marcos abierto de lectura" se anotaron en la base de datos
InterPro (Hunter et al., 2012). El mapeo de las secuencias genómicas de un genoma en concreto se realizó con
los programas SSAHA 2.5.4 (Ning et al., 2001) o Bowtie 2 (Langmead and Salzberg, 2012).
Los resultados se analizaron con los paquetes de programación en R, como por ejemplo "vegan" (Dixon,
2003) para determinar las abundancias bacterianas, "Rsamtools" (Li et al., 2009) para visualizar la cobertura
171
Resumen en Castellano
de genoma determinado con las secuencias obtenidas y "FlowViz" para manejar los datos de citometrá de flujo
(Hahne et al., 2009).
Resultados y conclusiones
La comparación de distribuciones taxonómicas de las dos parejas de fracciones (opsonizadas vs. no
opsonizadas y activas vs. inactivas) ha ayudado a determinar las características de disbiosis en pacientes
infectados por C. difficile. El grupo taxonómico de C. difficile estaba preferentemente opsonizado por
inmunoglobulina A secretora. En los pacientes no infectados, otras bacterias potencialmente patogénicas
también eran opsonizadas por inmunoglobulina A secretora. Los grupos de bacterias beneficiosas, como
Lactobacillales and Clostridium grupo IV eran inactivas en los pacientes infectados. Por las condiciones
medioambientales (como tratamiento antibiótico) estas bacterias bajan su actividad lo que promueve la
producción de toxinas por C. difficile aunque su proporción en el intestino sea muy baja (puede ser tan solo
0.0001 %) y aunque sea reconocido por el sistema inmune. No hubiese sido posible encontrar estos indicadores
de disbiosis aplicando los métodos de metagenómica rutinaria en la que se analiza la comunidad bacteriana
no fraccionada.
La citometría de flujo es un método para contar las células hibridadas con sondas fluorescentes específicas
de especies de interés. Cuando C. difficile se ha cultivado en conjunto con B. longum en medio sin bacteriocinas,
la proporción de las dos especies era similar, oscilaba entre 22.7 y 77.9 % durante toda la curva de crecimiento
de 12 horas. En el cultivo con el 8-hidroxiquinoleína el contenido de C. difficile bajó después de 4 horas (8.8.-
17.5 %). El crecimiento de B. longum no se vió afectado por 8-hidroxiquinoleína. Este estudio demuestra que
el efecto de 8-hidroxiquinoleína es selectivo contra C. difficile y no afecta a las bifidobacterias. Por eso podria
servir como tratamiento contra la infección por C. difficile.
Las secuencias genómicas de las 10,000 células de C. difficile separadas de heces de un paciente infectado
se han mapeado al genoma de referencia de la cepa 630. Sin embargo varias regiones específicas para esta
cepa faltaban por lo que se puede concluir que el paciente era infectado por otra(s) cepa(s). El estudio del
polimorfismo de un solo nucleótido ha detectado dos variantes del mismo nucleótido en varias ocasiones.
Los polimorfismos detectados en los genes de toxina A y B se han confirmado por secuenciación de los
amplicones de estas regiones. Aunque la cobertura del genoma de referencia no era suficiente para completar
el ensamblaje, este método puede servir para detectar las infecciones por cepas múltiples y así reducir los
gastos que surgieran si se secuencian las cepas aisladas por el cultivo microbiológico. Además, la separación
de células de C. difficile por la citometría de flujo no está sesgada por la diferente formas de crecimiento de las
cepas.
En los proyectos genómicos de esta tesis queríamos evitar el uso de enriquecimiento con la polimerasa Φ , ya
que esta forma secuencias corruptas. Se ha construido una librería de secuenciación que contenía el mínimo
número de fragmentos de ADN que se deben cargar en una placa de secuenciación de la plataforma 454 a partir
de tan solo 10,000 células de E. coli contadas por el citómetro. El optimizado protocolo de la preparación de
las librerías de secuenciación empleaba sonicación en lugar de la nebulización y las librerías se cuantificaban
por la PCR cuantitativa. El protocolo optimizado daba una cobertura uniforme del genoma de E. coli. Los
resultados se compararon con la muestra enriquecida con la polimerasa Φ que generó secuencias corruptas
(97.8 % se las secuencias) y tan solo 2.45 % del genoma de E. coli estuvo cubierto.
172
Resumen en Castellano
En el siguiente proyecto se ha utilizado el protocolo anterior para secuenciar tan solo 314 partículas virales
de heces de un voluntario sano. Se han seleccionado las partículas virales con el mismo contenido de ADN y
el mismo tamaño. El ensamblaje de las secuencias metagenómicas resultó en 34 contigs con longitud mayor
de 1,000 pares de bases. Esto representa un incremento del número de contigs largos por número de lecturas
obtenidas. Siete de estos contigs contenían marcos de lecturas abiertas identificados como partes de proteínas
de bacteriófagos. Otros contigs largos también tenían cierta similitud con secuencias de los bacteriófagos.
Ninguno de los contigs largos contenía genes bacterianos. No se detectó contaminación por mitocondrias
humanas. La citometría de flujo aplicada para fraccionar las partículas virales supone muchas ventajas en la
investigación del viroma humano. No solo mejora el ensamblaje sino que también reduce la contaminación
por células no virales.
En conclusión, esta tesis presenta varios casos en los que la citometría de flujo complementa y aumenta
la información biológica que ofrece la metagenómica clásica. Sirve para explicar disbiosis bacteriana en
infecciones, para describir las curvas crecimiento de especies mezclados en un cultivo, para detectar la
infección por cepas múltiples en un paciente y también sirve para mejorar varios aspectos de los estudios
de viroma humano, si se aplican protocolos optimizados de preparación de librerías de secuenciación.
173

Chapter11Appendix: Laboratory protocols

Appendix: Laboratory protocols
11.1 Amplification of 16S rDNA for Illuminasequencing
1. Prepare the following PCR premix:
31.75 µl water
4 µl dNTPs 2.5 mM each (Takara, Ref. RR001A)
5 µl ExTaq buffer 10x (TakaraRef. RR001A)
2 µl 10 mM 16S rDNA forward primer Illumina:
5’ - TCG TCG GCA GCG TCA GAT GTG TAT AAG AGA CAG CCT ACG GGN GGC WGC AG -3’
2 µl 10mM 16S rDNA reverse primer Illumina:
5’ - GTC TCG TGG GCT CGG AGA TGT GTA TAA GAG ACA GGA CTA CHV GGG TAT CTA ATC
C - 3’
0.25 µl ExTaq polymerase 5 U/µl (Takara, Ref. RR001A)
5 µl DNA, extracted according to the protocol in the section 11.5 or water (as a negative control)
2. Incubate the samples in a PCR cycler with the following program:
Initialization step:
94◦C 2 min
Denaturation, annealing and elongation steps: if DNA content is 12.5 ng, perform the PCR with 25
cycles, if it is less increase the number of cycles to 32:
94◦C 30 sec
54◦C 30 sec
72◦C 30 sec
Final elongation:
72◦C 10 min
Final hold at 4◦C
3. Purify the PCR product and prepare the sequencing library according to the manufacturer’s instructions
in the official Illumina protocol.
177
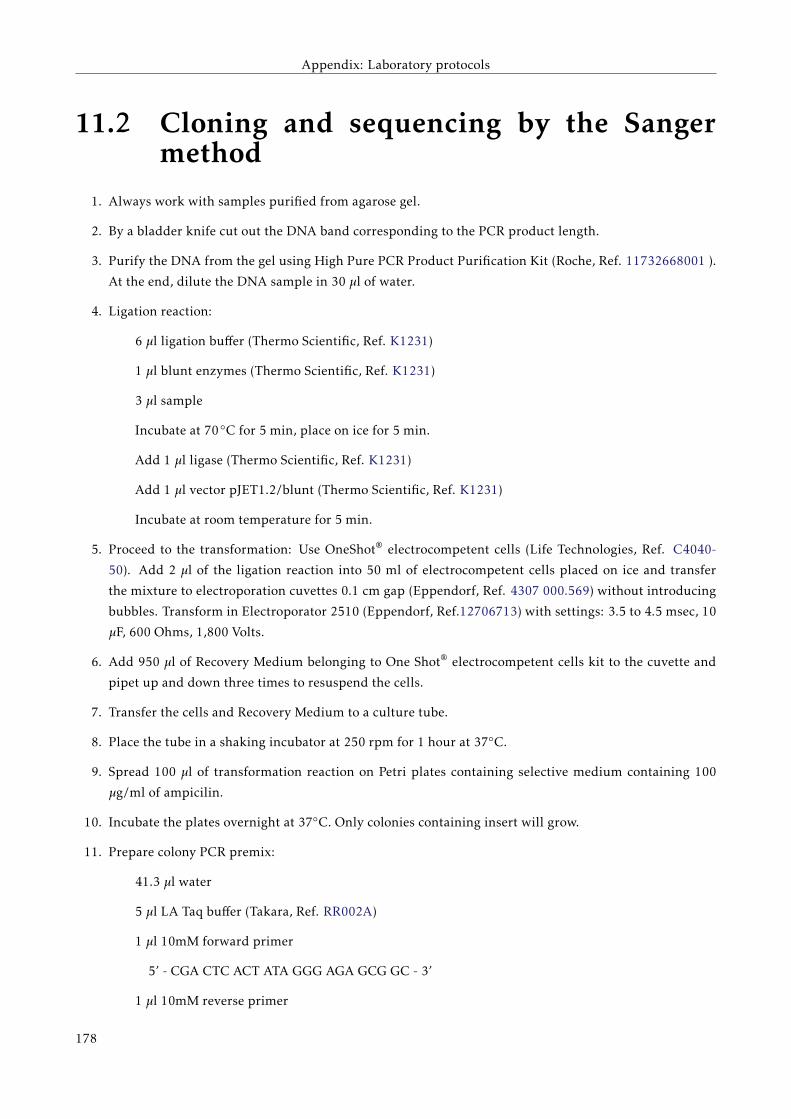
Appendix: Laboratory protocols
11.2 Cloning and sequencing by the Sangermethod
1. Always work with samples purified from agarose gel.
2. By a bladder knife cut out the DNA band corresponding to the PCR product length.
3. Purify the DNA from the gel using High Pure PCR Product Purification Kit (Roche, Ref. 11732668001 ).
At the end, dilute the DNA sample in 30 µl of water.
4. Ligation reaction:
6 µl ligation buffer (Thermo Scientific, Ref. K1231)
1 µl blunt enzymes (Thermo Scientific, Ref. K1231)
3 µl sample
Incubate at 70◦C for 5 min, place on ice for 5 min.
Add 1 µl ligase (Thermo Scientific, Ref. K1231)
Add 1 µl vector pJET1.2/blunt (Thermo Scientific, Ref. K1231)
Incubate at room temperature for 5 min.
5. Proceed to the transformation: Use OneShot® electrocompetent cells (Life Technologies, Ref. C4040-
50). Add 2 µl of the ligation reaction into 50 ml of electrocompetent cells placed on ice and transfer
the mixture to electroporation cuvettes 0.1 cm gap (Eppendorf, Ref. 4307 000.569) without introducing
bubbles. Transform in Electroporator 2510 (Eppendorf, Ref.12706713) with settings: 3.5 to 4.5 msec, 10
µF, 600 Ohms, 1,800 Volts.
6. Add 950 µl of Recovery Medium belonging to One Shot® electrocompetent cells kit to the cuvette and
pipet up and down three times to resuspend the cells.
7. Transfer the cells and Recovery Medium to a culture tube.
8. Place the tube in a shaking incubator at 250 rpm for 1 hour at 37◦C.
9. Spread 100 µl of transformation reaction on Petri plates containing selective medium containing 100
µg/ml of ampicilin.
10. Incubate the plates overnight at 37◦C. Only colonies containing insert will grow.
11. Prepare colony PCR premix:
41.3 µl water
5 µl LA Taq buffer (Takara, Ref. RR002A)
1 µl 10mM forward primer
5’ - CGA CTC ACT ATA GGG AGA GCG GC - 3’
1 µl 10mM reverse primer
178
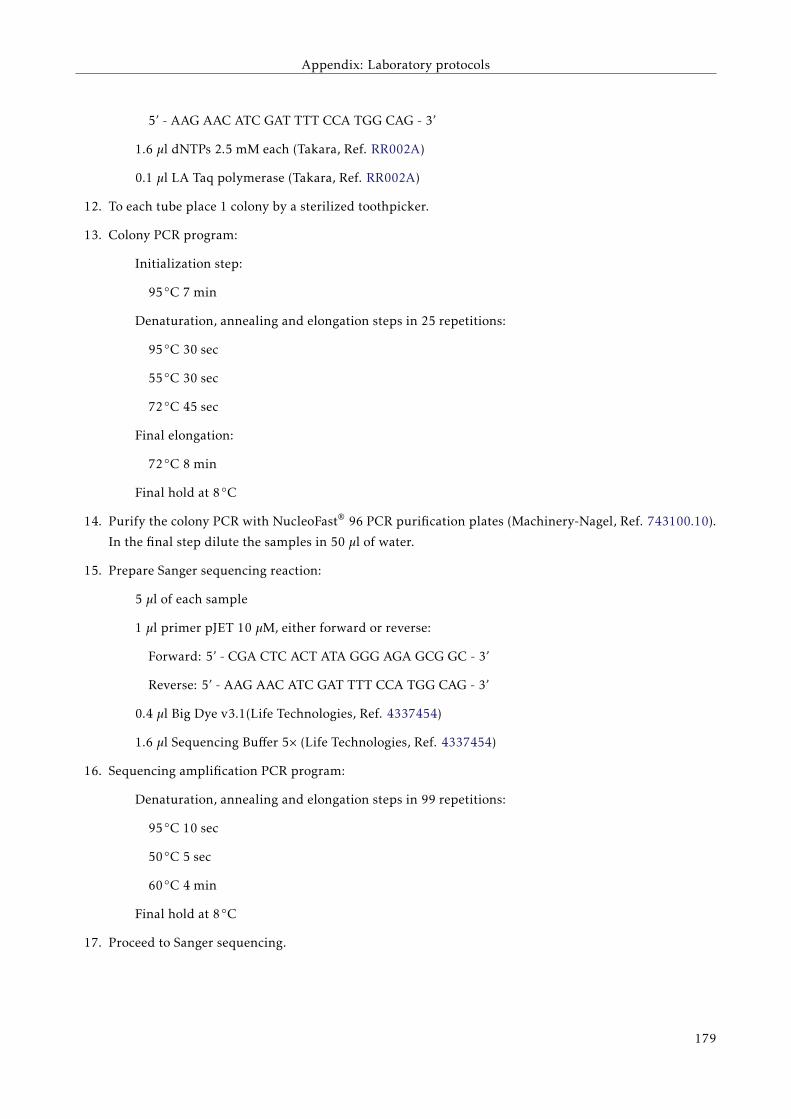
Appendix: Laboratory protocols
5’ - AAG AAC ATC GAT TTT CCA TGG CAG - 3’
1.6 µl dNTPs 2.5 mM each (Takara, Ref. RR002A)
0.1 µl LA Taq polymerase (Takara, Ref. RR002A)
12. To each tube place 1 colony by a sterilized toothpicker.
13. Colony PCR program:
Initialization step:
95◦C 7 min
Denaturation, annealing and elongation steps in 25 repetitions:
95◦C 30 sec
55◦C 30 sec
72◦C 45 sec
Final elongation:
72◦C 8 min
Final hold at 8◦C
14. Purify the colony PCR with NucleoFast® 96 PCR purification plates (Machinery-Nagel, Ref. 743100.10).
In the final step dilute the samples in 50 µl of water.
15. Prepare Sanger sequencing reaction:
5 µl of each sample
1 µl primer pJET 10 µM, either forward or reverse:
Forward: 5’ - CGA CTC ACT ATA GGG AGA GCG GC - 3’
Reverse: 5’ - AAG AAC ATC GAT TTT CCA TGG CAG - 3’
0.4 µl Big Dye v3.1(Life Technologies, Ref. 4337454)
1.6 µl Sequencing Buffer 5× (Life Technologies, Ref. 4337454)
16. Sequencing amplification PCR program:
Denaturation, annealing and elongation steps in 99 repetitions:
95◦C 10 sec
50◦C 5 sec
60◦C 4 min
Final hold at 8◦C
17. Proceed to Sanger sequencing.
179
Appendix: Laboratory protocols
11.3 Collection and fixation of bacterial cellsfrom fecal samples
1. Work with fresh fecal samples, or samples stored at −80◦C.
2. In a 50 ml tube, resuspend 5 ml of the fecal samples in 30 ml of ice cold salt solution (0.9 % NaCl) by
vortexing.
3. Centrifuge at 2,000 g for 2 min at 4◦C.
4. Transfer the supernatant to a new 50 ml tube.
5. Centrifuge the cells for 10 minutes at 4,000 g at 4◦C.
6. Remove the supernatant.
7. Resupend the cell pellet in 30 ml of ice cold salt solution containing 3.7 % of formaldehyde.
8. Let the sample incubate on ice for 1 hour.
9. Centrifuge at 4,000 g for 10 min at 4◦C.
10. Discard the supernatant.
11. Resuspend the pellet in 30 ml of ice cold salt solution and centrifuge again by the same conditions.
12. Resuspend the pellet in about 15 ml of salt solution and store at 4◦C for further use. Eventually, the cells
can be stored at −20◦C.
180

Appendix: Laboratory protocols
11.4 Cultivation and fixation of C. difficile1. Prepare Reinforced Clostridial Media (Oxoid, Ref: CM0149) by resuspending 38 g in 1 l of water and
autoclave it.
2. After cooling down the media, add 1 ml of L-cystein (Sigma-Aldrich, Ref. C1276-10G) prepared to
concentration 0.2g/ml and sterilized by filtration.
3. Transfer 9 ml of the media into anaerobic hungate culture tubes (Chemglass Life Sciences, Ref. CLS-
4208) and close the tubes.
4. Prepare one culture tube with indicator of oxigen: Via injection introduce 10 µl of resazurin (Sigma-
Aldrich, Ref. 199303-1G). The culture tube will turn violet. Do not add resazurin to all tubes, as it
interferes with fluorescent dyes.
5. Replace the oxigen in the tubes by introducing nitrogen from compressed nitrogen bomb. Conduce the
nitrogen from the bomb via plastic tube attached to a needle and allow the release of oxigen from the
hungate culture tube via another needle. Let flow the nitrogen inside about 10 seconds and invert the
tube several times to mix nitrogen with the media.
6. Wait until the oxigen control tube turns from violet color to original media color (transparent). It takes
30 - 60 minutes.
7. Inject C. difficile and cultivate at least 17 hours or more. When the density of cells increases, add 1 ml of
37 % formaldehyde for cell fixation and let incubate at 4◦C for at least 1 hour.
8. Transfer the cells into 50 ml plastic tubes.
9. Add 20 ml of salt solution (0.9 % NaCl).
10. Centrifuge at 4000 g for 10 min at 4◦C.
11. Discard the supernatant.
12. Resuspend the pellet in 30 ml of ice cold salt solution and centrifuge again by the same conditions.
13. Resuspend the pellet at about 15 ml of salt solution and store at 4◦C for further use. Eventually, the cells
can be stored at −20◦C.
181
Appendix: Laboratory protocols
11.5 Extraction of DNA from bacterial samples1. Perform the extraction in laminar flow cabin and sterilize all the buffers by filtration throught 0.2 µm
pores filters.
2. Work with low amount of bacterial cells, the cell pellet volume should be maximally 5 µl. The cells
should be resuspended in 220 µl PBS. Preparation of PBS:
8 g NaCl
0.2 g KCl
1.44 g Na2HPO4
0.24 g KH2PO4
Add 1 liter of water
3. Add 350 µl lysozyme (Sigma-Aldrich, Ref. L6876-1G)10mg/ml and incubate 30 min at 37◦C.
4. Add 30 µl of 10 % SDS and incubate 30 min at 50◦C.
5. Add 1.6 µl of proteinase K at concentration 50mg/ml (Sigma-Aldrich, Ref. P2308-25MG) and continue
incubating at 50◦C for 30 min.
6. Add 100 µl of 5M NaCl and 80 µl of CTAB (10 % in NaCl) and incubate 15 min at 65◦C.
7. Add 700 µl phenol:chloroform:isoamylalcohol (Sigma-Aldrich, Ref. P2069-100ML) and vortex for 1 min.
8. Centrifuge for 3 min at maximum speed.
9. Tranfer the supernatant to a new tube containing 700 µl chloroform and vortex for 1 min.
10. Centrifuge for 5 min at maximum speed.
11. Transfer the supernatant to a new tube containing 220 µl 5M NH4-acetate and mix by inverting the tube
up and down.
12. Add 1 µl of glycogen (Roche, Ref. 10901393001). Mix by inverting the tube up and down.
13. Add 500 µl isopropanol and vortex.
14. Incubate for 10 min at room temperature, vortex again and then store for 2-18 hours at −80◦C.
15. Centrifuge 45 min at 4◦C at 13,000 g.
16. Remove supernatant. Add 500 µl of 70 % ethanol. Vortex and centrifuge at maximum speed 10 min at
4◦C.
17. Discard the supernatant and centrifuge shortly to collect and discard all remaining ethanol.
18. Let remaining ethanol dry out, cca 30 min at room temperature at laminar flow cabin.
19. Resuspend in 100 µl water and vortex.
20. Store at 4◦C or at −20◦C for long-term storage.
182
Appendix: Laboratory protocols
11.6 Hybridization of bacteria by specific 16SrDNA probes
1. For hybridization of fecal bacteria, work with cells isolated and fixed according to the protocol 11.3. For
hybridization of C. difficile as positive/negative controls, cultivate and fix C. difficile as described in the
section 11.4. The protocol can be adapted for other bacterial species, too.
2. Prepare 1.5 ml tubes with 1 ml of fixed cells with the optical density 600 = 0.5 (equals approximatelly to
a pellet of volume 10 µl after centrifugation). Always prepare one negative control which will undergo
the same protocol, but will be not hybridized with fluorescent probes. Moreover, an additional negative
sample can be prepared: it will undergo the same hybridization protocol but without flourescent probes
and only cellular DNA stain will be added.
3. Centrifuge the samples at 13,000 g for 5 min at 4◦C and remove the supernatant.
4. After centrifugation, add 200 µl of ice-cold lysozime solution, which consists from:
100 µl salt solution (0.9 % NaCl)
40 µl 1M Tris-HCl
60 µl lysozime (10mg/ml)
5. Incubate at 37◦C for 7 minutes. Put immediatelly on ice.
6. Add 1 ml of ice cold salt solution, vortex and centrifuge at 13,000 g for 5 min at 4◦C and repeat twice.
After the third centrifugation, do not add salt solution.
7. Prepare hybridization solution (100 µl per sample):
12.9 µl water
40 µl formamide
2 µl 1M Tris-HCl
45 µl 2M NaCl
0.1 µl 10 % SDS
8. Prepare wash solution for probe removal (1 ml per sample):
529 µl water
20 µl 1M Tris-HCl
450 µl 2M NaCl
1 µl 10 % SDS
9. Preheat the wash solution to 56◦C.
10. Add 100 µl of hybridization solution containing 10 µl of probe (the final concentration of probe will be
0.5 µg/ml) to the positive samples. Do not add any probes to the negative samples.
183
Appendix: Laboratory protocols
11. Incubate the samples at 54◦C for 3 hours. Cover the thermoblock by an aluminium foil or perform it at
dark. Allow thermoblock shaking, if possible.
12. After 3 hours, add 1 ml of preheated wash solution and rise the temperature to 56◦C. Incubate at 56◦C
for 15 minutes. Cover the thermoblock by an aluminium foil.
13. Centrifuge at 13,000 g for 5 minutes.
14. Discard the supernatant and add 1 ml of salt solution. Vortex. Repeat the centrifugation and discard the
supernatant.
15. After the second centrifugation, resuspend the cell pellet in 1 ml of salt solution.
16. If staining of livining cells is required, add 10 µl of SYTO®62 at concentration 50 µM (Invitrogen, Ref.
S11344).
17. In the flow cytometer, set the negative gates according to the negative control (without probes) and
the second negative control stained with SYTO®62 only. The fluorescent area should be determined by
comparison with the stained bacterial culture, but the sorting gate should be adjusted according to the
comparison with the non-hybridized fecal sample, too.
18. Sort at least 10,000 fluorescent cells.
184
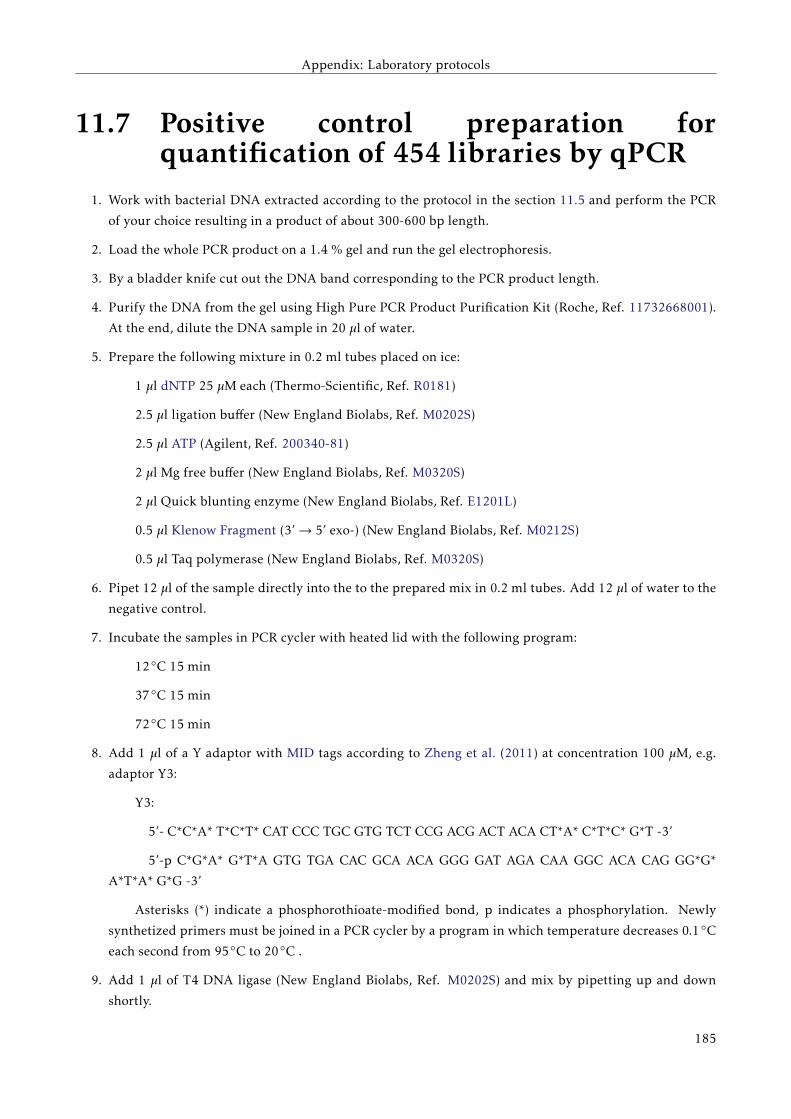
Appendix: Laboratory protocols
11.7 Positive control preparation forquantification of 454 libraries by qPCR
1. Work with bacterial DNA extracted according to the protocol in the section 11.5 and perform the PCR
of your choice resulting in a product of about 300-600 bp length.
2. Load the whole PCR product on a 1.4 % gel and run the gel electrophoresis.
3. By a bladder knife cut out the DNA band corresponding to the PCR product length.
4. Purify the DNA from the gel using High Pure PCR Product Purification Kit (Roche, Ref. 11732668001).
At the end, dilute the DNA sample in 20 µl of water.
5. Prepare the following mixture in 0.2 ml tubes placed on ice:
1 µl dNTP 25 µM each (Thermo-Scientific, Ref. R0181)
2.5 µl ligation buffer (New England Biolabs, Ref. M0202S)
2.5 µl ATP (Agilent, Ref. 200340-81)
2 µl Mg free buffer (New England Biolabs, Ref. M0320S)
2 µl Quick blunting enzyme (New England Biolabs, Ref. E1201L)
0.5 µl Klenow Fragment (3’→ 5’ exo-) (New England Biolabs, Ref. M0212S)
0.5 µl Taq polymerase (New England Biolabs, Ref. M0320S)
6. Pipet 12 µl of the sample directly into the to the prepared mix in 0.2 ml tubes. Add 12 µl of water to the
negative control.
7. Incubate the samples in PCR cycler with heated lid with the following program:
12◦C 15 min
37◦C 15 min
72◦C 15 min
8. Add 1 µl of a Y adaptor with MID tags according to Zheng et al. (2011) at concentration 100 µM, e.g.
adaptor Y3:
Y3:
5’- C*C*A* T*C*T* CAT CCC TGC GTG TCT CCG ACG ACT ACA CT*A* C*T*C* G*T -3’
5’-p C*G*A* G*T*A GTG TGA CAC GCA ACA GGG GAT AGA CAA GGC ACA CAG GG*G*
A*T*A* G*G -3’
Asterisks (*) indicate a phosphorothioate-modified bond, p indicates a phosphorylation. Newly
synthetized primers must be joined in a PCR cycler by a program in which temperature decreases 0.1◦C
each second from 95◦C to 20◦C .
9. Add 1 µl of T4 DNA ligase (New England Biolabs, Ref. M0202S) and mix by pipetting up and down
shortly.
185

Appendix: Laboratory protocols
10. Incubate at 12◦C overnight in a PCR cycler.
11. After incubation, bring the sample volume to 50 µl with water. Then remove possible self-ligated
adaptors with Agencourt AMPure Beads XP ® (Beckman Coulter, Ref. A63880) as described in the section
11.9.
12. Prepare premix for PCR with emPCR primers:
1 µl of the sample purified by magnetic beads.
1 µl of forward emPCR primer:
5’- CCA TCT CAT CCC TGC GTG TC -3’
1 µl of reverse emPCR primer:
5’- CCT ATC CCC TGT GTG CCT TG -3’
9.5 µl of water
12.5 µl GoTaq Green polymerase (Promega, Ref. M791A)
13. Incubate the samples in a PCR cycler with the following program:
Initialization step:
94◦C 2 min
Denaturation, annealing and elongation steps in 30 repetitions:
94◦C 30 sec
60◦C 1 min
72◦C 2 min
Final elongation:
72◦C 8 min
Final hold at 4◦C
14. Load the whole volume on a 1.4 % gel.
15. Extract the PCR product band from the agarose gel and clone as described in the protocol section 11.2.
16. After confirmation by Sanger sequencing that the colony PCR product is inserted correctly and its exact
size is known, amplify the rest of colony PCR product by PCR with emPCR primers as described above.
17. Purify the sample by Agencourt AMPure Beads XP® (Beckman Coulter, Ref. A63880) as described in the
protocol section 11.9.
18. Quantify the purified PCR product by the Picogreen assay (Life Technologies, Ref.P11496).
186
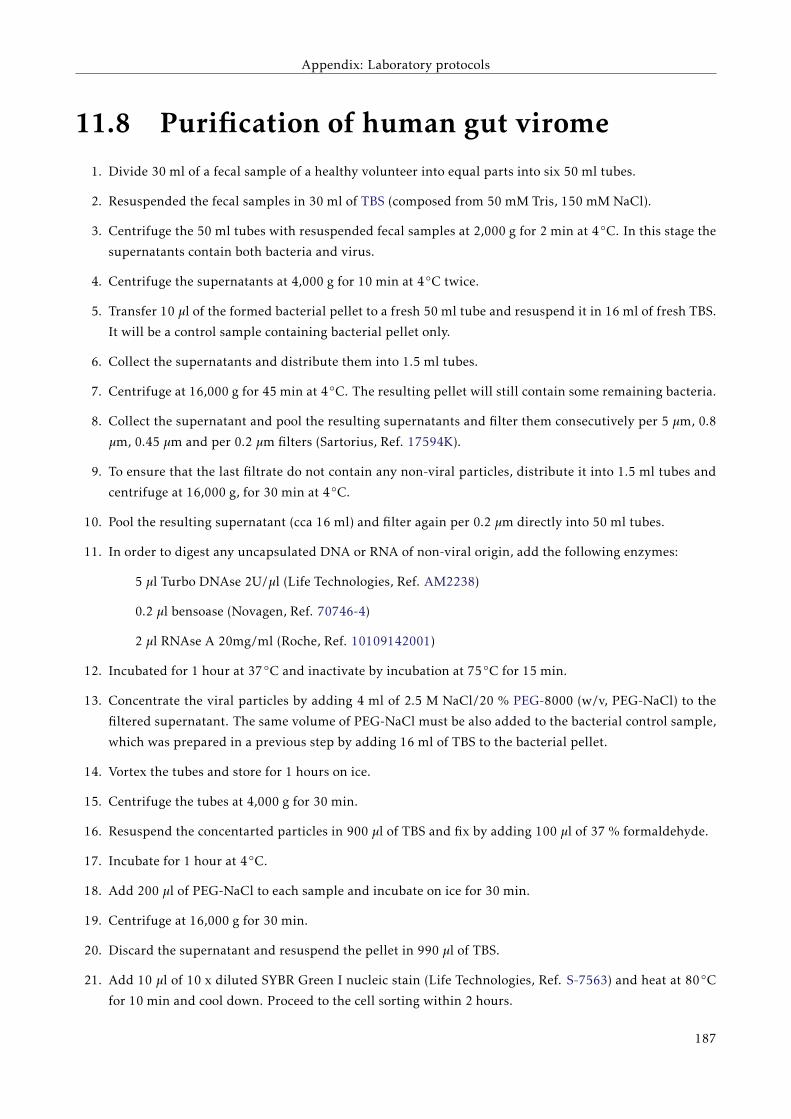
Appendix: Laboratory protocols
11.8 Purification of human gut virome1. Divide 30 ml of a fecal sample of a healthy volunteer into equal parts into six 50 ml tubes.
2. Resuspended the fecal samples in 30 ml of TBS (composed from 50 mM Tris, 150 mM NaCl).
3. Centrifuge the 50 ml tubes with resuspended fecal samples at 2,000 g for 2 min at 4◦C. In this stage the
supernatants contain both bacteria and virus.
4. Centrifuge the supernatants at 4,000 g for 10 min at 4◦C twice.
5. Transfer 10 µl of the formed bacterial pellet to a fresh 50 ml tube and resuspend it in 16 ml of fresh TBS.
It will be a control sample containing bacterial pellet only.
6. Collect the supernatants and distribute them into 1.5 ml tubes.
7. Centrifuge at 16,000 g for 45 min at 4◦C. The resulting pellet will still contain some remaining bacteria.
8. Collect the supernatant and pool the resulting supernatants and filter them consecutively per 5 µm, 0.8
µm, 0.45 µm and per 0.2 µm filters (Sartorius, Ref. 17594K).
9. To ensure that the last filtrate do not contain any non-viral particles, distribute it into 1.5 ml tubes and
centrifuge at 16,000 g, for 30 min at 4◦C.
10. Pool the resulting supernatant (cca 16 ml) and filter again per 0.2 µm directly into 50 ml tubes.
11. In order to digest any uncapsulated DNA or RNA of non-viral origin, add the following enzymes:
5 µl Turbo DNAse 2U/µl (Life Technologies, Ref. AM2238)
0.2 µl bensoase (Novagen, Ref. 70746-4)
2 µl RNAse A 20mg/ml (Roche, Ref. 10109142001)
12. Incubated for 1 hour at 37◦C and inactivate by incubation at 75◦C for 15 min.
13. Concentrate the viral particles by adding 4 ml of 2.5 M NaCl/20 % PEG-8000 (w/v, PEG-NaCl) to the
filtered supernatant. The same volume of PEG-NaCl must be also added to the bacterial control sample,
which was prepared in a previous step by adding 16 ml of TBS to the bacterial pellet.
14. Vortex the tubes and store for 1 hours on ice.
15. Centrifuge the tubes at 4,000 g for 30 min.
16. Resuspend the concentarted particles in 900 µl of TBS and fix by adding 100 µl of 37 % formaldehyde.
17. Incubate for 1 hour at 4◦C.
18. Add 200 µl of PEG-NaCl to each sample and incubate on ice for 30 min.
19. Centrifuge at 16,000 g for 30 min.
20. Discard the supernatant and resuspend the pellet in 990 µl of TBS.
21. Add 10 µl of 10 x diluted SYBR Green I nucleic stain (Life Technologies, Ref. S-7563) and heat at 80◦C
for 10 min and cool down. Proceed to the cell sorting within 2 hours.
187
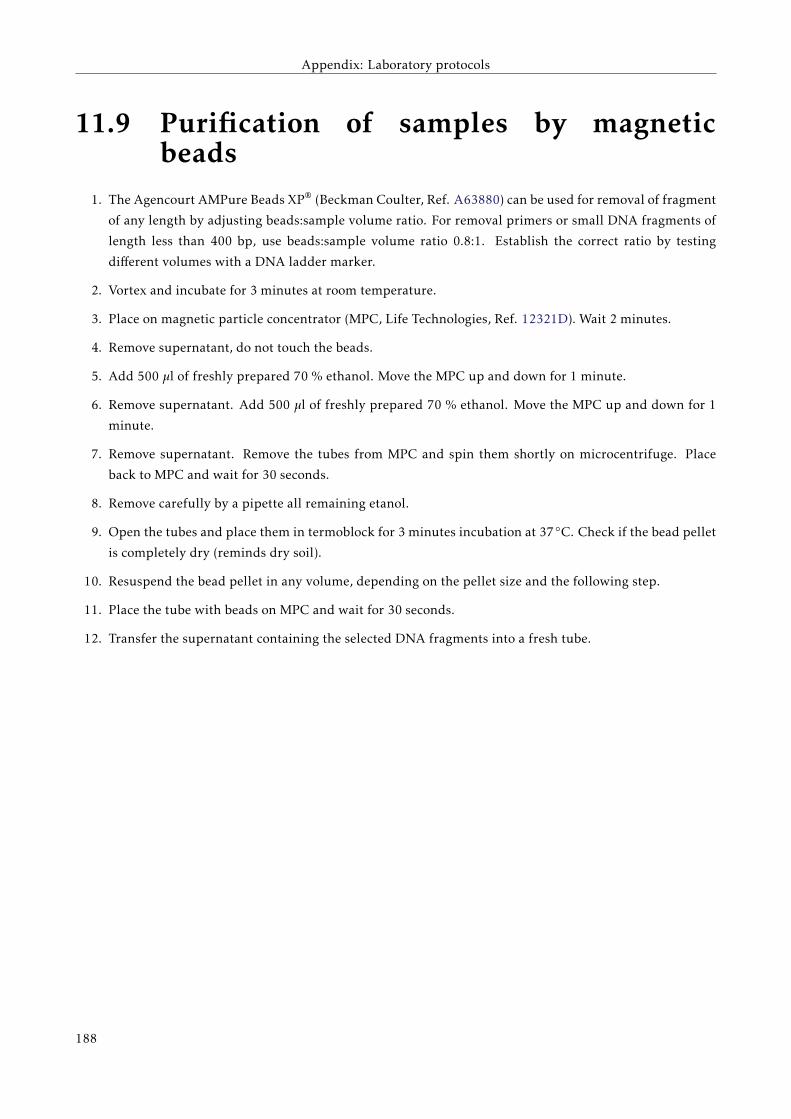
Appendix: Laboratory protocols
11.9 Purification of samples by magneticbeads
1. The Agencourt AMPure Beads XP® (Beckman Coulter, Ref. A63880) can be used for removal of fragment
of any length by adjusting beads:sample volume ratio. For removal primers or small DNA fragments of
length less than 400 bp, use beads:sample volume ratio 0.8:1. Establish the correct ratio by testing
different volumes with a DNA ladder marker.
2. Vortex and incubate for 3 minutes at room temperature.
3. Place on magnetic particle concentrator (MPC, Life Technologies, Ref. 12321D). Wait 2 minutes.
4. Remove supernatant, do not touch the beads.
5. Add 500 µl of freshly prepared 70 % ethanol. Move the MPC up and down for 1 minute.
6. Remove supernatant. Add 500 µl of freshly prepared 70 % ethanol. Move the MPC up and down for 1
minute.
7. Remove supernatant. Remove the tubes from MPC and spin them shortly on microcentrifuge. Place
back to MPC and wait for 30 seconds.
8. Remove carefully by a pipette all remaining etanol.
9. Open the tubes and place them in termoblock for 3 minutes incubation at 37◦C. Check if the bead pellet
is completely dry (reminds dry soil).
10. Resuspend the bead pellet in any volume, depending on the pellet size and the following step.
11. Place the tube with beads on MPC and wait for 30 seconds.
12. Transfer the supernatant containing the selected DNA fragments into a fresh tube.
188
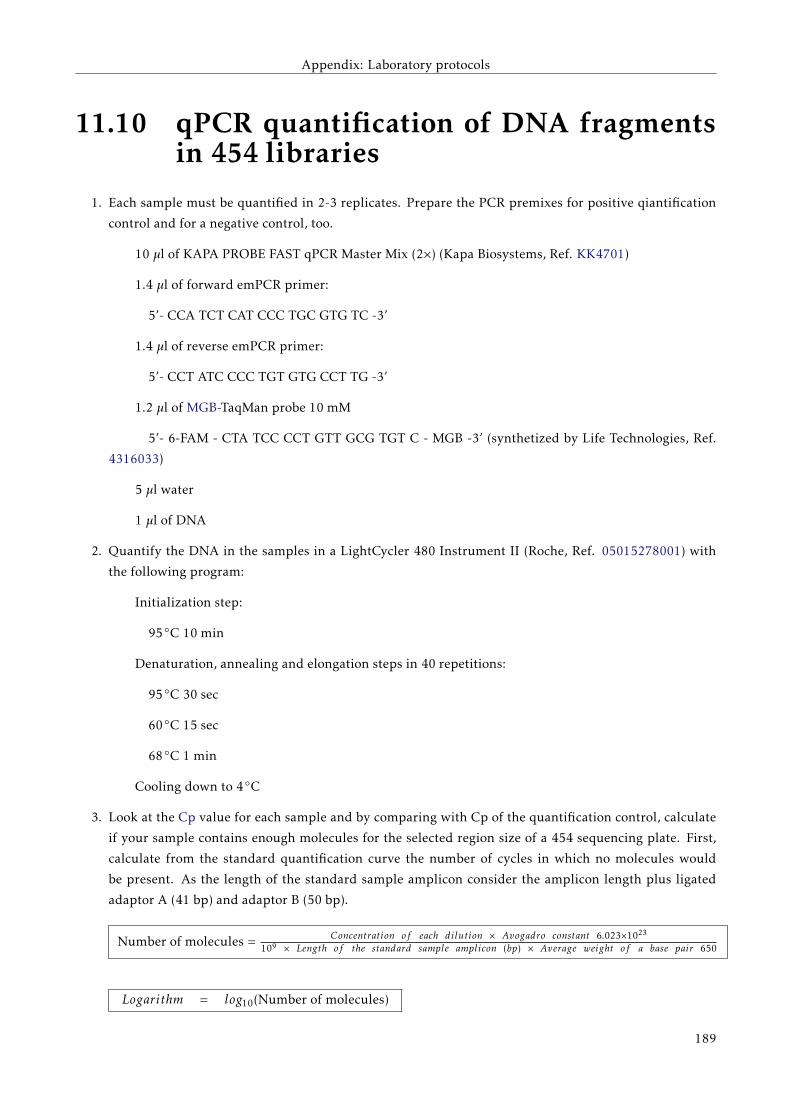
Appendix: Laboratory protocols
11.10 qPCR quantification of DNA fragmentsin 454 libraries
1. Each sample must be quantified in 2-3 replicates. Prepare the PCR premixes for positive qiantification
control and for a negative control, too.
10 µl of KAPA PROBE FAST qPCR Master Mix (2×) (Kapa Biosystems, Ref. KK4701)
1.4 µl of forward emPCR primer:
5’- CCA TCT CAT CCC TGC GTG TC -3’
1.4 µl of reverse emPCR primer:
5’- CCT ATC CCC TGT GTG CCT TG -3’
1.2 µl of MGB-TaqMan probe 10 mM
5’- 6-FAM - CTA TCC CCT GTT GCG TGT C - MGB -3’ (synthetized by Life Technologies, Ref.
4316033)
5 µl water
1 µl of DNA
2. Quantify the DNA in the samples in a LightCycler 480 Instrument II (Roche, Ref. 05015278001) with
the following program:
Initialization step:
95◦C 10 min
Denaturation, annealing and elongation steps in 40 repetitions:
95◦C 30 sec
60◦C 15 sec
68◦C 1 min
Cooling down to 4◦C
3. Look at the Cp value for each sample and by comparing with Cp of the quantification control, calculate
if your sample contains enough molecules for the selected region size of a 454 sequencing plate. First,
calculate from the standard quantification curve the number of cycles in which no molecules would
be present. As the length of the standard sample amplicon consider the amplicon length plus ligated
adaptor A (41 bp) and adaptor B (50 bp).
Number of molecules = Concentration of each dilution × Avogadro constant 6.023×10²³
109 × Length of the standard sample amplicon (bp) × Average weight of a base pair 650
Logarithm = log10(Number of molecules)
189
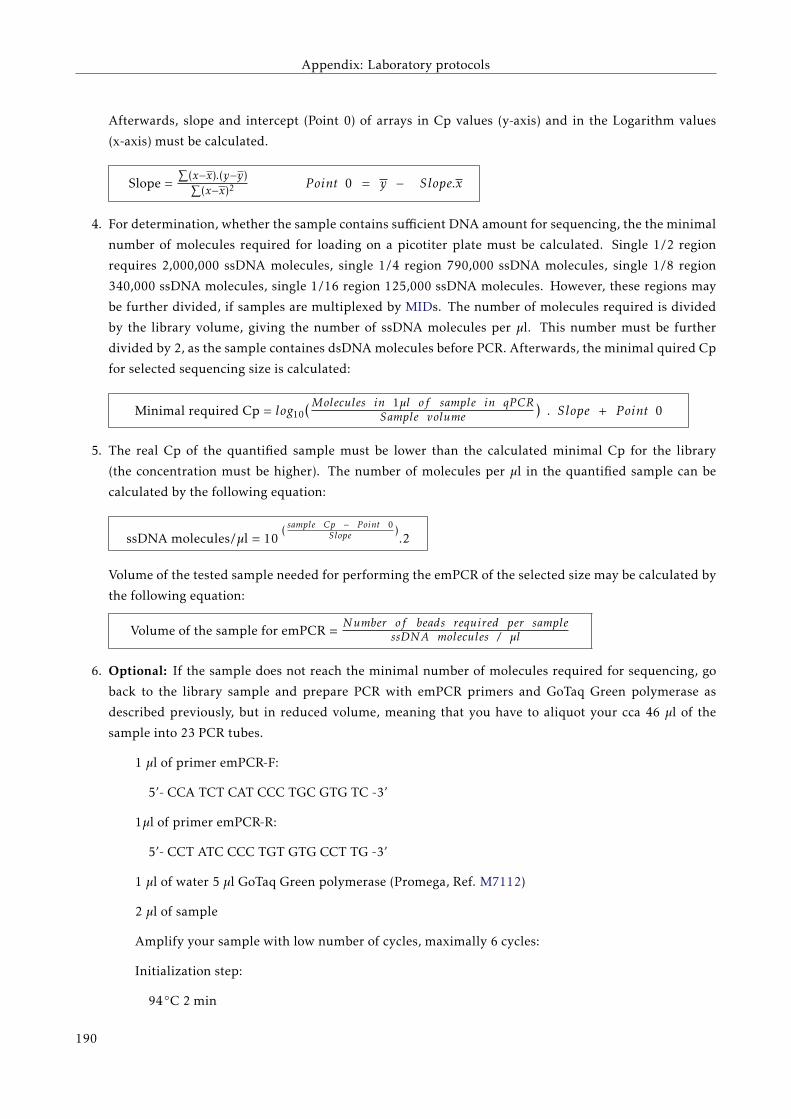
Appendix: Laboratory protocols
Afterwards, slope and intercept (Point 0) of arrays in Cp values (y-axis) and in the Logarithm values
(x-axis) must be calculated.
Slope =∑
(x−x).(y−y)∑(x−x)2 P oint 0 = y − Slope.x
4. For determination, whether the sample contains sufficient DNA amount for sequencing, the the minimal
number of molecules required for loading on a picotiter plate must be calculated. Single 1/2 region
requires 2,000,000 ssDNA molecules, single 1/4 region 790,000 ssDNA molecules, single 1/8 region
340,000 ssDNA molecules, single 1/16 region 125,000 ssDNA molecules. However, these regions may
be further divided, if samples are multiplexed by MIDs. The number of molecules required is divided
by the library volume, giving the number of ssDNA molecules per µl. This number must be further
divided by 2, as the sample containes dsDNA molecules before PCR. Afterwards, the minimal quired Cp
for selected sequencing size is calculated:
Minimal required Cp = log10(Molecules in 1µl of sample in qP CRSample volume ) . Slope + P oint 0
5. The real Cp of the quantified sample must be lower than the calculated minimal Cp for the library
(the concentration must be higher). The number of molecules per µl in the quantified sample can be
calculated by the following equation:
ssDNA molecules/µl = 10( sample Cp − P oint 0
Slope ).2
Volume of the tested sample needed for performing the emPCR of the selected size may be calculated by
the following equation:
Volume of the sample for emPCR =Number of beads required per sample
ssDNA molecules / µl
6. Optional: If the sample does not reach the minimal number of molecules required for sequencing, go
back to the library sample and prepare PCR with emPCR primers and GoTaq Green polymerase as
described previously, but in reduced volume, meaning that you have to aliquot your cca 46 µl of the
sample into 23 PCR tubes.
1 µl of primer emPCR-F:
5’- CCA TCT CAT CCC TGC GTG TC -3’
1µl of primer emPCR-R:
5’- CCT ATC CCC TGT GTG CCT TG -3’
1 µl of water 5 µl GoTaq Green polymerase (Promega, Ref. M7112)
2 µl of sample
Amplify your sample with low number of cycles, maximally 6 cycles:
Initialization step:
94◦C 2 min
190
Appendix: Laboratory protocols
Denaturation, annealing and elongation steps in maximally 6 repetitions:
94◦C 30 sec
60◦C 1 min
72◦C 2 min
Final elongation:
72◦C 8 min
Final hold at 4◦C
Pool the volumes of all PCR reactions and purify the pooled sample with Agencourt AMPure Beads
XP® as described previously in protocol 11.9 . At the end resuspend the beads in 50 µl of water and
repeat the quantification by qPCR.
191
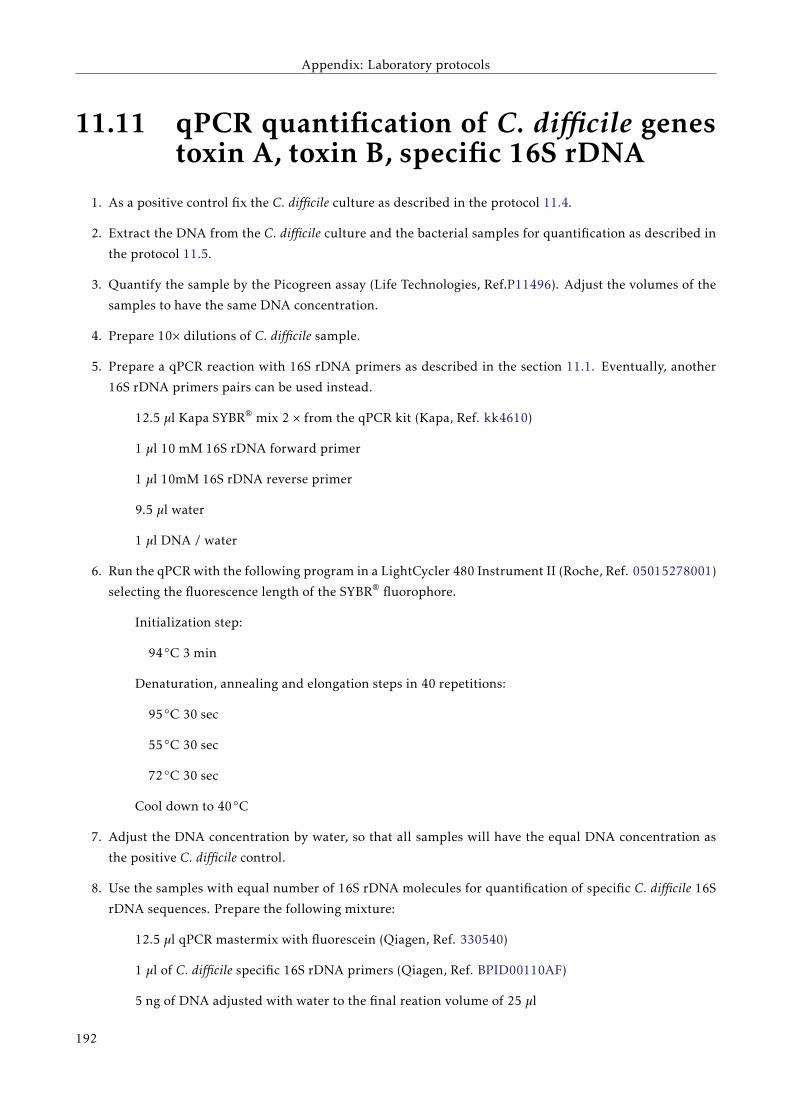
Appendix: Laboratory protocols
11.11 qPCR quantification of C. difficile genestoxin A, toxin B, specific 16S rDNA
1. As a positive control fix the C. difficile culture as described in the protocol 11.4.
2. Extract the DNA from the C. difficile culture and the bacterial samples for quantification as described in
the protocol 11.5.
3. Quantify the sample by the Picogreen assay (Life Technologies, Ref.P11496). Adjust the volumes of the
samples to have the same DNA concentration.
4. Prepare 10× dilutions of C. difficile sample.
5. Prepare a qPCR reaction with 16S rDNA primers as described in the section 11.1. Eventually, another
16S rDNA primers pairs can be used instead.
12.5 µl Kapa SYBR® mix 2 × from the qPCR kit (Kapa, Ref. kk4610)
1 µl 10 mM 16S rDNA forward primer
1 µl 10mM 16S rDNA reverse primer
9.5 µl water
1 µl DNA / water
6. Run the qPCR with the following program in a LightCycler 480 Instrument II (Roche, Ref. 05015278001)
selecting the fluorescence length of the SYBR® fluorophore.
Initialization step:
94◦C 3 min
Denaturation, annealing and elongation steps in 40 repetitions:
95◦C 30 sec
55◦C 30 sec
72◦C 30 sec
Cool down to 40◦C
7. Adjust the DNA concentration by water, so that all samples will have the equal DNA concentration as
the positive C. difficile control.
8. Use the samples with equal number of 16S rDNA molecules for quantification of specific C. difficile 16S
rDNA sequences. Prepare the following mixture:
12.5 µl qPCR mastermix with fluorescein (Qiagen, Ref. 330540)
1 µl of C. difficile specific 16S rDNA primers (Qiagen, Ref. BPID00110AF)
5 ng of DNA adjusted with water to the final reation volume of 25 µl
192
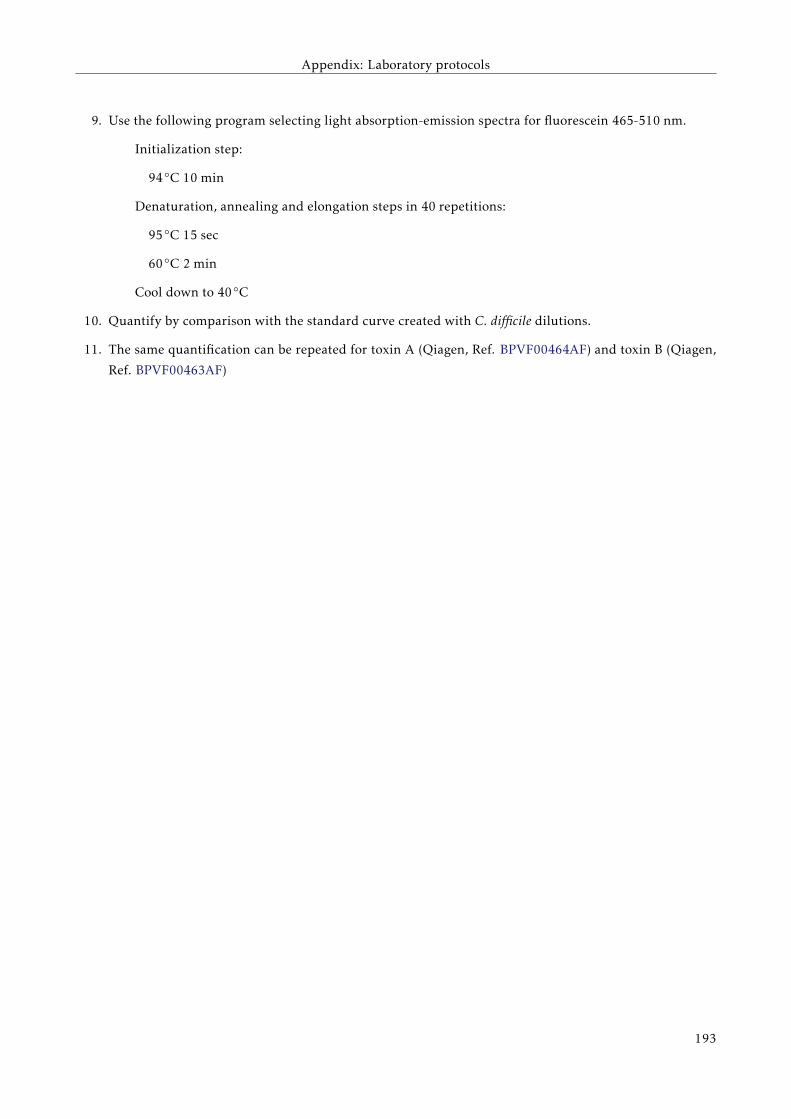
Appendix: Laboratory protocols
9. Use the following program selecting light absorption-emission spectra for fluorescein 465-510 nm.
Initialization step:
94◦C 10 min
Denaturation, annealing and elongation steps in 40 repetitions:
95◦C 15 sec
60◦C 2 min
Cool down to 40◦C
10. Quantify by comparison with the standard curve created with C. difficile dilutions.
11. The same quantification can be repeated for toxin A (Qiagen, Ref. BPVF00464AF) and toxin B (Qiagen,
Ref. BPVF00463AF)
193
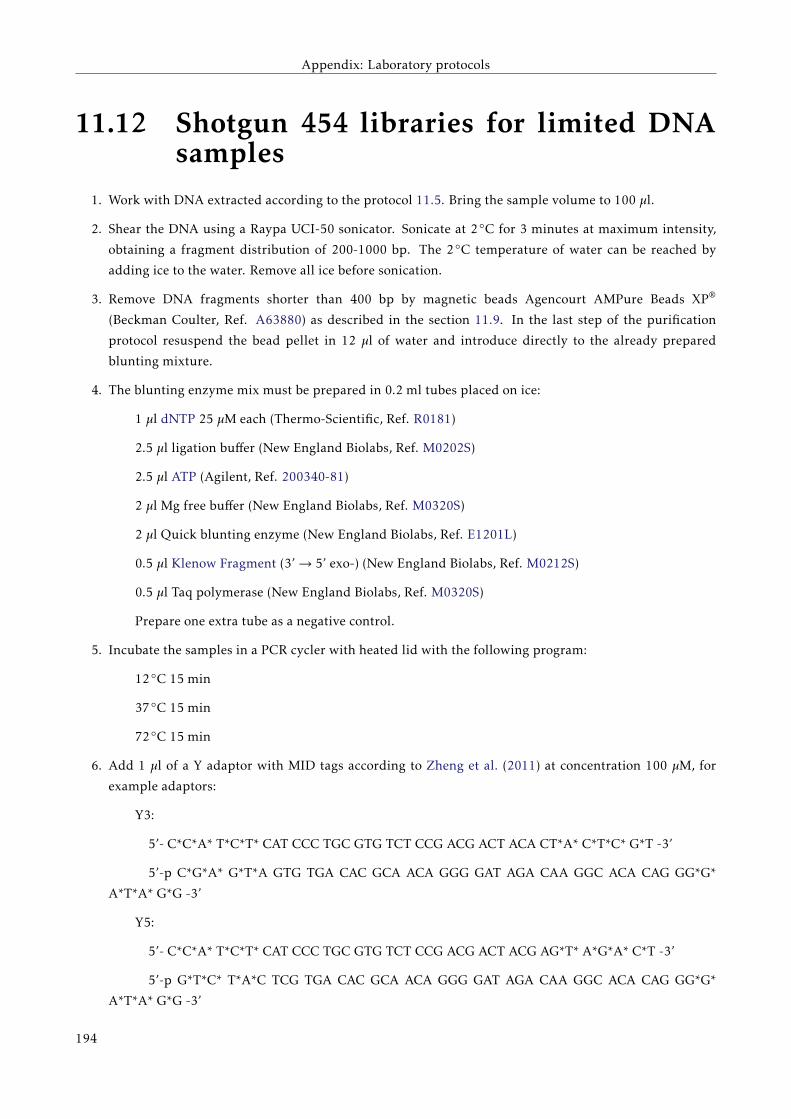
Appendix: Laboratory protocols
11.12 Shotgun 454 libraries for limited DNAsamples
1. Work with DNA extracted according to the protocol 11.5. Bring the sample volume to 100 µl.
2. Shear the DNA using a Raypa UCI-50 sonicator. Sonicate at 2◦C for 3 minutes at maximum intensity,
obtaining a fragment distribution of 200-1000 bp. The 2◦C temperature of water can be reached by
adding ice to the water. Remove all ice before sonication.
3. Remove DNA fragments shorter than 400 bp by magnetic beads Agencourt AMPure Beads XP®
(Beckman Coulter, Ref. A63880) as described in the section 11.9. In the last step of the purification
protocol resuspend the bead pellet in 12 µl of water and introduce directly to the already prepared
blunting mixture.
4. The blunting enzyme mix must be prepared in 0.2 ml tubes placed on ice:
1 µl dNTP 25 µM each (Thermo-Scientific, Ref. R0181)
2.5 µl ligation buffer (New England Biolabs, Ref. M0202S)
2.5 µl ATP (Agilent, Ref. 200340-81)
2 µl Mg free buffer (New England Biolabs, Ref. M0320S)
2 µl Quick blunting enzyme (New England Biolabs, Ref. E1201L)
0.5 µl Klenow Fragment (3’→ 5’ exo-) (New England Biolabs, Ref. M0212S)
0.5 µl Taq polymerase (New England Biolabs, Ref. M0320S)
Prepare one extra tube as a negative control.
5. Incubate the samples in a PCR cycler with heated lid with the following program:
12◦C 15 min
37◦C 15 min
72◦C 15 min
6. Add 1 µl of a Y adaptor with MID tags according to Zheng et al. (2011) at concentration 100 µM, for
example adaptors:
Y3:
5’- C*C*A* T*C*T* CAT CCC TGC GTG TCT CCG ACG ACT ACA CT*A* C*T*C* G*T -3’
5’-p C*G*A* G*T*A GTG TGA CAC GCA ACA GGG GAT AGA CAA GGC ACA CAG GG*G*
A*T*A* G*G -3’
Y5:
5’- C*C*A* T*C*T* CAT CCC TGC GTG TCT CCG ACG ACT ACG AG*T* A*G*A* C*T -3’
5’-p G*T*C* T*A*C TCG TGA CAC GCA ACA GGG GAT AGA CAA GGC ACA CAG GG*G*
A*T*A* G*G -3’
194
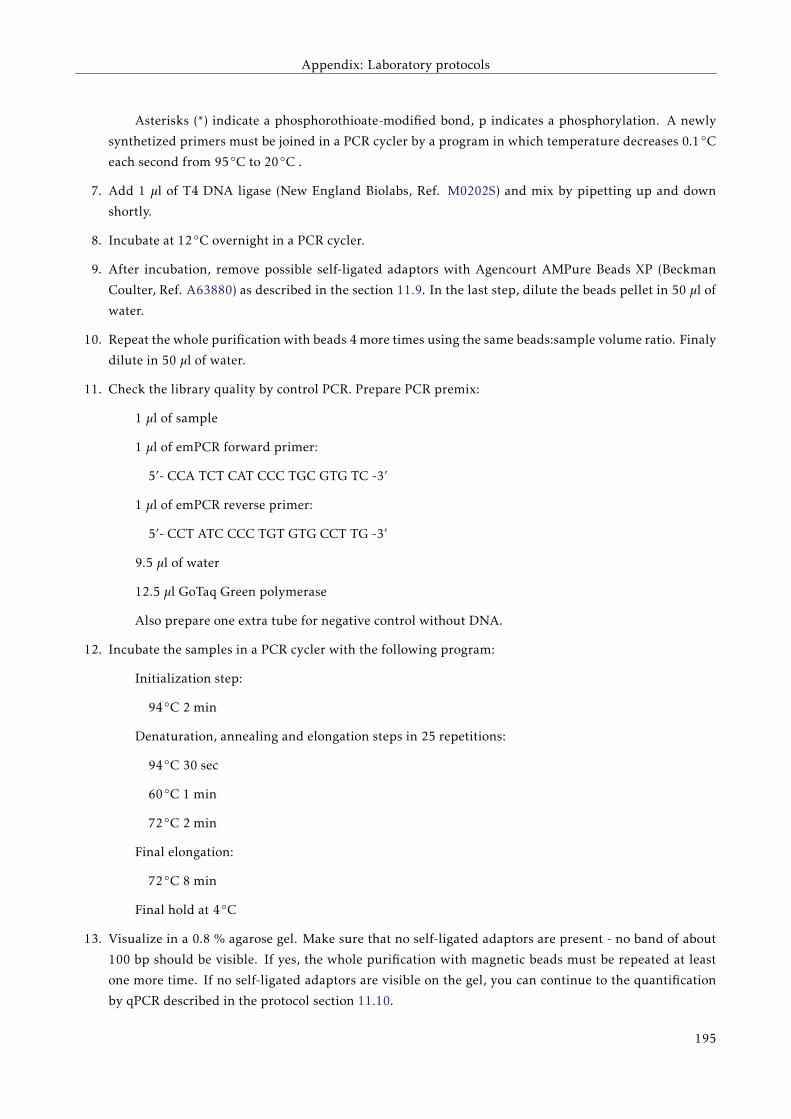
Appendix: Laboratory protocols
Asterisks (*) indicate a phosphorothioate-modified bond, p indicates a phosphorylation. A newly
synthetized primers must be joined in a PCR cycler by a program in which temperature decreases 0.1◦C
each second from 95◦C to 20◦C .
7. Add 1 µl of T4 DNA ligase (New England Biolabs, Ref. M0202S) and mix by pipetting up and down
shortly.
8. Incubate at 12◦C overnight in a PCR cycler.
9. After incubation, remove possible self-ligated adaptors with Agencourt AMPure Beads XP (Beckman
Coulter, Ref. A63880) as described in the section 11.9. In the last step, dilute the beads pellet in 50 µl of
water.
10. Repeat the whole purification with beads 4 more times using the same beads:sample volume ratio. Finaly
dilute in 50 µl of water.
11. Check the library quality by control PCR. Prepare PCR premix:
1 µl of sample
1 µl of emPCR forward primer:
5’- CCA TCT CAT CCC TGC GTG TC -3’
1 µl of emPCR reverse primer:
5’- CCT ATC CCC TGT GTG CCT TG -3’
9.5 µl of water
12.5 µl GoTaq Green polymerase
Also prepare one extra tube for negative control without DNA.
12. Incubate the samples in a PCR cycler with the following program:
Initialization step:
94◦C 2 min
Denaturation, annealing and elongation steps in 25 repetitions:
94◦C 30 sec
60◦C 1 min
72◦C 2 min
Final elongation:
72◦C 8 min
Final hold at 4◦C
13. Visualize in a 0.8 % agarose gel. Make sure that no self-ligated adaptors are present - no band of about
100 bp should be visible. If yes, the whole purification with magnetic beads must be repeated at least
one more time. If no self-ligated adaptors are visible on the gel, you can continue to the quantification
by qPCR described in the protocol section 11.10.
195
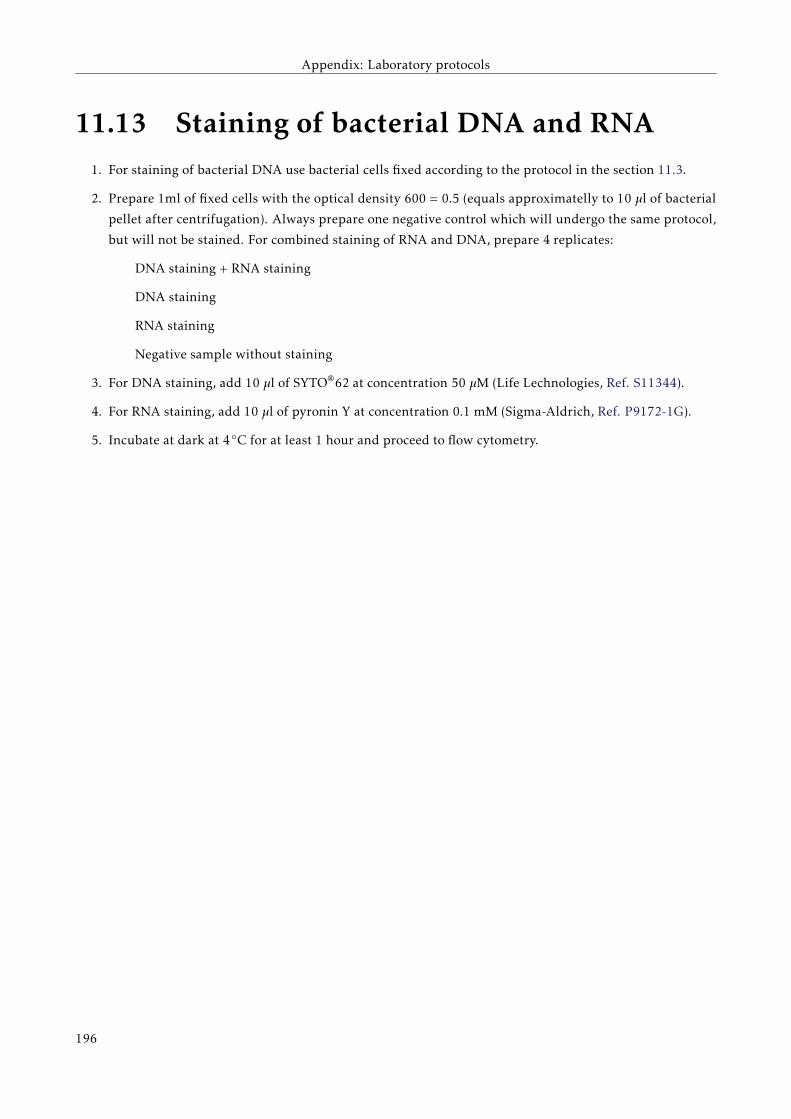
Appendix: Laboratory protocols
11.13 Staining of bacterial DNA and RNA1. For staining of bacterial DNA use bacterial cells fixed according to the protocol in the section 11.3.
2. Prepare 1ml of fixed cells with the optical density 600 = 0.5 (equals approximatelly to 10 µl of bacterial
pellet after centrifugation). Always prepare one negative control which will undergo the same protocol,
but will not be stained. For combined staining of RNA and DNA, prepare 4 replicates:
DNA staining + RNA staining
DNA staining
RNA staining
Negative sample without staining
3. For DNA staining, add 10 µl of SYTO®62 at concentration 50 µM (Life Lechnologies, Ref. S11344).
4. For RNA staining, add 10 µl of pyronin Y at concentration 0.1 mM (Sigma-Aldrich, Ref. P9172-1G).
5. Incubate at dark at 4◦C for at least 1 hour and proceed to flow cytometry.
196
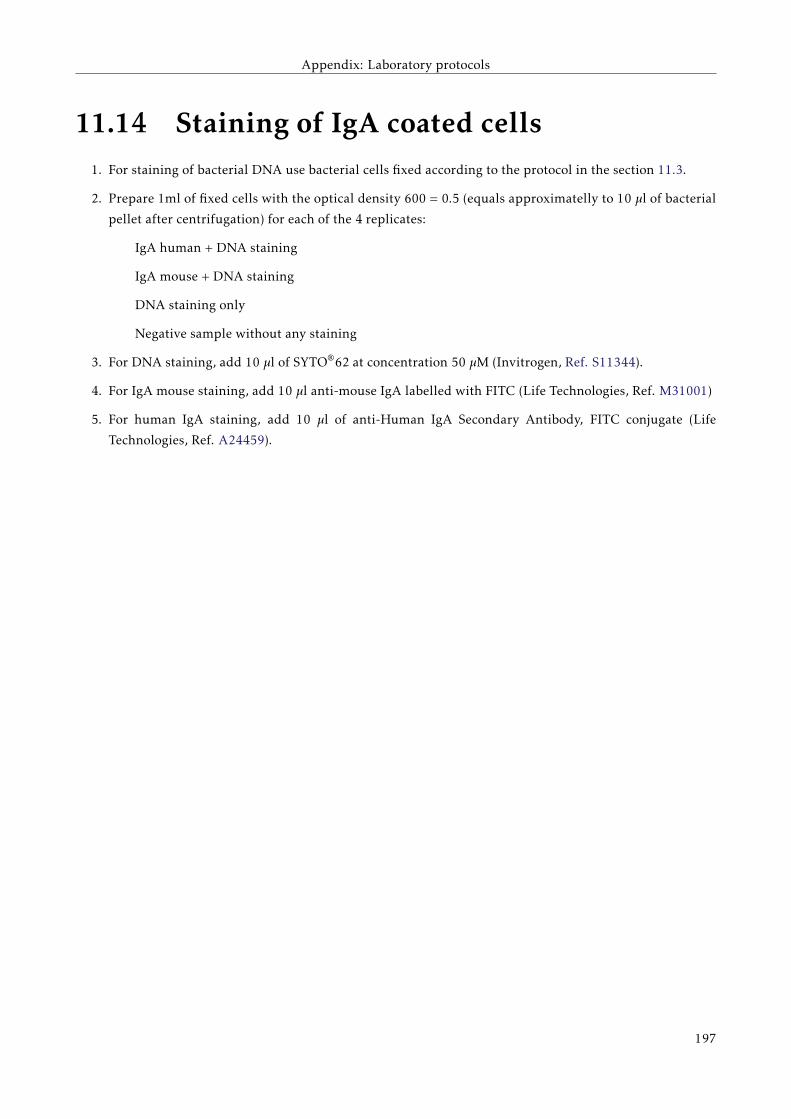
Appendix: Laboratory protocols
11.14 Staining of IgA coated cells1. For staining of bacterial DNA use bacterial cells fixed according to the protocol in the section 11.3.
2. Prepare 1ml of fixed cells with the optical density 600 = 0.5 (equals approximatelly to 10 µl of bacterial
pellet after centrifugation) for each of the 4 replicates:
IgA human + DNA staining
IgA mouse + DNA staining
DNA staining only
Negative sample without any staining
3. For DNA staining, add 10 µl of SYTO®62 at concentration 50 µM (Invitrogen, Ref. S11344).
4. For IgA mouse staining, add 10 µl anti-mouse IgA labelled with FITC (Life Technologies, Ref. M31001)
5. For human IgA staining, add 10 µl of anti-Human IgA Secondary Antibody, FITC conjugate (Life
Technologies, Ref. A24459).
197


Chapter12Appendix: Programming scripts

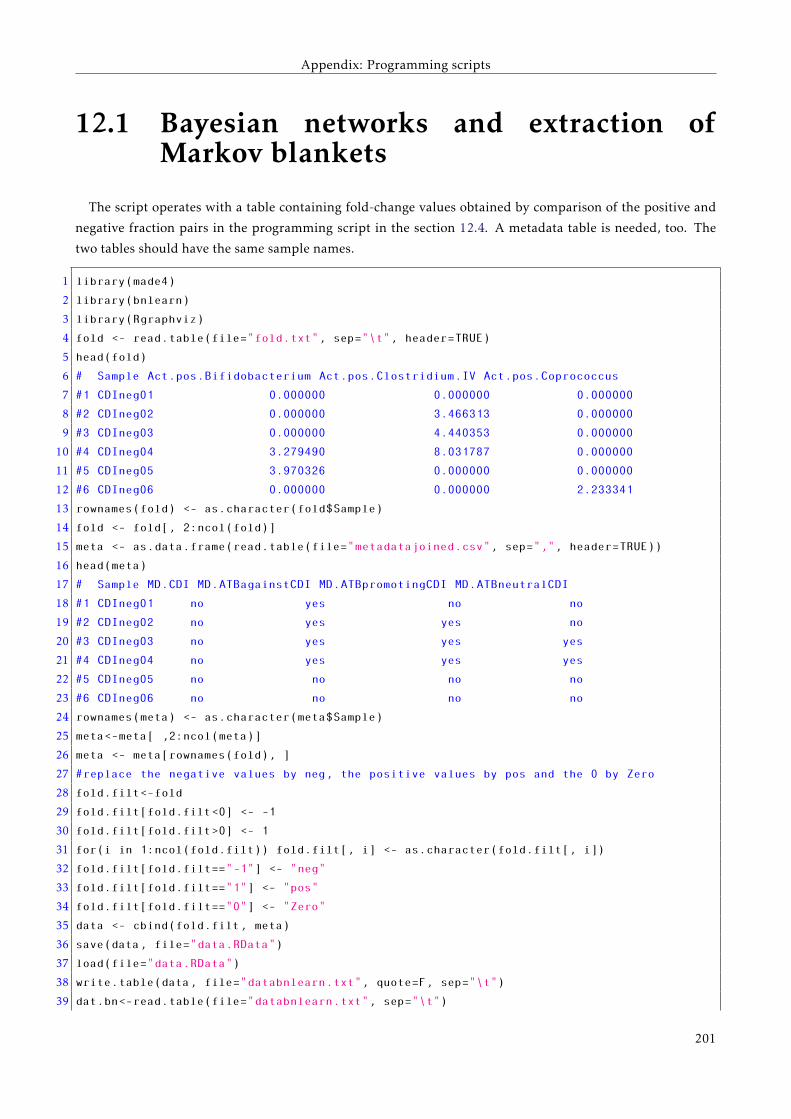
Appendix: Programming scripts
12.1 Bayesian networks and extraction ofMarkov blankets
The script operates with a table containing fold-change values obtained by comparison of the positive and
negative fraction pairs in the programming script in the section 12.4. A metadata table is needed, too. The
two tables should have the same sample names.
1 library(made4)
2 library(bnlearn)
3 library(Rgraphviz)
4 fold <- read.table(file="fold.txt", sep="\t", header=TRUE)
5 head(fold)
6 # Sample Act.pos.Bifidobacterium Act.pos.Clostridium.IV Act.pos.Coprococcus
7 #1 CDIneg01 0.000000 0.000000 0.000000
8 #2 CDIneg02 0.000000 3.466313 0.000000
9 #3 CDIneg03 0.000000 4.440353 0.000000
10 #4 CDIneg04 3.279490 8.031787 0.000000
11 #5 CDIneg05 3.970326 0.000000 0.000000
12 #6 CDIneg06 0.000000 0.000000 2.233341
13 rownames(fold) <- as.character(fold$Sample)
14 fold <- fold[, 2:ncol(fold)]
15 meta <- as.data.frame(read.table(file="metadatajoined.csv", sep=",", header=TRUE))
16 head(meta)
17 # Sample MD.CDI MD.ATBagainstCDI MD.ATBpromotingCDI MD.ATBneutralCDI
18 #1 CDIneg01 no yes no no
19 #2 CDIneg02 no yes yes no
20 #3 CDIneg03 no yes yes yes
21 #4 CDIneg04 no yes yes yes
22 #5 CDIneg05 no no no no
23 #6 CDIneg06 no no no no
24 rownames(meta) <- as.character(meta$Sample)
25 meta<-meta[ ,2:ncol(meta)]
26 meta <- meta[rownames(fold), ]
27 #replace the negative values by neg, the positive values by pos and the 0 by Zero
28 fold.filt<-fold
29 fold.filt[fold.filt<0] <- -1
30 fold.filt[fold.filt>0] <- 1
31 for(i in 1:ncol(fold.filt)) fold.filt[, i] <- as.character(fold.filt[, i])
32 fold.filt[fold.filt=="-1"] <- "neg"
33 fold.filt[fold.filt=="1"] <- "pos"
34 fold.filt[fold.filt=="0"] <- "Zero"
35 data <- cbind(fold.filt, meta)
36 save(data, file="data.RData")
37 load(file="data.RData")
38 write.table(data, file="databnlearn.txt", quote=F, sep="\t")
39 dat.bn<-read.table(file="databnlearn.txt", sep="\t")
201
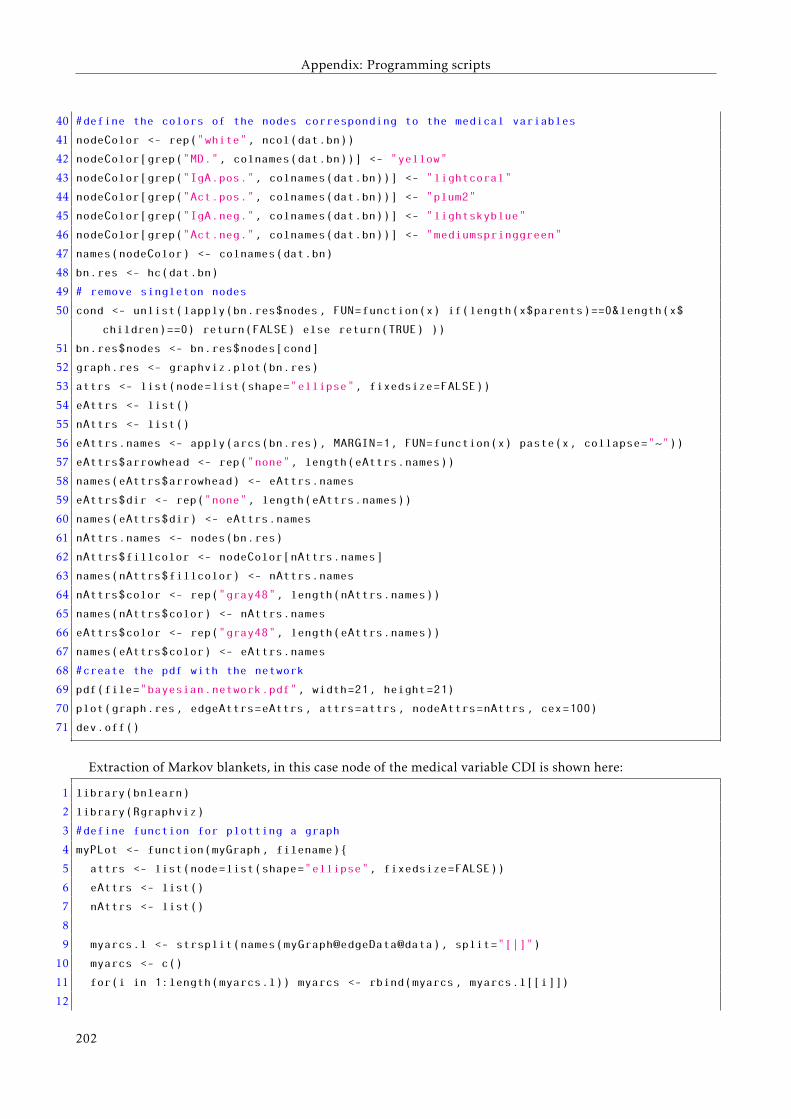
Appendix: Programming scripts
40 #define the colors of the nodes corresponding to the medical variables
41 nodeColor <- rep("white", ncol(dat.bn))
42 nodeColor[grep("MD.", colnames(dat.bn))] <- "yellow"
43 nodeColor[grep("IgA.pos.", colnames(dat.bn))] <- "lightcoral"
44 nodeColor[grep("Act.pos.", colnames(dat.bn))] <- "plum2"
45 nodeColor[grep("IgA.neg.", colnames(dat.bn))] <- "lightskyblue"
46 nodeColor[grep("Act.neg.", colnames(dat.bn))] <- "mediumspringgreen"
47 names(nodeColor) <- colnames(dat.bn)
48 bn.res <- hc(dat.bn)
49 # remove singleton nodes
50 cond <- unlist(lapply(bn.res$nodes, FUN=function(x) if(length(x$parents)==0&length(x$
children)==0) return(FALSE) else return(TRUE) ))
51 bn.res$nodes <- bn.res$nodes[cond]
52 graph.res <- graphviz.plot(bn.res)
53 attrs <- list(node=list(shape="ellipse", fixedsize=FALSE))
54 eAttrs <- list()
55 nAttrs <- list()
56 eAttrs.names <- apply(arcs(bn.res), MARGIN=1, FUN=function(x) paste(x, collapse="~"))
57 eAttrs$arrowhead <- rep("none", length(eAttrs.names))
58 names(eAttrs$arrowhead) <- eAttrs.names
59 eAttrs$dir <- rep("none", length(eAttrs.names))
60 names(eAttrs$dir) <- eAttrs.names
61 nAttrs.names <- nodes(bn.res)
62 nAttrs$fillcolor <- nodeColor[nAttrs.names]
63 names(nAttrs$fillcolor) <- nAttrs.names
64 nAttrs$color <- rep("gray48", length(nAttrs.names))
65 names(nAttrs$color) <- nAttrs.names
66 eAttrs$color <- rep("gray48", length(eAttrs.names))
67 names(eAttrs$color) <- eAttrs.names
68 #create the pdf with the network
69 pdf(file="bayesian.network.pdf", width=21, height=21)
70 plot(graph.res, edgeAttrs=eAttrs, attrs=attrs, nodeAttrs=nAttrs, cex=100)
71 dev.off()
Extraction of Markov blankets, in this case node of the medical variable CDI is shown here:
1 library(bnlearn)
2 library(Rgraphviz)
3 #define function for plotting a graph
4 myPLot <- function(myGraph, filename){
5 attrs <- list(node=list(shape="ellipse", fixedsize=FALSE))
6 eAttrs <- list()
7 nAttrs <- list()
8
9 myarcs.l <- strsplit(names(myGraph@edgeData@data), split="[|]")
10 myarcs <- c()
11 for(i in 1:length(myarcs.l)) myarcs <- rbind(myarcs, myarcs.l[[i]])
12
202
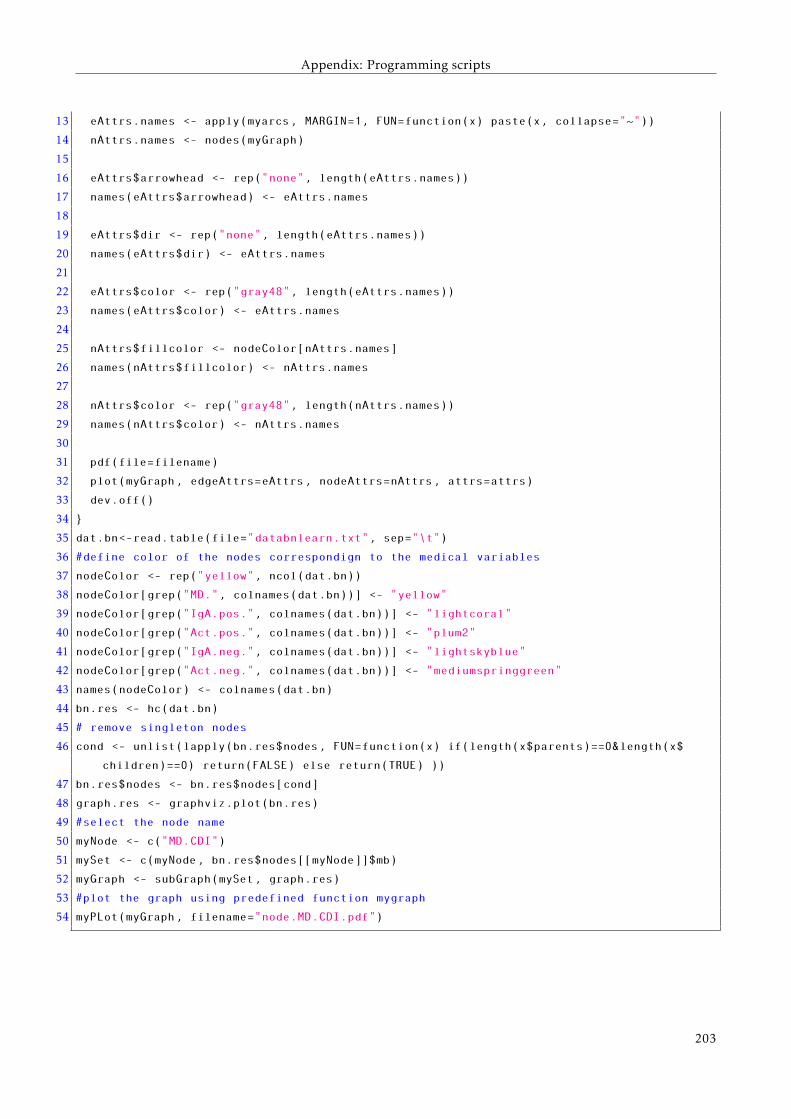
Appendix: Programming scripts
13 eAttrs.names <- apply(myarcs, MARGIN=1, FUN=function(x) paste(x, collapse="~"))
14 nAttrs.names <- nodes(myGraph)
15
16 eAttrs$arrowhead <- rep("none", length(eAttrs.names))
17 names(eAttrs$arrowhead) <- eAttrs.names
18
19 eAttrs$dir <- rep("none", length(eAttrs.names))
20 names(eAttrs$dir) <- eAttrs.names
21
22 eAttrs$color <- rep("gray48", length(eAttrs.names))
23 names(eAttrs$color) <- eAttrs.names
24
25 nAttrs$fillcolor <- nodeColor[nAttrs.names]
26 names(nAttrs$fillcolor) <- nAttrs.names
27
28 nAttrs$color <- rep("gray48", length(nAttrs.names))
29 names(nAttrs$color) <- nAttrs.names
30
31 pdf(file=filename)
32 plot(myGraph, edgeAttrs=eAttrs, nodeAttrs=nAttrs, attrs=attrs)
33 dev.off()
34 }
35 dat.bn<-read.table(file="databnlearn.txt", sep="\t")
36 #define color of the nodes correspondign to the medical variables
37 nodeColor <- rep("yellow", ncol(dat.bn))
38 nodeColor[grep("MD.", colnames(dat.bn))] <- "yellow"
39 nodeColor[grep("IgA.pos.", colnames(dat.bn))] <- "lightcoral"
40 nodeColor[grep("Act.pos.", colnames(dat.bn))] <- "plum2"
41 nodeColor[grep("IgA.neg.", colnames(dat.bn))] <- "lightskyblue"
42 nodeColor[grep("Act.neg.", colnames(dat.bn))] <- "mediumspringgreen"
43 names(nodeColor) <- colnames(dat.bn)
44 bn.res <- hc(dat.bn)
45 # remove singleton nodes
46 cond <- unlist(lapply(bn.res$nodes, FUN=function(x) if(length(x$parents)==0&length(x$
children)==0) return(FALSE) else return(TRUE) ))
47 bn.res$nodes <- bn.res$nodes[cond]
48 graph.res <- graphviz.plot(bn.res)
49 #select the node name
50 myNode <- c("MD.CDI")
51 mySet <- c(myNode, bn.res$nodes[[myNode]]$mb)
52 myGraph <- subGraph(mySet, graph.res)
53 #plot the graph using predefined function mygraph
54 myPLot(myGraph, filename="node.MD.CDI.pdf")
203
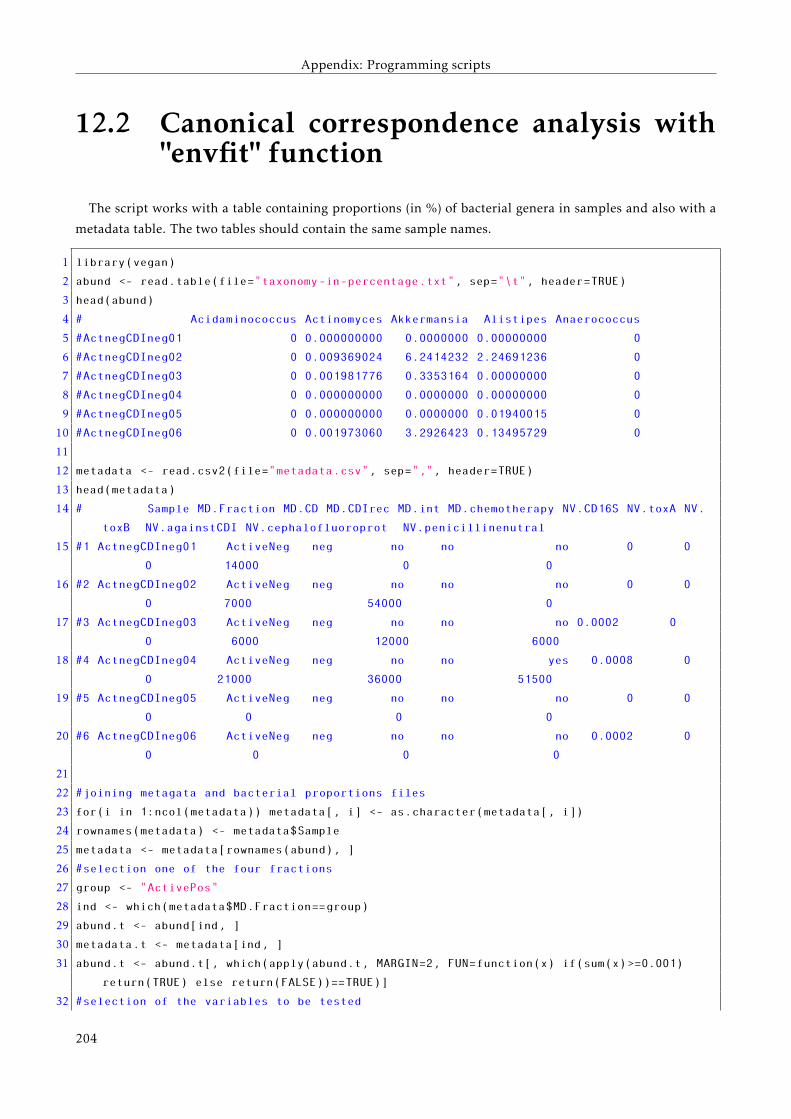
Appendix: Programming scripts
12.2 Canonical correspondence analysis with"envfit" function
The script works with a table containing proportions (in %) of bacterial genera in samples and also with a
metadata table. The two tables should contain the same sample names.
1 library(vegan)
2 abund <- read.table(file="taxonomy-in-percentage.txt", sep="\t", header=TRUE)
3 head(abund)
4 # Acidaminococcus Actinomyces Akkermansia Alistipes Anaerococcus
5 #ActnegCDIneg01 0 0.000000000 0.0000000 0.00000000 0
6 #ActnegCDIneg02 0 0.009369024 6.2414232 2.24691236 0
7 #ActnegCDIneg03 0 0.001981776 0.3353164 0.00000000 0
8 #ActnegCDIneg04 0 0.000000000 0.0000000 0.00000000 0
9 #ActnegCDIneg05 0 0.000000000 0.0000000 0.01940015 0
10 #ActnegCDIneg06 0 0.001973060 3.2926423 0.13495729 0
11
12 metadata <- read.csv2(file="metadata.csv", sep=",", header=TRUE)
13 head(metadata)
14 # Sample MD.Fraction MD.CD MD.CDIrec MD.int MD.chemotherapy NV.CD16S NV.toxA NV.
toxB NV.againstCDI NV.cephalofluoroprot NV.penicillinenutral
15 #1 ActnegCDIneg01 ActiveNeg neg no no no 0 0
0 14000 0 0
16 #2 ActnegCDIneg02 ActiveNeg neg no no no 0 0
0 7000 54000 0
17 #3 ActnegCDIneg03 ActiveNeg neg no no no 0.0002 0
0 6000 12000 6000
18 #4 ActnegCDIneg04 ActiveNeg neg no no yes 0.0008 0
0 21000 36000 51500
19 #5 ActnegCDIneg05 ActiveNeg neg no no no 0 0
0 0 0 0
20 #6 ActnegCDIneg06 ActiveNeg neg no no no 0.0002 0
0 0 0 0
21
22 #joining metagata and bacterial proportions files
23 for(i in 1:ncol(metadata)) metadata[, i] <- as.character(metadata[, i])
24 rownames(metadata) <- metadata$Sample
25 metadata <- metadata[rownames(abund), ]
26 #selection one of the four fractions
27 group <- "ActivePos"
28 ind <- which(metadata$MD.Fraction==group)
29 abund.t <- abund[ind, ]
30 metadata.t <- metadata[ind, ]
31 abund.t <- abund.t[, which(apply(abund.t, MARGIN=2, FUN=function(x) if(sum(x)>=0.001)
return(TRUE) else return(FALSE))==TRUE)]
32 #selection of the variables to be tested
204
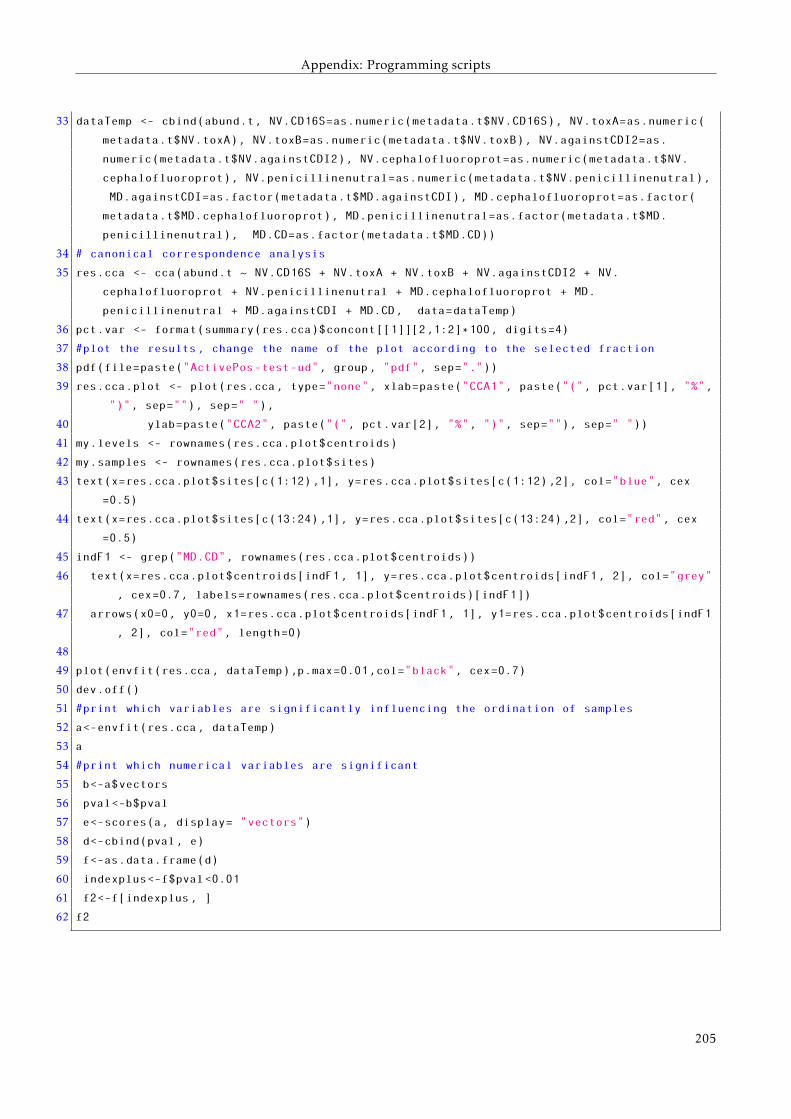
Appendix: Programming scripts
33 dataTemp <- cbind(abund.t, NV.CD16S=as.numeric(metadata.t$NV.CD16S), NV.toxA=as.numeric(
metadata.t$NV.toxA), NV.toxB=as.numeric(metadata.t$NV.toxB), NV.againstCDI2=as.
numeric(metadata.t$NV.againstCDI2), NV.cephalofluoroprot=as.numeric(metadata.t$NV.
cephalofluoroprot), NV.penicillinenutral=as.numeric(metadata.t$NV.penicillinenutral),
MD.againstCDI=as.factor(metadata.t$MD.againstCDI), MD.cephalofluoroprot=as.factor(
metadata.t$MD.cephalofluoroprot), MD.penicillinenutral=as.factor(metadata.t$MD.
penicillinenutral), MD.CD=as.factor(metadata.t$MD.CD))
34 # canonical correspondence analysis
35 res.cca <- cca(abund.t ~ NV.CD16S + NV.toxA + NV.toxB + NV.againstCDI2 + NV.
cephalofluoroprot + NV.penicillinenutral + MD.cephalofluoroprot + MD.
penicillinenutral + MD.againstCDI + MD.CD, data=dataTemp)
36 pct.var <- format(summary(res.cca)$concont[[1]][2,1:2]*100, digits=4)
37 #plot the results, change the name of the plot according to the selected fraction
38 pdf(file=paste("ActivePos-test-ud", group, "pdf", sep="."))
39 res.cca.plot <- plot(res.cca, type="none", xlab=paste("CCA1", paste("(", pct.var[1], "%",
")", sep=""), sep=" "),
40 ylab=paste("CCA2", paste("(", pct.var[2], "%", ")", sep=""), sep=" "))
41 my.levels <- rownames(res.cca.plot$centroids)
42 my.samples <- rownames(res.cca.plot$sites)
43 text(x=res.cca.plot$sites[c(1:12),1], y=res.cca.plot$sites[c(1:12),2], col="blue", cex
=0.5)
44 text(x=res.cca.plot$sites[c(13:24),1], y=res.cca.plot$sites[c(13:24),2], col="red", cex
=0.5)
45 indF1 <- grep("MD.CD", rownames(res.cca.plot$centroids))
46 text(x=res.cca.plot$centroids[indF1, 1], y=res.cca.plot$centroids[indF1, 2], col="grey"
, cex=0.7, labels=rownames(res.cca.plot$centroids)[indF1])
47 arrows(x0=0, y0=0, x1=res.cca.plot$centroids[indF1, 1], y1=res.cca.plot$centroids[indF1
, 2], col="red", length=0)
48
49 plot(envfit(res.cca, dataTemp),p.max=0.01,col="black", cex=0.7)
50 dev.off()
51 #print which variables are significantly influencing the ordination of samples
52 a<-envfit(res.cca, dataTemp)
53 a
54 #print which numerical variables are significant
55 b<-a$vectors
56 pval<-b$pval
57 e<-scores(a, display= "vectors")
58 d<-cbind(pval, e)
59 f<-as.data.frame(d)
60 indexplus<-f$pval<0.01
61 f2<-f[indexplus, ]
62 f2
205
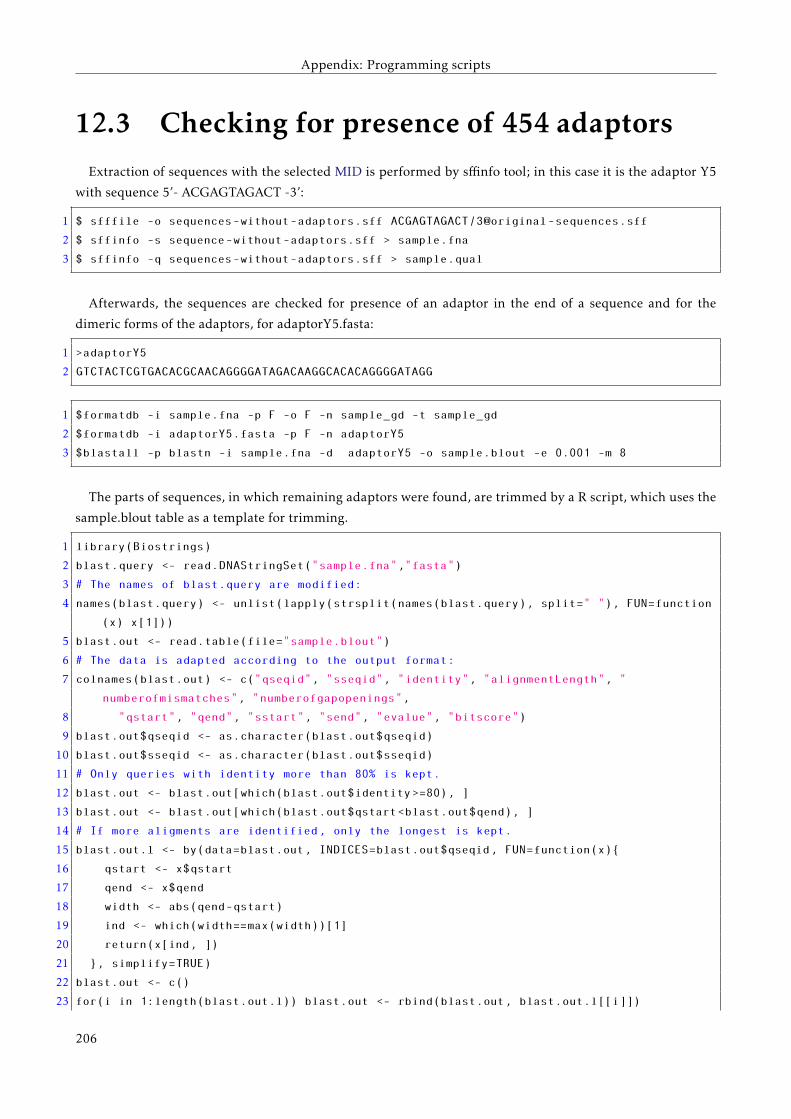
Appendix: Programming scripts
12.3 Checking for presence of 454 adaptorsExtraction of sequences with the selected MID is performed by sffinfo tool; in this case it is the adaptor Y5
with sequence 5’- ACGAGTAGACT -3’:
1 $ sfffile -o sequences-without-adaptors.sff ACGAGTAGACT/[email protected]
2 $ sffinfo -s sequence-without-adaptors.sff > sample.fna
3 $ sffinfo -q sequences-without-adaptors.sff > sample.qual
Afterwards, the sequences are checked for presence of an adaptor in the end of a sequence and for the
dimeric forms of the adaptors, for adaptorY5.fasta:
1 >adaptorY5
2 GTCTACTCGTGACACGCAACAGGGGATAGACAAGGCACACAGGGGATAGG
1 $formatdb -i sample.fna -p F -o F -n sample_gd -t sample_gd
2 $formatdb -i adaptorY5.fasta -p F -n adaptorY5
3 $blastall -p blastn -i sample.fna -d adaptorY5 -o sample.blout -e 0.001 -m 8
The parts of sequences, in which remaining adaptors were found, are trimmed by a R script, which uses the
sample.blout table as a template for trimming.
1 library(Biostrings)
2 blast.query <- read.DNAStringSet("sample.fna","fasta")
3 # The names of blast.query are modified:
4 names(blast.query) <- unlist(lapply(strsplit(names(blast.query), split=" "), FUN=function
(x) x[1]))
5 blast.out <- read.table(file="sample.blout")
6 # The data is adapted according to the output format:
7 colnames(blast.out) <- c("qseqid", "sseqid", "identity", "alignmentLength", "
numberofmismatches", "numberofgapopenings",
8 "qstart", "qend", "sstart", "send", "evalue", "bitscore")
9 blast.out$qseqid <- as.character(blast.out$qseqid)
10 blast.out$sseqid <- as.character(blast.out$sseqid)
11 # Only queries with identity more than 80% is kept.
12 blast.out <- blast.out[which(blast.out$identity >=80), ]
13 blast.out <- blast.out[which(blast.out$qstart<blast.out$qend), ]
14 # If more aligments are identified, only the longest is kept.
15 blast.out.l <- by(data=blast.out, INDICES=blast.out$qseqid, FUN=function(x){
16 qstart <- x$qstart
17 qend <- x$qend
18 width <- abs(qend-qstart)
19 ind <- which(width==max(width))[1]
20 return(x[ind, ])
21 }, simplify=TRUE)
22 blast.out <- c()
23 for(i in 1:length(blast.out.l)) blast.out <- rbind(blast.out, blast.out.l[[i]])
206
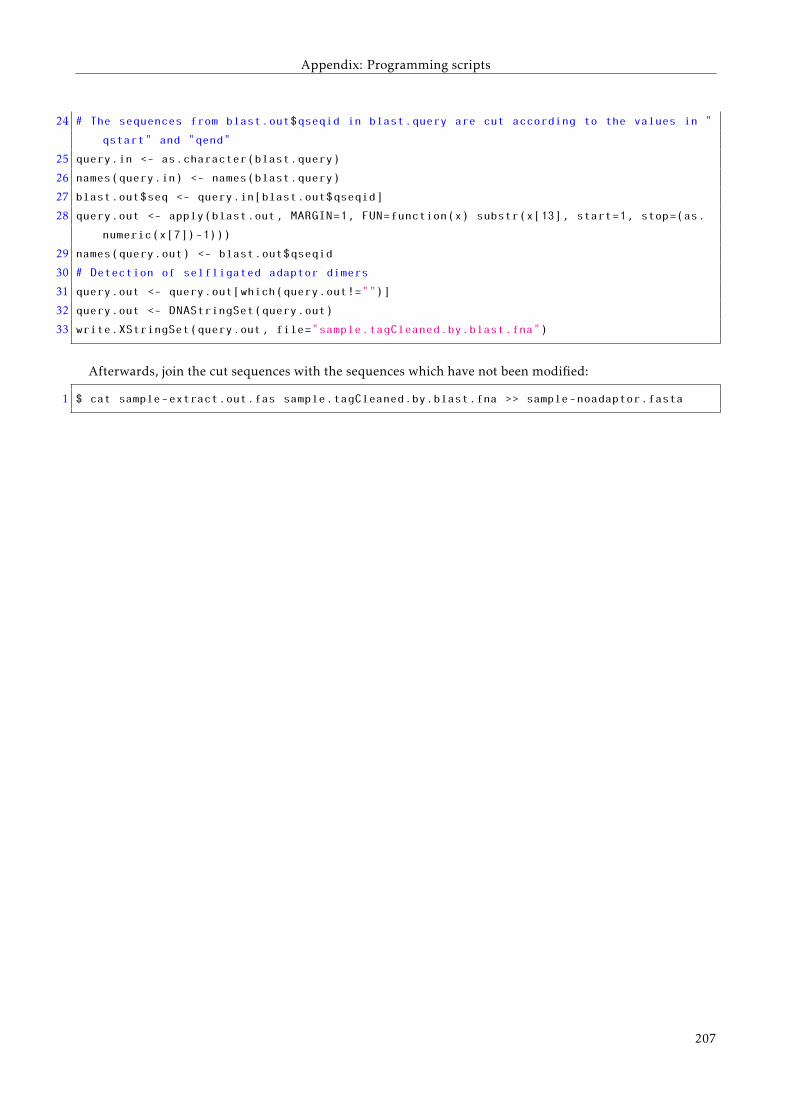
Appendix: Programming scripts
24 # The sequences from blast.out$qseqid in blast.query are cut according to the values in "
qstart" and "qend"
25 query.in <- as.character(blast.query)
26 names(query.in) <- names(blast.query)
27 blast.out$seq <- query.in[blast.out$qseqid]
28 query.out <- apply(blast.out, MARGIN=1, FUN=function(x) substr(x[13], start=1, stop=(as.
numeric(x[7])-1)))
29 names(query.out) <- blast.out$qseqid
30 # Detection of selfligated adaptor dimers
31 query.out <- query.out[which(query.out!="")]
32 query.out <- DNAStringSet(query.out)
33 write.XStringSet(query.out, file="sample.tagCleaned.by.blast.fna")
Afterwards, join the cut sequences with the sequences which have not been modified:
1 $ cat sample-extract.out.fas sample.tagCleaned.by.blast.fna >> sample-noadaptor.fasta
207
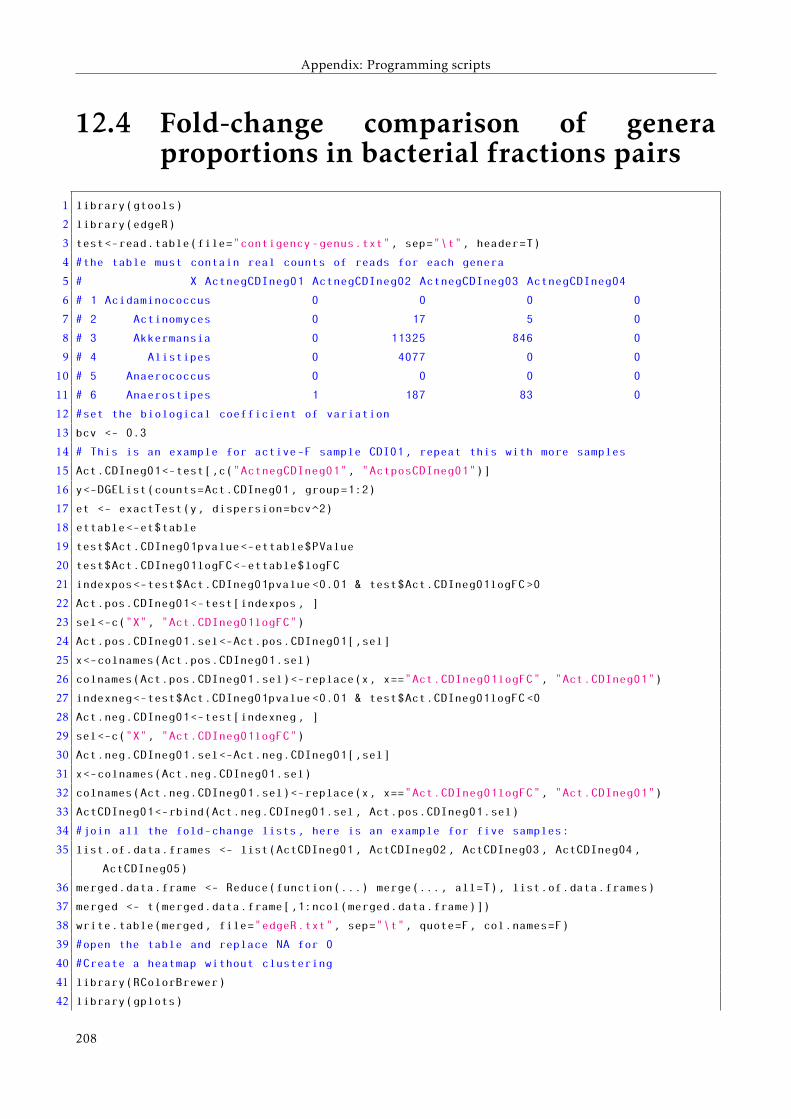
Appendix: Programming scripts
12.4 Fold-change comparison of generaproportions in bacterial fractions pairs
1 library(gtools)
2 library(edgeR)
3 test<-read.table(file="contigency-genus.txt", sep="\t", header=T)
4 #the table must contain real counts of reads for each genera
5 # X ActnegCDIneg01 ActnegCDIneg02 ActnegCDIneg03 ActnegCDIneg04
6 # 1 Acidaminococcus 0 0 0 0
7 # 2 Actinomyces 0 17 5 0
8 # 3 Akkermansia 0 11325 846 0
9 # 4 Alistipes 0 4077 0 0
10 # 5 Anaerococcus 0 0 0 0
11 # 6 Anaerostipes 1 187 83 0
12 #set the biological coefficient of variation
13 bcv <- 0.3
14 # This is an example for active-F sample CDI01, repeat this with more samples
15 Act.CDIneg01<-test[,c("ActnegCDIneg01", "ActposCDIneg01")]
16 y<-DGEList(counts=Act.CDIneg01, group=1:2)
17 et <- exactTest(y, dispersion=bcv^2)
18 ettable<-et$table
19 test$Act.CDIneg01pvalue<-ettable$PValue
20 test$Act.CDIneg01logFC<-ettable$logFC
21 indexpos<-test$Act.CDIneg01pvalue <0.01 & test$Act.CDIneg01logFC >0
22 Act.pos.CDIneg01<-test[indexpos, ]
23 sel<-c("X", "Act.CDIneg01logFC")
24 Act.pos.CDIneg01.sel<-Act.pos.CDIneg01[,sel]
25 x<-colnames(Act.pos.CDIneg01.sel)
26 colnames(Act.pos.CDIneg01.sel)<-replace(x, x=="Act.CDIneg01logFC", "Act.CDIneg01")
27 indexneg<-test$Act.CDIneg01pvalue <0.01 & test$Act.CDIneg01logFC <0
28 Act.neg.CDIneg01<-test[indexneg, ]
29 sel<-c("X", "Act.CDIneg01logFC")
30 Act.neg.CDIneg01.sel<-Act.neg.CDIneg01[,sel]
31 x<-colnames(Act.neg.CDIneg01.sel)
32 colnames(Act.neg.CDIneg01.sel)<-replace(x, x=="Act.CDIneg01logFC", "Act.CDIneg01")
33 ActCDIneg01<-rbind(Act.neg.CDIneg01.sel, Act.pos.CDIneg01.sel)
34 #join all the fold-change lists, here is an example for five samples:
35 list.of.data.frames <- list(ActCDIneg01, ActCDIneg02, ActCDIneg03, ActCDIneg04,
ActCDIneg05)
36 merged.data.frame <- Reduce(function(...) merge(..., all=T), list.of.data.frames)
37 merged <- t(merged.data.frame[,1:ncol(merged.data.frame)])
38 write.table(merged, file="edgeR.txt", sep="\t", quote=F, col.names=F)
39 #open the table and replace NA for 0
40 #Create a heatmap without clustering
41 library(RColorBrewer)
42 library(gplots)
208
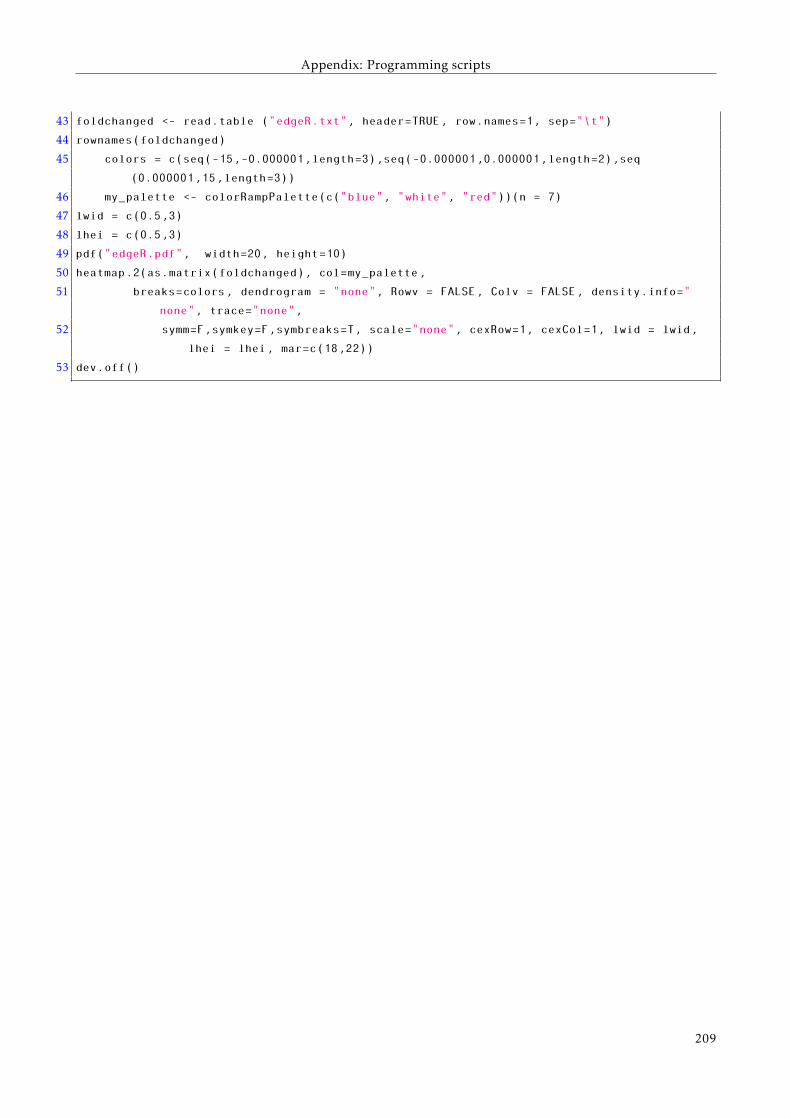
Appendix: Programming scripts
43 foldchanged <- read.table ("edgeR.txt", header=TRUE, row.names=1, sep="\t")
44 rownames(foldchanged)
45 colors = c(seq(-15,-0.000001,length=3),seq(-0.000001,0.000001,length=2),seq
(0.000001,15,length=3))
46 my_palette <- colorRampPalette(c("blue", "white", "red"))(n = 7)
47 lwid = c(0.5,3)
48 lhei = c(0.5,3)
49 pdf("edgeR.pdf", width=20, height=10)
50 heatmap.2(as.matrix(foldchanged), col=my_palette,
51 breaks=colors, dendrogram = "none", Rowv = FALSE, Colv = FALSE, density.info="
none", trace="none",
52 symm=F,symkey=F,symbreaks=T, scale="none", cexRow=1, cexCol=1, lwid = lwid,
lhei = lhei, mar=c(18,22))
53 dev.off()
209
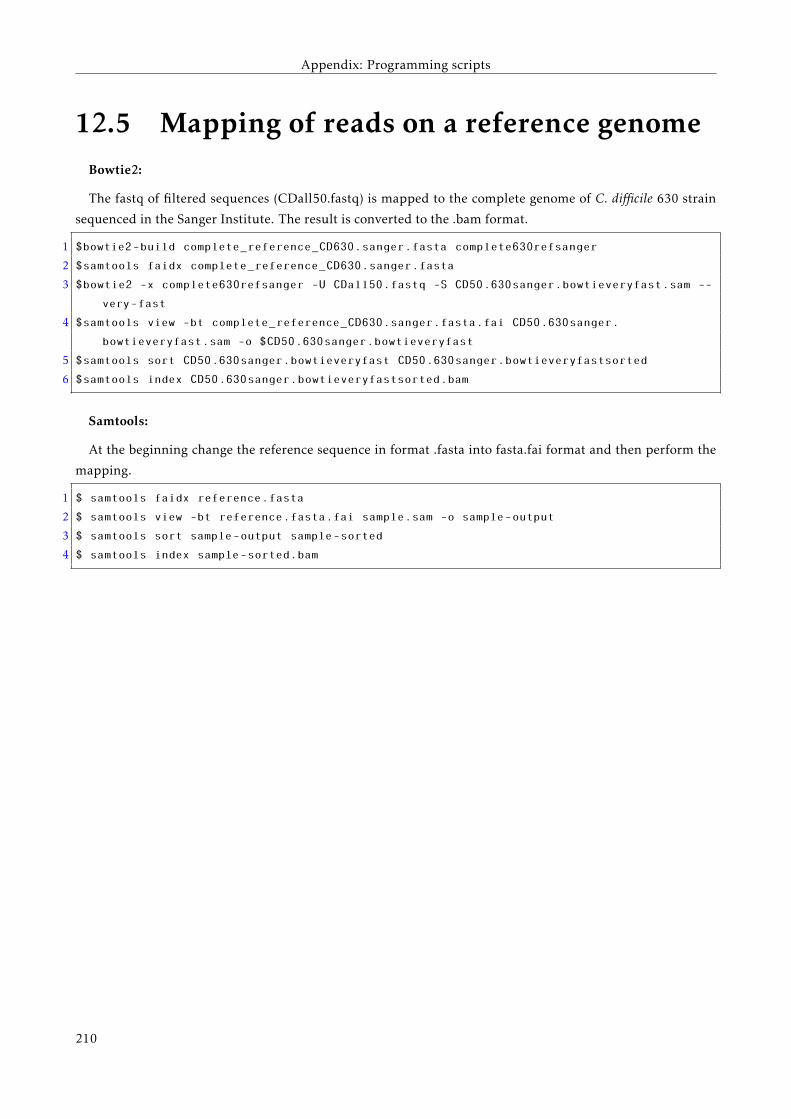
Appendix: Programming scripts
12.5 Mapping of reads on a reference genomeBowtie2:
The fastq of filtered sequences (CDall50.fastq) is mapped to the complete genome of C. difficile 630 strain
sequenced in the Sanger Institute. The result is converted to the .bam format.
1 $bowtie2-build complete_reference_CD630.sanger.fasta complete630refsanger
2 $samtools faidx complete_reference_CD630.sanger.fasta
3 $bowtie2 -x complete630refsanger -U CDall50.fastq -S CD50.630sanger.bowtieveryfast.sam --
very-fast
4 $samtools view -bt complete_reference_CD630.sanger.fasta.fai CD50.630sanger.
bowtieveryfast.sam -o $CD50.630sanger.bowtieveryfast
5 $samtools sort CD50.630sanger.bowtieveryfast CD50.630sanger.bowtieveryfastsorted
6 $samtools index CD50.630sanger.bowtieveryfastsorted.bam
Samtools:
At the beginning change the reference sequence in format .fasta into fasta.fai format and then perform the
mapping.
1 $ samtools faidx reference.fasta
2 $ samtools view -bt reference.fasta.fai sample.sam -o sample-output
3 $ samtools sort sample-output sample-sorted
4 $ samtools index sample-sorted.bam
210
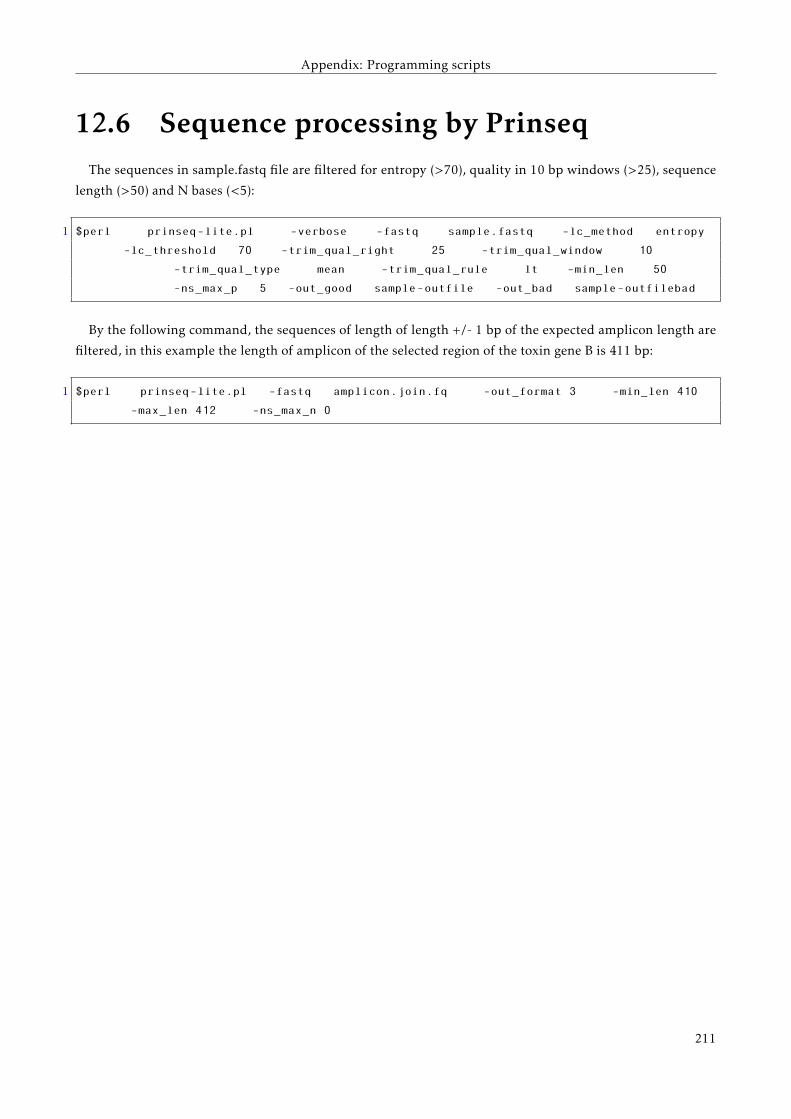
Appendix: Programming scripts
12.6 Sequence processing by PrinseqThe sequences in sample.fastq file are filtered for entropy (>70), quality in 10 bp windows (>25), sequence
length (>50) and N bases (<5):
1 $perl prinseq-lite.pl -verbose -fastq sample.fastq -lc_method entropy
-lc_threshold 70 -trim_qual_right 25 -trim_qual_window 10
-trim_qual_type mean -trim_qual_rule lt -min_len 50
-ns_max_p 5 -out_good sample-outfile -out_bad sample-outfilebad
By the following command, the sequences of length of length +/- 1 bp of the expected amplicon length are
filtered, in this example the length of amplicon of the selected region of the toxin gene B is 411 bp:
1 $perl prinseq-lite.pl -fastq amplicon.join.fq -out_format 3 -min_len 410
-max_len 412 -ns_max_n 0
211
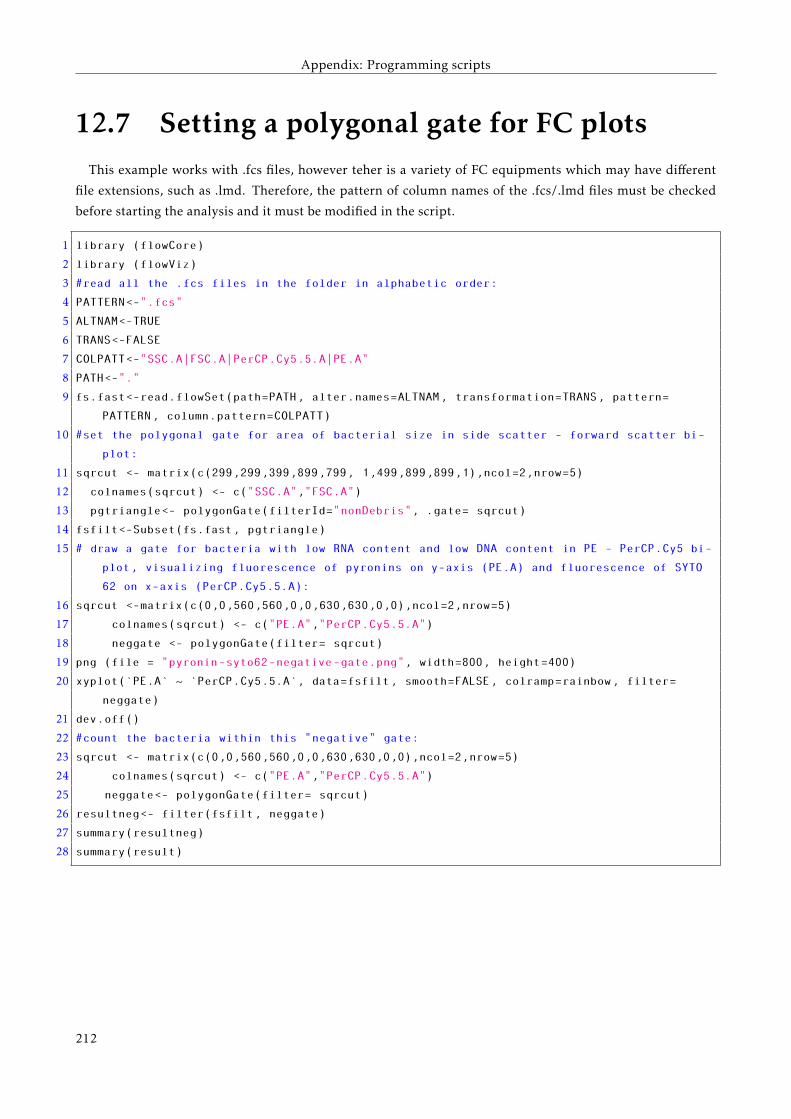
Appendix: Programming scripts
12.7 Setting a polygonal gate for FC plotsThis example works with .fcs files, however teher is a variety of FC equipments which may have different
file extensions, such as .lmd. Therefore, the pattern of column names of the .fcs/.lmd files must be checked
before starting the analysis and it must be modified in the script.
1 library (flowCore)
2 library (flowViz)
3 #read all the .fcs files in the folder in alphabetic order:
4 PATTERN<-".fcs"
5 ALTNAM<-TRUE
6 TRANS<-FALSE
7 COLPATT<-"SSC.A|FSC.A|PerCP.Cy5.5.A|PE.A"
8 PATH<-"."
9 fs.fast<-read.flowSet(path=PATH, alter.names=ALTNAM, transformation=TRANS, pattern=
PATTERN, column.pattern=COLPATT)
10 #set the polygonal gate for area of bacterial size in side scatter - forward scatter bi-
plot:
11 sqrcut <- matrix(c(299,299,399,899,799, 1,499,899,899,1),ncol=2,nrow=5)
12 colnames(sqrcut) <- c("SSC.A","FSC.A")
13 pgtriangle<- polygonGate(filterId="nonDebris", .gate= sqrcut)
14 fsfilt<-Subset(fs.fast, pgtriangle)
15 # draw a gate for bacteria with low RNA content and low DNA content in PE - PerCP.Cy5 bi-
plot, visualizing fluorescence of pyronins on y-axis (PE.A) and fluorescence of SYTO
62 on x-axis (PerCP.Cy5.5.A):
16 sqrcut <-matrix(c(0,0,560,560,0,0,630,630,0,0),ncol=2,nrow=5)
17 colnames(sqrcut) <- c("PE.A","PerCP.Cy5.5.A")
18 neggate <- polygonGate(filter= sqrcut)
19 png (file = "pyronin-syto62-negative-gate.png", width=800, height=400)
20 xyplot(‘PE.A‘ ~ ‘PerCP.Cy5.5.A‘, data=fsfilt, smooth=FALSE, colramp=rainbow, filter=
neggate)
21 dev.off()
22 #count the bacteria within this "negative" gate:
23 sqrcut <- matrix(c(0,0,560,560,0,0,630,630,0,0),ncol=2,nrow=5)
24 colnames(sqrcut) <- c("PE.A","PerCP.Cy5.5.A")
25 neggate<- polygonGate(filter= sqrcut)
26 resultneg<- filter(fsfilt, neggate)
27 summary(resultneg)
28 summary(result)
212
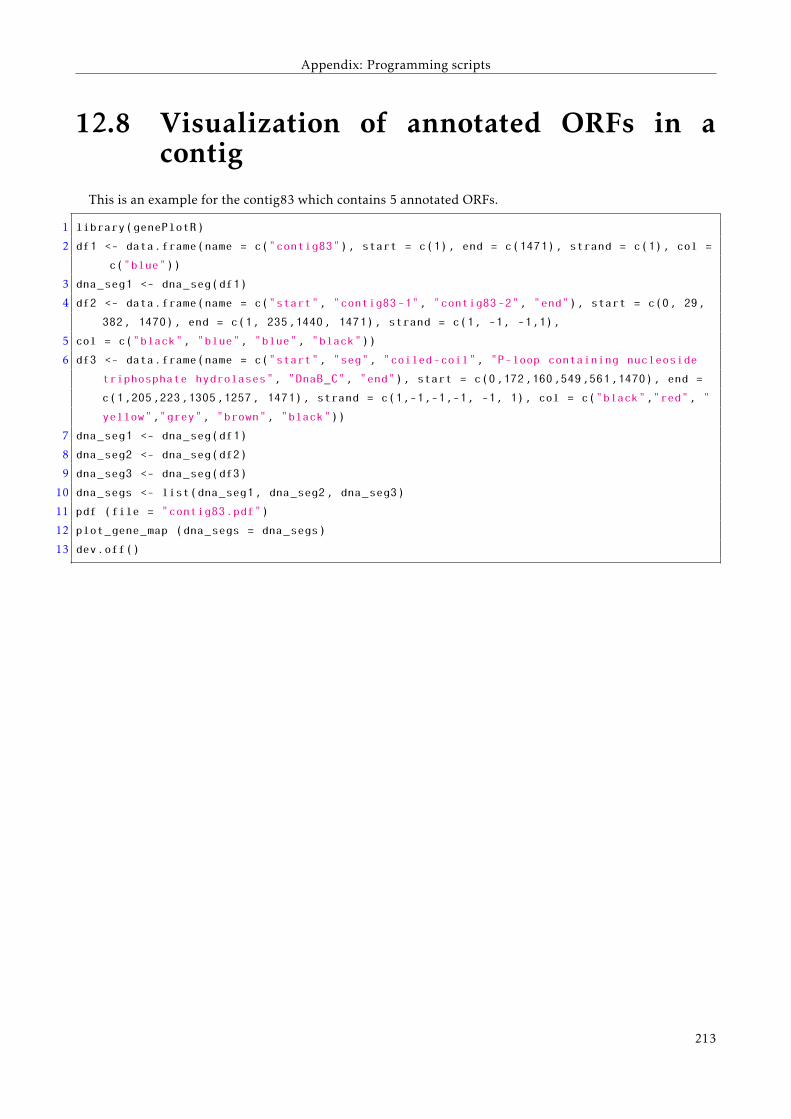
Appendix: Programming scripts
12.8 Visualization of annotated ORFs in acontig
This is an example for the contig83 which contains 5 annotated ORFs.
1 library(genePlotR)
2 df1 <- data.frame(name = c("contig83"), start = c(1), end = c(1471), strand = c(1), col =
c("blue"))
3 dna_seg1 <- dna_seg(df1)
4 df2 <- data.frame(name = c("start", "contig83-1", "contig83-2", "end"), start = c(0, 29,
382, 1470), end = c(1, 235,1440, 1471), strand = c(1, -1, -1,1),
5 col = c("black", "blue", "blue", "black"))
6 df3 <- data.frame(name = c("start", "seg", "coiled-coil", "P-loop containing nucleoside
triphosphate hydrolases", "DnaB_C", "end"), start = c(0,172,160,549,561,1470), end =
c(1,205,223,1305,1257, 1471), strand = c(1,-1,-1,-1, -1, 1), col = c("black","red", "
yellow","grey", "brown", "black"))
7 dna_seg1 <- dna_seg(df1)
8 dna_seg2 <- dna_seg(df2)
9 dna_seg3 <- dna_seg(df3)
10 dna_segs <- list(dna_seg1, dna_seg2, dna_seg3)
11 pdf (file = "contig83.pdf")
12 plot_gene_map (dna_segs = dna_segs)
13 dev.off()
213
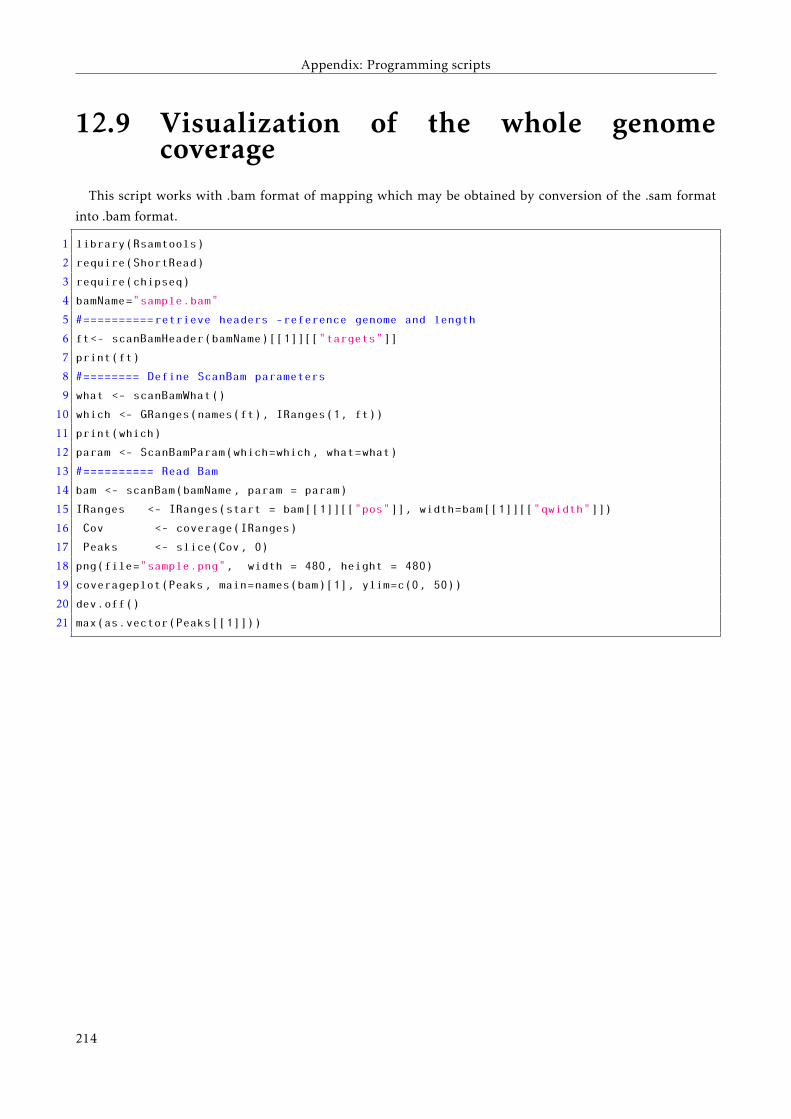
Appendix: Programming scripts
12.9 Visualization of the whole genomecoverage
This script works with .bam format of mapping which may be obtained by conversion of the .sam format
into .bam format.
1 library(Rsamtools)
2 require(ShortRead)
3 require(chipseq)
4 bamName="sample.bam"
5 #==========retrieve headers -reference genome and length
6 ft<- scanBamHeader(bamName)[[1]][["targets"]]
7 print(ft)
8 #======== Define ScanBam parameters
9 what <- scanBamWhat()
10 which <- GRanges(names(ft), IRanges(1, ft))
11 print(which)
12 param <- ScanBamParam(which=which, what=what)
13 #========== Read Bam
14 bam <- scanBam(bamName, param = param)
15 IRanges <- IRanges(start = bam[[1]][["pos"]], width=bam[[1]][["qwidth"]])
16 Cov <- coverage(IRanges)
17 Peaks <- slice(Cov, 0)
18 png(file="sample.png", width = 480, height = 480)
19 coverageplot(Peaks, main=names(bam)[1], ylim=c(0, 50))
20 dev.off()
21 max(as.vector(Peaks[[1]]))
214

Chapter13Appendix: Abstracts of other publications
not related to the thesis

Appendix: Abstracts of other publications not related to the thesis
Human monoclonal antibodies to Clostridium difficile toxins (MK-3415A) mediate gut microbiome restoration
Džunková, M., D’Auria, G., Moya, A., Kelly, C., Chen, X.
Submitted
The increasing incidence of Clostridium difficile infection (CDI) demonstrates that the current antibiotic
treatment approaches are inadequate, as they disrupt the normal gut microbiome protecting against CDI
recurrence. Human monoclonal antibody MK-3415A to C. difficile toxin A and toxin B has been shown to
reduce significantly the recurrence of CDI in mice and humans, but its mechanisms in preventing recurrent
CDI is not well understood.
Experimental mice have been pretreated by Clindamycin and infected by C. difficile. We compared the
bacterial diversity of the gut microbiome of CDI mice treated with MK-3425A, non-treated mice, mice treated
with Vancomycin (standard antibiotic treatment of CDI) and mice treated with Vancomycin combined with
MK-3415A.
C. difficile infection simulation resulted in the prevalence of Enterobacter species. Sixty % of mice of the
vehicle group died after two days and their microbiome was almost exclusively formed by Enterobacter. MK-
3415A achieved to decrease Enterobacter levels and to restore Blautia, Akkermansia and Lactobacillus levels
which had been the most important components of the original mice microbiota. Vancomycin treated mice had
short life span, which was in contrast to the mice treated by MK-3415A antibody combined with Vancomycin.
Vancomycin treatment decreased bacterial diversity with predominant Enterobacter and Akkermansia, while
Staphylococcus expanded after the Vancomycin treatment finished. In contrast, mice treated by Vancomycin
combined with MK-3415A also experienced decreased bacterial diversity during the Vancomycin treatment,
however, they were able to recover their initial Blautia and Lactobacillus proportions, even though episodes of
Staphylococcus overgrowth were being detected during the last experiment days.
In conclusion, the antibody MK-3415A facilitates the normalization of the gut microbiota. In contrast,
Vancomycin decreases bacterial diversity and reduces the proportions of the most common species of the
normal microbiota, what increases the risk of expansion of opportunistic pathogens or disease recurrence.
217
Appendix: Abstracts of other publications not related to the thesis
Genome of Lactobacillus plantarum strain 19L3 as starter culture for"Slovenská bryndza" ovine cheese
D’Auria, G., Džunková, M., Moya, A., Tomáška, M., Kolšta, M., Kmet, V.
Genome Announcements (2014) 2: e00292-14
The genome sequence of Lactobacillus plantarum isolated from ovine cheese is presented here. This
bacterium is proposed as a starter strain, named 19L3, for "Slovenská bryndza" cheese, a traditional Slovak
cheese fulfilling European Food Safety Authority (EFSA) requirements.
218
Appendix: Abstracts of other publications not related to the thesis
Estudios de epidemiología molecular sobre población inmigrante enEspaña
González-Candelas, F., Bracho, M.A., Comas, I., D’Auria, G., Džunková, M., García, R., Gosalbes, M.J.,
Isaac, S., Latorre, A., López-Labrador, F.X., Patiño Galindo, J.A., Palero, F., Pérez-Brocal, V., Pérez-Cobas,
A.E., Sánchez Busó, L., Silva, F.J., Vázquez Castellanos, J., Moya, A.
Revista Española de Salud Pública (2014) 88: 121-130
Fundamentos: La epidemiología molecular es una nueva disciplina que permite la integración de la
información sobre la variabilidad genética de patógenos infecciosos con su difusión en la población y
subgrupos de la misma incluyendo, por ejemplo, las mutaciones de resistencia a antibióticos y antivirales.
El objetivo es conocer qué posibles diferencias existe en las características genéticas de los agentes infecciosos
que afectan a las poblaciones inmigrante y autóctoctona en España.
Métodos: Se revisaron artículos originales publicados entre 1998-2013, con las palabras clave
"epidemiología molecular", "tipado molecular", "secuenciación", "inmigrante", "España".
Resultados: De un total de 267 artículos identificados inicialmente, 50 pasaron los diferentes filtros
establecidos. De ellos, 36 analizan las infecciones por Mycobacterium tuberculosis y VIH, seguidos de los que
analizan infecciones por Staphylococcus aureus (3) y el Virus de la Hepatitis B (3).
Conclusiones: Los objetivos principales de estos trabajos fueron el tipado del patógeno y la determinación
de la frecuencia de mutaciones de resistencia. Los estudios más frecuentes correspondieron a cohortes
retrospectivas, seguidos por los estudios ecológicos y los ensayos clínicos. En general los estudios son
descriptivos y su ámbito por el tipo y tamaño de muestra es bastante restringido. En varios se determina que
las cepas o variantes del patógeno encontradas en inmigrantes tienen su origen más probable en sus países de
origen, si bien otros también ponen de manifiesto la transmisión desde la población autóctona a la inmigrante.
219
Appendix: Abstracts of other publications not related to the thesis
Hybrid sequencing approach applied to human fecal metagenomicclone libraries revealed clones with potential biotechnologicalapplications
Džunková, M., D’Auria, G., Pérez-Villarroya, D., Moya, A.
PLoS One (2012) 7: e47654
Natural environments represent an incredible source of microbial genetic diversity. Discovery of novel
biomolecules involves biotechnological methods that often require the design and implementation of
biochemical assays to screen clone libraries. However, when an assay is applied to thousands of clones, one
may eventually end up with very few positive clones which, in most of the cases, have to be "domesticated"
for downstream characterization and application, and this makes screening both laborious and expensive.
The negative clones, which are not considered by the selected assay, may also have biotechnological potential;
however, unfortunately they would remain unexplored. Knowledge of the clone sequences provides important
clues about potential biotechnological application of the clones in the library; however, the sequencing of
clones one-by-one would be very time-consuming and expensive.
In this study, we characterized the first metagenomic clone library from the feces of a healthy human
volunteer, using a method based on 454 pyrosequencing coupled with a clone-by-clone Sanger end-
sequencing. Instead of whole individual clone sequencing, we sequenced 358 clones in a pool. The medium-
large insert (7-15 kb) cloning strategy allowed us to assemble these clones correctly, and to assign the clone
ends to maintain the link between the position of a living clone in the library and the annotated contig from
the 454 assembly. Finally, we found several open reading frames (ORFs) with previously described potential
medical application.
The proposed approach allows planning ad-hoc biochemical assays for the clones of interest, and the
appropriate sub-cloning strategy for gene expression in suitable vectors/hosts.
220
Appendix: Abstracts of other publications not related to the thesis
Intraspecific sequence comparisons reveal similar rates of non-collinear gene insertion in the B and D genomes of bread wheat
Bartoš, J., Vlcek, C., Choulet, F., Džunková, M., Cviková, K., Šafár, J., Šimková, H., Paces, J., Strnad, H.,
Sourdille, P., Bergès, H., Cattonaro, F., Feuillet, C., Doležel, J.
BMC Plant Biology (2012) 12: 155
Background
Polyploidization is considered one of the main mechanisms of plant genome evolution. The presence
of multiple copies of the same gene reduces selection pressure and permits sub-functionalization and neo-
functionalization leading to plant diversification, adaptation and speciation. In bread wheat, polyploidization
and the prevalence of transposable elements resulted in massive gene duplication and movement. As a result,
the number of genes which are non-collinear to genomes of related species seems markedly increased in wheat.
Results
We used new-generation sequencing (NGS) to generate sequence of a Mb-sized region from wheat
chromosome arm 3DS. Sequence assembly of 24 BAC clones resulted in two scaffolds of 1,264,820 and 333,768
bases. The sequence was annotated and compared to the homoeologous region on wheat chromosome 3B and
orthologous loci of Brachypodium distachyon and rice. Among 39 coding sequences in the 3DS scaffolds, 32
have a homoeolog on chromosome 3B. In contrast, only fifteen and fourteen orthologs were identified in the
corresponding regions in rice and Brachypodium, respectively. Interestingly, five pseudogenes were identified
among the non-collinear coding sequences at the 3B locus, while none was found at the 3DS locus.
Conclusion
Direct comparison of two Mb-sized regions of the B and D genomes of bread wheat revealed similar rates
of non-collinear gene insertion in both genomes with a majority of gene duplications occurring before their
divergence. Relatively low proportion of pseudogenes was identified among non-collinear coding sequences.
Our data suggest that the pseudogenes did not originate from insertion of non-functional copies, but were
formed later during the evolution of hexaploid wheat. Some evidence was found for gene erosion along the B
genome locus.
221
Appendix: Abstracts of other publications not related to the thesis
Characterisation of the Amaranth Genetic Resources in the Czech GeneBank
Janovská, D., Hlásná Čepková, P., Džunková, M.
In book: Genetic Diversity in Plants (2012), Publisher: In tech, Editors: Mahmut Caliskan, pp.457-478.
ISBN: 978-953-51-0185-7
Amaranth is mostly named as a crop of the future. Due to very good contents of protein, oil and many
components with positive effects to humans, it is one of the promising crops. In the Czech Republic, there was
interest of amaranth growing in the fields and the consumption of amaranth products is increasing as well.
Most of grain raw material is imported to the Czech Republic from other countries, but there is increasing
demand of Czech amaranth production. For amaranth cultivation it is necessary to know, what species could
be grown. Because amaranth is not native in Europe, we have to receive seeds from other sides. In Czech
legislation act about invasive weeds exists. Several amaranth species are included in this Act.
In order to avoid cultivation of weedy amaranths, it is necessary to know the characteristics of the cultivated
species and do not confuse them. Due to vegetable and weedy amaranth have black seed colour, it is impossible
to use this trait as a marker. Amaranth glutelins were the best tool for the amaranth species identification,
because they showed high polymorphism not only in position of bands but also in their intensity.
The method used here was based on the data concerning the relative intensity and the position of the bands
in the glutelin spectra obtained by the chip capillary electrophoresis what resulted in the exact similarity
calculation of the protein fraction spectra and thus in the segregation of the cultivated grain species, the
monoecious wild species and the dioecious wild species into three separate clusters. Each of the grain
amaranth species was characterized by one dark band in the polymorphic region (54 - 65 kDa), while the
hybrids possessed more bands of different relative intensity.
The study brought several new contributions to the amaranth genetic research and is a very useful tool for
species identification before cultivation in the field conditions. Unfortunately, this method is not so sensitive
for individual amaranth genotype identification. We work on it in our current tasks.
222
Appendix: Abstracts of other publications not related to the thesis
Glutelin protein fraction as a tool for clear identification of Amaranthaccessions
Džunková, M., Janovská, D., Hlásná Čepková, P., Prohasková, A., Kolář, M.
Journal of Cereal Science (2011) 53: 198-205
In order to simplify the identification of amaranth accessions in gene banks or seed laboratories, a
comprehensive method based on band position and relative band intensity data from the glutelin patterns
of the chip microfluidic electrophoresis was developed. Chip electrophoresis protein fraction patterns were
compared with the patterns obtained by the classical SDS-PAGE method. Fifty-nine amaranth accessions
(Amaranthus australis, Amaranthus cannabinus, Amaranthus deflexus, Amaranthus retroflexus, Amaranthus
tuberculatus, Amaranthus wrightii and 53 unknown accessions of the grain species Amaranthus caudatus,
Amaranthus cruentus and Amaranthus hypochondriacus) were analysed.
Detailed pattern description of each group is provided here in the form of simplified pattern codes in the
glutelin polymorphic area, enabling the identification of hybrid accessions and wild species. Inflorescence
type and colour, weight of a thousand seeds, and seed colour were tested as additional phenotypic markers.
The clustering within the grain amaranths group was related only to the different inflorescence types generally
used to discriminate amaranth species. Statistical analysis of pattern similarities resulted in the segregation of
the cultivated grain species, the monoecious wild species, and the dioecious wild species into three separate
clusters.
223


Chapter14Bibliography

Bibliography
Abulencia, C. B., Wyborski, D. L., Garcia, J. A., Podar, M., Chen, W., Chang, S. H., Chang, H. W., Watson, D., Brodie, E. L., et al. 2006.
Environmental whole-genome amplification to access microbial populations in contaminated sediments. Applied and Environmental
Microbiology, 72(5):3291–3301. Available from: http://dx.doi.org/10.1128/aem.72.5.3291-3301.2006.
Al-Nassir, W. N., Sethi, A. K., Li, Y., Pultz, M. J., Riggs, M. M., and Donskey, C. J. 2008. Both oral metronidazole and oral vancomycin
promote persistent overgrowth of vancomycin-resistant enterococci during treatment of Clostridium difficile-associated disease.
Antimicrobial Agents and Chemotherapy, 52(7):2403–2406. Available from: http://dx.doi.org/10.1128/aac.00090-08.
Allen, L. Z., Ishoey, T., Novotny, M. A., McLean, J. S., Lasken, R. S., and Williamson, S. J. 2011. Single virus genomics: A new tool for virus
discovery. PLoS ONE, 6(3):e17722+. Available from: http://dx.doi.org/10.1371/journal.pone.0017722.
Altschul, S. F., Gish, W., Miller, W., Myers, E. W., and Lipman, D. J. 1990. Basic local alignment search tool. Journal of Molecular Biology,
215(3):403–410. Available from: http://dx.doi.org/10.1006/jmbi.1990.9999.
Amann, R. and Fuchs, B. M. 2008. Single-cell identification in microbial communities by improved fluorescence in situ hybridization
techniques. Nature Reviews Microbiology, 6(5):339–348. Available from: http://dx.doi.org/10.1038/nrmicro1888.
Ambrose, H. E. and Clewley, J. P. 2006. Virus discovery by sequence-independent genome amplification. Rev. Med. Virol., 16(6):365–383.
Available from: http://dx.doi.org/10.1002/rmv.515.
Andrews, J. M. 2001. Determination of minimum inhibitory concentrations. The Journal of Antimicrobial Chemotherapy, 48 Suppl 1(suppl
1):5–16. Available from: http://dx.doi.org/10.1093/jac/48.suppl_1.5.
Aronesty, E. 2013. Comparison of sequencing utility programs. Comparison of Sequencing Utility Programs, 7:1–8. Available from: http:
//benthamopen.com/ABSTRACT/TOBIOIJ-7-1.
Arthur, J. C., Perez-Chanona, E., Mühlbauer, M., Tomkovich, S., Uronis, J. M., Fan, T.-J., Campbell, B. J., Abujamel, T., Dogan, B., et al.
2012. Intestinal inflammation targets Cancer-Inducing activity of the microbiota. Science, 338(6103):120–123. Available from: http:
//dx.doi.org/10.1126/science.1224820.
Arumugam, M., Raes, J., Pelletier, E., Le Paslier, D., Yamada, T., Mende, D. R., Fernandes, G. R., Tap, J., Bruls, T., et al. 2011. Enterotypes
of the human gut microbiome. Nature, 473(7346):174–180. Available from: http://dx.doi.org/10.1038/nature09944.
Ashelford, K. E., Weightman, A. J., and Fry, J. C. 2002. PRIMROSE: a computer program for generating and estimating the phylogenetic
range of 16S rRNA oligonucleotide probes and primers in conjunction with the RDP-II database. Nucleic Acids Research, 30(15):3481–
3489. Available from: http://dx.doi.org/10.1093/nar/gkf450.
Atarashi, K., Tanoue, T., Shima, T., Imaoka, A., Kuwahara, T., Momose, Y., Cheng, G., Yamasaki, S., Saito, T., et al. 2011. Induction of
colonic regulatory T cells by indigenous Clostridium species. Science, 331(6015):337–341. Available from: http://dx.doi.org/10.
1126/science.1198469.
Ausubel, F. M., Brent, R., Kingston, R. E., Moore, D. D., Seidman, J. G., and Struhl, K. 1992. Current Protocols in Molecular Biology.
Pp. 2.1.1–2.4.5. Available from: http://eu.wiley.com/WileyCDA/WileyTitle/productCd-047150338X.html.

Bibliography
Barketi-Klai, A., Hoys, S., Lambert-Bordes, S., Collignon, A., and Kansau, I. 2011. Role of fibronectin binding protein A in Clostridium
difficile intestinal colonization. Journal of Medical Microbiology, 60(8):jmm.0.029553–0–1161. Available from: http://dx.doi.org/
10.1099/jmm.0.029553-0.
Barnett, J. M., Cuchens, M. A., and Buchanan, W. 1984. Automated immunofluorescent speciation of oral bacteria using flow cytometry.
Journal of Dental Research, 63(8):1040–1042. Available from: http://view.ncbi.nlm.nih.gov/pubmed/6205030.
Bartlett, J. G., Chang, T. W., Gurwith, M., Gorbach, S. L., and Onderdonk, A. B. 1978. Antibiotic-associated pseudomembranous colitis
due to toxin-producing clostridia. The New England Journal of Medicine, 298(10):531–534. Available from: http://view.ncbi.nlm.
nih.gov/pubmed/625309.
Beeching, N. J., Jones, R., and Gazzard, B. 2011. 4 gastrointestinal opportunistic infections. HIV Medicine, 12:43–54. Available from:
http://dx.doi.org/10.1111/j.1468-1293.2011.00944_5.x.
Ben-Amor, K., Heilig, H., Smidt, H., Vaughan, E. E., Abee, T., and de Vos, W. M. 2005. Genetic diversity of viable, injured, and dead
fecal bacteria assessed by fluorescence-activated cell sorting and 16S rRNA gene analysis. Applied and Environmental Microbiology,
71(8):4679–4689. Available from: http://dx.doi.org/10.1128/aem.71.8.4679-4689.2005.
Bercik, P., Denou, E., Collins, J., Jackson, W., Lu, J., Jury, J., Deng, Y., Blennerhassett, P., Macri, J., et al. 2011. The intestinal microbiota
affect central levels of brain-derived neurotropic factor and behavior in mice. Gastroenterology, 141(2). Available from: http://dx.
doi.org/10.1053/j.gastro.2011.04.052.
Berdy, J. 2005. Bioactive microbial metabolites. The Journal of Antibiotics, 58(1):1–26. Available from: http://dx.doi.org/10.1038/ja.
2005.1.
Bhatt, A. S., Freeman, S. S., Herrera, A. F., Pedamallu, C. S., Gevers, D., Duke, F., Jung, J., Michaud, M., Walker, B. J., et al. 2013. Sequence-
based discovery of Bradyrhizobium enterica in cord colitis syndrome. New England Journal of Medicine, 369(6):517–528. Available
from: http://dx.doi.org/10.1056/nejmoa1211115.
Bidet, P., Barbut, F., Lalande, V., Burghoffer, B., and Petit, J. C. 1999. Development of a new PCR-ribotyping method for clostridium
difficile based on ribosomal RNA gene sequencing. FEMS Microbiology Letters, 175(2):261–266. Available from: http://view.ncbi.
nlm.nih.gov/pubmed/10386377.
Binga, E. K., Lasken, R. S., and Neufeld, J. D. 2008. Something from (almost) nothing: the impact of multiple displacement amplification
on microbial ecology. The ISME Journal, 2(3):233–241. Available from: http://dx.doi.org/10.1038/ismej.2008.10.
Birnboim, H. C. and Doly, J. 1979. A rapid alkaline extraction procedure for screening recombinant plasmid DNA. Nucleic Acids Research,
7(6):1513–1523. Available from: http://dx.doi.org/10.1093/nar/7.6.1513.
Blainey, P. C. 2013. The future is now: single-cell genomics of bacteria and archaea. FEMS Microbiology Reviews, 37(3):407–427. Available
from: http://dx.doi.org/10.1111/1574-6976.12015.
Bodilis, J., Nsigue-Meilo, S., Besaury, L., and Quillet, L. 2012. Variable copy number, intra-genomic heterogeneities and lateral transfers
of the 16S rRNA gene in pseudomonas. PLoS ONE, 7(4). Available from: http://view.ncbi.nlm.nih.gov/pubmed/22545126.
Boisvert, S., Raymond, F., Godzaridis, E., Laviolette, F., and Corbeil, J. 2012. Ray meta: scalable de novo metagenome assembly and
profiling. Genome Biology, 13(12):R122+. Available from: http://dx.doi.org/10.1186/gb-2012-13-12-r122.
Bonner, W. A., Hulett, H. R., Sweet, R. G., and Herzenberg, L. A. 1972. Fluorescence activated cell sorting. The Review of Scientific
Instruments, 43(3):404–409. Available from: http://view.ncbi.nlm.nih.gov/pubmed/5013444.
Borenfreund, E. and Puerner, J. A. 1985. Toxicity determined in vitro by morphological alterations and neutral red absorption. Toxicology
Letters, 24(2-3):119–124. Available from: http://dx.doi.org/10.1016/0378-4274(85)90046-3.
Borody, T. J. and Khoruts, A. 2012. Fecal microbiota transplantation and emerging applications. Nature Reviews. Gastroenterology and
Hepatology, 9(2):88–96. Available from: http://dx.doi.org/10.1038/nrgastro.2011.244.
Bouskra, D., Brazillon, C., Barard, M., Werts, C., Varona, R., Boneca, I. G., and Eberl, G. A. 2008. Lymphoid tissue genesis induced by
commensals through NOD1 regulates intestinal homeostasis. Nature, 456(7221):507–510. Available from: http://dx.doi.org/10.
1038/nature07450.
228
Bibliography
Braun, V., Hundsberger, T., Leukel, P., Sauerborn, M., and von Eichel-Streiber, C. 1996. Definition of the single integration site of the
pathogenicity locus in Clostridium difficile. Gene, 181(1-2):29–38. Available from: http://view.ncbi.nlm.nih.gov/pubmed/8973304.
Bredel, M., Bredel, C., Juric, D., Kim, Y., Vogel, H., Harsh, G. R., Recht, L. D., Pollack, J. R., and Sikic, B. I. 2005. Amplification of whole
tumor genomes and gene-by-gene mapping of genomic aberrations from limited sources of fresh-frozen and paraffin-embedded DNA.
The Journal of Molecular Diagnostics, 7(2):171–182. Available from: http://dx.doi.org/10.1016/s1525-1578(10)60543-0.
Breitbart, M., Felts, B., Kelley, S., Mahaffy, J. M., Nulton, J., Salamon, P., and Rohwer, F. 2004. Diversity and population structure of a
near-shore marine-sediment viral community. Proceedings. Biological Sciences / The Royal Society, 271(1539):565–574. Available from:
http://dx.doi.org/10.1098/rspb.2003.2628.
Breitbart, M., Haynes, M., Kelley, S., Angly, F., Edwards, R. A., Felts, B., Mahaffy, J. M., Mueller, J., Nulton, J., et al. 2008. Viral diversity
and dynamics in an infant gut. Research in Microbiology, 159(5):367–373. Available from: http://dx.doi.org/10.1016/j.resmic.
2008.04.006.
Breitbart, M., Hewson, I., Felts, B., Mahaffy, J. M., Nulton, J., Salamon, P., and Rohwer, F. 2003. Metagenomic analyses of an uncultured
viral community from human feces. Journal of Bacteriology, 185(20):6220–6223. Available from: http://dx.doi.org/10.1128/jb.
185.20.6220.
Breitbart, M., Salamon, P., Andresen, B., Mahaffy, J. M., Segall, A. M., Mead, D., Azam, F., and Rohwer, F. 2002. Genomic analysis of
uncultured marine viral communities. Proceedings of the National Academy of Sciences of the United States of America, 99(22):14250–
14255. Available from: http://dx.doi.org/10.1073/pnas.202488399.
Bressan, M., Trinsoutrot Gattin, I., Desaire, S., Castel, L., Gangneux, C., and Laval, K. 2015. A rapid flow cytometry method to assess
bacterial abundance in agricultural soil. Applied Soil Ecology, 88:60–68. Available from: http://dx.doi.org/10.1016/j.apsoil.
2014.12.007.
Brouwer, M. S. M., Roberts, A. P., Hussain, H., Williams, R. J., Allan, E., and Mullany, P. 2013. Horizontal gene transfer converts non-
toxigenic clostridium difficile strains into toxin producers. Nature Communications, 4. Available from: http://dx.doi.org/10.1038/
ncomms3601.
Brouwer, M. S. M., Warburton, P. J., Roberts, A. P., Mullany, P., and Allan, E. 2011. Genetic organisation, mobility and predicted functions
of genes on integrated, mobile genetic elements in sequenced strains of Clostridium difficile. PLoS ONE, 6(8):e23014+.
Brown, M. R., Camézuli, S., Davenport, R. J., Petelenz-Kurdziel, E., Øvreås, L., and Curtis, T. P. 2015. Flow cytometric quantification of
viruses in activated sludge. Water Research, 68:414–422. Available from: http://dx.doi.org/10.1016/j.watres.2014.10.018.
Brown, S. P., Le Chat, L., De Paepe, M., and Taddei, F. 2006. Ecology of microbial invasions: amplification allows virus carriers to invade
more rapidly when rare. Current Biology, 16(20):2048–2052. Available from: http://view.ncbi.nlm.nih.gov/pubmed/17055985.
Brussaard, C. P. D. 2004. Optimization of procedures for counting viruses by flow cytometry. Applied and Environmental Microbiology,
70(3):1506–1513. Available from: http://dx.doi.org/10.1128/aem.70.3.1506-1513.2004.
Buehler, B., Hogrefe, H. H., Scott, G., Ravi, H., Pabón-Peña, C., O’Brien, S., Formosa, R., and Happe, S. 2010. Rapid quantification of DNA
libraries for next-generation sequencing. Methods, 50(4):S15–S18. Available from: http://dx.doi.org/10.1016/j.ymeth.2010.01.
004.
Buffie, C. G., Bucci, V., Stein, R. R., McKenney, P. T., Ling, L., Gobourne, A., No, D., Liu, H., Kinnebrew, M., et al. 2014. Precision
microbiome reconstitution restores bile acid mediated resistance to clostridium difficile. Nature, 517(7533):205–208. Available from:
http://dx.doi.org/10.1038/nature13828.
Buh Gasparic, M., Tengs, T., La Paz, J. L. L., Holst-Jensen, A., Pla, M., Esteve, T., Zel, J., and Gruden, K. 2010. Comparison of nine different
real-time PCR chemistries for qualitative and quantitative applications in GMO detection. Analytical and bioanalytical chemistry,
396(6):2023–2029. Available from: http://dx.doi.org/10.1007/s00216-009-3418-0.
Calabi, E., Ward, S., Wren, B., Paxton, T., Panico, M., Morris, H., Dell, A., Dougan, G., and Fairweather, N. 2001. Molecular characterization
of the surface layer proteins from Clostridium difficile. Molecular Microbiology, 40(5):1187–1199. Available from: http://view.ncbi.
nlm.nih.gov/pubmed/11401722.
Cario, E. 2013. Microbiota and innate immunity in intestinal inflammation and neoplasia. Current Opinion in Gastroenterology, 29(1):85–
91. Available from: http://view.ncbi.nlm.nih.gov/pubmed/23207600.
229
Bibliography
Carter, G. P., Lyras, D., Allen, D. L., Mackin, K. E., Howarth, P. M., O’Connor, J. R., and Rood, J. I. 2007. Binary toxin production in
Clostridium difficile is regulated by CdtR, a LytTR family response regulator. Journal of Bacteriology, 189(20):7290–7301. Available
from: http://dx.doi.org/10.1128/jb.00731-07.
Carter, G. P., Rood, J. I., and Lyras, D. 2012. The role of toxin a and toxin b in the virulence of clostridium difficile. Trends in Microbiology,
20(1):21–29. Available from: http://dx.doi.org/10.1016/j.tim.2011.11.003.
Chalfie, M., Tu, Y., Euskirchen, G., Ward, W. W., and Prasher, D. C. 1994. Green fluorescent protein as a marker for gene expression.
Science, 263(5148):802–805. Available from: http://dx.doi.org/10.1126/science.8303295.
ChapetónMontes, D., Candela, T., Collignon, A., and Janoir, C. 2011. Localization of the Clostridium difficile cysteine protease Cwp84
and insights into its maturation process. Journal of Bacteriology, 193(19):5314–5321. Available from: http://dx.doi.org/10.1128/
jb.00326-11.
Chen, F., Lu, J.-r., Binder, B. J., Liu, Y.-c., and Hodson, R. E. 2001. Application of Digital Image Analysis and Flow Cytometry To
Enumerate Marine Viruses Stained with SYBR Gold. Applied and Environmental Microbiology, 67(2):539–545. Available from: http:
//dx.doi.org/10.1128/aem.67.2.539-545.2001.
Chevreux, B., Wetter, T., and Suhai, S. 1999. Genome sequence assembly using trace signals and additional sequence information. In
Computer Science and Biology: Proceedings of the German Conference on Bioinformatics (GCB), volume 99, Pp. 45–56. Available from:
http://mira-assembler.sourceforge.net/docs/DefinitiveGuideToMIRA.html.
Chobot, V., Drage, S., and Hadacek, F. 2011. Redox properties of 8-quinolinol and implications for its mode of action. Natural Product
Communications, 6(5):597–602. Available from: http://view.ncbi.nlm.nih.gov/pubmed/21615015.
Clabots, C. R., Johnson, S., Bettin, K. M., Mathie, P. A., Mulligan, M. E., Schaberg, D. R., Peterson, L. R., and Gerding, D. N. 1993.
Development of a rapid and efficient restriction endonuclease analysis typing system for clostridium difficile and correlation with other
typing systems. Journal of Clinical Microbiology, 31(7):1870–1875. Available from: http://www.ncbi.nlm.nih.gov/pmc/articles/
PMC265648/.
Claesson, M. J., Jeffery, I. B., Conde, S., Power, S. E., O’Connor, E. M., Cusack, S., Harris, H. M. B., Coakley, M., Lakshminarayanan, B.,
et al. 2012. Gut microbiota composition correlates with diet and health in the elderly. Nature, 488(7410):178–184. Available from:
http://dx.doi.org/10.1038/nature11319.
Clarke, S. F., Murphy, E. F., Nilaweera, K., Ross, P. R., Shanahan, F., O’Toole, P. W., and Cotter, P. D. 2012. The gut microbiota and its
relationship to diet and obesity: new insights. Gut Microbes, 3(3):186–202. Available from: http://view.ncbi.nlm.nih.gov/pubmed/
22572830.
Coconnier, M. H., Liévin, V., Bernet-Camard, M. F., Hudault, S., and Servin, A. L. 1997. Antibacterial effect of the adhering human
lactobacillus acidophilus strain LB. Antimicrobial Agents and Chemotherapy, 41(5):1046–1052. Available from: http://www.ncbi.nlm.
nih.gov/pmc/articles/PMC163848/.
Cole, J. R., Wang, Q., Cardenas, E., Fish, J., Chai, B., Farris, R. J., Kulam-Syed-Mohideen, A. S., McGarrell, D. M., Marsh, T., et al. 2009. The
Ribosomal Database Project: improved alignments and new tools for rRNA analysis. Nucleic Acids Research, 37(Database issue):D141–
D145. Available from: http://dx.doi.org/10.1093/nar/gkn879.
Collins, M. D., Lawson, P. A., Willems, A., Cordoba, J. J., Fernandez-Garayzabal, J., Garcia, P., Cai, J., Hippe, H., and Farrow, J. A. 1994.
The phylogeny of the genus Clostridium: proposal of five new genera and eleven new species combinations. International Journal of
Systematic Bacteriology, 44(4):812–826. Available from: http://dx.doi.org/10.1099/00207713-44-4-812.
Coons, A. H., Creech, H. J., and Jones, R. N. 1941. Immunological properties of an antibody containing a fluorescent group. Experimental
Biology and Medicine, 47(2):200–202. Available from: http://dx.doi.org/10.3181/00379727-47-13084p.
Coons, A. H. and Kaplan, M. H. 1950. Localization of antigen in tissue cells; improvements in a method for the detection of antigen by
means of fluorescent antibody. The Journal of Experimental Medicine, 91(1):1–13. Available from: http://view.ncbi.nlm.nih.gov/
pubmed/15395569.
Coupland, P., Chandra, T., Quail, M., Reik, W., and Swerdlow, H. 2012. Direct sequencing of small genomes on the Pacific Biosciences RS
without library preparation. BioTechniques, 53(6):365–372. Available from: http://dx.doi.org/10.2144/000113962.
230
Bibliography
Curry, S. R., Marsh, J. W., Muto, C. A., O’Leary, M. M., Pasculle, A. W., and Harrison, L. H. 2007. tcdC genotypes associated with severe
TcdC truncation in an epidemic clone and other strains of clostridium difficile. Journal of Clinical Microbiology, 45(1):215–221. Available
from: http://view.ncbi.nlm.nih.gov/pubmed/17035492.
David, L. A., Maurice, C. F., Carmody, R. N., Gootenberg, D. B., Button, J. E., Wolfe, B. E., Ling, A. V., Devlin, A. S., Varma, Y., et al. 2014.
Diet rapidly and reproducibly alters the human gut microbiome. Nature, 505(7484):559–563. Available from: http://dx.doi.org/
10.1038/nature12820.
De La Cochetière, M. F., Durand, T., Lalande, V., Petit, J. C., Potel, G., and Beaugerie, L. 2008. Effect of antibiotic therapy on human
fecal microbiota and the relation to the development of Clostridium difficile. Microbial Ecology, 56(3):395–402. Available from: http:
//view.ncbi.nlm.nih.gov/pubmed/18209965.
de la Riva, L., Willing, S. E., Tate, E. W., and Fairweather, N. F. 2011. Roles of cysteine proteases Cwp84 and Cwp13 in biogenesis of the cell
wall of Clostridium difficile. Journal of Bacteriology, 193(13):3276–3285. Available from: http://dx.doi.org/10.1128/jb.00248-11.
De Paepe, M., Hutinet, G., Son, O., Amarir-Bouhram, J., Schbath, S., and Petit, M.-A. A. 2014a. Temperate phages acquire DNA from
defective prophages by relaxed homologous recombination: the role of rad52-like recombinases. PLoS Genetics, 10(3). Available from:
http://view.ncbi.nlm.nih.gov/pubmed/24603854.
De Paepe, M., Leclerc, M., Tinsley, C. R., and Petit, M.-A. A. 2014b. Bacteriophages: an underestimated role in human and animal health?
Frontiers in Cellular and Infection Microbiology, 4. Available from: http://view.ncbi.nlm.nih.gov/pubmed/24734220.
Dean, F. B., Hosono, S., Fang, L., Wu, X., Faruqi, A. F., Bray-Ward, P., Sun, Z., Zong, Q., Du, Y., et al. 2002. Comprehensive human genome
amplification using multiple displacement amplification. Proceedings of the National Academy of Sciences of the United States of America,
99(8):5261–5266. Available from: http://dx.doi.org/10.1073/pnas.082089499.
Dean, F. B., Nelson, J. R., Giesler, T. L., and Lasken, R. S. 2001. Rapid amplification of plasmid and phage DNA using Phi 29 DNA
polymerase and multiply-primed rolling circle amplification. Genome Research, 11(6):1095–1099. Available from: http://dx.doi.
org/10.1101/gr.180501.
del Giorgio, P. A., Prairie, Y. T., and Bird, D. F. 1997. Coupling between rates of bacterial production and the abundance of metabolically
active bacteria in lakes, enumerated using CTC reduction and flow cytometry. Microbial Ecology, 34(2):144–154. Available from:
http://dx.doi.org/10.1007/s002489900044.
Delcher, A. L., Harmon, D., Kasif, S., White, O., and Salzberg, S. L. 1999. Improved microbial gene identification with GLIMMER. Nucleic
Acids Research, 27(23):4636–4641. Available from: http://dx.doi.org/10.1093/nar/27.23.4636.
Demarest, S. J., Hariharan, M., Elia, M., Salbato, J., Jin, P., Bird, C., Short, J. M., Kimmel, B. E., Dudley, M., Woodnutt, G., and Hansen,
G. 2010. Neutralization of Clostridium difficile toxin A using antibody combinations. mAbs, 2(2):190–198. Available from: http:
//www.ncbi.nlm.nih.gov/pmc/articles/PMC2840238/.
Dennehy, P. H. 2000. Transmission of rotavirus and other enteric pathogens in the home. The Pediatric Infectious Disease Journal, 19(10
Suppl). Available from: http://view.ncbi.nlm.nih.gov/pubmed/11052397.
Didelot, X., Eyre, D., Cule, M., Ip, C., Ansari, M., Griffiths, D., Vaughan, A., O’Connor, L., Golubchik, T., et al. 2012. Microevolutionary
analysis of Clostridium difficile genomes to investigate transmission. Genome Biology, 13(12):R118+. Available from: http://dx.doi.
org/10.1186/gb-2012-13-12-r118.
Dietrich, M. A., Truax, R. E., French, D. D., Lea, D. F., Stear, M. J., and Newman, M. J. 1991. Measurement of antibody binding to intact
bacteria using flow cytometric techniques. Journal of Microbiological Methods, 13(4):281–291. Available from: http://dx.doi.org/10.
1016/0167-7012(91)90065-x.
Dingle, K. E., Didelot, X., Ansari, M. A., Eyre, D. W., Vaughan, A., Griffiths, D., Ip, C. L. C., Batty, E. M., Golubchik, T., et al. 2013.
Recombinational switching of the Clostridium difficile S-Layer and a novel glycosylation gene cluster revealed by large-scale whole-
genome sequencing. Journal of Infectious Diseases, 207(4):675–686. Available from: http://dx.doi.org/10.1093/infdis/jis734.
Dingle, K. E., Elliott, B., Robinson, E., Griffiths, D., Eyre, D. W., Stoesser, N., Vaughan, A., Golubchik, T., Fawley, W. N., et al. 2014.
Evolutionary history of the clostridium difficile pathogenicity locus. Genome Biology and Evolution, 6(1):36–52. Available from: http:
//dx.doi.org/10.1093/gbe/evt204.
231
Bibliography
Dingle, K. E., Griffiths, D., Didelot, X., Evans, J., Vaughan, A., Kachrimanidou, M., Stoesser, N., Jolley, K. A., Golubchik, T., et al. 2011.
Clinical Clostridium difficile: clonality and pathogenicity locus diversity. PLoS ONE, 6(5):e19993+. Available from: http://dx.doi.
org/10.1371/journal.pone.0019993.
Dixon, P. 2003. VEGAN, a package of r functions for community ecology. Journal of Vegetation Science, 14(6):927–930. Available from:
http://dx.doi.org/10.1111/j.1654-1103.2003.tb02228.x.
Dodsworth, J. A., Blainey, P. C., Murugapiran, S. K., Swingley, W. D., Ross, C. A., Tringe, S. G., Chain, P. S. G., Scholz, M. B., Lo, C.-C.,
et al. 2013. Single-cell and metagenomic analyses indicate a fermentative and saccharolytic lifestyle for members of the OP9 lineage.
Nature Communications, 4:1854+. Available from: http://dx.doi.org/10.1038/ncomms2884.
Drudy, D., Kyne, L., O’Mahony, R., and Fanning, S. 2007. gyrA mutations in fluoroquinolone-resistant Clostridium difficile PCR-027.
Emerging Infectious Diseases, 13(3):504–505. Available from: http://dx.doi.org/10.3201/eid1303.060771.
Du, P., Cao, B., Wang, J., Li, W., Jia, H., Zhang, W., Lu, J., Li, Z., Yu, H., Chen, C., and Cheng, Y. 2014. Sequence variation in tcdA
and tcdB of clostridium difficile: ST37 with truncated tcdA is a potential epidemic strain in china. Journal of Clinical Microbiology,
52(9):3264–3270. Available from: http://dx.doi.org/10.1128/jcm.03487-13.
Duhaime, M. B., Deng, L., Poulos, B. T., and Sullivan, M. B. 2012. Towards quantitative metagenomics of wild viruses and other ultra-low
concentration DNA samples: a rigorous assessment and optimization of the linker amplification method. Environmental Microbiology,
14(9):2526–2537. Available from: http://dx.doi.org/10.1111/j.1462-2920.2012.02791.x.
DuRand, M. D., Olson, R. J., and Chisholm, S. W. 2001. Phytoplankton population dynamics at the bermuda atlantic time-series station
in the sargasso sea. Deep Sea Research Part II: Topical Studies in Oceanography, 48(8-9):1983–2003. Available from: http://dx.doi.
org/10.1016/s0967-0645(00)00166-1.
Durbán, A., Abellán, J. J., Jiménez-Hernández, N., Artacho, A., Garrigues, V., Ortiz, V., Ponce, J., Latorre, A., and Moya, A. 2013. Instability
of the faecal microbiota in diarrhoea-predominant irritable bowel syndrome. FEMS Microbiology and Ecology, 86(3):581–589. Available
from: http://view.ncbi.nlm.nih.gov/pubmed/23889283.
Durbán, A., Abellán, J. J., Jiménez-Hernández, N., Ponce, M., Ponce, J., Sala, T., D’Auria, G., Latorre, A., and Moya, A. 2011. Assessing
gut microbial diversity from feces and rectal mucosa. Microbial ecology, 61(1):123–133. Available from: http://view.ncbi.nlm.nih.
gov/pubmed/20734040.
Dutilh, B. E., Cassman, N., McNair, K., Sanchez, S. E., Silva, G. G. Z., Boling, L., Barr, J. J., Speth, D. R., Seguritan, V., et al. 2014. A highly
abundant bacteriophage discovered in the unknown sequences of human faecal metagenomes. Nature Communications, 5. Available
from: http://dx.doi.org/10.1038/ncomms5498.
Eckburg, P. B., Bik, E. M., Bernstein, C. N., Purdom, E., Dethlefsen, L., Sargent, M., Gill, S. R., Nelson, K. E., and Relman, D. A. 2005.
Diversity of the human intestinal microbial flora. Science, 308(5728):1635–1638. Available from: http://dx.doi.org/10.1126/
science.1110591.
Edgar, R. C. 2010. Search and clustering orders of magnitude faster than BLAST. Bioinformatics, 26(19):2460–2461. Available from:
http://dx.doi.org/10.1093/bioinformatics/btq461.
Edwards, R. A. and Rohwer, F. 2005. Viral metagenomics. Nature Reviews Microbiology, 3(6):504–510. Available from: http://dx.doi.
org/10.1038/nrmicro1163.
Ekimov, A. I., Efros, A., and Onushchenko, A. A. 1985. Quantum size effect in semiconductor microcrystals. Solid State Communications,
56(11):921–924. Available from: http://dx.doi.org/10.1016/s0038-1098(85)80025-9.
Elliott, B., Dingle, K. E., Didelot, X., Crook, D. W., and Riley, T. V. 2014. The complexity and diversity of the pathogenicity locus in
Clostridium difficile clade 5. Genome Biology and Evolution, 6(12):3159–3170. Available from: http://dx.doi.org/10.1093/gbe/
evu248.
Endt, K., Stecher, B., Chaffron, S., Slack, E., Tchitchek, N., Benecke, A., Van Maele, L., Sirard, J.-C. C., Mueller, A. J., et al. 2010. The
microbiota mediates pathogen clearance from the gut lumen after non-typhoidal salmonella diarrhea. PLoS Pathogens, 6(9):e1001097+.
Available from: http://dx.doi.org/10.1371/journal.ppat.1001097.
232
Bibliography
Evans, M. E., Pollack, M., Hardegen, N. J., Koles, N. L., Guelde, G., and Chia, J. K. S. 1990. Fluorescence-activated cell sorter analysis of
binding by lipopolysaccharide-specific monoclonal antibodies to gram-negative bacteria. Journal of Infectious Diseases, 162(1):148–155.
Available from: http://dx.doi.org/10.1093/infdis/162.1.148.
Eyre, D. W., Cule, M. L., Griffiths, D., Crook, D. W., Peto, T. E. A., Walker, A. S., and Wilson, D. J. 2013a. Detection of mixed infection from
bacterial whole genome sequence data allows assessment of its role in Clostridium difficile transmission. PLoS Computational Biology,
9(5):e1003059+. Available from: http://dx.doi.org/10.1371/journal.pcbi.1003059.
Eyre, D. W., Cule, M. L., Wilson, D. J., Griffiths, D., Vaughan, A., O’Connor, L., Ip, C. L. C., Golubchik, T., Batty, E. M., et al. 2013b.
Diverse sources of C. difficile infection identified on whole-genome sequencing. New England Journal of Medicine, 369(13):1195–1205.
Available from: http://dx.doi.org/10.1056/nejmoa1216064.
Eyre, D. W., Golubchik, T., Gordon, N. C., Bowden, R., Piazza, P., Batty, E. M., Ip, C. L. C., Wilson, D. J., Didelot, X., et al. 2012a. A pilot
study of rapid benchtop sequencing of Staphylococcus aureus and Clostridium difficile for outbreak detection and surveillance. BMJ
Open, 2(3):e001124+. Available from: http://dx.doi.org/10.1136/bmjopen-2012-001124.
Eyre, D. W., Walker, A. S., Griffiths, D., Wilcox, M. H., Wyllie, D. H., Dingle, K. E., Crook, D. W., and Peto, T. E. 2012b. Clostridium
difficile mixed infection and reinfection. Journal of Clinical Microbiology, 50(1):142–144. Available from: http://view.ncbi.nlm.nih.
gov/pubmed/22075589.
Fedorak, R. N. 2010. Probiotics in the management of ulcerative colitis. Gastroenterology & Hepatology, 6(11):688–690. Available from:
http://www.ncbi.nlm.nih.gov/pmc/articles/PMC3033537/.
Fei, N. and Zhao, L. 2012. An opportunistic pathogen isolated from the gut of an obese human causes obesity in germfree mice. The ISME
Journal, 7(4):880–884. Available from: http://dx.doi.org/10.1038/ismej.2012.153.
Finkbeiner, S. R., Allred, A. F., Tarr, P. I., Klein, E. J., Kirkwood, C. D., and Wang, D. 2008. Metagenomic Analysis of Human Diarrhea:
Viral Detection and Discovery. PLoS Pathog, 4(2):e1000011+. Available from: http://dx.doi.org/10.1371/journal.ppat.1000011.
Fire, A. and Xu, S. Q. 1995. Rolling replication of short DNA circles. Proceedings of the National Academy of Sciences of the United States of
America, 92(10):4641–4645. Available from: http://www.pnas.org/content/92/10/4641.abstract.
Focà, A., Liberto, M. C., Quirino, A., Marascio, N., Zicca, E., and Pavia, G. 2015. Gut inflammation and immunity: What is the role of the
human gut virome? Mediators of Inflammation, Pp. 326032+. Available from: http://www.hindawi.com/journals/mi/2015/326032/.
Franks, A. H., Harmsen, H. J., Raangs, G. C., Jansen, G. J., Schut, F., and Welling, G. W. 1998. Variations of bacterial populations in
human feces measured by fluorescent in situ hybridization with group-specific 16S rRNA-targeted oligonucleotide probes. Applied and
Environmental Microbiology, 64(9):3336–3345. Available from: http://aem.asm.org/content/64/9/3336.abstract.
Franzosa, E. A., Morgan, X. C., Segata, N., Waldron, L., Reyes, J., Earl, A. M., Giannoukos, G., Boylan, M. R., Ciulla, D., et al. 2014.
Relating the metatranscriptome and metagenome of the human gut. Proceedings of the National Academy of Sciences of the United States
of America, 111(22):E2329–E2338. Available from: http://dx.doi.org/10.1073/pnas.1319284111.
Fraser, R. S. and Creanor, J. 1975. The mechanism of inhibition of ribonucleic acid synthesis by 8-hydroxyquinoline and the antibiotic
lomofungin. The Biochemical journal, 147(3):401–410. Available from: http://view.ncbi.nlm.nih.gov/pubmed/810137.
Frias-Lopez, J., Shi, Y., Tyson, G. W., Coleman, M. L., Schuster, S. C., Chisholm, S. W., and DeLong, E. F. 2008. Microbial community gene
expression in ocean surface waters. Proceedings of the National Academy of Sciences of the United States of America, 105(10):3805–3810.
Available from: http://dx.doi.org/10.1073/pnas.0708897105.
Fuchs, B. M., Wallner, G., Beisker, W., Schwippl, I., Ludwig, W., and Amann, R. 1998. Flow cytometric analysis of the in situ accessibility of
escherichia coli 16S rRNA for fluorescently labeled oligonucleotide probes. Applied and Environmental Microbiology, 64(12):4973–4982.
Available from: http://aem.asm.org/cgi/content/abstract/64/12/4973.
Fulwyler, M. J. 1965. Electronic separation of biological cells by volume. Science, 150(3698):910–911. Available from: http://dx.doi.
org/10.1126/science.150.3698.910.
Galdeano, C. M. and Perdigón, G. 2006. The probiotic bacterium Lactobacillus casei induces activation of the gut mucosal immune system
through innate immunity. Clinical and Vaccine Immunology, 13(2):219–226. Available from: http://view.ncbi.nlm.nih.gov/pubmed/
16467329.
233
Bibliography
Gao, X. W., Mubasher, M., Fang, C. Y., Reifer, C., and Miller, L. E. 2010. Dose-response efficacy of a proprietary probiotic formula of
Lactobacillus acidophilus cl1285 and Lactobacillus casei lbc80r for antibiotic-associated diarrhea and Clostridium difficile-associated
diarrhea prophylaxis in adult patients. American Journal of Gastroenterology, 105(7):1636–1641. Available from: http://dx.doi.org/
10.1038/ajg.2010.11.
Geric, B., Rupnik, M., Gerding, D. N., Grabnar, M., and Johnson, S. 2004. Distribution of Clostridium difficile variant toxinotypes and
strains with binary toxin genes among clinical isolates in an american hospital. Journal of Medical Microbiology, 53(Pt 9):887–894.
Available from: http://view.ncbi.nlm.nih.gov/pubmed/15314196.
Ghosh, D., Roy, K., Williamson, K. E., White, D. C., Wommack, K. E., Sublette, K. L., and Radosevich, M. 2008. Prevalence of lysogeny
among soil bacteria and presence of 16S rRNA and trzN genes in viral-community DNA. Applied and Environmental Microbiology,
74(2):495–502. Available from: http://dx.doi.org/10.1128/aem.01435-07.
Ghoshal, U. C., Shukla, R., Ghoshal, U., Gwee, K.-A. A., Ng, S. C., and Quigley, E. M. 2012. The gut microbiota and irritable bowel
syndrome: friend or foe? International Journal of Inflammation, 2012. Available from: http://view.ncbi.nlm.nih.gov/pubmed/
22577594.
Gill, S. R., Pop, M., Deboy, R. T., Eckburg, P. B., Turnbaugh, P. J., Samuel, B. S., Gordon, J. I., Relman, D. A., Fraser-Liggett, C. M.,
and Nelson, K. E. 2006. Metagenomic analysis of the human distal gut microbiome. Science, 312(5778):1355–1359. Available from:
http://dx.doi.org/10.1126/science.1124234.
Glass, R. I., Parashar, U. D., and Estes, M. K. 2009. Norovirus gastroenteritis. New England Journal of Medicine, 361(18):1776–1785.
Available from: http://dx.doi.org/10.1056/nejmra0804575.
Goodman, A. L., Kallstrom, G., Faith, J. J., Reyes, A., Moore, A., Dantas, G., and Gordon, J. I. 2011. Extensive personal human gut
microbiota culture collections characterized and manipulated in gnotobiotic mice. Proceedings of the National Academy of Sciences of the
United States of America, 108(15):6252–6257. Available from: http://dx.doi.org/10.1073/pnas.1102938108.
Goorhuis, A., Bakker, D., Corver, J., Debast, S. B., Harmanus, C., Notermans, D. W., Bergwerff, A. A., Dekker, F. W., and Kuijper, E. J.˙
Clinical Infectious Diseases.
Gosalbes, M. J., Llop, S., Vallès, Y., Moya, A., Ballester, F., and Francino, M. P. 2013. Meconium microbiota types dominated by lactic acid
or enteric bacteria are differentially associated with maternal eczema and respiratory problems in infants. Clinical and Experimental
Allergy, 43(2):198–211. Available from: http://view.ncbi.nlm.nih.gov/pubmed/23331561.
Graf, D., Di Cagno, R., Fåk, F., Flint, H. J., Nyman, M., Saarela, M., and Watzl, B. 2015. Contribution of diet to the composition of the
human gut microbiota. Microbial ecology in health and disease, 26. Available from: http://view.ncbi.nlm.nih.gov/pubmed/25656825.
Gregory, J. C., Buffa, J. A., Org, E., Wang, Z., Levison, B. S., Zhu, W., Wagner, M. A., Bennett, B. J., Li, L., DiDonato, J. A., Lusis, A. J., and
Hazen, S. L. 2014. Transmission of atherosclerosis susceptibility with gut microbial transplantation. Journal of Biological Chemistry,
Pp. jbc.M114.618249+. Available from: http://dx.doi.org/10.1074/jbc.m114.618249.
Griffiths, D., Fawley, W., Kachrimanidou, M., Bowden, R., Crook, D. W., Fung, R., Golubchik, T., Harding, R. M., Jeffery, K. J. M., et al.
2010. Multilocus sequence typing of Clostridium difficile. Journal of Clinical Microbiology, 48(3):770–778. Available from: http:
//dx.doi.org/10.1128/jcm.01796-09.
Guinane, C. M. and Cotter, P. D. 2013. Role of the gut microbiota in health and chronic gastrointestinal disease: understanding a
hidden metabolic organ. Therapeutic Advances in Gastroenterology, 6(4):295–308. Available from: http://dx.doi.org/10.1177/
1756283x13482996.
Gunasekera, T. S., Attfield, P. V., and Veal, D. A. 2000. A flow cytometry method for rapid detection and enumeration of total bacteria in
milk. Applied and Environmental Microbiology, 66(3):1228–1232. Available from: http://dx.doi.org/10.1128/aem.66.3.1228-1232.
2000.
Günther, S., Trutnau, M., Kleinsteuber, S., Hause, G., Bley, T., Röske, I., Harms, H., and Müller, S. 2009. Dynamics of
Polyphosphate-Accumulating bacteria in wastewater treatment plant microbial communities detected via DAPI (4âĂš,6âĂš-
Diamidino-2-Phenylindole) and tetracycline labeling. Applied and Environmental Microbiology, 75(7):2111–2121. Available from:
http://dx.doi.org/10.1128/aem.01540-08.
234
Bibliography
Guy, L., Kultima, J. R., and Andersson, S. G. E. 2010. genoPlotR: comparative gene and genome visualization in R. Bioinformatics,
26(18):2334–2335. Available from: http://dx.doi.org/10.1093/bioinformatics/btq413.
Hahn, M. W. 2004. Broad diversity of viable bacteria in ’sterile’ (0.2 µm) filtered water. Research in Microbiology, 155(8):688–691. Available
from: http://dx.doi.org/10.1016/j.resmic.2004.05.003.
Hahne, F., LeMeur, N., Brinkman, R., Ellis, B., Haaland, P., Sarkar, D., Spidlen, J., Strain, E., and Gentleman, R. 2009. flowCore: a
Bioconductor package for high throughput flow cytometry. BMC Bioinformatics, 10(1):106+. Available from: http://dx.doi.org/10.
1186/1471-2105-10-106.
Haiser, H. J. and Turnbaugh, P. J. 2013. Developing a metagenomic view of xenobiotic metabolism. Pharmacological Research, 69(1):21–31.
Available from: http://dx.doi.org/10.1016/j.phrs.2012.07.009.
Hammond, G. A. and Johnson, J. L. 1995. The toxigenic element of Clostridium difficile strain VPI 10463. Microbial Pathogenesis,
19(4):203–213. Available from: http://dx.doi.org/10.1016/s0882-4010(95)90263-5.
Handelsman, J. 2004. Metagenomics: application of genomics to uncultured microorganisms. Microbiology and Molecular Biology Reviews,
68(4):669–685. Available from: http://dx.doi.org/10.1128/mmbr.68.4.669-685.2004.
Hapfelmeier, S., Lawson, M. A., Slack, E., Kirundi, J. K., Stoel, M., Heikenwalder, M., Cahenzli, J., Velykoredko, Y., Balmer, M. L., et al.
2010. Reversible microbial colonization of germ-free mice reveals the dynamics of IgA immune responses. Science, 328(5986):1705–
1709. Available from: http://dx.doi.org/10.1126/science.1188454.
He, J., Sakaguchi, K., and Suzuki, T. 2012. Acquired tolerance to oxidative stress in bifidobacterium longum 105-A via expression of a
catalase gene. Applied and environmental microbiology, 78(8):2988–2990. Available from: http://dx.doi.org/10.1128/aem.07093-11,
doi:10.1128/aem.07093-11.
He, M., Miyajima, F., Roberts, P., Ellison, L., Pickard, D. J., Martin, M. J., Connor, T. R., Harris, S. R., Fairley, D., et al. 2013. Emergence
and global spread of epidemic healthcare-associated Clostridium difficile. Nature Genetics, 45(1):109–113. Available from: http:
//dx.doi.org/10.1038/ng.2478.
He, M., Sebaihia, M., Lawley, T. D., Stabler, R. A., Dawson, L. F., Martin, M. J., Holt, K. E., Seth-Smith, H. M. B., Quail, M. A., Rance,
R., et al. 2010. Evolutionary dynamics of Clostridium difficile over short and long time scales. Proceedings of the National Academy of
Sciences of the United States of America, 107(16):7527–7532. Available from: http://dx.doi.org/10.1073/pnas.0914322107.
Héchard, Y., Jayat, C., Letellier, F., Julien, R., Cenatiempo, Y., and Ratinaud, M. H. 1992. On-line visualization of the competitive behavior
of antagonistic bacteria. Applied and Environmental Microbiology, 58(11):3784–3786. Available from: http://view.ncbi.nlm.nih.
gov/pubmed/1482199.
Heeg, D., Burns, D. A., Cartman, S. T., and Minton, N. P. 2012. Spores of clostridium difficile clinical isolates display a diverse germination
response to bile salts. PloS one, 7(2). Available from: http://view.ncbi.nlm.nih.gov/pubmed/22384234.
Heijtz, R. D., Wang, S., Anuar, F., Qian, Y., Björkholm, B., Samuelsson, A., Hibberd, M. L., Forssberg, H., and Pettersson, S. 2011. Normal
gut microbiota modulates brain development and behavior. Proceedings of the National Academy of Sciences of the United States of
America, 108(7):3047–3052. Available from: http://dx.doi.org/10.1073/pnas.1010529108.
Hennequin, C., Janoir, C., Barc, M.-C. C., Collignon, A., and Karjalainen, T. 2003. Identification and characterization of a fibronectin-
binding protein from Clostridium difficile. Microbiology (Reading, England), 149(Pt 10):2779–2787. Available from: http://view.
ncbi.nlm.nih.gov/pubmed/14523111.
HMPC 2012. Structure, function and diversity of the healthy human microbiome. Nature, 486(7402):207–214. Available from: http:
//dx.doi.org/10.1038/nature11234.
Hooper, L. V. and Gordon, J. I. 2001. Commensal Host-Bacterial relationships in the gut. Science, 292(5519):1115–1118. Available from:
http://dx.doi.org/10.1126/science.1058709.
Hooper, L. V., Wong, M. H., Thelin, A., Hansson, L., Falk, P. G., and Gordon, J. I. 2001. Molecular analysis of commensal host-microbial
relationships in the intestine. Science, 291(5505):881–884. Available from: http://dx.doi.org/10.1126/science.291.5505.881.
Hosono, S., Faruqi, A. F., Dean, F. B., Du, Y., Sun, Z., Wu, X., Du, J., Kingsmore, S. F., Egholm, M., and Lasken, R. S. 2003. Unbiased
whole-genome amplification directly from clinical samples. Genome Research, 13(5):954–964. Available from: http://dx.doi.org/
10.1101/gr.816903.
235
Bibliography
Hsiao, E. Y., McBride, S. W., Hsien, S., Sharon, G., Hyde, E. R., McCue, T., Codelli, J. A., Chow, J., Reisman, S. E., et al. 2013. Microbiota
modulate behavioral and physiological abnormalities associated with neurodevelopmental disorders. Cell, 155(7):1451–1463. Available
from: http://dx.doi.org/10.1016/j.cell.2013.11.024.
Huang, J., Zheng, Z., Andersson, A. F., Engstrand, L., and Ye, W. 2011. Rapid screening of complex DNA samples by single-molecule
amplification and sequencing. PLoS ONE, 6(5):e19723+. Available from: http://dx.doi.org/10.1371/journal.pone.0019723.
Hunter, S., Jones, P., Mitchell, A., Apweiler, R., Attwood, T. K., Bateman, A., Bernard, T., Binns, D., et al. 2012. InterPro in 2011: new
developments in the family and domain prediction database. Nucleic Acids Research, 40(Database issue):D306–D312. Available from:
http://dx.doi.org/10.1093/nar/gkr948.
Huson, D. H., Auch, A. F., Qi, J., and Schuster, S. C. 2007. MEGAN analysis of metagenomic data. Genome Research, 17(3):377–386.
Available from: http://dx.doi.org/10.1101/gr.5969107.
Hutchison, C. A., Smith, H. O., Pfannkoch, C., and Venter, J. C. 2005. Cell-free cloning using phi29 DNA polymerase. Proceedings of
the National Academy of Sciences of the United States of America, 102(48):17332–17336. Available from: http://dx.doi.org/10.1073/
pnas.0508809102.
Inoue, J., Shigemori, Y., and Mikawa, T. 2006. Improvements of rolling circle amplification (RCA) efficiency and accuracy using thermus
thermophilus SSB mutant protein. Nucleic Acids Research, 34(9). Available from: http://view.ncbi.nlm.nih.gov/pubmed/16707659.
Ishoey, T., Woyke, T., Stepanauskas, R., Novotny, M., and Lasken, R. S. 2008. Genomic sequencing of single microbial cells from
environmental samples. Current Opinion in Microbiology, 11(3):198–204. Available from: http://dx.doi.org/10.1016/j.mib.2008.
05.006.
Iwamoto, K., Bundo, M., Ueda, J., Nakano, Y., Ukai, W., Hashimoto, E., Saito, T., and Kato, T. 2007. Detection of chromosomal structural
alterations in single cells by snp arrays: A systematic survey of amplification bias and optimized workflow. PLoS ONE, 2(12):e1306+.
Available from: http://dx.doi.org/10.1371/journal.pone.0001306.
Janoir, C., Péchiné, S., Grosdidier, C., and Collignon, A. 2007. Cwp84, a surface-associated protein of Clostridium difficile, is a cysteine
protease with degrading activity on extracellular matrix proteins. Journal of Bacteriology, 189(20):7174–7180. Available from: http:
//dx.doi.org/10.1128/jb.00578-07.
Janvilisri, T., Scaria, J., Thompson, A. D., Nicholson, A., Limbago, B. M., Arroyo, L. G., Songer, J. G., Gröhn, Y. T., and Chang, Y.-F. F.
2009. Microarray identification of Clostridium difficile core components and divergent regions associated with host origin. Journal of
Bacteriology, 191(12):3881–3891. Available from: http://dx.doi.org/10.1128/jb.00222-09.
Jeon, J.-H., Lee, C.-H., and Lee, H.-S. 2009. Antimicrobial activities of 2-Methyl-8-Hydroxyquinoline and its derivatives against human
intestinal bacteria. Journal of the Korean Society for Applied Biological Chemistry, 52(2):202–205. Available from: http://dx.doi.org/
10.3839/jksabc.2009.037.
Jiang, Z., Zhang, X., Deka, R., and Jin, L. 2005. Genome amplification of single sperm using multiple displacement amplification. Nucleic
Acids Research, 33(10):e91. Available from: http://dx.doi.org/10.1093/nar/gni089.
Kalisky, T. and Quake, S. R. 2011. Single-cell genomics. Nature Methods, 8(4):311–314. Available from: http://dx.doi.org/10.1038/
nmeth0411-311.
Kamentsky, L. A. and Melamed, M. R. 1967. Spectrophotometric cell sorter. Science, 156(3780):1364–1365. Available from: http:
//dx.doi.org/10.1126/science.156.3780.1364.
Karpińska, G., Mazurek, A. P., and Dobrowolski, J. C. 2010. On tautomerism and substituent effect in 8-hydroxyquinoline-derived
medicine molecules. Journal of Molecular Structure, 961(1-3):101–106. Available from: http://dx.doi.org/10.1016/j.theochem.
2010.09.006.
Kawamoto, S., Maruya, M., Kato, L. M., Suda, W., Atarashi, K., Doi, Y., Tsutsui, Y., Qin, H., Honda, K., et al. 2014. Foxp3(+) t cells
regulate immunoglobulin a selection and facilitate diversification of bacterial species responsible for immune homeostasis. Immunity,
41(1):152–165. Available from: http://view.ncbi.nlm.nih.gov/pubmed/25017466.
Kawamoto, S., Tran, T. H., Maruya, M., Suzuki, K., Doi, Y., Tsutsui, Y., Kato, L. M., and Fagarasan, S. 2012. The inhibitory receptor pd-1
regulates iga selection and bacterial composition in the gut. Science, 336(6080):485–489. Available from: http://dx.doi.org/10.
1126/science.1217718.
236
Bibliography
Kelly, C. P. and Kyne, L. 2011. The host immune response to Clostridium difficile. Journal of Medical Microbiology, 60(8):1070–1079.
Available from: http://dx.doi.org/10.1099/jmm.0.030015-0.
Kelly, C. P., Pothoulakis, C., and LaMont, J. T. 1994. Clostridium difficile colitis. New England Journal of Medicine, 330(4):257–262.
Available from: http://dx.doi.org/10.1056/nejm199401273300406.
Kim, K.-H. H., Chang, H.-W. W., Nam, Y.-D. D., Roh, S. W. W., Kim, M.-S. S., Sung, Y., Jeon, C. O. O., Oh, H.-M. M., and Bae, J.-W. W. 2008.
Amplification of uncultured single-stranded DNA viruses from rice paddy soil. Applied and Environmental Microbiology, 74(19):5975–
5985. Available from: http://dx.doi.org/10.1128/aem.01275-08.
Klaassen, C. H., van Haren, H. A., and Horrevorts, A. M. 2002. Molecular fingerprinting of clostridium difficile isolates: pulsed-field
gel electrophoresis versus amplified fragment length polymorphism. Journal of Clinical Microbiology, 40(1):101–104. Available from:
http://www.ncbi.nlm.nih.gov/pmc/articles/PMC120100/.
Klein, C. A., Schmidt-Kittler, O., Schardt, J. A., Pantel, K., Speicher, M. R., and Riethmüller, G. 1999. Comparative genomic hybridization,
loss of heterozygosity, and DNA sequence analysis of single cells. Proceedings of the National Academy of Sciences of the United States of
America, 96(8):4494–4499. Available from: http://dx.doi.org/10.1073/pnas.96.8.4494.
Klindworth, A., Pruesse, E., Schweer, T., Peplies, J., Quast, C., Horn, M., and Glöckner, F. O. O. 2013. Evaluation of general 16S ribosomal
RNA gene PCR primers for classical and next-generation sequencing-based diversity studies. Nucleic Acids Research, 41(1):e1. Available
from: http://dx.doi.org/10.1093/nar/gks808.
Klucar, L., Stano, M., and Hajduk, M. 2010. phiSITE: database of gene regulation in bacteriophages. Nucleic Acids Research, 38(suppl
1):D366–D370. Available from: http://dx.doi.org/10.1093/nar/gkp911.
Knecht, H., Neulinger, S. C., Heinsen, F. A., Knecht, C., Schilhabel, A., Schmitz, R. A., Zimmermann, A., dos Santos, V. M., Ferrer, M., et al.
2014. Effects of beta-lactam antibiotics and fluoroquinolones on human gut microbiota in relation to Clostridium difficile associated
diarrhea. PLoS ONE, 9(2):e89417+. Available from: http://dx.doi.org/10.1371/journal.pone.0089417.
Knierim, E., Lucke, B., Schwarz, J. M. M., Schuelke, M., and Seelow, D. 2011. Systematic comparison of three methods for fragmentation of
long-range PCR products for next generation sequencing. PLoS ONE, 6(11):e28240+. Available from: http://dx.doi.org/10.1371/
journal.pone.0028240.
Koboldt, D. C., Zhang, Q., Larson, D. E., Shen, D., McLellan, M. D., Lin, L., Miller, C. A., Mardis, E. R., Ding, L., and Wilson, R. K. 2012.
VarScan 2: Somatic mutation and copy number alteration discovery in cancer by exome sequencing. Genome Research, 22(3):568–576.
Available from: http://dx.doi.org/10.1101/gr.129684.111.
Koenig, J. E., Spor, A., Scalfone, N., Fricker, A. D., Stombaugh, J., Knight, R., Angenent, L. T., and Ley, R. E. 2011. Succession of microbial
consortia in the developing infant gut microbiome. Proceedings of the National Academy of Sciences of the United States of America,
108(S1):4578–4585. Available from: http://dx.doi.org/10.1073/pnas.1000081107.
Koo, H. L., Van, J. N., Zhao, M., Ye, X., Revell, P. A., Jiang, Z.-D. D., Grimes, C. Z., Koo, D. C., Lasco, T., et al. 2014. Real-time polymerase
chain reaction detection of asymptomatic Clostridium difficile colonization and rising C. difficile-associated disease rates. Infection
control and hospital epidemiology : the official journal of the Society of Hospital Epidemiologists of America, 35(6):667–673. Available from:
http://view.ncbi.nlm.nih.gov/pubmed/24799643.
Kostic, A. D., Gevers, D., Pedamallu, C. S. S., Michaud, M., Duke, F., Earl, A. M., Ojesina, A. I., Jung, J., Bass, A. J., et al. 2012. Genomic
analysis identifies association of fusobacterium with colorectal carcinoma. Genome Research, 22(2):292–298. Available from: http:
//dx.doi.org/10.1101/gr.126573.111.
Kristensen, D. M., Mushegian, A. R., Dolja, V. V., and Koonin, E. V. 2010. New dimensions of the virus world discovered through
metagenomics. Trends in Microbiology, 18(1):11–19. Available from: http://dx.doi.org/10.1016/j.tim.2009.11.003.
Kuijper, E. J., Barbut, F., Brazier, J. S., Kleinkauf, N., Eckmanns, T., Lambert, M. L., Drudy, D., Fitzpatrick, F., Wiuff, C., Brown, D. J., et al.
2008. Update of clostridium difficile infection due to PCR ribotype 027 in europe, 2008. Euro Surveillance, 13(31). Available from:
http://view.ncbi.nlm.nih.gov/pubmed/18761903.
Kunin, V., Engelbrektson, A., Ochman, H., and Hugenholtz, P. 2010. Wrinkles in the rare biosphere: pyrosequencing errors can lead to
artificial inflation of diversity estimates. Environmental Microbiology, 12(1):118–123. Available from: http://dx.doi.org/10.1111/
j.1462-2920.2009.02051.x.
237
Bibliography
Kuroda, M., Serizawa, M., Okutani, A., Sekizuka, T., Banno, S., and Inoue, S. 2010. Genome-wide single nucleotide polymorphism typing
method for identification of Bacillus anthracis species and strains among B. cereus group species. Journal of Clinical Microbiology,
48(8):2821–2829. Available from: http://view.ncbi.nlm.nih.gov/pubmed/20554827.
Kyne, L., Warny, M., Qamar, A., and Kelly, C. P. 2000. Asymptomatic carriage of Clostridium difficile and serum levels of IgG
antibody against toxin A. New England Journal of Medicine, 342(6):390–397. Available from: http://dx.doi.org/10.1056/
nejm200002103420604.
Ladner, J. T., Beitzel, B., Chain, P. S. G., Davenport, M. G., Donaldson, E., Frieman, M., Kugelman, J., Kuhn, J. H., O’Rear, J., et al.
2014. Standards for sequencing viral genomes in the era of high-throughput sequencing. mBio, 5(3):e01360–14+. Available from:
http://dx.doi.org/10.1128/mbio.01360-14.
Lage, J. M., Leamon, J. H., Pejovic, T., Hamann, S., Lacey, M., Dillon, D., Segraves, R., Vossbrinck, B., González, A., et al. 2003. Whole
genome analysis of genetic alterations in small DNA samples using hyperbranched strand displacement amplification and array-CGH.
Genome Research, 13(2):294–307. Available from: http://dx.doi.org/10.1101/gr.377203.
Lang, A. S., Zhaxybayeva, O., and Beatty, J. T. 2012. Gene transfer agents: phage-like elements of genetic exchange. Nature Reviews.
Microbiology, 10(7):472–482. Available from: http://view.ncbi.nlm.nih.gov/pubmed/22683880.
Langmead, B. and Salzberg, S. L. 2012. Fast gapped-read alignment with bowtie 2. Nature Methods, 9(4):357–359. Available from:
http://dx.doi.org/10.1038/nmeth.1923.
Lasken, R. S. 2013. Single-cell sequencing in its prime. Nature Biotechnology, 31(3):211–212. Available from: http://dx.doi.org/10.
1038/nbt.2523.
Lasken, R. S. and Stockwell, T. B. 2007. Mechanism of chimera formation during the multiple displacement amplification reaction. BMC
Biotechnology, 7:19+. Available from: http://dx.doi.org/10.1186/1472-6750-7-19.
Law, J., Jovel, J., Patterson, J., Ford, G., O’keefe, S., Wang, W., Meng, B., Song, D., Zhang, Y., et al. 2013. Identification of hepatotropic
viruses from plasma using deep sequencing: A next generation diagnostic tool. PLoS ONE, 8(4):e60595+. Available from: http:
//dx.doi.org/10.1371/journal.pone.0060595.
Lawlor, G. and Moss, A. C. 2010. Cytomegalovirus in inflammatory bowel disease: pathogen or innocent bystander? Inflammatory Bowel
Diseases, 16(9):1620–1627. Available from: http://view.ncbi.nlm.nih.gov/pubmed/20232408.
Le Caignec, C., Spits, C., Sermon, K., De Rycke, M., Thienpont, B., Debrock, S., Staessen, C., Moreau, Y., Fryns, J.-P., et al. 2006. Single-cell
chromosomal imbalances detection by array CGH. Nucleic Acids Research, 34(9):e68. Available from: http://dx.doi.org/10.1093/
nar/gkl336.
Lennon, N., Lintner, R., Anderson, S., Alvarez, P., Barry, A., Brockman, W., Daza, R., Erlich, R., Giannoukos, G., et al. 2010. A scalable,
fully automated process for construction of sequence-ready barcoded libraries for 454. Genome Biology, 11(2):R15+. Available from:
http://dx.doi.org/10.1186/gb-2010-11-2-r15.
Lepage, P., Colombet, J., Marteau, P., Sime-Ngando, T., Doré, J., and Leclerc, M. 2008. Dysbiosis in inflammatory bowel disease: a role for
bacteriophages? Gut, 57(3):424–425. Available from: http://view.ncbi.nlm.nih.gov/pubmed/18268057.
Lepage, P., Häsler, R., Spehlmann, M. E., Rehman, A., Zvirbliene, A., Begun, A., Ott, S., Kupcinskas, L., Doré, J., Raedler, A., and Schreiber,
S. 2011. Twin study indicates loss of interaction between microbiota and mucosa of patients with ulcerative colitis. Gastroenterology,
141(1):227–236. Available from: http://dx.doi.org/10.1053/j.gastro.2011.04.011.
Leplae, R., Hebrant, A., Wodak, S. J., and Toussaint, A. 2004. ACLAME: a CLAssification of Mobile genetic Elements. Nucleic Acids
Research, 32:D45–D49. Available from: http://dx.doi.org/10.1093/nar/gkh084.
Leung, K., Zahn, H., Leaver, T., Konwar, K. M., Hanson, N. W., Pagé, A. P., Lo, C.-C., Chain, P. S., Hallam, S. J., and Hansen, C. L. 2012.
A programmable droplet-based microfluidic device applied to multiparameter analysis of single microbes and microbial communities.
Proceedings of the National Academy of Sciences of the United States of America, 109(20):7665–7670. Available from: http://dx.doi.
org/10.1073/pnas.1106752109.
Ley, R. E. 2014. Harnessing microbiota to kill a pathogen: The sweet tooth of Clostridium difficile. Nature Medicine, 20(3):248–249.
Available from: http://dx.doi.org/10.1038/nm.3494.
238
Bibliography
Li, D., He, M., and Jiang, S. C. 2010. Detection of infectious adenoviruses in environmental waters by fluorescence-activated cell sorting
assay. Applied and Environmental Microbiology, 76(5):1442–1448. Available from: http://dx.doi.org/10.1128/aem.01937-09.
Li, H., Handsaker, B., Wysoker, A., Fennell, T., Ruan, J., Homer, N., Marth, G., Abecasis, G., Durbin, R., and 1000 Genome Project Data
Processing Subgroup 2009. The sequence alignment/map format and SAMtools. Bioinformatics, 25(16):2078–2079. Available from:
http://dx.doi.org/10.1093/bioinformatics/btp352.
Li, K., Bihan, M., Yooseph, S., and Methé, B. A. 2012. Analyses of the microbial diversity across the human microbiome. PLoS ONE,
7(6):e32118+. Available from: http://dx.doi.org/10.1371/journal.pone.0032118.
Li, W. and Godzik, A. 2006. Cd-hit: a fast program for clustering and comparing large sets of protein or nucleotide sequences.
Bioinformatics, 22(13):1658–1659. Available from: http://dx.doi.org/10.1093/bioinformatics/btl158.
Lin, Y.-P. P., Kuo, C.-J. J., Koleci, X., McDonough, S. P., and Chang, Y.-F. F. 2011. Manganese binds to Clostridium difficile Fbp68 and
is essential for fibronectin binding. The Journal of Biological Chemistry, 286(5):3957–3969. Available from: http://dx.doi.org/10.
1074/jbc.m110.184523.
Ling, Z., Liu, X., Jia, X., Cheng, Y., Luo, Y., Yuan, L., Wang, Y., Zhao, C., Guo, S., et al. 2014. Impacts of infection with different toxigenic
Clostridium difficile strains on faecal microbiota in children. Scientific Reports, 4(7485). Available from: http://www.nature.com/
srep/2014/141215/srep07485/full/srep07485.html.
Liu, C., Bayer, A., Cosgrove, S. E., Daum, R. S., Fridkin, S. K., Gorwitz, R. J., Kaplan, S. L., Karchmer, A. W., Levine, D. P., et al. 2011.
Clinical practice guidelines by the infectious diseases society of america for the treatment of methicillin-resistant Staphylococcus
aureus infections in adults and children. Clinical Infectious Diseases, 52(3):ciq146+. Available from: http://dx.doi.org/10.1093/
cid/ciq146.
Llano-Sotelo, B., Azucena, E. F., Kotra, L. P., Mobashery, S., and Chow, C. S. 2002. Aminoglycosides modified by resistance enzymes
display diminished binding to the bacterial ribosomal aminoacyl-tRNA site. Chemistry & biology, 9(4):455–463. Available from:
http://view.ncbi.nlm.nih.gov/pubmed/11983334.
Loftus, E. V. 2004. Clinical epidemiology of inflammatory bowel disease: Incidence, prevalence, and environmental influences.
Gastroenterology, 126(6):1504–1517. Available from: http://view.ncbi.nlm.nih.gov/pubmed/15168363.
Lopetuso, L. R., Scaldaferri, F., Petito, V., and Gasbarrini, A. 2013. Commensal Clostridia: leading players in the maintenance of gut
homeostasis. Gut pathogens, 5(1). Available from: http://view.ncbi.nlm.nih.gov/pubmed/23941657.
López-Amorós, R., Castel, S., Comas-Riu, J., and Vives-Rego, J. 1997. Assessment of E. coli and Salmonella viability and starvation by
confocal laser microscopy and flow cytometry using rhodamine 123, DiBAC4(3), propidium iodide, and CTC. Cytometry, 29(4):298–
305. Available from: http://view.ncbi.nlm.nih.gov/pubmed/9415412.
Lu, S., Zong, C., Fan, W., Yang, M., Li, J., Chapman, A. R., Zhu, P., Hu, X., Xu, L., et al. 2012. Probing meiotic recombination and
aneuploidy of single sperm cells by whole-genome sequencing. Science, 338(6114):1627–1630. Available from: http://dx.doi.org/
10.1126/science.1229112.
Lutgendorff, F., Akkermans, L. M., and Söderholm, J. D. 2008. The role of microbiota and probiotics in stress-induced gastro-intestinal
damage. Current Molecular Medicine, 8(4):282–298. Available from: http://view.ncbi.nlm.nih.gov/pubmed/18537636.
Lynch, M. D. J. and Neufeld, J. D. 2015. Ecology and exploration of the rare biosphere. Nature Reviews Microbiology, 13(4):217–229.
Available from: http://dx.doi.org/10.1038/nrmicro3400.
Macfarlane, S., Woodmansey, E. J., and Macfarlane, G. T. 2005. Colonization of mucin by human intestinal bacteria and establishment of
biofilm communities in a two-stage continuous culture system. Applied and Environmental Microbiology, 71(11):7483–7492. Available
from: http://dx.doi.org/10.1128/aem.71.11.7483-7492.2005.
Macpherson, A. J., Gatto, D., Sainsbury, E., Harriman, G. R., Hengartner, H., and Zinkernagel, R. M. 2000. A primitive T cell-independent
mechanism of intestinal mucosal IgA responses to commensal bacteria. Science, 288(5474):2222–2226. Available from: http://view.
ncbi.nlm.nih.gov/pubmed/10864873.
Macpherson, A. J., Geuking, M. B., Slack, E., Hapfelmeier, S., and McCoy, K. D. 2012. The habitat, double life, citizenship, and
forgetfulness of IgA. Immunological reviews, 245(1):132–146. Available from: http://view.ncbi.nlm.nih.gov/pubmed/22168417.
239
Bibliography
Manichanh, C., Borruel, N., Casellas, F., and Guarner, F. 2012. The gut microbiota in IBD. Nature Reviews. Gastroenterology & Hepatology,
9(10):599–608. Available from: http://view.ncbi.nlm.nih.gov/pubmed/22907164.
Marcy, Y., Ishoey, T., Lasken, R. S., Stockwell, T. B., Walenz, B. P., Halpern, A. L., Beeson, K. Y., Goldberg, S. M. D., and Quake, S. R.
2007a. Nanoliter reactors improve multiple displacement amplification of genomes from single cells. PLoS Genetics, 3(9):e155–1708.
Available from: http://dx.doi.org/10.1371/journal.pgen.0030155.
Marcy, Y., Ouverney, C., Bik, E. M., Lösekann, T., Ivanova, N., Martin, H. G., Szeto, E., Platt, D., Hugenholtz, P., et al. 2007b. Dissecting
biological "dark matter" with single-cell genetic analysis of rare and uncultivated TM7 microbes from the human mouth. Proceedings of
the National Academy of Sciences of the United States of America, 104(29):11889–11894. Available from: http://dx.doi.org/10.1073/
pnas.0704662104.
Marie, D., Brussaard, C. P. D., Thyrhaug, R., Bratbak, G., and Vaulot, D. 1999. Enumeration of marine viruses in culture and natural
samples by flow cytometry. Applied and Environmental Microbiology, 65(1):45–52. Available from: http://www.ncbi.nlm.nih.gov/
pmc/articles/PMC90981/.
Marine, R., McCarren, C., Vorrasane, V., Nasko, D., Crowgey, E., Polson, S. W., and Wommack, K. E. 2014. Caught in the middle with
multiple displacement amplification: the myth of pooling for avoiding multiple displacement amplification bias in a metagenome.
Microbiome, 2(1). Available from: http://dx.doi.org/10.1186/2049-2618-2-3.
Marine, R., Polson, S. W., Ravel, J., Hatfull, G., Russell, D., Sullivan, M., Syed, F., Dumas, M., and Wommack, K. E. 2011. Evaluation of a
transposase protocol for rapid generation of shotgun high-throughput sequencing libraries from nanogram quantities of DNA. Applied
and Environmental Microbiology, 77(22):8071–8079. Available from: http://dx.doi.org/10.1128/aem.05610-11.
Martin, C. E., Weishaupt, M. W., and Seeberger, P. H. 2011. Progress toward developing a carbohydrate-conjugate vaccine against
Clostridium difficile ribotype 027: synthesis of the cell-surface polysaccharide PS-I repeating unit. Chemical Communications,
47(37):10260–10262. Available from: http://dx.doi.org/10.1039/c1cc13614c.
Martinez-Garcia, M., Brazel, D., Poulton, N. J., Swan, B. K., Gomez, M. L., Masland, D., Sieracki, M. E., and Stepanauskas, R. 2011.
Unveiling in situ interactions between marine protists and bacteria through single cell sequencing. The ISME Journal, 6(3):703–707.
Available from: http://dx.doi.org/10.1038/ismej.2011.126.
Matsuda, K., Tsuji, H., Asahara, T., Takahashi, T., Kubota, H., Nagata, S., Yamashiro, Y., and Nomoto, K. 2012. Sensitive quantification of
Clostridium difficile cells by reverse transcription-quantitative PCR targeting rRNA molecules. Applied and Environmental Microbiology,
78(15):5111–5118. Available from: http://dx.doi.org/10.1128/aem.07990-11.
Maurice, C. F. F., Haiser, H. J. J., and Turnbaugh, P. J. J. 2013. Xenobiotics shape the physiology and gene expression of the active human
gut microbiome. Cell, 152(1-2):39–50. Available from: http://dx.doi.org/10.1016/j.cell.2012.10.052.
Mazmanian, S. K., Liu, C. H., Tzianabos, A. O., and Kasper, D. L. 2005. An immunomodulatory molecule of symbiotic bacteria directs
maturation of the host immune system. Cell, 122(1):107–118. Available from: http://dx.doi.org/10.1016/j.cell.2005.05.007.
McEllistrem, M. C., Carman, R. J., Gerding, D. N., Genheimer, C. W., and Zheng, L. 2005. A hospital outbreak of Clostridium difficile
disease associated with isolates carrying binary toxin genes. Clinical Infectious Diseases, 40(2):265–272. Available from: http://dx.
doi.org/10.1086/427113.
McGuckin, M. A., Lindén, S. K., Sutton, P., and Florin, T. H. 2011. Mucin dynamics and enteric pathogens. Nature Reviews Microbiology,
9(4):265–278. Available from: http://dx.doi.org/10.1038/nrmicro2538.
Medini, D., Donati, C., Tettelin, H., Masignani, V., and Rappuoli, R. 2005. The microbial pan-genome. Current Opinion in Genetics &
Development, 15(6):589–594. Available from: http://dx.doi.org/10.1016/j.gde.2005.09.006.
Mehlig, M., Moos, M., Braun, V., Kalt, B., Mahony, D. E., and von Eichel-Streiber, C. 2001. Variant toxin B and a functional toxin A
produced by Clostridium difficile C34. FEMS Microbiology Letters, 198(2):171–176. Available from: http://view.ncbi.nlm.nih.gov/
pubmed/11430410.
Merenstein, D., El-Nachef, N., and Lynch, S. V. 2014. Fecal microbial therapy: promises and pitfalls. Journal of Pediatric Gastroenterology
and Nutrition, 59(2):157–161. Available from: http://view.ncbi.nlm.nih.gov/pubmed/24796803.
240
Bibliography
Merrigan, M. M., Sambol, S. P., Johnson, S., and Gerding, D. N. 2003. Prevention of fatal Clostridium difficile-associated disease during
continuous administration of clindamycin in hamsters. The Journal of Infectious Diseases, 188(12):1922–1927. Available from: http:
//view.ncbi.nlm.nih.gov/pubmed/14673773.
Meyer, M., Briggs, A. W., Maricic, T., Höber, B., Höffner, B., Krause, J., Weihmann, A., Pääbo, S., and Hofreiter, M. 2008. From micrograms
to picograms: quantitative PCR reduces the material demands of high-throughput sequencing. Nucleic Acids Research, 36(1):e5.
Available from: http://dx.doi.org/10.1093/nar/gkm1095.
Mills, S., Serrano, L. M., Griffin, C., O’Connor, P. M., Schaad, G., Bruining, C., Hill, C., Ross, R. P., and Meijer, W. C. 2011. Inhibitory
activity of Lactobacillus plantarum LMG p-26358 against Listeria innocua when used as an adjunct starter in the manufacture of
cheese. Microbial Cell Factories, 10 Suppl 1. Available from: http://view.ncbi.nlm.nih.gov/pubmed/21995443.
Mills, S., Shanahan, F., Stanton, C., Hill, C., Coffey, A., and Ross, R. P. 2013. Movers and shakers: influence of bacteriophages in shaping
the mammalian gut microbiota. Gut Microbes, 4(1):4–16. Available from: http://view.ncbi.nlm.nih.gov/pubmed/23022738.
Minot, S., Bryson, A., Chehoud, C., Wu, G. D., Lewis, J. D., and Bushman, F. D. 2013. Rapid evolution of the human gut virome. Proceedings
of the National Academy of Sciences of the United States of America, 110(30):12450–12455. Available from: http://dx.doi.org/10.1073/
pnas.1300833110.
Minot, S., Grunberg, S., Wu, G. D., Lewis, J. D., and Bushman, F. D. 2012. Hypervariable loci in the human gut virome. Proceedings of the
National Academy of Sciences of the United States of America, 109(10):3962–3966. Available from: http://dx.doi.org/10.1073/pnas.
1119061109.
Minot, S., Sinha, R., Chen, J., Li, H., Keilbaugh, S. A., Wu, G. D., Lewis, J. D., and Bushman, F. D. 2011. The human gut virome: inter-
individual variation and dynamic response to diet. Genome Research, 21(10):1616–1625. Available from: http://dx.doi.org/10.
1101/gr.122705.111.
Modi, S. R., Lee, H. H., Spina, C. S., and Collins, J. J. 2013. Antibiotic treatment expands the resistance reservoir and ecological network
of the phage metagenome. Nature, 499(7457):219–222. Available from: http://dx.doi.org/10.1038/nature12212.
Morgan, M., Anders, S., Lawrence, M., Aboyoun, P., Pagès, H., and Gentleman, R. 2009. Shortread: a bioconductor package for input,
quality assessment and exploration of high-throughput sequence data. Bioinformatics, 25:2607–2608. Available from: http://dx.doi.
org10.1093/bioinformatics/btp450.
Morgan, M., Pagès, H., Obenchain, V., and Hayden, N. 2015. Rsamtools: Binary alignment (bam), fasta, variant call (bcf), and tabix file
import. R package version 1.18.3. Available from: http://bioconductor.org/packages/release/bioc/html/Rsamtools.html.
Morgan, X. C., Segata, N., and Huttenhower, C. 2013. Biodiversity and functional genomics in the human microbiome. Trends in Genetics,
29(1):51–58. Available from: http://dx.doi.org/10.1016/j.tig.2012.09.005.
Morris, R. M., Rappé, M. S., Connon, S. A., Vergin, K. L., Siebold, W. A., Carlson, C. A., and Giovannoni, S. J. 2002. SAR11 clade dominates
ocean surface bacterioplankton communities. Nature, 420(6917):806–810. Available from: http://view.ncbi.nlm.nih.gov/pubmed/
12490947.
Moya, A., Peretó, J., Gil, R., and Latorre, A. 2008. Learning how to live together: genomic insights into prokaryote-animal symbioses.
Nature Reviews. Genetics, 9(3):218–229. Available from: http://dx.doi.org/10.1038/nrg2319.
Mullane, K. M., Miller, M. A., Weiss, K., Lentnek, A., Golan, Y., Sears, P. S., Shue, Y.-K., Louie, T. J., and Gorbach, S. L. 2011. Efficacy
of fidaxomicin versus vancomycin as therapy for Clostridium difficile infection in individuals taking concomitant antibiotics for other
concurrent infections. Clinical Infectious Diseases, 53(5):440–447. Available from: http://dx.doi.org/10.1093/cid/cir404.
Müller, S. and Babel, W. 2003. Analysis of bacterial DNA patterns–an approach for controlling biotechnological processes. Journal of
Microbiological Methods, 55(3):851–858. Available from: http://view.ncbi.nlm.nih.gov/pubmed/14607431.
Müller, S. and Nebe-von Caron, G. 2010. Functional single-cell analyses: flow cytometry and cell sorting of microbial populations and
communities. FEMS Microbiology Reviews, 34(4):554–587. Available from: http://dx.doi.org/10.1111/j.1574-6976.2010.00214.
x.
Murphy, E. F., Cotter, P. D., Healy, S., Marques, T. M., O’Sullivan, O., Fouhy, F., Clarke, S. F., O’Toole, P. W., Quigley, E. M., et al. 2010.
Composition and energy harvesting capacity of the gut microbiota: relationship to diet, obesity and time in mouse models. Gut,
59(12):1635–1642. Available from: http://dx.doi.org/10.1136/gut.2010.215665.
241
Bibliography
Ng, K. M., Ferreyra, J. A., Higginbottom, S. K., Lynch, J. B., Kashyap, P. C., Gopinath, S., Naidu, N., Choudhury, B., Weimer, B. C., et al.
2013. Microbiota-liberated host sugars facilitate post-antibiotic expansion of enteric pathogens. Nature, 502(7469):96–99. Available
from: http://dx.doi.org/10.1038/nature12503.
Ning, Z., Cox, A. J., and Mullikin, J. C. 2001. SSAHA: a fast search method for large DNA databases. Genome Research, 11(10):1725–1729.
Available from: http://dx.doi.org/10.1101/gr.194201.
Norman, J. M., Handley, S. A., Baldridge, M. T., Droit, L., Liu, C. Y., Keller, B. C., Kambal, A., Monaco, C. L., Zhao, G., et al. 2015. Disease-
specific alterations in the enteric virome in inflammatory bowel disease. Cell, 160(3):447–460. Available from: http://dx.doi.org/
10.1016/j.cell.2015.01.002.
Novakova, J., Vlkova, E., Bonusova, B., Rada, V., and Kokoska, L. 2013. In vitro selective inhibitory effect of 8-hydroxyquinoline against
bifidobacteria and clostridia. Anaerobe, 22:134–136. Available from: http://view.ncbi.nlm.nih.gov/pubmed/23770542.
Novo, D. J., Perlmutter, N. G., Hunt, R. H., and Shapiro, H. M. 2000. Multiparameter flow cytometric analysis of antibiotic effects on
membrane potential, membrane permeability, and bacterial counts of Staphylococcus aureus and Micrococcus luteus. Antimicrobial
Agents and Chemotherapy, 44(4):827–834. Available from: http://www.ncbi.nlm.nih.gov/pmc/articles/PMC89778/.
Ogilvie, L. A., Bowler, L. D., Caplin, J., Dedi, C., Diston, D., Cheek, E., Taylor, H., Ebdon, J. E., and Jones, B. V. 2013. Genome signature-
based dissection of human gut metagenomes to extract subliminal viral sequences. Nature Communications, 4. Available from: http:
//view.ncbi.nlm.nih.gov/pubmed/24036533.
Ohman, L. and Simrén, M. 2013. Intestinal microbiota and its role in irritable bowel syndrome (IBS). Current Gastroenterology Reports,
15(5). Available from: http://view.ncbi.nlm.nih.gov/pubmed/23580243.
Okubo, K., Hori, N., Matoba, R., Niiyama, T., Fukushima, A., Kojima, Y., and Matsubara, K. 1992. Large scale cDNA sequencing for
analysis of quantitative and qualitative aspects of gene expression. Nature Genetics, 2(3):173–179. Available from: http://dx.doi.
org/10.1038/ng1192-173.
Ozaki, E., Kato, H., Kita, H., Karasawa, T., Maegawa, T., Koino, Y., Matsumoto, K., Takada, T., Nomoto, K., et al. 2004. Clostridium difficile
colonization in healthy adults: transient colonization and correlation with enterococcal colonization. Journal of Medical Microbiology,
53(Pt 2):167–172. Available from: http://view.ncbi.nlm.nih.gov/pubmed/14729940.
Pabst, O. 2012. New concepts in the generation and functions of IgA. Nature Reviews Immunology, 12(12):821–832. Available from:
http://dx.doi.org/10.1038/nri3322.
Pachmann, K. 2015. Current and potential use of MAINTRAC method for cancer diagnosis and prediction of metastasis. Expert Review of
Molecular Diagnostics, 15(5):597–605. Available from: http://dx.doi.org/10.1586/14737159.2015.1032260.
Paez, J. G., Lin, M., Beroukhim, R., Lee, J. C., Zhao, X., Richter, D. J., Gabriel, S., Herman, P., Sasaki, H., et al. 2004. Genome coverage
and sequence fidelity of phi29 polymerase-based multiple strand displacement whole genome amplification. Nucleic Acids Research,
32(9):e71. Available from: http://dx.doi.org/10.1093/nar/gnh069.
Pages, H., Aboyoun, P., Gentleman, R., and DebRoy, S. 2014. Biostrings: String objects representing biological sequences, and matching
algorithms. R package version 2.26.3.
Palm, N. W., de Zoete, M. R., Cullen, T. W., Barry, N. A., Stefanowski, J., Hao, L., Degnan, P. H., Hu, J., Peter, I., et al. 2014. Immunoglobulin
a coating identifies colitogenic bacteria in inflammatory bowel disease. Cell, 158(5):1000–1010. Available from: http://dx.doi.org/
10.1016/j.cell.2014.08.006.
Pan, X., Urban, A. E., Palejev, D., Schulz, V., Grubert, F., Hu, Y., Snyder, M., and Weissman, S. M. 2008. A procedure for highly specific,
sensitive, and unbiased whole-genome amplification. Proceedings of the National Academy of Sciences of the United States of America,
105(40):15499–15504. Available from: http://dx.doi.org/10.1073/pnas.0808028105.
Paradis, E., Claude, J., and Strimmer, K. 2004. APE: Analyses of phylogenetics and evolution in R language. Bioinformatics, 20(2):289–290.
Available from: http://dx.doi.org/10.1093/bioinformatics/btg412.
Parsons, R. J., Breitbart, M., Lomas, M. W., and Carlson, C. A. 2012. Ocean time-series reveals recurring seasonal patterns of virioplankton
dynamics in the northwestern Sargasso Sea. The ISME journal, 6(2):273–284. Available from: http://view.ncbi.nlm.nih.gov/
pubmed/21833038.
242
Bibliography
Pearl, J. 1988. Probabilistic Reasoning in Intelligent Systems: Networks of Plausible Inference. San Francisco, CA, USA: Morgan Kaufmann
Publishers Inc. Available from: http://portal.acm.org/citation.cfm?id=52121.
Peltier, J., Courtin, P., El Meouche, I., Lemée, L., Chapot-Chartier, M.-P. P., and Pons, J.-L. L. 2011. Clostridium difficile has an original
peptidoglycan structure with a high level of N-acetylglucosamine deacetylation and mainly 3-3 cross-links. The Journal of Biological
Chemistry, 286(33):29053–29062. Available from: http://view.ncbi.nlm.nih.gov/pubmed/21685382.
Pépin, J., Valiquette, L., Alary, M.-E. E., Villemure, P., Pelletier, A., Forget, K., Pépin, K., and Chouinard, D. 2004. Clostridium difficile-
associated diarrhea in a region of quebec from 1991 to 2003: a changing pattern of disease severity. CMAJ, 171(5):466–472. Available
from: http://view.ncbi.nlm.nih.gov/pubmed/15337727.
Pérez-Brocal, V., García-López, R., Vázquez-Castellanos, J. F., Nos, P., Beltrán, B., Latorre, A., and Moya, A. 2013. Study of the viral
and microbial communities associated with Crohn’s disease: a metagenomic approach. Clinical and Translational Gastroenterology,
4(6):e36+. Available from: http://dx.doi.org/10.1038/ctg.2013.9.
Pérez-Cobas, A. E., Gosalbes, M. J., Friedrichs, A., Knecht, H., Artacho, A., Eismann, K., Otto, W., Rojo, D., Bargiela, R., et al. 2012.
Gut microbiota disturbance during antibiotic therapy: a multi-omic approach. Gut, Pp. gutjnl–2012–303184+. Available from:
http://dx.doi.org/10.1136/gutjnl-2012-303184.
Peris-Bondia, F., Latorre, A., Artacho, A., Moya, A., and D’Auria, G. 2011. The active human gut microbiota differs from the total
microbiota. PLoS ONE, 6(7). Available from: http://view.ncbi.nlm.nih.gov/pubmed/21829462.
Perkins, T. T., Kingsley, R. A., Fookes, M. C., Gardner, P. P., James, K. D., Yu, L., Assefa, S. A., He, M., Croucher, N. J., et al. 2009. A strand-
specific RNA-Seq analysis of the transcriptome of the typhoid bacillus Salmonella typhi. PLoS Genetics, 5(7):e1000569+. Available
from: http://dx.doi.org/10.1371/journal.pgen.1000569.
Peterson, D. A., McNulty, N. P., Guruge, J. L., and Gordon, J. I. 2007. Iga response to symbiotic bacteria as a mediator of gut homeostasis.
Cell Host & Microbe, 2(5):328–339. Available from: http://dx.doi.org/10.1016/j.chom.2007.09.013.
Petrov, V. M., Ratnayaka, S., Nolan, J. M., Miller, E. S., and Karam, J. D. 2010. Genomes of the T4-related bacteriophages as windows on
microbial genome evolution. Virology Journal, 7. Available from: http://view.ncbi.nlm.nih.gov/pubmed/21029436.
Picot, J., Guerin, C. L., Le Van Kim, C., and Boulanger, C. M. 2012. Flow cytometry: retrospective, fundamentals and recent
instrumentation. Cytotechnology, 64(2):109–130. Available from: http://dx.doi.org/10.1007/s10616-011-9415-0.
Pinard, R., de Winter, A., Sarkis, G., Gerstein, M., Tartaro, K., Plant, R., Egholm, M., Rothberg, J., and Leamon, J. 2006. Assessment of
whole genome amplification-induced bias through high-throughput, massively parallel whole genome sequencing. BMC Genomics,
7(1):216+. Available from: http://dx.doi.org/10.1186/1471-2164-7-216.
Podar, M., Abulencia, C. B., Walcher, M., Hutchison, D., Zengler, K., Garcia, J. A., Holland, T., Cotton, D., Hauser, L., and Keller, M.
2007. Targeted access to the genomes of low-abundance organisms in complex microbial communities. Applied and Environmental
Microbiology, 73(10):3205–3214. Available from: http://dx.doi.org/10.1128/aem.02985-06.
Popoff, M. R., Rubin, E. J., Gill, D. M., and Boquet, P. 1988. Actin-specific ADP-ribosyltransferase produced by a Clostridium difficile
strain. Infection and Immunity, 56(9):2299–2306. Available from: http://view.ncbi.nlm.nih.gov/pubmed/3137166.
Pruesse, E., Quast, C., Knittel, K., Fuchs, B. M., Ludwig, W., Peplies, J., and Glöckner, F. O. O. 2007. SILVA: a comprehensive online
resource for quality checked and aligned ribosomal RNA sequence data compatible with ARB. Nucleic Acids Research, 35(21):7188–
7196. Available from: http://dx.doi.org/10.1093/nar/gkm864.
Pruitt, K. D., Tatusova, T., and Maglott, D. R. 2007. NCBI reference sequences (RefSeq): a curated non-redundant sequence database of
genomes, transcripts and proteins. Nucleic Acids Research, 35(suppl 1):D61–D65. Available from: http://dx.doi.org/10.1093/nar/
gkl842.
Qin, J., Li, R., Raes, J., Arumugam, M., Burgdorf, K. S., Manichanh, C., Nielsen, T., Pons, N., Levenez, F., et al. 2010. A human gut
microbial gene catalogue established by metagenomic sequencing. Nature, 464(7285):59–65. Available from: http://dx.doi.org/10.
1038/nature08821.
Quevillon, E., Silventoinen, V., Pillai, S., Harte, N., Mulder, N., Apweiler, R., and Lopez, R. 2005. InterProScan: protein domains identifier.
Nucleic Acids Research, 33(suppl 2):W116–W120. Available from: http://dx.doi.org/10.1093/nar/gki442.
243
Bibliography
R Development Core Team 2008. R: A Language and Environment for Statistical Computing. R Foundation for Statistical Computing,
Vienna, Austria. ISBN 3-900051-07-0. Available from: http://www.R-project.org.
Rada, V. and Petr, J. 2000. A new selective medium for the isolation of glucose non-fermenting bifidobacteria from hen caeca. Journal of
Microbiological Methods, 43(2):127–132. Available from: http://view.ncbi.nlm.nih.gov/pubmed/11121611.
Raghunathan, A., Ferguson, H. R., Bornarth, C. J., Song, W., Driscoll, M., and Lasken, R. S. 2005. Genomic DNA amplification from a
single bacterium. Applied and Environmental Microbiology, 71(6):3342–3347. Available from: http://dx.doi.org/10.1128/aem.71.
6.3342-3347.2005.
Rakoff-Nahoum, S. and Medzhitov, R. 2008. Innate immune recognition of the indigenous microbial flora. Mucosal Immunology, 1(1s):S10–
S14. Available from: http://dx.doi.org/10.1038/mi.2008.49.
Rasheed, Z., Rangwala, H., and Barbara, D. 2013. 16S rRNA metagenome clustering and diversity estimation using locality sensitive
hashing. BMC Systems Biology, 7(S4):S11+. Available from: http://dx.doi.org/10.1186/1752-0509-7-s4-s11.
Reinhardt, C., Bergentall, M., Greiner, T. U., Schaffner, F., Ostergren-Lunden, G., Petersen, L. C., Ruf, W., and Backhed, F. 2012. Tissue
factor and PAR1 promote microbiota-induced intestinal vascular remodelling. Nature, 483(7391):627–631. Available from: http:
//dx.doi.org/10.1038/nature10893.
Renner, E. D. 1994. Development and clinical evaluation of an amplified flow cytometric fluoroimmunoassay for Clostridium difficile
toxin A. Cytometry, 18(2):103–108. Available from: http://view.ncbi.nlm.nih.gov/pubmed/7924698.
Reyes, A., Haynes, M., Hanson, N., Angly, F. E., Heath, A. C., Rohwer, F., and Gordon, J. I. 2010. Viruses in the faecal microbiota of
monozygotic twins and their mothers. Nature, 466(7304):334–338. Available from: http://dx.doi.org/10.1038/nature09199.
Reyes, A., Semenkovich, N. P., Whiteson, K., Rohwer, F., and Gordon, J. I. 2012. Going viral: next-generation sequencing applied to
phage populations in the human gut. Nature Reviews. Microbiology, 10(9):607–617. Available from: http://view.ncbi.nlm.nih.gov/
pubmed/22864264.
Reynolds, C. B., Emerson, J. E., de la Riva, L., Fagan, R. P., and Fairweather, N. F. 2011. The Clostridium difficile cell wall protein cwpv is
antigenically variable between strains, but exhibits conserved aggregation-promoting function. PLoS Pathog, 7(4):e1002024+. Available
from: http://dx.doi.org/10.1371/journal.ppat.1002024.
Roberts, R. J. and Murray, K. 1976. Restriction endonuclease. Critical Reviews in Biochemistry and Molecular Biology, 4(2):123–164.
Available from: http://dx.doi.org/10.3109/10409237609105456.
Robinson, J. T., Thorvaldsdottir, H., Winckler, W., Guttman, M., Lander, E. S., Getz, G., and Mesirov, J. P. 2011. Integrative genomics
viewer. Nature Biotechnology, 29(1):24–26. Available from: http://dx.doi.org/10.1038/nbt.1754.
Rodrigue, S., Malmstrom, R. R., Berlin, A. M., Birren, B. W., Henn, M. R., and Chisholm, S. W. 2009. Whole genome amplification and
de novo assembly of single bacterial cells. PLoS ONE, 4(9):e6864+. Available from: http://dx.doi.org/10.1371/journal.pone.
0006864.
Rohwer, F. 2003. Global phage diversity. Cell, 113(2):141+. Available from: http://dx.doi.org/10.1016/s0092-8674(03)00276-9.
Rojo, D., Gosalbes, M. J., Ferrari, R., Perez-Cobas, A. E., Hernandez, E., Oltra, R., Buesa, J., Latorre, A., Barbas, C., et al. 2015. Clostridium
difficile heterogeneously impacts intestinal community architecture but drives stable metabolome responses. The ISME Journal.
Available from: http://dx.doi.org/10.1038/ismej.2015.32.
Rolfe, R. D., Helebian, S., and Finegold, S. M. 1981. Bacterial interference between clostridium difficile and normal fecal flora. Journal of
Infectious Diseases, 143(3):470–475. Available from: http://dx.doi.org/10.1093/infdis/143.3.470.
Ronaghi, M., Uhlén, M., and Nyrén, P. 1998. A sequencing method based on real-time pyrophosphate. Science, 281(5375):363–365.
Available from: http://dx.doi.org/10.1126/science.281.5375.363.
Rupnik, M. 2008. Heterogeneity of large clostridial toxins: importance of Clostridium difficile toxinotypes. FEMS Microbiology Reviews,
32(3):541–555. Available from: http://dx.doi.org/10.1111/j.1574-6976.2008.00110.x.
Rupnik, M. 2010. Clostridium difficile toxinotyping. Methods in Molecular Biology, 646:67–76. Available from: http://view.ncbi.nlm.
nih.gov/pubmed/20597003.
244
Bibliography
Rupnik, M., Brazier, J. S., Duerden, B. I., Grabnar, M., and Stubbs, S. L. J. 2001. Comparison of toxinotyping and PCR ribotyping
of Clostridium difficile strains and description of novel toxinotypes. Microbiology, 147(2):439–447. Available from: http://mic.
sgmjournals.org/content/147/2/439.abstract.
Rupnik, M., Wilcox, M. H., and Gerding, D. N. 2009. Clostridium difficile infection: new developments in epidemiology and pathogenesis.
Nature Reviews. Microbiology, 7(7):526–536. Available from: http://dx.doi.org/10.1038/nrmicro2164.
Sambrook, J. and Russell, D. W. 2006a. Fragmentation of DNA by nebulization. Cold Spring Harbor Protocols, 2006(4):pdb.prot4539+.
Available from: http://dx.doi.org/10.1101/pdb.prot4539.
Sambrook, J. and Russell, D. W. 2006b. Fragmentation of DNA by sonication. CSH protocols, 2006(4). Available from: http://view.
ncbi.nlm.nih.gov/pubmed/22485919.
Sansonetti, P. J. 2010. To be or not to be a pathogen: that is the mucosally relevant question. Mucosal Immunology, 4(1):8–14. Available
from: http://dx.doi.org/10.1038/mi.2010.77.
Sarkar, D., Gentleman, R., Lawrence, M., and Yao, Z. 2015. chipseq: A package for analyzing chipseq data. R package version 1.16.0.
Savage, D. C. 1977. Microbial ecology of the gastrointestinal tract. Annual Review of Microbiology, 31(1):107–133. Available from:
http://dx.doi.org/10.1146/annurev.mi.31.100177.000543.
Schmieder, R. and Edwards, R. 2011. Quality control and preprocessing of metagenomic datasets. Bioinformatics, 27(6):863–864. Available
from: http://dx.doi.org/10.1093/bioinformatics/btr026.
Schnorr, S. L., Candela, M., Rampelli, S., Centanni, M., Consolandi, C., Basaglia, G., Turroni, S., Biagi, E., Peano, C., et al. 2014. Gut
microbiome of the hadza hunter-gatherers. Nature Communications, 5. Available from: http://dx.doi.org/10.1038/ncomms4654.
Schönhuber, W., Fuchs, B., Juretschko, S., and Amann, R. 1997. Improved sensitivity of whole-cell hybridization by the combination
of horseradish peroxidase-labeled oligonucleotides and tyramide signal amplification. Applied and Environmental Microbiology,
63(8):3268–3273. Available from: http://aem.asm.org/content/63/8/3268.abstract.
Schubert, A. M., Rogers, M. A., Ring, C., Mogle, J., Petrosino, J. P., Young, V. B., Aronoff, D. M., and Schloss, P. D. 2014. Microbiome
data distinguish patients with clostridium difficile infection and non-C. difficile-associated diarrhea from healthy controls. mBio, 5(3).
Available from: http://dx.doi.org/10.1128/mbio.01021-14, doi:10.1128/mbio.01021-14.
Schwan, C., Stecher, B., Tzivelekidis, T., van Ham, M., Rohde, M., Hardt, W.-D. D., Wehland, J., and Aktories, K. 2009. Clostridium difficile
toxin CDT induces formation of microtubule-based protrusions and increases adherence of bacteria. PLoS Pathogens, 5(10):e1000626+.
Available from: http://dx.doi.org/10.1371/journal.ppat.1000626.
Sebaihia, M., Wren, B. W., Mullany, P., Fairweather, N. F., Minton, N., Stabler, R., Thomson, N. R., Roberts, A. P., Cerdeño Tárraga, A. M.,
et al. 2006. The multidrug-resistant human pathogen Clostridium difficile has a highly mobile, mosaic genome. Nature Genetics,
38(7):779–786. Available from: http://dx.doi.org/10.1038/ng1830.
Seekatz, A. M. and Young, V. B. 2014. Clostridium difficile and the microbiota. The Journal of Clinical Investigation, 124(10):4182–4189.
Available from: http://view.ncbi.nlm.nih.gov/pubmed/25036699.
Segata, N., Izard, J., Waldron, L., Gevers, D., Miropolsky, L., Garrett, W. S., and Huttenhower, C. 2011. Metagenomic biomarker discovery
and explanation. Genome Biology, 12(6):R60+. Available from: http://dx.doi.org/10.1186/gb-2011-12-6-r60.
Selinger, C. P., Bell, A., Cairns, A., Lockett, M., Sebastian, S., and Haslam, N. 2013. Probiotic VSL#3 prevents antibiotic-associated
diarrhoea in a double-blind, randomized, placebo-controlled clinical trial. Journal of Hospital Infection, 84(2):159–165. Available from:
http://dx.doi.org/10.1016/j.jhin.2013.02.019.
Sherr, E. B., Sherr, B. F., and Verity, P. G. 2002. Distribution and relation of total bacteria, active bacteria, bacterivory, and volume of
organic detritus in atlantic continental shelf waters off cape hatteras NC, USA. Deep Sea Research Part II: Topical Studies in Oceanography,
49(20):4571–4585. Available from: http://dx.doi.org/10.1016/s0967-0645(02)00129-7.
Silva, F., Ferreira, S., Queiroz, J. a. A., and Domingues, F. C. 2011. Coriander (Coriandrum sativum L.) essential oil: its antibacterial
activity and mode of action evaluated by flow cytometry. Journal of Medical Microbiology, 60(10):1479–1486. Available from: http:
//dx.doi.org/10.1099/jmm.0.034157-0.
245
Bibliography
Sims, D., Sudbery, I., Ilott, N. E., Heger, A., and Ponting, C. P. 2014. Sequencing depth and coverage: key considerations in genomic
analyses. Nature Reviews. Genetics, 15(2):121–132. Available from: http://dx.doi.org/10.1038/nrg3642.
Sjögren, K., Engdahl, C., Henning, P., Lerner, U. H., Tremaroli, V., Lagerquist, M. K., Bäckhed, F., and Ohlsson, C. 2012. The gut microbiota
regulates bone mass in mice. Journal of Bone and Mineral Research, 27(6):1357–1367. Available from: http://dx.doi.org/10.1002/
jbmr.1588.
Skarstad, K., Steen, H. B., and Boye, E. 1983. Cell cycle parameters of slowly growing Escherichia coli B/r studied by flow cytometry.
Journal of Bacteriology, 154(2):656–662. Available from: http://www.ncbi.nlm.nih.gov/pmc/articles/PMC217513/.
Skraban, J., Dzeroski, S., Zenko, B., Mongus, D., Gangl, S., and Rupnik, M. 2013. Gut microbiota patterns associated with colonization
of different Clostridium difficile ribotypes. PLoS ONE, 8(2):e58005+. Available from: http://dx.doi.org/10.1371/journal.pone.
0058005.
Solonenko, S., Espinoza, J. I., Alberti, A., Cruaud, C., Hallam, S., Konstantinidis, K., Tyson, G., Wincker, P., and Sullivan, M. 2013.
Sequencing platform and library preparation choices impact viral metagenomes. BMC Genomics, 14(1):320+. Available from: http:
//dx.doi.org/10.1186/1471-2164-14-320.
Sommer, F. and Bäckhed, F. 2013. The gut microbiota–masters of host development and physiology. Nature Reviews. Microbiology,
11(4):227–238. Available from: http://view.ncbi.nlm.nih.gov/pubmed/23435359.
Song, K. P., Ow, S. E., Chang, S. Y., and Bai, X. L. 1999. Sequence analysis of a new open reading frame located in the pathogenicity locus
of Clostridium difficile strain 8864. FEMS Microbiology Letters, 180(2):241–248. Available from: http://view.ncbi.nlm.nih.gov/
pubmed/10556718.
Song, Y., Garg, S., Girotra, M., Maddox, C., von Rosenvinge, E. C., Dutta, A., Dutta, S., and Fricke, W. F. 2013. Microbiota dynamics in
patients treated with fecal microbiota transplantation for recurrent Clostridium difficile infection. PLoS ONE, 8(11):e81330+. Available
from: http://dx.doi.org/10.1371/journal.pone.0081330.
Sorek, R. and Cossart, P. 2010. Prokaryotic transcriptomics: a new view on regulation, physiology and pathogenicity. Nature Reviews.
Genetics, 11(1):9–16. Available from: http://dx.doi.org/10.1038/nrg2695.
Sorg, J. A. and Sonenshein, A. L. 2009. Chenodeoxycholate is an inhibitor of clostridium difficile spore germination. Journal of bacteriology,
191(3):1115–1117. Available from: http://view.ncbi.nlm.nih.gov/pubmed/19060152.
Spits, C., Le Caignec, C., De Rycke, M., Van Haute, L., Van Steirteghem, A., Liebaers, I., and Sermon, K. 2006a. Optimization and
evaluation of single-cell whole-genome multiple displacement amplification. Human Mutation, 27(5):496–503. Available from: http:
//dx.doi.org/10.1002/humu.20324.
Spits, C., Le Caignec, C., De Rycke, M., Van Haute, L., Van Steirteghem, A., Liebaers, I., and Sermon, K. 2006b. Whole-genome multiple
displacement amplification from single cells. Nature Protocols, 1(4):1965–1970. Available from: http://dx.doi.org/10.1038/nprot.
2006.326.
Stabler, R., He, M., Dawson, L., Martin, M., Valiente, E., Corton, C., Lawley, T., Sebaihia, M., Quail, M., et al. 2009. Comparative genome
and phenotypic analysis of Clostridium difficile 027 strains provides insight into the evolution of a hypervirulent bacterium. Genome
Biology, 10(9):R102+. Available from: http://dx.doi.org/10.1186/gb-2009-10-9-r102.
Stabler, R. A., Gerding, D. N., Songer, J. G., Drudy, D., Brazier, J. S., Trinh, H. T., Witney, A. A., Hinds, J., and Wren, B. W. 2006.
Comparative phylogenomics of Clostridium difficile reveals clade specificity and microevolution of hypervirulent strains. Journal of
Bacteriology, 188(20):7297–7305. Available from: http://dx.doi.org/10.1128/jb.00664-06.
Stang, A., Korn, K., Wildner, O., and Uberla, K. 2005. Characterization of virus isolates by particle-associated nucleic acid PCR. Journal
of Clinical Microbiology, 43(2):716–720. Available from: http://dx.doi.org/10.1128/jcm.43.2.716-720.2005.
Stecher, B. and Hardt, W.-D. D. 2008. The role of microbiota in infectious disease. Trends in Microbiology, 16(3):107–114. Available from:
http://dx.doi.org/10.1016/j.tim.2007.12.008.
Stecher, B., Maier, L., and Hardt, W.-D. 2013. ’Blooming’ in the gut: how dysbiosis might contribute to pathogen evolution. Nature Reviews
Microbiology, 11(4):277–284. Available from: http://dx.doi.org/10.1038/nrmicro2989.
246
Bibliography
Stepanauskas, R. and Sieracki, M. E. 2007. Matching phylogeny and metabolism in the uncultured marine bacteria, one cell at a time.
Proceedings of the National Academy of Sciences of the United States of America, 104(21):9052–9057. Available from: http://dx.doi.
org/10.1073/pnas.0700496104.
Stern, A., Mick, E., Tirosh, I., Sagy, O., and Sorek, R. 2012. CRISPR targeting reveals a reservoir of common phages associated with the
human gut microbiome. Genome Research, 22(10):1985–1994. Available from: http://dx.doi.org/10.1101/gr.138297.112.
Strateva, T. and Yordanov, D. 2009. Pseudomonas aeruginosa - a phenomenon of bacterial resistance. Journal of Medical Microbiology,
58(Pt 9):1133–1148. Available from: http://dx.doi.org/10.1099/jmm.0.009142-0.
Stubbs, S., Rupnik, M., Gibert, M., Brazier, J., Duerden, B., and Popoff, M. 2000. Production of actin-specific ADP-ribosyltransferase
(binary toxin) by strains of Clostridium difficile. FEMS Microbiology Letters, 186(2):307–312. Available from: http://dx.doi.org/10.
1111/j.1574-6968.2000.tb09122.x.
Sutera, V., Caspar, Y., Boisset, S., and Maurin, M. 2014. A new dye uptake assay to test the activity of antibiotics against intracellular
Francisella tularensis. Frontiers in Cellular and Infection Microbiology, 4. Available from: http://view.ncbi.nlm.nih.gov/pubmed/
24672776.
Suzuki, R. and Shimodaira, H. 2014. pvclust: Hierarchical Clustering with P-Values via Multiscale Bootstrap Resampling. R package version
1.3-2. Available from: http://CRAN.R-project.org/package=pvclust.
Swan, B. K., Martinez-Garcia, M., Preston, C. M., Sczyrba, A., Woyke, T., Lamy, D., Reinthaler, T., Poulton, N. J., Dashiell, et al. 2011.
Potential for chemolithoautotrophy among ubiquitous bacteria lineages in the dark ocean. Science, 333(6047):1296–1300. Available
from: http://dx.doi.org/10.1126/science.1203690.
Syed, F., Grunenwald, H., and Caruccio, N. 2009. Next-generation sequencing library preparation: simultaneous fragmentation and
tagging using in vitro transposition. Nature Methods, 6(11). Available from: http://dx.doi.org/10.1038/nmeth.f.272.
Tanner, H. E., Hardy, K. J., and Hawkey, P. M. 2010. Coexistence of multiple multilocus variable-number tandem-repeat analysis subtypes
of Clostridium difficile PCR ribotype 027 strains within fecal specimens. Journal of Clinical Microbiology, 48(3):985–987. Available
from: http://dx.doi.org/10.1128/jcm.02012-09.
Tasteyre, A., Barc, M. C., Collignon, A., Boureau, H., and Karjalainen, T. 2001. Role of FliC and FliD flagellar proteins of Clostridium
difficile in adherence and gut colonization. Infection and Immunity, 69(12):7937–7940. Available from: http://dx.doi.org/10.1128/
iai.69.12.7937-7940.2001.
Tasteyre, A., Karjalainen, T., Avesani, V., Delmée, M., Collignon, A., Bourlioux, P., and Barc, M. C. 2000. Phenotypic and genotypic
diversity of the flagellin gene (fliC) among Clostridium difficile isolates from different serogroups. Journal of Clinical Microbiology,
38(9):3179–3186. Available from: http://view.ncbi.nlm.nih.gov/pubmed/10970353.
Tatusova, T., Ciufo, S., Fedorov, B., O’Neill, K., and Tolstoy, I. 2014. RefSeq microbial genomes database: new representation and
annotation strategy. Nucleic Acids Research, 42(Database issue). Available from: http://view.ncbi.nlm.nih.gov/pubmed/24316578.
Tazzari, P. L. L., Ricci, F., Carnicelli, D., Caprioli, A., Tozzi, A. E., Rizzoni, G., Conte, R., and Brigotti, M. 2004. Flow cytometry detection of
Shiga toxins in the blood from children with hemolytic uremic syndrome. Cytometry. Part B, Clinical cytometry, 61(1):40–44. Available
from: http://view.ncbi.nlm.nih.gov/pubmed/15351981.
Teeling, H., Waldmann, J., Lombardot, T., Bauer, M., and Glöckner, F. O. O. 2004. TETRA: a web-service and a stand-alone program
for the analysis and comparison of tetranucleotide usage patterns in DNA sequences. BMC Bioinformatics, 5(1):163+. Available from:
http://dx.doi.org/10.1186/1471-2105-5-163.
Telenius, H., Carter, N. P., Bebb, C. E., Nordenskjöld, M., Ponder, B. A., and Tunnacliffe, A. 1992. Degenerate oligonucleotide-primed
PCR: general amplification of target DNA by a single degenerate primer. Genomics, 13(3):718–725. Available from: http://view.
ncbi.nlm.nih.gov/pubmed/1639399.
Theriot, C. M., Koenigsknecht, M. J., Carlson, P. E., Hatton, G. E., Nelson, A. M., Li, B., Huffnagle, G. B., Z Li, J., and Young, V. B.
2014. Antibiotic-induced shifts in the mouse gut microbiome and metabolome increase susceptibility to Clostridium difficile infection.
Nature Communications, 5. Available from: http://view.ncbi.nlm.nih.gov/pubmed/24445449.
Thurber, R. V., Haynes, M., Breitbart, M., Wegley, L., and Rohwer, F. 2009. Laboratory procedures to generate viral metagenomes. Nature
Protocols, 4(4):470–483. Available from: http://dx.doi.org/10.1038/nprot.2009.10.
247
Bibliography
Tonooka, T., Sakata, S., Kitahara, M., Hanai, M., Ishizeki, S., Takada, M., Sakamoto, M., and Benno, Y. 2005. Detection and quantification
of four species of the genus Clostridium in infant feces. Microbiology and Immunology, 49(11):987–992. Available from: http://view.
ncbi.nlm.nih.gov/pubmed/16301809.
Trompette, A., Gollwitzer, E. S., Yadava, K., Sichelstiel, A. K., Sprenger, N., Ngom-Bru, C., Blanchard, C., Junt, T., Nicod, L. P., et al. 2014.
Gut microbiota metabolism of dietary fiber influences allergic airway disease and hematopoiesis. Nature Medicine, 20(2):159–166.
Available from: http://dx.doi.org/10.1038/nm.3444.
Troutt, A. B., McHeyzer-Williams, M. G., Pulendran, B., and Nossal, G. J. 1992. Ligation-anchored PCR: a simple amplification technique
with single-sided specificity. Proceedings of the National Academy of Sciences of the United States of America, 89(20):9823–9825. Available
from: http://dx.doi.org/10.1073/pnas.89.20.9823.
Turnbaugh, P. J., Ley, R. E., Mahowald, M. A., Magrini, V., Mardis, E. R., and Gordon, J. I. 2006. An obesity-associated gut microbiome with
increased capacity for energy harvest. Nature, 444(7122):1027–1031. Available from: http://dx.doi.org/10.1038/nature05414.
Twine, S. M., Reid, C. W., Aubry, A., McMullin, D. R., Fulton, K. M., Austin, J., and Logan, S. M. 2009. Motility and flagellar glycosylation
in Clostridium difficile. Journal of Bacteriology, 191(22):7050–7062. Available from: http://dx.doi.org/10.1128/jb.00861-09.
Ueckert, J. E., Nebe von Caron, G., Bos, A. P., and ter Steeg, P. F. 1997. Flow cytometric analysis of Lactobacillus plantarum to monitor
lag times, cell division and injury. Letters in Applied Microbiology, 25(4):295–299. Available from: http://view.ncbi.nlm.nih.gov/
pubmed/9351280.
van den Berg, R. J., Ameen, H. A. A., Furusawa, T., Claas, E. C. C., van der Vorm, E. R., and Kuijper, E. J. 2005. Coexistence of multiple
PCR-ribotype strains of Clostridium difficile in faecal samples limits epidemiological studies. Journal of Medical Microbiology, 54(Pt
2):173–179. Available from: http://view.ncbi.nlm.nih.gov/pubmed/15673513.
van den Berg, R. J., Schaap, I., Templeton, K. E., Klaassen, C. H., and Kuijper, E. J. 2007. Typing and subtyping of Clostridium difficile
isolates by using multiple-locus variable-number tandem-repeat analysis. Journal of Clinical Microbiology, 45(3):1024–1028. Available
from: http://dx.doi.org/10.1128/jcm.02023-06.
van der Waaij, L. A., Kroese, F. G., Visser, A., Nelis, G. F., Westerveld, B. D., Jansen, P. L., and Hunter, J. O. 2004. Immunoglobulin coating
of faecal bacteria in inflammatory bowel disease. European journal of gastroenterology & hepatology, 16(7):669–674. Available from:
http://view.ncbi.nlm.nih.gov/pubmed/15201580.
van Eijk, E., Anvar, S. Y. Y., Browne, H. P., Leung, W. Y. Y., Frank, J., Schmitz, A. M., Roberts, A. P., and Smits, W. K. K. 2015. Complete
genome sequence of the Clostridium difficile laboratory strain 630 delta erm reveals differences from strain 630, including translocation
of the mobile element CTn5. BMC genomics, 16(1):31+. Available from: http://dx.doi.org/10.1186/s12864-015-1252-7.
Van Wey, A. S., Cookson, A. L., Roy, N. C., McNabb, W. C., Soboleva, T. K., and Shorten, P. R. 2011. Bacterial biofilms associated with food
particles in the human large bowel. Molecular nutrition & food research, 55(7):969–978. Available from: http://view.ncbi.nlm.nih.
gov/pubmed/21638777.
Varga, J. J., Nguyen, V., O’Brien, D. K., Rodgers, K., Walker, R. A., and Melville, S. B. 2006. Type IV pili-dependent gliding motility
in the Gram-positive pathogen Clostridium perfringens and other Clostridia. Molecular Microbiology, 62(3):680–694. Available from:
http://view.ncbi.nlm.nih.gov/pubmed/16999833.
Vazquez Castellanos, J., Garcia Lopez, R., Perez Brocal, V., Pignatelli, M., and Moya, A. 2014. Comparison of different assembly and
annotation tools on analysis of simulated viral metagenomic communities in the gut. BMC Genomics, 15(1):37+. Available from:
http://dx.doi.org/10.1186/1471-2164-15-37.
Vazquez-Castellanos, J. F., Serrano-Villar, S., Latorre, A., Artacho, A., Ferrus, M. L., Madrid, N., Vallejo, A., Sainz, T., Martinez-Botas,
J., et al. 2014. Altered metabolism of gut microbiota contributes to chronic immune activation in HIV-infected individuals. Mucosal
Immunology. Available from: http://dx.doi.org/10.1038/mi.2014.107.
Vedantam, G., Clark, A., Chu, M., McQuade, R., Mallozzi, M., and Viswanathan, V. K. 2012. Clostridium difficile infection: toxins and
non-toxin virulence factors, and their contributions to disease establishment and host response. Gut Microbes, 3(2):121–134. Available
from: http://view.ncbi.nlm.nih.gov/pubmed/22555464.
Venter, J. C., Remington, K., Heidelberg, J. F., Halpern, A. L., Rusch, D., Eisen, J. A., Wu, D., Paulsen, I., Nelson, K. E., et al. 2004.
Environmental genome shotgun sequencing of the Sargasso Sea. Science, 304(5667):66–74. Available from: http://dx.doi.org/10.
1126/science.1093857.
248
Bibliography
Vestvik, N., Rønneseth, A., Kalgraff, C. A. K., Winther-Larsen, H. C., Wergeland, H. I., and Haugland, G. T. 2013. Francisella noatunensis
subsp. noatunensis replicates within atlantic cod (Gadus morhua L.) leucocytes and inhibits respiratory burst activity. Fish & Shellfish
Immunology, 35(3):725–733. Available from: http://dx.doi.org/10.1016/j.fsi.2013.06.002.
Vieites, J. M., Guazzaroni, M.-E., Beloqui, A., Golyshin, P. N., and Ferrer, M. 2009. Metagenomics approaches in systems microbiology.
FEMS Microbiology Reviews, 33(1):236–255. Available from: http://dx.doi.org/10.1111/j.1574-6976.2008.00152.x.
Vimr, E. R., Kalivoda, K. A., Deszo, E. L., and Steenbergen, S. M. 2004. Diversity of microbial sialic acid metabolism. Microbiology and
Molecular Biology Reviews, 68(1):132–153. Available from: http://dx.doi.org/10.1128/mmbr.68.1.132-153.2004.
Vives-Rego, J., Lebaron, P., and Caron, G. N.-v. 2000. Current and future applications of flow cytometry in aquatic microbiology. FEMS
Microbiology Reviews, 24(4):429–448. Available from: http://dx.doi.org/10.1111/j.1574-6976.2000.tb00549.x.
Vlková, E., Nevoral, J., Jencikova, B., Kopecný, J., Godefrooij, J., Trojanová, I., and Rada, V. 2005. Detection of infant faecal bifidobacteria
by enzymatic methods. Journal of Microbiological Methods, 60(3):365–373. Available from: http://view.ncbi.nlm.nih.gov/pubmed/
15649538.
Vlček, v. and Pačes, V. 1986. Nucleotide sequence of the late region of Bacillus phage phi29 completes the 19285-bp sequence of phi29
genome. Comparison with the homologous sequence of phage PZA. Gene, 46(2-3):215–225. Available from: http://dx.doi.org/10.
1016/0378-1119(86)90406-3.
von Eiff, C., Herrmann, M., and Peters, G. 1995. Antimicrobial susceptibilities of Stomatococcus mucilaginosus and of Micrococcus spp.
Antimicrobial Agents and Chemotherapy, 39(1):268–270. Available from: http://view.ncbi.nlm.nih.gov/pubmed/7695321.
von Nussbaum, F., Brands, M., Hinzen, B., Weigand, S., and Häbich, D. 2006. Antibacterial natural products in medicinal chemistry-
exodus or revival? Angewandte Chemie International Edition, 45(31):5072–5129. Available from: http://dx.doi.org/10.1002/anie.
200600350.
Wagner, J., Maksimovic, J., Farries, G., Sim, W. H., Bishop, R. F., Cameron, D. J., Catto-Smith, A. G., and Kirkwood, C. D. 2013.
Bacteriophages in gut samples from pediatric Crohn’s disease patients: metagenomic analysis using 454 pyrosequencing. Inflammatory
Bowel Diseases, 19(8):1598–1608. Available from: http://view.ncbi.nlm.nih.gov/pubmed/23749273.
Wagner, R. 1994. The regulation of ribosomal RNA synthesis and bacterial cell growth. Archives of Microbiology, 161(2):100–109. Available
from: http://dx.doi.org/10.1007/bf00276469.
Waligora, A. J., Hennequin, C., Mullany, P., Bourlioux, P., Collignon, A., and Karjalainen, T. 2001. Characterization of a cell surface protein
of Clostridium difficile with adhesive properties. Infection and Immunity, 69(4):2144–2153. Available from: http://dx.doi.org/10.
1128/iai.69.4.2144-2153.2001.
Walker, A. S., Eyre, D. W., Wyllie, D. H., Dingle, K. E., Harding, R. M., O’Connor, L., Griffiths, D., Vaughan, A., Finney, J., et al. 2012.
Characterisation of Clostridium difficile hospital ward-based transmission using extensive epidemiological data and molecular typing.
PLoS Medicine, 9(2):e1001172+. Available from: http://dx.doi.org/10.1371/journal.pmed.1001172.
Waller, A. S., Yamada, T., Kristensen, D. M., Kultima, J. R., Sunagawa, S., Koonin, E. V., and Bork, P. 2014. Classification and quantification
of bacteriophage taxa in human gut metagenomes. The ISME Journal, 8(7):1391–1402. Available from: http://dx.doi.org/10.1038/
ismej.2014.30.
Wang, Y., Hammes, F., Boon, N., Chami, M., and Egli, T. 2009. Isolation and characterization of low nucleic acid (LNA)-content bacteria.
The ISME Journal, 3(8):889–902. Available from: http://dx.doi.org/10.1038/ismej.2009.46.
Wang, Y., Hammes, F., Boon, N., and Egli, T. 2007. Quantification of the filterability of freshwater bacteria through 0.45, 0.22, and
0.1 µm pore size filters and shape-dependent enrichment of filterable bacterial communities. Environmental Science and Technology,
41(20):7080–7086. Available from: http://dx.doi.org/10.1021/es0707198.
White, R., Blainey, P., Fan, H. C., and Quake, S. 2009. Digital PCR provides sensitive and absolute calibration for high throughput
sequencing. BMC Genomics, 10(1):116+. Available from: http://dx.doi.org/10.1186/1471-2164-10-116.
Wickham, H. 2009. ggplot2: elegant graphics for data analysis. Springer New York. Available from: http://had.co.nz/ggplot2/book.
Willems, R. J., Top, J., van Santen, M., Robinson, D. A., Coque, T. M., Baquero, F., Grundmann, H., and Bonten, M. J. 2005. Global spread
of vancomycin-resistant Enterococcus faecium from distinct nosocomial genetic complex. Emerging Infectious Diseases, 11(6):821–828.
Available from: http://view.ncbi.nlm.nih.gov/pubmed/15963275.
249
Bibliography
Williamson, S. J., Allen, L. Z., Lorenzi, H. A., Fadrosh, D. W., Brami, D., Thiagarajan, M., McCrow, J. P., Tovchigrechko, A., Yooseph, S.,
and Venter, J. C. 2012. Metagenomic exploration of viruses throughout the Indian Ocean. PLoS ONE, 7(10):e42047+. Available from:
http://dx.doi.org/10.1371/journal.pone.0042047.
Willner, D., Furlan, M., Haynes, M., Schmieder, R., Angly, F. E., Silva, J., Tammadoni, S., Nosrat, B., Conrad, D., and Rohwer, F. 2009.
Metagenomic analysis of respiratory tract DNA viral communities in cystic fibrosis and non-cystic fibrosis individuals. PLoS ONE,
4(10):e7370+. Available from: http://dx.doi.org/10.1371/journal.pone.0007370.
Woese, C. R. and Fox, G. E. 1977. Phylogenetic structure of the prokaryotic domain: the primary kingdoms. Proceedings of the National
Academy of Sciences of the United States of America, 74(11):5088–5090. Available from: http://dx.doi.org/10.1073/pnas.74.11.
5088.
Wong, K. H. H., Jin, Y., and Moqtaderi, Z. 2013. Multiplex Illumina sequencing using DNA barcoding. Current protocols in molecular
biology / edited by Frederick M. Ausubel ... [et al.], Chapter 7. Available from: http://view.ncbi.nlm.nih.gov/pubmed/23288465.
Wooley, J. C., Godzik, A., and Friedberg, I. 2010. A primer on metagenomics. PLoS Computational Biology, 6(2):e1000667+. Available
from: http://dx.doi.org/10.1371/journal.pcbi.1000667.
Wostmann, B. S. 1981. The germfree animal in nutritional studies. Annual Review of Nutrition, 1:257–279. Available from: http:
//view.ncbi.nlm.nih.gov/pubmed/6764717.
Woyke, T., Sczyrba, A., Lee, J., Rinke, C., Tighe, D., Clingenpeel, S., Malmstrom, R., Stepanauskas, R., and Cheng, J.-F. 2011.
Decontamination of MDA reagents for single cell whole genome amplification. PLoS ONE, 6(10):e26161+. Available from: http:
//dx.doi.org/10.1371/journal.pone.0026161.
Wu, G. D., Chen, J., Hoffmann, C., Bittinger, K., Chen, Y.-Y., Keilbaugh, S. A., Bewtra, M., Knights, D., Walters, W. A., et al. 2011. Linking
long-term dietary patterns with gut microbial enterotypes. Science, 334(6052):105–108. Available from: http://dx.doi.org/10.
1126/science.1208344.
Xiao, Y., Gordon, A., and Yakovlev, A. 2006. A C++ Program for the Cramér-Von Mises Two-sample test. Journal of Statistical Software,
17(8):1–15. Available from: http://www.jstatsoft.org/v17/i08.
Xiong, J., Hynes, M. F., Ye, H., Chen, H., Yang, Y., M’zali, F., and Hawkey, P. M. 2006. bla(IMP-9) and its association with large plasmids
carried by Pseudomonas aeruginosa isolates from the People’s Republic of China. Antimicrobial Agents and Chemotherapy, 50(1):355–
358. Available from: http://dx.doi.org/10.1128/aac.50.1.355-358.2006.
Yano, J. M., Yu, K., Donaldson, G. P., Shastri, G. G., Ann, P., Ma, L., Nagler, C. R., Ismagilov, R. F., Mazmanian, S. K., and Hsiao, E. Y.
2015. Indigenous bacteria from the gut microbiota regulate host serotonin biosynthesis. Cell, 161(2):264–276. Available from: http:
//dx.doi.org/10.1016/j.cell.2015.02.047.
Yoon, H. S., Price, D. C., Stepanauskas, R., Rajah, V. D., Sieracki, M. E., Wilson, W. H., Yang, E. C., Duffy, S., and Bhattacharya, D. 2011.
Single-cell genomics reveals organismal interactions in uncultivated marine protists. Science, 332(6030):714–717. Available from:
http://dx.doi.org/10.1126/science.1203163.
Youngster, I., Russell, G. H., Pindar, C., Ziv-Baran, T., Sauk, J., and Hohmann, E. L. 2014. Oral, capsulized, frozen fecal microbiota
transplantation for relapsing clostridium difficile infection. JAMA, 312(17):1772–1778. Available from: http://view.ncbi.nlm.nih.
gov/pubmed/25322359.
Zhang, K., Martiny, A. C., Reppas, N. B., Barry, K. W., Malek, J., Chisholm, S. W., and Church, G. M. 2006. Sequencing genomes from
single cells by polymerase cloning. Nature Biotechnology, 24(6):680–686. Available from: http://dx.doi.org/10.1038/nbt1214.
Zhang, T., Breitbart, M., Lee, W. H., Run, J.-Q., Wei, C. L., Soh, S. W., Hibberd, M. L., Liu, E. T., Rohwer, F., and Ruan, Y. 2005. Rna viral
community in human feces: Prevalence of plant pathogenic viruses. PLoS Biology, 4(1):e3+. Available from: http://dx.doi.org/10.
1371/journal.pbio.0040003.
Zheng, Z., Advani, A., Melefors, O., Glavas, S., Nordström, H., Ye, W., Engstrand, L., and Andersson, A. F. 2010. Titration-free massively
parallel pyrosequencing using trace amounts of starting material. Nucleic Acids Research, 38(13):e137. Available from: http://dx.
doi.org/10.1093/nar/gkq332.
Zheng, Z., Advani, A., Melefors, O., Glavas, S., Nordstrom, H., Ye, W., Engstrand, L., and Andersson, A. F. 2011. Titration-free 454
sequencing using Y adapters. Nature Protocols, 6(9):1367–1376. Available from: http://dx.doi.org/10.1038/nprot.2011.369.
250

Bibliography
Zhulidov, P. A., Bogdanova, E. A., Shcheglov, A. S., Vagner, L. L., Khaspekov, G. L., Kozhemyako, V. B., Matz, M. V., Meleshkevitch, E.,
Moroz, L. L., et al. 2004. Simple cdna normalization using Kamchatka crab duplex-specific nuclease. Nucleic Acids Research, 32(3):e37+.
Available from: http://dx.doi.org/10.1093/nar/gnh031.
Zong, C., Lu, S., Chapman, A. R., and Xie, X. S. 2012. Genome-wide detection of single-nucleotide and copy-number variations of a single
human cell. Science, 338(6114):1622–1626. Available from: http://dx.doi.org/10.1126/science.1229164.
251


Chapter15Glossary

Glossary
8HQ 8-Hydroxyquinoline. It is an organic compound, a monoprotic bidentate chelating agent. 74, 75, 77, 80, 81
ATP Adenosine 5’-Triphosphate. It is a substrate for many ATP-dependent enzyme systems, as DNA ligation. 186, 195
CD Crohn’s disease. It is a form of the inflammatory bowel disease. 28, 29
CDI Clostridium difficile infection. This disease is actually an inflammation of the large intestine. C. difficile releases toxins
that may cause bloating and diarrhea, with abdominal pain, which may become severe. 50, 51, 56, 66, 72, 80, 89, 91
Cp The number of cycles which are needed to generate enough molecules that have enough fluorescence to be detected
by the qPCR system. 144, 190
CTAB Cetyltrimethylammonium bromide. It is a cationic surfactant used in the extraction of DNA. 183
dNTP 2’-Deoxynucleotide Triphosphates mix containing deoxyadenosine triphosphate (dATP), deoxyguanosine
triphosphate (dGTP), deoxycytidine triphosphate (dCTP), deoxythymidine triphosphate (dTTP). 186, 195
emPCR Emulsion PCR. It isolates individual DNA molecules along with primer-coated beads in aqueous droplets within
an oil phase. The PCR then coats each bead with clonal copies of the DNA molecule followed by immobilization for
later DNA sequencing. 117, 121, 130
FACS Fluorescent activated cell sorting. It is a specialized type of flow cytometry. It provides a method for sorting a
heterogeneous mixture of biological cells into two or more containers, one cell at a time, based upon the specific
light scattering and fluorescent characteristics of each cell. 41, 50, 52, 91, 98, 104, 107, 110, 117, 132, 138, 140, 142,
152
FC Flow cytometry. It is a laser-based, biophysical technology employed in cell counting, cell sorting, biomarker detection
and protein engineering, by suspending cells in a stream of fluid and passing them by an electronic detection
apparatus. It allows simultaneous multiparametric analysis of the physical and chemical characteristics of up to
thousands of particles per second. 33, 34, 41, 53, 70, 74, 76, 77, 81, 93, 138, 140, 150
FISH Fluorescence in situ hybridization. It is a cytogenetic technique that is used to detect and localize the presence or
absence of specific DNA sequences on chromosomes. FISH uses fluorescent probes that bind to only complementary
parts of the genome. Fluorescence microscopy or flow cytometry can be used to find out where the fluorescent probe
is bound to the chromosomes. 31, 35, 36, 74, 76
GI Gastrointestinal tract. 25
IBD Inflammatory bowel disease. 29
Glossary
Klenow Fragment Klenow Fragment (3’→ 5’ exo-) is an N-terminal truncation of DNA Polymerase I which retains
polymerase activity, but has lost the 5’→ 3’ exonuclease activity and has mutations (D355A, E357A) which abolish
the 3’→5’ exonuclease activity. 186, 195
LB Lysogeny broth. It is a nutritionally rich medium, which is primarily used for the growth of bacteria, consiting usually
from 10 g tryptone, 5 g yeast extract and 10 g NaCl per liter of water. 118, 141
MDA Multiple Displacement Amplification. It is a non-PCR based DNA amplification technique for whole genome
amplification. This method can rapidly amplify minute amounts of DNA samples to a reasonable quantity for
genomic analysis. The reaction starts by annealing random hexamer primers to the template: DNA synthesis is
carried out by a high fidelity enzyme, preferentially phi29 DNA polymerase, at a constant temperature. 116–118,
130, 132, 138
MGB Minor groove binder probes are DNA probes with conjugated minor groove binder groups form extremely stable
duplexes with single-stranded DNA targets, allowing shorter probes to be used for hybridization based assays. 116,
120, 190
MIC Minimum inhibitory concentration. It is the lowest concentration of an antimicrobial that will inhibit the visible
growth of a microorganism after overnight incubation. 75, 77, 80
MID Multiplex identifiers tags. They allow identifying multiple libraries so that they may be multiplexed for sequencing
on one sequencing plate. 120, 125, 186, 191, 207
MLST Multilocus sequence typing. 89, 91
ORF Open reading frame. An open reading frame is essentially the same as genes. They are also referred to as protein-
coding regions. ORFs are identified in genomes by several algorithms, most of which search for stretches of DNA
sequence without stop codons. 27, 144, 147
OTU Operational Taxonomic Units. Operational definition of a species or group of species often used when only DNA
sequence data is available. 62
PBS Phosphate-buffered saline. A buffer commonly used in biological research. The osmolarity and ion concentrations of
the solutions match those of the human body (isotonic). 183
PEG Polyethylene glycol. It is a polyether compound, a hydrophilic polymer, with many applications from industrial
manufacturing to medicine. 150, 188
PTP Pico titer plate. The sequencing plate of 454 sequencing platform. 120, 130
qPCR Quantitative PCR. It is a real-time polymerase chain reaction, which is used to amplify and simultaneously detect
or quantify a targeted DNA molecule. For the DNA quantification can be employed (1) non-specific fluorescent
dyes that intercalate with any double-stranded DNA or (2) sequence-specific oligonucleotides that are labelled with
a fluorescent reporter which permits detection only after hybridization with its complementary sequence. 98, 116,
117, 120, 130
SDS Sodium dodecyl suphate. It is an anionic surfactant used in many cleaning and hygiene products. 76, 183
SNP Single Nucleotide Polymorphisms. It a DNA sequence variation occurring commonly within a population in which
a single nucleotide - A, T, C or G - in the genome differs. 89, 107
TBS Tris-buffered saline. It is a buffer used in some biochemical techniques to maintain the pH within a relatively narrow
range. TBS has many uses because it is isotonic and non-toxic. 141, 188
256
Glossary
UC Ulcerative colitis. It is a form of inflammatory bowel disease. Ulcerative colitis is a form of colitis, a disease of the
colon, that includes characteristic ulcers, or open sores. The main symptom of active disease is usually constant
diarrhea mixed with blood, of gradual onset. 29
WGA Whole genome amplification. It is a way of increasing the amount of limited DNA samples where DNA quantities
are limited but many analyses or high amounts of input DNA are required. 117, 131, 137, 140, 150, 152
257


Valencia, 2016
Related Documents