Mesozooplankton community structure across the Antarctic Circumpolar Current to the north of South Georgia: Southern Ocean Received: 10 December 2002 / Accepted: 18 December 2002 / Published online: 9 April 2003 Ó Springer-Verlag 2003 Abstract During four summer seasons mesozooplank- ton community composition and structure in relation to water mass distribution were investigated along a 735- km transect running across the Antarctic Circumpolar Current (ACC) to the north-west of the island of South Georgia, Southern Ocean. Samples were obtained each year during December–January from the top 200 m of the water column at 22 stations spaced 35 km apart. Cluster analysis revealed four station groupings that were geographically consistent with the different water masses identified on the basis of temperature and salinity properties along the transect. A Sub-Antarctic Zone (SAZ) community characterised by low overall plankton abundance was present at the northernmost end of the transect on three of the four cruises, separated from a Polar Frontal Zone (PFZ) community by the Sub-Ant- arctic Front (SAF). The PFZ community lay between the SAF and the Polar Front (PF) and was characterised by highest overall abundance and little interannual variability. Two Antarctic Zone (AAZ) communities were found south of the PF that, although taxonomi- cally similar, differed in overall abundance. Although there were significant differences in nutrients (e.g. sili- cate) and phytoplankton (Chl a) between the different water masses, these factors only weakly correlated with plankton community structure. Copepods were the largest contributors to total abundance within all station groupings (median percentage 83–90% of total) and pteropods were also proportionately abundant in the PFZ (11%). With the exception of pteropods ( £ 11%) and ostracods ( £ 3%) all other non-copepod taxa contributed <1% to total abundance. All station groups were characterised by varying proportions of a relatively small subset of species, many of which were present throughout the transect, for example, Oithona similis, Ctenocalanus spp., Euchaeta antarctica, and Rhincalanus gigas. Others were particularly characteris- tic of different station groups, thus Neocalanus tonsus, Clausocalanus ingens, and Calocalanus spp. were char- acteristic of the SAZ with few in the PFZ and none in the AAZ. Microcalanus pygmaeus was particularly abundant in the AAZ compared to other regions, as was the polychaete, Pelagobia longicirrata. Other taxa, al- though widespread, tended to be typical of particular water masses, for example, Calanus simillimus and Li- macina helicina in the PFZ, Calanoides acutus, appen- dicularians and P. longicirrata in the AAZ, and ostracods and chaetognaths in the SAZ. The close physical and biological coupling observed across the ACC confirms the frontal zones and particularly the PF as features across which community properties change in the Atlantic sector of the Southern Ocean. Introduction Despite its circumpolar continuity the Southern Ocean is increasingly being recognised as a mosaic of sub-regions, each having distinct physical and biological properties (Tre´guer and Jacques 1992; Longhurst 1998; Pakhomov et al. 2000). Tre´guer and Jacques (1992) denoted the following areas, Polar Frontal Zone (PFZ), Permanently Open Ocean Zone (POOZ), Seasonal Ice Zone (SIZ), and Continental Shelf Zone (CSZ), as representing four separate functional units based on differences in their nutrient and phytoplankton dynamics. Longhurst’s (1998) alternative view that frontal zones within the Marine Biology (2003) 143: 121–130 DOI 10.1007/s00227-003-1019-6 P. Ward M. Whitehouse M. Brandon R. Shreeve R. Woodd-Walker Communicated by J.P. Thorpe, Port Erin P. Ward (&) M. Whitehouse R. Shreeve R. Woodd-Walker British Antarctic Survey, High Cross, Madingley Road, Cambridge, CB3 0ET, UK E-mail: [email protected] Tel.: +44-01223-22156 Fax: +44-01223-362616 M. Brandon Department of Earth Sciences, The Open University, Walton Hall, Milton Keynes, MK7 6AA, UK

Welcome message from author
This document is posted to help you gain knowledge. Please leave a comment to let me know what you think about it! Share it to your friends and learn new things together.
Transcript

Mesozooplankton community structure across the Antarctic CircumpolarCurrent to the north of South Georgia: Southern Ocean
Received: 10 December 2002 / Accepted: 18 December 2002 / Published online: 9 April 2003� Springer-Verlag 2003
Abstract During four summer seasons mesozooplank-ton community composition and structure in relation towater mass distribution were investigated along a 735-km transect running across the Antarctic CircumpolarCurrent (ACC) to the north-west of the island of SouthGeorgia, Southern Ocean. Samples were obtained eachyear during December–January from the top 200 m ofthe water column at 22 stations spaced 35 km apart.Cluster analysis revealed four station groupings thatwere geographically consistent with the different watermasses identified on the basis of temperature and salinityproperties along the transect. A Sub-Antarctic Zone(SAZ) community characterised by low overall planktonabundance was present at the northernmost end of thetransect on three of the four cruises, separated from aPolar Frontal Zone (PFZ) community by the Sub-Ant-arctic Front (SAF). The PFZ community lay betweenthe SAF and the Polar Front (PF) and was characterisedby highest overall abundance and little interannualvariability. Two Antarctic Zone (AAZ) communitieswere found south of the PF that, although taxonomi-cally similar, differed in overall abundance. Althoughthere were significant differences in nutrients (e.g. sili-cate) and phytoplankton (Chl a) between the differentwater masses, these factors only weakly correlated withplankton community structure. Copepods were thelargest contributors to total abundance within all station
groupings (median percentage 83–90% of total) andpteropods were also proportionately abundant in thePFZ (11%). With the exception of pteropods ( £ 11%)and ostracods ( £ 3%) all other non-copepod taxacontributed <1% to total abundance. All stationgroups were characterised by varying proportions of arelatively small subset of species, many of which werepresent throughout the transect, for example, Oithonasimilis, Ctenocalanus spp., Euchaeta antarctica, andRhincalanus gigas. Others were particularly characteris-tic of different station groups, thus Neocalanus tonsus,Clausocalanus ingens, and Calocalanus spp. were char-acteristic of the SAZ with few in the PFZ and none inthe AAZ. Microcalanus pygmaeus was particularlyabundant in the AAZ compared to other regions, as wasthe polychaete, Pelagobia longicirrata. Other taxa, al-though widespread, tended to be typical of particularwater masses, for example, Calanus simillimus and Li-macina helicina in the PFZ, Calanoides acutus, appen-dicularians and P. longicirrata in the AAZ, andostracods and chaetognaths in the SAZ. The closephysical and biological coupling observed across theACC confirms the frontal zones and particularly the PFas features across which community properties change inthe Atlantic sector of the Southern Ocean.
Introduction
Despite its circumpolar continuity the Southern Ocean isincreasingly being recognised as a mosaic of sub-regions,each having distinct physical and biological properties(Treguer and Jacques 1992; Longhurst 1998; Pakhomovet al. 2000). Treguer and Jacques (1992) denoted thefollowing areas, Polar Frontal Zone (PFZ), PermanentlyOpen Ocean Zone (POOZ), Seasonal Ice Zone (SIZ),and Continental Shelf Zone (CSZ), as representing fourseparate functional units based on differences in theirnutrient and phytoplankton dynamics. Longhurst’s(1998) alternative view that frontal zones within the
Marine Biology (2003) 143: 121–130DOI 10.1007/s00227-003-1019-6
P. Ward Æ M. Whitehouse Æ M. Brandon Æ R. ShreeveR. Woodd-Walker
Communicated by J.P. Thorpe, Port Erin
P. Ward (&) Æ M. Whitehouse Æ R. Shreeve Æ R. Woodd-WalkerBritish Antarctic Survey, High Cross,Madingley Road, Cambridge, CB3 0ET, UKE-mail: [email protected].: +44-01223-22156Fax: +44-01223-362616
M. BrandonDepartment of Earth Sciences,The Open University,Walton Hall, Milton Keynes,MK7 6AA, UK

Antarctic Circumpolar Current (ACC), particularly theSubtropical Convergence (STC), Subantarctic Front(SAF), Antarctic Polar Front (PF), and Antarctic Di-vergence (AD), best serve to define ecologically distinctareas is fundamentally similar. This is supported by re-cent research (e.g. Froneman et al. 1995; Pakhomov andMcQuaid 1996; Errhif et al. 1997; Pakhomov et al. 2000;Ward et al., 2003b) that has looked at partitioning ofzooplankton communities over large and basin scalesand has found in most cases that changes were coinci-dent with the presence of frontal zones.
Although the Southern Ocean has an essentially an-nular structure, occasioned by the circumpolar nature ofthe fronts, the generation of eddies and meandering offrontal zones is commonplace (Lutjeharms and Baker1980; Bryden 1983; Lutjeharms et al. 1985). It has beensuggested that meso- and large-scale movements offrontal zones, particularly the PF, can have dramaticinfluences on ecosystem function by influencing zoo-plankton community composition (Heywood et al. 1985;Priddle et al. 1988; Hosie 1994; Pakhomov et al. 1997;Chiba et al. 2001; Hunt et al. 2001). Hunt et al. (2001)have observed rapid shifts in frontal positions near thePrince Edward Islands accompanied by changes inecosystem structure, and Chiba et al. (2001) have alsoobserved such variability in the Prydz Bay region in theIndian Ocean sector of the Southern Ocean. Here amixing of zooplankton communities along the samelatitude is brought about by intrusions of warmer sili-cate-poor water from the northern part of the ACC intocolder silicate-rich water to the south. The regiondownstream of Drake Passage is also particularly dy-namic following its narrowing and constraint betweenthe Antarctic Peninsula and South America, and herethe generation of eddies and meandering of frontal zonesis commonplace (Atkinson et al. 1990; Whitehouse et al.1996a). Heywood et al. (1985) and Priddle et al. (1988)have suggested large-scale frontal shifts as a factor in-fluencing oceanographic conditions around the produc-tive island of South Georgia lying south of the PF in thePOOZ at the north-eastern margins of the Scotia Sea.However, recent findings summarised in Atkinson et al.(2001) discount the idea of such large-scale frontalmovements in this region given that the PF has beenshown to be consistently >250 km north of SouthGeorgia (Moore et al. 1997, 1999). However, there re-mains some debate as to the course taken by the PF tothe north of South Georgia. Mackintosh (1946) drewpositions for the location of the PF (formerly the Ant-arctic Convergence) in this region that lay both to thenorth and south of Maurice Ewing Bank (MEB)whereas Gordon et al. (1977) suggested the PF lies on itssouthern flank. More recently Moore et al. (1997,1999),Trathan et al. (2000), and Arhan et al. (2002) have alsosuggested the southern flank as the most likely positionand discuss the constraining influence of local topogra-phy.
Nonetheless considerable interannual variation in theimmediate environment around South Georgia has been
recorded, both in terms of its physical properties (Mer-edith et al. 2003a) and also with respect to nutrients,phytoplankton, and zooplankton (Whitehouse et al.1993, 1996b, 2000; Brierley et al. 1997; Shreeve et al.2002). Some of this environmental variation is un-doubtedly seasonal in nature, reflecting differences in thetiming of ecosystem processes in relation to sampling,but regional changes in water mass characteristics mayalso be influential (Trathan et al. 2003; Meredith et al.2003b). South Georgia is a productive region but long-term declines in population indices of krill-dependentpredators suggest that the marine environment, partic-ularly with respect to the supply of krill brought into thevicinity of the island, might be changing (Reid andCroxall 2001). Characterising variability over a varietyof scales is a necessary precursor to detecting and un-derstanding fundamental long-term changes. As a con-sequence the British Antarctic Survey has undertaken a5-year programme to study physical and biologicalvariability in the waters around South Georgia. As partof this an oceanographic sampling programme was es-tablished along a 735-km transect running across theACC, over MEB south-eastwards towards SouthGeorgia. This article reports four summer seasons (1995/1996–1998/1999) of sampling that focussed on meso-zooplankton community structure in relation to watermass structure.
Materials and methods
The transect consisted of a series of 22 stations, spaced at 35-kmintervals, starting north of the MEB at 47�59¢S, 43�16¢W andrunning south-eastwards towards the South Georgia shelf (53�52¢S,38�40¢W; Fig. 1). Sampling was carried out during four australsummers (December/January) during the years 1995/1996–1998/1999 (Cruises JR11, 17, 28, and 38). Each occupation of the tran-sect lasted approximately 4 days. CTDs were deployed at eachstation to a depth of at least 1,000 m, with the exception of sta-tion 22, located over the South Georgia shelf in around 200 mdepth. Water bottle samples (0–50 m) were analysed fluorometri-cally for chlorophyll a (Parsons et al. 1984) and silicate (White-house 1997). Surface mixed-layer depths were generally around50 m; therefore an average value has been used to describe Chl aand Si.
The positions of the PF and SAF were located in two ways: firston the basis of isotherm depth; for the PF we used the 2�C isothermcrossing 200 m depth (Peterson and Whitworth 1989; Orsi et al.1995) and for the SAF, where the 4�C isotherm descended below400 m (Orsi et al. 1995). However, as both Peterson and Whitworth(1989) and Orsi et al. (1995) recognised, temperature, in isolation,can be a poor indicator of boundaries, so we also used standardtemperature and salinity (TS) envelopes previously described forthe Scotia Sea (Gordon et al. 1977) to identify frontal positions.
A paired motion-compensated Bongo net (0.61 m diameter,200 lm mesh net) equipped with 5-l solid cod-ends was used ateach station to sample zooplankton. The net was deployed to200 m and hauled vertically to the surface at 10–13 m min)1. Thecatch was concentrated by filtration and preserved in 10% (v:v)formalin in seawater and transported back to the UK. In the lab-oratory macroplankton such as krill, salps, and other gelatinousforms were first removed and counted and samples were then splitinto a series of aliquots using a Folsom plankton splitter. The aimwas to count at least 200 individual plankton in each aliquot andaccordingly two fractions of between 1/2 and 1/64 of the preserved
122

amount were usually examined to ascertain the numbers of largermesozooplankton (large copepods, chaetognaths, euphausiid lar-vae, etc.) and two fractions usually between 1/256 and 1/512 for thesmaller end of the spectrum (Oithoniids, Ctenocalanus spp. cope-pod nauplii, etc.). During cruise JR17 poor weather preventedsampling taking place at station 15 and accordingly 87 sampleswere collected for this study out of a possible total of 88.
Sample data were analysed using the statistical package Plym-outh Routines in Multivariate Ecological Research PRIMER 5(PRIMER-E Ltd 2000; see Clarke and Warwick 1994). Copepodspecies stages and larval euphausiids were pooled within species togive overall totals, thus reducing the list of taxa categories from 104to 65. Rare taxa (those contributing <4% of counts at all stations)were eliminated, resulting in 33 taxa being used for subsequentanalyses. The abundances were standardised (per cubic metre) andlog transformed. Bray–Curtis similarity was calculated betweensamples and used for nearest-neighbour cluster analysis and multi-dimensional scaling (MDS). Station groups identified in this waywere tested for significance using ANOSIM (analysis of similarity,analogous to one-way ANOVA), and SIMPER (similarity per-centages) was used to identify the taxa contributing to similaritywithin and differences between groups, respectively (Fieldet al.1982). The routines BIOENV and BVSTEP were used to testthe extent to which measured environmental variables (tempera-ture, silicate concentration, and surface chlorophyll), could accountfor pattern in the species data and to test for redundancy by seeing
if a limited subset of species could produce the same pattern. Thesoftware package Minitab 13 (Minitab, State College, Pa.) wasused to examine the relationships between zooplankton in differentwater masses across different years.
Results
Water masses and environmental variablesalong the transect
TS properties consistently placed the PF on the southernflank of the MEB generally between stations 12 and 13,in agreement with the positions defined by Moore et al.(1997), whereas the position using temperature alonewas variable, generally placing the PF further north (upto 2� latitude on JR11). The position of the SAF differedless between definitions and was usually encounteredwithin the first few stations at the northern end of thetransect. Although it was not found at all during JR11, itis likely that it lay close by, as indicated by the increasinggradients in salinity and density recorded towards thetransect head (Trathan et al. 2000). It was only detectedon the basis of temperature during cruise JR38. There-fore, for the purposes of subsequent analysis, the PF wasdefined as lying between stations 12 and 13 with stationsto the south of this position characterised as lying inAntarctic Zone (AAZ) water and stations to the north(up to the SAF) as lying in PFZ water. The SAF wasabsent during cruise JR11, lay between stations 5 and 6on cruise JR17, between 2 and 3 on cruise JR28, andbetween 4 and 5 on cruise JR38.
There were significant (P<0.001) environmental dif-ferences between surface (0–50 m) properties measuredwithin the three zones (Fig. 2). For instance, a latitudi-nal temperature gradient was evident with SAZ valueshigher than those in the PFZ that in turn were higherthan those in the AAZ (median values 9.9, 5.1, 2.7�C,respectively). A range of around 11�C was found duringthe four cruises between the colder AAZ temperatures inthe south and the northernmost stations in the SAZ.Generally temperature was less variable south of the PF(�2–4�C) compared to a 5–6�C variation observed at thenorth-western end of the transect (see also Whitehouseet al. 2000). A latitudinal gradient was also evident insilicate concentrations with significant differences be-tween the three zones. As previously documented(Whitehouse et al. 2000), and in contrast to temperature,highest values were found in AAZ waters and lowestwithin the SAZ (medians 13 and 2.2 mmol m)3, PFZ�4.9 mmol m)3). Variability, due to differential phyto-plankton use as well as seasonal factors, was consider-able, especially over the South Georgia shelf.Phytoplankton standing stock, measured as chlorophylla, was also very variable, probably due to differentialgrazing rates in addition to growth and seasonal factors.In contrast to temperature and silicate, the SAZ and thePFZ (medians 0.6 and 0.8 mg m)3, respectively) weresimilar, although both held significantly less phyto-plankton than the AAZ (median 2.9 mg m)3).
Fig. 1 Map showing the positions of South Georgia within thenorthern part of the Scotia Sea (inset) and the 22 stations along thetransect. Cruise JR11 was undertaken 5–7 January 1996, JR17 16–21 December 1996, JR28 17–21 January 1998, and JR38 20–25December 1998. Isobaths shown in metres. During the surveys thePolar Front (PF) was always found between stations 12 and 13.The Subantarctic Front (SAF) was absent along the transect duringcruise JR11 but variously lay between stations 2 and 3, 4 and 5, and5 and 6 on the three remaining cruises (see Fig. 2)
123

Whilst there was generally a smooth latitudinalprogression between the various water masses and littleevidence for eddy generation, there was a suggestionthat during JR17, station 1 might have been influencedby water of PFZ origin. This supposition was based onthe clustering of stations on the basis of zooplanktondata (see below) and the surface temperature, whichwas some 3�C lower than found at the subsequentstation 2.
Station groupings
Results of clustering and MDS analysis on the aggre-gated data set are presented in Fig. 3. Four stationgroupings were identified that were geographically con-sistent with the distribution of water masses as deter-mined from TS properties (see above). Group 1consisted of 9 stations drawn from cruises JR17, JR28,and JR38, all of which were located at the northernmosthead of the transect within water close to or influenced
by the SAF. Group 2 comprised 37 stations drawn fromall cruises, 35 of which lay within the PFZ, extendingnorthwards from station 12 or 13 up to the SAF, and afurther 2 in bordering SAZ water. Group 3 represented29 stations drawn from cruises JR17, JR28, and JR38,27 of which clearly lay in AAZ water and the remaining 2in adjacent PFZ water. Group 4 consisted of 10 AAZstations from cruise JR11 and 2 AAZ near-shelf andshelf stations (21 and 22) from cruise JR17. MDS showsthe station groupings to be clearly demarcated in ordi-nation space.
ANOSIM performed on the station groupings indi-cated a large value for R (the global statistic) and sig-nificant differences between all four station groups in thepairwise tests (Table 1). Characterisation of the stationsaccording to which water mass they lay in also produceda similar result. The overall value of R in this case wassomewhat less, largely because station groups 3 and 4both lay within the same water mass.
Fig. 3 a Results of clustering performed on the Bray–Curtissimilarity matrix created from the log-transformed zooplanktondata. Four station groups referred to in the text and Table 1 areidentified in panel b. Results of MDS: stations have beendesignated according to which water mass they occupied and alsowhich station group they occurred in. Thus the shapes of thesymbols, irrespective of infill, represent different water masses(squares SAZ, triangles PFZ, circles AAZ) and the infill indicateswhich station group they belonged to (solid circles group 4, opencircles group 3, solid triangles and squares group 2, and crossedsquares group 1)
Fig. 2 Water mass distributions along the transect determinedduring each of the four cruises described in this study (upper panel).Plots of median values (interquartile and range values also shown)of temperature, silicate, and chlorophyll a within the top 50 m atstations along the transect across all years are shown. AAZAntarctic Zone, PFZ Polar Frontal Zone, SAZ Sub-AntarcticZone
124

Grouping stations by cruise yielded low values of R( £ 0.276). indicating that overall, cruise per se was not asignificant factor in the ordination of stations.
Community structure
Overall, zooplankton abundance with respect to watermass was highest within the PFZ (median abundance2,100 individuals m)3) and lowest in the SAZ (470 in-dividuals m)3). Mann–Whitney tests of median valuesindicated significant differences in median abundancebetween the SAZ and the PFZ and AAZ across all yearscombined but none between the PFZ and AAZ(Table 2). Testing within water masses, but betweenyears, Kruskal–Wallis tests confirmed the high vari-ability seen in the AAZ and to a lesser extent the SAZ,although there were no differences seen within the PFZ(Table 3). Variation in abundance along the transectacross years is summarised in Fig. 4, where medianvalues and interquartile ranges are presented.
Copepods were the largest contributors to totalabundance within all station groupings (median per-centage 83–90% of total) and pteropods were also pro-portionately abundant in the PFZ (11%). With the
exception of ostracods (1–3%) all other non-copepodtaxa contributed <1% to total abundance.
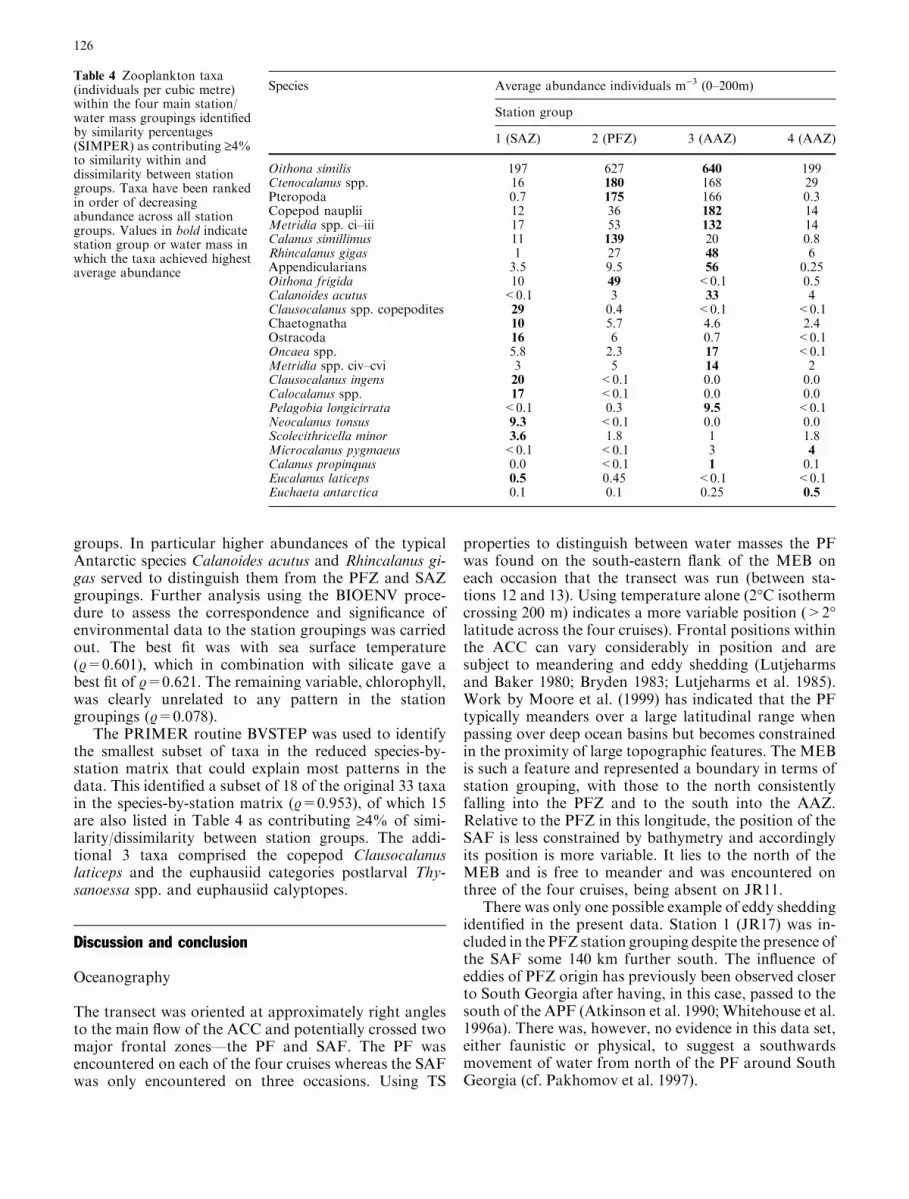
SIMPERwas performed to determine which taxa werecontributing most to similarities within and differencesbetween station groupings. The abundance (individualsper cubic metre) of the 24 taxa that contributed ‡4% towithin-group similarity or between-group dissimilarityfor at least one of the four groups are presented inTable 4.Average within-group similarity ranged from 78 to 83%.All taxa listed in Table 4 collectively accounted for be-tween 70 and 88% of within-group similarity. Between-group dissimilarity ranged from 25 to 40%.
There were broad similarities in taxonomic compo-sition across the four station groups with many species,such as Oithona similis and Ctenocalanus spp., beingwidely distributed and abundant in all four groups.These taxa contributed a higher proportion of within-group similarity to all groups than many taxa that wererarer and had restricted distributions, for example, Ne-ocalanus tonsus and Calocalanus spp., which were con-fined to station groups 1 and 2. Species with restricteddistributions generally contributed most to between-group dissimilarity. Thus the SAZ group was distin-guished from the others primarily by the presence of thetwo aforementioned species and additionally by thepresence of large numbers of Clausocalaniid copepoditestages. The PFZ was characterised by the presence ofCalanus simillimus, Ctenocalanus spp., and the shelledpteropod Limacina helicina. The two AAZ groups weredistinct from one another as well as the other two
Table 1 Analysis of similarity (ANOSIM) performed on the simi-larity matrix using the ’station groups’ derived from the clusteranalysis (see Fig. 3) and by grouping data according to which watermass they occupied. For derivation of water masses see Methods.Global R for station groups, R=0.722 (P=0.1%) and for watermasses, R=0.629 (P=0.1%). All values of R in the pairwise testsare significant at P=0.1%. PFZ Polar Frontal Zone, AAZ Ant-arctic Zone, SAZ Sub-Antarctic Zone
Pairwise tests R statistic
Station groups1, 3 0.9992, 4 0.8412, 1 0.8862, 3 0.6364, 1 14, 3 0.825
Water massesPFZ, AAZ 0.511PFZ, SAZ 0.843AAZ, SAZ 0.896
Table 2 Non-parametric tests of median abundance between watermasses. Median abundances across years (lowest and highest me-dian values within years). Mann–Whitney tests are between watermasses pooling across years. Significant P values indicate medianabundances differing between water masses
Water masscomparisons
Median abundanceacross years
Mann–Whitneycomparisons
Significance
Individuals m–3 W P
SAZ/PFZ 470 (299–1449) 121 0.0003**AAZ/PFZ 2100 (1216–2743) 1338 0.0903 (NS)AAZ/SAZ 1429 (393–3500) 1092 0.0231*
*P<0.05; **P<0.01
Table 3 Non-parametric tests of median abundance within watermasses. Kruskal–Wallis tests are to assess differences within watermasses between years. Significant P values indicate median abun-dances differing between years
Water mass Kruskal–Wallis SignificanceH P
SAZ 6.72 0.035*PFZ 2.86 0.414 (NS)AAZ 30.47 0.000**
*P<0.05; **P<0.01
Fig. 4 Mesozooplankton abundance (individuals m–3) along thetransect across all years. Median abundance value with interquar-tile ranges are shown. Table 2 gives the results of non-parametrictesting of differences in abundance between water masses
125
groups. In particular higher abundances of the typicalAntarctic species Calanoides acutus and Rhincalanus gi-gas served to distinguish them from the PFZ and SAZgroupings. Further analysis using the BIOENV proce-dure to assess the correspondence and significance ofenvironmental data to the station groupings was carriedout. The best fit was with sea surface temperature(.=0.601), which in combination with silicate gave abest fit of .=0.621. The remaining variable, chlorophyll,was clearly unrelated to any pattern in the stationgroupings (.=0.078).
The PRIMER routine BVSTEP was used to identifythe smallest subset of taxa in the reduced species-by-station matrix that could explain most patterns in thedata. This identified a subset of 18 of the original 33 taxain the species-by-station matrix (.=0.953), of which 15are also listed in Table 4 as contributing ‡4% of simi-larity/dissimilarity between station groups. The addi-tional 3 taxa comprised the copepod Clausocalanuslaticeps and the euphausiid categories postlarval Thy-sanoessa spp. and euphausiid calyptopes.
Discussion and conclusion
Oceanography
The transect was oriented at approximately right anglesto the main flow of the ACC and potentially crossed twomajor frontal zones—the PF and SAF. The PF wasencountered on each of the four cruises whereas the SAFwas only encountered on three occasions. Using TS
properties to distinguish between water masses the PFwas found on the south-eastern flank of the MEB oneach occasion that the transect was run (between sta-tions 12 and 13). Using temperature alone (2�C isothermcrossing 200 m) indicates a more variable position (>2�latitude across the four cruises). Frontal positions withinthe ACC can vary considerably in position and aresubject to meandering and eddy shedding (Lutjeharmsand Baker 1980; Bryden 1983; Lutjeharms et al. 1985).Work by Moore et al. (1999) has indicated that the PFtypically meanders over a large latitudinal range whenpassing over deep ocean basins but becomes constrainedin the proximity of large topographic features. The MEBis such a feature and represented a boundary in terms ofstation grouping, with those to the north consistentlyfalling into the PFZ and to the south into the AAZ.Relative to the PFZ in this longitude, the position of theSAF is less constrained by bathymetry and accordinglyits position is more variable. It lies to the north of theMEB and is free to meander and was encountered onthree of the four cruises, being absent on JR11.
There was only one possible example of eddy sheddingidentified in the present data. Station 1 (JR17) was in-cluded in the PFZ station grouping despite the presence ofthe SAF some 140 km further south. The influence ofeddies of PFZ origin has previously been observed closerto South Georgia after having, in this case, passed to thesouth of the APF (Atkinson et al. 1990; Whitehouse et al.1996a). There was, however, no evidence in this data set,either faunistic or physical, to suggest a southwardsmovement of water from north of the PF around SouthGeorgia (cf. Pakhomov et al. 1997).
Table 4 Zooplankton taxa(individuals per cubic metre)within the four main station/water mass groupings identifiedby similarity percentages(SIMPER) as contributing ‡4%to similarity within anddissimilarity between stationgroups. Taxa have been rankedin order of decreasingabundance across all stationgroups. Values in bold indicatestation group or water mass inwhich the taxa achieved highestaverage abundance
Species Average abundance individuals m)3 (0–200m)
Station group
1 (SAZ) 2 (PFZ) 3 (AAZ) 4 (AAZ)
Oithona similis 197 627 640 199Ctenocalanus spp. 16 180 168 29Pteropoda 0.7 175 166 0.3Copepod nauplii 12 36 182 14Metridia spp. ci–iii 17 53 132 14Calanus simillimus 11 139 20 0.8Rhincalanus gigas 1 27 48 6Appendicularians 3.5 9.5 56 0.25Oithona frigida 10 49 <0.1 0.5Calanoides acutus <0.1 3 33 4Clausocalanus spp. copepodites 29 0.4 <0.1 <0.1Chaetognatha 10 5.7 4.6 2.4Ostracoda 16 6 0.7 <0.1Oncaea spp. 5.8 2.3 17 <0.1Metridia spp. civ–cvi 3 5 14 2Clausocalanus ingens 20 <0.1 0.0 0.0Calocalanus spp. 17 <0.1 0.0 0.0Pelagobia longicirrata <0.1 0.3 9.5 <0.1Neocalanus tonsus 9.3 <0.1 0.0 0.0Scolecithricella minor 3.6 1.8 1 1.8Microcalanus pygmaeus <0.1 <0.1 3 4Calanus propinquus 0.0 <0.1 1 0.1Eucalanus laticeps 0.5 0.45 <0.1 <0.1Euchaeta antarctica 0.1 0.1 0.25 0.5
126

Association of zooplankton with water masses
Copepods constituted by far the largest proportion oftotal zooplankton abundance and with the exception ofthe pteropoda (mainly Limacina helicina), which wereparticularly abundant in the PFZ, other taxa contrib-uted little to overall characterisation of communitieswithin water masses. Overall abundance was consis-tently higher in the PFZ than in the other water masses,and although there were no numerical increases associ-ated with the frontal zones, there was considerable in-terstation variability. Our results on the generalcomposition of the plankton are in broad agreementwith those of Pakhomov et al. (2000), who reviewedzooplankton distribution and community structurealong a transect running across the ACC from Sanae onthe Antarctic continent to Cape Town. Abundance was,however, significantly greater in this study probably duein large part to a smaller net mesh (200 lm vs 300 lm).We found four major station groupings that were foundto be consistent with different water masses separated bythe major frontal regions (Fig. 3). These groupings werealso in agreement with those defined by Pakhomov et al.(2000) and in the main were characterised by varyingproportions of a relatively small subset of species (Ta-ble 4). Although many of these were present throughoutthe transect, some were particularly characteristic ofdifferent station groupings, thus Neocalanus tonsus,Clausocalanus ingens, and Calocalanus spp. were char-acteristic of the SAZ with few in the PFZ and none inthe AAZ. Microcalanus pygmaeus was particularlyabundant in the AAZ compared to other regions as wasthe polychaete, Pelagobia longicirrata. Other taxa suchas Ctenocalanus spp., Euchaeta antarctica, and Rhincal-anus gigas were generally widespread along the transectand others, although widespread, tended to be typical ofparticular water masses, for example, Calanus simillimusand L. helicina in the PFZ, Calanoides acutus, appendi-cularians, and P. longicirrata in the AAZ, and ostracodsand chaetognaths in the SAZ (Table 4).
Over the 4 years represented in this study there was avery strong relationship between zooplankton commu-nity structure and water mass distribution indicating aclose relationship between physics and biology. Therobustness of these groupings is suggested by the con-sistent pattern in relation to the frontal zones across allyears. Greater variability in overall zooplankton abun-dance was more apparent within the AAZ than in theother water masses when all years were compared (Ta-ble 3) and the presence of two station groups clearlyseparated from each other is interesting. In fact group 3is closer to the PFZ grouping than to group 4 (Fig. 3).SIMPER did not indicate a fundamentally differentzooplankton composition between these two groups al-though most taxa in group 4 (primarily cruise JR11)were reduced in abundance relative to their meanabundance in group 3 (cruises 17, 28, and 38). It wasalso noticeable that during cruise JR11 the SAZgrouping was absent, and the PFZ extended to the
transect head where sea surface temperatures at )7�Cwere as much as 5�C lower than in other years.
Whitehouse et al. (2000) examined the chlorophyll/nutrient characteristics along the transect over a numberof years and from their analysis it is clear that greatervariability was also seen in the AAZ than elsewhere,particularly with respect to chlorophyll and silicate.Shreeve et al. (2002) examined the relationships betweencopepod abundance and chlorophyll and silicate con-centrations, respectively, in two mesoscale boxes on thenorth coast of South Georgia during the same cruiseperiods. Their findings indicated a strong inverse rela-tionship between zooplankton abundance and silicateconcentration, suggesting that silicate serves as a proxyfor past diatom growth—that is, where there has beenlittle diatom growth and hence little silicate draw-downthere will be low zooplankton abundance. Applying theroutine BIOENV to the whole data set as well as asubset within the AAZ, however, indicated no clear re-lationship. There may be a number of reasons for this.First, to be able to apply this method successfully re-quires that the same water mass be sampled on eachoccasion. Within the AAZ, silicate concentration may bevariable (Ward et al. 2003a) and colder silicate-richwater from the southern part of the ACC may occa-sionally intrude into this part of the transect as theSouthern Antarctic Circumpolar Current Front (SAC-CF) loops westwards along the north coast of SouthGeorgia before retroflecting eastwards well to the northof the island (Orsi et al. 1995; Ward et al. 2003a; Mer-edith et al. 2003b). Thus advection of water with dif-fering nutrient properties, but not necessarily a differentzooplankton community, may be present.
Second, it has been suggested by Atkinson et al.(1999) that during cruise JR11 krill abundance was highin the South Georgia–PF region and that predation bykrill on copepods could be responsible for their lowabundance. Although inverse relationships were dem-onstrated between krill and copepods over a number ofscales, krill biomass around South Georgia during JR11was not the highest recorded over the 4 years of thisstudy. Cruises took place in a fairly narrow time windowof approximately 1 month (December–January) and al-though there is variability in the timing of the bloomperiod and hence recruitment of zooplankton, season-ally JR11 was not the earliest cruise (see Methods) andso time of year appears relatively unimportant in thisinstance. The region of the transect lying between SouthGeorgia and the PF is somewhat atypical of the ACCgenerally in terms of productivity. Examination of re-gional SeaWIFS images shows the links between SouthGeorgia and the PF and the general enhancement thatcan occur along the transect during the summer (At-kinson et al. 2001; R. Korb et al., unpublished manu-script). Whereas lower chlorophyll values, more typicalof the ACC generally, were recorded during JR11 (me-dian value 1.6 mg m)3) much higher levels (median9.8 mg m)3) were measured on JR17 (Whitehouse et al.2000). However at South Georgia, shelf waters fre-
127
quently have less chlorophyll biomass than those offshelf(Whitehouse et al. 2000; R. Korb et al., unpublishedmanuscript). During JR11 modified shelf water occupiedthe last four stations along the transect (19–22) andduring JR17 a distinct frontal zone also separated shelf-modified water (stations 21 and 22) and offshelf AAZwater (Brandon et al. 2000). Thus 6 of the 12 stationsidentified in station group 4 occupied water that wascolder and fresher compared to cruises JR28 and JR38.Whatever the reason for the reduced zooplanktonabundance during JR11, phytoplankton biomass wasclearly linked to intercruise variability. Temperatureemerged as the environmental factor most clearly relatedto the species similarity matrix. This is perhaps not toosurprising given that TS properties were used to definethe water masses.
Biogeographical boundaries
Despite some penetration of ’Antarctic species’ into thePFZ and a corresponding southwards movement of sub-Antarctic species, it has generally been accepted that thePF represents a significant faunal boundary in theSouthern Ocean at least as far as near-surface organismsare concerned (Deacon 1982; Pakhomov and McQuaid1996; Errhif et al. 1997; Pakhomov et al. 2000; thisstudy). Atkinson and Sinclair (2000) have pointed outthat in the Atlantic sector many species show a spectrumof zonal distribution with several major species beingabundant in the region of the PF itself. On a species-by-species basis they found little evidence that the PF rep-resented a faunal boundary and mesopelagic species inparticular were widely distributed throughout the re-gion. In this study the PFZ did indeed contain a mixtureof Antarctic and sub-Antarctic species and has beencharacterised as an ecotone-type community (Pakhomovet al. 2000). However, when such data on near-surfacespecies are subjected to multivariate analysis and watermass positions are clearly defined, it is invariably foundthat community changes are commonly indicated atfrontal regions. Different ’communities’ are often rep-resented by changes in the balance of taxa or in theabundance of individual species, rather than funda-mentally differing faunas (Siegel and Piatkowski 1990).Within the Southern Ocean the STC is undoubtedly themost important faunistic boundary for many speciesincluding mesopelagic forms (Boltovskoy et al. 1999;Pakhomov et al. 2000; Ward and Shreeve 2001). In ourstudy the SAF, when present, also represented a featureeither side of which there was a clear change in com-munity structure. Characterised by significantly lowerzooplankton abundance and a higher proportion ofClausocalaniid copepods, chaetognaths, and ostracods,this zone was more dissimilar to the PFZ communitythan was either of the AAZ groupings (Table 1). Southof the PF a single plankton community was found al-though two station groupings were present. Previousstudies reached a similar conclusion, for example, in a
basin-scale study encompassing stations throughout theScotia Sea, Ward et al. (2003b) distinguished warm andcold water assemblages that taxonomically only repre-sented a single community. In this Southern Oceansector the ACC is geographically wide and temporaldifferences in community development can give rise toapparent differences in community structure. Pakhomovet al. (2000) also reached the same conclusion in thatdespite finding three differing assemblages south of thePF, specifically associated with the marginal ice zoneand open water, taxonomically only a single communitywas distinguished.
Conclusion
In contrast to areas of the world’s ocean where routinemonitoring of plankton populations has been widelypractised (e.g. North Atlantic, see Edinburgh Oceano-graphic Laboratory 1973; Colebrook 1991; CaliforniaCurrent, see Roemmich and McGowan 1995), in theSouthern Ocean such studies are largely non-existent.Concise descriptions of community structure and func-tion over large geographic scales are a relatively recentdevelopment, yet a consensus about the nature and ex-tent of these is beginning to emerge (Hosie 1994; Pa-khomov et al. 2000; Chiba et al. 2001; this study).
Still, little work has focussed on either seasonal orinterannual changes in such communities and it is suchstudies that will now be important if we are to placebackground variability in the context of any changes inresponse to global phenomena. Two recent findingsunderline the timeliness of this approach; first, planktondiversity in the world’s oceans is linked to seasonality offood supply (Woodd-Walker et al. 2002) and physicalforcing (Beaugrand et al. 2001) and second, modelspredict that the Southern Ocean might become the mainoceanic sink for atmospheric CO2 if atmospheric CO2
concentrations continue to rise exponentially (Treguerand Pondaven 2002). Given the taxonomic and size-based differences in community composition found inthis and other studies, both findings emphasise the needto better understand taxonomic and community re-sponse to changing phenomena over basin scales.
Acknowledgements We thank the officers and crew onboard R.R.S.‘‘James Clark Ross’’ for their help in the successful completion ofthis project. The many colleagues who participated in the collectionof various data sets along the transect are also gratefully ac-knowledged.
References
Arhan M, Naveira Garabata AC, Heywood KJ, Stevens DP (2002)The Antarctic Circumpolar Current between the Falkland Is-lands and South Georgia. J Phys Oceanogr 32:1914–1931
Atkinson A, Sinclair JD (2000) Zonal distribution and seasonalvertical migration of copepod assemblages in the Scotia Sea.Polar Biol 23:46–58
128

Atkinson A, Ward P, Peck JM, Murray AWA (1990) Mesoscaledistribution of zooplankton around South Georgia. Deep-SeaRes 137:1213–1227
Atkinson A, Ward P, Hill A, Brierley AS, Cripps GC (1999) Krill–copepod interactions at South Georgia, Antarctica, II. Eup-hausia superba as a major control on copepod abundance. MarEcol Prog Ser 176:63–79
Atkinson A, Whitehouse MJ, Priddle J, Cripps GC, Ward P,Brandon MA (2001) South Georgia, Antarctica: a productive,cold water, pelagic ecosystem. Mar Ecol Prog Ser 216:279–308
Beaugrand G, Ibanez F, Lindley JA (2001) Geographical distri-bution and seasonal and diel changes in the diversity of cala-noid copepods in the North Atlantic and North Sea. Mar EcolProg Ser 219:189–203
Boltovskoy D, Gibbons MJ, Hutchings L, Binet D (1999) Generalbiological features of the South Atlantic. In: Boltovskoy D (ed)South Atlantic zooplankton. Backhuys, Leiden, pp 1–42
Brandon MA, Murphy EJ, Trathan PN, Bone DG (2000) Physicaloceanographic conditions to the northwest of the sub-Antarcticisland of South Georgia. J Geophys Res 105(C10):23983–23996
Brierley AS, Watkins JL, Murray AWA (1997) Interannual vari-ability in krill abundance at South Georgia. Mar Ecol Prog Ser150:87–98
Bryden HL (1983) The Southern Ocean. In: Robinson AR (ed)Eddies in marine science. Springer, Berlin Heidelberg NewYork, pp 265–277
Chiba S, Ishimaru T, Hosie GW, Fukuchi M (2001) Spatio-tem-poral variability of zooplankton community structure off eastAntarctica (90–160�E). Mar Ecol Prog Ser 216:95–108
Clarke KR, Warwick RM (1994) Changes in marine communities:an approach to statistical analysis and interpretation. PlymouthMarine Laboratory, Plymouth
Colebrook JM (1991) Continuous plankton records: from seasonsto decades in the plankton of the north-east Atlantic. In: Ka-wasaki T, Tanaka S, Toba Y, Taniguchi A (eds) Long-termvariability of pelagic fish populations and their environments.Pergamon Press, Oxford, pp 70–76
Deacon GER (1982) Physical and biological zonation in theSouthern Ocean. Deep-Sea Res 129:1–15
Edinburgh Oceanographic Laboratory (1973) Continuous plank-ton records: a plankton atlas of the North Atlantic and theNorth Sea. Bull Mar Ecol 7:1–174
Errhif A, Razouls C, Mayzaud P (1997) Composition and com-munity structure of pelagic copepods in the Indian sector of theAntarctic Ocean during the end of the austral summer. PolarBiol 17:418–430
Field JG, Clarke KR, Warwick RM (1982) A practical strategy foranalysing multispecies distribution. Mar Ecol Prog Ser 8:37–52
Froneman PW, McQuaid CD, Perissinotto R (1995) Biogeographicstructure of the microphytoplankton assemblages of the southAtlantic and Southern Ocean during austral summer. J Plank-ton Res 17:1791–1802
Gordon AL, Georgi DT, Taylor HW (1977) Antarctic Polar FrontZone in the western Scotia Sea—summer 1975. J Phys Ocea-nogr 7:309–328
Heywood RB, Everson I, Priddle J (1985) The absence of krill fromthe South Georgia zone, winter 1983. Deep-Sea Res 132:369–378
Hosie GW (1994) The macroplankton communities in the PrydzBay region, Antarctica. In: El-Sayed SZ (ed) Southern Oceanecology: the BIOMASS perspective. Cambridge UniversityPress, Cambridge, pp 93–123
Hunt BPV, Pakhomov EA, McQuaid CD (2001) Short-term vari-ation and long-term changes in the oceanographic environmentand zooplankton community in the vicinity of a sub-Antarcticarchipelago. Mar Biol 138:369–381
Longhurst A (1998) Ecological geography of the sea. AcademicPress, London
Lutjeharms JRE, Baker D Jr (1980) A statistical analysis of themesoscale dynamics of the Southern Ocean. Deep-Sea Res127:145–159
Lutjeharms JRE, Walters NM, Allanson BR (1985) Oceanic frontalsystems and biological enhancement. In: Siegfried WR, CondyPR, Laws RM (eds) Antarctic nutrient cycles and food webs.Springer, Berlin Heidelberg New York, pp 1–21
Mackintosh NA (1946) The Antarctic Convergence and the dis-tribution of surface temperatures in Antarctic waters. DiscoveryRep 23:177–212
Meredith MP, Brandon MA, Trathan PN, Murphy EJ, Bone DG,Grant SD, Chernyshkov PP, Sushin VA (2003a) Variability inoceanographic conditions to the east and northwest of SouthGeorgia 1996–2001. Prog Oceanog (in press)
Meredith MP, Watkins JL, Murphy EJ, Ward P, Bone DG, ThorpeSe, Grant SD (2003b) The Southern ACC Front to the north-east of South Georgia: pathways, characteristics and fluxes.J Geophys Res (in press)
Moore JK, Abbott MR, Richman JG (1997) Variability in thelocation of the Antarctic Polar Front (90�–20�W) from satellitesea surface temperature data. J Geophys Res 102(C13):27825–27833
Moore JK, Abbott MR, Richman JG (1999) Location and dy-namics of the Antarctic Polar Front from satellite sea surfacetemperature data. J Geophys Res 104(C2):3059–3073
Orsi AH, Whitworth T III, Nowlin WD Jr (1995) On the meridi-onal extent and fronts of the Antarctic Circumpolar Current.Deep-Sea Res 142:641–673
Pakhomov EA, McQuaid CD (1996) Distribution of surface zoo-plankton and seabirds across the Southern Ocean. Polar Biol16:271–286
Pakhomov EA, Verheye HM, Atkinson A, Laubscher RK, Taun-ton-Clark J (1997) Structure and grazing impact of the meso-zooplankton community during late summer 1994 near SouthGeorgia, Antarctica. Polar Biol 18:180–192
Pakhomov EA, Perissinotto R, McQuaid CR, Froneman PW(2000) Zooplankton structure and grazing in the Atlantic sectorof the Southern Ocean in late austral summer 1993 Part l.Ecological zonation. Deep-Sea Res 147:1663–1686
Parsons TR, Maita Y, Lalli CM (1984) A manual of chemical andbiological methods for seawater analysis. Pergamon Press,Oxford
Peterson RG, Whitworth T III (1989) The subantarctic and polarfronts in relation to the deep water masses through the south-western Atlantic. J Geophys Res 94:10817–10838
Priddle J, Croxall JP, Everson I, Heywood RB, Murphy EJ, PrincePA, Sear CB (1988) Large-scale fluctuation in the abundanceand distribution of krill—a discussion of possible causes. In:Sahrhage D (ed) Antarctic Ocean and resources variability.Springer, Berlin Heidelberg New York, pp 169–182
Reid K, Croxall JP (2001) Environmental response of upper tro-phic-level predators reveals a system change in an Antarcticmarine ecosystem. Proc R Soc Lond Ser B 268:377–384
Roemmich D, McGowan J (1995) Climatic warming and the de-cline of zooplankton in the California Current. Science267:1324–1326
Shreeve RS, Ward P, Whitehouse MJ (2002) Copepod growth anddevelopment around South Georgia: relationships with tem-perature, food and krill. Mar Ecol Prog Ser 233:169–183
Siegel V, Piatkowski U (1990) Variability in the macrozooplanktoncommunity off the Antarctic peninsula. Polar Biol 10:373–386
Trathan PN, Brandon MA, Murphy EJ (2000) Transport andstructure within the Antarctic Circumpolar Current to thenorth of South Georgia. Geophys Res Lett 27:1727–1730
Trathan PN, Brierley AS, Brandon MA, Bone DG, Goss C, GrantS, Murphy EJ, Watkins JL (2003) Oceanographic variabilityand changes in Antarctic krill abundance at South Georgia.Fish Oceanogr (in press)
Treguer P, Jacques G (1992) Dynamics of nutrients and phyto-plankton, and fluxes of carbon, nitrogen and silicon in theAntarctic Ocean. Polar Biol 12:149–162
Treguer P, Pondaven P (2002) Climatic changes and the cycles ofcarbon in the Southern Ocean. Deep-Sea Res II 49:3103–3104
Ward P, Shreeve RS (2001) The deep-sea copepod fauna of theSouthern Ocean: patterns and processes. In: Lopes RM, Reid
129

JW, Rocha CEF (eds) Copepoda: developments in ecology,biology and systematics. Hydrobiologia 453/454:37–54
Ward P, Whitehouse M, Meredith MP, Murphy EJ, Shreeve RS,Korb R, Watkins JL, Thorpe SE, Woodd–Walker RS, BrierleyA, Cunningham N, Grant SD, Bone DG (2003a) The SouthernAntarctic Circumpolar Current: physical and biological cou-pling at South Georgia. Deep-Sea Res I 49:2183–2202
Ward P, Grant S, Brandon MA, Siegel V, Sushin V, Loeb V,Griffiths H (2003b) Mesozooplankton community structure inthe Scotia Sea during the CCAMLR survey: January–February2000. (Special issue CCAMLR 2000 survey) Deep-Sea Res II (inpress)
Whitehouse MJ (1997) Automated seawater nutrient chemistry.British Antarctic Survey, Cambridge
Whitehouse MJ, Symon C, Priddle J (1993) Variations in the dis-tribution of chlorophyll a and inorganic nutrients around SouthGeorgia. Antarctic Sci 5:367–376
Whitehouse MJ, Priddle J, Trathan PN, Brandon MA (1996a)Substantial open-ocean phytoplankton blooms to the north ofSouth Georgia, South Atlantic during summer 1994. Mar EcolProg Ser 140:187–197
Whitehouse MJ, Priddle J, Symon C (1996b) Seasonal and annualchange in seawater temperature, salinity, nutrient and chloro-phyll a distributions around South Georgia, South Atlantic.Deep-Sea Res 143:425–443
Whitehouse MJ, Priddle J, Brandon MA (2000) Chlorophyll/nu-trient characteristics in the water masses to the north of SouthGeorgia, Southern Ocean. Polar Biol 23:373–382
Woodd–Walker RS, Ward P, Clarke A (2002) Large-scale patternsin diversity and community structure of surface water copepodsfrom the Atlantic Ocean. Mar Ecol Prog Ser 236:189–203
130
Related Documents