State of California The Resources Agency DEPARTMENT OF FISH AND WILDLIFE COASTAL MENDOCINO COUNTY SALMONID LIFE CYCLE AND REGIONAL MONITORING: MONITORING STATUS AND TRENDS 2012 2011─12 Administrative Report California Department of Fish and Wildlife Fisheries Restoration Grant Program Grant # P0810312 Coastal Mendocino County Salmonid Monitoring Project January 2013 By Sean P. Gallagher 1,2 Shaun Thompson 1 And David W. Wright 3 1 California Department of Fish and Wildlife, 32330 N. Harbor, Fort Bragg, CA 95437 (e-mail: [email protected], [email protected]) 2 This report should be cited as: Gallagher, S. P. Thompson, S., and D. W. Wright. 2013. Coastal Mendocino County salmonid life cycle and regional monitoring: monitoring status and trends for 2012. 2011-12 Administrative Report. California State Department of Fish and Wildlife, Coastal Watershed Planning and Assessment Program, 1487 Sandy Prairie Court, Suite A, Fortuna, CA 95540. 47 pp. 3 Campbell Timberlands Management LLC, P.O. Box 1228, Fort Bragg, CA 95437 (e-mail: [email protected])

Welcome message from author
This document is posted to help you gain knowledge. Please leave a comment to let me know what you think about it! Share it to your friends and learn new things together.
Transcript

State of California
The Resources Agency
DEPARTMENT OF FISH AND WILDLIFE
COASTAL MENDOCINO COUNTY SALMONID LIFE CYCLE AND REGIONAL
MONITORING: MONITORING STATUS AND TRENDS 2012
2011─12 Administrative Report
California Department of Fish and Wildlife
Fisheries Restoration Grant Program
Grant # P0810312
Coastal Mendocino County Salmonid Monitoring Project
January 2013
By
Sean P. Gallagher1,2 Shaun Thompson1
And
David W. Wright3
1 California Department of Fish and Wildlife, 32330 N. Harbor, Fort Bragg, CA 95437 (e-mail: [email protected], [email protected]) 2 This report should be cited as: Gallagher, S. P. Thompson, S., and D. W. Wright. 2013. Coastal Mendocino County salmonid life cycle and regional monitoring: monitoring status and trends for 2012. 2011-12 Administrative Report. California State Department of Fish and Wildlife, Coastal Watershed Planning and Assessment Program, 1487 Sandy Prairie Court, Suite A, Fortuna, CA 95540. 47 pp. 3 Campbell Timberlands Management LLC, P.O. Box 1228, Fort Bragg, CA 95437 (e-mail: [email protected])

Coastal Salmon Monitoring Plan
2
Abstract California’s coastal salmon and steelhead populations are listed under California and Federal
endangered species acts; both require monitoring to provide measures of recovery. Since 2004
the California Department of Fish and Game and NOAA Fisheries have been developing a
monitoring plan for California’s coastal salmonids (the California Coastal Salmonid
Monitoring Plan- or CMP). The CMP monitors the status and trends of salmonids at
evolutionarily significant regional scales and provides population level estimates. For the
CMP, data to evaluate adult populations are collected using a spatially balanced probabilistic
design (e.g., Generalized Random Tesselation Stratified- or GRTS). Under this scheme a two-
stage approach is used to estimate status. Each year regional redd surveys (stage 1) are
conducted in stream reaches in a GRTS sampling design at a survey level of 15% of available
habitat or a minimum of 41 reaches, whichever results in fewer reaches. Spawner: redd ratios
are derived from smaller scale census watersheds (stage 2) where “true” escapement is
estimated using capture-recapture methods. These are used to estimate regional escapement
from expanded redd counts. In 2008-09 we applied the results of our previous studies to
estimate salmonid escapement for the Mendocino coast region, the first implementation of the
CMP in the state. Here we present the results of the fourth year (2011─12) of this monitoring
effort and discuss our findings in the context of expanding the CMP to all of coastal
California. We discuss sample frame development, sample size, and present escapement data
for major portions of the California Coastal (CC) Chinook Salmon Evolutionarily Significant
Unit (ESU), the Central California (CCC) Coho Salmon ESU, and the Northern California
(NC) Steelhead Distinct Population Segment (DPS). In addition, we present 2011─12 data
from three life cycle monitoring streams and combine this information with previous years’
data to evaluate status and trends for coho salmon and steelhead.
Key words: coho salmon, population monitoring, spawning surveys, status, trends
Introduction Recovery of salmon and steelhead listed under the Federal and California
endangered species acts primarily depends on increasing the abundance of adults returning to spawn (Good et al. 2005), and both spawner escapement and trends in spawner escapement are two primary measures of recovery. In California watersheds north of Monterey Bay and south of the Klamath River, four distinct units of Chinook salmon (Oncorhynchus tshawytscha), coho salmon (O. kisutch), and steelhead (O. mykiss) are currently either threatened or endangered under the federal or state endangered species acts: the California Coastal Chinook salmon Evolutionarily Significant Unit (ESU), the Central California Coast coho salmon ESU, the Northern California steelhead Distinct Population Segment (DPS), and the Central California

Mendocino County Salmonid Life Cycle and Regional Monitoring 2012
3
Coast steelhead DPS. Delisting of these ESUs and DPSs will depend on whether important populations have reached abundance thresholds (Spence et al. 2008).
In 2005, the California Department of Fish and Wildlife (CDFW, formerly the Department of Fish and Game) and NOAA Fisheries published an Action Plan for monitoring California’s coastal salmonids (Boydstun and McDonald 2005). This plan outlined a strategy to monitor salmonid status and trends at spatial scales from individual populations to geographic regions or ESU/DPS regional spatial scales and provide population level estimates. The monitoring is similar to the adult component of the Oregon Plan, where data to evaluate regional populations are collected in a spatially explicit rotating panel design. Crawford and Rumsey (2009) and the Salmon Monitoring Advisor (https://salmonmonitoring advisor.org/) recommend a spawner abundance sampling design using a spatially balanced probabilistic approach (e.g., Generalized Random Tessellation Stratified – or GRTS, Larsen et al. 2008). Similarly, Adams et al. (2011) propose a two-stage approach to estimate regional escapement of California’s coastal salmonids. Under this scheme, first-stage sampling is comprised of extensive regional spawning surveys to estimate escapement based on redd counts, which are collected in stream reaches selected under a GRTS rotating panel design at a survey level of 10% of available habitat each year. Second-stage sampling consists of escapement estimates from intensively monitored census streams through either total counts of returning adults or capture-recapture studies. The second-stage estimates are considered to represent true adult escapement and are used to calibrate first-stage estimates of regional adult abundance by associating precise redd counts with true fish abundance (Adams et. al. 2011).
The Action Plan was tested and further developed in a three-year pilot study (Gallagher et al. 2010 a-b). This study compared abundance estimates derived from a regional GRTS survey design to abundance measured using a more intensive stratified random monitoring approach, evaluated sample size and statistical power for trend detection, and evaluated the quality of the stage two data for calibrating regional surveys. Gallagher et al. (2010 a) recommended that annual spawner:redd ratios from intensively monitored watersheds be used to calibrate redd counts for regional monitoring of California’s coastal salmonid populations because they were reliable, economical, and less intrusive than tagging, trapping, underwater observation, weirs, and genetics. Converted redd counts were statistically and operationally similar to live fish capture-recapture estimates, but required fewer resources than the other methods they evaluated. Gallagher et al. (2010b) found that redd counts and escapement estimates using annual spawner:redd ratios were reliable for regional monitoring using a 10% GRTS sample, and that increasing sample size above 15% did not significantly improve the estimates. Their evaluation of sample size suggests that sampling at least 41 reaches or 15% of available habitat, whichever

Coastal Salmon Monitoring Plan
4
results in fewer reaches, has adequate precision and sufficient statistical power to detect regional trends in salmon populations.
Boydstun and McDonald (2005) provided a 10% sample size without justification. For the example in the Action Plan for the Mendocino Coast region, a 10% GRTS sample resulted in an annual sample of 203 reaches. This size sample would result in costly over sampling of more reaches than necessary to encompass intra-reach variance. In their study of five streams in Mendocino County, Gallagher et al. (2010b) found sampling at 10% produced acceptable escapement estimates. However, the GRTS design has not been evaluated at a larger scale. NOAA (2007) wrote that the issue of sampling intensity for a Coastal Monitoring Plan (CMP) has not yet been resolved.
Beginning in 2008─09, we applied the results of our previous studies to estimate salmonid escapement for the entire Mendocino Coast region following Adams et al. (2011). The study’s purpose was to 1) continue salmon life cycle monitoring (adults in─ smolts out) in three streams (LCMS) and provide spawner:redd ratios for calibrating regional redd surveys and, 2) conduct regional spawning surveys in the Mendocino Coast region (fig. 1) to estimate Chinook salmon, coho salmon, and steelhead escapement and to evaluate sample size at this scale. This effort provided a fourth year (2011─12) of escapement data for six independent and eight dependent populations representing two diversity strata within the CCC coho salmon ESU as well as major populations within the CC Chinook salmon ESU and NC steelhead DPS. Our work also increased the time series of smolt and adult data at the LCMS streams to 12 years. We field-verified and gained access to 41 reaches during summer 2011 and conducted spawning surveys in these reaches during winter 2011─12. We operated three LCMS to continue population monitoring on Caspar and Pudding creeks and the South Fork Noyo River.
Here we present the results of the fourth year (2011─12) of the regional monitoring effort and discuss our findings in the context of expanding the CMP to all of coastal California. We discuss sample frame development, sample size, and present escapement data for major portions of the CC Chinook Salmon ESU, the CCC coho Salmon ESU, and the NC steelhead DPS (Spence et al. 2008). In addition, we present 2011-12 data from three life cycle monitoring streams and combine this information with previous years’ data to evaluate status and trends for coho salmon and steelhead.
Mendocino County Salmonid Life Cycle and Regional Monitoring 2012
5
Materials and methods Life Cycle Monitoring Streams
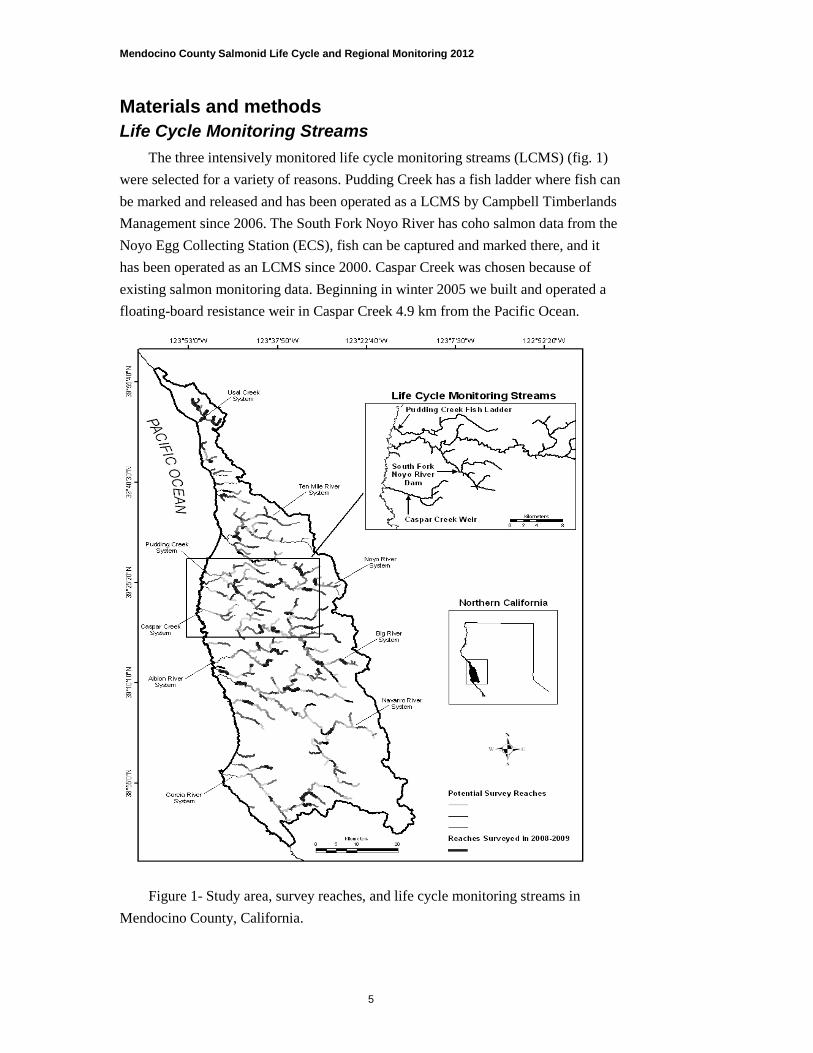
The three intensively monitored life cycle monitoring streams (LCMS) (fig. 1) were selected for a variety of reasons. Pudding Creek has a fish ladder where fish can be marked and released and has been operated as a LCMS by Campbell Timberlands Management since 2006. The South Fork Noyo River has coho salmon data from the Noyo Egg Collecting Station (ECS), fish can be captured and marked there, and it has been operated as an LCMS since 2000. Caspar Creek was chosen because of existing salmon monitoring data. Beginning in winter 2005 we built and operated a floating-board resistance weir in Caspar Creek 4.9 km from the Pacific Ocean.
Figure 1- Study area, survey reaches, and life cycle monitoring streams in Mendocino County, California.
Coastal Salmon Monitoring Plan
6
Adult Abundance To estimate escapement we marked and released fish weekly with time-specific
individually numbered bi-colored floy tags (Szerlong and Rundio 2008). We estimated escapement using the Schnabel mark-recapture method (Krebs 1989) and conducted redd censuses in our LCMS (see redd survey abundance estimation, below). Recaptures were live-fish observations made during spawning ground surveys. In order to evaluate tag loss, fish were also marked with weekly stream-specific operculum punches. Floy tags on carcasses were recovered and all carcasses inspected for operculum punches (and other marks) to estimate tag loss, and residence time, as well as to calculate capture-recapture estimates from carcass data. Adult fish were captured, marked and released at the following locations: 1) the fish ladder and flashboard dam located 0.25 km from the Pacific Ocean on Pudding Creek, 2) the egg collecting station (ECS) on the South Fork Noyo River, and 3) a floating-board resistance weir in Caspar Creek 4.9 km from the Pacific Ocean (fig. 1). Adult steelhead were also captured and marked in screw traps on Pudding Creek and the South Fork Noyo River and in fyke traps on Caspar Creek.
Redd Survey Abundance Estimation
To estimate escapement we used redd count and measurement data collected during spawning surveys following methods established in previous studies (Gallagher and Knechtle 2003, Gallagher et al. 2007). Over and under-counting errors in redd counts (bias corrected) were reduced following Gallagher and Gallagher (2005). These efforts included a formal written protocol, training of field staff, pairing experienced and inexperienced observers, marking and reexamining marked redds, estimating observer efficiency for each reach, measuring redds, using predictive models to determine redd species, having a test category for ambiguous redds (these were removed from further analysis), and surveying every ten days. Surveys were conducted approximately fortnightly from early November 2011 to mid-April 2012 in all spawning habitat in each stream.
We calculated spawner: redd ratios by dividing capture-recapture abundance estimates for coho salmon and steelhead by the bias corrected redd counts for all available data. The average of these estimates were then used to convert regional redd counts into estimates of adult abundance.
Smolt Abundance
We used downstream migrant traps to estimate smolt abundance using capture-recapture methods in the LCMS and Little River. Traps were placed in the streams in mid-March and checked daily until early-June 2012. One fyke trap was located about 5.0 km above the Pacific Ocean in the main stem of Caspar Creek. We deployed a
Mendocino County Salmonid Life Cycle and Regional Monitoring 2012
7
screw trap about 50 m below the ECS on the South Fork Noyo River. A fyke trap was fished in Little River about 2.5 km above the Pacific Ocean. Campbell Timberland Management operated a screw trap about 5 km upstream of the ocean in Pudding Creek. To further evaluate migration timing, we installed two PIT tag antenna arrays about 0.5km from the ocean in Caspar Creek and one array on the Pudding Creek dam. In 2010 Campbell received a Mendocino County Fish and Game Commission grant and used this money to put another PIT tag antenna array in the fish ladder at Pudding Creek. Campbell continued efforts to devise and opportunistically operate a smolt trap in the fish ladder during spring 2011.
During 2012 we generally followed the methods of Barrineau and Gallagher (2001), except we used PIT tags as the primary mark for fish > 70 mm (FL) and used a maxillary clip to assess PIT tag loss. To further evaluate PIT tag loss, in 2010 half of all coho salmon and steelhead > 70 mm captured at the Pudding Creek screw trap and a downstream trap on the dam were marked with a right maxillary clip only and the other half were marked with a left maxillary clip and a PIT tag. To avoid marking bias we attempted to give every other fish > 70 mm encountered one mark or the other. This cohort returned as adults in 2012. We measured and weighed all steelhead and coho salmon > 45 mm, young-of-the-year were too small to mark and were simply tallied. Captured fish were marked with a site and week specific mark (PIT tag or fin clip) and released upstream of the traps. All other species and YOY captured were identified, counted, and released below the traps. We examined all steelhead and coho salmon >50 mm for marks each day. Those without marks were marked and released at least 150 m upstream of the traps. Recaptured fish were measured and released at least 150 m downstream of the traps.
To estimate salmonid populations, capture probabilities, and timing for each trap all captures and recaptures were totaled by week and size/age class to create data matrices for input to DARR (Darroch Analysis with Rank Reduction), a software application for estimating abundance from stratified mark-recapture data (Bjorkstedt 2003). These matrices were run in DARR to produce population estimates and capture probabilities for both coho salmon and steelhead. For both species, we used the following classes: < 70 mm (YOY), 71-120 mm (Y+), and > 120 mm (Y++). We developed these age/size classes based on Neillands (2003), Gallagher (2000), and Shapovalov and Taft (1954), as well as discussion with local biologists. Salmonids < 71 mm captured before fry were first observed in spring were assumed to be Y+ (year old fish hatched the previous spring). Once fry were observed, fork length frequencies were used to separate year classes.
Late-Summer Juvenile Abundance
We developed a 20 unit GRTS sample draw of 50 m reaches in Pudding Creek
Coastal Salmon Monitoring Plan
8
for estimating summer rearing density following methods described above for regional sampling. Similarly, we randomly selected ten 50 m units in Caspar Creek. Salmonid density was estimated in each reach by depletion electro-fishing. In summer 2011 we conducted habitat censuses in Caspar and Pudding creeks following Bouwes et al. (2011). We used a random subset of at least six of each of the nine unit types within our GRTS design to estimate summer (Pudding Creek only) and fall parr abundance and salmon density (both streams) using depletion electro-fishing. All salmonids > 60 mm (FL) were given PIT tags and maxillary clips and all captured fish were examined for previously applied marks. We calculated the average and 95% CI density of salmonids by species in each stream and multiplied this by the total length of anadromy to estimate late-summer juvenile abundance.
Survival
We estimated apparent coho salmon egg-to-smolt and smolt-to-adult survival for the three LCMS streams from smolt abundance data from 2000 to 2011 and adult return data from 2000 through 2011─12. To estimate egg abundance we used the relationship between fecundity and fork length from Shapovalov and Taft (1954) and the average length and the total number of females observed in each stream each year. Coho salmon spawner: recruit ratios for eight consecutive years were estimated using data from this study. Overwinter survival was estimated for Caspar and Pudding creeks using data collected during summer electro-fishing: summer stream-level population estimates were divided into smolt abundance estimates the following spring. We also estimated overwinter survival with pit tag data where the estimated number of summer PIT-tagged fish captured in downstream traps and detected in our arrays was divided by the total number of PIT tags deployed in summer. Trends in Coho Salmon Abundance
Trends in coho salmon and steelhead abundance, productivity, and survival over 11 years and nine complete coho salmon life cycles were examined following McDonald et al. (2007) using a trend detection package in R (www.r-project.org) developed for this purpose (Trent McDonald, Personal Communication). Coho salmon population trends and population viability were also examined following methods described by Spence et al. (2008). Trends in abundance versus year were examined with t-tests.
Regional Spawning Survey Abundance Estimation
The Mendocino Coast region extends from Usal Creek to Schooner Gulch (fig. 1). We followed Boydstun and McDonald (2005) to define the sampling universe, create a sample frame (the sample universe broken into sampling units), and produce

Mendocino County Salmonid Life Cycle and Regional Monitoring 2012
9
a GRTS draw (the spatially balanced random sample). We defined the sampling universe as all coho salmon spawning habitat in coastal Mendocino County. To improve the utility of the data set to track population trends we used a three year rotating panel design with 40% of the selected reaches sampled every year (Trent McDonald Personal Communication). During 2008─09 we selected GRTS reaches 1 to 41 (annual panel), in 2009─10 we selected reaches 1 to 16 and 42 to 67 (panel 2), and for 2010─11 we selected reaches 1 to 16 and 68 to 93. In 2011─12 we selected reaches 1 to 16 and 109 to 136 (panel 3) and fit all the 339 reaches in the GRTS sample draw to a 0-3-12 rotating panel design (Table 1). Because we did not develop the rotating panel until 2012 we skipped the three year repeat panel and included an extra 12 year panel (Table 1). Gallagher and Wright (2011) provide more details on development of the sample frame and reach selection.
To estimate regional abundance, we conducted fortnightly spawning surveys in 41 GRTS reaches from mid-November 2011 through April 2012. Our methods for redd count and measurement data on spawning surveys were the same as for LCMS. We used the average annual coho salmon spawner: redd ratios from our LCMS to convert bias corrected redd counts into fish numbers for each reach (Gallagher et al. 2010a).
Table 1. Rotating panel design for regional salmonid escapement monitoring in coastal Mendocino County, California.
Spatial Temporal Sample year
Panel Rotation 2009 2010 2011 2012 2013 2014 2015 2016 2017 2018 2019 2020
1 Annual 16 16 16 16 16 16 16 16 16 16 16 16
2 Every 3 yrs 13 0 13 13
2 Every 3 yrs 12 12 12 12
2 Every 3 yrs 13 13 13 13
3 Every 12 years 12
3 Every 12 years 13
3 Every 12 years 12
3 Every 12 years 13
3 Every 12 years 12
3 Every 12 years 13
3 Every 12 years 12
3 Every 12 years 12
3 Every 12 years 13
3 Every 12 years 12
3 Every 12 years 12
3 Every 12 years 13
3 Every 12 years 12
Sample size (total number of reaches)
N = 41 41 41 41 41 41 41 41 41 41 41 41 41

Coastal Salmon Monitoring Plan
10
We followed Adams et al. (2010) to estimate regional abundance where the average number of redds in our 41 reaches was multiplied by the total number of reaches in our sample frame. We estimated 95% confidence intervals using Bootstrap with replacement and 1000 iterations (Trent McDonald Personal Communication).
Data Analysis
Escapement estimate based on mark-recapture experiments used the Schnabel method and confidence intervals were obtained from the Poisson distribution (Krebs 1989). To evaluate precision in our escapement estimates we evaluated confidence interval widths and coefficients of variation (CV). Narrower 95% confidence intervals (and thus smaller SD) and smaller CVs were deemed more precise and reliable than wider bounds. We compared species-specific redd densities and reach level abundance with ANOVA or the Kruskal-Wallis ANOVA on ranks when Standard Kurtosis p-values were < 0.05. We evaluated sample size (n) for our regional spawning ground surveys following Equation 1 and graphically with performance curves (Brower and Zar 1987). We accepted statistical significance at p < 0.05, although, endangered species management often accepts statistical significance at the p < 0.10 level (Good et al. 2005).
Equation 1
Where ẍ is the mean value expected in data, k is the negative binomial exponent,
r is the desired level of error, (i.e. the width of the 95% confidence intervals relative to the point estimates as a percent 10%, 25%, 30%, and 50%), and tα is the probability of not achieving desired level of error (from Krebs 1989).
Results Mendocino Coast Sample GRTS Draw
Each year from 2008─09 to 2010─11, nine of the 41 GRTS reaches (21%) were unavailable for sampling because landowners denied us permission to enter. In 2011─12 only 4 of the 41 reaches (9.7%) were unavailable for sampling due to denied access. Unavailable reaches were replaced by the reaches in draw order to fill out our required sample size of n = 41 or 12% for coho salmon and steelhead. The GRTS sample resulted in sampling reaches in all independent populations in two coho salmon diversity strata within the CCC ESU. Sampling the 41 reaches selected
+≈ kxr
tn 112
)100( 2α
Mendocino County Salmonid Life Cycle and Regional Monitoring 2012
11
for this study resulted in a 14% sample (n = 16 of 113) of all identified Chinook salmon reaches for evaluating Chinook salmon escapement sample size and reach variances. Life Cycle Monitoring Adult Escapement
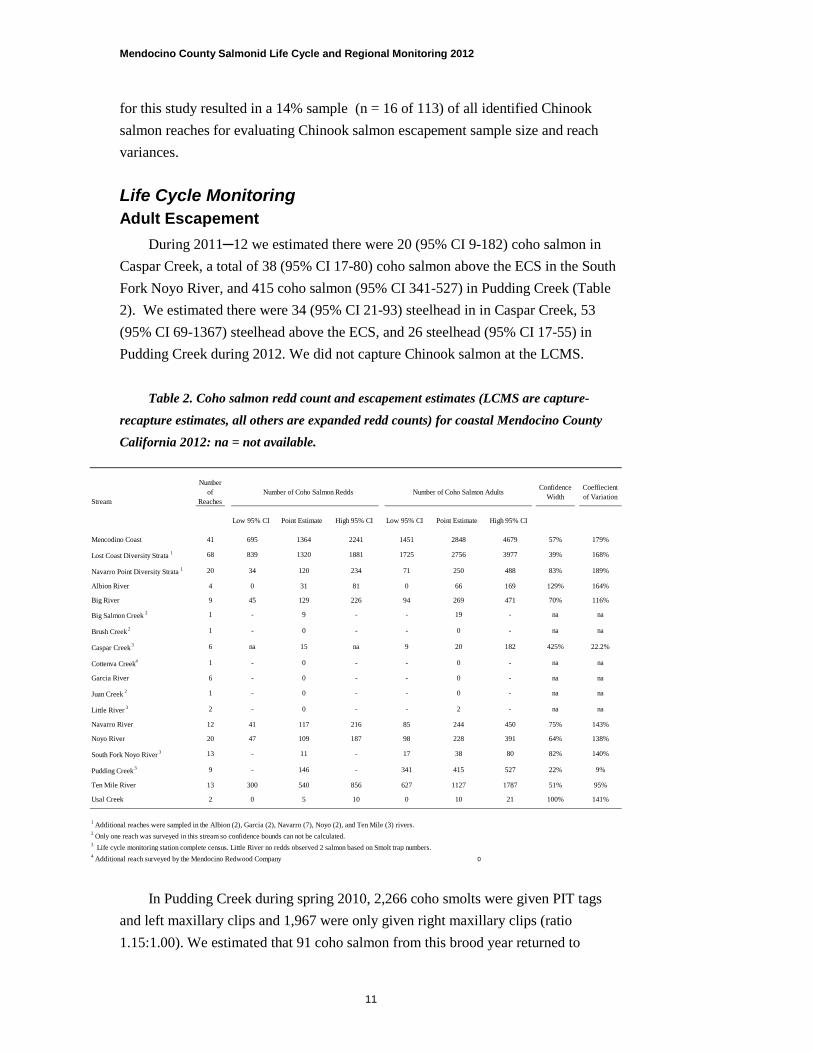
During 2011─12 we estimated there were 20 (95% CI 9-182) coho salmon in Caspar Creek, a total of 38 (95% CI 17-80) coho salmon above the ECS in the South Fork Noyo River, and 415 coho salmon (95% CI 341-527) in Pudding Creek (Table 2). We estimated there were 34 (95% CI 21-93) steelhead in in Caspar Creek, 53 (95% CI 69-1367) steelhead above the ECS, and 26 steelhead (95% CI 17-55) in Pudding Creek during 2012. We did not capture Chinook salmon at the LCMS.
Table 2. Coho salmon redd count and escapement estimates (LCMS are capture-
recapture estimates, all others are expanded redd counts) for coastal Mendocino County California 2012: na = not available.
In Pudding Creek during spring 2010, 2,266 coho smolts were given PIT tags
and left maxillary clips and 1,967 were only given right maxillary clips (ratio 1.15:1.00). We estimated that 91 coho salmon from this brood year returned to
Stream
Number of
ReachesNumber of Coho Salmon Redds Number of Coho Salmon Adults Confidence
WidthCoeffiecient of Variation
Low 95% CI Point Estimate High 95% CI Low 95% CI Point Estimate High 95% CI
Mencodino Coast 41 695 1364 2241 1451 2848 4679 57% 179%
Lost Coast Diversity Strata 1 68 839 1320 1881 1725 2756 3977 39% 168%
Navarro Point Diversity Strata 1 20 34 120 234 71 250 488 83% 189%
Albion River 4 0 31 81 0 66 169 129% 164%
Big River 9 45 129 226 94 269 471 70% 116%
Big Salmon Creek 2 1 - 9 - - 19 - na na
Brush Creek 2 1 - 0 - - 0 - na na
Caspar Creek 3 6 na 15 na 9 20 182 425% 22.2%
Cottenva Creek4 1 - 0 - - 0 - na na
Garcia River 6 - 0 - - 0 - na na
Juan Creek 2 1 - 0 - - 0 - na na
Little River 3 2 - 0 - - 2 - na na
Navarro River 12 41 117 216 85 244 450 75% 143%
Noyo River 20 47 109 187 98 228 391 64% 138%
South Fork Noyo River 3 13 - 11 - 17 38 80 82% 140%
Pudding Creek 3 9 - 146 - 341 415 527 22% 9%
Ten Mile River 13 300 540 856 627 1127 1787 51% 95%
Usal Creek 2 0 5 10 0 10 21 100% 141%
1 Additional reaches were sampled in the Albion (2), Garcia (2), Navarro (7), Noyo (2), and Ten Mile (3) rivers.2 Only one reach was surveyed in this stream so confidence bounds can not be calculated.3 Life cycle monitoring station complete census. Little River no redds observed 2 salmon based on Smolt trap numbers.4 Additional reach surveyed by the Mendocino Redwood Company 0
Coastal Salmon Monitoring Plan
12
Pudding Creek in 2011─12; 61 with left maxillary and PIT tags, three with a left maxillary clip and no PIT tag, and 34 with only a right maxillary clip (ratio 1.79:1.00). We captured five adult salmon with left maxillary clips that lacked PIT tags. Thus PIT tag loss was perhaps as high as 4.9% or as low as 0% and maxillary clip loss was 0%. The ratio of left maxillary/PIT to right maxillary was higher in the adult captures compared to the number marked as smolts. We attribute this to process error where many smolts in 2010 were accidentally given left maxillary clips and no PIT tags rather than right maxillary clips and no PIT tags. In 2011-12 we captured 2 adult coho salmon in Caspar Creek and 3 adult coho salmon at the ECS with PIT tags and maxillary clips that were marked in these streams as smolts in 2011.
For 2012, the steelhead female: male ratio was 2.57:1.00 in Caspar Creek and in the South Fork Noyo River it was 1.13:1.00 (Appendix 1). In Pudding Creek the steelhead female: to male ratio was 1.66:1.00. The female: male ratio of the returned PIT tagged adult coho salmon in Pudding Creek was 0.93:1.00 in 2011─12.
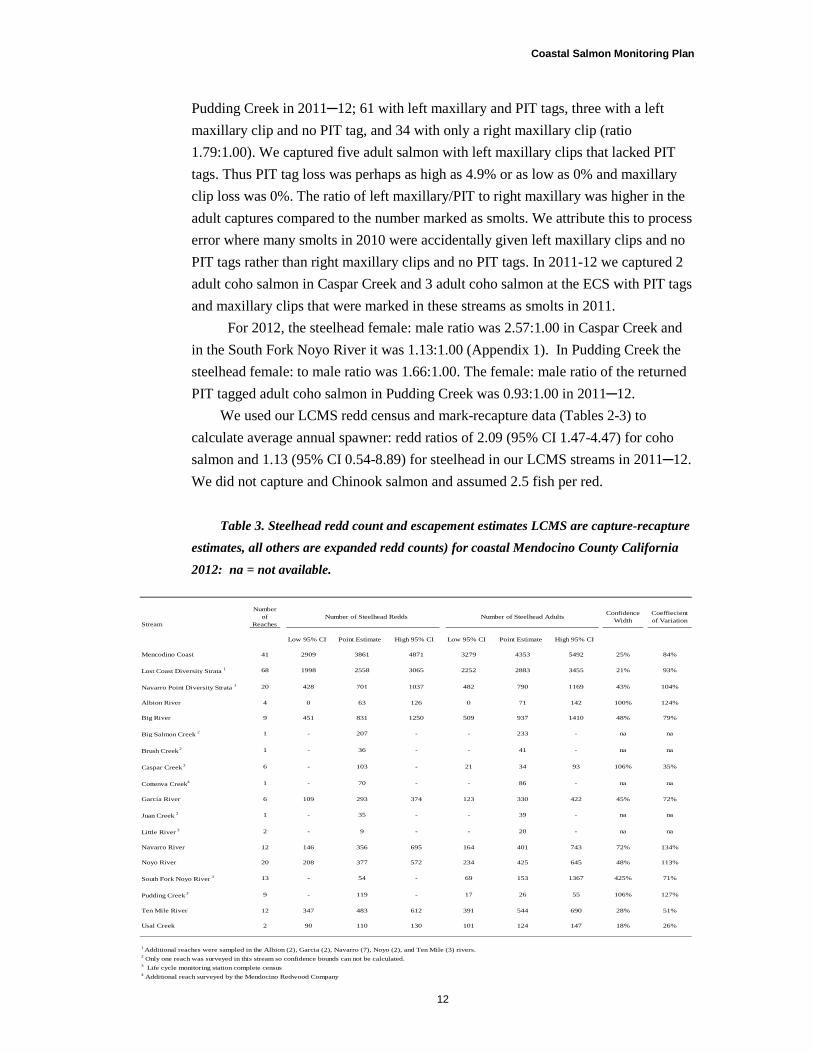
We used our LCMS redd census and mark-recapture data (Tables 2-3) to calculate average annual spawner: redd ratios of 2.09 (95% CI 1.47-4.47) for coho salmon and 1.13 (95% CI 0.54-8.89) for steelhead in our LCMS streams in 2011─12. We did not capture and Chinook salmon and assumed 2.5 fish per red.
Table 3. Steelhead redd count and escapement estimates LCMS are capture-recapture estimates, all others are expanded redd counts) for coastal Mendocino County California
2012: na = not available.
Stream
Number of
ReachesNumber of Steelhead Redds Number of Steelhead Adults Confidence
WidthCoeffiecient of Variation
Low 95% CI Point Estimate High 95% CI Low 95% CI Point Estimate High 95% CI
Mencodino Coast 41 2909 3861 4871 3279 4353 5492 25% 84%
Lost Coast Diversity Strata 1 68 1998 2558 3065 2252 2883 3455 21% 93%
Navarro Point Diversity Strata 1 20 428 701 1037 482 790 1169 43% 104%
Albion River 4 0 63 126 0 71 142 100% 124%
Big River 9 451 831 1250 509 937 1410 48% 79%
Big Salmon Creek 2 1 - 207 - - 233 - na na
Brush Creek 2 1 - 36 - - 41 - na na
Caspar Creek 3 6 - 103 - 21 34 93 106% 35%
Cottenva Creek4 1 - 70 - - 86 - na na
Garcia River 6 109 293 374 123 330 422 45% 72%
Juan Creek 2 1 - 35 - - 39 - na na
Little River 3 2 - 9 - - 20 - na na
Navarro River 12 146 356 695 164 401 743 72% 134%
Noyo River 20 208 377 572 234 425 645 48% 113%
South Fork Noyo River 3 13 - 54 - 69 153 1367 425% 71%
Pudding Creek 3 9 - 119 - 17 26 55 106% 127%
Ten Mile River 12 347 483 612 391 544 690 28% 51%
Usal Creek 2 90 110 130 101 124 147 18% 26%
1 Additional reaches were sampled in the Albion (2), Garcia (2), Navarro (7), Noyo (2), and Ten Mile (3) rivers.2 Only one reach was surveyed in this stream so confidence bounds can not be calculated.3 Life cycle monitoring station complete census4 Additional reach surveyed by the Mendocino Redwood Company
Mendocino County Salmonid Life Cycle and Regional Monitoring 2012
13
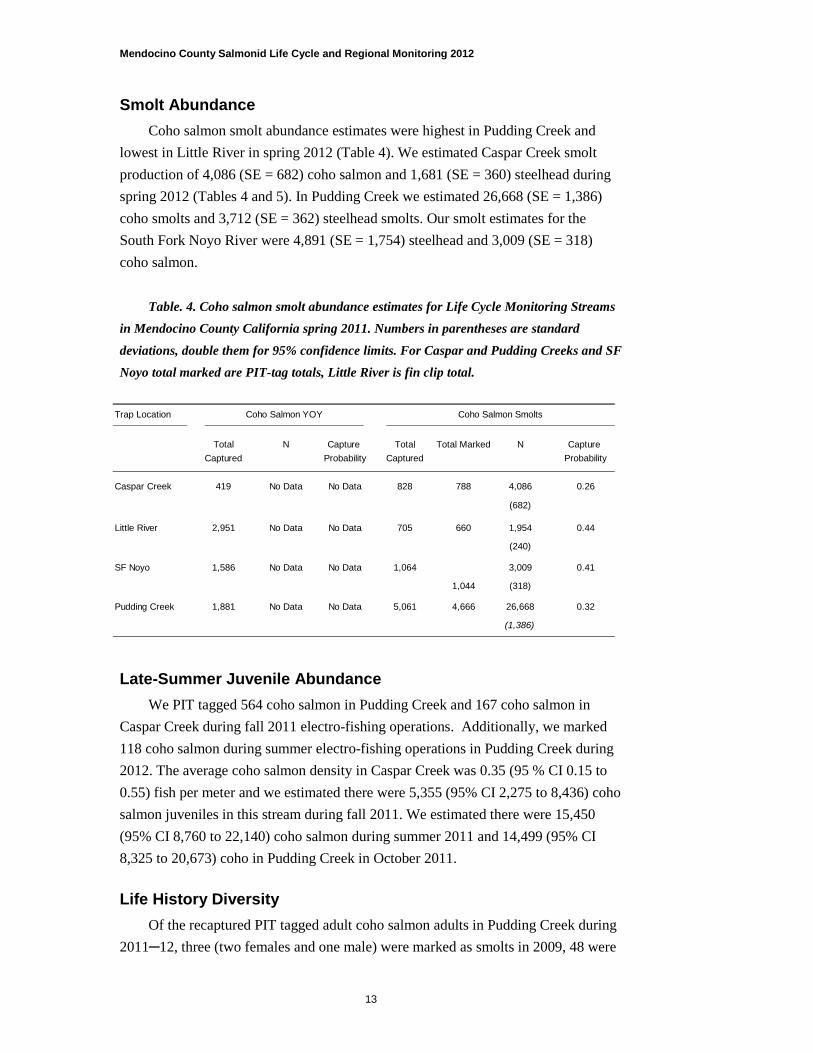
Smolt Abundance Coho salmon smolt abundance estimates were highest in Pudding Creek and
lowest in Little River in spring 2012 (Table 4). We estimated Caspar Creek smolt production of 4,086 (SE = 682) coho salmon and 1,681 (SE = 360) steelhead during spring 2012 (Tables 4 and 5). In Pudding Creek we estimated 26,668 (SE = 1,386) coho smolts and 3,712 (SE = 362) steelhead smolts. Our smolt estimates for the South Fork Noyo River were 4,891 (SE = 1,754) steelhead and 3,009 (SE = 318) coho salmon.
Table. 4. Coho salmon smolt abundance estimates for Life Cycle Monitoring Streams in Mendocino County California spring 2011. Numbers in parentheses are standard
deviations, double them for 95% confidence limits. For Caspar and Pudding Creeks and SF Noyo total marked are PIT-tag totals, Little River is fin clip total.
Late-Summer Juvenile Abundance
We PIT tagged 564 coho salmon in Pudding Creek and 167 coho salmon in Caspar Creek during fall 2011 electro-fishing operations. Additionally, we marked 118 coho salmon during summer electro-fishing operations in Pudding Creek during 2012. The average coho salmon density in Caspar Creek was 0.35 (95 % CI 0.15 to 0.55) fish per meter and we estimated there were 5,355 (95% CI 2,275 to 8,436) coho salmon juveniles in this stream during fall 2011. We estimated there were 15,450 (95% CI 8,760 to 22,140) coho salmon during summer 2011 and 14,499 (95% CI 8,325 to 20,673) coho in Pudding Creek in October 2011. Life History Diversity
Of the recaptured PIT tagged adult coho salmon adults in Pudding Creek during 2011─12, three (two females and one male) were marked as smolts in 2009, 48 were
Trap Location Coho Salmon YOY Coho Salmon Smolts
Total N Capture Total Total Marked N Capture Captured Probability Captured Probability
Caspar Creek 419 No Data No Data 828 788 4,086 0.26
(682)
Little River 2,951 No Data No Data 705 660 1,954 0.44
(240)
SF Noyo 1,586 No Data No Data 1,064 3,009 0.41
1,044 (318)
Pudding Creek 1,881 No Data No Data 5,061 4,666 26,668 0.32
(1,386)

Coastal Salmon Monitoring Plan
14
marked as smolts during 2010, and seven were marked as smolts during 2011. The fish originally marked during 2009 (average fork length 95.6 mm, SE = 7.1, when first captured and 657 mm, SE = 16.6 as adults) returned as four-year-olds, potentially spending about two years in freshwater and two in the ocean. There was no difference (Tukeys Q= 0.59, p > 0.05) between the size of these adults and the 48 fish that showed a three year life history (average smolt fork length 106mm, SE = 2.5, and average and adult fork length 688mm, SE = 6.6). The seven fish that returned as adults after spending approximately 8.5 months in the ocean were considerably smaller as adults than the rest of the fish that returned to Pudding Creek during 2010─11 (ANOVA 108, p < 0.001, d.f. = 49) with an average fork length of 406 mm (SE = 12.6 mm). These fish averaged 133mm (SE = 2.6) as smolts and, based on the size at capture as smolts, these fish may have been two-year freshwater residents. All seven of these fish were deemed to be males.
In the three streams where we used PIT tags, we recaptured a number of coho salmon in the smolt traps during spring that were first marked and classified as one-year old fish during downstream trapping the year before. The average percentage of fish displaying this two-year stream residency pattern from 2006 to 2011 was 0.78% (SE = 0.14%) and ranged from 0.00% to 2.1% (Table 6). We also detected a number of coho salmon young-of-the-year tagged in October 2011 in Caspar Creek migrating to the lower watershed during January 2012; half of these were detected again later in spring. Similar to the two-year freshwater residency observations, the proportion of fish smolting as young-of-the-year was low (Table 6), 99.6% of tagged coho salmon went to the ocean between 1 March and 30 June 2012 (Table 7). We did not observe young-of-the-year migrating to the sea at Pudding Creek,
Table. 5. Steelhead smolt abundance for streams in Mendocino County California spring 2011. Numbers in parentheses estimates are standard deviations, double them for
95% confidence limits. For Caspar and Pudding Creeks and SF Noyo total marked are PIT-tag totals, Little River is fin clip total.
Trap Location YOY Y+ < 120 Y++ Y+ and Y++
Total Total N Capture Total N Capture Total Total N Capture Captured Captured Probability Captured Probability Captured Marked Probability
Caspar Creek 1,067 326 1,450 0.25 60 447 0.17 386 372 1,681 0.22
(346) (398) (360)
Little River 526 250 1,651 0.17 41 533 0.08 290 278 2,044 0.16
(940) (590) (1,110)
SF Noyo 1,016 648 4,707 0.18 14 77 0.18 662 624 4,891 0.18
(1,672) (97) (1,754)
Pudding Creek 66 436 2,336 0.21 202 1,635 0.14 638 604 3,712 0.18
(256) (409) (362)

Mendocino County Salmonid Life Cycle and Regional Monitoring 2012
15
Survival Coho salmon egg-to-smolt survival (freshwater) ranged from 1% to over 20%
over the last 11 years and was very similar among the three LCMS (Fig. 2a, Appendix 1). From our summer population and smolt trap captures we estimated 2011-12 over-winter (parr to smolt survival) in Caspar Creek at 0.76 (95% CI 0.64-1.20). Due to errors in our DARR estimates or because our fall electro-fishing efforts were flawed our estimate of over-winter survival in Pudding Creek was > 1.00. We are checking our data and calculations on this and will report when we have an explanation. Coho salmon smolt-to-adult survival was similar among streams over 11 years and ranged from 0.002 to 0.17 (Fig. 2b, Table 8, and Appendix 1). Treating years as replicates smolt-to-adult survival was not significantly different among streams (ANOVA = 5.59, d.f. 2, 22, p = 0.13). Treating streams as replicates smolt-to-adult survival was significantly different over ten years (ANOVA H = 29.5, d.f. = 10, p = 0.001). Examined individually smolt-to-adult survival was higher in 2011 than in 2007 and 2008 (Dunn’s q >3.5, p < 0.05).
Table. 6. Proportion of coho salmon that reared in freshwater for two years from 2006
to 2011. ND is not detected.
Mark-Year Proportion 2-Year Freshwater Life History
Caspar Creek Pudding CreekSouth Fork Noyo River
2006 0.008 0.017 0.003
2007 0.014 0.005 0.001
2008 0.021 0.009 0.007
2009 0.008 0.004 0.007
2010 ND 0.006 ND
2011 0.004 ND 0.003

Coastal Salmon Monitoring Plan
16
Table. 7. Proportion of coho salmon tagged during 2011 and 2012 detected at the
Caspar Creek PIT tag array each month. ND is not detected. Based on our downstream trapping and adult mark-recapture population
estimates the 2010 smolt to 2011-12 adult survival averaged 0.30 (Table 8). In the South Fork Noyo River the smolt-to-adult survival thus estimated was 0.04 (4.00%), For Pudding Creek it was 0.03, and for Caspar Creek coho salmon-smolt-to- adult survival was 0.026 (Appendix 1). Smolt-to-adult survival in Pudding Creek from smolts PIT tagged and maxillary clipped in 2010 to adult returns in 2011─12 was 0.02; for just PIT tagged fish it was 0.027. The PIT-tag based survival estimates are almost identical to our calculated apparent survival estimates for Pudding Creek. Smolt-to-adult survival has increased over the past three years (2010 to 2012) relative to the period from 2006 to 2009 (Fig. 2 A).
Figure 2- Coho salmon freshwater and marine survival 2000 to 2010. A. Freshwater
survival. B. Marine survival.
Month
Fall 2011
Spring 2012
2011 and 2012
January
0.06 ND 0.01 February
0.01 ND 0.00
March
0.08 0.04 0.05 April
0.56 0.44 0.46
May
0.23 0.40 0.37 June
0.07 0.12 0.11
July
0.00 0.00 0.00 August
0.00 0.00 0.00
September
ND ND ND October
ND ND ND
November
0.00 0.00 0.00 December
0.00 0.00 0.00
Mendocino County Salmonid Life Cycle and Regional Monitoring 2012
17
Coho salmon recruits-per-spawner ratios were less than 1.00 for the 2002─03 to 2005─06, the 2003─04 to 2006─07, the 2004─05 to 2007─08, the 2005─06 to 2008─09 and the 2006─07 to 2009─10 cohorts (Table 9). With the 2010 to 2012 cohort productivity appears to have improved as recruits-per-spawner was 2.0 for the South Fork Noyo River, 8.3 for Pudding Creek, and 2.8 for Caspar Creek. Treating years as replicates, recruits per spawner estimates were not significantly different among streams (ANOVA = 0.49, df = 3, 30, p = 0.69). When streams were treated as replicates, recruits-per-spawner estimates were significantly different over nine years (ANOVA H = 28.9, df = 9, p < 0.001). Examined by year, recruits per spawner were only significantly different between 2001─04 and 2005─08 (Dunn’s q = 3.37, p < 0.05). There were no other significant differences in recruits per spawner for the other year’s data (Dunn’s q <3.09, p > 0.05).
Trends in Coho Abundance, Productivity, and Survival
There was no significant trend in regional coho salmon escapement over the last 12 years (Fig. 3a). When examined by year class one cohort showed a significant negative trend in escapement over multiple generations (Fig. 3b-d). If we lower the acceptance probability to p < 0.10 all three cohorts exhibited significant negative escapement trends. When evaluated by spawners per intrinsic potential-km-1 (Bjorkstedt et al. 2005), and using the geometric mean approach of Spence et al. (2008) there were significant trends in coho salmon abundance in all of the study streams over the past ten years (Tables 10-11). Based on risk categories in Spence et al. (2008) extinction risks of these populations were moderate to high (Tables 10-11).

Coastal Salmon Monitoring Plan
18
B
C
D
A
Figure 3- Coho salmon escapement trends 2000 to 2011. A. All years combined. B.
Cohort 1. C. Cohort 2. D. Cohort 3.
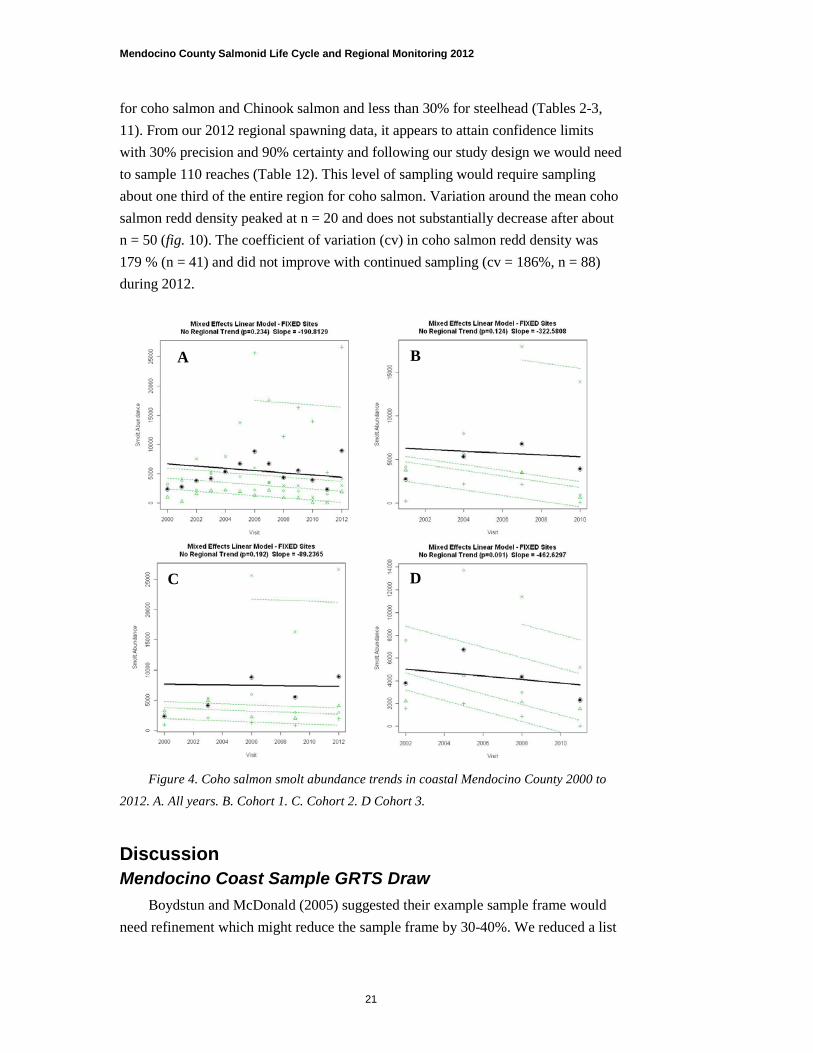
There were no significant trends in regional coho salmon smolt abundance over
the past 12 years (Fig. 4). Similarly, there were no significant trends in coho salmon smolt abundance when each cohort was examined separately (Fig. 4).
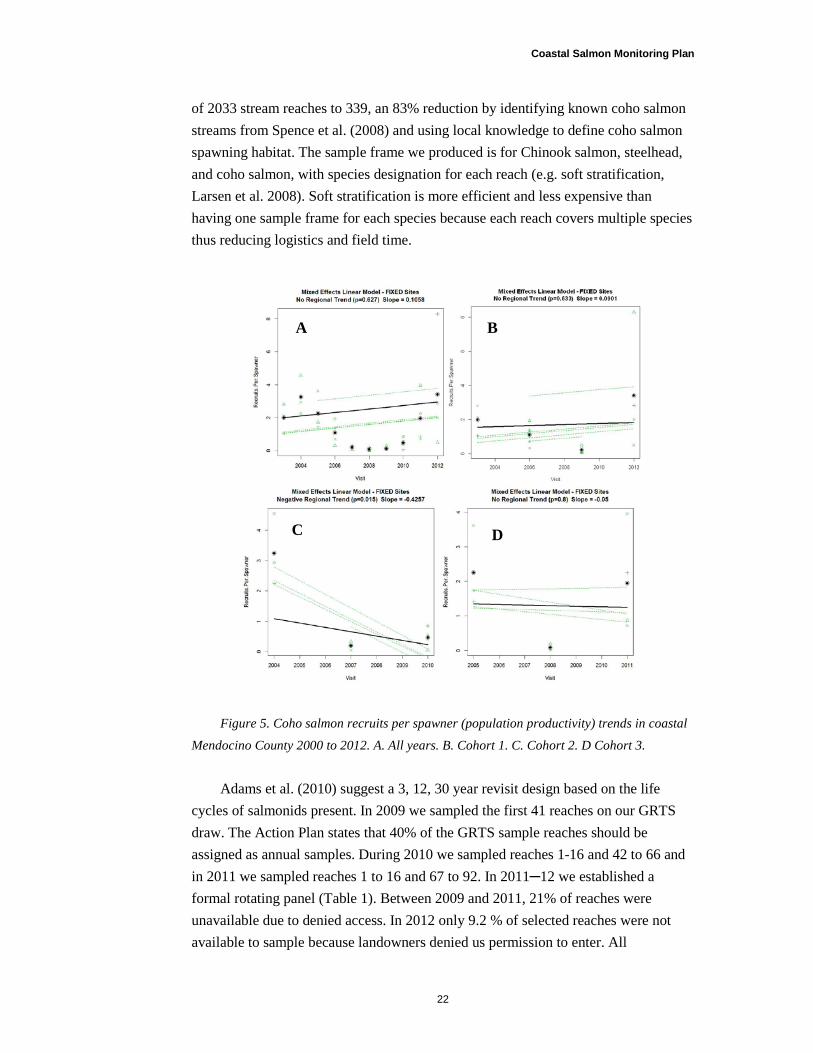
Coho salmon productivity (recruits per spawner) showed no trend over the past nine years (Fig. 5). When examined by year class one of three cohorts showed significant negative production trends (Fig. 5). Freshwater productivity, as measured by smolt recruitment (smolts year n+3/smolts year n), showed no significant trend over the past ten years. When examined by cohort, one of the three cohorts exhibited a significant negative trend in freshwater productivity (Fig. 6).
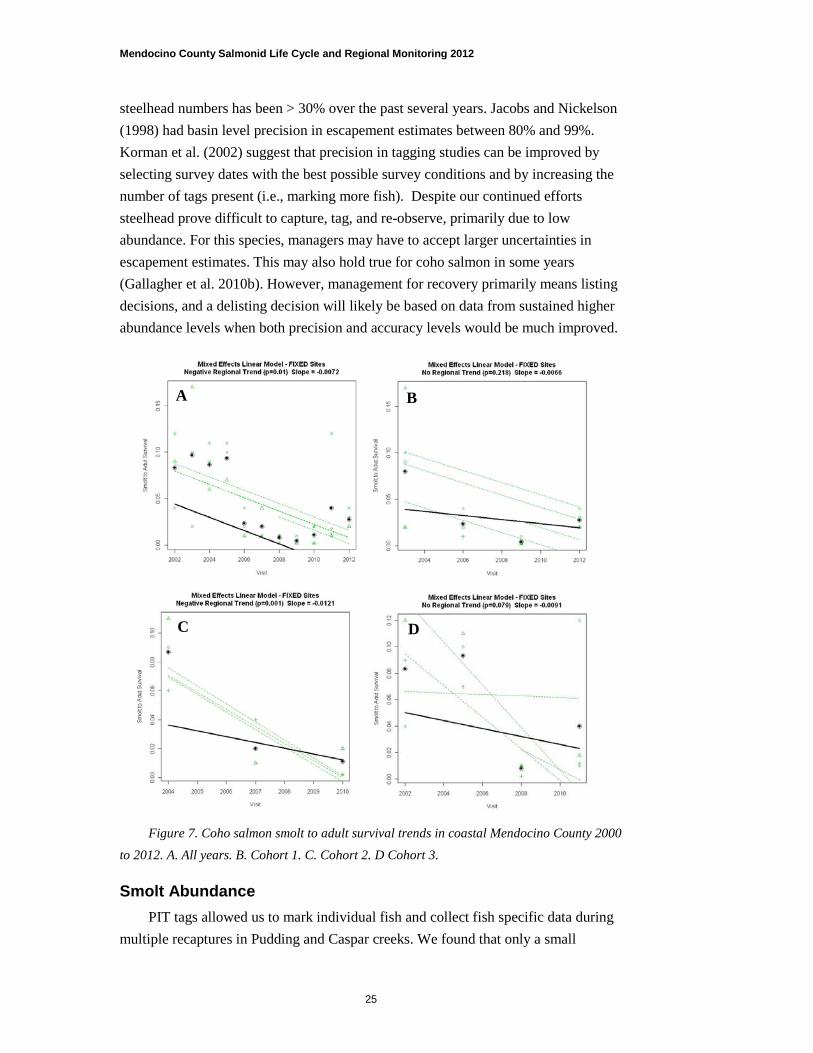
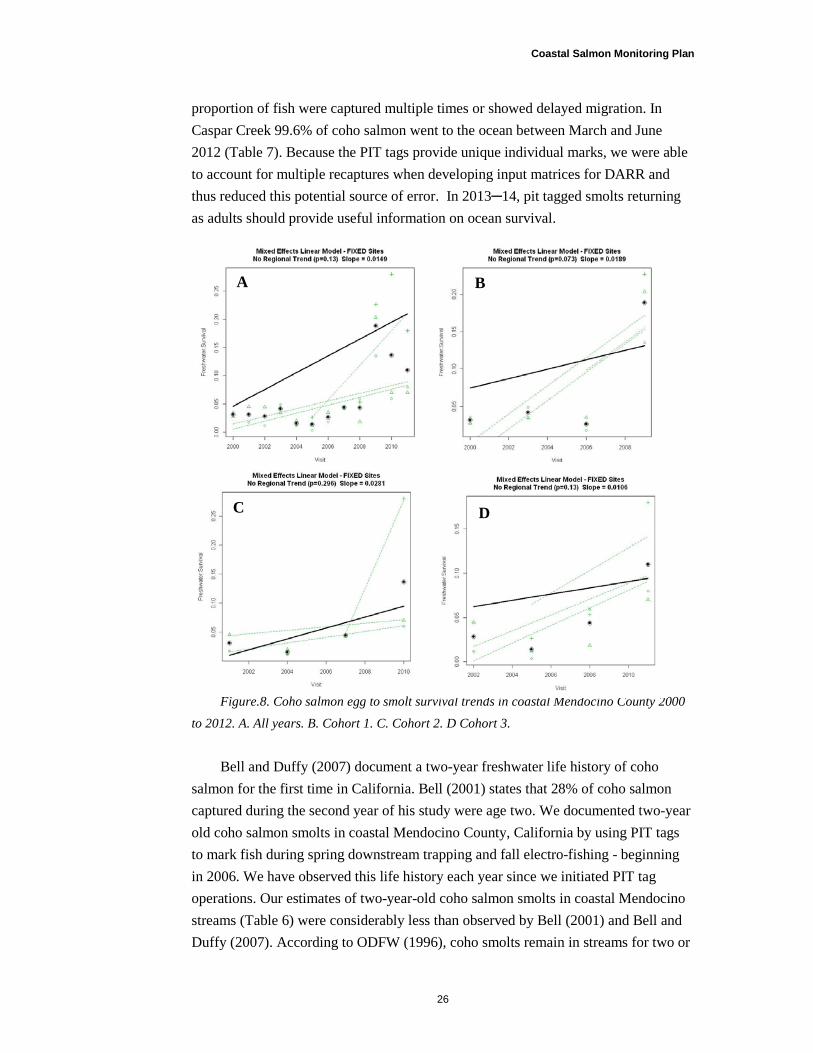
Coho salmon smolt-to-adult (marine) survival showed a significant negative trend over the past ten years (Fig. 7a). Only one of three cohorts showed a significant negative trend in smolt to adult survival over three generations at p < 0.05 (Fig. 7 b-d). There was no significant trend in freshwater (egg to smolt survival) over the past ten years (Fig. 8 a). None of three cohorts showed a significant trend in freshwater survival at p < 0.10 (Fig 8 c).

Mendocino County Salmonid Life Cycle and Regional Monitoring 2012
19
Table. 8. Estimates of smolt-to-adult survival of coho salmon from four watersheds in
Mendocino County, California, for the brood years 1999-2000 to 2008-2009. Salmon hatched in 2009, smolted in 2010, and returned as adults in 2012. Pudding Creek surveys
began in 2006.
Table. 9. Coho salmon recruit: spawner ratios for brood years 1999-2000 to 2011-2012 in four watersheds in Mendocino County, California.
Brood Year Caspar Creek Little River Pudding Creek South Fork Noyo River
1999 0.12 0.09 - 0.03
2000 0.02 0.17 - 0.12
2001 0.11 0.06 - 0.09
2002 0.11 0.07 - 0.10
2003 0.02 0.01 - 0.04
2004 0.01 0.003 - 0.01
2005 0.008 0.002 0.01 0.01
2006 0.002 0.002 0.003 0.01
2007 0.004 0.002 0.001 0.02
2008 0.02 0.01 0.01 0.12
2009 0.03 0.02 0.03 0.04
Return Year Caspar Creek Little River Pudding Creek South Fork Noyo River
2003 1.05 2.81 - 2.71
2004 2.25 4.55 4.36 2.00
2005 1.42 1.73 2.23 5.58
2006 1.38 0.31 1.93 0.55
2007 0.23 0.05 0.33 0.18
2008 0.03 0.01 0.20 0.10
2009 0.05 0.29 0.07 0.07
2010 0.17 0.40 0.02 0.55
2011 2.12 3.96 0.87 0.72
2012 2.83 0.50 8.30 2.00

Coastal Salmon Monitoring Plan
20
Table. 10. Coho salmon population viability based on Spence et al. (2008) for several
coastal Mendocino County streams 2000 to 2012.
Table. 11. Coho salmon population trends based on Spence et al. (2008) for several coastal Mendocino County streams 2000 to 2012.
Regional Spawning Survey Abundance Estimation
Sampling 41 reaches each year encompassed the variation in coho salmon redd density within coastal Mendocino County and redd density was not significantly different among streams (fig. 9). Because redd density was not statistically different among streams we used the average of all reaches to estimate total redd counts and escapement for the region and for individual populations within the region. We estimated 1,364 (95% CI 695 to 2,241) coho salmon redds and 2,848 (95% CI 1,451-4,679) adult coho salmon in coastal Mendocino County during 2011─12 (Table 2). Regional coho salmon confidence limit width was 57% with n = 41 and decreased to 38% when we included reaches from the LCMS (n =88). Escapement estimates for the two coho salmon diversity strata and for individual streams had increased confidence limit widths due to smaller sample sizes (Table 2).
We estimated there were 4,353 steelhead in coastal Mendocino County during 2011 and 95% confidence limit width was 25% at n = 41 (Table 3). We estimated there were 95 Chinook salmon in coastal Mendocino County during 2011─12 (Table 11).
Confidence limit half-widths for our regional sampling were greater than 30%
Stream Geometric Mean Number of Years Slope Negative Trend Population Size ≤ 500
Population Size
South Fork Noyo River 124 11 -0.23 yes p = 0.006 Yes
Pudding Creek 274 9 -0.3 yes p = 0.003 Yes
Caspar Creek 58 11 -0.3 yes p = 0.001 Yes
Little River 16 11 -0.34 yes p = 0.002 Yes
Stream Harmonic Mean (per generation) Number of Years Extinction Risk Spawners/ IP-KM
Population Size Effective Population Size 2
South Fork Noyo River 298 60 11 Moderate 9
Pudding Creek 704 141 9 Moderate 17
Caspar Creek 109 22 11 Moderate 10
Little River 24 5 11 High 2 5
1 Harmonic mean times 0.20. 2 Spence et al. (2008) state that small stable populations are exempt.
Mendocino County Salmonid Life Cycle and Regional Monitoring 2012
21
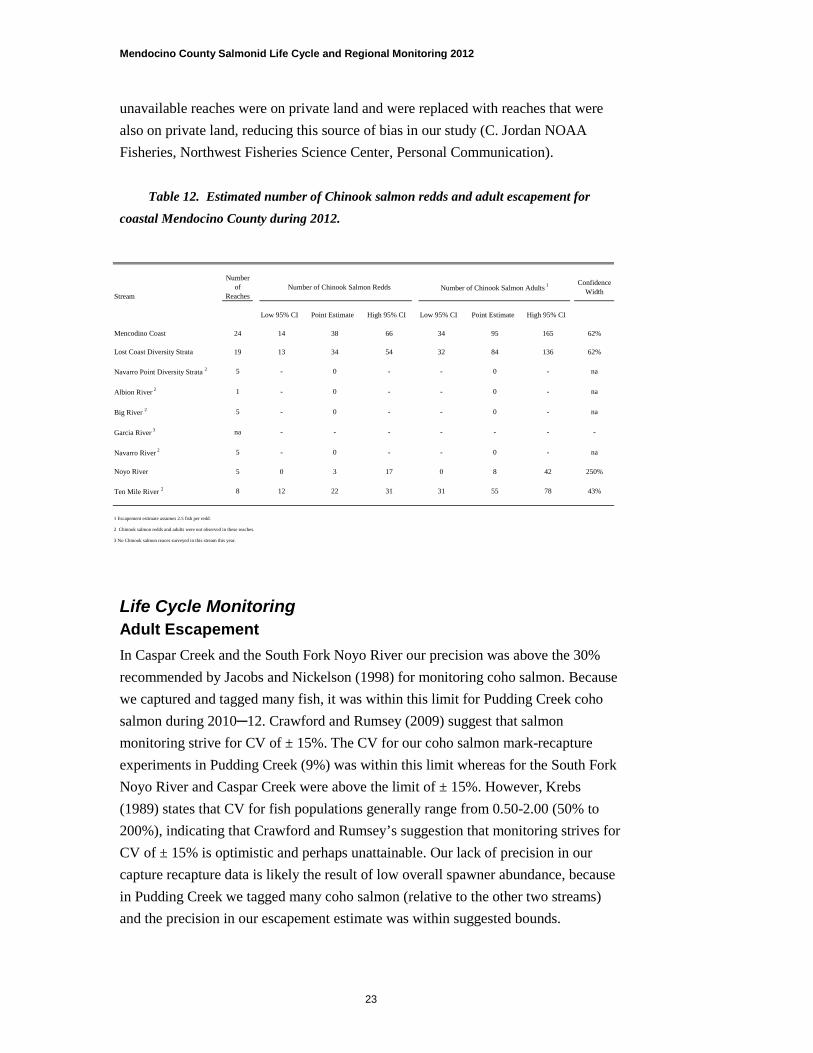
for coho salmon and Chinook salmon and less than 30% for steelhead (Tables 2-3, 11). From our 2012 regional spawning data, it appears to attain confidence limits with 30% precision and 90% certainty and following our study design we would need to sample 110 reaches (Table 12). This level of sampling would require sampling about one third of the entire region for coho salmon. Variation around the mean coho salmon redd density peaked at n = 20 and does not substantially decrease after about n = 50 (fig. 10). The coefficient of variation (cv) in coho salmon redd density was 179 % (n = 41) and did not improve with continued sampling (cv = 186%, n = 88) during 2012.
Figure 4. Coho salmon smolt abundance trends in coastal Mendocino County 2000 to
2012. A. All years. B. Cohort 1. C. Cohort 2. D Cohort 3.
Discussion Mendocino Coast Sample GRTS Draw
Boydstun and McDonald (2005) suggested their example sample frame would need refinement which might reduce the sample frame by 30-40%. We reduced a list
A B
C D
Coastal Salmon Monitoring Plan
22
of 2033 stream reaches to 339, an 83% reduction by identifying known coho salmon streams from Spence et al. (2008) and using local knowledge to define coho salmon spawning habitat. The sample frame we produced is for Chinook salmon, steelhead, and coho salmon, with species designation for each reach (e.g. soft stratification, Larsen et al. 2008). Soft stratification is more efficient and less expensive than having one sample frame for each species because each reach covers multiple species thus reducing logistics and field time.
Figure 5. Coho salmon recruits per spawner (population productivity) trends in coastal
Mendocino County 2000 to 2012. A. All years. B. Cohort 1. C. Cohort 2. D Cohort 3. Adams et al. (2010) suggest a 3, 12, 30 year revisit design based on the life
cycles of salmonids present. In 2009 we sampled the first 41 reaches on our GRTS draw. The Action Plan states that 40% of the GRTS sample reaches should be assigned as annual samples. During 2010 we sampled reaches 1-16 and 42 to 66 and in 2011 we sampled reaches 1 to 16 and 67 to 92. In 2011─12 we established a formal rotating panel (Table 1). Between 2009 and 2011, 21% of reaches were unavailable due to denied access. In 2012 only 9.2 % of selected reaches were not available to sample because landowners denied us permission to enter. All
C
BA
D
Mendocino County Salmonid Life Cycle and Regional Monitoring 2012
23
unavailable reaches were on private land and were replaced with reaches that were also on private land, reducing this source of bias in our study (C. Jordan NOAA Fisheries, Northwest Fisheries Science Center, Personal Communication).
Table 12. Estimated number of Chinook salmon redds and adult escapement for
coastal Mendocino County during 2012.
Life Cycle Monitoring Adult Escapement In Caspar Creek and the South Fork Noyo River our precision was above the 30% recommended by Jacobs and Nickelson (1998) for monitoring coho salmon. Because we captured and tagged many fish, it was within this limit for Pudding Creek coho salmon during 2010─12. Crawford and Rumsey (2009) suggest that salmon monitoring strive for CV of ± 15%. The CV for our coho salmon mark-recapture experiments in Pudding Creek (9%) was within this limit whereas for the South Fork Noyo River and Caspar Creek were above the limit of ± 15%. However, Krebs (1989) states that CV for fish populations generally range from 0.50-2.00 (50% to 200%), indicating that Crawford and Rumsey’s suggestion that monitoring strives for CV of ± 15% is optimistic and perhaps unattainable. Our lack of precision in our capture recapture data is likely the result of low overall spawner abundance, because in Pudding Creek we tagged many coho salmon (relative to the other two streams) and the precision in our escapement estimate was within suggested bounds.
Stream
Number of
ReachesNumber of Chinook Salmon Redds Number of Chinook Salmon Adults 1 Confidence
Width
Low 95% CI Point Estimate High 95% CI Low 95% CI Point Estimate High 95% CI
Mencodino Coast 24 14 38 66 34 95 165 62%
Lost Coast Diversity Strata 19 13 34 54 32 84 136 62%
Navarro Point Diversity Strata 2 5 - 0 - - 0 - na
Albion River 2 1 - 0 - - 0 - na
Big River 2 5 - 0 - - 0 - na
Garcia River 3 na - - - - - - -
Navarro River 2 5 - 0 - - 0 - na
Noyo River 5 0 3 17 0 8 42 250%
Ten Mile River 2 8 12 22 31 31 55 78 43%
1 Escapement estimate assumes 2.5 fish per redd.
2 Chinnok salmon redds and adults were not observed in these reaches.
3 No Chinook salmon reaces surveyed in this stream this year.

Coastal Salmon Monitoring Plan
24
Figure 6. Coho salmon smolts per smolt (freshwater productivity) trends in coastal
Mendocino County 2000 to 2012. A. All years. B. Cohort 1. C. Cohort 2. D Cohort 3.
Our steelhead mark-recapture escapement estimates were very imprecise again this year. Jacobs et al. (2001) defined ± 30% as target precision levels for steelhead redd count estimates in Oregon. Gallagher et al. (2010 b) state that for steelhead, managers may have to accept lower precision in steelhead estimates or use redd areas. We attributed this to low abundance and difficulties capturing and observing steelhead. Over the past eight years, precision in our steelhead escapement estimates has ranged from 40% to 425%; we have never achieved precision ≤ 30%.
Krebs (1989) states that population estimates for management should be accurate to ± 25% and preliminary surveys should be ± 50%. Jacobs and Nickelson (1998) suggest that ± 30% should be the target level for monitoring coho salmon. Jacobs et al. (2001) also defined ± 30% as target levels for steelhead redd count estimates in Oregon. Between 2004 and 2008 and again in 2011 and 2012 the precision in the live coho salmon capture-recapture estimates for Pudding Creek was < 30%, for three years it was ≤ 25%, and in 2011 it was < 15%. The precision in our
A B
C D
Mendocino County Salmonid Life Cycle and Regional Monitoring 2012
25
steelhead numbers has been > 30% over the past several years. Jacobs and Nickelson (1998) had basin level precision in escapement estimates between 80% and 99%. Korman et al. (2002) suggest that precision in tagging studies can be improved by selecting survey dates with the best possible survey conditions and by increasing the number of tags present (i.e., marking more fish). Despite our continued efforts steelhead prove difficult to capture, tag, and re-observe, primarily due to low abundance. For this species, managers may have to accept larger uncertainties in escapement estimates. This may also hold true for coho salmon in some years (Gallagher et al. 2010b). However, management for recovery primarily means listing decisions, and a delisting decision will likely be based on data from sustained higher abundance levels when both precision and accuracy levels would be much improved.
Figure 7. Coho salmon smolt to adult survival trends in coastal Mendocino County 2000 to 2012. A. All years. B. Cohort 1. C. Cohort 2. D Cohort 3. Smolt Abundance
PIT tags allowed us to mark individual fish and collect fish specific data during multiple recaptures in Pudding and Caspar creeks. We found that only a small
A B
C D
Coastal Salmon Monitoring Plan
26
proportion of fish were captured multiple times or showed delayed migration. In Caspar Creek 99.6% of coho salmon went to the ocean between March and June 2012 (Table 7). Because the PIT tags provide unique individual marks, we were able to account for multiple recaptures when developing input matrices for DARR and thus reduced this potential source of error. In 2013─14, pit tagged smolts returning as adults should provide useful information on ocean survival.
Figure.8. Coho salmon egg to smolt survival trends in coastal Mendocino County 2000 to 2012. A. All years. B. Cohort 1. C. Cohort 2. D Cohort 3.
Bell and Duffy (2007) document a two-year freshwater life history of coho
salmon for the first time in California. Bell (2001) states that 28% of coho salmon captured during the second year of his study were age two. We documented two-year old coho salmon smolts in coastal Mendocino County, California by using PIT tags to mark fish during spring downstream trapping and fall electro-fishing - beginning in 2006. We have observed this life history each year since we initiated PIT tag operations. Our estimates of two-year-old coho salmon smolts in coastal Mendocino streams (Table 6) were considerably less than observed by Bell (2001) and Bell and Duffy (2007). According to ODFW (1996), coho smolts remain in streams for two or
A B
C D

Mendocino County Salmonid Life Cycle and Regional Monitoring 2012
27
three years in British Columbia, the coldest part of their range. Water temperatures in our LCMS are similar to those of the other coastal California streams where this life history has not been observed. Based on our recapture of adults with PIT tags first marked as smolts, the average size at smolting was about 98 mm, suggesting there is a threshold size necessary for coho migration to the ocean (Gallagher and Wright 2009). Fish that fail to meet this size by the end of spring may remain in the stream a second year. At the time of migration to the ocean in their second spring these fish are generally larger than this minimum size. In fact most two year rearing coho salmon are much larger than the one year-old fish (Wright et al. 2012). This suggests fish marked later in the spring are likely to hold a second year, probably because they have yet to reach sufficient size for migrating to the ocean.
Figure 9. Average coho salmon density by stream for regional surveys in coastal Mendocino County California 2009 to 2012. A. 2009. B. 2010. C. 2011. D. 2012. Numbers
above estimates are sample sizes (the number of reaches surveyed). Thin lines are 95% confidence limits.
In Caspar Creek during 2011─12 we documented young-of-the-year coho
salmon migrating to the lower watershed during the winter rather than the spring. Some of these fish may be entering the ocean as young-of-the-year. However, only a very small proportion of fish (0.4%) demonstrated this life history and we have not observed this phenomenon in Pudding Creek over the past three years. In contrast, Roni et al. (2012) found that 50% of coho smolts had this life-history type, the
Coastal Salmon Monitoring Plan
28
proportion displaying this life-history type was consistent over many years, and these fish contributed to adult returns (George Pess, NOAA, Personal Communication, November 2012). In their study the large proportion of fish leaving in fall had significant impacts on estimates of freshwater survival. At this juncture, with only 0.4% of coho salmon in one of two streams displaying this life-history type it is unlikely this will influence our freshwater survival estimates. However, continued monitoring is needed to understand annual variation in this life history type.
Survival
Coho salmon smolt to adult survival with eleven smolt-to-adult return cycles was similar to that reported by Bradford (1999), Logerwell et al. (2003), and Shapovolov and Taft (1954) between 2002 and 2005, was considerably lower from 2006 to 2010, and appears to have rebounded since 2011 (Figs. 2, 7a). Both smolt-to-adult survival and recruits per spawner showed a similar drop in mid to late-2000 and a potential rebound beginning in 2011 (Figs 5a, 7a, Table 6). Coho salmon smolt-to-adult (and adult-to-adult) survival is influenced by ocean conditions at the time of ocean entry. Gallagher et al. (2012) found that ocean survival was more influential in driving population production than was freshwater survival, furthering the notion that ocean conditions at the time coho salmon smolts immigrate to the sea is important to survival (Spence and Hall 2010). Trends in Coho Abundance, Productivity, and Survival
With all years combined we did not find significant trends in coho escapement over 13 years in our LCMS streams. This may be a result of the length of the time series or due to the three-year coho salmon life cycle. However, all populations showed moderate to high extinction risk, population sizes < 500 (Tables 10-11), and there was a negative trend in the geometric mean escapement for all LCMS coho salmon populations. When we examined escapement trends by cohort the one with the longest time series (Fig. 3 b) showed a significant negative trend at p < 0.05. If we increased the p-value for accepting statistical significance to p ≤ 0.10, all three cohorts showed significant negative escapement trend over 13 years. Both of these approaches to evaluate escapement trends are designed to incorporate the three-year life history of coho salmon. Thus the difference between the regional model results by cohort and methods suggested by Spence et al. (2008) may be a result of small sample size in the latter or because of cohort overlap that is not accounted for in our mixed model analysis but is accounted for using the geometric mean approach. Trend detection may be more appropriate over a longer time series (Spence and Williams 2011, Spence et al. 2008), with additional covariates such as mean December to January stream flow, an index of the Pacific decadal oscillation or ocean survival,

Mendocino County Salmonid Life Cycle and Regional Monitoring 2012
29
annual precipitation, March to June stream flow two years previous, and perhaps other values. Larsen et al. (2004) found that trend detection increased markedly with increased time series and Shea and Mangel (2001) state that statistical uncertainty in trend detection for modeled coho salmon populations increased with shorter time series. There is increasing evidence that Pacific salmonid populations follow regime shifts in abundance that are related to large-scale climate cycles (Smith and Ward 2000, Smith et al. 2000). If salmonid population abundance fluctuates on decadal or longer periods, our 13 year dataset could be too short to detect these long-term trends. However, Bradford et al. (2000) suggest their results, and others they cite, argue against the idea that regional climate variation affects coho salmon freshwater survival. When we examined adult coho salmon trends by cohort we found that two cohorts showed a significant negative trend (at p < 0.10) and in one case their smolt progeny did also (Fig. 4d), confounding the notion that poor ocean conditions was the cause. We saw a positive trend in freshwater survival for one cohort (at p < 0.10), whereas productivity (recruits per spawner) and smolt to adult survival showed significant negative trends. Similar to Moore et al. (2011), low adult returns did not result in low smolt abundance suggesting reduced density dependence in freshwater. Gallagher et al. (2012) showed that marine survival drives populations in our LCMS which suggests that ocean rather than freshwater conditions may be responsible for the negative trends we observed. They also attributed their observation of increased freshwater survival when there were fewer adults to density dependence.
We did not examine steelhead trends due to the short time series in these data. Steelhead can live up to seven years and spawn as many as four times (Shapovolov and Taft 1954). Thus we only have data for one generation. Continued monitoring of these streams is necessary to provide this type of data as well as information needed for population viability assessments as recommended by Spence et al. (2008).
Regional Spawning Survey Abundance Estimation
For the fourth consecutive year we produced Chinook salmon, coho salmon, and steelhead escapement estimates for the entire coast of Mendocino County representing two diversity strata, six independent populations, and eight potentially independent populations within the CCC Coho salmon ESU. While the precision of these estimates (95% confidence half widths) was lower than expected, we now have estimates, with statistical certainty, of salmonid escapement in this area. We believe, given the variance in redd density we observed, if we are confident in our regional estimates we can have confidence in individual population estimates despite the larger confidence widths.
In an earlier study, we suggested if redd density variation in the pilot study area was representative of coastal California as a whole, a sample size > 41 reaches for

Coastal Salmon Monitoring Plan
30
coho salmon should have confidence interval widths of 30% and sufficient statistical power for monitoring escapement trends (Gallagher et al. 2010 b). Our present application of these sample sizes to the entire area of coastal Mendocino County resulted in escapement estimates with larger confidence widths than we expected. We attribute this in large part to low abundance and perhaps patchy distribution. The steelhead confidence estimates were 25% in 2012, a result of higher abundance than in previous years (Gallagher and Wright 2011). When we included all reaches surveyed during each year, a systematic rather than design-based GRTS sample, precision in our estimates improved. However, the coefficient of variation did not improve with increased sample size and variation about the mean (fig. 10) peaked out at n = 20 and did not substantially decrease after about 58 reaches (~15%). Redd density (an index of abundance) in the LCMS was lower between 2009 and 2012 than observed since 2000 and was outside the range of data we used earlier (Gallagher et al. 2010 b) to develop sample size estimates. Courbios et al. (2008) found that a larger sampling fraction and higher redd abundance resulted in better precision for GRTS. At low redd abundance none of their sampling designs were very precise. In a GRTS sampling design for bull trout in the Columbia Basin, Jacobs et al. (2009) found that precision ranged from 15% to 35% and was dependent on redd distributions within basins and that there was no reduction in precision with sample sizes between 10 and 50 sites. Our results are similar in that increased sample size appears to only marginally improve the precision of our estimates.
Table 13. Estimated sample sizes (number of reaches) for five desired levels of
precision (width of the 95% confidence limits relative to the mean) in coho salmon redd densities for regional monitoring.
Precision Confidence limits
90% 95% 10% 988 1416 20% 247 354 30% 110 157 40% 62 89 50% 42 57

Mendocino County Salmonid Life Cycle and Regional Monitoring 2012
31
Figure 10. Cumulative mean coho salmon redd density (±SE) plotted against the number of sample reaches surveyed in coastal Mendocino County, California during 2012.
Crawford and Rumsey (2009) suggest that salmon monitoring programs strive
for estimates that have a CV of ± 15%. In 2012 increasing sample size did not substantially improve our regional CV for coho salmon. It was 179% with n = 41 and 186% with n = 88. Given the cost to survey one reach for a season ($3,000/ reach, Gallagher et al. 2010b) and the fact that increasing our sampling fraction to 30% would result in sampling 184 reaches ($552,000/year), which would not greatly improve precision, we recommend continued evaluation of smaller sampling fractions. The use of standardized data collection procedures and trained staff (Gallagher et al. 2007) will continue to contribute to increased precision in regional escapement monitoring. Finally, for regional monitoring at low abundance, managers may have to accept larger uncertainties in escapement estimates. However, management for recovery primarily means listing decisions, and a delisting decision will likely be based on data from sustained higher abundance levels when both precision and accuracy levels would be much improved.
Additional Accomplishments Four primary literature publications were produced as a result of FRGP Grant
P0810312. In addition, the California Coastal Monitoring Plan (Adams et al. 2011) was published. This document, which forms the foundation of salmon monitoring in coastal California, benefited a great deal due to work funded by this grant. Sean Gallagher presented preliminary findings from this study at the 2011and 2012 Salmonid Restoration Federation conference, the 2012 Cal-Neva AFS meeting, and
Coastal Salmon Monitoring Plan
32
participated in a workshop on monitoring salmon in California. Dave Wright and Sean Gallagher gave papers at the Redwood Science symposium in June 2011. Other accomplishments: Campbell received a Mendocino County Fish and Game Commission grant to fund improvements in their PIT tag arrays at the Pudding Creek dam. As a result of analysis conducted under this grant (Gallagher and Wright 2012, Gallagher et al. 2012, Wright et al. 2012), we have started to evaluate methods for regionally monitoring fish habitat. In summer 2011 and 2012, we participated in training and conducted habitat surveys following the CHaMP protocols (wwww.Champmonitoring.org). A report documenting the findings of this work is in preparation.
Adams, P.B., L.B. Boydstun, S.P. Gallagher, M.K. Lacy, T. McDonald, and K.E. Shaffer.
2011. California coastal salmonid population monitoring: strategy, design, and methods. Fish Bulletin 180. California Department of Fish and Game. 82Pages.
Gallagher, S. P., S. Thompson, and D. W. Wright. 2012. Identifying factors limiting coho salmon to inform stream restoration in coastal Northern California. California Fish and Game 89(4):185-201.
Gallagher, S.P. and D.W. Wright. 2012. How do we know how many salmon returned to spawn? Implementing the California Coastal Salmonid Monitoring Plan in Mendocino County, California. Proceedings of the 2011 Redwood Symposium. University Of California Press.
Moore, J.W., S.A. Hayes, W. Duffy. S. Gallagher, C.J. Michel, and D. Wright. 2011. Nutrient fluxes and the recent collapse of coastal California salmon populations. Canadian Journal of Fisheries and Aquatic Sciences 68:1161-1170
Wright, D.W., S.P. Gallagher, and C.J. Hannon. 2012. Measurements of key life history metrics of coho salmon in Pudding Creek, California. Proceedings of the 2011 Redwood Symposium. University Of California Press.
Recommendations The life cycle and regional monitoring portion of this study should be continued
into perpetuity to gather data on multiple generations of salmonids and increase the data set for trend detection. As soon as possible, these streams should be included in a larger coast-wide monitoring effort. The capture and marking of steelhead should be increased by better operation of the Pudding Creek flashboard dam and the Noyo ECS. Bootstrap simulations should be used to calculate 95% confidence bounds for regional population estimates. Coordination with others collecting this type of data should continue and a standardized database should be used at the regional level for both LCMS streams and regional GRTS sampling. Access agreements with landowners should be established prior to 1 November each year.
Capture-recapture at LCMS streams should use week specific-colored Floy tags and operculum punches with recaptures made during spawning ground surveys.
Mendocino County Salmonid Life Cycle and Regional Monitoring 2012
33
Smolt abundance should be estimated annually at LCMS streams using downstream migrant traps and PIT tag capture-recapture. The effect of using the neighborhood variance estimator (Stevens 2002) to estimate confidence bounds on sample size should be evaluated. All coastal salmon monitoring should be included in a master sample and use of standardized data collection procedures and well trained staff (Gallagher et al. 2007).
Acknowledgements This work was funded by the California Department of Fish and Game’s
Fisheries Restoration Grant Program. Peter Adams, Barry Collins, Seth Ricker (California Fish and Game), and Danna McCain (Humboldt State University), helped to develop this study. Too many individuals to mention by name from the following entities helped with this study: CDFW, Campbell Timberlands Management, NOAA Fisheries Santa Cruz, and the Pacific States Marine Fisheries Commission. Be assured we value your help. We thank our 2012 field crew: Chris Bell, Elizabeth MacKey, Laura Miller, Katrina Nystrom, Emily Lang, Andy McClary, Sarah Wolf, Nick Tedesco, Brian Storms, Katie Webster, and Jake Smootherman. Thanks to Stan Allen for administrative support, Wendy Holloway for helping to craft Fig. 1, and Wendy Holloway, Chris Hannon, and Scott Harris for many long hours in the field. Mark Gard, Gayle Garman, Brian Spence, and Thomas Williams provided critical review that greatly improved earlier versions of this manuscript. Thanks to David Ulrich and the Mendocino Redwood Company for granting access to streams on their property. And as always a special thanks to Big Wave Dave for his surfing artistry.
References Adams, P.B., L.B. Boydstun, S.P. Gallagher, M.K. Lacy, T. McDonald, and K.E. Shaffer.
2011. California coastal salmonid population monitoring: strategy, design, and methods. Fish Bulletin 180. California Department of Fish and Game. 82 pp.
Barrineau, C. E. and S. P. Gallagher. 2001. Noyo River fyke/pipe trap checking protocol. California State Department of Fish and Game. Steelhead Research and Monitoring Program, 1031 South Main, Suite A, Fort Bragg, California 95437. Report FB-07. 17 pp.
Bell, E. A. 2001. Survival, growth, and movement of juvenile coho salmon (Oncorhynchus kisutch) over-wintering in alcoves, backwaters, and main channel pools in Prairie Creek, California. Thesis (MS). Humboldt State University, Arcata, CA. 85 pp.
Bell, E. and W.G. Duffy. 2007. Previously undocumented two-year freshwater residency of juvenile coho salmon in Prairie Creek California. Transactions of the American Fisheries Society 136: 966-970.
Bjorkstedt, E. P. 2003. DARR (Darroch analysis with rank-reduction) A method for analysis of stratified mark-recapture data for small populations, with application to estimating abundance of smolts from out-migrant trap data. National Marine Fisheries Service,

Coastal Salmon Monitoring Plan
34
Southwest Fisheries Science Center, Santa Cruz, CA. Administrative Report SC-00-02. 24 pp
Bjorkstedt, E. P., B. C. Spence, J. C. Garza, D. G. Hankin, D. Fuller, W. E. Jones, J. J. Smith, and R. Macedo. 2005. An analysis of historical population structure for Evolutionarily Significant Units of Chinook salmon, coho salmon, and steelhead in the North-Central California Coast Recovery Domain. NOAA Technical Memorandum NMFS-SWFSC-382. 210 pp.
Bouwes, N., J. Moberg, N. Weber, B. Bouwes, C. Beasley, S. Bennett, A. Hill, C. Jordan, R. Miller, P. Nelle, M. Polino, S. Rentmeester, B. Semmens, C. Volk, M. B. Ward, G. Wathen, and J. White. 2011. Scientific protocol for salmonid habitat surveys within the Columbia Habitat Monitoring Program. Prepared by the Integrated Status and Effectiveness Monitoring Program and published by Terraqua, Inc., Wauconda, WA. 121 pp.
Boydstun, L. B. 1987. An evaluation of the Schaefer and Jolly-Seber methods for estimating the fall Chinook salmon (Oncorhynchus tshawytscha) spawning escapement into Bogus Creek, upper Klamath River. Inland Fisheries Division Administrative Report No. 87. California State Department of Fish and Game. 28 pp.
Boydstun, L.B. and McDonald, T. 2005. Action plan for Monitoring California’s coastal salmonids. Final report to NOAA Fisheries, Santa Cruz, CA. WASC-3-1295. 78 pp.
Bradford, M. J., R. A. Myers, and J. R. Irvine. 2000. Reference points for coho salmon (Oncorhynchus kisutch) harvest rates and escapement goals based on freshwater production. Canadian Journal of Fisheries and Aquatic Sciences 57: 677-686.
Bradford, M. J. 1999. Temporal and spatial trends in the abundance of coho salmon smolts from western North America. Transactions of the American Fisheries Society 128: 840-846.
Brower, J.E. and J.H. Zar. 1987. Field and Laboratory Methods for General Ecology, 2nd ed. Wm. C. Brown, Dubuque, Iowa. 226 pp.
Courbios, J., S.L. Katz, D.J. Isaak, E.A. Steel, R.F. Thurow, A. M.W. Rub, T. Olsen, and C.E. Jordan. 2008. Evaluating probability sampling strategies for estimating redd counts: an example with Chinook salmon (Oncorhynchus tshawytscha). Canadian Journal of Fisheries and Aquatic Sciences. 65:1814-1830.
Crawford, B.A. and S. Rumsey. 2009. Guidance for monitoring recovery of Pacific Northwest salmon and steelhead listed under the Federal Endangered Species Act (Idaho, Oregon, and Washington). NOAA’s National Marine Fisheries Service-Northwest Region. Draft 12 June 2009. 129 pp.
Gallagher, S.P., and C.M. Gallagher. 2005. Discrimination of Chinook and coho salmon and steelhead redds and evaluation of the use of redd data for estimating escapement in several unregulated streams in Northern California. North American Journal of Fisheries Management 25:284-300.
Gallagher, S.P, P.K. Hahn, and D.H. Johnson. 2007. Redd Counts. Pages 197–234 in D.H. Johnson, B.M. Shrier, J.S. O’Neal, J.A. Knutzen, X.Augerot, T.A. O’Neil, and T.N. Pearsons. Salmonid field protocols handbook: techniques for assessing status and trends in salmon and trout populations. American Fisheries Society, Bethesda, Maryland.
Gallagher, S. P. and D. W. Wright. 2009. Coastal Mendocino County salmonid life cycle and regional monitoring: monitoring status and trends. California State Department of Fish and Game, Coastal Watershed Planning and Assessment Program, 1487 Sandy Prairie Court, Suite A, Fortuna, CA 95540. 58 pp.
Mendocino County Salmonid Life Cycle and Regional Monitoring 2012
35
Gallagher, S.P., P.B. Adams, D.W. Wright, and B.W. Collins. 2010a. Performance of spawner survey techniques at low abundance levels. North American Journal of Fisheries Management 30:1086-1097.
Gallagher, S.P., D.W. Wright, B.W. Collins, and P.B. Adams. 2010 b. A regional approach for monitoring salmonid status and trends: results from a pilot study in coastal Mendocino County, California. North American Journal of Fisheries Management 30:1075-1085.
Gallagher, S. P. and D. W. Wright. 2011. Coastal Mendocino County salmonid life cycle and regional monitoring: monitoring status and trends for 2010. California State Department of Fish and Game, Coastal Watershed Planning and Assessment Program, 1487 Sandy Prairie Court, Suite A, Fortuna, CA 95540. 49 pp.
Gallagher, S. P. and D. W. Wright. 2012. Coastal Mendocino County salmonid life cycle and regional monitoring: monitoring status and trends for 2011. California State Department of Fish and Game, Coastal Watershed Planning and Assessment Program, 1487 Sandy Prairie Court, Suite A, Fortuna, CA 95540. 34 pp.
Gallagher, S. P., D. W. Wright, and S. Thompson. 2012. Identifying factors limiting coho salmon to inform restoration in coastal Northern California. California Fish and Game 98:185-201.
Good, T.P., R.S. Waples, P. Adams. (eds.) 2005. Updated status of federally listed ESUs of West Coast salmon and steelhead. U.S. Dept. of Commerce, NOAA Tech. Memo., NMFS-NWFSC-66, 598 p.
Jacobs, S.E., Gaeumand, W., Weeber, M., A., Gunckel, S.L. and S.J. Starcevich. 2009. Utility of a probabilistic sampling design to determine bull trout population status using redd counts in basins of the Columbia River Plateau. North American Journal of Fisheries Management 29:1590-1604.
Jacobs, S. and Nickelson, T. 1998. Use of stratified random sampling to estimate abundance of Oregon coastal salmon. F-145-12-09. Oregon Department of Fish and Wildlife, Portland, Or. 31 pp.
Jacobs, S., J. Firman, and G Susac. 2001. Status of Oregon coastal stocks of anadromous salmonids; Monitoring program report number OPSW-ODFW-2001-03, Oregon Department of Fish and Wildlife, Portland, Oregon. 83 pp.
Korman, J., Ahrens, R. M. N., Higgins, P. S., and Walters, C. J. 2002. Effects of observer efficiency, arrival timing, and survey life on estimates of escapement for steelhead trout (Oncorhynchus mykiss) derived from repeat mark-recapture experiments. Canadian Journal of Fisheries and Aquatic Sciences. 59:1116-1131.
Krebs, C. J. 1989. Ecological Methodology, Harper & Row, Publishers, Inc, New York, NY. 664 pp.
Larsen, D.P., A.R. Olsen, and D.L. Stevens. 2008. Using a master sample to integrate stream monitoring programs. Journal of Agricultural, Biological, and Environmental Statistics 13:243-254.
Logerwell, E.A., N. Mantua, P.W. Lawson, R.C. Francis, and V. N. Agostini. 2003. Tracking environmental processes in the coastal zone for understanding and predicting Oregon coho (Oncorhynchus kisutch) marine survival. Fisheries Oceanography, 12:554-568
MacDonald, T. L., B.F.J. Manly, and R. M. Nielson. 2007. Review of environmental monitoring methods: trend detection. West Inc. Draft, 37 pp.
Moore, J.W, S.A. Hayes, W. Duffy, S.P. Gallagher, C. Michel, and D. Wright. In Press. Nutrient fluxes and the recent collapse of coastal California salmon populations. Canadian Journal of Fisheries and Aquatic Sciences. 68: 1161-1170.

Coastal Salmon Monitoring Plan
36
Neillands, W. G. 2003. Life history evaluations study 2d4. California Department of Fish and Game, 50 Ericson Ct., Arcata, CA 95521. 21 pp.
NOAA. 2007. California coastal salmonid monitoring plan agreement No. P0210567 final report. NOAA Fisheries, Southwest Fisheries Science Center, Fisheries Ecology Division, 110 Shaffer Rd., Santa Cruz, CA 95060. 26 pp plus appendices.
ODFW. 1996. Biennial Report, Oregon Dept. of Fish and Wildlife. Oregon Department of Fish and Wildlife, 2501 S.W. First Ave., P.O. Box 59, Portland, Oregon 97207
Roni, P., T. Bennett, R. Holland, G. Pess, K. Hanson, R. Moses, M. McHenry, W. Ehinger, and J. Walter. 2012. Factors affecting the migration timing, growth and survival of juvenile coho salmon in two coastal Washington watersheds. Transactions of the American Fisheries Society 141:890-906.
Shapovalov, L. and Taft, A. C. 1954. The life histories of the steelhead rainbow trout (Salmo gairdneri) and silver salmon (Oncorhynchus kisutch) with special reference to Waddell Creek, California and recommendations regarding their management. California Department of Fish and Game, California. Bulletin 98. 375 pp.
Shea, K. and M. Mangel. 2001. Detection of population trends in threatened coho salmon (Oncorhynchus kisutch). Canadian Journal of Fisheries and Aquatic Sciences 58: 375-385.
Smith, B. D. and B. R. Ward. 2000. Trends in wild adult steelhead (Oncorhynchus mykiss) abundance for coastal regions of British Columbia support the variable marine survival hypothesis. Canadian Journal of Fisheries and Aquatic Sciences 57: 271-284.
Smith, B. D., B. R. Ward, and D. W. Welch. 2000. Trends in wild adult steelhead (Oncorhynchus mykiss) abundance in British Columbia as indexed by angler success. Canadian Journal of Fisheries and Aquatic Sciences 57: 255-270
Spence, B., E. Bjorkstedt, J.C. Garza, D. Hankin, J. Smith, D. Fuller, W. Jones, R. Macedo, T.H. Williams, and E. Mora. 2008. A framework for assessing the viability of threatened and endangered salmon and steelhead in north-central California coast recovery domain. NOAA Fisheries Santa Cruz. NOAA Technical Memorandum NMFS-SWFSC-423. 173 pp.
Spence, B.C. and J.D. Hall. 2010. Spatiotemporal patterns in migration timing of coho salmon (Oncorhynchus kisutch) smolts in North America. Canadian Journal of Fisheries and Aquatic Sciences 67:1316-1334.
Stevens, D. L. 2002. Sampling design and statistical analysis methods for the integrated biological and physical monitoring of Oregon streams. Oregon State University, Corvallis Oregon.
Szerlong, R. G., and D. E. Rundio. 2008. A statistical modeling method for estimating mortality and abundance of spawning salmon from a time series of counts. Canadian Journal of Fisheries and Aquatic Sciences 65(1):17-26.

Mendocino County Salmonid Life Cycle and Regional Monitoring 2012
37
Appendix 1: Metrics from Mendocino County, California life cycle monitoring stations 2000 to 2012

Table A1. Summary of coho salmon adult returns, smolts produced, smolt: adult ratios, smolt-to-adult survival, and recruit: spawner ratios by brood year for the Caspar Creek life cycle monitoring station.
Brood Year Adults Smolts 6 Smolt per Adult 7 Estimated Smolt to Adult Survival 8 Recriut:Spawner Ratio
Lower 95% CI Estimate High 95% CI Lower 95% CI Estimate High 95% CI Lower 95% CI Estimate High 95% CI Lower 95% CI Estimate High 95% CI Lower 95% CI Estimate High 95% CI
1999 ND ND ND 2889 3259 3629 ND ND ND 0.110 0.118 0.120 ND ND ND
2000 1, 2 41 87 133 3355 3799 4243 32 44 82 0.024 0.024 0.024 ND ND ND
2001 1, 2 102 106 108 1922 2224 2526 19 21 23 0.109 0.107 0.105 ND ND ND
2002 1,2 370 386 402 4258 4976 5694 12 13 14 0.101 0.110 0.117 ND ND ND
2003 1,2 81 91 101 4371 5753 7135 54 63 71 0.011 0.022 0.695 0.76 1.05 1.98
2004 1,2 210 238 266 3792 4482 5172 18 19 19 0.007 0.012 0.038 2.06 2.25 2.46
2005 1,2 432 548 664 1893 2253 2613 4 4 4 0.003 0.008 ND 1.17 1.42 1.65
2006 48 126 4961 2843 3505 4167 1 28 59 ND 0.002 ND 0.59 1.38 49.12
2007 28 54 196 1786 2134 2491 13 40 64 0.002 0.002 0.004 0.13 0.23 0.74
2008 6 17 ∞ 1424 2044 2664 ND 120 237 0.018 0.017 0.027 0.01 0.03 NA
2009 3 nd 6 nd 545 659 773 ND 110 ND 0.017 0.030 0.235 NA 0.05 NA
2010 4 3 5 9 1069 1525 1981 94 305 356 0.11 0.09 0.05
2011 5 25 34 73 2722 4086 5450 75 120 109 4.17 2.00 NA
2012 9 20 182 NA 3.33 NA
1 Adult escapement based on one redd per female and assumed even male to female ratio.2 Adult escampent based on one redd per female3 Total count of fish released above the weir.4 No fish tagged fish observed during spawning surveys: AUC estimate Noyo 2011 observer efficiancy and 2001 to 2008 average residence time.5No fish captured, handled, or tagged: fish per redd estimate.6 Smolt data by brood year: 1999 brood year smolted in spring 2000.7 By brood year: 1999 adults produced 2000 smolts.8 By brood year: 1999 adults produced 2000 smolts and 2002 returning adults.

Mendocino County Salmonid Life Cycle and Regional Monitoring 2012
39
Table A2. Summary of coho salmon female: male ratios, number of females, female length, number of eggs, number of redds, and spawner: redd ratios by brood year for the Caspar Creek life cycle monitoring station.
Brood Year Female:Male Ratio
Estimated Number of Females
Average Female Fork
Length
Estimated Number of
EggsRedd Count Estimated Spawner:Redd Ratio
Lower 95% CI Estimate High 95% CI
2000 1, 2 1.00:1.00 44 64.7 105906 43 0.95 2.02 3.09
2001 2 1.00:1.00 53 64.7 129035 53 1.92 2.00 2.04
2002 0.91:1.00 176 64.7 427592 183 2.02 2.11 2.20
2003 1.23:1.00 56 61.7 118501 59 1.37 1.54 1.71
2004 1.30:1.00 155 66.1 401303 133 1.58 1.79 2.00
2005 1.14:1.00 312 61.6 656752 292 1.48 1.88 2.27
2006 1.10:1.00 69 68.0 195294 38 1.26 3.32 130.55
2007 0.80:1.00 22 63.4 49518 45 0.62 1.20 4.36
2008 1.50:1.00 13 67.2 34702 9 0.67 1.89 ND
2009 0.50:1.00 2 64.7 4863 11 ND 0.55 ND
2010 2 1.00:1.00 11 64.7 25564 26 0.12 0.19 0.35
2011 1.00:1.00 18 68.0 50726 13 1.92 2.62 5.62
2012 2 1.00:1.00 9 64.7 20694 15 0.60 1.33 12.13
1 Expanded Harris (1999-2000) raw redd count of 32 assume 0.64 oe in redd detection (32*0.36+32).2 No fish observed or captured female to male ratio assumed to be 1.00.
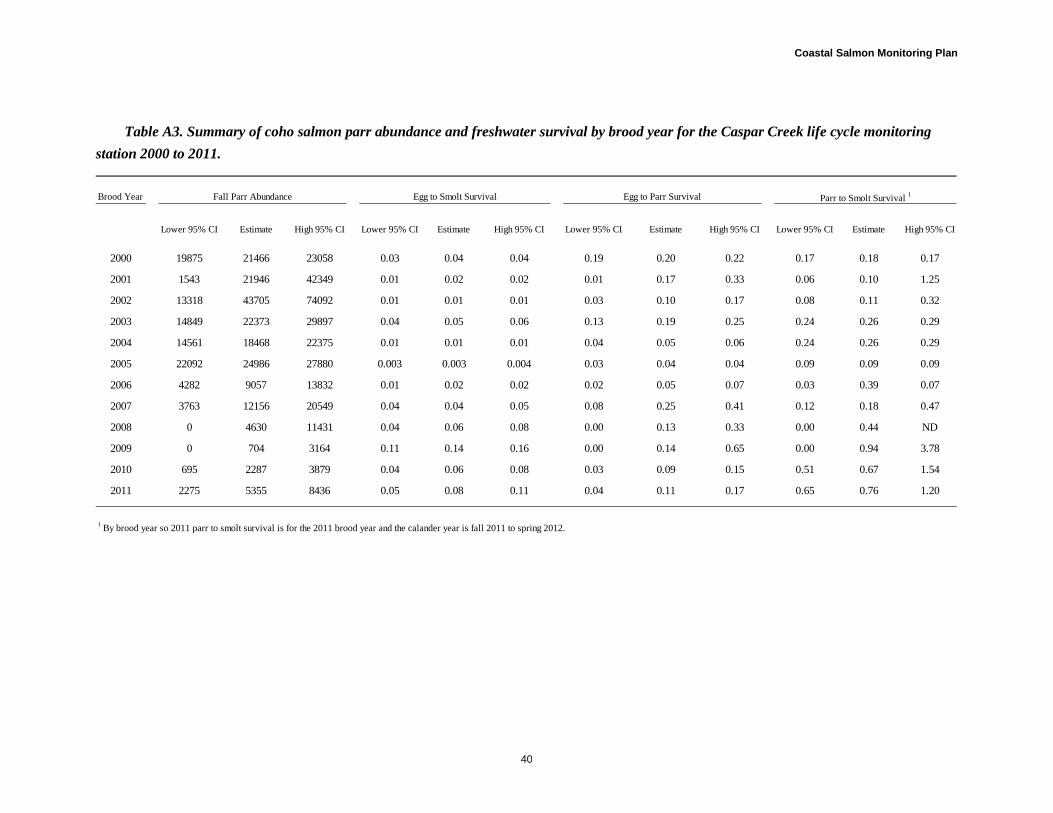
Coastal Salmon Monitoring Plan
40
Table A3. Summary of coho salmon parr abundance and freshwater survival by brood year for the Caspar Creek life cycle monitoring station 2000 to 2011.
Brood Year Fall Parr Abundance Egg to Smolt Survival Egg to Parr Survival Parr to Smolt Survival 1
Lower 95% CI Estimate High 95% CI Lower 95% CI Estimate High 95% CI Lower 95% CI Estimate High 95% CI Lower 95% CI Estimate High 95% CI
2000 19875 21466 23058 0.03 0.04 0.04 0.19 0.20 0.22 0.17 0.18 0.17
2001 1543 21946 42349 0.01 0.02 0.02 0.01 0.17 0.33 0.06 0.10 1.25
2002 13318 43705 74092 0.01 0.01 0.01 0.03 0.10 0.17 0.08 0.11 0.32
2003 14849 22373 29897 0.04 0.05 0.06 0.13 0.19 0.25 0.24 0.26 0.29
2004 14561 18468 22375 0.01 0.01 0.01 0.04 0.05 0.06 0.24 0.26 0.29
2005 22092 24986 27880 0.003 0.003 0.004 0.03 0.04 0.04 0.09 0.09 0.09
2006 4282 9057 13832 0.01 0.02 0.02 0.02 0.05 0.07 0.03 0.39 0.07
2007 3763 12156 20549 0.04 0.04 0.05 0.08 0.25 0.41 0.12 0.18 0.47
2008 0 4630 11431 0.04 0.06 0.08 0.00 0.13 0.33 0.00 0.44 ND
2009 0 704 3164 0.11 0.14 0.16 0.00 0.14 0.65 0.00 0.94 3.78
2010 695 2287 3879 0.04 0.06 0.08 0.03 0.09 0.15 0.51 0.67 1.54
2011 2275 5355 8436 0.05 0.08 0.11 0.04 0.11 0.17 0.65 0.76 1.20
1 By brood year so 2011 parr to smolt survival is for the 2011 brood year and the calander year is fall 2011 to spring 2012.
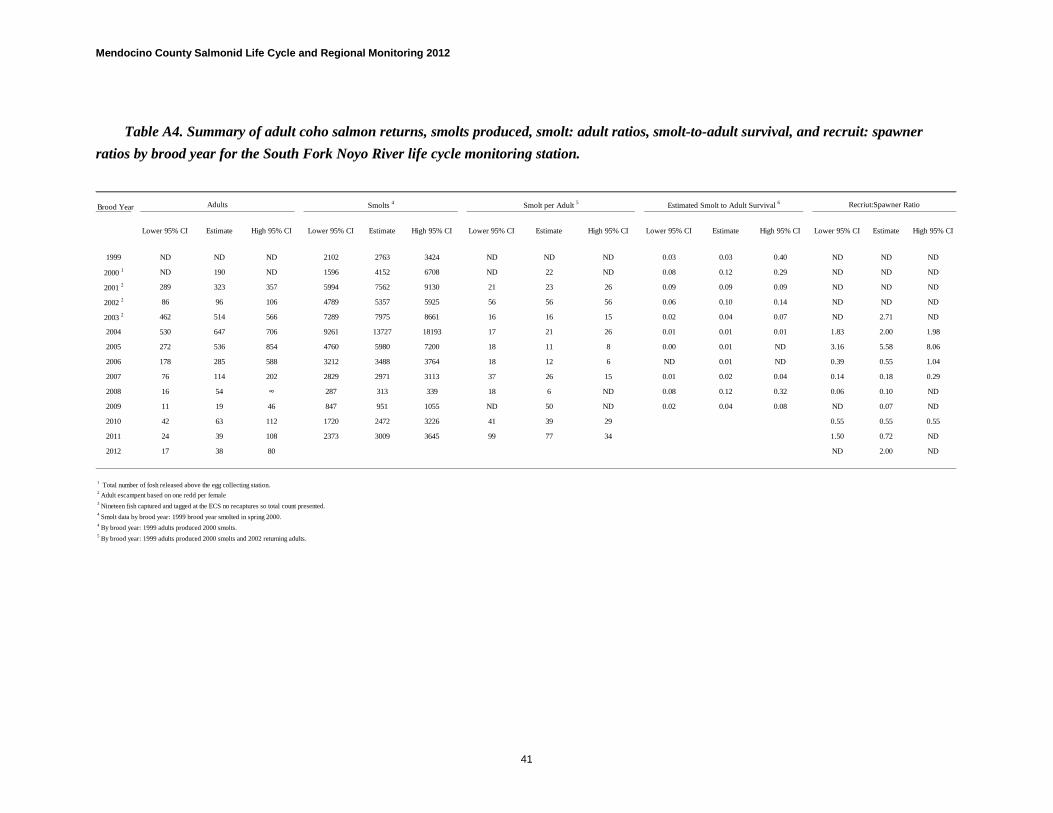
Mendocino County Salmonid Life Cycle and Regional Monitoring 2012
41
Table A4. Summary of adult coho salmon returns, smolts produced, smolt: adult ratios, smolt-to-adult survival, and recruit: spawner ratios by brood year for the South Fork Noyo River life cycle monitoring station.
Brood Year Adults Smolts 4 Smolt per Adult 5 Estimated Smolt to Adult Survival 6 Recriut:Spawner Ratio
Lower 95% CI Estimate High 95% CI Lower 95% CI Estimate High 95% CI Lower 95% CI Estimate High 95% CI Lower 95% CI Estimate High 95% CI Lower 95% CI Estimate High 95% CI
1999 ND ND ND 2102 2763 3424 ND ND ND 0.03 0.03 0.40 ND ND ND
2000 1 ND 190 ND 1596 4152 6708 ND 22 ND 0.08 0.12 0.29 ND ND ND
2001 2 289 323 357 5994 7562 9130 21 23 26 0.09 0.09 0.09 ND ND ND
2002 2 86 96 106 4789 5357 5925 56 56 56 0.06 0.10 0.14 ND ND ND
2003 2 462 514 566 7289 7975 8661 16 16 15 0.02 0.04 0.07 ND 2.71 ND
2004 530 647 706 9261 13727 18193 17 21 26 0.01 0.01 0.01 1.83 2.00 1.98
2005 272 536 854 4760 5980 7200 18 11 8 0.00 0.01 ND 3.16 5.58 8.06
2006 178 285 588 3212 3488 3764 18 12 6 ND 0.01 ND 0.39 0.55 1.04
2007 76 114 202 2829 2971 3113 37 26 15 0.01 0.02 0.04 0.14 0.18 0.29
2008 16 54 ∞ 287 313 339 18 6 ND 0.08 0.12 0.32 0.06 0.10 ND
2009 11 19 46 847 951 1055 ND 50 ND 0.02 0.04 0.08 ND 0.07 ND
2010 42 63 112 1720 2472 3226 41 39 29 0.55 0.55 0.55
2011 24 39 108 2373 3009 3645 99 77 34 1.50 0.72 ND
2012 17 38 80 ND 2.00 ND
1 Total number of fosh released above the egg collecting station.2 Adult escampent based on one redd per female3 Nineteen fish captured and tagged at the ECS no recaptures so total count presented.4 Smolt data by brood year: 1999 brood year smolted in spring 2000.4 By brood year: 1999 adults produced 2000 smolts.5 By brood year: 1999 adults produced 2000 smolts and 2002 returning adults.
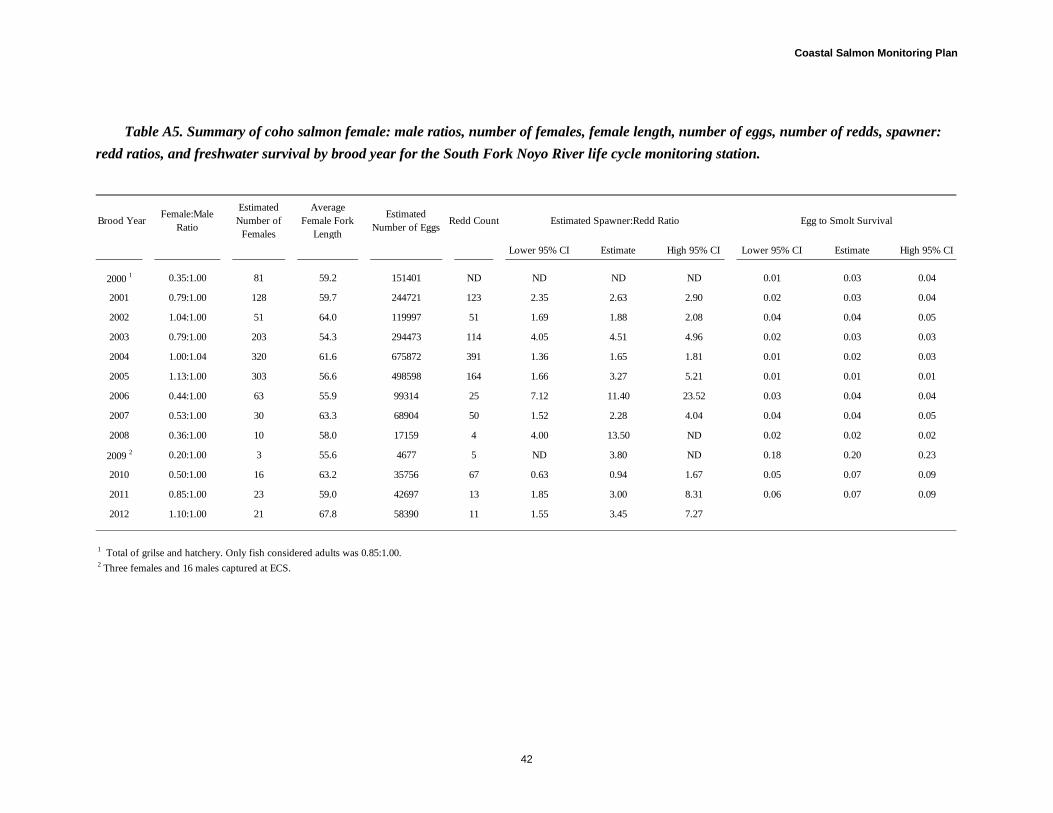
Coastal Salmon Monitoring Plan
42
Table A5. Summary of coho salmon female: male ratios, number of females, female length, number of eggs, number of redds, spawner: redd ratios, and freshwater survival by brood year for the South Fork Noyo River life cycle monitoring station.
Brood Year Female:Male Ratio
Estimated Number of
Females
Average Female Fork
Length
Estimated Number of Eggs Redd Count Estimated Spawner:Redd Ratio Egg to Smolt Survival
Lower 95% CI Estimate High 95% CI Lower 95% CI Estimate High 95% CI
2000 1 0.35:1.00 81 59.2 151401 ND ND ND ND 0.01 0.03 0.04
2001 0.79:1.00 128 59.7 244721 123 2.35 2.63 2.90 0.02 0.03 0.04
2002 1.04:1.00 51 64.0 119997 51 1.69 1.88 2.08 0.04 0.04 0.05
2003 0.79:1.00 203 54.3 294473 114 4.05 4.51 4.96 0.02 0.03 0.03
2004 1.00:1.04 320 61.6 675872 391 1.36 1.65 1.81 0.01 0.02 0.03
2005 1.13:1.00 303 56.6 498598 164 1.66 3.27 5.21 0.01 0.01 0.01
2006 0.44:1.00 63 55.9 99314 25 7.12 11.40 23.52 0.03 0.04 0.04
2007 0.53:1.00 30 63.3 68904 50 1.52 2.28 4.04 0.04 0.04 0.05
2008 0.36:1.00 10 58.0 17159 4 4.00 13.50 ND 0.02 0.02 0.02
2009 2 0.20:1.00 3 55.6 4677 5 ND 3.80 ND 0.18 0.20 0.23
2010 0.50:1.00 16 63.2 35756 67 0.63 0.94 1.67 0.05 0.07 0.09
2011 0.85:1.00 23 59.0 42697 13 1.85 3.00 8.31 0.06 0.07 0.09
2012 1.10:1.00 21 67.8 58390 11 1.55 3.45 7.27
1 Total of grilse and hatchery. Only fish considered adults was 0.85:1.00.2 Three females and 16 males captured at ECS.

Mendocino County Salmonid Life Cycle and Regional Monitoring 2012
43
Table A6. Summary of coho salmon adult returns, smolts produced, smolt: adult ratios, smolt-to-adult survival, and recruit: spawner ratios by brood year for the Pudding Creek life cycle monitoring station.
Brood Year Adults Smolts 2 Smolt per Adult 3 Estimated Smolt to Adult Survival 4 Recriut:Spawner Ratio
Lower 95% CI Estimate High 95% CI Lower 95% CI Estimate High 95% CI Lower 95% CI Estimate High 95% CI Lower 95% CI Estimate High 95% CI Lower 95% CI Estimate High 95% CI
2001 1 ND 276 ND ND ND ND ND ND ND ND ND ND ND ND ND
2002 1 484 524 564 ND ND ND ND ND ND ND ND ND ND ND ND
2003 1 351 367 383 ND ND ND ND ND ND ND ND ND ND ND ND
2004 1067 1204 1600 ND ND ND ND ND ND ND ND ND ND 4.36 ND
2005 899 1167 1773 21862 25656 29450 17 22 24 0.007 0.009 0.015 1.86 2.23 3.14
2006 588 709 888 15313 17609 19905 22 25 26 0.002 0.003 0.005 1.68 1.93 2.32
2007 295 401 601 10842 11390 11938 20 28 27 0.000 0.001 0.002 0.28 0.33 0.38
2008 153 228 450 14367 16309 18251 41 72 100 0.011 0.012 0.015 0.17 0.20 0.25
2009 32 50 96 12748 13920 15092 157 278 398 0.027 0.030 0.035 0.05 0.07 0.11
2010 4 9 27 4853 5181 5509 204 576 1213 0.01 0.02 0.04
2011 153 199 270 23896 26668 29440 109 134 156 0.60 0.87 1.07
2012 341 415 527 5.49 8.30 10.66
1 Adult escampent based on one redd per female2 Smolt data by brood year: 1999 brood year smolted in spring 2000.3 By brood year: 1999 adults produced 2000 smolts.4 By brood year: 1999 adults produced 2000 smolts and 2002 returning adults.
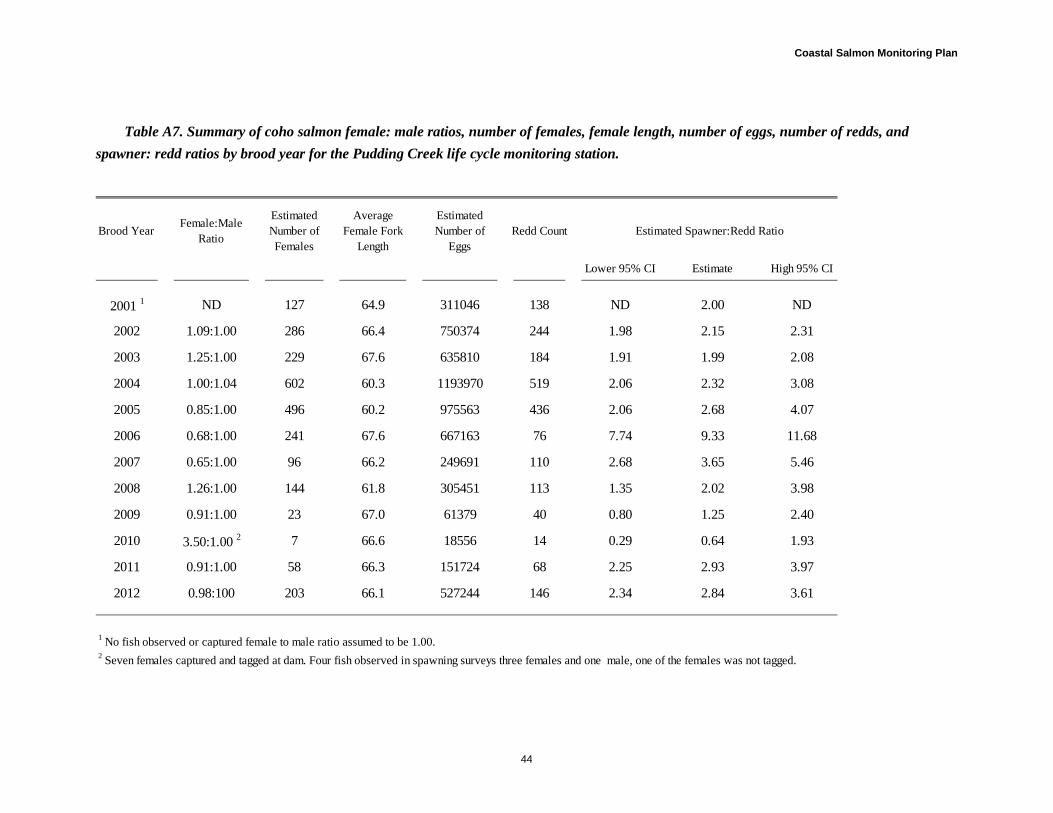
Coastal Salmon Monitoring Plan
44
Table A7. Summary of coho salmon female: male ratios, number of females, female length, number of eggs, number of redds, and spawner: redd ratios by brood year for the Pudding Creek life cycle monitoring station.
Brood Year Female:Male Ratio
Estimated Number of Females
Average Female Fork
Length
Estimated Number of
EggsRedd Count Estimated Spawner:Redd Ratio
Lower 95% CI Estimate High 95% CI
2001 1 ND 127 64.9 311046 138 ND 2.00 ND
2002 1.09:1.00 286 66.4 750374 244 1.98 2.15 2.31
2003 1.25:1.00 229 67.6 635810 184 1.91 1.99 2.08
2004 1.00:1.04 602 60.3 1193970 519 2.06 2.32 3.08
2005 0.85:1.00 496 60.2 975563 436 2.06 2.68 4.07
2006 0.68:1.00 241 67.6 667163 76 7.74 9.33 11.68
2007 0.65:1.00 96 66.2 249691 110 2.68 3.65 5.46
2008 1.26:1.00 144 61.8 305451 113 1.35 2.02 3.98
2009 0.91:1.00 23 67.0 61379 40 0.80 1.25 2.40
2010 3.50:1.00 2 7 66.6 18556 14 0.29 0.64 1.93
2011 0.91:1.00 58 66.3 151724 68 2.25 2.93 3.97
2012 0.98:100 203 66.1 527244 146 2.34 2.84 3.61
1 No fish observed or captured female to male ratio assumed to be 1.00.2 Seven females captured and tagged at dam. Four fish observed in spawning surveys three females and one male, one of the females was not tagged.
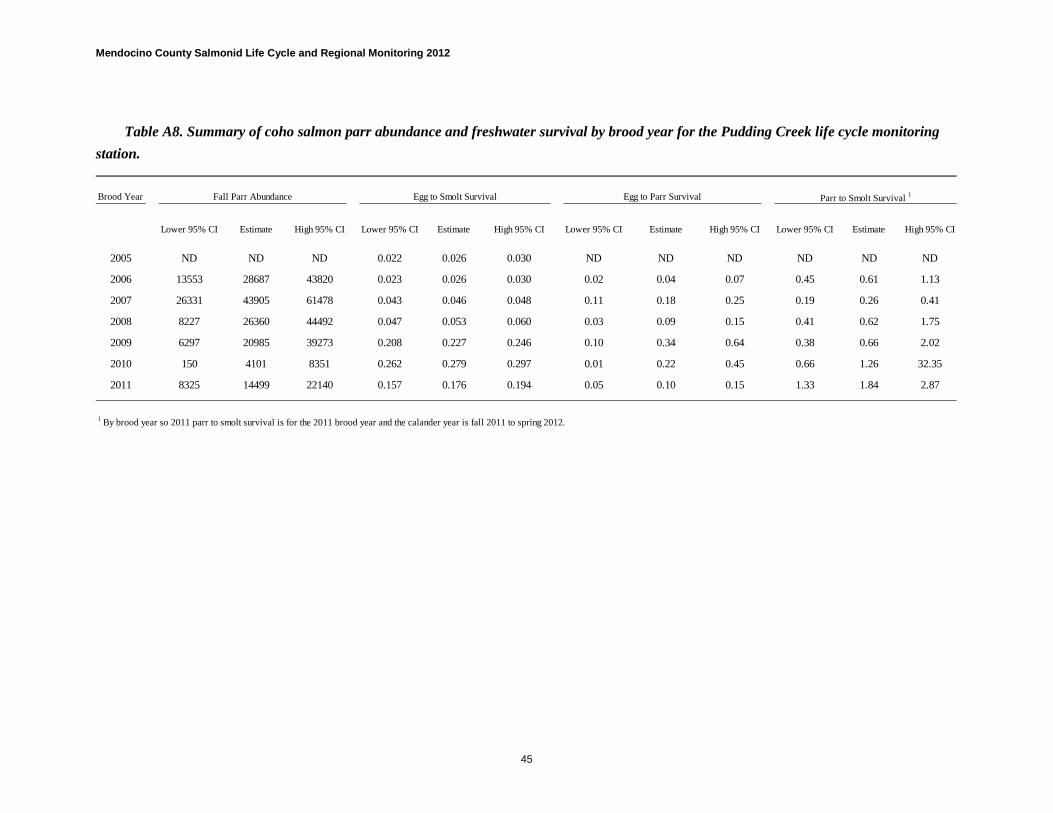
Mendocino County Salmonid Life Cycle and Regional Monitoring 2012
45
Table A8. Summary of coho salmon parr abundance and freshwater survival by brood year for the Pudding Creek life cycle monitoring station.
Brood Year Fall Parr Abundance Egg to Smolt Survival Egg to Parr Survival Parr to Smolt Survival 1
Lower 95% CI Estimate High 95% CI Lower 95% CI Estimate High 95% CI Lower 95% CI Estimate High 95% CI Lower 95% CI Estimate High 95% CI
2005 ND ND ND 0.022 0.026 0.030 ND ND ND ND ND ND
2006 13553 28687 43820 0.023 0.026 0.030 0.02 0.04 0.07 0.45 0.61 1.13
2007 26331 43905 61478 0.043 0.046 0.048 0.11 0.18 0.25 0.19 0.26 0.41
2008 8227 26360 44492 0.047 0.053 0.060 0.03 0.09 0.15 0.41 0.62 1.75
2009 6297 20985 39273 0.208 0.227 0.246 0.10 0.34 0.64 0.38 0.66 2.02
2010 150 4101 8351 0.262 0.279 0.297 0.01 0.22 0.45 0.66 1.26 32.35
2011 8325 14499 22140 0.157 0.176 0.194 0.05 0.10 0.15 1.33 1.84 2.87
1 By brood year so 2011 parr to smolt survival is for the 2011 brood year and the calander year is fall 2011 to spring 2012.

Coastal Salmon Monitoring Plan
46
Table A9. Summary of coho salmon adult returns, smolts produced, smolt: adult ratios, smolt-to-adult survival, and recruit: spawner ratios by brood year for the Little River life cycle monitoring station.
Brood Year Adults Smolts 3 Smolt per Adult 4 Estimated Smolt to Adult Survival 5 Recriut:Spawner Ratio
Lower 95% CI Estimate High 95% CI Lower 95% CI Estimate High 95% CI Lower 95% CI Estimate High 95% CI Lower 95% CI Estimate High 95% CI Lower 95% CI Estimate High 95% CI
1999 917 975 1033 ND ND ND 0.03 0.09 0.40 ND ND ND
2000 1 0 16 67 259 264 280 ND 17 ND 0.08 0.17 0.29 ND ND ND
2001 2 6 20 33 1441 1575 1709 52 79 240 0.02 0.06 0.09 ND ND ND
2002 2 50 88 126 1885 2115 2345 19 24 38 0.00 0.07 0.23 ND ND ND
2003 2 42 45 48 2038 2202 2366 49 49 49 0.00 0.01 0.01 ND 2.81 ND
2004 2 28 91 154 1834 1974 2114 14 22 66 0.002 0.003 0.003 4.67 4.55 4.67
2005 2 0 152 535 1176 1294 1412 3 9 ∞ 0.001 0.002 0.003 0.00 1.73 4.25
2006 2 1 14 27 1855 2175 2495 92 155 1855 ND 0.002 ND 0.02 0.31 0.56
2007 2 3 5 6 800 863 923 154 173 267 0.000 0.002 0.000 0.04 0.05 0.11
2008 2 1 2 4 698 836 974 245 414 517 ND 0.01 ND ND 0.01 ND
2009 2 - 4 - 41 85 129 ND 21 ND ND 0.02 ND ND 0.29 ND
2010 2 2 NA 0 NA ND 0 ND 0.00 0.40 0.00
2011 2 - 8 - 1474 1954 2434 ND 244 ND ND 3.96 ND
2012 2 - 2 - ND 0.50 ND
1 Adult escapement from Harris 1999 redd counts2 Adult escampent based on one redd per female3 Smolt data by brood year: 1999 brood year smolted in spring 2000.4 By brood year: 1999 adults produced 2000 smolts.5 By brood year: 1999 adults produced 2000 smolts and 2002 returning adults.
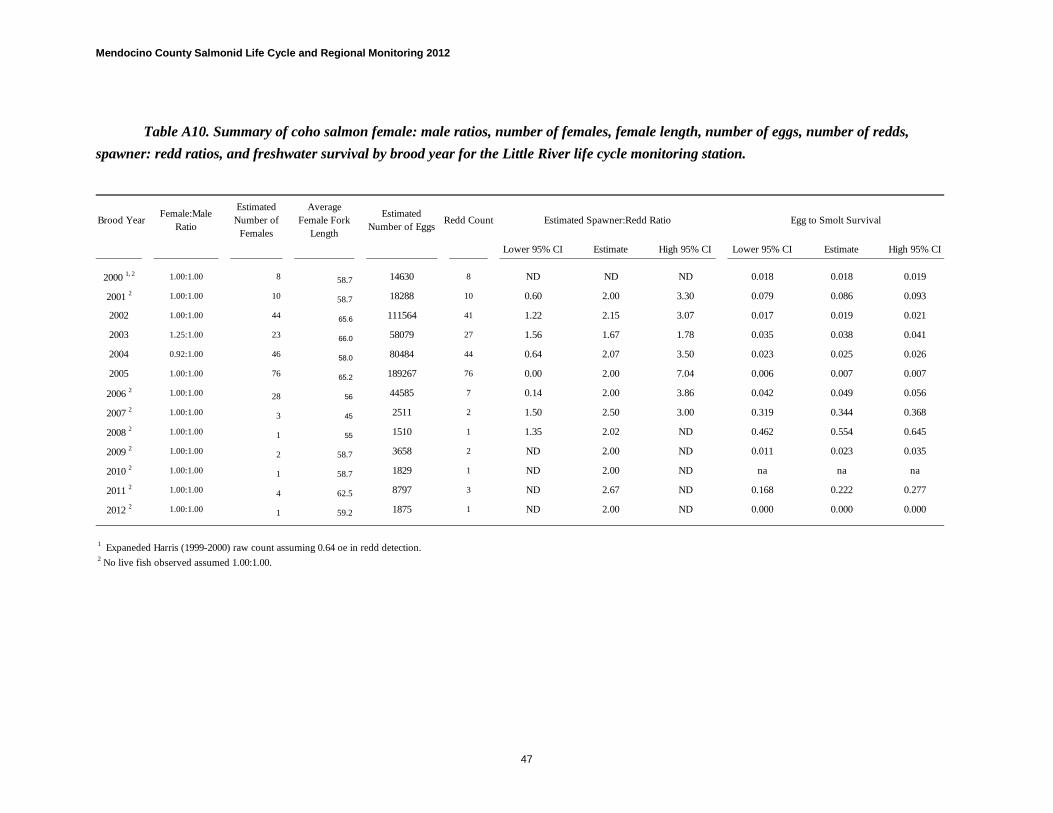
Mendocino County Salmonid Life Cycle and Regional Monitoring 2012
47
Table A10. Summary of coho salmon female: male ratios, number of females, female length, number of eggs, number of redds, spawner: redd ratios, and freshwater survival by brood year for the Little River life cycle monitoring station.
Brood Year Female:Male Ratio
Estimated Number of
Females
Average Female Fork
Length
Estimated Number of Eggs Redd Count Estimated Spawner:Redd Ratio Egg to Smolt Survival
Lower 95% CI Estimate High 95% CI Lower 95% CI Estimate High 95% CI
2000 1, 2 1.00:1.00 8 58.7 14630 8 ND ND ND 0.018 0.018 0.019
2001 2 1.00:1.00 10 58.7 18288 10 0.60 2.00 3.30 0.079 0.086 0.093
2002 1.00:1.00 44 65.6 111564 41 1.22 2.15 3.07 0.017 0.019 0.021
2003 1.25:1.00 23 66.0 58079 27 1.56 1.67 1.78 0.035 0.038 0.041
2004 0.92:1.00 46 58.0 80484 44 0.64 2.07 3.50 0.023 0.025 0.026
2005 1.00:1.00 76 65.2 189267 76 0.00 2.00 7.04 0.006 0.007 0.007
2006 2 1.00:1.00 28 56 44585 7 0.14 2.00 3.86 0.042 0.049 0.056
2007 2 1.00:1.00 3 45 2511 2 1.50 2.50 3.00 0.319 0.344 0.368
2008 2 1.00:1.00 1 55 1510 1 1.35 2.02 ND 0.462 0.554 0.645
2009 2 1.00:1.00 2 58.7 3658 2 ND 2.00 ND 0.011 0.023 0.035
2010 2 1.00:1.00 1 58.7 1829 1 ND 2.00 ND na na na
2011 2 1.00:1.00 4 62.5 8797 3 ND 2.67 ND 0.168 0.222 0.277
2012 2 1.00:1.00 1 59.2 1875 1 ND 2.00 ND 0.000 0.000 0.000
1 Expaneded Harris (1999-2000) raw count assuming 0.64 oe in redd detection.2 No live fish observed assumed 1.00:1.00.
Related Documents


![SHEET 50 ZONING DISPLAY MAP - Mendocino County, CA · MRR MSR M TR GPD GVMU GHMU GI RR_ [RR_] Mendocino Commercial Mendocino Forestland M en doc ix -Us Mendocino Open Space Mendocino](https://static.cupdf.com/doc/110x72/5f0ffb107e708231d446d8b9/sheet-50-zoning-display-map-mendocino-county-ca-mrr-msr-m-tr-gpd-gvmu-ghmu-gi.jpg)