METHODS ARTICLE published: 16 July 2013 doi: 10.3389/fonc.2013.00184 MelanomaDB: a web tool for integrative analysis of melanoma genomic information to identify disease-associated molecular pathways Alexander J.Trevarton 1 , Michael B. Mann 2 , Christoph Knapp 3 , Hiromitsu Araki 4 , Jonathan D. Wren 5,6 , Steven Stones-Havas 7 , Michael A. Black 8,9 and Cristin G. Print 1,3,9 * 1 Department of Molecular Medicine and Pathology, School of Medical Sciences, University of Auckland, Auckland, New Zealand 2 Cancer Research Program, The Methodist Hospital Research Institute, Houston, TX, USA 3 Bioinformatics Institute, University of Auckland, Auckland, New Zealand 4 Department of Bioscience and Biotechnology, Faculty ofAgriculture, Kyushu University, Fukuoka, Japan 5 Arthritis and Clinical Immunology Research Program, Oklahoma Medical Research Foundation, Oklahoma City, OK, USA 6 Department of Biochemistry and Molecular Biology, University of Oklahoma Health Sciences Center, Oklahoma City, OK, USA 7 Biomatters Ltd., Auckland, New Zealand 8 Department of Biochemistry, University of Otago, Dunedin, New Zealand 9 Maurice Wilkins Centre, Auckland, New Zealand Edited by: Mike Eccles, University of Otago, New Zealand Reviewed by: William Curtis Reinhold, National Cancer Institute, USA Terrence Furey, University of North Carolina at Chapel Hill, USA Paola Parrella, IRCCS Casa Sollievo Della Sofferenza, Italy *Correspondence: Cristin G. Print, Department of Molecular Medicine and Pathology, School of Medical Sciences, The New Zealand Bioinformatics Institute, University of Auckland, Private Bag 92019, Auckland 1142, New Zealand e-mail: [email protected] Despite on-going research, metastatic melanoma survival rates remain low and treatment options are limited. Researchers can now access a rapidly growing amount of molecular and clinical information about melanoma.This information is becoming difficult to assemble and interpret due to its dispersed nature, yet as it grows it becomes increasingly valuable for understanding melanoma. Integration of this information into a comprehensive resource to aid rational experimental design and patient stratification is needed. As an initial step in this direction, we have assembled a web-accessible melanoma database, MelanomaDB, which incorporates clinical and molecular data from publically available sources, which will be reg- ularly updated as new information becomes available.This database allows complex links to be drawn between many different aspects of melanoma biology: genetic changes (e.g., mutations) in individual melanomas revealed by DNA sequencing, associations between gene expression and patient survival, data concerning drug targets, biomarkers, druggabil- ity, and clinical trials, as well as our own statistical analysis of relationships between mole- cular pathways and clinical parameters that have been produced using these data sets.The database is freely available at http://genesetdb.auckland.ac.nz/melanomadb/about.html. A subset of the information in the database can also be accessed through a freely avail- able web application in the Illumina genomic cloud computing platform BaseSpace at http://www.biomatters.com/apps/melanoma-profiler-for-research.The MelanomaDB data- base illustrates dysregulation of specific signaling pathways across 310 exome-sequenced melanomas and in individual tumors and identifies the distribution of somatic variants in melanoma. We suggest that MelanomaDB can provide a context in which to interpret the tumor molecular profiles of individual melanoma patients relative to biological information and available drug therapies. Keywords: melanoma, mutation, molecular pathway, MelanomaDB, gene set analysis, BaseSpace INTRODUCTION THE GROWTH AND COMPLEXITY OF MELANOMA GENOMIC DATA Melanoma researchers are faced with a rapidly growing amount of useful molecular and clinical data, particularly gene expression information. This rapid growth can be illustrated by surveying the Gene Expression Omnibus (GEO) (1), an international repos- itory that contains a large subset of the published gene expression data (Figure 1). Largely based on genomic data, our understand- ing of the genes involved in melanoma progression has advanced from focused investigations of candidate genes to studies on a whole-genome scale (2). The advent of next-generation sequenc- ing (NGS) in particular has opened up a floodgate of data, from the published sequence of the first melanoma genome in the beginning of 2010 (3), to more recent whole-exome studies sequencing more than one hundred tumors (4, 5). Melanoma genomic data is poised to grow rapidly with the advent of large-scale initiatives such as Australia’s Melanoma Genome Project 1 , melanoma analysis in The Cancer Genome Atlas (TCGA) project 2 as well as the melanoma sequencing projects underway at several individual institutions. LIMITATIONS OF CURRENT TECHNIQUES Unfortunately, information pertinent to melanoma exists in a diverse range of formats and locations. For example, relevant data 1 http://www.melanoma.org.au/research/melanoma-genome-project.html 2 http://cancergenome.nih.gov www.frontiersin.org July 2013 |Volume 3 | Article 184 | 1

Welcome message from author
This document is posted to help you gain knowledge. Please leave a comment to let me know what you think about it! Share it to your friends and learn new things together.
Transcript
METHODS ARTICLEpublished: 16 July 2013
doi: 10.3389/fonc.2013.00184
MelanomaDB: a web tool for integrative analysis ofmelanoma genomic information to identifydisease-associated molecular pathwaysAlexander J.Trevarton1, Michael B. Mann2, Christoph Knapp3, Hiromitsu Araki 4, Jonathan D. Wren5,6,Steven Stones-Havas7, Michael A. Black 8,9 and Cristin G. Print 1,3,9*1 Department of Molecular Medicine and Pathology, School of Medical Sciences, University of Auckland, Auckland, New Zealand2 Cancer Research Program, The Methodist Hospital Research Institute, Houston, TX, USA3 Bioinformatics Institute, University of Auckland, Auckland, New Zealand4 Department of Bioscience and Biotechnology, Faculty of Agriculture, Kyushu University, Fukuoka, Japan5 Arthritis and Clinical Immunology Research Program, Oklahoma Medical Research Foundation, Oklahoma City, OK, USA6 Department of Biochemistry and Molecular Biology, University of Oklahoma Health Sciences Center, Oklahoma City, OK, USA7 Biomatters Ltd., Auckland, New Zealand8 Department of Biochemistry, University of Otago, Dunedin, New Zealand9 Maurice Wilkins Centre, Auckland, New Zealand
Edited by:Mike Eccles, University of Otago,New Zealand
Reviewed by:William Curtis Reinhold, NationalCancer Institute, USATerrence Furey, University of NorthCarolina at Chapel Hill, USAPaola Parrella, IRCCS Casa SollievoDella Sofferenza, Italy
*Correspondence:Cristin G. Print , Department ofMolecular Medicine and Pathology,School of Medical Sciences, The NewZealand Bioinformatics Institute,University of Auckland, Private Bag92019, Auckland 1142, New Zealande-mail: [email protected]
Despite on-going research, metastatic melanoma survival rates remain low and treatmentoptions are limited. Researchers can now access a rapidly growing amount of molecularand clinical information about melanoma.This information is becoming difficult to assembleand interpret due to its dispersed nature, yet as it grows it becomes increasingly valuable forunderstanding melanoma. Integration of this information into a comprehensive resource toaid rational experimental design and patient stratification is needed. As an initial step in thisdirection, we have assembled a web-accessible melanoma database, MelanomaDB, whichincorporates clinical and molecular data from publically available sources, which will be reg-ularly updated as new information becomes available. This database allows complex linksto be drawn between many different aspects of melanoma biology: genetic changes (e.g.,mutations) in individual melanomas revealed by DNA sequencing, associations betweengene expression and patient survival, data concerning drug targets, biomarkers, druggabil-ity, and clinical trials, as well as our own statistical analysis of relationships between mole-cular pathways and clinical parameters that have been produced using these data sets.Thedatabase is freely available at http://genesetdb.auckland.ac.nz/melanomadb/about.html. Asubset of the information in the database can also be accessed through a freely avail-able web application in the Illumina genomic cloud computing platform BaseSpace athttp://www.biomatters.com/apps/melanoma-profiler-for-research.The MelanomaDB data-base illustrates dysregulation of specific signaling pathways across 310 exome-sequencedmelanomas and in individual tumors and identifies the distribution of somatic variants inmelanoma. We suggest that MelanomaDB can provide a context in which to interpret thetumor molecular profiles of individual melanoma patients relative to biological informationand available drug therapies.
Keywords: melanoma, mutation, molecular pathway, MelanomaDB, gene set analysis, BaseSpace
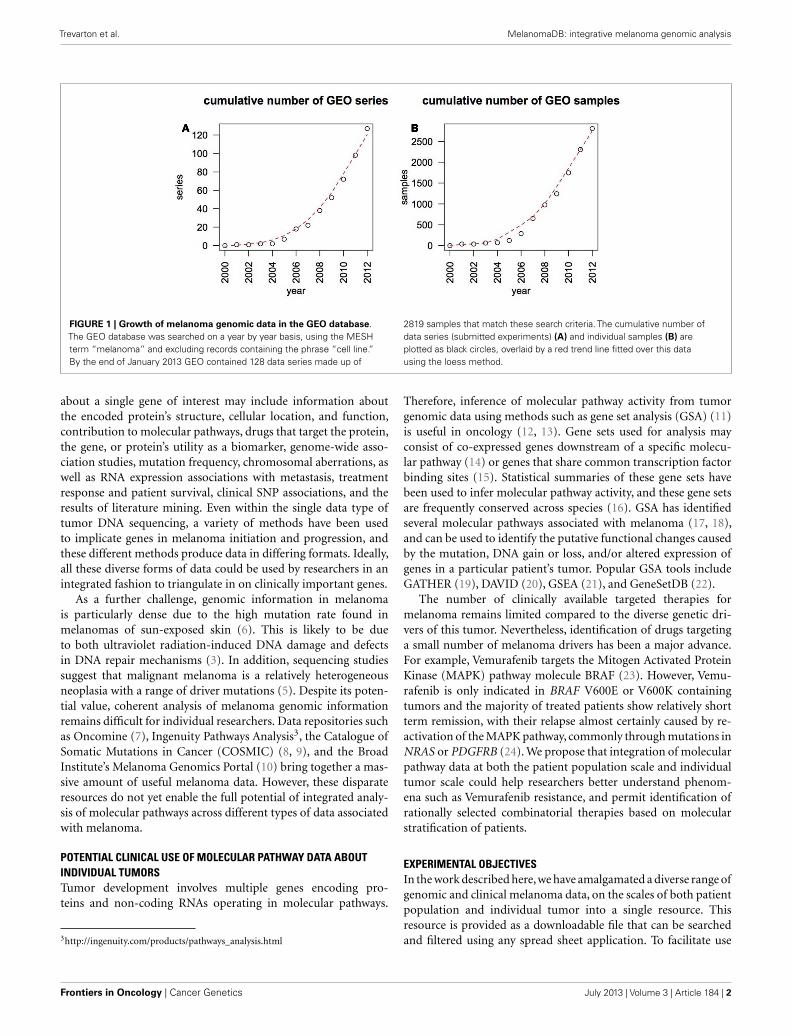
INTRODUCTIONTHE GROWTH AND COMPLEXITY OF MELANOMA GENOMIC DATAMelanoma researchers are faced with a rapidly growing amountof useful molecular and clinical data, particularly gene expressioninformation. This rapid growth can be illustrated by surveyingthe Gene Expression Omnibus (GEO) (1), an international repos-itory that contains a large subset of the published gene expressiondata (Figure 1). Largely based on genomic data, our understand-ing of the genes involved in melanoma progression has advancedfrom focused investigations of candidate genes to studies on awhole-genome scale (2). The advent of next-generation sequenc-ing (NGS) in particular has opened up a floodgate of data, from thepublished sequence of the first melanoma genome in the beginning
of 2010 (3), to more recent whole-exome studies sequencing morethan one hundred tumors (4, 5). Melanoma genomic data is poisedto grow rapidly with the advent of large-scale initiatives such asAustralia’s Melanoma Genome Project1, melanoma analysis in TheCancer Genome Atlas (TCGA) project2 as well as the melanomasequencing projects underway at several individual institutions.
LIMITATIONS OF CURRENT TECHNIQUESUnfortunately, information pertinent to melanoma exists in adiverse range of formats and locations. For example, relevant data
1http://www.melanoma.org.au/research/melanoma-genome-project.html2http://cancergenome.nih.gov
www.frontiersin.org July 2013 | Volume 3 | Article 184 | 1
Trevarton et al. MelanomaDB: integrative melanoma genomic analysis
FIGURE 1 | Growth of melanoma genomic data in the GEO database.The GEO database was searched on a year by year basis, using the MESHterm “melanoma” and excluding records containing the phrase “cell line.”By the end of January 2013 GEO contained 128 data series made up of
2819 samples that match these search criteria. The cumulative number ofdata series (submitted experiments) (A) and individual samples (B) areplotted as black circles, overlaid by a red trend line fitted over this datausing the loess method.
about a single gene of interest may include information aboutthe encoded protein’s structure, cellular location, and function,contribution to molecular pathways, drugs that target the protein,the gene, or protein’s utility as a biomarker, genome-wide asso-ciation studies, mutation frequency, chromosomal aberrations, aswell as RNA expression associations with metastasis, treatmentresponse and patient survival, clinical SNP associations, and theresults of literature mining. Even within the single data type oftumor DNA sequencing, a variety of methods have been usedto implicate genes in melanoma initiation and progression, andthese different methods produce data in differing formats. Ideally,all these diverse forms of data could be used by researchers in anintegrated fashion to triangulate in on clinically important genes.
As a further challenge, genomic information in melanomais particularly dense due to the high mutation rate found inmelanomas of sun-exposed skin (6). This is likely to be dueto both ultraviolet radiation-induced DNA damage and defectsin DNA repair mechanisms (3). In addition, sequencing studiessuggest that malignant melanoma is a relatively heterogeneousneoplasia with a range of driver mutations (5). Despite its poten-tial value, coherent analysis of melanoma genomic informationremains difficult for individual researchers. Data repositories suchas Oncomine (7), Ingenuity Pathways Analysis3, the Catalogue ofSomatic Mutations in Cancer (COSMIC) (8, 9), and the BroadInstitute’s Melanoma Genomics Portal (10) bring together a mas-sive amount of useful melanoma data. However, these disparateresources do not yet enable the full potential of integrated analy-sis of molecular pathways across different types of data associatedwith melanoma.
POTENTIAL CLINICAL USE OF MOLECULAR PATHWAY DATA ABOUTINDIVIDUAL TUMORSTumor development involves multiple genes encoding pro-teins and non-coding RNAs operating in molecular pathways.
3http://ingenuity.com/products/pathways_analysis.html
Therefore, inference of molecular pathway activity from tumorgenomic data using methods such as gene set analysis (GSA) (11)is useful in oncology (12, 13). Gene sets used for analysis mayconsist of co-expressed genes downstream of a specific molecu-lar pathway (14) or genes that share common transcription factorbinding sites (15). Statistical summaries of these gene sets havebeen used to infer molecular pathway activity, and these gene setsare frequently conserved across species (16). GSA has identifiedseveral molecular pathways associated with melanoma (17, 18),and can be used to identify the putative functional changes causedby the mutation, DNA gain or loss, and/or altered expression ofgenes in a particular patient’s tumor. Popular GSA tools includeGATHER (19), DAVID (20), GSEA (21), and GeneSetDB (22).
The number of clinically available targeted therapies formelanoma remains limited compared to the diverse genetic dri-vers of this tumor. Nevertheless, identification of drugs targetinga small number of melanoma drivers has been a major advance.For example, Vemurafenib targets the Mitogen Activated ProteinKinase (MAPK) pathway molecule BRAF (23). However, Vemu-rafenib is only indicated in BRAF V600E or V600K containingtumors and the majority of treated patients show relatively shortterm remission, with their relapse almost certainly caused by re-activation of the MAPK pathway, commonly through mutations inNRAS or PDGFRB (24). We propose that integration of molecularpathway data at both the patient population scale and individualtumor scale could help researchers better understand phenom-ena such as Vemurafenib resistance, and permit identification ofrationally selected combinatorial therapies based on molecularstratification of patients.
EXPERIMENTAL OBJECTIVESIn the work described here,we have amalgamated a diverse range ofgenomic and clinical melanoma data, on the scales of both patientpopulation and individual tumor into a single resource. Thisresource is provided as a downloadable file that can be searchedand filtered using any spread sheet application. To facilitate use
Frontiers in Oncology | Cancer Genetics July 2013 | Volume 3 | Article 184 | 2
Trevarton et al. MelanomaDB: integrative melanoma genomic analysis
of this resource in the context of molecular pathways, we alsoprovide a web-accessible SQL database named MelanomaDB,through which researchers can perform GSA using integratedmelanoma data of several types. A subset of the information inthe database can also be accessed through a freely available webapplication in the Illumina genomic cloud computing platformBaseSpace. While other disease-specific databases exist for othercancers such as lung (25) and ovarian (26) cancer, we know ofno other database similar to ours dealing with melanoma. Fur-thermore, we believe that MelanomaDB’s breadth across sequenceand microarray data, biological and pharmacological gene sets,and pathway information, in addition to its usability and itsmelanoma focus, make it unique. In this paper, we use informa-tion assembled in MelanomaDB in several downstream analysesto demonstrate the utility of this resource for finding relationshipsbetween molecular pathways and clinical parameters, includingthe mutational patterns of members of molecular pathways (27)in individual tumors. We hope this tool will prove increasinglyuseful as it expands when new tumor data becomes available.In particular, we hope that it will provide a context in which tointerpret the tumor molecular profiles of individual melanomapatients.
MATERIALS AND METHODSOVERVIEW OF THE CONSTRUCTION OF MELANOMA GENE SETSTo facilitate an integrative analysis of melanoma information wecombined a variety of melanoma data in the form of gene sets,attempting to collect information for all genes in the genome.These melanoma gene sets were groups of genes that shared bio-logical or clinical relevance for melanoma, derived from five typesof publically available information: drug and biomarker informa-tion, druggability, literature relationship strength, disease-specificsurvival, and somatic mutation data. Drug information includesinformation on compounds and the proteins they target, whileDruggability information comprises of estimations of the degreeto which proteins are amenable to targeting by drugs, and proteincharacteristics relevant to this. A detailed description of this infor-mation is available in Data Sheet 1 in Supplementary Material.
SOURCES OF SPECIFIC INFORMATIONFurther explanations of the gene sets used are in the MelanomaDBhelp page at http://genesetdb.auckland.ac.nz/melanomadb/help.html
Drug and biomarker informationDrug information was taken from online databases DrugBank ver-sion 3 (28), KEGG DRUG (27), Therapeutic Targets Database (29),and ClinicalTrials.gov. Biomarker information was taken frompublished papers by Gould Rothberg et al. (30), Schramm andMann (31), Utikal et al. (85), Mehta et al. (32), and from the data-base KEGG BRITE (27). It should be noted that gene sets such asthose derived from DrugBank include all genes encoding proteinsto which each drug binds, including both intended and unintendedtargets. However, metabolising enzymes, transporters and carrierproteins are excluded. For example, targets of the drug Cetuximabinclude the intended target (the human epidermal growth factorreceptor) but also compliment components and Fc receptors, as is
expected due to the nature of this drug as an antibody4. For fur-ther explanations of the gene sets used see the MelanomaDB helppage at http://genesetdb.auckland.ac.nz/melanomadb/help.html
Druggability informationDruggability data was sourced from the Sophic Integrated Drug-gable Genome Database (33), EBI’s DrugEBIlity database (34), andpublished papers by Li and Lai (35) and Tiedemann et al. (36).Data on protein characteristics relevant to druggability were takenfrom Affymetrix annotations5, and online databases UniProt Con-sortium (37), Secreted Protein Database (38), and KinBase (39).
Literature and genomic data relationship strength informationInformation on Literature Relationship strength was derived fromthe IRIDESCENT (40) and GAMMA (41) software packages.IRIDESCENT searches every published MEDLINE abstract forassociations between objects, and creates a network of tentativerelationships between these objects. Objects encompass genes,diseases, phenotypes, chemical compounds, drugs, and ontol-ogy categories. The relative strength of association between twoobjects is determined by the frequency in which they appear in thesame abstract or sentence. Here, this network is used to score thestrength of association between genes and the terms “melanoma”or “metastatic melanoma.”
GAMMA conducts a meta-analysis of gene expression behav-ior across 16,000 wide-ranging microarray experiments to identifygenes that are consistently and specifically co-expressed across het-erogeneous experimental conditions. In this way GAMMA extendsthe connections in IRIDESCENT’s association network to geneswithout any published associations to melanoma by identifyingwhich of these genes are consistently co-expressed with multipleknown melanoma genes. To date, GAMMA has been used success-fully to identify phenotypes and/or disease relevance for severalpreviously uncharacterized genes (42–45).
Disease-specific survival dataStrength of statistical associations between RNA abundance andmelanoma-specific survival were gathered from several publishedstudies, and from our additional statistical analysis of two pub-lished sets of linked microarray and clinical data. Associationsbetween gene expression in melanomas and patient survival weretaken directly from John et al. (46), Mandruzzato et al. (47), andJourne et al. (48), and associations between gene expression andmetastasis were taken directly from Timar et al. (49). We per-formed our own analyses on the microarray data of Bogunovic etal. (50) and Jönsson et al. (51) based on patient survival data andAffymetrix CEL files retrieved from GEO. The Bogunovic study’sraw Affymetrix data was normalized using RMA normalizationperformed using the affy package in the R statistical software(52). The Illumina data from the Jonsson et al. study was obtainedin a normalized format, however, we removed three patients forwhom patient survival data was missing, and adjusted all microar-ray values by adding the minimum value in order to eliminatenegative values. R was used to split the patients into two groups,
4http://www.drugbank.ca/drugs/DB000025http://www.affymetrix.com/support/technical/annotationfilesmain.affx
www.frontiersin.org July 2013 | Volume 3 | Article 184 | 3
Trevarton et al. MelanomaDB: integrative melanoma genomic analysis
create a survival object for each group and then compare thesetwo survival objects using a Log Rank test. For each probe set thissplitting was performed nine times, once at each RNA abundancedecile across the patient population. R was also used to fit a Coxproportional hazards regression model for each probe set.
To facilitate the use of these data in exploratory analyses forhypothesis generation, we also generated additional gene setsin which we aggregated several different RNA associations withpatient survival to allow broader surveys. For example, four genesets were identified from the expression and survival data ofBogunovic et al. (50) using different statistical criteria.
Somatic variant dataMultiple studies reporting melanoma variants were collated foruse with MelanomaDB. A literature review identified 11 exomesequencing studies suitable for inclusion (4–6, 53–60). In addi-tion, the Cancer Cell Line Encyclopedia (61), and the SangerInstitute’s COSMIC (8, 9), and Matched Pair Cancer Cell Lines(3) were searched for mutations detected in melanoma cell lines.In total, we collected data on 58 established melanoma cell lines,119 primary “short-passage” cell lines, 38 primary tumors, and 96metastatic melanoma tumors. Non-silent variants were reportedin 16,488 genes. With the exception of the 10 samples from the2010 study of Berger et al. (53), and some of the samples fromCOSMIC, these samples have all been paired with matched nor-mal samples to ensure that the variants reported are somatic.In the current iteration of this database only non-synonymouscoding mutations, indels, splice-site mutations, and structuralrearrangements (including gene fusions and read-through tran-scripts) are included. Synonymous coding mutations are notincluded. Presently, this somatic variant data includes more than35,000 non-synonymous coding mutations, and more than 3,500structural rearrangements and indels. We have not provided thissomatic variant data as a supplementary file but instead invitereaders to contact us to obtain the links to this data. We do this sowe can ensure that access permission and ethical issues associatedwith this individual patient data are adhered to.
AMALGAMATION OF ALL DATA INTO GENE SETSTo facilitate the construction of gene sets, all data described abovewas combined into a single matrix, which is available as Data Sheet2 in Supplementary Material. This matrix is gene-based and usesEntrez Gene ID as a unique index for each gene6. Every gene is rep-resented by one row, and each column contains data from a singlesource. Columns annotating genes with references to other data-bases were derived from NCBI’s Gene database FTP directory7 andsupplemented by Affymetrix annotations (see text footnote 5).
From this data matrix, a number of gene sets were derived. Inmost cases, columns of the matrix were converted directly intogene sets by including in that set every gene with an entry in thatcolumn. In some cases, such as statistical associations betweenRNA expression and patient survival, a cut-off was required fordefining gene set membership. For example, only genes encodingproteins with positive DrugEBIlity ensemble scores were included
6http://www.ncbi.nlm.nih.gov/gene, accessed on 30/7/127ftp://ftp.ncbi.nih.gov/gene/DATA/
in the gene set “DrugEBIlity: Positive ensemble scores.” A furtherdescription of the melanoma gene sets is available in Data Sheet 1in Supplementary Material.
SQL DATABASE GENERATIONTo facilitate access, combination, and filtering of different types ofgenomic data related to melanoma, and interpretation of this datain terms of molecular pathways and functional categories, the datamatrix described above was used to generate a web-accessible SQLdatabase named MelanomaDB. The web interface is implementedusing Apache, PHP, Javascript, and HTML. The meta-gene setdatabase GeneSetDB (22) was accessed from within MelanomaDBto identify the intersection between melanoma-specific gene setsand gene sets related to biological functions and molecular path-ways. The R framework was used for statistical calculations. GSAwas performed using the hyper-geometric distribution to calculatethe probability of overrepresentation, followed by multiple testingcorrection using the Benjamini and Hochberg method (62).
BaseSpace APPLICATION PREPARATIONA subset of the information in MelanomaDB is also included ina freely available Illumina BaseSpace application. This BaseSpaceapplication retrieves a tumor and corresponding normal germline sequence pair from the BaseSpace archive or the user’s ownBaseSpace account as vcf files. Then, variants present in the tumorbut the not normal germ line tissue of the patient are identi-fied using the Genome Analysis Tool Kit’s SelectVariants java tool(63). This list of tumor variant genes is identified. Then, themolecular pathways these genes correspond to, along with anystatistically significant pathway enrichment within the list of vari-ant genes and targeting drugs, are retrieved from the GeneSetDBpathway analysis web tool (22). A diagram showing tumor vari-ant genes in the context of molecular pathways is generated usingthe KEGG, Reactome, and Biocarta pathways included in the Rgraphite package (64), and a clustered heatmap showing how thegenetic variants in the sample tumor compare to variants in the310 tumors cataloged in MelanomaDB is generated. This clusteredheatmap is generated: (i) using a modification of the heatmap.2function from the R gtools package (see Data Sheet 5 in Supple-mentary Material) (65), using the “binary” method for distancecalculation and the “single” method for clustering and (ii) as areverse-orientation waterfall plot to illustrate patterns of somaticvariant co-occurrence in melanoma.
ASSEMBLY OF INFORMATION FOR INDIVIDUAL TUMORSFrom the exome and whole-genome sequencing informationassembled above, we constructed a tumor-based matrix in whicheach row was a gene, each column was an individual tumor andeach cell described any somatic variants present in a certain genefor a certain tumor. After duplicated tumors were removed, thissomatic variant data included 310 samples, 183, and 72 of whichhad somatic alterations in the BRAF and NRAS genes, respec-tively. When multiple sequenced tumors or cell lines from the samepatient were available, the union of somatic variants found in thesesamples was used. Links to the papers and their supplementary websites used to construct this tumor-specific somatic variant data isavailable in Data Sheet 3 in Supplementary Material. The authors
Frontiers in Oncology | Cancer Genetics July 2013 | Volume 3 | Article 184 | 4
Trevarton et al. MelanomaDB: integrative melanoma genomic analysis
can assist researchers with the precise sources of information usedto construct this resource.
VISUALIZATIONThe statistical software R was used to construct a clusteredheat map of tumor variants for genes included in the KEGG“Melanoma” signalling pathway with a modified heatmap.2 func-tion of the R package “gplots,”8 using the “binary” method fordistance and the “single” method for clustering. R was also used todraw gene network diagrams. Molecular pathways were obtainedfrom the pathways included in the graphite R package9 and wereplotted using the graphite (see text footnote 9) R package.
The R scripts used to generate Figures 2A–C as well as the path-way diagrams and heatmaps in Figures 4–7 are given in Data Sheet5 in Supplementary Material.
RESULTS AND DISCUSSIONHere we describe the assembly and use of the MelanomaDBdatabase.
ASSEMBLY OF MELANOMA GENOMIC INFORMATION FROM DIVERSESOURCES INTO A MELANOMA DATA MATRIXFirstly, a melanoma data matrix (Data Sheet 2 in Supplemen-tary Material) was constructed, with genes (or genomic lociin some cases) as rows. The columns of this matrix representdiverse features of biological functions related to melanoma andare described in Data Sheet 1 in Supplementary Material. Thismelanoma data matrix can be utilized in a variety of ways. Mostsimply, researchers can access a variety of data pertaining to theirparticular gene of interest. The melanoma data matrix can alsobe manipulated with spread sheet software to sort, find, and filterinformation in order to generate gene lists useful for hypothesisgeneration.
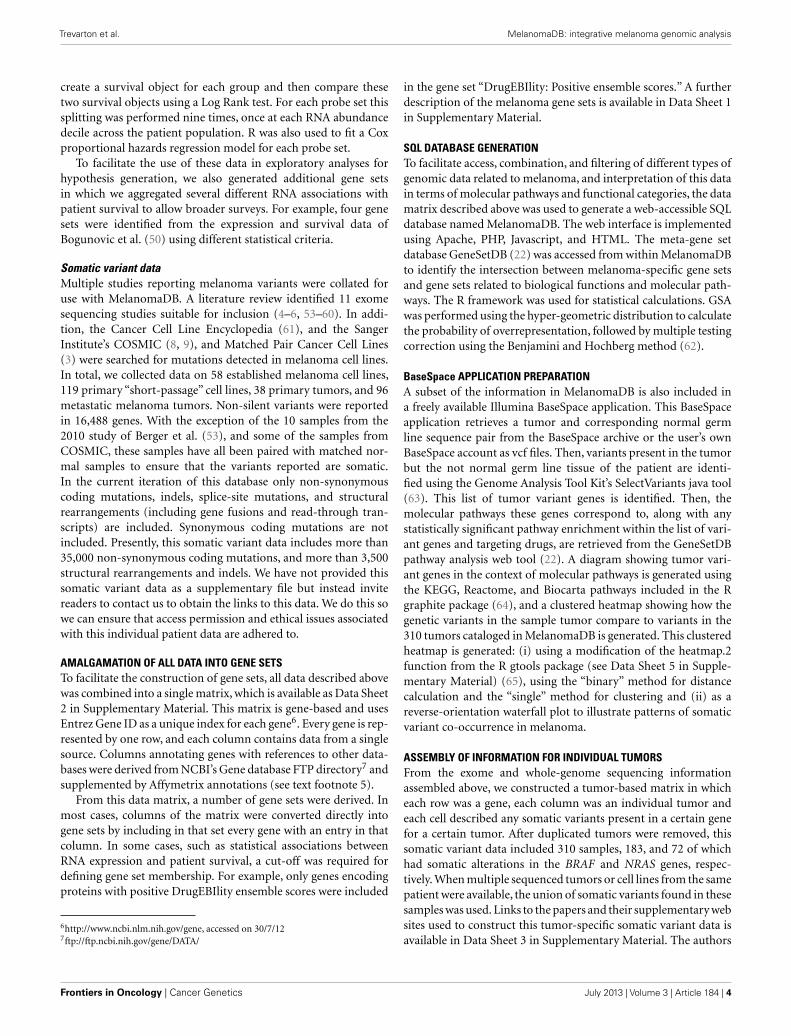
ASSEMBLY OF SOMATIC VARIANT INFORMATION FOR MELANOMAS OFINDIVIDUAL PATIENTSNext, we assembled as much information about somatic varia-tion in individual exome-sequenced and genome-wide-sequencedmelanomas as possible. We gathered information about somaticvariations in 58 established melanoma cell lines, 119 primary“fresh” cell lines, 38 primary tumors, and 96 metastatic melanomatumors, which was appended to the information matrix describedabove (Data Sheet 3 in Supplementary Material, Tab “TablesUsed”). Information about non-synonymous coding mutations,structural rearrangements, and indels was included (intronic andsynonymous coding mutations were excluded from the currentiteration of this data resource). The information contained in DataSheet 2 in Supplementary Material was read into the statisticalenvironment R and visualized, as described in the Section “Mate-rials and Methods” and Data Sheet 5 in Supplementary Material.Firstly, the distribution of somatic variations for individual genes isshown in Figure 2A. The majority of genes showed somatic varia-tions in only small numbers of tumors. Comparison of each gene’stotal exon length versus the number of tumors with a mutation in
8http://cran.r-project.org/web/packages/gplots/index.html9http://www.bioconductor.org/packages/release/bioc/html/graphite.html
FIGURE 2 | (A) The distribution of the number of tumors with somaticalterations in each individual gene. (B) Each gene’s total exon length in basepairs (y -axis) versus the number of the 310 tumors with a mutation in thatgene (x -axis). (C) The distribution of the number of genes with somaticalterations in each individual tumor.
that gene using R (Figure 2B), revealed a statistically significant butweak correlation between somatic variation frequency and totalexon length (Pearson’s correlation coefficient= 0.47, p≤ 0.001).Although variations in large genes such as Titan (TTN ) have been
www.frontiersin.org July 2013 | Volume 3 | Article 184 | 5
Trevarton et al. MelanomaDB: integrative melanoma genomic analysis
implicated as cancer drivers, these may also occur in so manymelanomas due to large gene size increasing the likelihood of pas-senger mutations. However, the BRAF gene clearly stands out asfrequently mutated in melanomas despite its moderate length. Thedistribution of the number of genes with somatic alterations ineach individual tumor was performed using R and is shown inFigure 2C.
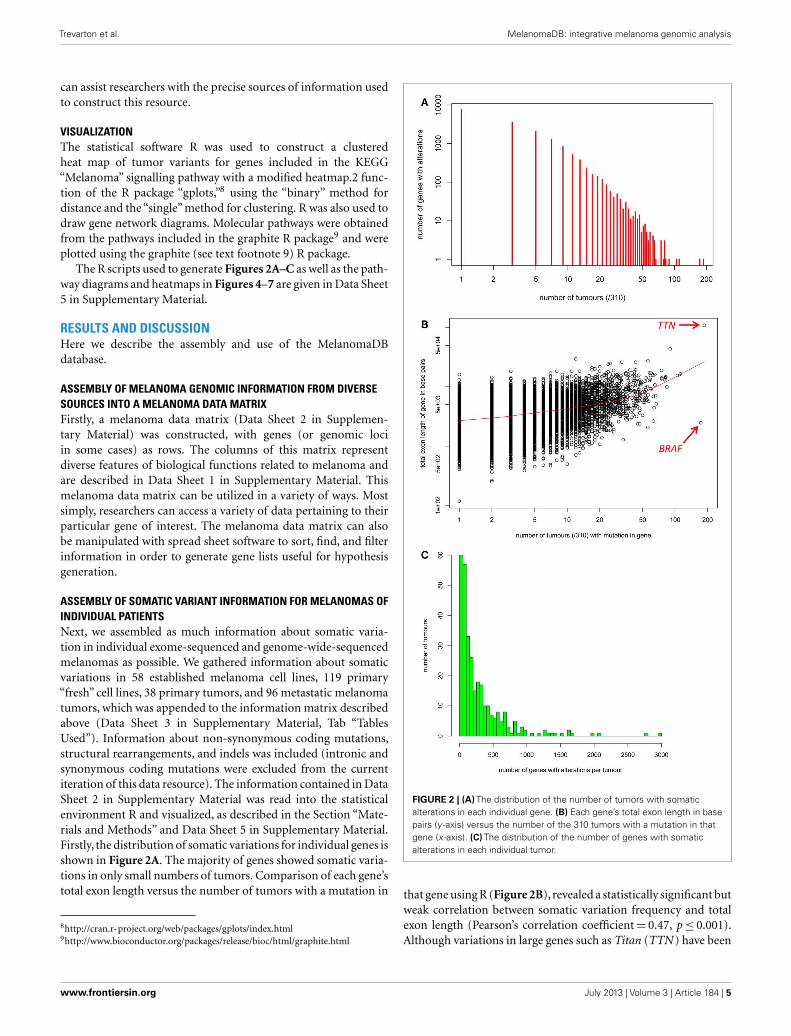
USE OF THE COMBINED MELANOMA INFORMATIONAs an example of using the information assembled above, anapproach to identifying novel candidate novel drug targets formelanoma using this melanoma data matrix (Data Sheet 2 inSupplementary Material) can be performed by filtering and sort-ing Data Sheet 2 in Supplementary Material in a spreadsheetapplication and is described in Figure 3.
This process generates a short list of 129 genes that can be exam-ined more closely in order to select a final list of genes that maywarrant investigation in the laboratory. A variant on this approachmay be to place more weight on particular data, for example, onselected druggability measures. By using a spreadsheet applicationto take the 987 genes in Data Sheet 2 in Supplementary Mater-ial encoding proteins that have scored greater than 0.5 on eitherDrugEBIlity’s Ensemble score or Li and Lai’s druggability measure,and eliminating proteins already targeted by existing drugs, wehave a list of 803 genes that are predicted to be probably druggable.Of these, 21 also have high RNA expression significantly associatedwith reduced disease-free survival in melanoma patients, makingthem possible new drug targets. These genes are AKR7A2,AKR7A3,ARIH1, ARPC1A, CD163, DCT, DHRS11, DUS4L, FAH, FSCN1,HS3ST3A1, NRAS, NUP155, PANK2, PRMT3, QTRT1, RAD1,RAE1, SUV39H2, UPP1, USP13. It is interesting to see NRAS onthis list, which is a potential melanoma drug candidate but hasproved remarkably resistant to drug development efforts to date(66). CD163 expression on melanoma-infiltrating macrophageshas been suggested as a prognostic marker in melanoma (67).
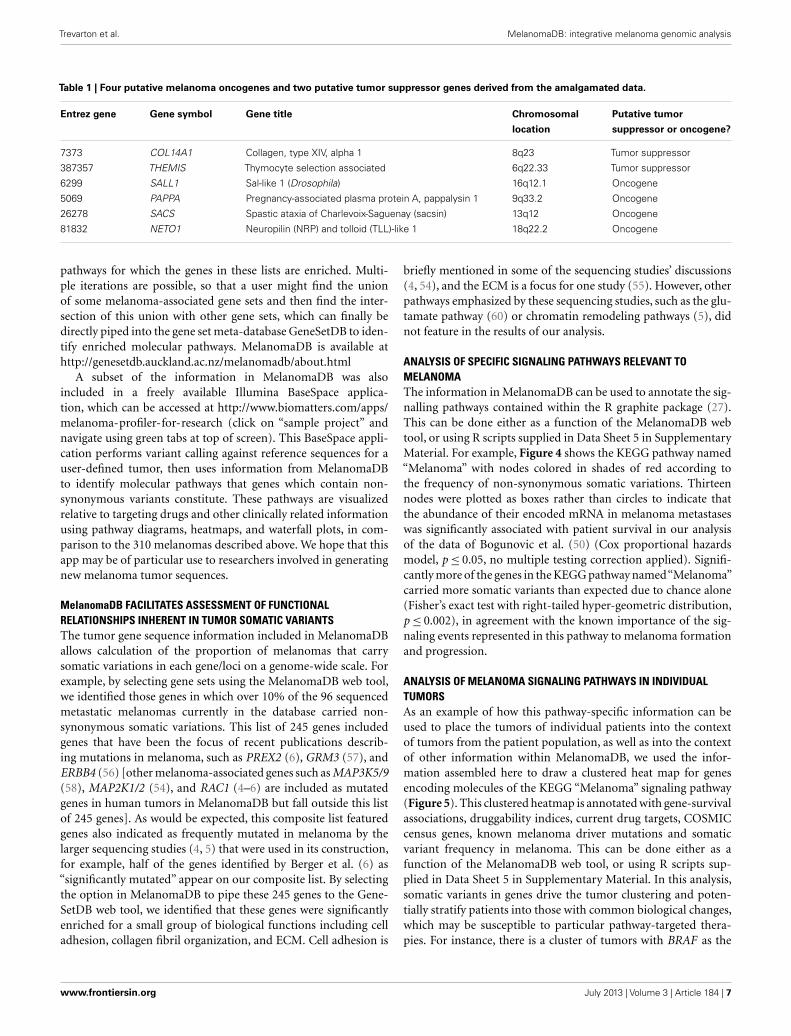
Similarly, a list of putative melanoma tumor suppressor genesor melanoma oncogenes can be generated using a spreadsheetapplication from this melanoma data matrix (Data Sheet 2 in Sup-plementary Material). For example, a list consisting of genes thatare mutated in more than 10% of melanoma metastases and haveshorter melanoma-free patient survival associated with their low(putative tumor suppressor) or high (oncogene) RNA expression.Known tumor suppressors and oncogenes that were identifiedby this strategy (NRAS, KIT, and WNT family members) wereremoved. This list of putative melanoma tumor suppressors andoncogenes that remains is shown in Table 1.
Combined melanoma information with gene set analysisCombining this assembled melanoma information with statisticalGSA can potentially provide additional insights. For example, witha spreadsheet application we could generate a list of 245 genes fromData Sheet 2 in Supplementary Material that have coding regionmutations in more than 10% of melanoma metastases, and subjectthis list to gene set enrichment analysis in order to identify bio-logical functions that may be commonly disrupted in melanoma.When submitted to the web tool GeneSetDB (a meta-database ofbiologically relevant sets of genes) for enrichment analysis (with
FIGURE 3 | An example of a process through which the melanomadata matrix (Data Sheet 2 in Supplementary Material) can be used togenerate a short list of putative drug targets. The initial gene list consistsof those genes in the melanoma data matrix (Data Sheet 2 inSupplementary Material) that have an entry in any of the columnsdescribing the data of the studies of Jönsson et al. (51), John et al. (46),Mandruzzato et al. (47), Journe et al. (48), or Bogunovic et al. (50). (Pleasenote that this example is for use with the data matrix in Data Sheet 2 inSupplementary Material, rather than for the MelanomaDB web tool).
false discovery rate set to 0.01), this list of 245 genes was found to besignificantly enriched for several gene sets including sets associatedwith the extracellular matrix (ECM), cell adhesion, and collagenfibril organization. We encourage users to use a spreadsheet appli-cation and simple web tools such as GeneSetDB to perform theirown exploration of Data Sheet 2 in Supplementary Material.
ASSEMBLY OF MelanomaDB – A WEB-ACCESSIBLE GENOMICMELANOMA SQL DATABASE, AND OF A CORRESPONDING BaseSpaceAPPIn order to make use of this assembly of melanoma informationand its regular updating easier, we converted this melanoma datamatrix (Data Sheet 2 in Supplementary Material) into a web-accessible SQL database. This database, named MelanomaDB,features melanoma gene sets derived from Data Sheet 2 in Supple-mentary Material and directly links into a molecular pathway/GSAmeta-database previously generated by our research group namedGeneSetDB (22). Using MelanomaDB, a user can easily find theunion or intersection between any number of melanoma genesets (taken from the columns of Data Sheet 2 in SupplementaryMaterial) and also their own user-submitted gene lists (copiedand pasted, or uploaded from a file, using any of over 50 types ofcommonly used gene identifier), then interrogate the molecular
Frontiers in Oncology | Cancer Genetics July 2013 | Volume 3 | Article 184 | 6
Trevarton et al. MelanomaDB: integrative melanoma genomic analysis
Table 1 | Four putative melanoma oncogenes and two putative tumor suppressor genes derived from the amalgamated data.
Entrez gene Gene symbol Gene title Chromosomal
location
Putative tumor
suppressor or oncogene?
7373 COL14A1 Collagen, type XIV, alpha 1 8q23 Tumor suppressor
387357 THEMIS Thymocyte selection associated 6q22.33 Tumor suppressor
6299 SALL1 Sal-like 1 (Drosophila) 16q12.1 Oncogene
5069 PAPPA Pregnancy-associated plasma protein A, pappalysin 1 9q33.2 Oncogene
26278 SACS Spastic ataxia of Charlevoix-Saguenay (sacsin) 13q12 Oncogene
81832 NETO1 Neuropilin (NRP) and tolloid (TLL)-like 1 18q22.2 Oncogene
pathways for which the genes in these lists are enriched. Multi-ple iterations are possible, so that a user might find the unionof some melanoma-associated gene sets and then find the inter-section of this union with other gene sets, which can finally bedirectly piped into the gene set meta-database GeneSetDB to iden-tify enriched molecular pathways. MelanomaDB is available athttp://genesetdb.auckland.ac.nz/melanomadb/about.html
A subset of the information in MelanomaDB was alsoincluded in a freely available Illumina BaseSpace applica-tion, which can be accessed at http://www.biomatters.com/apps/melanoma-profiler-for-research (click on “sample project” andnavigate using green tabs at top of screen). This BaseSpace appli-cation performs variant calling against reference sequences for auser-defined tumor, then uses information from MelanomaDBto identify molecular pathways that genes which contain non-synonymous variants constitute. These pathways are visualizedrelative to targeting drugs and other clinically related informationusing pathway diagrams, heatmaps, and waterfall plots, in com-parison to the 310 melanomas described above. We hope that thisapp may be of particular use to researchers involved in generatingnew melanoma tumor sequences.
MelanomaDB FACILITATES ASSESSMENT OF FUNCTIONALRELATIONSHIPS INHERENT IN TUMOR SOMATIC VARIANTSThe tumor gene sequence information included in MelanomaDBallows calculation of the proportion of melanomas that carrysomatic variations in each gene/loci on a genome-wide scale. Forexample, by selecting gene sets using the MelanomaDB web tool,we identified those genes in which over 10% of the 96 sequencedmetastatic melanomas currently in the database carried non-synonymous somatic variations. This list of 245 genes includedgenes that have been the focus of recent publications describ-ing mutations in melanoma, such as PREX2 (6), GRM3 (57), andERBB4 (56) [other melanoma-associated genes such as MAP3K5/9(58), MAP2K1/2 (54), and RAC1 (4–6) are included as mutatedgenes in human tumors in MelanomaDB but fall outside this listof 245 genes]. As would be expected, this composite list featuredgenes also indicated as frequently mutated in melanoma by thelarger sequencing studies (4, 5) that were used in its construction,for example, half of the genes identified by Berger et al. (6) as“significantly mutated” appear on our composite list. By selectingthe option in MelanomaDB to pipe these 245 genes to the Gene-SetDB web tool, we identified that these genes were significantlyenriched for a small group of biological functions including celladhesion, collagen fibril organization, and ECM. Cell adhesion is
briefly mentioned in some of the sequencing studies’ discussions(4, 54), and the ECM is a focus for one study (55). However, otherpathways emphasized by these sequencing studies, such as the glu-tamate pathway (60) or chromatin remodeling pathways (5), didnot feature in the results of our analysis.
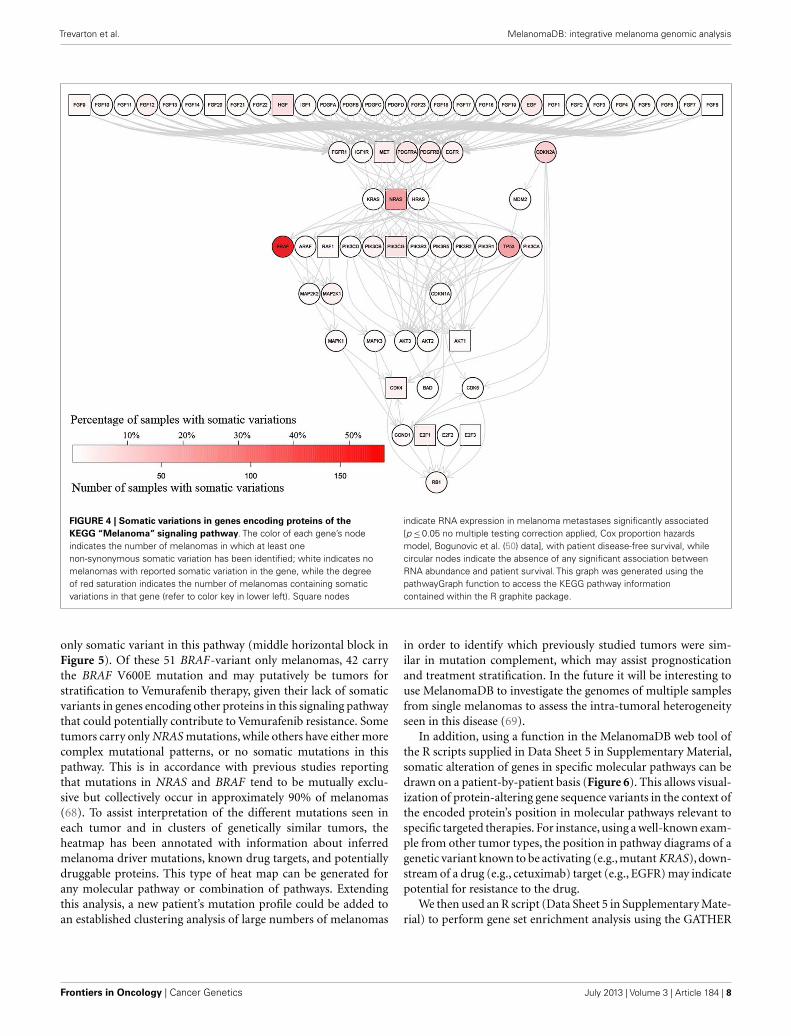
ANALYSIS OF SPECIFIC SIGNALING PATHWAYS RELEVANT TOMELANOMAThe information in MelanomaDB can be used to annotate the sig-nalling pathways contained within the R graphite package (27).This can be done either as a function of the MelanomaDB webtool, or using R scripts supplied in Data Sheet 5 in SupplementaryMaterial. For example, Figure 4 shows the KEGG pathway named“Melanoma” with nodes colored in shades of red according tothe frequency of non-synonymous somatic variations. Thirteennodes were plotted as boxes rather than circles to indicate thatthe abundance of their encoded mRNA in melanoma metastaseswas significantly associated with patient survival in our analysisof the data of Bogunovic et al. (50) (Cox proportional hazardsmodel, p≤ 0.05, no multiple testing correction applied). Signifi-cantly more of the genes in the KEGG pathway named“Melanoma”carried more somatic variants than expected due to chance alone(Fisher’s exact test with right-tailed hyper-geometric distribution,p≤ 0.002), in agreement with the known importance of the sig-naling events represented in this pathway to melanoma formationand progression.
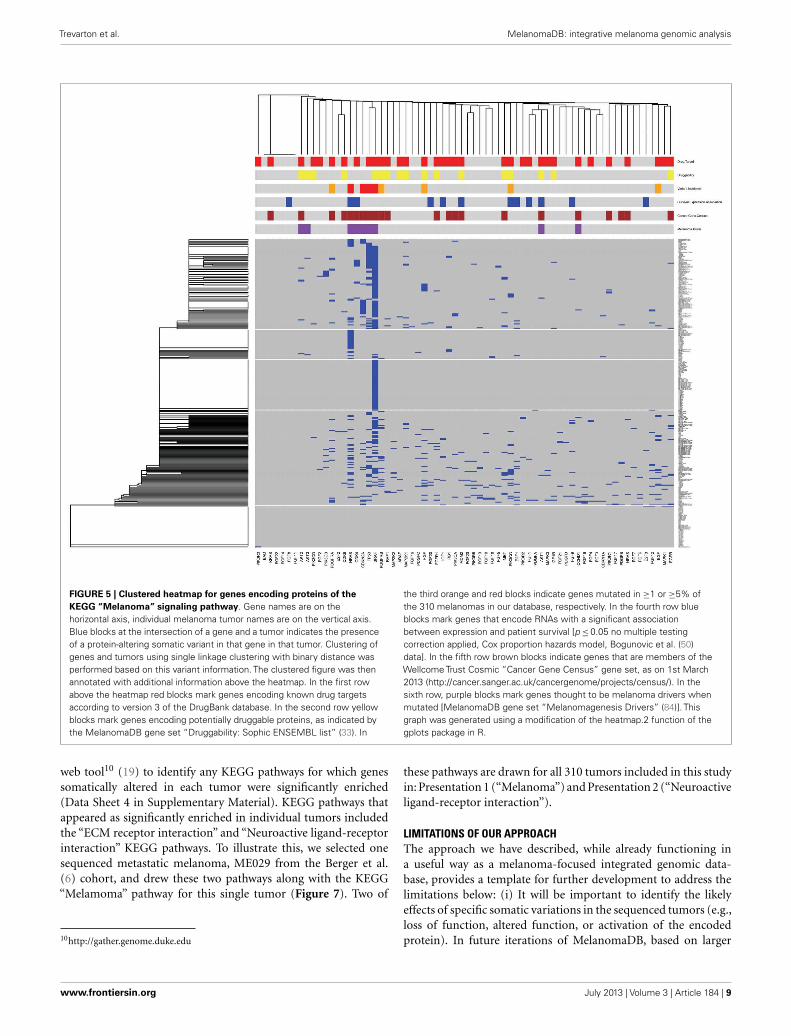
ANALYSIS OF MELANOMA SIGNALING PATHWAYS IN INDIVIDUALTUMORSAs an example of how this pathway-specific information can beused to place the tumors of individual patients into the contextof tumors from the patient population, as well as into the contextof other information within MelanomaDB, we used the infor-mation assembled here to draw a clustered heat map for genesencoding molecules of the KEGG “Melanoma” signaling pathway(Figure 5). This clustered heatmap is annotated with gene-survivalassociations, druggability indices, current drug targets, COSMICcensus genes, known melanoma driver mutations and somaticvariant frequency in melanoma. This can be done either as afunction of the MelanomaDB web tool, or using R scripts sup-plied in Data Sheet 5 in Supplementary Material. In this analysis,somatic variants in genes drive the tumor clustering and poten-tially stratify patients into those with common biological changes,which may be susceptible to particular pathway-targeted thera-pies. For instance, there is a cluster of tumors with BRAF as the
www.frontiersin.org July 2013 | Volume 3 | Article 184 | 7
Trevarton et al. MelanomaDB: integrative melanoma genomic analysis
FIGURE 4 | Somatic variations in genes encoding proteins of theKEGG “Melanoma” signaling pathway. The color of each gene’s nodeindicates the number of melanomas in which at least onenon-synonymous somatic variation has been identified; white indicates nomelanomas with reported somatic variation in the gene, while the degreeof red saturation indicates the number of melanomas containing somaticvariations in that gene (refer to color key in lower left). Square nodes
indicate RNA expression in melanoma metastases significantly associated[p≤0.05 no multiple testing correction applied, Cox proportion hazardsmodel, Bogunovic et al. (50) data], with patient disease-free survival, whilecircular nodes indicate the absence of any significant association betweenRNA abundance and patient survival. This graph was generated using thepathwayGraph function to access the KEGG pathway informationcontained within the R graphite package.
only somatic variant in this pathway (middle horizontal block inFigure 5). Of these 51 BRAF-variant only melanomas, 42 carrythe BRAF V600E mutation and may putatively be tumors forstratification to Vemurafenib therapy, given their lack of somaticvariants in genes encoding other proteins in this signaling pathwaythat could potentially contribute to Vemurafenib resistance. Sometumors carry only NRAS mutations, while others have either morecomplex mutational patterns, or no somatic mutations in thispathway. This is in accordance with previous studies reportingthat mutations in NRAS and BRAF tend to be mutually exclu-sive but collectively occur in approximately 90% of melanomas(68). To assist interpretation of the different mutations seen ineach tumor and in clusters of genetically similar tumors, theheatmap has been annotated with information about inferredmelanoma driver mutations, known drug targets, and potentiallydruggable proteins. This type of heat map can be generated forany molecular pathway or combination of pathways. Extendingthis analysis, a new patient’s mutation profile could be added toan established clustering analysis of large numbers of melanomas
in order to identify which previously studied tumors were sim-ilar in mutation complement, which may assist prognosticationand treatment stratification. In the future it will be interesting touse MelanomaDB to investigate the genomes of multiple samplesfrom single melanomas to assess the intra-tumoral heterogeneityseen in this disease (69).
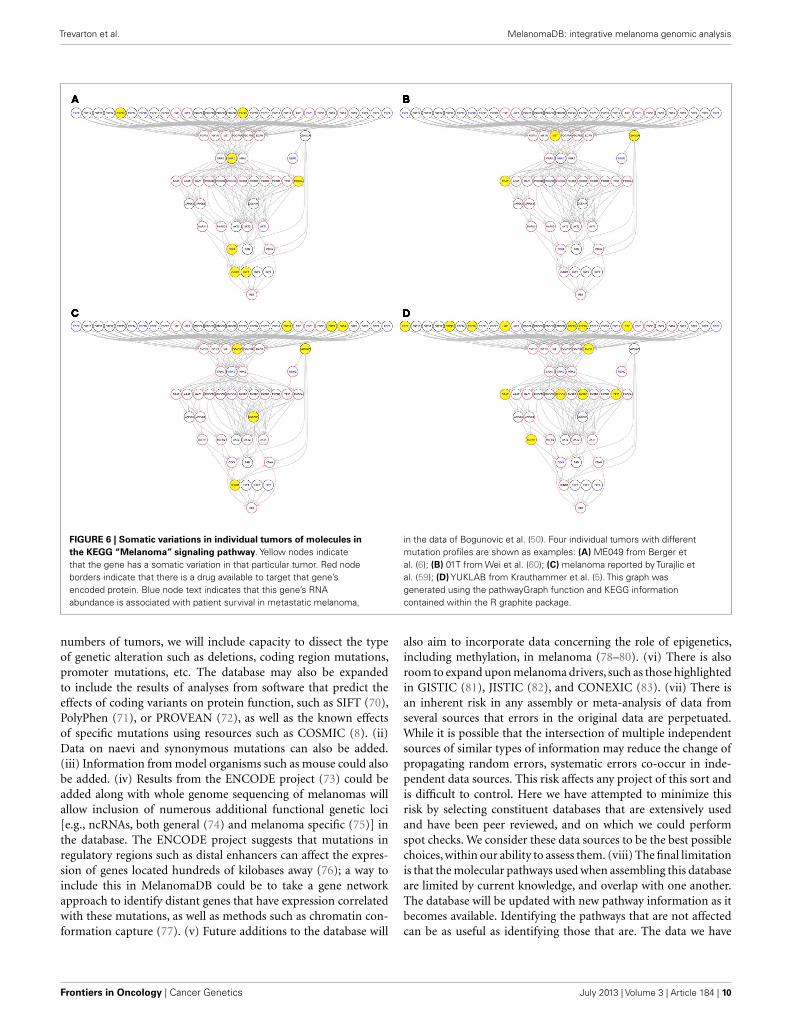
In addition, using a function in the MelanomaDB web tool ofthe R scripts supplied in Data Sheet 5 in Supplementary Material,somatic alteration of genes in specific molecular pathways can bedrawn on a patient-by-patient basis (Figure 6). This allows visual-ization of protein-altering gene sequence variants in the context ofthe encoded protein’s position in molecular pathways relevant tospecific targeted therapies. For instance, using a well-known exam-ple from other tumor types, the position in pathway diagrams of agenetic variant known to be activating (e.g., mutant KRAS), down-stream of a drug (e.g., cetuximab) target (e.g., EGFR) may indicatepotential for resistance to the drug.
We then used an R script (Data Sheet 5 in Supplementary Mate-rial) to perform gene set enrichment analysis using the GATHER
Frontiers in Oncology | Cancer Genetics July 2013 | Volume 3 | Article 184 | 8
Trevarton et al. MelanomaDB: integrative melanoma genomic analysis
FIGURE 5 | Clustered heatmap for genes encoding proteins of theKEGG “Melanoma” signaling pathway. Gene names are on thehorizontal axis, individual melanoma tumor names are on the vertical axis.Blue blocks at the intersection of a gene and a tumor indicates the presenceof a protein-altering somatic variant in that gene in that tumor. Clustering ofgenes and tumors using single linkage clustering with binary distance wasperformed based on this variant information. The clustered figure was thenannotated with additional information above the heatmap. In the first rowabove the heatmap red blocks mark genes encoding known drug targetsaccording to version 3 of the DrugBank database. In the second row yellowblocks mark genes encoding potentially druggable proteins, as indicated bythe MelanomaDB gene set “Druggability: Sophic ENSEMBL list” (33). In
the third orange and red blocks indicate genes mutated in ≥1 or ≥5% ofthe 310 melanomas in our database, respectively. In the fourth row blueblocks mark genes that encode RNAs with a significant associationbetween expression and patient survival [p≤0.05 no multiple testingcorrection applied, Cox proportion hazards model, Bogunovic et al. (50)data]. In the fifth row brown blocks indicate genes that are members of theWellcome Trust Cosmic “Cancer Gene Census” gene set, as on 1st March2013 (http://cancer.sanger.ac.uk/cancergenome/projects/census/). In thesixth row, purple blocks mark genes thought to be melanoma drivers whenmutated [MelanomaDB gene set “Melanomagenesis Drivers” (84)]. Thisgraph was generated using a modification of the heatmap.2 function of thegplots package in R.
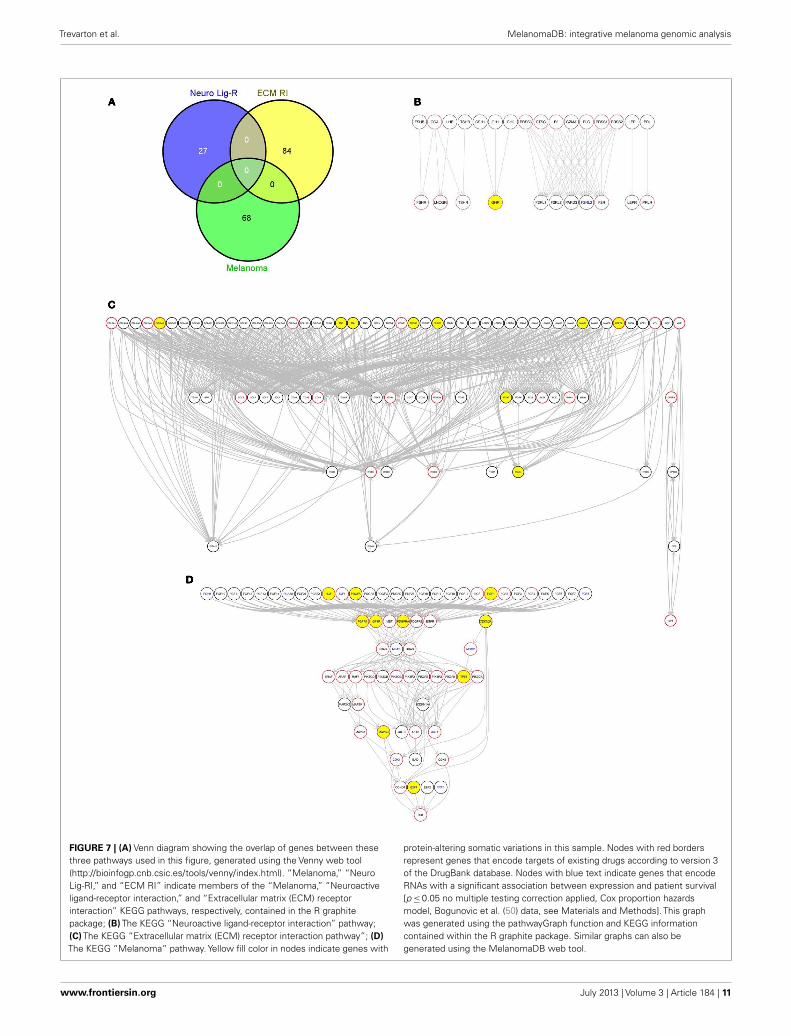
web tool10 (19) to identify any KEGG pathways for which genessomatically altered in each tumor were significantly enriched(Data Sheet 4 in Supplementary Material). KEGG pathways thatappeared as significantly enriched in individual tumors includedthe “ECM receptor interaction” and “Neuroactive ligand-receptorinteraction” KEGG pathways. To illustrate this, we selected onesequenced metastatic melanoma, ME029 from the Berger et al.(6) cohort, and drew these two pathways along with the KEGG“Melamoma” pathway for this single tumor (Figure 7). Two of
10http://gather.genome.duke.edu
these pathways are drawn for all 310 tumors included in this studyin: Presentation 1 (“Melanoma”) and Presentation 2 (“Neuroactiveligand-receptor interaction”).
LIMITATIONS OF OUR APPROACHThe approach we have described, while already functioning ina useful way as a melanoma-focused integrated genomic data-base, provides a template for further development to address thelimitations below: (i) It will be important to identify the likelyeffects of specific somatic variations in the sequenced tumors (e.g.,loss of function, altered function, or activation of the encodedprotein). In future iterations of MelanomaDB, based on larger
www.frontiersin.org July 2013 | Volume 3 | Article 184 | 9
Trevarton et al. MelanomaDB: integrative melanoma genomic analysis
FIGURE 6 | Somatic variations in individual tumors of molecules inthe KEGG “Melanoma” signaling pathway. Yellow nodes indicatethat the gene has a somatic variation in that particular tumor. Red nodeborders indicate that there is a drug available to target that gene’sencoded protein. Blue node text indicates that this gene’s RNAabundance is associated with patient survival in metastatic melanoma,
in the data of Bogunovic et al. (50). Four individual tumors with differentmutation profiles are shown as examples: (A) ME049 from Berger etal. (6); (B) 01T from Wei et al. (60); (C) melanoma reported by Turajlic etal. (59); (D) YUKLAB from Krauthammer et al. (5). This graph wasgenerated using the pathwayGraph function and KEGG informationcontained within the R graphite package.
numbers of tumors, we will include capacity to dissect the typeof genetic alteration such as deletions, coding region mutations,promoter mutations, etc. The database may also be expandedto include the results of analyses from software that predict theeffects of coding variants on protein function, such as SIFT (70),PolyPhen (71), or PROVEAN (72), as well as the known effectsof specific mutations using resources such as COSMIC (8). (ii)Data on naevi and synonymous mutations can also be added.(iii) Information from model organisms such as mouse could alsobe added. (iv) Results from the ENCODE project (73) could beadded along with whole genome sequencing of melanomas willallow inclusion of numerous additional functional genetic loci[e.g., ncRNAs, both general (74) and melanoma specific (75)] inthe database. The ENCODE project suggests that mutations inregulatory regions such as distal enhancers can affect the expres-sion of genes located hundreds of kilobases away (76); a way toinclude this in MelanomaDB could be to take a gene networkapproach to identify distant genes that have expression correlatedwith these mutations, as well as methods such as chromatin con-formation capture (77). (v) Future additions to the database will
also aim to incorporate data concerning the role of epigenetics,including methylation, in melanoma (78–80). (vi) There is alsoroom to expand upon melanoma drivers, such as those highlightedin GISTIC (81), JISTIC (82), and CONEXIC (83). (vii) There isan inherent risk in any assembly or meta-analysis of data fromseveral sources that errors in the original data are perpetuated.While it is possible that the intersection of multiple independentsources of similar types of information may reduce the change ofpropagating random errors, systematic errors co-occur in inde-pendent data sources. This risk affects any project of this sort andis difficult to control. Here we have attempted to minimize thisrisk by selecting constituent databases that are extensively usedand have been peer reviewed, and on which we could performspot checks. We consider these data sources to be the best possiblechoices, within our ability to assess them. (viii) The final limitationis that the molecular pathways used when assembling this databaseare limited by current knowledge, and overlap with one another.The database will be updated with new pathway information as itbecomes available. Identifying the pathways that are not affectedcan be as useful as identifying those that are. The data we have
Frontiers in Oncology | Cancer Genetics July 2013 | Volume 3 | Article 184 | 10
Trevarton et al. MelanomaDB: integrative melanoma genomic analysis
FIGURE 7 | (A) Venn diagram showing the overlap of genes between thesethree pathways used in this figure, generated using the Venny web tool(http://bioinfogp.cnb.csic.es/tools/venny/index.html). “Melanoma,” “NeuroLig-RI,” and “ECM RI” indicate members of the “Melanoma,” “Neuroactiveligand-receptor interaction,” and “Extracellular matrix (ECM) receptorinteraction” KEGG pathways, respectively, contained in the R graphitepackage; (B) The KEGG “Neuroactive ligand-receptor interaction” pathway;(C) The KEGG “Extracellular matrix (ECM) receptor interaction pathway”; (D)The KEGG “Melanoma” pathway. Yellow fill color in nodes indicate genes with
protein-altering somatic variations in this sample. Nodes with red bordersrepresent genes that encode targets of existing drugs according to version 3of the DrugBank database. Nodes with blue text indicate genes that encodeRNAs with a significant association between expression and patient survival[p≤0.05 no multiple testing correction applied, Cox proportion hazardsmodel, Bogunovic et al. (50) data, see Materials and Methods]. This graphwas generated using the pathwayGraph function and KEGG informationcontained within the R graphite package. Similar graphs can also begenerated using the MelanomaDB web tool.
www.frontiersin.org July 2013 | Volume 3 | Article 184 | 11
Trevarton et al. MelanomaDB: integrative melanoma genomic analysis
generated using literature relationships with the IRREDESCENTand GAMMA methods has not been experimentally verified andis intended primarily for hypothesis generating.
CONCLUSIONWe have brought together a large collection of melanoma genomicdata of several types from published studies and publicly availabledatasets into an easily utilized data matrix that can be analyzedusing a spread sheet application. We also assembled data on tumorsfrom individual patients. We then incorporated this informa-tion into a web-accessible SQL database, MelanomaDB, whichresearchers can use to perform molecular pathway and GSA ofmelanoma genomic data, and into a BaseSpace application. Byway of illustration, we used this information to analyze the muta-tional and expression patterns of genes encoding proteins in spe-cific directional signaling pathways within individual tumors, andannotated these visualizations with information about existingdrugs, druggability, associations between RNA expression and sur-vival, and driver mutations. We hope that this resource will proveincreasingly useful when it expands as new tumor data becomesavailable. In particular, we hope it may provide a context in whichto interpret the melanoma molecular profiles of new patients as
well as patient-specific molecular pathway disruption. We havedemonstrated possible uses of this integrated information, andencourage melanoma researchers to employ these resources.
ACKNOWLEDGMENTSThe databases from which data was gathered are available for freenon-commercial use and we would like to thank their creators.The authors would like to acknowledge Ben Lawrence, NicholasKnowlton, Gavin Harris, Michael Findlay, John McCall, Debo-rah Wright, Arend Merrie, Nooriyah Poonawala, Matthew Landry,Reuben Broom, Brett Amundson, and Sunali Mehta for their gen-erous advice and feedback over the period of this work. AlexanderTrevarton was supported by a University of Auckland DoctoralScholarship. The researchers wish to acknowledge the generoussupport of The Maurice Wilkins Centre, The Health ResearchCouncil of New Zealand, and also NIH grant #1P20GM103636(to Jonathan Wren).
SUPPLEMENTARY MATERIALThe Supplementary Material for this article can be foundonline at http://www.frontiersin.org/Cancer_Genetics/10.3389/fonc.2013.00184/abstract
REFERENCES1. Barrett T, Troup DB, Wilhite SE,
Ledoux P, Rudnev D, Evange-lista C, et al. NCBI GEO: archivefor high-throughput functionalgenomic data. Nucleic Acids Res(2009) 37(Database issue):D885–90. doi:10.1093/nar/gkn764
2. Walia V, Mu EW, Lin JC, SamuelsY. Delving into somatic varia-tion in sporadic melanoma. Pig-ment Cell Melanoma Res (2012)25(2):155–70. doi:10.1111/j.1755-148X.2012.00976.x
3. Pleasance ED, Cheetham RK,Stephens PJ, McBride DJ,Humphray SJ, Greenman CD,et al. A comprehensive cata-logue of somatic mutationsfrom a human cancer genome.Nature (2010) 463(7278):191–6.doi:10.1038/nature08658
4. Hodis E, Watson IR, KryukovGV, Arold ST, Imielinski M,Theurillat JP, et al. A landscape ofdriver mutations in melanoma.Cell (2012) 150(2):251–63.doi:10.1016/j.cell.2012.06.024
5. Krauthammer M, Kong Y, Ha BH,Evans P, Bacchiocchi A, McCuskerJP, et al. Exome sequencingidentifies recurrent somatic RAC1mutations in melanoma. NatGenet (2012) 44(9):1006–14.doi:10.1038/ng.2359
6. Berger MF, Hodis E, HeffernanTP, Deribe YL, Lawrence MS,Protopopov A, et al. Melanoma
genome sequencing revealsfrequent PREX2 mutations.Nature (2012) 485(7399):502–6.doi:10.1038/nature11071
7. Rhodes DR, Kalyana-Sundaram S,Mahavisno V, Varambally R, YuJ, Briggs BB, et al. Oncomine3.0: genes, pathways, and net-works in a collection of 18,000cancer gene expression profiles.Neoplasia (2007) 9(2):166–80.doi:10.1593/neo.07112
8. Forbes SA, Bindal N, BamfordS, Cole C, Kok CY, Beare D,et al. COSMIC: mining com-plete cancer genomes in theCatalogue of Somatic Mutationsin Cancer. Nucleic Acids Res(2011) 39(Database issue):D945–50. doi:10.1093/nar/gkq929
9. Forbes SA, Bhamra G, BamfordS, Dawson E, Kok C, Clements J,et al., The Catalogue of SomaticMutations in Cancer (COSMIC).Curr Protoc Hum Genet (2008)57:10.11.1–10.11.26. doi:10.1002/0471142905.hg1011s57
10. Lin WM, Baker AC, BeroukhimR, Winckler W, Feng W, MarmionJM, et al. Modeling genomicdiversity and tumor dependencyin malignant melanoma. Can-cer Res (2008) 68(3):664–73.doi:10.1158/0008-5472.CAN-07-2615
11. Song S, Black MA. Microarray-based gene set analysis: acomparison of current methods.
BMC Bioinformatics (2008) 9:502.doi:10.1186/1471-2105-9-502
12. Heiser LM, Sadanandam A,Kuo WL, Benz SC, GoldsteinTC, Ng S, et al. Subtype andpathway specific responses toanticancer compounds in breastcancer. Proc Natl Acad Sci US A (2012) 109(8):2724–9.doi:10.1073/pnas.1018854108
13. Gatza ML, Lucas JE, BarryWT, Kim JW, Wang Q, Craw-ford MD, et al. A pathway-based classification of humanbreast cancer. Proc Natl Acad SciU S A (2010) 107(15):6994–9.doi:10.1073/pnas.0912708107
14. Obayashi T, Kinoshita K. Rank ofcorrelation coefficient as a compa-rable measure for biological sig-nificance of gene coexpression.DNA Res (2009) 16(5):249–60.doi:10.1093/dnares/dsp016
15. Hatanaka Y, Nagasaki M, Yam-aguchi R, Obayashi T, NumataK, Fujita A, et al. A novelstrategy to search conservedtranscription factor bindingsites among coexpressing genesin human. Genome Inform(2008) 20:212–21. doi:10.1142/9781848163003_0018
16. Obayashi T, Kinoshita K. COX-PRESdb: a database to comparegene coexpression in seven modelanimals. Nucleic Acids Res (2011)39(Database issue):D1016–22.doi:10.1093/nar/gkq1147
17. Hoek K, Rimm DL, Williams KR,Zhao H, Ariyan S, Lin A, et al.Expression profiling reveals novelpathways in the transformationof melanocytes to melanomas.Cancer Res (2004) 64(15):5270–82. doi:10.1158/0008-5472.CAN-04-0731
18. Wang L, Hurley DG, Watkins W,Araki H, Tamada Y, Muthukarup-pan A, et al. Cell cycle genenetworks are associated withmelanoma prognosis. PLoSONE (2012) 7(4):e34247.doi:10.1371/journal.pone.0034247
19. Chang JT, Nevins JR. GATHER: asystems approach to interpretinggenomic signatures. Bioinfor-matics (2006) 22(23):2926–33.doi:10.1093/bioinformatics/btl483
20. Huang da W, Sherman BT,Lempicki RA. Systematicand integrative analysis oflarge gene lists using DAVIDbioinformatics resources. NatProtoc (2009) 4(1):44–57.doi:10.1038/nprot.2008.211
21. Subramanian A, Tamayo P,Mootha VK, Mukherjee S,Ebert BL, Gillette MA, et al.Gene set enrichment analysis:a knowledge-based approachfor interpreting genome-wideexpression profiles. Proc NatlAcad Sci U S A (2005) 102(43):15545–50. doi:10.1073/pnas.0506580102
Frontiers in Oncology | Cancer Genetics July 2013 | Volume 3 | Article 184 | 12
Trevarton et al. MelanomaDB: integrative melanoma genomic analysis
22. Araki H, Knapp C, Tsai P, PrintC. GeneSetDB: a comprehen-sive meta-database, statisticaland visualisation frameworkfor gene set analysis. FEBSOpen Bio (2012) 2:76–82.doi:10.1016/j.fob.2012.04.003
23. Bollag G, Tsai J, Zhang J, Zhang C,Ibrahim P, Nolop K, et al. Vemu-rafenib: the first drug approvedfor BRAF-mutant cancer. Nat RevDrug Discov (2012) 11(11):873–86. doi:10.1038/nrd3847
24. Nazarian R, Shi H, Wang Q,Kong X, Koya RC, Lee H, etal. Melanomas acquire resistanceto B-RAF(V600E) inhibition byRTK or N-RAS upregulation.Nature (2010) 468(7326):973–7.doi:10.1038/nature09626
25. Wang L, Xiong Y, Sun Y, Fang Z, LiL, Ji H, et al. HLungDB: an inte-grated database of human lungcancer research. Nucleic Acids Res(2010) 38(Database issue):D665–9. doi:10.1093/nar/gkp945
26. Kaur M, Radovanovic A, EssackM, Schaefer U, Maqungo M,Kibler T, et al. Database forexploration of functional con-text of genes implicated in ovar-ian cancer. Nucleic Acids Res(2009) 37(Database issue):D820–3. doi:10.1093/nar/gkn593
27. Kanehisa M, Goto S, Sato Y,Furumichi M, Tanabe M. KEGGfor integration and interpre-tation of large-scale molecu-lar data sets. Nucleic Acids Res(2012) 40(Database issue):D109–14. doi:10.1093/nar/gkr988
28. Knox C, Law V, Jewison T,Liu P, Ly S, Frolkis A, et al.DrugBank 3.0: a comprehensiveresource for “omics” research ondrugs. Nucleic Acids Res (2011)39(Database issue):D1035–41.doi:10.1093/nar/gkq1126
29. Zhu F, Shi Z, Qin C, Tao L, Liu X,Xu F, et al. Therapeutic target data-base update 2012: a resource forfacilitating target-oriented drugdiscovery. Nucleic Acids Res (2012)40(Database issue):D1128–36.doi:10.1093/nar/gkr797
30. Gould Rothberg BE, BrackenMB, Rimm DL. Tissue biomark-ers for prognosis in cutaneousmelanoma: a systematic reviewand meta-analysis. J Natl Can-cer Inst (2009) 101(7):452–74.doi:10.1093/jnci/djp038
31. Schramm SJ, Mann GJ. Melanomaprognosis: a REMARK-based sys-tematic review and bioinformaticanalysis of immunohistochemi-cal and gene microarray stud-ies. Mol Cancer Ther (2011)
10(8):1520–8. doi:10.1158/1535-7163.MCT-10-0901
32. Mehta S, Shelling A, Muthukarup-pan A, Lasham A, BlenkironC, Laking G, et al. Predictiveand prognostic molecular mark-ers for cancer medicine. Ther AdvMed Oncol (2010) 2(2):125–48.doi:10.1177/1758834009360519
33. Blake PM, Decker DA, GlennonTM, Liang YM, Losko S, NavinN, et al. Toward an integratedknowledge environment to sup-port modern oncology. Cancer J(2011) 17(4):257–63. doi:10.1097/PPO.0b013e31822c390b
34. Gaulton A, Bellis LJ, Bento AP,Chambers J, Davies M, HerseyA, et al. ChEMBL: a large-scalebioactivity database for drug dis-covery. Nucleic Acids Res (2012)40(Database issue):D1100–7.doi:10.1093/nar/gkr777
35. Li Q, Lai L. Prediction of potentialdrug targets based on sim-ple sequence properties. BMCBioinformatics (2007) 8:353.doi:10.1186/1471-2105-8-353
36. Tiedemann RE, Zhu YX, SchmidtJ, Shi CX, Sereduk C, Yin H,et al. Identification of molec-ular vulnerabilities in humanmultiple myeloma cells by RNAinterference lethality screeningof the druggable genome. Can-cer Res (2012) 72(3):757–68.doi:10.1158/0008-5472.CAN-11-2781
37. UniProt Consortium. Ongoingand future developments at theUniversal Protein Resource.Nucleic Acids Res (2011)39(Database issue):D214–9.doi:10.1093/nar/gkq1020
38. Chen Y, Zhang Y, Yin Y, GaoG, Li S, Jiang Y, et al. SPD – aweb-based secreted protein data-base. Nucleic Acids Res (2005)33(Database issue):D169–73.doi:10.1093/nar/gki093
39. Manning G, Whyte DB, Mar-tinez R, Hunter T, SudarsanamS. The protein kinase comple-ment of the human genome. Sci-ence (2002) 298(5600):1912–34.doi:10.1126/science.1075762
40. Wren JD, Bekeredjian R, Stew-art JA, Shohet RV, Garner HR.Knowledge discovery by auto-mated identification and rankingof implicit relationships. Bioin-formatics (2004) 20(3):389–98.doi:10.1093/bioinformatics/btg421
41. Wren JD. A global meta-analysisof microarray expression data topredict unknown gene functionsand estimate the literature-data
divide. Bioinformatics (2009)25(13):1694–701. doi:10.1093/bioinformatics/btp290
42. Daum JR, Wren JD, DanielJJ, Sivakumar S, McAvoy JN,Potapova TA, et al. Ska3 isrequired for spindle checkpointsilencing and the mainte-nance of chromosome cohesionin mitosis. Curr Biol (2009)19(17):1467–72. doi:10.1016/j.cub.2009.07.017
43. Lupu C, Zhu H, Popescu NI,Wren JD, Lupu F. Novel proteinADTRP regulates TFPI expressionand function in human endothe-lial cells in normal conditionsand in response to androgen.Blood (2011) 118(16):4463–71.doi:10.1182/blood-2011-05-355370
44. Clemmensen SN, Bohr CT,Rørvig S, Glenthøj A, Mora-Jensen H, Cramer EP, et al.Olfactomedin 4 defines a subsetof human neutrophils. J LeukocBiol (2012) 91(3):495–500.doi:10.1189/jlb.0811417
45. Towner RA, Jensen RL, Colman H,Vaillant B, Smith N, Casteel R, etal. ELTD1, a potential new bio-marker for gliomas. Neurosurgery(2013) 72(1):77–90. doi:10.1227/NEU.0b013e318276b29d discus-sion 91.
46. John T, Black MA, Toro TT,Leader D, Gedye CA, Davis ID,et al. Predicting clinical out-come through molecular profil-ing in stage III melanoma. ClinCancer Res (2008) 14(16):5173–80. doi:10.1158/1078-0432.CCR-07-4170
47. Mandruzzato S, Callegaro A, Tur-catel G, Francescato S, MontescoMC, Chiarion-Sileni V, et al. Agene expression signature associ-ated with survival in metastaticmelanoma. J Transl Med (2006)4:50. doi:10.1186/1479-5876-4-50
48. Journe F, Id Boufker H, VanKempen L, Galibert MD, WiedigM, Salès F, et al. TYRP1 mRNAexpression in melanoma metas-tases correlates with clinicaloutcome. Br J Cancer (2011)105(11):1726–32. doi:10.1038/bjc.2011.451
49. Timar J, Gyorffy B, Raso E. Genesignature of the metastatic poten-tial of cutaneous melanoma: toomuch for too little? Clin ExpMetastasis (2010) 27(6):371–87.doi:10.1007/s10585-010-9307-2
50. Bogunovic D, O’Neill DW,Belitskaya-Levy I, Vacic V, Yu YL,Adams S, et al. Immune profileand mitotic index of metastatic
melanoma lesions enhance clin-ical staging in predicting patientsurvival. Proc Natl Acad Sci US A (2009) 106(48):20429–34.doi:10.1073/pnas.0905139106
51. Jönsson G, Busch C, Knapp-skog S, Geisler J, Miletic H,Ringnér M, et al. Gene expres-sion profiling-based identifica-tion of molecular subtypes instage IV melanomas with dif-ferent clinical outcome. ClinCancer Res (2010) 16(13):3356–67. doi:10.1158/1078-0432.CCR-09-2509
52. Bolstad BM, Irizarry RA, AstrandM, Speed TP. A comparison ofnormalization methods for highdensity oligonucleotide arraydata based on variance and bias.Bioinformatics (2003) 19(2):185–93. doi:10.1093/bioinformatics/19.2.185
53. Berger MF, Levin JZ, Vijayen-dran K, Sivachenko A, AdiconisX, Maguire J, et al. Integrativeanalysis of the melanoma tran-scriptome. Genome Res (2010)20(4):413–27. doi:10.1101/gr.103697.109
54. Nikolaev SI, Rimoldi D, Iseli C,Valsesia A, Robyr D, Gehrig C, etal. Exome sequencing identifiesrecurrent somatic MAP2K1and MAP2K2 mutations inmelanoma. Nat Genet (2012)44(2):133–9. doi:10.1038/ng.1026
55. Palavalli LH, Prickett TD, Wun-derlich JR, Wei X, Burrell AS,Porter-Gill P, et al. Analysisof the matrix metalloproteinasefamily reveals that MMP8 isoften mutated in melanoma.Nat Genet (2009) 41(5):518–20.doi:10.1038/ng.340
56. Prickett TD, Agrawal NS, WeiX, Yates KE, Lin JC, WunderlichJR, et al. Analysis of the tyro-sine kinome in melanoma revealsrecurrent mutations in ERBB4.Nat Genet (2009) 41(10):1127–32.doi:10.1038/ng.438
57. Prickett TD, Wei X, Cardenas-Navia I, Teer JK, Lin JC, WaliaV, et al. Exon capture analy-sis of G protein-coupled recep-tors identifies activating muta-tions in GRM3 in melanoma.Nat Genet (2011) 43(11):1119–26.doi:10.1038/ng.950
58. Stark MS, Woods SL, GartsideMG, Bonazzi VF, Dutton-RegesterK, Aoude LG, et al. Frequentsomatic mutations in MAP3K5and MAP3K9 in metastaticmelanoma identified by exomesequencing. Nat Genet (2012)44(2):165–9. doi:10.1038/ng.1041
www.frontiersin.org July 2013 | Volume 3 | Article 184 | 13
Trevarton et al. MelanomaDB: integrative melanoma genomic analysis
59. Turajlic S, Furney SJ, LambrosMB, Mitsopoulos C, Kozarewa I,Geyer FC, et al. Whole genomesequencing of matched primaryand metastatic acral melanomas.Genome Res (2012) 22(2):196–207. doi:10.1101/gr.125591.111
60. Wei X, Walia V, Lin JC, TeerJK, Prickett TD, Gartner J, etal. Exome sequencing identifiesGRIN2A as frequently mutatedin melanoma. Nat Genet (2011)43(5):442–6. doi:10.1038/ng.810
61. Barretina J, Caponigro G, Stran-sky N, Venkatesan K, Mar-golin AA, Kim S, et al. TheCancer Cell Line Encyclope-dia enables predictive modellingof anticancer drug sensitivity.Nature (2012) 483(7391):603–7.doi:10.1038/nature11003
62. Benjamini Y, Hochberg Y. Con-trolling the false discovery rate – apractical and powerful approachto multiple testing. J R Stat Soc SerB Stat Methodol (1995) 57(1):289–300.
63. McKenna A, Hanna M, BanksE, Sivachenko A, Cibulskis K,Kernytsky A, et al. The GenomeAnalysis Toolkit: a MapReduceframework for analyzing next-generation DNA sequencingdata. Genome Res (2010) 20(9):1297–303. doi:10.1101/gr.107524.110
64. Sales G, Calura E, Cavalieri D,Romualdi C. graphite – a Biocon-ductor package to convert path-way topology to gene network.BMC Bioinformatics (2012) 13:20.doi:10.1186/1471-2105-13-20
65. Warnes G. Gtools: Various R Pro-gramming Tools. R Package 2.7.0.(2012).
66. Kelleher FC, McArthur GA. Tar-geting NRAS in melanoma. Can-cer J (2012) 18(2):132–6. doi:10.1097/PPO.0b013e31824ba4df
67. Jensen TO, Hoyer M, SchmidtH, Moller HJ, Steiniche T. Theprognostic role of protumoral
macrophages in AJCC stage I/IImelanoma [abstract]. J Clin Oncol(2008) 26(15S):9017.
68. Davies MA, Samuels Y. Analy-sis of the genome to per-sonalize therapy for melanoma.Oncogene (2010) 29(41):5545–55.doi:10.1038/onc.2010.323
69. Yancovitz M, Litterman A, YoonJ, Ng E, Shapiro RL, BermanRS, et al. Intra- and inter-tumorheterogeneity of BRAF(V600E)mutations in primary andmetastatic melanoma. PLoSONE (2012) 7(1):e29336. doi:10.1371/journal.pone.0029336
70. Ng PC, Henikoff S. SIFT: pre-dicting amino acid changes thataffect protein function. NucleicAcids Res (2003) 31(13):3812–4.doi:10.1093/nar/gkg509
71. Adzhubei IA, Schmidt S, PeshkinL, Ramensky VE, GerasimovaA, Bork P, et al. A method andserver for predicting damag-ing missense mutations. NatMethods (2010) 7(4):248–9.doi:10.1038/nmeth0410-248
72. Choi Y, Sims GE, Murphy S,Miller JR, Chan AP. Predictingthe functional effect of aminoacid substitutions and indels.PLoS ONE (2012) 7(10):e46688.doi:10.1371/journal.pone.0046688
73. ENCODE Project Consortium,Dunham I, Kundaje A, Aldred SF,Collins PJ, Davis CA, et al. Anintegrated encyclopedia of DNAelements in the human genome.Nature (2012) 489(7414):57–74.doi:10.1038/nature11247
74. Derrien T, Johnson R, BussottiG, Tanzer A, Djebali S, TilgnerH, et al. The GENCODE v7 cat-alog of human long noncod-ing RNAs: analysis of their genestructure, evolution, and expres-sion. Genome Res (2012) 22(9):1775–89. doi:10.1101/gr.132159.111
75. Khaitan D, Dinger ME, Mazar J,Crawford J, Smith MA, Mattick JS,
et al. The melanoma-upregulatedlong noncoding RNA SPRY4-IT1modulates apoptosis and invasion.Cancer Res (2011) 71(11):3852–62. doi:10.1158/0008-5472.CAN-10-4460
76. Sanyal A, Lajoie BR, Jain G,Dekker J. The long-range interac-tion landscape of gene promoters.Nature (2012) 489(7414):109–13.doi:10.1038/nature11279
77. de Graaf CA, van SteenselB. Chromatin organization:form to function. Curr OpinGenet Dev (2012) 23(2):185–90.doi:10.1016/j.gde.2012.11.011
78. Sigalotti L, Covre A, Fratta E,Parisi G, Colizzi F, Rizzo A, etal. Epigenetics of human cuta-neous melanoma: setting thestage for new therapeutic strate-gies. J Transl Med (2010) 8:56.doi:10.1186/1479-5876-8-56
79. Fratta E, Sigalotti L, Colizzi F,Covre A, Nicolay HJ, DanielliR, et al. Epigenetically regulatedclonal heritability of CTA expres-sion profiles in human melanoma.J Cell Physiol (2010) 223(2):352–8.doi:10.1002/jcp.22040
80. Howell PM Jr., Liu S, Ren S, BehlenC, Fodstad O, Riker AI. Epigenet-ics in human melanoma. CancerControl (2009) 16(3):200–18.
81. Mermel CH, Schumacher SE,Hill B, Meyerson ML, BeroukhimR, Getz G. GISTIC2.0 facili-tates sensitive and confident local-ization of the targets of focalsomatic copy-number alterationin human cancers. Genome Biol(2011) 12(4):R41. doi:10.1186/gb-2011-12-4-r41
82. Sanchez-Garcia F, Akavia UD,Mozes E, Pe’er D. JISTIC: iden-tification of significant targetsin cancer. BMC Bioinformatics(2010) 11:189. doi:10.1186/1471-2105-11-189
83. Akavia UD, Litvin O, KimJ, Sanchez-Garcia F, KotliarD, Causton HC, et al. An
integrated approach touncover drivers of cancer.Cell (2010) 143(6):1005–17.doi:10.1016/j.cell.2010.11.013
84. Flaherty KT, Hodi FS, FisherDE. From genes to drugs: tar-geted strategies for melanoma.Nat Rev Cancer (2012) 12(5):349–61. doi:10.1038/nrc3218
85. Utikal J, Schadendorf D, UgurelS. Serologic and immunohisto-chemical prognostic biomarkersof cutaneous malignancies.Arch Dermatol Res (2007)298(10):469–77.
Conflict of Interest Statement: StevenStones-Havas is an employee, andCristin G. Print a paid consultant, of thecompany Biomatters Ltd., which worksin the general field of genomic visu-alization. Biomatters Ltd., generatedthe freely available BaseSpace applica-tion described in this manuscript in anon-commercial collaboration with theother authors.
Received: 31 March 2013; accepted: 29June 2013; published online: 16 July 2013.Citation: Trevarton AJ, Mann MB,Knapp C, Araki H, Wren JD, Stones-Havas S, Black MA and Print CG (2013)MelanomaDB: a web tool for integrativeanalysis of melanoma genomic informa-tion to identify disease-associated molec-ular pathways. Front. Oncol. 3:184. doi:10.3389/fonc.2013.00184This article was submitted to Frontiers inCancer Genetics, a specialty of Frontiersin Oncology.Copyright © 2013 Trevarton, Mann,Knapp, Araki, Wren, Stones-Havas,Black and Print . This is an open-access article distributed under the termsof the Creative Commons AttributionLicense, which permits use, distributionand reproduction in other forums, pro-vided the original authors and sourceare credited and subject to any copy-right notices concerning any third-partygraphics etc.
Frontiers in Oncology | Cancer Genetics July 2013 | Volume 3 | Article 184 | 14
Related Documents