RESEARCH ARTICLE Open Access Integrative genomic analysis identifies epigenetic marks that mediate genetic risk for epithelial ovarian cancer Devin C Koestler 1 , Prabhakar Chalise 1 , Mine S Cicek 3 , Julie M Cunningham 4 , Sebastian Armasu 3 , Melissa C Larson 3 , Jeremy Chien 2 , Matthew Block 5 , Kimberly R Kalli 5 , Thomas A Sellers 6 , Brooke L Fridley 1* and Ellen L Goode 3 Abstract Background: Both genetic and epigenetic factors influence the development and progression of epithelial ovarian cancer (EOC). However, there is an incomplete understanding of the interrelationship between these factors and the extent to which they interact to impact disease risk. In the present study, we aimed to gain insight into this relationship by identifying DNA methylation marks that are candidate mediators of ovarian cancer genetic risk. Methods: We used 214 cases and 214 age-matched controls from the Mayo Clinic Ovarian Cancer Study. Pretreatment, blood-derived DNA was profiled for genome-wide methylation (Illumina Infinium HumanMethylation27 BeadArray) and single nucleotide polymorphisms (SNPs, Illumina Infinium HD Human610-Quad BeadArray). The Causal Inference Test (CIT) was implemented to distinguish CpG sites that mediate genetic risk, from those that are consequential or independently acted on by genotype. Results: Controlling for the estimated distribution of immune cells and other key covariates, our initial epigenome-wide association analysis revealed 1,993 significantly differentially methylated CpGs that between cases and controls (FDR, q < 0.05). The relationship between methylation and case-control status for these 1,993 CpGs was found to be highly consistent with the results of previously published, independent study that consisted of peripheral blood DNA methylation signatures in 131 pretreatment cases and 274 controls. Implementation of the CIT test revealed 17 CpG/SNP pairs, comprising 13 unique CpGs and 17 unique SNPs, which represent potential methylation-mediated relationships between genotype and EOC risk. Of these 13 CpGs, several are associated with immune related genes and genes that have been previously shown to exhibit altered expression in the context of cancer. Conclusions: These findings provide additional insight into EOC etiology and may serve as novel biomarkers for EOC susceptibility. Keywords: Integrative genomics, Ovarian cancer, Blood-based DNA methylation Background Epithelial ovarian cancer (EOC) is the fifth leading cause of cancer death among women in the United States and the most deadly among gynecologic malignancies. In 2013 it is estimated that 22,240 new cases of EOC will be diagnosed [1], making it one of the most common gy- necologic malignancies. Along with the physical burdens suffered by affected patients, the costs to the health care system are significant [2] with recent estimates suggest- ing that EOC accounts for upward of 5.1 billion dollars annually; rendering this disease as one of the most expensive cancers to treat [3]. The enormous physical, societal, and economic burdens associated with EOC along with the current lack of success in the early diagno- sis of this disease, underscore the urgent need of studies aimed toward understanding the molecular basis of EOC susceptibility. * Correspondence: [email protected] 1 Department of Biostatistics, University of Kansas Medical Center, 3901 Rainbow Blvd, Kansas City, KS 66160, USA Full list of author information is available at the end of the article © 2014 Koestler et al.; licensee BioMed Central Ltd. This is an Open Access article distributed under the terms of the Creative Commons Attribution License (http://creativecommons.org/licenses/by/2.0), which permits unrestricted use, distribution, and reproduction in any medium, provided the original work is properly credited. The Creative Commons Public Domain Dedication waiver (http://creativecommons.org/publicdomain/zero/1.0/) applies to the data made available in this article, unless otherwise stated. Koestler et al. BMC Medical Genomics 2014, 7:8 http://www.biomedcentral.com/1755-8794/7/8

Welcome message from author
This document is posted to help you gain knowledge. Please leave a comment to let me know what you think about it! Share it to your friends and learn new things together.
Transcript

Koestler et al. BMC Medical Genomics 2014, 7:8http://www.biomedcentral.com/1755-8794/7/8
RESEARCH ARTICLE Open Access
Integrative genomic analysis identifies epigeneticmarks that mediate genetic risk for epithelialovarian cancerDevin C Koestler1, Prabhakar Chalise1, Mine S Cicek3, Julie M Cunningham4, Sebastian Armasu3, Melissa C Larson3,Jeremy Chien2, Matthew Block5, Kimberly R Kalli5, Thomas A Sellers6, Brooke L Fridley1* and Ellen L Goode3
Abstract
Background: Both genetic and epigenetic factors influence the development and progression of epithelial ovariancancer (EOC). However, there is an incomplete understanding of the interrelationship between these factors andthe extent to which they interact to impact disease risk. In the present study, we aimed to gain insight into thisrelationship by identifying DNA methylation marks that are candidate mediators of ovarian cancer genetic risk.
Methods: We used 214 cases and 214 age-matched controls from the Mayo Clinic Ovarian Cancer Study. Pretreatment,blood-derived DNA was profiled for genome-wide methylation (Illumina Infinium HumanMethylation27 BeadArray) andsingle nucleotide polymorphisms (SNPs, Illumina Infinium HD Human610-Quad BeadArray). The Causal Inference Test(CIT) was implemented to distinguish CpG sites that mediate genetic risk, from those that are consequential orindependently acted on by genotype.
Results: Controlling for the estimated distribution of immune cells and other key covariates, our initialepigenome-wide association analysis revealed 1,993 significantly differentially methylated CpGs that betweencases and controls (FDR, q < 0.05). The relationship between methylation and case-control status for these 1,993CpGs was found to be highly consistent with the results of previously published, independent study that consistedof peripheral blood DNA methylation signatures in 131 pretreatment cases and 274 controls. Implementation ofthe CIT test revealed 17 CpG/SNP pairs, comprising 13 unique CpGs and 17 unique SNPs, which represent potentialmethylation-mediated relationships between genotype and EOC risk. Of these 13 CpGs, several are associated withimmune related genes and genes that have been previously shown to exhibit altered expression in the context ofcancer.
Conclusions: These findings provide additional insight into EOC etiology and may serve as novel biomarkers forEOC susceptibility.
Keywords: Integrative genomics, Ovarian cancer, Blood-based DNA methylation
BackgroundEpithelial ovarian cancer (EOC) is the fifth leading causeof cancer death among women in the United States andthe most deadly among gynecologic malignancies. In2013 it is estimated that 22,240 new cases of EOC willbe diagnosed [1], making it one of the most common gy-necologic malignancies. Along with the physical burdens
* Correspondence: [email protected] of Biostatistics, University of Kansas Medical Center, 3901Rainbow Blvd, Kansas City, KS 66160, USAFull list of author information is available at the end of the article
© 2014 Koestler et al.; licensee BioMed CentraCommons Attribution License (http://creativecreproduction in any medium, provided the orDedication waiver (http://creativecommons.orunless otherwise stated.
suffered by affected patients, the costs to the health caresystem are significant [2] with recent estimates suggest-ing that EOC accounts for upward of 5.1 billion dollarsannually; rendering this disease as one of the mostexpensive cancers to treat [3]. The enormous physical,societal, and economic burdens associated with EOCalong with the current lack of success in the early diagno-sis of this disease, underscore the urgent need of studiesaimed toward understanding the molecular basis of EOCsusceptibility.
l Ltd. This is an Open Access article distributed under the terms of the Creativeommons.org/licenses/by/2.0), which permits unrestricted use, distribution, andiginal work is properly credited. The Creative Commons Public Domaing/publicdomain/zero/1.0/) applies to the data made available in this article,
Koestler et al. BMC Medical Genomics 2014, 7:8 Page 2 of 14http://www.biomedcentral.com/1755-8794/7/8
Epigenetics refers to differences in phenotypic statesthat are not based on differences in the underlying DNAsequence, are potentially reversible, and are generallystably maintained during cell division. Epigenetic markssuch as DNA methylation (DNAm) of cytosine residues inthe context of CpG dinucleotides, have been extensivelycharacterized in EOC tumor tissue and have been shownto differ between histological subtypes of ovarian cancer[4], associate with patient clinical outcomes including sur-vival time [5] and progression [6], and have led to identifi-cation of inherited variants in HNF1B (hepatocyte nuclearfactor 1 homeobox B) as a subtype-specific susceptibilitygene [7]. Despite the obvious relevance of investigatingtumor-derived DNAm signatures for understanding EOCrisk and prognosis, it also is clear that tumors do not de-velop as isolated phenomenon in their target tissue, butinstead result from altered processes affecting neighboringcells and tissues, including the immune system. Thus,alterations DNAm profiles measured in peripheral bloodmay be useful not only in understanding the carcinogenicprocess and response to environmental insults, but mayalso provide critical insights in a systems biological viewof tumorigenesis. Recent work has begun to translatethese findings to clinically useful endpoints by examin-ing the relationship between DNAm alterations andcancer risk [8-11], including ovarian cancer [12]. Yet,the retrospective nature of such studies and the assess-ment of DNAm peripheral blood leukocytes presentsignificant challenges in the interpretation of the re-sults; in particular, (a) the extent to which the identifiedmethylation marks are consequential or are causal/me-diators of disease risk and (b) potential for confoundingdue to heterogeneity in the underlying population ofcells used for methylation assessment [13-15].These challenges have served to motivate the applica-
tion of novel analytical approaches for retrospectivestudies of DNA methylation that aim to distinguish epi-genetic marks that are consequential or reflect alter-ations to the methylome driven by the tumor itself, fromthose that are causal or mediate tumor growth and de-velopment. In particular, a recent case-control study ofrheumatoid arthritis, Liu et al., [16] utilized genotypedata collected on the study subjects to identify methy-lation marks that fall along the casual pathway fromgenotype to disease status. As the potential for con-founding due to cell heterogeneity represents a majorbottleneck in the interpretation of blood-based studiesof DNA methylation, the authors also applied a recentlydeveloped statistical methodology [13] for estimating theunderlying distribution of cell types across each of thestudy samples, enabling them to control for the potentialconfounding effects of cell type heterogeneity. The over-arching paradigm of this work is that genetically drivenalterations in the pattern of DNAm of white blood cells
can result in functional deficits in the normal function-ing of immune system that modify disease susceptibility.Here, we speculated that these same might hold truefor EOC risk; that genetically induced changes in theepigenetic landscape of white blood cells can alter sus-ceptibility to EOC. Indeed, integrative genomics studiesof other cancers, for example prostate cancer, indicatethat the tumor epigenetic landscape is partly mediatedby genetic differences, which may affect disease pro-gression [17,18]. Additionally, Genome-wide associationstudies (GWAS) in the context of ovarian cancer haveidentified 11 common risk alleles [7,19-24], and six ofthese are located in homeobox gene clusters (HOXA,HOXB, and HOXD), homeobox-related genes (HNF1B),or genes expressed in early progenitor cells (BNC2,TERT) [20,25,26]; many developmental genes such asthese are silenced by DNAm in differentiated cells andbecome aberrantly hypomethylated during tumorigen-esis [26].Given the well-established role of genetic variation and
EOC risk and importance of examining DNA methy-lation in non target tissues, we attempted to leveragethese findings along with the analytical framework ap-plied in Lui et al. [16], with the goal of gaining betterunderstanding the epigenetic basis of EOC susceptibil-ity. Specifically, using blood-derived genome-wide epi-genetic and genetic data collected on a total of 214 EOCcases and 214 controls enrolled in the Mayo ClinicOvarian Cancer Study, we aimed to distinguish blood-based DNA methylation markers that are candidates formediating EOC genetic risk.
MethodsStudy population and sample preparationThis study consisted of 428 women of European ancestry(214 pre-treatment invasive epithelial ovarian cancer casesand 214 controls one-to-one matched with EOC cases onthe basis age (within 1-year)) between the ages of 27 and91 enrolled in the Mayo Clinic Ovarian Cancer Study [20].Genomic DNA was isolated from whole blood collectedat the time of enrollment, using PureGene DNA iso-lation reagents (Gentra Systems, Minneapolis, MN),re-suspended in TE buffer, and stored at -80°C. Sampleswere bar-coded with a unique subject identification num-ber to ensure accurate and reliable sample processing andstorage. Research protocols were approved by the MayoClinic Institutional Review Boards, and all participantsprovided written informed consent.
Genotype dataLeukocyte-derived DNA was genotyped with the Illu-mina 610-quad Beadchip Array™ according to manufac-turer’s protocol, at the Mayo Clinic Medical GenomeFacility (Rochester, MN) by laboratory personnel blinded

Koestler et al. BMC Medical Genomics 2014, 7:8 Page 3 of 14http://www.biomedcentral.com/1755-8794/7/8
to case-control status. Detailed quality control (QC) pro-cedures have been described elsewhere [20,27]. Briefly,Illumina’s Genome Studio™ software was used to performautomated genotype clustering and calling. Assays includedduplicates and laboratory controls, which showed sampleconcordance of 99.93%, genotype call rate of 99.7%. SNPswere excluded with call rate <95%, MAF <0.05, Hardy-Weinberg Equilibrium (HWE) p-value < 10-4, or unre-solved replicate errors, and samples were excluded withcall rate <95%, ambiguous gender, or predicted less than80% European ancestry. SNPnexus was used to annotatethe genotyped variants [28-30].
DNA methylation assaysLeukocyte-derived DNA was assayed and underwent QCprocedures at the Mayo Clinic Molecular Genome Facility(Rochester, MN). Samples were assayed in two batches,hereafter referred to as Batch 1 (n = 132; 66 cases andmatched control samples) and Batch 2 samples (n = 296;148 cases and matched control samples). For each sample,1 μg of genomic DNA was bisulfite modified (BSM) usingthe Zymo EZ96 DNA Methylation Kit (Zymo Research,Orange, CA) according to the manufacturer’s protocol.Epigenome-wide assessment of DNA methylation was car-ried out using the Illumina Infinium HumanMethyla-tion27 BeadChip, which is capable of interrogating themethylation status >27,000 CpG loci across the genome.This assay uses bisulfite-treated DNA and two site-specificprobes for each marker, which bind to the associatedmethylated and unmethylated sequences. The intensity ofthe methylated probe relative to the total probe intensity(sum of methylated and unmethylated probe intensities)represents the fractional level of methylation for that spe-cific site within a sample. Centre d’Etudes du Polymor-phisme Humain (CEPH) DNA, placental DNA (positivecontrol) and whole genome amplified (WGA) DNA (nega-tive control) were also included (n = 9, n = 12 and n = 8,respectively), as were technical replicates (n = 12). Briefly,fragmented DNA was hybridized to the BeadChips, whichwere then processed through a primer extension and animmunohistochemistry staining protocol to allow detec-tion of a single-base extension reaction. Finally, BeadChipswere coated and then imaged on an Illumina iScan.Analysis included control probes for assessing sample-independent and sample-dependent performance.
Methylation data pre-processing and quality controlThe methylation level of each CpG locus was calculatedin GenomeStudio® Methylation module (v.1.9.0) by com-paring the ratio of fluorescent signal from the methyl-ated allele to the sum from the fluorescent signal fromboth methylated and unmethylated alleles and scored asbeta values, ranging from 0 (unmethylated) to 1 (methyl-ated). We first excluded probes that had an rsid, were
located on the Y chromosome, or were positioned at asingle nucleotide polymorphism (SNPs) (dbSNP build137), as SNPs at the same site have the potential to con-found methylation assessment. We also removed CpGloci that had high beta values in BSM negative controls(defined as exceeding four standard deviations of themean) and those that were detected in <70% of samples(based on a detection p-value cut-off of 0.05). This left atotal of 25,926 out 27,578 (94%) of probes that passedQC. The intra-class correlation coefficients, computedbased on beta values among CEPH replicates and for du-plicate samples, were >0.93, indicating a high degree ofreproducibility in our array. In addition, samples wereexcluded if >25% of the probes for that sample had de-tection p-values that exceeded 1 × 10⁻⁵. Following QC,428 samples remained for analyses; including 132 sam-ples (66 cases and matched control samples) and 296samples (148 cases and matched control samples) inBatch 1 and Batch 2, respectively.Next, we assessed possible plate/Beadchip/batch ef-
fects visually and through principal component analyses(PCA) [31,32]. DNAm values were logit-transformed(i.e., log2(β/1- β)) as in previous studies to obtain theDNAm M-value for each CpG locus [33,34]. PCA repre-sents a feature extraction technique where the methyla-tion data is orthogonally transformed, such that the firstprincipal component has the largest possible variance(accounts for maximal amount of variability in the methy-lation data), and each succeeding component, in turn hasthe next highest variance possible. PCA was applied to themethylation data for each batch separately (n1 = 138 andn2 = 296, for Batch 1 and Batch 2, respectively) and also tothe combined methylation data for both Batches (n = 428).The resulting top principal components (those explainingthe maximal proportion of variability in DNAm) werethen examined in terms of their association with technicalaspects concerning the array (i.e., plate/BeadChip), andbatch for the principal components estimated from thecombined methylation data from the Batch 1 and Batch 2samples. As batch was observed to be a major determinantof variability in the combined DNAm data (Additionalfiles 1 and 2), we adjusted for batch-effects by applying theComBat normalization method [35] using the R-package‘sva’. Combat is an empirical Bayes batch adjustmentmethodology that uses a location and scale adjustmentfor standardizing the mean and variability in methy-lation levels across batches. This methodology beenshown to perform effectively and efficiently comparedto competing batch/plate-adjustment methodologies[36,37] and has become an established preprocessingstep for array-based DNA methylation data [38-40].Following the application of Combat, principal com-ponents were computed from the batch-adjusted dataand inspected to ensure that batch effects had been

Koestler et al. BMC Medical Genomics 2014, 7:8 Page 4 of 14http://www.biomedcentral.com/1755-8794/7/8
successfully attenuated. In addition, within each batchwe observed plate-effects (data not shown). To removevariability in DNAm due to plate, we fit a linear modelto the logit-transformed methylation values for eachCpG locus and included a fixed effect term for plate.The logit-transformed locus means were then addedback onto the unstandardized residuals derived fromthese models, before back transforming values on thelogit-scale to a 0 to 1 scale.
Technical validation of the methylation array dataAs an orthogonal array validation, eight CpGs with abroad spectrum of percent methylation (range; 0.11-0.73) and variability (standard deviation; 0.11-0.15) wereassessed using bisulfite pyrosequencing. Ninety-six sam-ples were tested, including 45 cases and 45 controls, twosamples each of WGA, BSM negative, and control sam-ples (CpGenome™ Universal Methylated DNA; MilliporeCorporation, Billerica, MA). Primers (Additional file 3)were designed using the Pyrosequencing Assay DesignSoftware. Genomic DNA (20-30 ng) was PCR-amplifiedusing primers, one of which was biotinylated. Briefly, theincorporated biotinylated amplicon was immobilized onstreptavidin-coated beads used to purify and renderthe denatured, single stranded and biotinylated PCRproduct. Single stranded DNA was purified using the py-rosequencing vacuum workstation. The single-strandedproduct was annealed to 0.3 μM of the sequencing pri-mer complementary to the single-stranded template andplaced at 85°C for two minutes, then cooled to roomtemperature for five minutes. Pyrosequencing reactionswere performed on Biotage PyroMark MD, and datawere analyzed using PyroMD Software. Percent methyla-tion was quantified as methylated C to unmethylated C ra-tio using the Pyro Q-CpG software, which providedautomatic QC for each sample for completion of bisulfiteconversion and estimates of non-converted DNA. Themedian Pearson correlation of methylation values betweenthe array and pyrosequencing assays was 0.88 (Additionalfile 3), suggesting high concordance in the methylationarray values and those generated from pyrosequencing.
Cell mixture deconvolution analysisRecent work has demonstrated substantial differences inthe DNAm signature across different leukocyte subtypes[13-15] and also differences in white blood cell propor-tions by EOC case-control status [41-43]. As such, het-erogeneity in the underlying distribution of white bloodcell types is likely to be a key confounder when examin-ing the association between DNAm and EOC status.Using the plate- and batch-adjusted methylation data,we employed a statistical methodology [13] for inferringchanges in the distribution of leukocytes based on per-ipheral blood DNAm signatures, in combination with a
previously obtained external reference data set consist-ing of methylation signatures from purified leukocytesamples (i.e., B cells, natural killer (NK) cells, CD8+ Tlymphocytes, CD4+ T lymphocytes, monocytes, andgranulocytes) [13,14]. In this approach data obtainedfrom a target set comprised of DNA methylation pro-files from a heterogeneous mixture of cell populationsis assumed to be a high-dimensional multivariate sur-rogate for the underlying distribution of cell types.Houseman et al. [13], proposed a cell mixture decon-volution methodology – similar to regression calibra-tion – that involves the projection of DNA methylationprofiles from the target set onto a reference data set,which consists of the DNA methylation signatures forisolated leukocyte subtypes. Under certain constraints,the cell mixture deconvolution approach can be used toapproximate the underlying distribution of cell propor-tions within the target data via constrained projection.Application of this method to our data allowed us to es-timate the expected difference in cell type proportionsbetween ovarian cases and controls, as well as to predictthe proportion of the aforementioned leukocyte sub-types for each of the study samples. In addition, thesemethods allowed us to quantify the proportion of totaland systematic variability in peripheral blood DNAmexplained by estimated immune cell composition.Although this method has been shown to produce ac-
curate and reliable estimates of the underlying distribu-tion of cell type [44], we additionally investigated theconsistency of our results with an independent studypopulation. Specifically, we compared our estimates ofthe expected difference in cell type proportions betweenovarian cases and controls with the results reported inHouseman et al. [13]; which consisted of the applicationof the cell mixture methodology using blood-derivedmethylation data from n = 131 pretreatment EOC casesand n = 274 controls [12].
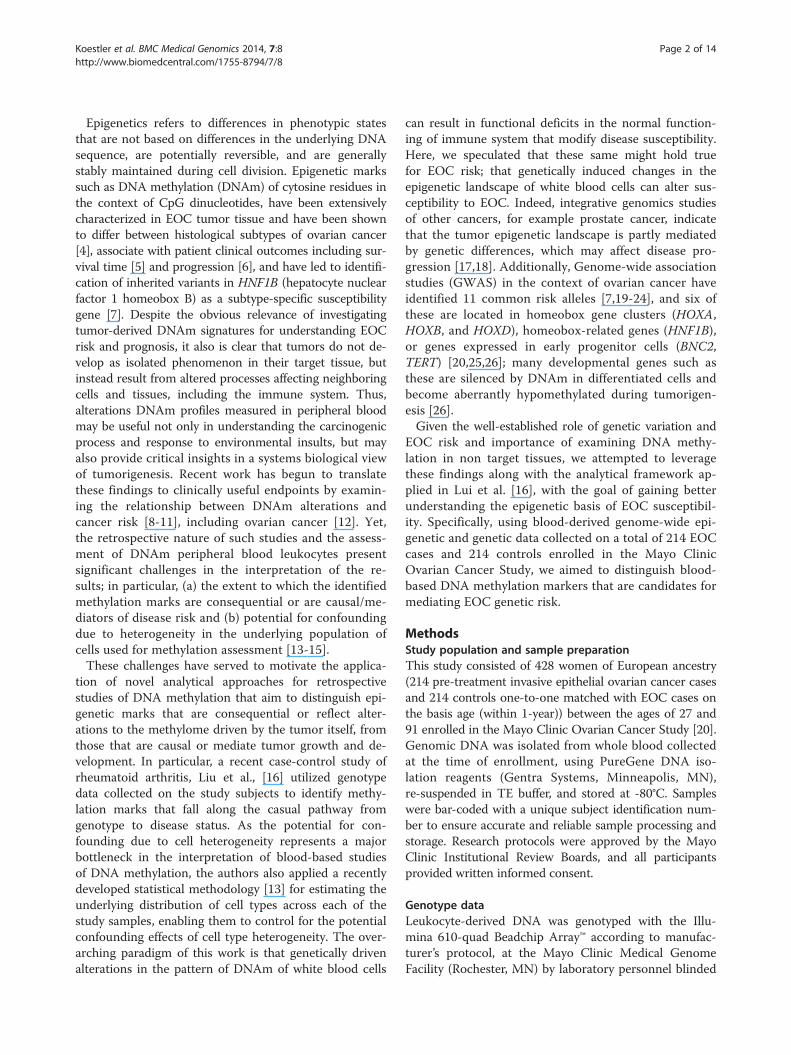
Causal inference test (CIT)In a manner similar to that described in Liu et al. [16],genotype (G), methylation (M), and phenotype (Y) rela-tionships were assessed using the causal inference test(CIT) [45] to classify them as “methylation mediated”,“methylation consequential” or “independent”. The CITis comprised of a series of conditional correlation ana-lyses that consider the possible directed relationshipsbetween a causal factor (genotype (G)), a potential medi-ator (methylation (M)) and an outcome (EOC status (Y))(Figure 1A). In order for methylation (M) to be classifiedas a mediator of genetic (G) risk for EOC (Y) the follow-ing conditions must be met: (1) G and Y are associated,(2) G is associated with M after adjustment for Y, (3) Mis associated with Y after adjusting for G, and (4) G is in-dependent of Y after adjusting for M (Figure 1B). When
Full Data (25,926 CpGs and 503,502 SNPs)
M Y M Y
M Y G M Y G
M Y G M Y G
1,933 CpGs significantly associated with EOC
427 CpG/SNP pairs (185 unique CpGs and 377
unique SNPs)
(1) EOC-associated differentially methylated CpGs
(2) Genotype-dependent methylation
(3) Genotype associated with both methylation and EOC
(4) CIT: CpGs that mediate genetic risk for EOC
28 CpG/SNP pairs (19 unique CpGs and 28
unique SNPs)
17 CpG/SNP pairs (13 unique CpGs and 17
unique SNPs)
Four components of CIT: (i) G and Y are associated (ii) G is associated with M after
adjusting for Y (iii) M is associated with Y after
adjusting for G (iv) G is independent of Y after
adjusting for M
G
M
Y Methylation Mediated
G
M
Y Consequential
G
M
Y Independent
A
B
C
Figure 1 Identification of epigenetically mediated genetic risk factors for EOC. (A) Directed acyclic graphs (DAGs) depicting the possiblerelationships between a causal factor (G), a potential mediator (M), and an outcome (Y). Top, DAG for the methylation-mediated relationship,wherein G acts on Y through M. Middle, DAG for the methylation-consequential (reverse causality) relationship, in which changes in M arise as aconsequence of Y. Bottom, DAG for the methylation-independent relationship, wherein G acts on M and Y independently. (B) The fourcomponents of the CIT. (C) Flow diagram illustrating the various filtering steps, and ensuing results, used to identify methylation sites that arecandidates for mediators of genetic risk for EOC.
Koestler et al. BMC Medical Genomics 2014, 7:8 Page 5 of 14http://www.biomedcentral.com/1755-8794/7/8
M is a consequence of Y or independently acted on byG (Figure 1A), there should be no difference in the effectof G on Y, when conditioning on M. However, when Mmediates the genetic risk for EOC, conditioning on Mshould substantially reduce the effect of G on Y [16,45].The CIT P-value was defined using the intersection-
union framework as the maximum of the component P-values for the first three of these conditions. G, M, andY relationships were considered methylation-mediatedif: the p-value obtained from the fourth condition abovewas > 0.05, indicating no statistically significant associ-ation between G and Y after adjustment for M; and theCIT P-value was < 0.05. Where appropriate, linear andlogistic regression models were used to examine the fourconditions comprising the CIT.To ease the computational burden that would ensue
from examining the above conditions for every G, M, andY trio (503,502 × 25,926 × 4 total tests), we implemented
the three step filtering procedure described in [16]. In thefirst step, the methylation status of each CpG, epigenome-wide, was examined for its association with Y. In step two,potential genetic regulators of methylation were identifiedby computing the pairwise relationship between each SNP,genome-wide, and each of CpG sites that were associatedwith Y in step 1. The final step involved an examination ofthe relationship between Y and each SNP that was identi-fied as statistically significant in step 2. The generalscheme of this analytic procedure is given in Figure 1C.
Identifying ovarian cancer-associated differentially meth-ylated CpGsTo discern differentially methylated CpGs between EOCcases and controls, we fit a series of linear regressionmodels, which modeled the methylation M-value for eachCpG as a function of ovarian case/control status. Modelswere adjusted for the estimated differential leukocyte cell

Koestler et al. BMC Medical Genomics 2014, 7:8 Page 6 of 14http://www.biomedcentral.com/1755-8794/7/8
counts described above, as well as age (continuous),current smoking status (yes vs. no), alcohol consump-tion (never, former, and current), study enrollment year(1999-2002, 2003, 2004, 2005, and 2006-2007), locationof residence (MN vs. other), parity and age at first birth(nulliparous, 1-2 at ≤ 20 yrs, 1-2 at > 20 yrs, 3+ at ≤ 20 yrs,and 3+ > 20 yrs), and the first principal component repre-senting within-European population sub-structure. Due tothe large number of tests being performed, we correctedfor multiple comparisons by computing the false discoveryrate (FDR) q-value [46].
Identifying genotype-dependent differentially methylatedCpGsAll epigenome-wide statistically significant (FDR q-value <0.05) ovarian cancer- associated differentially methylatedCpGs were subsequently examined based on their associ-ation with genotype using an additive minor-allele dosagemodel fit to all of the study subjects. Briefly, we useda series of linear regression models (# ovarian cancer-associated CpGs × # of SNPs) that modeled methylation M-values, as a function of the number of minor alleles for aspecific SNP. Genotype-methylation associations were ad-justed for multiple comparisons by computing the FDR q-value. A less stringent FDR q-value cutoff of 0.10 was usedto determine statistical significance, so as to limit falsenegative findings.
ResultsStudy populationThe study population considered here consisted of 428women of European ancestry (214 pre-treatment invasiveEOC cases and 214 controls) between the ages of 27 and91 enrolled in the Mayo Clinic Ovarian Cancer Study. Ofthe EOC cases (n = 214), 114 had tumors of serous hist-ology (66%), 49 tumors were endometriod (23%), 13 wereclear cell (6%), 5 were mucinous (2%) and 6 (3%) wereother/unknown. Further information on clinical, lifestyle,and demographic characteristics of the study population isprovided in Table 1 and Additional file 4. In general, base-line characteristics of EOC cases versus controls weresimilar to those estimated based on previous studies ofknown risk factors (Additional file 4).
Inferred immune cell subsets differ between ovariancases and controlsAs DNAm was profiled using genomic DNA from whole-blood, which is comprised of genetic substrate from va-rious leukocyte subtypes, the methylation signatures inour study population represent the aggregate methylationprofile across a complex cellular landscape. To examinethe predicted differences in the major leukocyte compo-nents of whole blood (i.e., B cells, natural killer (NK) cells,CD8+ T lymphocytes, CD4+ T lymphocytes, monocytes,
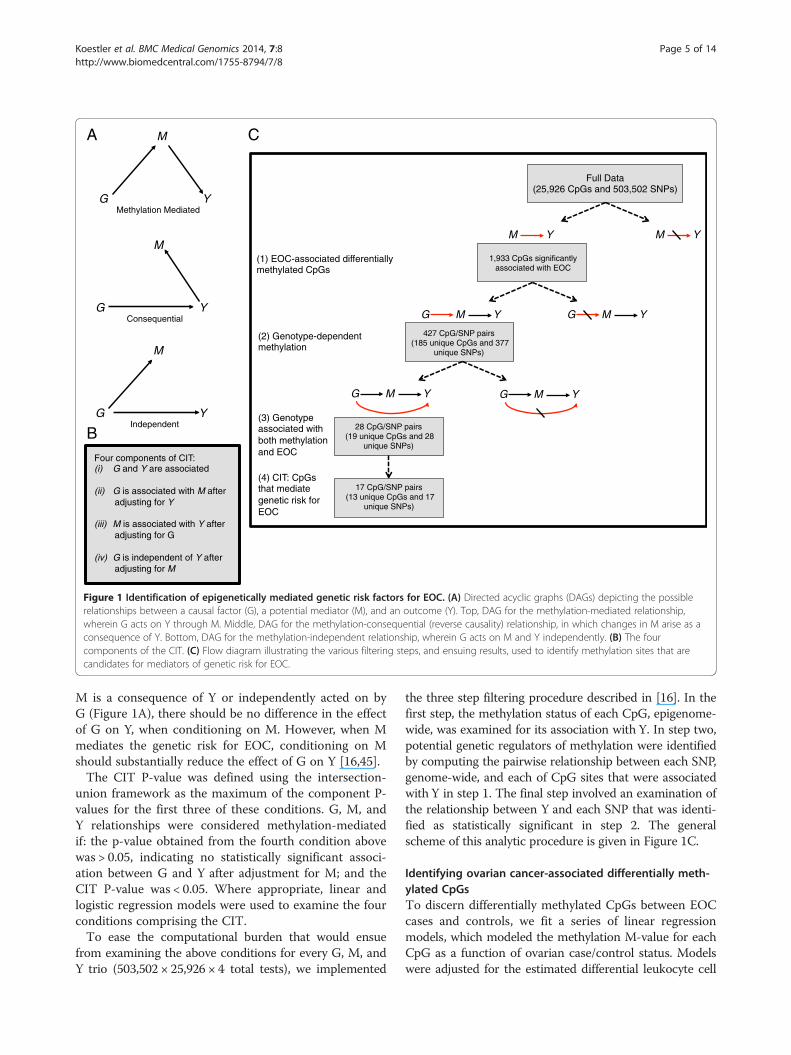
and granulocytes) we utilized the cell mixture methodologyof Houseman et al. [13]. This method uses a referencepanel consisting of the DNAm signatures of isolatedleukocyte subtypes to deconvolve the distribution of whiteblood cell types when DNAm is profiled in whole blood.As noted in Figure 2A, several of the estimated cell typeproportions showed statistically significant (p < 0.05) differ-ences between EOC cases and controls. More importantly,the relationship between cell type and EOC status washighly consistent between both batches of samples withinour study population and also with the results reported ina prior publication [13], which consisted of the applicationof the cell mixture methodology to an independent studypopulation of n = 131 pretreatment EOC cases and n = 274controls [12]. In particular, granulocyte fractions werehigher in EOC cases, while CD8+ T lymphocyte and CD4+T lymphocyte, and, to a lesser extent B cell and NK cellfractions, were lower in EOC cases compared to controls.These results combined with known methylation dif-
ferences by cell type suggest that it is critical and feasibleto adjust for the underlying distribution of cell typeswhen investigating the relationship between DNAm andEOC case/control status. In particular, Figure 2 showsthe epigenome-wide association between DNAm andEOC status (Batch 1 and 2 samples combined) before(Figure 2B,D) and after (Figure 2C,E) adjustment for theestimated cell type proportions, and demonstrates a sub-stantial reduction in the number of differentially methyl-ated CpGs by EOC case/control status upon adjustment.
Identifying CpG dinucleotides that mediate genetic riskfor EOCCase-control studies focused on the identification of pat-terns of differential DNAm in the context of diseasephenotypes are limited by their retrospective nature and,therefore, are unable to discriminate between patternsthat are a consequence of the disease and those that aremediators of disease risk. To filter out consequential epi-genetic marks in an attempt to understand biology re-lated to the cause of EOC, we adopted the frameworkdescribed by Liu et al. [16] for identifying epigeneticmarks that are candidate mediators of genetic risk forEOC. To identify instances in which genetic variationinfluences risk for EOC by regulating CpG-specific methy-lation patterns we performed a three-step filtering proced-ure followed by the Causal Inference Test (CIT) [45]. Inthe first filtering step, we conducted an epigenome-wideassociation study (EWAS) to identify CpGs differentiallymethylated by EOC case/control status. Using a series oflinear regression models that were adjusted the estimatedcell-type proportions and other key covariates, we found1,993 out of 25,926 (7.7%) CpGs were associated withEOC case/control status after controlling for multiplecomparisons (FDR, q < 0.05), step 1 Figure 1C, Additional

Table 1 Clinical characteristics for the study population
Batch 1(N = 132)
Batch 2(N = 296)
Total(N = 428)
EOC status
Control 66 (50.0%) 148 (50.0%) 214 (50.0%)
Case 66 (50.0%) 148 (50.0%) 214 (50.0%)
Age
Mean (SD) 60 (12) 63 (13) 62 (13)
Median 61 65 64
Q1, Q3 50, 69 54, 73 52, 72
Range (33–82) (27–91) (27–91)
Year enrolled
1999–2002 18 (13.6%) 164 (55.4%) 182 (42.5%)
2003 10 (7.6%) 36 (12.2%) 46 (10.7%)
2004 41 (31.1%) 33 (11.1%) 74 (17.3%)
2005 25 (18.9%) 23 (7.8%) 48 (11.2%)
2006–2007 38 (28.8%) 40 (13.5%) 78 (18.2%)
Parity, number of births
Nulliparous 24 (18.2%) 42 (14.2%) 66 (15.4%)
1-2,<=20 yrs 7 (5.3%) 14 (4.7%) 21 (4.9%)
1-2,>20 yrs 31 (23.5%) 84 (28.4%) 115 (26.9%)
3+,<=20 yrs 28 (21.2%) 47 (15.9%) 75 (17.5%)
3+,>20 yrs 40 (30.3%) 95 (32.1%) 135 (31.5%)
Smoking status (current)
No 120 (90.9%) 259 (87.5%) 379 (88.6%)
Yes 10 (7.6%) 19 (6.4%) 29 (6.8%)
State
Other 68 (51.5%) 120 (40.5%) 188 (43.9%)
Minnesota 64 (48.5%) 176 (59.5%) 240 (56.1%)
Alcohol consumption
Never 32 (24.2%) 71 (24.0%) 103 (24.1%)
Current 78 (59.1%) 152 (51.4%) 230 (53.7%)
Former 18 (13.6%) 47 (15.9%) 65 (15.2%)
Histology
Serous 43 (65.2%) 98 (66.2%) 141 (65.9%)
Mucinous 1 (1.5%) 4 (2.7%) 5 (2.3%)
Endometrioid 16 (24.2%) 33 (22.3%) 49 (22.9%)
Clear Cell 4 (6.1%) 9 (6.1%) 13 (6.1%)
Other 2 (3.0%) 4 (2.7%) 6 (2.8%)
Grade
Grade 1 1 (1.6%) 9 (6.1%) 10 (4.7%)
Grade 2 10 (15.6%) 21 (14.2%) 31 (14.6%)
Grade 3 32 (50.0%) 79 (53.4%) 111 (52.4%)
Grade 4 21 (32.8%) 39 (26.4%) 60 (28.3%)
Table 1 Clinical characteristics for the study population(Continued)
Stage
Stage 1 11 (16.7%) 29 (19.6%) 40 (18.7%)
Stage 2 3 (4.5%) 11 (7.4%) 14 (6.5%)
Stage 3 43 (65.2%) 84 (56.8%) 127 (59.3%)
Stage 4 9 (13.6%) 24 (16.2%) 33 (15.4%)
Koestler et al. BMC Medical Genomics 2014, 7:8 Page 7 of 14http://www.biomedcentral.com/1755-8794/7/8
file 5). As partial validation of these results, we examinedthe methylation of these 1,993 CpG loci in an independentstudy population [12]. Our validation analysis revealedthat 1,603 out of 1,993 CpG loci (80%) were significantlydifferentially methylated (FDR; q < 0.05), and of these1,603 loci, 94% exhibited the same direction of association(i.e., hyper versus hypomethylated) compared to the resultsobtained from our study population (Additional file 5).Similar to the models fit to our study population, modelsfit to the independent data were adjusted for the estimateddistribution of cell types and subject age; however smokingstatus, alcohol consumption, parity and population sub-structure variables were not available in these data andtherefore could not be used for adjustment.In an attempt to identify CpGs where methylation might
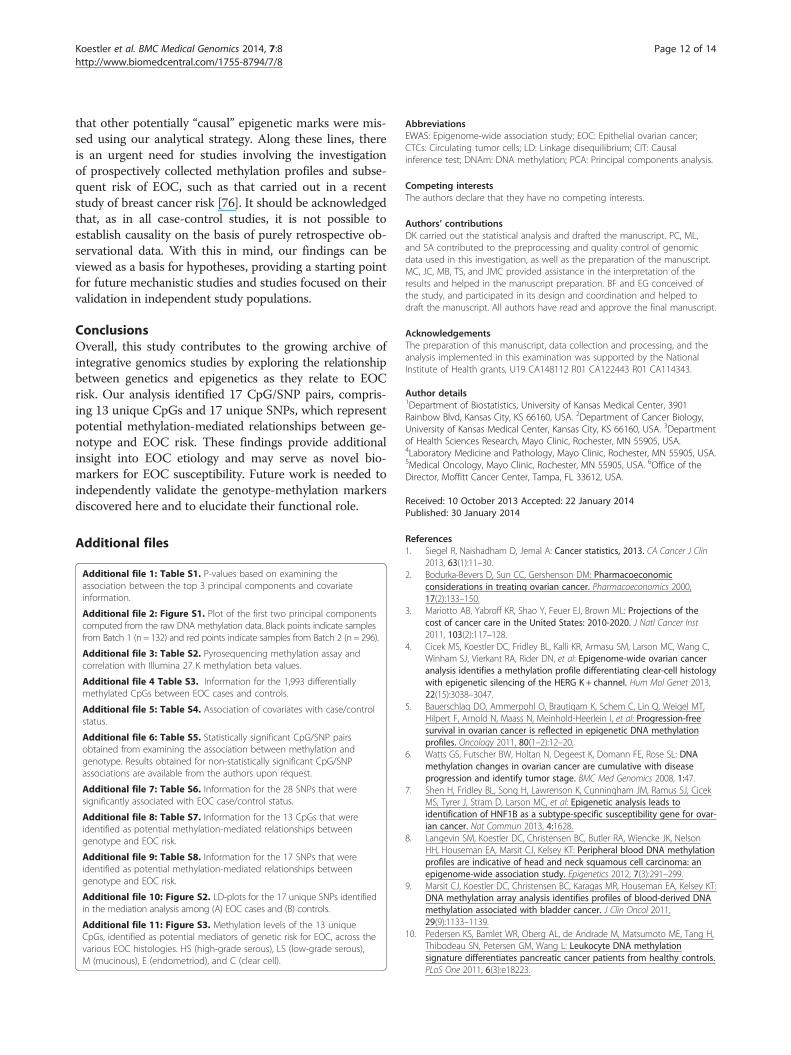
be genetically influenced, we performed a genome-wideSNP association analysis for each of the 1,993 CpG locithat were differentially methylated between EOC casesand controls. Fitting an allelic dosage model to each ofthese CpGs and each of 503,502 SNPs, we identified 427CpG-SNP pairs with genome-wide statistical significance(FDR; q <0.10) (step 2 Figure 1C, Additional file 6). These427 CpG-SNP pairs constituted 377 unique SNPs and 185unique CpGs, and these CpG loci were disproportionatelylocated in CpG islands (Fisher’s Exact; p = 0.017); CpG-dense regions present in the promoters of 50%–70% ofhuman genes. Nonetheless, it is still possible that thedifferential patterns of methylation observed for these185 CpGs are a consequence of EOC or independentlyacted on by genotype. To address this concern, we nextexamined the association between the 377 unique SNPsand EOC status. Of the 377 SNPs, we identified 28 thatwere significantly associated with EOC status at P < 0.05(Additional file 7). These 28 SNPs form 28 CpG-SNPpairs with 19 unique CpGs (step 3 Figure 1C). Imple-menting the CIT test, we found that the SNP associ-ation with EOC was attenuated upon adjustment formethylation for 17 of the 28 CpG-SNP pairs (61%), sug-gesting mediation (Figure 3). These 17 CpG-SNP pairsconstituted 13 unique CpGs and 17 unique SNPs andrepresent potential methylation-mediated relationshipsbetween genotype and EOC risk (step 4 Figure 1C,Table 2). Information regarding the genomic locationand additional annotation for these CpGs and SNPs isprovided in Additional files 8 and 9, respectively.

-10 -5 0 5 10 15
Estimated Cell-type difference (Cases(%) - Controls (%))
Gran
Mono
Bcell
NK
CD4T
CD8T
P-value
Den
sity
0.0 0.2 0.4 0.6 0.8 1.0
01
23
45
-0.2 0.0 0.2 0.4 0.6
12
34
Difference in methylation (Cases - Controls)
log 1
0(q-
valu
e)
P-value
Den
sity
0.0 0.2 0.4 0.6 0.8 1.0
02
46
-0.5 0.0 0.5
05
1015
Difference in methylation (Cases - Controls)
log 1
0(q-
valu
e)
Batch 1 (ncases = 66, ncontrols = 66)
Batch 2 (ncases = 148, ncontrols = 148)
Houseman et al. (2012) (ncases = 131, ncontrols = 274)
A B CUnadjusted for cell type Adjusted for cell type
D E
Indicates a statistically significant (p < 0.05) difference in the estimated cell-type difference between EOC cases and controls
Figure 2 Differential cell distributions in EOC cases. (A) Estimated difference in leukocyte subtypes (i.e., CD8+ T-lymphocytes (CD8T), CD4+T-lymphocytes (CD4T), natural killer cells (NK), B cells (Bcell), monocytes (Mono), and granulocytes (Gran)) between EOC cases and controls. Barsreflect the 95% confidence interval for the difference in cell distributions between EOC cases and controls. (B, C) Histograms of P-values obtainedfrom examining the association between DNAm and EOC case/control status, (B) unadjusted for estimated cell distribution and (C) adjusted forthe estimated cell distribution. Dashed line is the density histogram that is expected if all CpGs were null (not differentially methylated) and thedotted line is at the height of our estimate of the proportion of null p-values. (D, E) Volcano plots of –log10(q-value) against the estimated difference inmethylation between EOC cases and controls, (D) unadjusted for estimated cell distribution and (E) adjusted for the estimated cell distribution. Redand blue dashed lines indicate –log10(q = 0.05) and –log10(q = 0.10), respectively. Each model was fit to the combined data from the Batch 1 and 2samples (n = 428) and were adjusted for age, smoking status, alcohol consumption, study enrollment year, location of residence, parity, andpopulation substructure.
Koestler et al. BMC Medical Genomics 2014, 7:8 Page 8 of 14http://www.biomedcentral.com/1755-8794/7/8
Examining the linkage-disequalibrium (LD) structureamong the 17 unique SNPs identified in our analysisshowed that most of the identified SNPs were uncorre-lated at r2 < 0.05, with the exception of rs1250220 andrs1250252 located in an intragenic region on chro-mosome 2q35 and rs6754181, rs2631958, rs2254066,located in an intron region associated with ALK (ana-plastic lymphoma receptor tyrosine kinase) (Additionalfile 10). The 17 CpG-SNP pairs highlight 13 CpG loci;all loci correlate with a single SNP or SNP cluster, al-though cg10636246 located near AIM2 demonstratedan association with two independent SNPs with dif-ferent genomic locations (rs11120596 (p = 8 × 10⁻⁷) andrs460380 (p = 5 × 10⁻⁷)) (Table 2).As differences in tumor DNAm, epidemiologic risk
factors, genetic variants, and precursor tissues are known
to exist between the major EOC histologies (serous,mucinous, endometrioid, and clear cell) [4], we eva-luated whether the 13 unique methylation mediatorsexhibited consistent patterns of methylation in a case-only analysis across EOC subtypes. With the ex-ception of cg25553916 located in the promoter regionof FLJ22318 (required for meiotic nuclear division 5homolog B), which showed increased methylation inmucinous cases (p = 0.006), the methylation levels ofthe 12 remaining CpG loci were not statistically significantdifferent across the histologies of EOC (Additional file 11).Interestingly, this locus was the only one among the13 that did not exhibit the same direction of associationwith EOC comparing our results to those from theTeschendorff et al. [12] data (Table 2 and Additionalfile 5).

cg10061138, rs11884397
M Y M Y G
M Y G Y G M
0.1
0.2
0.3
0.4
Genotype
Met
hyla
tion
-val
ue
AA Aa aa
-2-1
01
2
0.1
0.2
0.3
0.4
Phenotype (EOC status)
Met
hyla
tion
-val
ue
Control Case
Genotype
Per
cent
age
of c
ases
(%
)
020
4060
8010
0
AA Aa aa
A B
C D
AA (n = 287) Aa (n = 125)
aa (n = 16)
cg25553916, rs2254066
cg25553916, rs6754181
AA (n = 115) Aa (n = 217)
aa (n = 95)
cg09822001, rs2919303
AA (n = 162) Aa (n = 217)
aa (n = 49)
cg10636246, rs460380
AA (n = 298) Aa (n = 117)
aa (n = 13)
0.70 0.75 0.80 0.85
Methylation -value
Den
sity
0.70 0.75 0.80 0.85
Methylation -value
Den
sity
0.05 0.10 0.15 0.20 0.25
Methylation -value
Den
sity
0.10 0.15 0.20 0.25 0.30 0.35
Methylation -value
Den
sity
E F
G H
Figure 3 Genotype-dependent candidate CpGs that mediate genetic risk for EOC. (Left) Plot depicting the DNAm status of cg10061138,associated with gene STAB1, between (A) EOC cases and controls and by genotype at SNP rs11884397 (B). Red lines denote the median methylationlevels. (C) Percentage of EOC cases by the number of minor alleles for SNP rs11884397. (D) Coefficient (β) reflects the log-odds of EOC for a one-unitincrease in the number of minor alleles for SNP rs11884397 with and without adjustment for the methylation levels of cg10061138. Bars represent the95% CI for the estimate of the log-odds (i.e., β). (E-H) Density plots of DNAm by genotype (AA = green, Aa = red, and aa = blue) for four EOC–associatedCpGs; solid lines indicate the methylation distribution for EOC cases and dotted lines indicate the methylation distribution for controls.
Koestler et al. BMC Medical Genomics 2014, 7:8 Page 9 of 14http://www.biomedcentral.com/1755-8794/7/8
DiscussionAttempts aimed at distinguishing causal methylation marksfrom those that are merely a consequence of disease arecritical for elucidating the biological mechanisms under-lying this disease. Previous analyses of genetic regulators ofmethylation and expression levels have revealed three-waycausal relationships, where the prevailing model is one inwhich genetic variation influences methylation that in turninfluences expression levels. The idea that DNA methy-lation levels at specific loci are under genetic control hasgained traction in recent years, bolstered by the resultsobtained from comparing patterns of DNA methylationbetween monozygotic and dizygotic twins [47]. Here, weaimed to leverage these findings in an attempt to filter outepigenetic marks resulting from disease, focusing our at-tention on the identification of epigenetic marks that arepotential mediators of genetic risk for EOC. Not only aresuch analyses critical for our understanding of EOC patho-genesis, but the genotype-methylation markers identifiedthrough such efforts may further enhance the growinglibrary of risk-associated biomarkers for EOC.Associations between genetic variation with expression
and methylation levels have been identified in several or-ganisms [48,49] and tissue types [50]. While recent work
has demonstrated both local (cis) and distal (trans) associa-tions of genetic variation with methylation levels [51-53],little is known about the precise biological mechanisms bywhich genetic variants modify DNA methylation. All of themethylation-genotype pairs identified in our analysis in-dicated trans regulation, or distant regulation effects.Although none of the 17 SNPs identified in our analysishave been previously identified as reaching genome-widestatistical significance in GWAS of ovarian cancer, of par-ticular importance was the identification of ALK as a po-tential regulator of CpG-specific DNAm and genetic riskmarker for EOC. This gene encodes a receptor tyrosinekinase belonging to the insulin receptor superfamily, andhas been found to be rearranged, mutated, or amplified ina series of human cancer tumorigenesis [54-56]. Recentwork has demonstrated methylation induced silencing ofIL-2Rγ expression in in T-cell lymphoma cells expressingNPM-ALK kinase [57], which originates from fusion of thenucleophosmin (NPM) and the membrane receptor ana-plastic lymphoma kinase genes. IL-2Rγ is shared by re-ceptors for several cytokines that play key roles in thematuration and growth of normal CD4+ T lymphocytesand other immune cells. Thus, it is possible that geneticvariation in ALK contributes to epigenetic modifications

Table 2 CpG sites that were identified as potential mediators of genetic risk for EOC (CIT p < 0.05)
CpGs associated with EOC SNPs associated with CpGs
CpG Meth diff P-value(M vs Y)
Gene Chr Pos SNP Chr Pos P-value(G vs M)
P-value(G vs Y)
P-value(CIT)
cg03718677 -0.08 4.60E-03 TMOD4 1 149414890 rs1250220 2 216320050 2.30E-07 0.023 0.023
cg03718677 -0.08 4.60E-03 TMOD4 1 149414890 rs1250252 2 216313591 1.70E-07 0.029 0.029
cg09822001 0.11 5.50E-04 APOA1BP 1 154827958 rs2919303 8 62214493 1.50E-07 0.027 0.027
cg10636246 -0.11 2.70E-04 AIM2 1 157313597 rs11120596 1 215850817 7.60E-07 0.002 0.002
cg10636246 -0.11 2.70E-04 AIM2 1 157313597 rs460380 21 46028864 5.30E-07 0.01 0.01
cg13721560 0.07 7.90E-03 LRPPRC 2 44076072 rs2289840 3 124181739 9.40E-08 0.041 0.041
cg10061138 -0.09 8.30E-04 STAB1 3 52504125 rs11884397 2 23885388 3.10E-07 0.002 0.002
cg25086702 0.1 1.70E-03 HMGB2 4 174492134 rs11210834 1 43787437 7.10E-08 0.048 0.048
cg24136586 0.1 5.50E-03 ATG10 5 81304122 rs3800524 6 168302015 1.80E-06 0.034 0.034
cg01495509 0.08 5.30E-03 KCNMB1 5 169748956 rs4457945 15 54608127 2.20E-08 0.019 0.019
cg25553916 0.06 6.90E-04 FLJ22318 5 177491361 rs2254066 2 29889019 2.60E-07 0.003 0.003
cg25553916 0.06 6.90E-04 FLJ22318 5 177491361 rs2631958 2 29958841 7.10E-07 0.009 0.009
cg25553916 0.06 6.90E-04 FLJ22318 5 177491361 rs6754181 2 29966380 3.10E-07 0.003 0.003
cg19436567 0.12 1.50E-04 ARID1B 6 157141067 rs12362925 11 16875419 7.80E-08 0.029 0.029
cg08142684 0.13 2.70E-04 TCP1 6 160129858 rs9792311 8 123940585 7.40E-07 0.023 0.023
cg05109049 0.09 5.30E-03 EVI2B 17 26665459 rs2294405 6 99292136 1.60E-06 0.013 0.013
cg00021527 0.09 5.20E-03 TAF15 17 31160293 rs10488500 7 76841259 2.50E-07 0.046 0.046
M: Methylation, G: Genotype, Y: EOC status.Methdiff: Difference in the methylation M-value between EOC cases minus controls, adjusted for the estimated distribution of cell types, age, smoking status,alcohol consumption, study enrollment year, location of residence, parity and age at first birth, and the first principal component representing within-Europeanpopulation sub-structure.Gene: Denotes the nearest gene for the given CpG site.
Koestler et al. BMC Medical Genomics 2014, 7:8 Page 10 of 14http://www.biomedcentral.com/1755-8794/7/8
that alter the normal functioning of immune cells, howeverthe exact biological mechanisms by which ALK exerts aninfluence on DNA methylation is unclear.It is also compelling that the predicted distribution of
immune cell subsets in our data, which showed in-creased myeloid derived cell types (e.g., monocytes andgranulocytes) and decreased lymphocytes (e.g., CD8+ Tlymphocytes, CD4+ T lymphocytes, B cells, and naturalkiller cells) between EOC cases and controls, mimickedthe results obtained when applying the cell mixturemethodology to an independent study population. Therelationship between predicted cell type distributionsand cancer status are consistent with previous literature,where it has been demonstrated that EOC cases havedecreased B and T-lymphocyte fractions [41-43] andincreases in neutrophil granulocytes [43]. While modestvariation was observed in the estimated cell type dif-ferences between EOC cases and controls between thedifferent study populations, particularly for CD8+ T-lymphocytes, this is not entirely unexpected given dif-ferences in the distribution of ovarian cancer histologicalsubtypes between the study populations (Table 1;Teschendorff et al. [12]) and that variation in host im-mune responses to EOC has been shown to vary byhistological subtype [58].
Our analysis identified cg25086702 as a potential me-diator of genetic risk for EOC. This particular locus re-sides in CpG island region located in HMGB2 (highmobility group protein 2) and was found to be hyper-methylated in EOC in the present analysis (β = 0.10, 95%CI [0.04, 0.16]). High mobility group box (HMGB) pro-teins are ubiquitous, abundant nuclear proteins with di-verse functions in the cell. HMGB1 and HMGB2 are themain members of the HMGB protein family and theiroverexpression has been observed in numerous humanmalignancies, including hepatocellular [59], skin squa-mous cell [60], prostate [61], gastrointestinal [62,63]breast [64,65], and bladder carcinomas [66]. Addition-ally, a recent report demonstrated increased expressionof HMGB2 in invasive EOC tumors compared to EOCtumors with low malignancy potential [67]. However,many of the results demonstrating HMGB2 overexpres-sion were based on measurements derived from tumortissue, and far less is known about the implications ofdysregulated HMGB2 expression in peripheral bloodleukocytes and its role in cancer risk. While it is possiblethat our observation of increased CpG island methyla-tion of HMGB2 in EOC cases is due to the methylationsignature arising from circulating tumor cells (CTCs),this is unlikely as CTCs would be expected to comprise

Koestler et al. BMC Medical Genomics 2014, 7:8 Page 11 of 14http://www.biomedcentral.com/1755-8794/7/8
a small fraction of the total cells used in assessing DNAm[68], and thus contribute insignificantly to the overallmethylation signatures analyzed. Also, given the role CpGisland hypermethylation on gene silencing and the numer-ous reports of HMGB overexpression in tumor tissue, wemight expect to see the opposite results (i.e., CpG islandhypomethlation of HMGB2) if in fact, CTCs were drivingforce behind the methylation signals detected here. An al-ternative explanation for these findings is motivated bythe role of HMGB1, a closely related gene, in immuneresponse in adult peripheral blood. HMGB1 recruits in-flammatory cells and activates innate immune cells. Fur-thermore, after being secreted by activated macrophagesor its release from necrotic cells, HMGB1 regulates adap-tive immunity [69-71]. Thus, CpG island hypermethyla-tion induced silencing of HMGB1 and possibly otherHMGB genes, may compromise the immune system, pro-moting tumor development and progression.Our analysis also identified cg05109049 (β = 0.09, 95%
CI [0.03, 0.16]), associated with EVI2B (Ecotropic ViralIntegration Site 2B Protein), as a potential mediator ofgenetic risk for EOC. EVI2B is expressed in peripheralblood mononuclear cells, fibroblasts, and bone marrowand blood-based overexpression of this gene was recentlyreported in postoperative relapse of colorectal cancer [72].Another notable discovery from our analysis was hyper-methylation of cg00021527 (β = 0.09, 95% CI [0.03, 0.15]),residing in a CpG Island region located in the gene TAF15(TATA box-binding protein-associated factor 2 N 68 kDa),which together with FUS (fused in sarcoma) and EWS(Ewing sarcoma breakpoint 1), constitute the FET proteinfamily. The FET-proteins are involved in transcriptionalregulation and RNA processing, and FET-gene deregula-tion is associated with development of cancer. In particu-lar, a recent report demonstrated that TAF15 knockdownaffects the expression of a large subset of genes, includingmany involved in cell cycle and cell death [73]. Together,these findings highlight the biological relevance of themethylation sites identified in our investigation and theirpotential role in the pathogenesis of EOC.There are several noteworthy limitations to the present
study. First, the relatively small sample size and largenumber of genotype/methylation markers, reduces ourstatistical power for detecting genotype/methylation asso-ciations. To address the burden of multiple comparisonsarising from the large number of genotype/methylationmarkers, we employed an analytical strategy that is basedon a series of filtering steps, resulting in many fewer over-all tests than an analysis considering all possible genotype,methylation, and phenotype combinations. Further, whileIllumina Infinium HumanMethylation27 BeadChip pro-vides an efficient solution for surveying genome-wideDNA methylation profiles, the lower coverage and scopeof this array compared to more recent array technologies,
e.g., Illumina Infinium HumanMethylation450 BeadChip,may have limited our ability for detecting methylation me-diators of EOC genetic risk.With regard to our sample size, efforts to replicate the
analysis described here using a larger group of studysubjects as both a validation of our existing results, andto identify additional methylation sites that mediategenetic risk for EOC is ongoing research by our group.Moreover, we additionally evaluated the results of ourEWAS analysis using a previously published data set, whichconsisted of whole-blood derived methylation data –assayed using the same array technology – collected frompre-treatment EOC cases and controls. Unlike our data,genotypic information was not available on those subjects,preventing a complete validation of the genotype-methylation pairs identified here. However, the fact that 12of the 13 (92%) CpGs representing potential methylation-mediated relationships between genotype and EOC riskdemonstrated the same direction of association with EOCstatus is encouraging and serves as motivation for the con-tinued and future study of these markers.A second consideration of this work involves the po-
tential for confounding based on interpersonal variabilitythe distribution of cell types used in assessing DNAmethylation. While previous reports involving blood-based assessment of DNA methylation have controlledfor cell mixture using complete-blood cell count (CBC)measurements [74,75], such measurements are not cap-able of distinguishing between different lymphocytesubtypes and may be an oversimplification of the com-plexity and variability in circulating immune cells. Here,we employed a recently developed statistical method forpredicting the distribution of the major leukocyte com-ponents of whole blood, followed by their inclusion asadditional covariates in our methylation association ana-lyses. It should be noted that the cell type predictionsobtained using this approach are themselves estimatesand therefore subject to uncertainty. Computationallyefficient statistical approaches that facilitate the propaga-tion of this uncertainty into locus-specific differentialmethylation analyses are urgently needed and representan opportunity for future methodological work.A limitation of EWAS aimed toward understanding
the molecular basis of complex phenotypes over conven-tional GWAS, is that the methylation sites identifiedfrom EWAS may be a consequence of the disease or dueto treatment, rather than true biomarkers of disease risk.We attempted to address this limitation by focusing ouranalysis on pre-treatment EOC cases and through theimplementation of a statistical mediation framework thatwas recently shown to be an effective tool in the analysisof data arising from EWAS [16]. We do however note thatin focusing on the identification of candidate methylationmediators of EOC genetic risk, it is possible, and likely,
Koestler et al. BMC Medical Genomics 2014, 7:8 Page 12 of 14http://www.biomedcentral.com/1755-8794/7/8
that other potentially “causal” epigenetic marks were mis-sed using our analytical strategy. Along these lines, thereis an urgent need for studies involving the investigationof prospectively collected methylation profiles and subse-quent risk of EOC, such as that carried out in a recentstudy of breast cancer risk [76]. It should be acknowledgedthat, as in all case-control studies, it is not possible toestablish causality on the basis of purely retrospective ob-servational data. With this in mind, our findings can beviewed as a basis for hypotheses, providing a starting pointfor future mechanistic studies and studies focused on theirvalidation in independent study populations.
ConclusionsOverall, this study contributes to the growing archive ofintegrative genomics studies by exploring the relationshipbetween genetics and epigenetics as they relate to EOCrisk. Our analysis identified 17 CpG/SNP pairs, compris-ing 13 unique CpGs and 17 unique SNPs, which representpotential methylation-mediated relationships between ge-notype and EOC risk. These findings provide additionalinsight into EOC etiology and may serve as novel bio-markers for EOC susceptibility. Future work is needed toindependently validate the genotype-methylation markersdiscovered here and to elucidate their functional role.
Additional files
Additional file 1: Table S1. P-values based on examining theassociation between the top 3 principal components and covariateinformation.
Additional file 2: Figure S1. Plot of the first two principal componentscomputed from the raw DNA methylation data. Black points indicate samplesfrom Batch 1 (n = 132) and red points indicate samples from Batch 2 (n = 296).
Additional file 3: Table S2. Pyrosequencing methylation assay andcorrelation with Illumina 27 K methylation beta values.
Additional file 4 Table S3. Information for the 1,993 differentiallymethylated CpGs between EOC cases and controls.
Additional file 5: Table S4. Association of covariates with case/controlstatus.
Additional file 6: Table S5. Statistically significant CpG/SNP pairsobtained from examining the association between methylation andgenotype. Results obtained for non-statistically significant CpG/SNPassociations are available from the authors upon request.
Additional file 7: Table S6. Information for the 28 SNPs that weresignificantly associated with EOC case/control status.
Additional file 8: Table S7. Information for the 13 CpGs that wereidentified as potential methylation-mediated relationships betweengenotype and EOC risk.
Additional file 9: Table S8. Information for the 17 SNPs that wereidentified as potential methylation-mediated relationships betweengenotype and EOC risk.
Additional file 10: Figure S2. LD-plots for the 17 unique SNPs identifiedin the mediation analysis among (A) EOC cases and (B) controls.
Additional file 11: Figure S3. Methylation levels of the 13 uniqueCpGs, identified as potential mediators of genetic risk for EOC, across thevarious EOC histologies. HS (high-grade serous), LS (low-grade serous),M (mucinous), E (endometriod), and C (clear cell).
AbbreviationsEWAS: Epigenome-wide association study; EOC: Epithelial ovarian cancer;CTCs: Circulating tumor cells; LD: Linkage disequilibrium; CIT: Causalinference test; DNAm: DNA methylation; PCA: Principal components analysis.
Competing interestsThe authors declare that they have no competing interests.
Authors’ contributionsDK carried out the statistical analysis and drafted the manuscript. PC, ML,and SA contributed to the preprocessing and quality control of genomicdata used in this investigation, as well as the preparation of the manuscript.MC, JC, MB, TS, and JMC provided assistance in the interpretation of theresults and helped in the manuscript preparation. BF and EG conceived ofthe study, and participated in its design and coordination and helped todraft the manuscript. All authors have read and approve the final manuscript.
AcknowledgementsThe preparation of this manuscript, data collection and processing, and theanalysis implemented in this examination was supported by the NationalInstitute of Health grants, U19 CA148112 R01 CA122443 R01 CA114343.
Author details1Department of Biostatistics, University of Kansas Medical Center, 3901Rainbow Blvd, Kansas City, KS 66160, USA. 2Department of Cancer Biology,University of Kansas Medical Center, Kansas City, KS 66160, USA. 3Departmentof Health Sciences Research, Mayo Clinic, Rochester, MN 55905, USA.4Laboratory Medicine and Pathology, Mayo Clinic, Rochester, MN 55905, USA.5Medical Oncology, Mayo Clinic, Rochester, MN 55905, USA. 6Office of theDirector, Moffitt Cancer Center, Tampa, FL 33612, USA.
Received: 10 October 2013 Accepted: 22 January 2014Published: 30 January 2014
References1. Siegel R, Naishadham D, Jemal A: Cancer statistics, 2013. CA Cancer J Clin
2013, 63(1):11–30.2. Bodurka-Bevers D, Sun CC, Gershenson DM: Pharmacoeconomic
considerations in treating ovarian cancer. Pharmacoeconomics 2000,17(2):133–150.
3. Mariotto AB, Yabroff KR, Shao Y, Feuer EJ, Brown ML: Projections of thecost of cancer care in the United States: 2010-2020. J Natl Cancer Inst2011, 103(2):117–128.
4. Cicek MS, Koestler DC, Fridley BL, Kalli KR, Armasu SM, Larson MC, Wang C,Winham SJ, Vierkant RA, Rider DN, et al: Epigenome-wide ovarian canceranalysis identifies a methylation profile differentiating clear-cell histologywith epigenetic silencing of the HERG K + channel. Hum Mol Genet 2013,22(15):3038–3047.
5. Bauerschlag DO, Ammerpohl O, Brautigam K, Schem C, Lin Q, Weigel MT,Hilpert F, Arnold N, Maass N, Meinhold-Heerlein I, et al: Progression-freesurvival in ovarian cancer is reflected in epigenetic DNA methylationprofiles. Oncology 2011, 80(1–2):12–20.
6. Watts GS, Futscher BW, Holtan N, Degeest K, Domann FE, Rose SL: DNAmethylation changes in ovarian cancer are cumulative with diseaseprogression and identify tumor stage. BMC Med Genomics 2008, 1:47.
7. Shen H, Fridley BL, Song H, Lawrenson K, Cunningham JM, Ramus SJ, CicekMS, Tyrer J, Stram D, Larson MC, et al: Epigenetic analysis leads toidentification of HNF1B as a subtype-specific susceptibility gene for ovar-ian cancer. Nat Commun 2013, 4:1628.
8. Langevin SM, Koestler DC, Christensen BC, Butler RA, Wiencke JK, NelsonHH, Houseman EA, Marsit CJ, Kelsey KT: Peripheral blood DNA methylationprofiles are indicative of head and neck squamous cell carcinoma: anepigenome-wide association study. Epigenetics 2012, 7(3):291–299.
9. Marsit CJ, Koestler DC, Christensen BC, Karagas MR, Houseman EA, Kelsey KT:DNA methylation array analysis identifies profiles of blood-derived DNAmethylation associated with bladder cancer. J Clin Oncol 2011,29(9):1133–1139.
10. Pedersen KS, Bamlet WR, Oberg AL, de Andrade M, Matsumoto ME, Tang H,Thibodeau SN, Petersen GM, Wang L: Leukocyte DNA methylationsignature differentiates pancreatic cancer patients from healthy controls.PLoS One 2011, 6(3):e18223.

Koestler et al. BMC Medical Genomics 2014, 7:8 Page 13 of 14http://www.biomedcentral.com/1755-8794/7/8
11. Wang L, Aakre JA, Jiang R, Marks RS, Wu Y, Chen J, Thibodeau SN, PankratzVS, Yang P: Methylation markers for small cell lung cancer in peripheralblood leukocyte DNA. J Thorac Oncol 2010, 5(6):778–785.
12. Teschendorff AE, Menon U, Gentry-Maharaj A, Ramus SJ, Gayther SA, Apos-tolidou S, Jones A, Lechner M, Beck S, Jacobs IJ, et al: An epigeneticsignature in peripheral blood predicts active ovarian cancer. PLoS One2009, 4(12):e8274.
13. Houseman EA, Accomando WP, Koestler DC, Christensen BC, Marsit CJ,Nelson HH, Wiencke JK, Kelsey KT: DNA methylation arrays as surrogatemeasures of cell mixture distribution. BMC Bioinforma 2012, 13(1):86.
14. Koestler DC, Marsit CJ, Christensen BC, Accomando W, Langevin SM,Houseman EA, Nelson HH, Karagas MR, Wiencke JK, Kelsey KT: Peripheralblood immune cell methylation profiles are associated withnonhematopoietic cancers. Cancer Epidemiol Biomarkers Prev 2012,21(8):1293–1302.
15. Reinius LE, Acevedo N, Joerink M, Pershagen G, Dahlen SE, Greco D,Soderhall C, Scheynius A, Kere J: Differential DNA methylation in purifiedhuman blood cells: implications for cell lineage and studies on diseasesusceptibility. PLoS One 2012, 7(7):e41361.
16. Liu Y, Aryee MJ, Padyukov L, Fallin MD, Hesselberg E, Runarsson A, Reinius L,Acevedo N, Taub M, Ronninger M, et al: Epigenome-wide association dataimplicate DNA methylation as an intermediary of genetic risk inrheumatoid arthritis. Nat Biotechnol 2013, 31(2):142–147.
17. Lin PC, Giannopoulou EG, Park K, Mosquera JM, Sboner A, Tewari AK,Garraway LA, Beltran H, Rubin MA, Elemento O: Epigenomic alterations inlocalized and advanced prostate cancer. Neoplasia 2013, 15(4):373–383.
18. Baylin SB, Jones PA: A decade of exploring the cancer epigenome -biological and translational implications. Nat Rev Cancer 2011,11(10):726–734.
19. Bolton KL, Tyrer J, Song H, Ramus SJ, Notaridou M, Jones C, Sher T, Gentry-Maharaj A, Wozniak E, Tsai YY, et al: Common variants at 19p13 areassociated with susceptibility to ovarian cancer. Nat Genet 2010,42(10):880–884.
20. Goode EL, Chenevix-Trench G, Song H, Ramus SJ, Notaridou M, LawrensonK, Widschwendter M, Vierkant RA, Larson MC, Kjaer SK, et al: A genome-wideassociation study identifies susceptibility loci for ovarian cancer at 2q31and 8q24. Nat Genet 2010, 42(10):874–879.
21. Song H, Ramus SJ, Tyrer J, Bolton KL, Gentry-Maharaj A, Wozniak E, Anton-Culver H, Chang-Claude J, Cramer DW, DiCioccio R, et al: A genome-wideassociation study identifies a new ovarian cancer susceptibility locus on9p22.2. Nat Genet 2009, 41(9):996–1000.
22. Pharoah PD, Tsai YY, Ramus SJ, Phelan CM, Goode EL, Lawrenson K, BuckleyM, Fridley BL, Tyrer JP, Shen H, et al: GWAS meta-analysis and replicationidentifies three new susceptibility loci for ovarian cancer. Nat Genet 2013,45(4)):362–370. 370e361-362.
23. Bojesen SE, Pooley KA, Johnatty SE, Beesley J, Michailidou K, Tyrer JP,Edwards SL, Pickett HA, Shen HC, Smart CE, et al: Multiple independentvariants at the TERT locus are associated with telomere length and risksof breast and ovarian cancer. Nat Genet 2013, 45(4):371–384. 384e371-372.
24. Permuth-Wey J, Lawrenson K, Shen HC, Velkova A, Tyrer JP, Chen Z, Lin HY,Chen YA, Tsai YY, Qu X, et al: Identification and molecular characterizationof a new ovarian cancer susceptibility locus at 17q21.31. Nat Commun2013, 4:1627.
25. Painter JN, Anderson CA, Nyholt DR, Macgregor S, Lin J, Lee SH, Lambert A,Zhao ZZ, Roseman F, Guo Q, et al: Genome-wide association studyidentifies a locus at 7p15.2 associated with endometriosis. Nat Genet2011, 43(1):51–54.
26. Cedar H, Bergman Y: Programming of DNA methylation patterns. AnnuRev Biochem 2012, 81:97–117.
27. Permuth-Wey J, Kim D, Tsai YY, Lin HY, Chen YA, Barnholtz-Sloan J, BirrerMJ, Bloom G, Chanock SJ, Chen Z, et al: LIN28B Polymorphisms influencesusceptibility to epithelial ovarian cancer. Cancer Res 2011, 71(11):3896–3903.
28. Chelala C, Khan A, Lemoine NR: SNPnexus: a web database for functionalannotation of newly discovered and public domain single nucleotidepolymorphisms. Bioinformatics 2009, 25(5):655–661.
29. Dayem Ullah AZ, Lemoine NR, Chelala C: SNPnexus: a web server forfunctional annotation of novel and publicly known genetic variants(2012 update). Nucleic Acids Res 2012, 40(Web Server issue):W65–W70.
30. Dayem Ullah AZ, Lemoine NR, Chelala C: A practical guide for thefunctional annotation of genetic variations using SNPnexus. BriefBioinform 2013, 14(4):437–447.
31. Yang HH, Hu N, Wang C, Ding T, Dunn BK, Goldstein AM, Taylor PR, Lee MP:Influence of genetic background and tissue types on global DNAmethylation patterns. PLoS One 2010, 5(2):e9355.
32. Harper KN, Peters BA, Gamble MV: Batch effects and pathway analysis:two potential perils in cancer studies involving DNA methylation arrayanalysis. Cancer Epidemiol Biomarkers Prev 2013, 22(6):1052–1060.
33. Du P, Zhang X, Huang CC, Jafari N, Kibbe WA, Hou L, Lin SM: Comparisonof Beta-value and M-value methods for quantifying methylation levelsby microarray analysis. BMC Bioinforma 2010, 11:587.
34. Kuan PF, Wang S, Zhou X, Chu H: A statistical framework for Illumina DNAmethylation arrays. Bioinformatics 2010, 26(22):2849–2855.
35. Johnson WE, Li C, Rabinovic A: Adjusting batch effects in microarrayexpression data using empirical Bayes methods. Biostatistics 2007,8(1):118–127.
36. Chen C, Grennan K, Badner J, Zhang D, Gershon E, Jin L, Liu C: Removingbatch effects in analysis of expression microarray data: an evaluation ofsix batch adjustment methods. PLoS One 2011, 6(2).
37. Kupfer P, Guthke R, Pohlers D, Huber R, Koczan D, Kinne RW: Batchcorrection of microarray data substantially improves the identification ofgenes differentially expressed in rheumatoid arthritis and osteoarthritis.BMC Med Genomics 2012, 5:23.
38. Dedeurwaerder S, Defrance M, Bizet M, Calonne E, Bontempi G, Fuks F:A comprehensive overview of infinium HumanMethylation450 dataprocessing. Brief Bioinform 2013.
39. Morris TJ, Butcher LM, Feber A, Teschendorff AE, Chakravarthy AR, WojdaczTK, Beck S: ChAMP: 450k chip analysis methylation pipeline. Bioinformatics2013.
40. Wilhelm-Benartzi CS, Koestler DC, Karagas MR, Flanagan JM, Christensen BC,Kelsey KT, Marsit CJ, Houseman EA, Brown R: Review of processing andanalysis methods for DNA methylation array data. Br J Cancer 2013,109(6):1394–1402.
41. Bishara S, Griffin M, Cargill A, Bali A, Gore ME, Kaye SB, Shepherd JH, VanTrappen PO: Pre-treatment white blood cell subtypes as prognosticindicators in ovarian cancer. Eur J Obstet Gynecol Reprod Biol 2008,138(1):71–75.
42. Cho H, Hur HW, Kim SW, Kim SH, Kim JH, Kim YT, Lee K: Pre-treatmentneutrophil to lymphocyte ratio is elevated in epithelial ovarian cancerand predicts survival after treatment. Cancer Immunol Immunother 2009,58(1):15–23.
43. den Ouden M, Ubachs JM, Stoot JE, van Wersch JW: Whole blood cellcounts and leucocyte differentials in patients with benign or malignantovarian tumours. Eur J Obstet Gynecol Reprod Biol 1997, 72(1):73–77.
44. Koestler DC, Christensen B, Karagas MR, Marsit CJ, Langevin SM, Kelsey KT,Wiencke JK, Houseman EA: Blood-based profiles of DNA methylationpredict the underlying distribution of cell types: a validation analysis.Epigenetics 2013, 8(8).
45. Millstein J, Zhang B, Zhu J, Schadt EE: Disentangling molecularrelationships with a causal inference test. BMC Genet 2009, 10:23.
46. Storey JD, Tibshirani R: Statistical significance for genomewide studies.Proc Natl Acad Sci USA 2003, 100(16):9440–9445.
47. Kaminsky ZA, Tang T, Wang SC, Ptak C, Oh GH, Wong AH, Feldcamp LA,Virtanen C, Halfvarson J, Tysk C, et al: DNA methylation profiles inmonozygotic and dizygotic twins. Nat Genet 2009, 41(2):240–245.
48. Cookson W, Liang L, Abecasis G, Moffatt M, Lathrop M: Mapping complexdisease traits with global gene expression. Nat Rev Genet 2009,10(3):184–194.
49. Stranger BE, Dermitzakis ET: The genetics of regulatory variation in thehuman genome. Hum Genomics 2005, 2(2):126–131.
50. Nica AC, Parts L, Glass D, Nisbet J, Barrett A, Sekowska M, Travers M, PotterS, Grundberg E, Small K, et al: The architecture of gene regulatoryvariation across multiple human tissues: the MuTHER study. PLoS Genet2011, 7(2):e1002003.
51. Bell JT, Pai AA, Pickrell JK, Gaffney DJ, Pique-Regi R, Degner JF, Gilad Y,Pritchard JK: DNA methylation patterns associate with genetic and geneexpression variation in HapMap cell lines. Genome Biol 2011, 12(1):R10.
52. Gibbs JR, van der Brug MP, Hernandez DG, Traynor BJ, Nalls MA, Lai SL,Arepalli S, Dillman A, Rafferty IP, Troncoso J, et al: Abundant quantitativetrait loci exist for DNA methylation and gene expression in human brain.PLoS Genet 2010, 6(5):e1000952.
53. Zhang D, Cheng L, Badner JA, Chen C, Chen Q, Luo W, Craig DW, RedmanM, Gershon ES, Liu C: Genetic control of individual differences in

Koestler et al. BMC Medical Genomics 2014, 7:8 Page 14 of 14http://www.biomedcentral.com/1755-8794/7/8
gene-specific methylation in human brain. Am J Hum Genet 2010,86(3):411–419.
54. Janoueix-Lerosey I, Lequin D, Brugieres L, Ribeiro A, de Pontual L, CombaretV, Raynal V, Puisieux A, Schleiermacher G, Pierron G, et al: Somatic andgermline activating mutations of the ALK kinase receptor in neuroblastoma.Nature 2008, 455(7215):967–970.
55. Webb TR, Slavish J, George RE, Look AT, Xue L, Jiang Q, Cui X, Rentrop WB,Morris SW: Anaplastic lymphoma kinase: role in cancer pathogenesis andsmall-molecule inhibitor development for therapy. Expert Rev AnticancerTher 2009, 9(3):331–356.
56. Wong DW, Leung EL, So KK, Tam IY, Sihoe AD, Cheng LC, Ho KK, Au JS,Chung LP, Pik Wong M: The EML4-ALK fusion gene is involved in varioushistologic types of lung cancers from nonsmokers with wild-type EGFRand KRAS. Cancer 2009, 115(8):1723–1733.
57. Zhang Q, Wang HY, Liu X, Bhutani G, Kantekure K, Wasik M: IL-2R commongamma-chain is epigenetically silenced by nucleophosphin-anaplasticlymphoma kinase (NPM-ALK) and acts as a tumor suppressor bytargeting NPM-ALK. Proc Natl Acad Sci USA 2011, 108(29):11977–82.
58. Milne K, Kobel M, Kalloger SE, Barnes RO, Gao D, Gilks CB, Watson PH,Nelson BH: Systematic analysis of immune infiltrates in high-grade serousovarian cancer reveals CD20, FoxP3 and TIA-1 as positive prognosticfactors. PLoS One 2009, 4(7):e6412.
59. Kostova N, Zlateva S, Ugrinova I, Pasheva E: The expression of HMGB1protein and its receptor RAGE in human malignant tumors. Mol CellBiochem 2010, 337(1–2):251–258.
60. Sharma A, Ray R, Rajeswari MR: Overexpression of high mobility group(HMG) B1 and B2 proteins directly correlates with the progression ofsquamous cell carcinoma in skin. Cancer Invest 2008, 26(8):843–851.
61. Gnanasekar M, Thirugnanam S, Ramaswamy K: Short hairpin RNA (shRNA)constructs targeting high mobility group box-1 (HMGB1) expressionleads to inhibition of prostate cancer cell survival and apoptosis. Int JOncol 2009, 34(2):425–431.
62. Song B, Song WG, Li ZJ, Xu ZF, Wang XW, Wang CX, Liu J: Effect of HMGB1silencing on cell proliferation, invasion and apoptosis of MGC-803 gastriccancer cells. Cell Biochem Funct 2011.
63. Yao X, Zhao G, Yang H, Hong X, Bie L, Liu G: Overexpression of high-mobility group box 1 correlates with tumor progression and poor prog-nosis in human colorectal carcinoma. J Cancer Res Clin Oncol 2010,136(5):677–684.
64. Jiao Y, Wang HC, Fan SJ: Growth suppression and radiosensitivity increaseby HMGB1 in breast cancer. Acta Pharmacol Sin 2007, 28(12):1957–1967.
65. Rhodes DR, Yu J, Shanker K, Deshpande N, Varambally R, Ghosh D, BarretteT, Pandey A, Chinnaiyan AM: Large-scale meta-analysis of cancer micro-array data identifies common transcriptional profiles of neoplastic trans-formation and progression. Proc Natl Acad Sci USA 2004,101(25):9309–9314.
66. Wang W, Jiang H, Zhu H, Zhang H, Gong J, Zhang L, Ding Q:Overexpression of high mobility group box 1 and 2 is associated withthe progression and angiogenesis of human bladder carcinoma. OncolLett 2013, 5(3):884–888.
67. Ouellet V, Le Page C, Guyot MC, Lussier C, Tonin PN, Provencher DM, Mes-Masson AM: SET complex in serous epithelial ovarian cancer. Int J Cancer2006, 119(9):2119–2126.
68. Yu M, Stott S, Toner M, Maheswaran S, Haber DA: Circulating tumor cells:approaches to isolation and characterization. J Cell Biol 2011,192(3):373–382.
69. Bianchi ME, Manfredi AA: High-mobility group box 1 (HMGB1) protein atthe crossroads between innate and adaptive immunity. Immunol Rev2007, 220:35–46.
70. Raucci A, Palumbo R, Bianchi ME: HMGB1: a signal of necrosis.Autoimmunity 2007, 40(4):285–289.
71. Scaffidi P, Misteli T, Bianchi ME: Release of chromatin protein HMGB1 bynecrotic cells triggers inflammation. Nature 2002, 418(6894):191–195.
72. Huang MY, Wang HM, Tok TS, Chang HJ, Chang MS, Cheng TL, Wang JY, LinSR: EVI2B, ATP2A2, S100B, TM4SF3, and OLFM4 as potential prognosticmarkers for postoperative Taiwanese colorectal cancer patients. DNA CellBiol 2012, 31(4):625–635.
73. Ballarino M, Jobert L, Dembele D, de la Grange P, Auboeuf D, Tora L: TAF15is important for cellular proliferation and regulates the expression of asubset of cell cycle genes through miRNAs. Oncogene 2012,32(39):4646–4655.
74. Lam LL, Emberly E, Fraser HB, Neumann SM, Chen E, Miller GE, Kobor MS:Factors underlying variable DNA methylation in a human communitycohort. Proc Natl Acad Sci USA 2012, 109(Suppl 2):17253–17260.
75. Byun HM, Nordio F, Coull BA, Tarantini L, Hou L, Bonzini M, Apostoli P,Bertazzi PA, Baccarelli A: Temporal stability of epigenetic markers:sequence characteristics and predictors of short-term DNA methylationvariations. PLoS One 2012, 7(6):e39220.
76. Xu Z, Bolick SC, DeRoo LA, Weinberg CR, Sandler DP, Taylor JA: Epigenome-wide association study of breast cancer using prospectively collectedsister study samples. J Natl Cancer Inst 2013, 105(10):694–700.
doi:10.1186/1755-8794-7-8Cite this article as: Koestler et al.: Integrative genomic analysis identifiesepigenetic marks that mediate genetic risk for epithelial ovarian cancer.BMC Medical Genomics 2014 7:8.
Submit your next manuscript to BioMed Centraland take full advantage of:
• Convenient online submission
• Thorough peer review
• No space constraints or color figure charges
• Immediate publication on acceptance
• Inclusion in PubMed, CAS, Scopus and Google Scholar
• Research which is freely available for redistribution
Submit your manuscript at www.biomedcentral.com/submit
Related Documents