Measuring what you manage The presentation is broken into three parts Part One: Why Create Metrics Part Two: How to Create Metrics Part Three: How to Analyze, Trend and Report Metrics John Parker: Data Center Operations Management - Esri

Measuring what you manage The presentation is broken into three parts Part One: Why Create Metrics Part Two: How to Create Metrics Part Three: How to Analyze,
Dec 15, 2015
Welcome message from author
This document is posted to help you gain knowledge. Please leave a comment to let me know what you think about it! Share it to your friends and learn new things together.
Transcript
Measuring what you manage
The presentation is broken into three parts Part One: Why Create Metrics Part Two: How to Create Metrics Part Three: How to Analyze, Trend and Report Metrics
John Parker: Data Center Operations Management - Esri

Part One: Why are Metrics Important“How can you manage what you can’t measure”
Benchmark your goalsDid you meet your goals?
Creates efficienciesCost savingsEliminate subjectivityManageability of resources and workloads
Part Two: How to Create Metrics
I. Understand what is important to measure
II. Metrics formula - Workload + Performance = Goals or Results (see Table One)
III.Know your audience
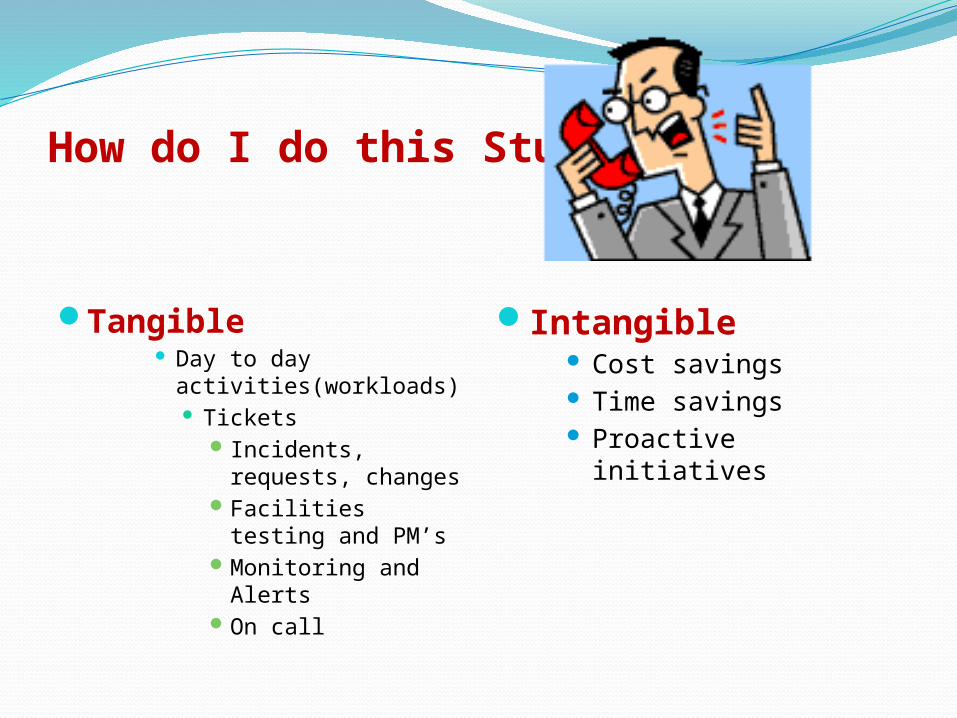
How do I do this Stuff !
Tangible Day to day
activities(workloads) Tickets
Incidents, requests, changes
Facilities testing and PM’s
Monitoring and Alerts
On call
Intangible Cost savings Time savings Proactive initiatives
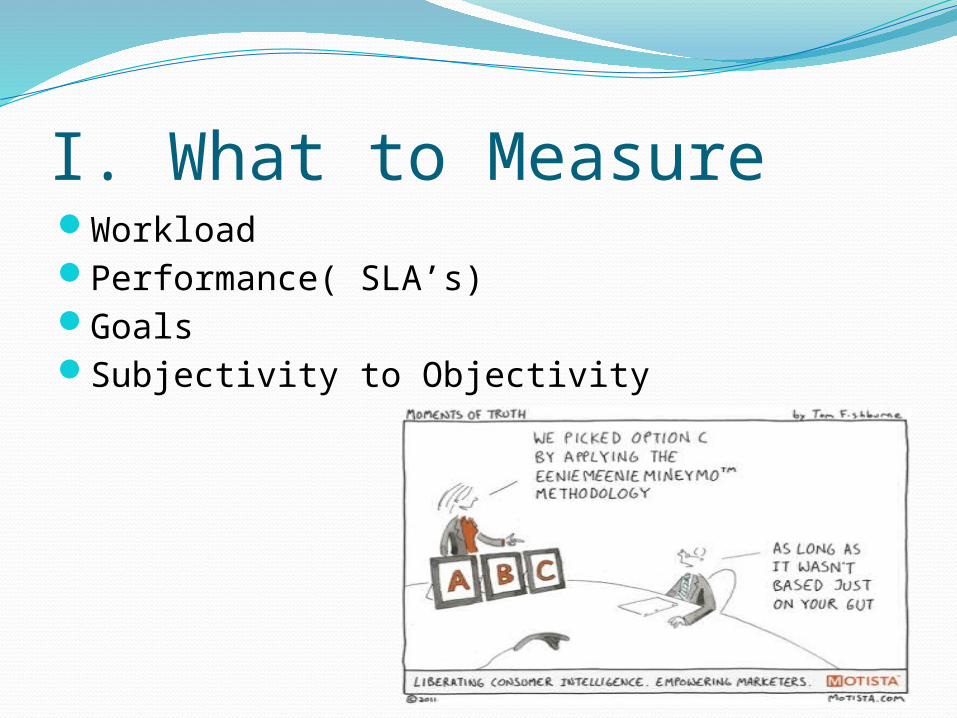
I. What to MeasureWorkloadPerformance( SLA’s)GoalsSubjectivity to Objectivity
II. The Metrics FormulaWorkload + Performance = (SLA’s or Goals)
Workload Metrics (what you do)
Performance Metrics (how well you do it)
SLA’s or Goal Metrics (Are you meeting or exceeding expectations?)
III. Know Your AudienceCustomize metrics for yourself, your
colleagues and your customers based on:Your requirements (what is important to you?)Their requirements (what is important to them)Toot your Whistle…
It’s time to prove with numbers how well you provide services
Part Three: Analyze, Trend and ReportWeekly MetricsMonthly MetricsQuarterly MetricsAnnual Metrics

Weekly MetricsTickets
Ticket Type
C/F from Last week
New Create
d
Escalations
during week
Total Worke
d
Resolved
Unresolved
Weekly Resolution score
YTD Resolution Score
Incidents 0 77 3 74 71 3 95.95%
92.34%
User Requests
2 24 1 25 23 2 92.00%
Scheduled
3 14 0 17 14 3 82.35%
Total 5 115 4 116 108 8 93.10%Other (N
ot Consider
ed)
7 6 0 13 6 7 46.15%
Change Type Total Changes
Completed Successfully
Success Rate
(ROC)Comments
Scheduled 6 5 83%RFC-2387, 2429, 2426, 2421,
2433, 2418
Standard 6 6 100%RFC-2435, 2437, 2436, 2432,
2440, 2438
Emergency 0 0 NA
Totals 12 11 92%
1.RFC Totals (Production)
Part one –Metrics building blocks – How well you do it (Monthly)Support
Weekly “workload” numbers combined
Applications & Hardware
Users & customersData centersProjects Completed
PerformanceAvailabilityService Level
Agreements (SLA’s) Target and Stretch
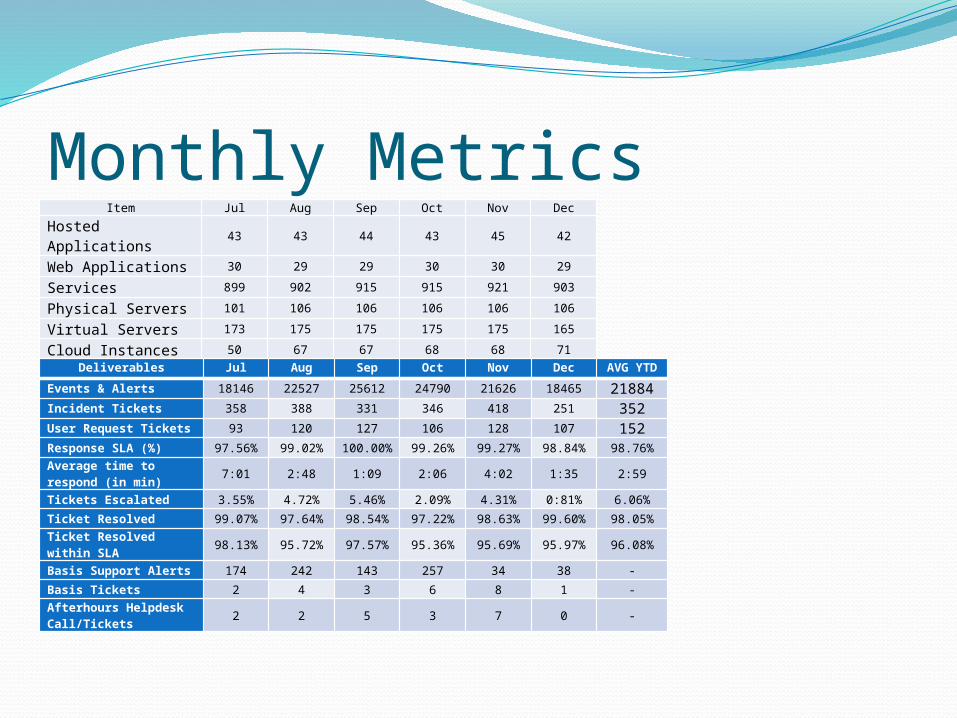
Monthly MetricsItem Jul Aug Sep Oct Nov Dec
Hosted Applications
43 43 44 43 45 42
Web Applications 30 29 29 30 30 29
Services 899 902 915 915 921 903
Physical Servers 101 106 106 106 106 106
Virtual Servers 173 175 175 175 175 165
Cloud Instances 50 67 67 68 68 71
Deliverables Jul Aug Sep Oct Nov Dec AVG YTD
Events & Alerts 18146 22527 25612 24790 21626 18465 21884Incident Tickets 358 388 331 346 418 251 352User Request Tickets 93 120 127 106 128 107 152
Response SLA (%) 97.56% 99.02%100.00
%99.26% 99.27% 98.84% 98.76%
Average time to respond (in min) 7:01 2:48 1:09 2:06 4:02 1:35 2:59
Tickets Escalated 3.55% 4.72% 5.46% 2.09% 4.31% 0:81% 6.06%
Ticket Resolved 99.07% 97.64% 98.54% 97.22% 98.63% 99.60% 98.05%Ticket Resolved within SLA 98.13% 95.72% 97.57% 95.36% 95.69% 95.97% 96.08%
Basis Support Alerts 174 242 143 257 34 38 -
Basis Tickets 2 4 3 6 8 1 -Afterhours Helpdesk Call/Tickets 2 2 5 3 7 0 -

Quarterly MetricsMonth Apr May Jun
Total Ticket in GOC scope 526 581 593
Tickets Resolved 520 568 576
Tickets Resolved within SLA 519 565 567
Month
No KB Restricted Access
Out of IOG Scope (DB)
Out of GOC scope(In IOG Scope)
Hardware restrictions
Training Gaps
Apr1 10 6 28 10 0
May0 5 8 33 0 0
Jun1 3 10 32 0 0
Total2 18 24 93 10 0
Annual Metrics ReportsSummarize:Easy to readWorkloadYear to year comparisonsPerformance
Goals/SLA’s


SummaryWorkload + Performance = SLA’s or
GoalsWeekly Metrics meetingsCentralized Metrics repositoryDelegate tasksAutomationAccuracy
How to use Metrics to advance your career
How can metrics help youAccuracy and consistencyCreates visibility for yourself and your
team(s)To toot your whistleJob performanceAdd/promote StaffGrow teams
Related Documents


![Consistent XVA Metrics Part I: Single-currency · Consistent XVA Metrics Part I: Single-currency Mats Kjaer ... A Details of the semi-replication18 ... for example Piterbarg [13],](https://static.cupdf.com/doc/110x72/5afb3df87f8b9a19548f02e6/consistent-xva-metrics-part-i-single-currency-xva-metrics-part-i-single-currency.jpg)