CAPRI CENTER FOR THE ANALYSIS OF PROPERTY RIGHTS AND INNOVATION MEASURING THE EFFECT OF MUSIC DOWNLOADS ON MUSIC PURCHASES Alejandro Zentner CAPRI Publication 05-03 Alejandro Zentner is on the faculty of the School of Management at the University of Texas at Dallas. Contact: azentner@.

Welcome message from author
This document is posted to help you gain knowledge. Please leave a comment to let me know what you think about it! Share it to your friends and learn new things together.
Transcript
CAPRI CENTER FOR THE ANALYSIS OF PROPERTY RIGHTS AND INNOVATION
MEASURING THE EFFECT OF MUSIC DOWNLOADS ON MUSIC PURCHASES
Alejandro Zentner
CAPRI Publication 05-03
Alejandro Zentner is on the faculty of the School of Management at the University of Texas at Dallas. Contact: azentner@.
1
MEASURING THE EFFECT OF MUSIC DOWNLOADS ON MUSIC
PURCHASES*
Alejandro Zentner
University of Texas at Dallas School of Management
ABSTRACT File sharing may substantially undermine the intellectual property rights of digital goods. This paper concentrates on the music industry. I estimate the effect of music downloads on the probability of purchasing music using a European individual- level cross section of 15,000 people from 2001. A simple comparison of means shows that people who regularly download music online are more likely to buy music. The positive relationship persists when controlling for observed characteristics. However, simultaneity between tastes for music and peer-to-peer usage makes it difficult to isolate the causal effect of music downloads on music purchases. To break that simultaneity, this paper uses measures of internet sophistication and the speed of the internet connection as instruments. The results suggest that peer-to-peer usage reduces the probability of buying music by 30%. Based on my estimates, back of the envelope calculations indicate that -without downloads- sales in 2002 would have been around 7.8% higher.
* I wish to thank Austan Goolsbee, Steven Levitt and Hugo Sonnenschein for their advice and encouragement. I also thank Nathaniel Baum-Snow, Gary Becker, Dennis Carlton, Carolina Czastkiewicz, Julio Elias, Jonah Gelbach, Thomas Hubbard, Anupam Bapu Jena, David Levine, Jose Liberti, Douglas Lichtman, Laura Martinolich, Kevin Murphy, Alejandro Rodriguez, Chad Syverson and Frank Wolak for their helpful comments.
2
I- INTRODUCTION
The global music industry was quite successful during the 1990s. According to
the International Federation of the Phonographic Industry (IFPI), album sales grew from
US$24.1 billion in 1990 to US$39.4 billion in 1996, and remained at a high level until
1999. Those days are over and the industry is now struggling. Global music sales have
been falling for the last three years (figures I and II). Global sales (units) of CDs -- the
most popular format -- fell in 2001 for the first time since it s introduction in 1983.
This downturn coincides with the proliferation of online music file sharing. In
June 1999 Napster was created, making the work of many artists available for free. Its
popularity was immediate. According to Mediametrix, a company that provides internet
rankings and measurement, Napster was the fastest software adoption in history (CNN,
2000). Given its impact, the Recording Industry Association of America (RIAA) soon
filed a motion against Napster in the U.S. District Court of San Francisco for “engaging
in or enabling, facilitating or assisting others in the copying, downloading, up loading,
transmission, or distribution of copyrighted musical work or sound recordings protected
by copyright or state law without the express permission of the rights owners” (US
District Court, 2000). Napster was shut down in February 2001. However, many peer-to-
peer alternatives to share music over the internet remain available. KaZaA, a Napster
successor, holds the new record of most downloaded software with more than 230 million
users worldwide (KaZaA, 2003). According to the Yahoo Buzz Index, an index that
measures internet search using the Yahoo search engine, “KaZaA” was the number one
searched term on the internet in 2003.
3
File sharing has an important online presence. In June 2001, IFPI estimated 3
million simultaneous global users and 500 million files available for copying at any given
time. In 2002, the IFPI estimate went up to 5 million simultaneous users and 900 million
files (IFPI, January 2003). In 2002, NetPD, a company that provides protection services
to copyright owners whose material is being pirated through the internet, reported that 3.6
billion files were downloaded monthly, of which around 60% to 70% were music files
(The Observer, 2002). The most popular albums are available for online sharing almost
immediately after release and in some cases, such as Oasis and Eminem, even before
(IFPI, 2002). Copy protection technology has been ineffective.
The development of broadband facilitates music sharing. A soundtrack that takes
more than 12 minutes to download with a dial-up connection can be downloaded in as
little as 20 seconds with a high-speed connection. Napster and its successors were banned
in many universities because the very fast connections apparently induced so much file
sharing that there was little available bandwidth left for anything else. In the case of the
University of Illinois at Urbana-Champaign, this amounted to 75% of the total bandwidth
(BusinessWeek, 2000).
File sharing is not limited to music. The development of fast connections is
extending downloading to other digital goods such as movies, software, video games, and
books. Some movies are available online during the opening week of theatrical release
and before the authorized DVD is available.
Does file sharing reduce music sales? If so, what is the magnitude of the impact of
file sharing on music sales? Is file sharing responsible for the recent drop in sales? Inside
the music industry, it is generally accepted that music sales have been affected negatively
4
by file sharing, but there has not been much empirical work done to measure the sign and
extent of this effect.
The question is important because file-sharing technology may undermine the
effective protection offered by copyright. Strong property rights create monopoly
distortions but weak property rights may lead to low creation of artistic work or
innovation. 1 The balance between these opposing forces has not been empirically
addressed very often. Knowledge of the impact of file sharing on sales is an essential part
of the information needed for the balancing of these factors in the case of digital goods.
Another important component for this balancing -- that is not addressed in this paper -- is
the elasticity of the supply of talent.
The objective of this paper is to obtain estimates of the impact of online file
sharing on music purchases. The main difficulty in the estimation of the effect of
downloads on purchases of music, using individual- level data, is the presence of
unobserved heterogeneity in music tastes among individuals. To control for this
heterogeneity, it would be ideal to follow individuals through time. In the absence of such
a panel data, I use a major European cross section database of 15,000 observations from
October 2001. With these data, I attempt to identify the causal effect of downloading
MP3 files on the probability of buying music.
Ordinary least squares shows a positive -- though not significant -- relationship
between peer-to-peer usage and the probability of purchasing music. However, OLS is
biased and inconsistent in the presence of unobserved heterogeneity. People who
download music may have a greater taste for music. To overcome this obstacle, my
1 Romer (2002) analyzes this trade-off for the case of musical recordings. See Boldrin and Levine (2002) and Klein, Lerner and Murphy (2002) for a discussion of the effect of file sharing on copyright value.
5
approach is to use instrumental variables techniques. This requires an instrumental
variable that explains peer-to-peer systems usage, but is otherwise unrelated to music
purchases. I employ measures of internet sophistication and access to broadband as
instruments. My estimates indicate that peer-to-peer usage reduces the probability of
buying music. Using measures of sophistication as instruments, music downloading
reduces the probability of buying music by 30%.
Because of the large change in the estimated effect found in the instrumented
regressions, special attention is given to the validity of the instruments and robustness of
the results. First step regressions show a positive and significant correlation of the
instruments with peer-to-peer usage. I present tests of overidentifying restrictions to
analyze the exogeneity of the instruments. I also analyze the exclusion restrictions by
studying how MP3 downloading affects purchases of other entertainment goods, and by
studying the relationship of the instruments with variables that may signal taste for music
and the value of time. I analyze the robustness of the results by restricting the analysis to
internet users and to individuals who had an internet connection before Napster started --
to control for the possibility that people went online in order to download music.
The data employed in this paper do not contain the information on the intensity of
music purchases and downloading necessary to make a direct analysis of the effect of file
sharing on music sales. However, using my estimate for the reduction in the probability
of buying music, back of the envelope calculations indicate that --without file-sharing--
sales in 2002 would have been around 7.8 % higher in the countries considered.
The paper is organized as follows. Section II provides an overview of the
literature. Section III summarizes the main features of the music industry. Section IV
6
describes the data. Section V presents the empirical strategy and results. Section VI
discusses the implications of the estimated coefficients for music sales. Finally, section
VII concludes.
II- RELATED LITERATURE
To the best of my knowledge, the first empirical attempt to measure the effect of
online file sharing on music sales is the one prepared in the legal battle against Napster.
To measure this effect, the plaintiff hired Soundscan, a company that developed an
information system to capture point-of-sale data on music sales in more than 18,000
stores throughout the US. Soundscan (Fine, 2000) compared sales means for the first
quarter of years 1997, 1998, 1999 (when Napster was not available) and 2000 (when
Napster was available), for all stores, stores within one mile of any college or university,
stores within one mile of the top 40 most wired universities, and stores near universities
that banned Napster use after the first quarter of 2000. From the first quarter of 1999 to
the first quarter of 2000, national sales grew 6.6%, sales near all universities dropped
2.6%, sales near most wired schools dropped 6.2%, and sales near schools where Napster
was banned after the first quarter of 2000 fell 8.1%. However, as noted by Fader (2000)
on the Napster legal case, sales near universities had been falling since 1998, at a time
when Napster was not available and in which national sales were growing, casting doubts
on the conclusion of Soundscan’s report.
7
More recent empirical attempts to measure this effect are Liebowitz (2003),
Zentner (2003), Oberholzer and Strumpf (2004), and Rob and Waldfogel (2004).2
Using a time series of aggregate data for the US, Liebowitz (2003) analyzes the
effect of a variety of reasons that could explain the drop in music sales, including income,
prices of albums, prices of complements and substitutes, recording formats, interest in
music, demographics and distribution channels. He finds that these alternative reasons
cannot explain the observed reduction in sales.
Zentner (2003) uses internet and broadband usage by country as proxies for music
downloaders, and documents that countries with greater internet and broadband
penetration have suffered greater reductions in music sales. Some types of music would
be expected to be more susceptible to file sharing than others. For a given country,
international repertoire -- as opposed to domestic repertoire -- is music that it is not
produced inside that country. Music produced in the US is more popular among young
individuals in international markets who are more likely to share files online, whereas the
domestic repertoire contains albums that appeal more to an older and less computer
friendly population. Zentner (2003) finds some evidence that file sharing may be behind
the recent increase in the share of domestic repertoire in total sales.
Using a panel of weekly album sales and information on the weekly number of
downloads by album for the US, Oberholzer and Strumpf (2004) find that music
downloading has an effect on sales that is statistically indistinguishable from zero. They
use two identification strategies: across-albums variation and within-album variation
across weeks. To establish causality, they employ technical features related to file sharing
2 Hui and Png (2003) analyze the effect of commercial piracy on music sales with data fro m the years 1994-1998. See Liebowitz (2005) for a more extensive analysis of the literature including several more recent studies.
8
as instruments. The high frequency nature of their identification strategy -- across weeks
variation within album -- and the durability of music may restrict the interpretation of the
results to the lack of contemporaneous substitution. 3
Rob and Waldfogel (2004) collected individual- level data on album downloads
and purchases by 500 college students. They find evidence that each album download
reduces music purchases by 0.2 albums in the OLS specification, and they find a much
bigger effect when using instrumental variables. Following the approach of this paper,
they address causality issues by using the speed of the internet connection as an
instrument. In addition to individual- level self reported broadband access, they employ
broadband access variation at the school level as an alternative instrument. They also
collected information on consumers’ valuation of these albums, allowing them to
document that downloaded albums are valued less than purchased albums. The restriction
to 500 college students in four schools limits generalizations of their results.
III- THE MUSIC INDUSTRY
Global music sales in 2002 totaled US$32.2 billion. 41% of these sales were made
in North America, 34.5% in Europe, 18.6% in Asia -- with Japan representing more than
80% of Asian sales --, 3.1% in Latin America, and 2.7% distributed among Australasia,
the Middle East and Africa. Sales are concentrated in the top markets. The Top 5
countries -- US, Japan, UK, France, and Germany -- represent 76.5% of global sales and
3 To address this concern they present a distributed lag model. See Liebowitz (2004) for a critique of the instruments and Rob and Waldfogel (2004) for a more detailed analysis of the identification strategy.
9
the top 10 -- the top 5 above plus Canada, Italy, Spain, Australia, and Mexico --
represent 85% (IFPI, 2002).
Sales are also concentrated in a few companies. The 4 biggest companies --
Universal, Sony-BMG, EMI, and Warner -- control more than 70% of the global market
of music sales, with the rest of the market share distributed among many independent
record labels (indies). These latter labels, in some cases, have an important presence in an
individual country, region or continent.
Companies and musicians usually negotiate exclusive multi-year contracts. When
producing a new album, artists typically receive an up-front payment and a royalty
somewhere between 5% and 13% of the retail price of the record (S&P, 2002).
The compact disc (CD) is the most popular music format, representing 72% of
total international units sales. Sales of singles, long plays (LPs) and cassettes (MCs)
continue to be replaced by sales of CD albums (IFPI, 2002). Two new formats, DVD
Audio and Super Audio CD, are growing but do not yet have an important share. These
new formats have higher sound quality and contain some extra content such us video
clips and interviews with the artists. The tendency to include extra content might have
been accelerated by the need to differentiate the product from the illegal online substitute.
There is variability in prices across CDs. While the average retail price of a CD in
the US is US$14.19 (BusinessWeek, 2003), 28 of the top 50 albums on the Billboard
charts have a list price between US$17.98 and US$19.98, and only seven are listed at
US$14.98 or less (Billboard, 2002). There is not much information on music prices for
other countries. In 2001, the European Commission opened an investigation to study the
10
higher prices in Europe and the divergence in prices inside the European Union. 4 In 2003,
the average price of a CD in the UK was US$16.80 (British Phonographic Industry,
2003).
Distribution costs of music represent a very important share of total costs. A CD
with a suggested price to consumers of US$16.98 has a price of US$10.50 to the retailer
(S&P, 2002). This latter figure includes distribution costs from the record company to the
retailer.
The distribution channels have been changing. Music stores have been shrinking
as a source of sales, and are being replaced by supermarkets, discount stores, department
stores, and online retail. In the US, music stores’ share of sales fell from 62% in 1991 to
42% in 2000 (RIAA). In the UK, supermarkets increased their share of music sales from
11.2% in 1999 to 17.7% in 2001 (IFPI, 2002). Online retail (off- line delivery), as a share
of total sales, increased from 6% in 2001 to 9% in 2002 in Germany, from 4% to 6% in
the UK, and remained steady at 3% in the US. Online legitimate delivery became
available in 2001 but it is still not an important source of sales. In 2003, sales of music
downloads in the US totaled US$ 30 million, representing 0.25% of total music sales
(IFPI, 2004).
Digital Music Online
4 It was found that the major labels were including minimum advertised prices linked to cooperative advertising agreements in Germany (Official Journal of the European Union, 2002). A lawsuit alleging the same practices was filed in the US. The case ended with a settlement in which the companies agreed to refund US$67.4 million to consumers and discontinue their minimum pricing policies (New York Times, 2002).
11
Online legitimate delivery and file sharing are possible in “Motion Picture Expert
Group-1 Audio layer 3” format (MP3). MP3 is a way to compress audio data without
significantly compromising sound quality.
Sound recordings are originally represented as waves. When the sounds are
digitalized, these waves are sampled many times per second and a file is created. CD
quality needs a sampling of 44,100 times per second (44.1KHz). Humans can only hear
around 10% of the sounds that are recorded on a CD. The MP3 compression system
eliminates sounds that are not perceptible to humans and softer sounds when different
sounds are playing simultaneously. There are different qualities of MP3 compression
(bitrate of the file). Bitrates between 64Kbps and 192Kbps are standard on the internet,
but only files above 160Kbps have quality comparable to CDs.
A 5 minute soundtrack that would take more than 50 megabytes in CD
compression format can be reduced to a file of 5 megabytes without significantly
affecting the sound quality. A compressed file of this size can be downloaded in as fast as
12 minutes with a dial-up internet connection (56Kbps modem downstream), 1 minute
and 20 seconds with a regular DSL or cable connection (512Kbps downstream), and 20
seconds with a fast DSL connection (2000Kbps downstream). However, the actual
downloading speed also depends on the upstream speed connection of the computer
providing the file, and the upstream speed is usually lower than the downstream speed.5
5 Having a high downstream speed connection allow users to downloads many files at the same time. Also in many peer-to-peer services, for example KaZaA, it is possible to download the same file from different users. The program recognizes the same file in different computers, partitions the file in several pieces and allows to download each piece from a different peer. These two ways help circumventing the bottleneck created by a lower upstream speed than downstream speed. Universities have T3 connections that are much faster than residential service (from 3Mbps to 45Mbps downstream).
12
People can upload (rip) CDs to their PCs’s hard drives and listen to music on their
computer, compress the files to an MP3 format to reduce the storage memory
requirement and to facilitate the sharing of the files over the internet, and also convert the
files back to a CD format and “burn” CDs that can be played in a regular player.
The development of these technologies could represent a very significant
reduction in costs considering that around 50% of music costs are distribution expenses.
There are many alternatives for getting music online. They can be divided into
two groups: legitimate and illegitimate (under the current law).
Legitimate companies either own the copyright or make deals with copyright
owners to distribute their music. Among the biggest companies are Pressplay (owned by
Sony and Universal), AOL MusicNet (owned by EMI, AOL Time Warner, BMG and
RealNetworks), the recently launched iTunes and the Europe-based OD2, Wippit, and
Tornado Virtue. Most services offer unlimited “streaming audio” and “tethered
downloads”6 for a fixed charge per month of around US$10 and the possibility to do
permanent burnable downloads for around US$1 per song. Prices of digital tracks in
Europe are higher: between US$1.76 and US$2.35 a song (Billboard, 2003).
Online legitimate digital delivery has been overshadowed by piracy. After the
shut-down of Napster, illegitimate music online can still be found globally on peer-to-
peer file-sharing services such as KaZaA, BitTorrent, Groekster, iMesh, WinMX and
Gnutella. These services are distributed without charge and allow users to download both
licensed and unlicensed files, including music, movies, games and software. The amount
of music available through these services is larger than on any legitimate site.
6 Streaming audio is the opportunity to listen to soundtracks without downloading them to the hard drive. Tethered downloads are downloads to the hard drive that cannot be burned into a CD. Music is no longer available to listen when subscription is ended.
13
Since the second half of 2003, the RIAA has been suing individual users who are
offering substantial amounts of copyrighted music over peer-to-peer networks. The
industry claims that these lawsuits are behind the leveling off of the decline in US music
sales in 2004.
IV- THE DATA
This paper uses a European consumer mail survey by Forrester from October
2001 called Technographics. Forrester is a business research company specializing in the
information economy. The fieldwork was conducted by the market research company
Taylor Nelson Sofrés. The sampling methodology is proprietary but is meant to ensure a
representative sample in each country. The survey contains more than 70 questions about
many different topics, with many sub items and multiple answers. Analogous US data
from Forrester have been used extensively in economic literature related to the internet
(Goolsbee, 2000 and 2001; Goolsbee and Brown, 2002; and Goolsbee and Klenow,
2002).
The survey includes 22,488 observations and is designed to be representative of
the total 16-and-older population in 7 European countries: France, Germany, Italy,
Netherlands, Spain, Sweden and UK.7 Three of these countries are among the top 5 music
7 I found modest differences in age and gender when comparing these data with country-level censuses. 7,355 individuals have missing values for at least one of the variables. Income is the only missing variable for 2,625 individuals. Results below are similar if these individuals are included in the regressions and income is not included as a control. Also, English proficiency is the only missing variable for 1,083 individuals. The results are also similar including these individuals and not using this variable as a control.
14
markets and 5 are among the top 10. In 2001, they represented 27.8% of international
music sales (IFPI, 2002).
The database contains a discrete {0,1} variable indicating purchases of music --
CDs, tapes, or records -- during the month prior to the survey for each respondent. This
question is broad in the sense that it is not restricted to off- line purchases. For each
respondent it also contains information about access to the internet, purchases of many
goods during the last month including videos, books, software and groceries, ownership
of many electronic goods including portable stereo, Hi-Fi stereo, cellular phone, DVD
player, MP3 player, CD writer and game console, and demographic variables such as
gender, age, work status, education, household size and household income.
For internet users, the database contains information on the weekly average
number of hours spent online, the number of years that they have been going online and
using the email, and information about the respondent’s internet activity including check
email, use search engines, purchase goods online, publish own web pages, participate in
online auctions and download MP3 files. For people with internet connection at home,
the database contains information on the type of connection -- DSL, cable, ISDN or dial-
up --.
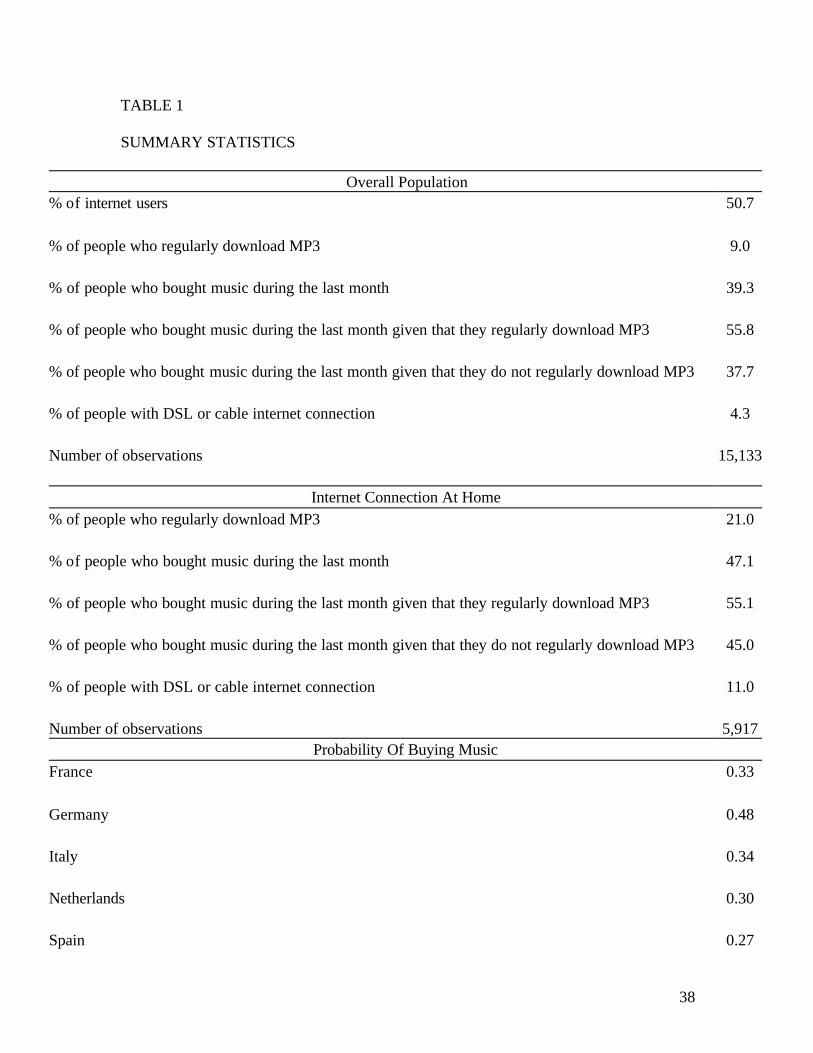
Table 1 presents summary statistics. Across the overall sample (15,133
observations after dropping individuals with missing values), 39.3% bought music during
the month prior to the interview, 9.0% regularly download MP3 files8 and 50.7% have
internet access.
8 There are two questions about music downloading in the survey: regularly “download music (MP3)” and regularly do “file sharing (e.g. Napster)”. I report the results of a variable assigning 1 to doing any of these activities. These two variables have a high correlation. The results below are similar using any of these two variables separately.
15
Downloading’s current illegal status may induce a negative bias in the fraction of
people who report downloading music. However, the indus try strategy of suing
individuals -- rather than companies on the basis of contributory and vicarious liability--
who are illegally sharing music is recent, and the risk of individuals being prosecuted or
fined was probably negligible in October of 2001.9 Only in the middle of 2004 has the
industry started suing European individuals.
The percentage of people who bought music is much larger among the group who
regularly download MP3 files (55.8%) than among those who do not (37.7%); suggesting
that MP3 downloaders have a high taste for music.
Considering only those people who have an internet connection at home (5,917
observations), 47.1% bought music during the month prior to the interview and 21.0%
regularly download MP3s. Again, the fraction of people who bought music is higher
among those who regularly download music (55.1%) than among those who do not
regularly download music (45.0%).
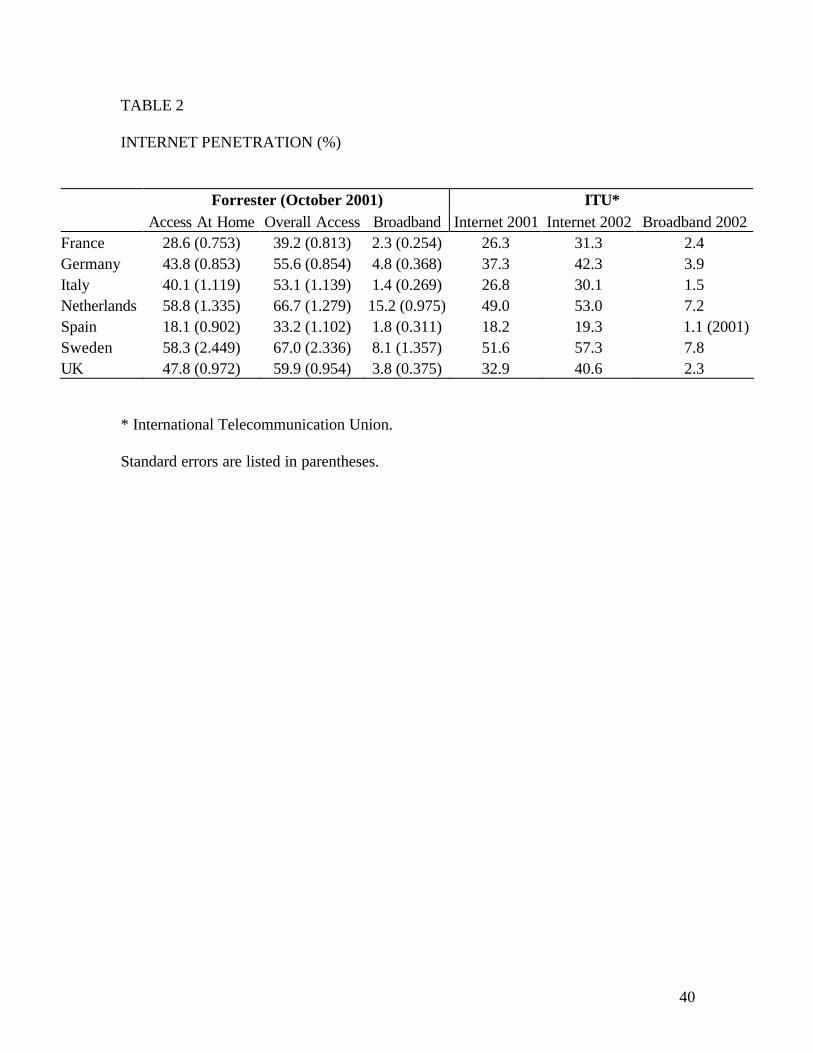
Table 2 compares internet users and broadband access by country in Forrester’s
sample with data on the number of internet users by the International Telecommunication
Union (ITU). The ITU does not collect the data by itself but it compiles information from
9 Because of the design of the questionnaire, it is not possible to know whether some individuals refused to answer if they regularly download music. File sharing is an item in a question with more than 40 items and individuals are asked to mark all the statements that apply. Regularly “Download music (MP3)” and regularly do “file sharing (e.g. Napster)” are two of these statements. An important characteristic of the questionnaire is that the sub-items including the question asking if they bought music in the month prior to the survey and the sub-item including the question asking if the regularly download music are in different sections. While the first question is asked to the whole sample, the second is only asked to individuals with access to the internet. There are many questions about completely different topics in between them. This may be important because individuals might strategically misreport their actions if they are supporters of file sharing or are against it. By answering both questions together they could predict that the results are going to be used to evaluate the effect of file sharing on music sales. This may be a problem for analyses based on surveys that only concentrate on music purchases and downloads.
16
different country-level surveys.10 Forrester’s data show a higher number of internet users
and broadband users than the data by the ITU.
There is heterogeneity in per-capita music sales among the countries considered.
According to the IFPI, in 2001, per-capita music sales (CDs, cassettes, singles and long
plays) per year in the UK were 4.79 units, 3.53 in Sweden, 3.16 in Germany, 2.89 in
France, 2.31 in Netherlands, 2.02 in Spain and 0.85 units in Italy. Average per-capita unit
sales per year over the countries considered in the sample were 2.83. The micro-data does
not contain sales quantities to match to the IFPI data.11 Table 1 also reports probabilities
of music purchases by country.
V- EMPIRICAL APPROACH
The goal of this paper is to estimate the effect of peer-to peer usage on the
probability of purchasing music. It was shown in the last section that a comparison of
means indicates that individuals who regularly download MP3s are more likely to buy
music. This positive relationship persists -- although it is not statistically different from
zero -- when controlling for several individual- level characteristics.
I consider the following model:
10 It is not known the date of the year in which the data was collected in each country and the broadness of the measure of internet access -- access at home or overall access. 11 The micro-data probably include purchases of illegitimate copies of music (commercial piracy). Seasonality in music sales and the fact that Forrester does not include individuals 15 years old and younger make difficult to compare probabilities computed from the micro-data with data on quantities from the IFPI. To my knowledge, information on country-level seasonality is not available.
17
iiii XbDbB ???? 21
where for individual i, Bi and Di are discrete {0,1} variables indicating the
response of having bought music during the month prior to the survey and the response of
regularly download MP3 files, respectively, Xi is a vector of observed individual
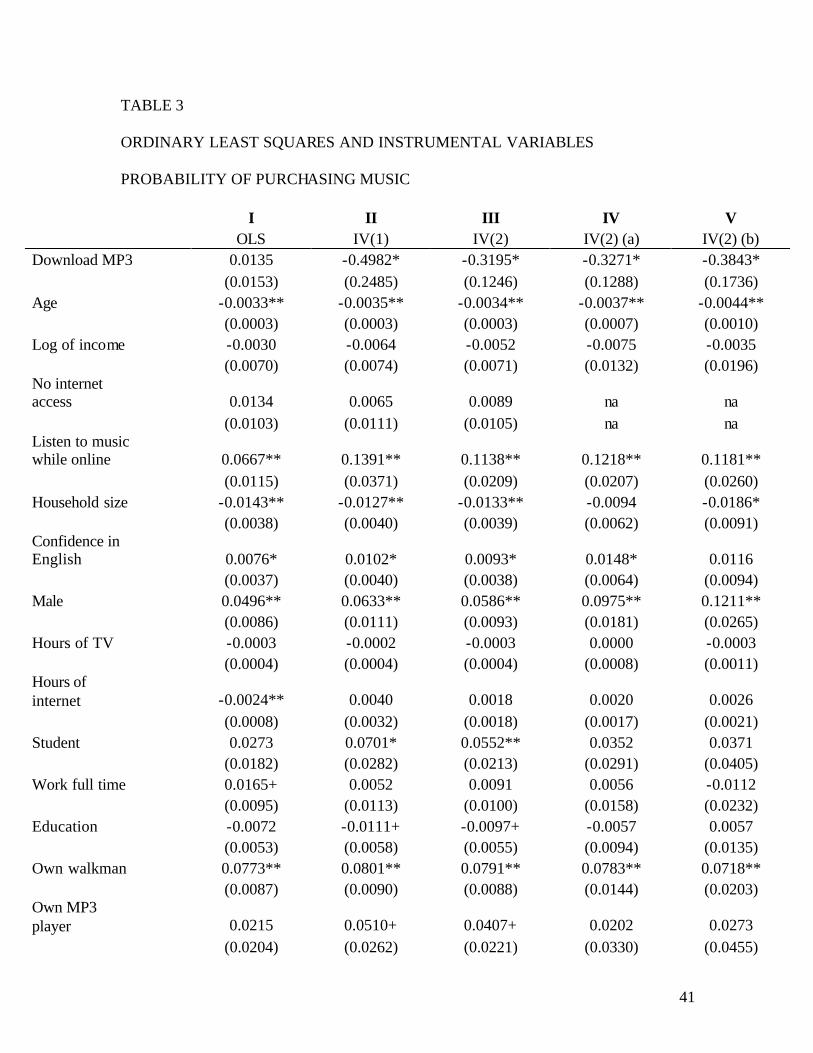
characteristics and i? represents the error. Column I of Table 3 presents OLS estimates.
This regression is done with respondents with and without internet access. Feasible
generalized least squares is employed to allow for heteroskedasticity across individuals.
Household income was standardized to gross annual euros per year and its logarithm was
included in the regression. Age is measured in years. Confidence in English is measured
from 1 to 5 with 5 being “very confident”. Education takes values from 1 to 3 for lower,
middle, and upper. Household size has a cap for 5 or more people in the household.
Hours of TV and hours of internet (only for internet users) are the average hours per
week and take the values 2, 7, 12, 17, 22, 27 and 30 (with a cap for 30 or more hours).
All the other controls are dummies.
Note that prices of music are not included in the analysis. As the coefficient is
identified in the cross section, the relevant variation in prices is the variation across
regions. In a concentrated music market, it is possible that there exist some price
variation across regions. To my knowledge, regional price information is not available.
The regressions include 53 within country regional dummies that may account for this
possibility.12
12 Despite many missing observations, for each individual the survey contains brackets for the size of the population in the city (not available for Germany). The brackets are different for every country and do not coincide with the within country regions. For example, for Italy the brackets are: lower than 10,000 individuals, 10,000 to 30,000, 30,000 to 100,000 and more than 100,000. In a few cases they list a specific
18
The downloaded online product can theoretically be a complement for music in
regular formats (CDs, cassettes, LPs) as the means comparison and the OLS regression
suggest.13 Consumers may get to know albums by downloading some tracks from the
internet and then decide whether or not to buy the album. Downloading takes time; but
this cost could be lower than the cost of getting to know music by going to the store and
listening to different albums before purchasing. Also, not having an MP3 player, not
being able to burn CDs in order to listen to the downloaded copy on a regular stereo
system, or some quality difference between the copy and the original may induce the
purchase of the album.
However, radios advertise music and the technology is available to burn good
quality CDs from MP3 files in order to listen the downloaded copy in a regular player.
The presence of unobserved heterogeneity in music tastes across individuals may
obstacle the identification of the causal effect. The approach of this paper is to use
instrumental variables techniques. To achieve the goal requires an instrumental variable
that explains peer-to-peer systems usage, but is otherwise unrelated to music purchases.
To account for the presence of unobserved heterogeneity, I consider the following
model:
city. For the listed cities, I imputed the real population. For the other cities, I imputed the median value of the range of the bracket. For the top bracket I tried different values. The magnitude of the effect of downloading in the regressions below are similar when I include the size of the city as an additional control and measures of internet sophistication are used as instruments. The coefficient is estimated more imprecisely, but also similar in magnitude, when including the size as a control and instrumenting with the speed of the connection. The coefficient and standard error in this latter case are very similar when including or excluding the size of the city as a control, suggesting that the increased imprecision is a consequence of the missing observations. 13 It should be noted that this is valid for both legal and illegal downloads. A related question to the one analyzed in this paper -- that to my knowledge has not been addressed in the literature -- is the study of online-offline substitution for the case of legal downloads.
19
iiiii vXbDbB ???? ?21
where, for individual i, i? represents unobserved taste for music and iv represents
the error. If i? and Di are not orthogonal, OLS gives a biased and inconsistent estimate of
b1. One way to overcome this problem is to find an instrumental variable Zi that explains
Di but is orthogonal to i? .14
The first instrument that I consider is access to a broadband connection. 15 The idea
is that it is considerably faster to download a music file with a high-speed connection,
reducing the cost in time of downloading music.
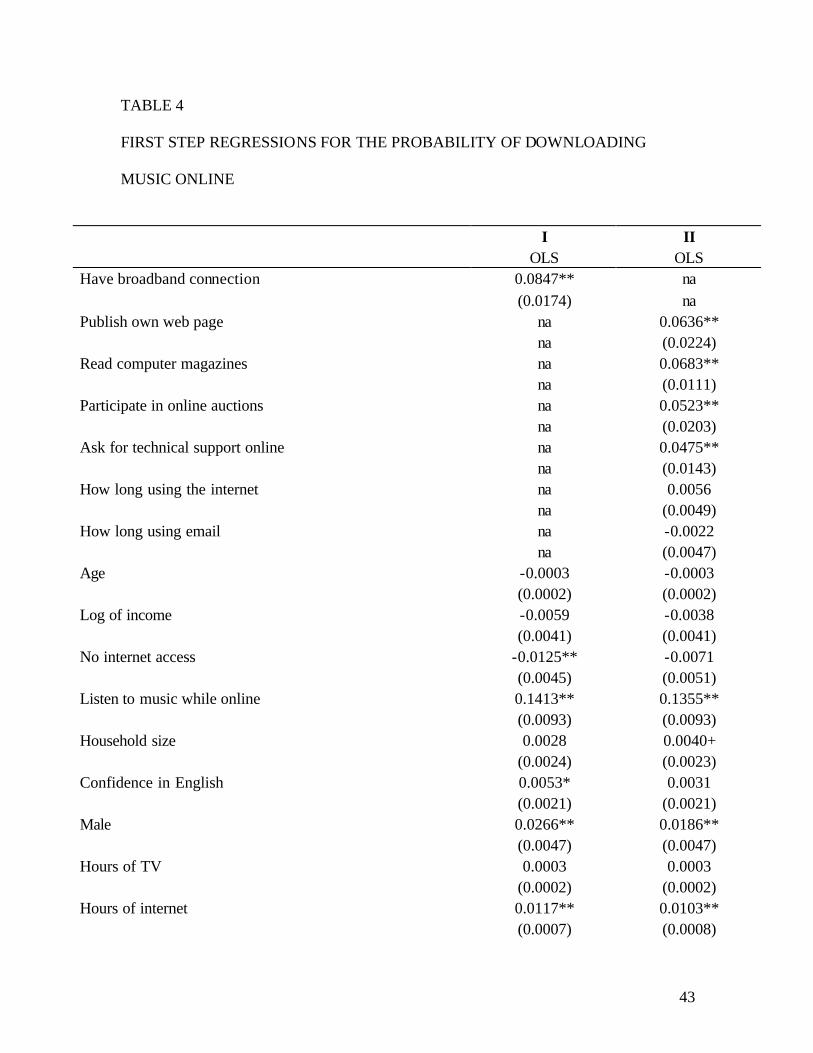
Column I of Table 4 shows that having a broadband connection significantly
increases the probability of downloading music. The first stage shows who downloads
music. Young individuals,16 students, males, owners of MP3 players, owners of CD
writers, and individuals who listen to music while online are more likely to be
downloaders.
The second stage presented in Column II of Table 3 suggests a reduction of 50%
in the probability of buying music. Purchases of music are negatively correlated with age
14 Estimation of models of limited dependent variables (LDV) with endogenous continuous regressors has been discussed extensively in the literature (Amemiya (1978), Newey, (1987) and Rivers and Vuong (1988)). However, here the endogenous regressor is a dummy variable. Angrist, (2001) shows different ways of dealing with dichotomous endogenous regressors in models of LDV. Using linear IV with a LATE interpretation is one of the proposed alternatives. Kane, Rouse and Staiger (1999) show that instrumenting a dummy regressor measured with error bias the coefficient away from zero. (See footnote 9 supra). 15 Having a broadband connection might be correlated with a high downloading intensity. If there was misreporting (see footnote 9 supra), I do not see a reason to believe that the unobserved downloading intensity would be correlated with this hypothetical misreporting in a particular way. Only recently has the RIAA started suing US individuals that share large amounts of music online. 16 Note that the age variable is not significant. Including the variable age implicitly assumes that the marginal effect computed at different ages is the same. The substitution of the variable age for dummies variables by years of age does not change the result of the regressions below.
20
and household size, and positively correlated with: listening to music while online,17
being male, being a student, the level of confidence in English, the ownership of a CD
writer and an MP3 player, and the ownership of complements of music, such as a
walkman and a Hi-Fi stereo.
A problem with this instrument is that it is a choice variable, and it is probably
related with the interest in downloading music.18 However, if people who buy broadband
connections have a strong taste for music -- and buying a broadband connection in order
to download music may signal a strong taste for music --, the bias goes in the direction of
underestimating the effect of downloads on the probability of buying music. In fact, in
2001, many broadband service providers explicitly advertised the ability to make fast
downloads. On the other hand, if --for a given taste for music-- people who buy
broadband connections are people who are going to substitute more, then the bias goes in
the direction of overestimating the average reduction in the probability of buying.
Measures of internet sophistication could be employed as alternative instruments.
The presumption is that downloading MP3s requires a high degree of internet
sophistication. In the database there is information about many uses of the internet and
information on the number of years individuals have been using the internet and the
email. There is also a dummy variable for individuals who read computer magazines. A
high number of years using the internet and the email, some uses of the internet such as
“publish own web pages”, “participate in online auc tions”, and “ask for technical support 17 This is not necessarily streaming audio by the context in which the question is asked. The question is “Do you ever do any of the following while online?” One of the options is “Listen to music/radio” and there are many other options, such as “Have the TV on”, “Have friends over” and “Read magazines” 18 A better instrument would be to use variation in broadband availability at the regional level. Regions are within countries and there are a total of 53 regions in the sample. However, to my knowledge, European information of broadband availability at the within country regional level is not available. Moreover, the database is not precise about which cities are considered in each region to match broadband availability at the regional level. For example, for the United Kingdom the regions are North, Midlands and South.
21
online”, and “read computer magazines” might signal a high degree of internet
sophistication. These variables could increase the probability of downloading music but
might be otherwise unrelated with an unobserved taste for music or entertainment.
Column II of Table 4 reports the first step regression of “download MP3” on the
proposed instruments. As noted in Table 1, the percentage of people who download MP3
across the overall population is 9%. The first stage shows that sophisticated internet users
have a higher probability of downloading music online. The probability value of an F-test
of the global significance of the excluded in the second stage variables is reported at the
bottom of Table 4. Table 4 also shows that being a student, being male, listening to music
while online and the ownership of complements of music in digital format -- MP3 player
and CD writer -- increase the probability of downloading music.
In column III of Table 3, “download MP3” is instrumented for with the proposed
variables. The coefficient on “download MP3” is negative and significant. It indicates
that downloading MP3s reduces the probability of buying music by 32%.
In the case of a dummy independent variable, a dummy treatment, and a dummy
instrument, instrumental variables has a local average treatment effect (LATE)
interpretation (Angrist, 2001).19 When using the speed of the connection as an instrument,
the estimate measures the average treatment effect for those who would be induced to
download if broadband is given to them. Downloading intensity is not available in the
database. Having a broadband connection may induce a high downloading intensity and
thus generate a big reduction in the probability of buying music. This may explain a
lower estimated effect when using measures of internet sophistication as an instrument.
19 Note that the average treatment effect (ATE) might be of lower interests if the goal is to explain the observed reduction on purchases of music.
22
The broadband instrument is interesting for forecast analysis if it is assumed that
broadband will be ubiquitous in the near future.
The instruments “how long using the internet” and “how long using the email”
are not significant in the first step. Even having a high global significance of the
instruments -- F-value of 14.7 --20 in the first step regression, it may be better to exclude
them from the analysis in order to avoid the risk of dealing with weak instruments. The
results do not change much when these instruments are excluded from the analysis.
To further analyze the robustness of the results, columns IV and V of Table 3
restrict the regressions to people with internet access at home and with internet users with
more than two years of online experience, respectively. The regression with individuals
with more than two years of internet experience is performed to exclude people who
acquired an internet connection after Napster started -- to control for the possibility that
people went online in order to download music --.21 The estimated effects of downloading
music on the probability of buying music are similar when restricting to these groups.
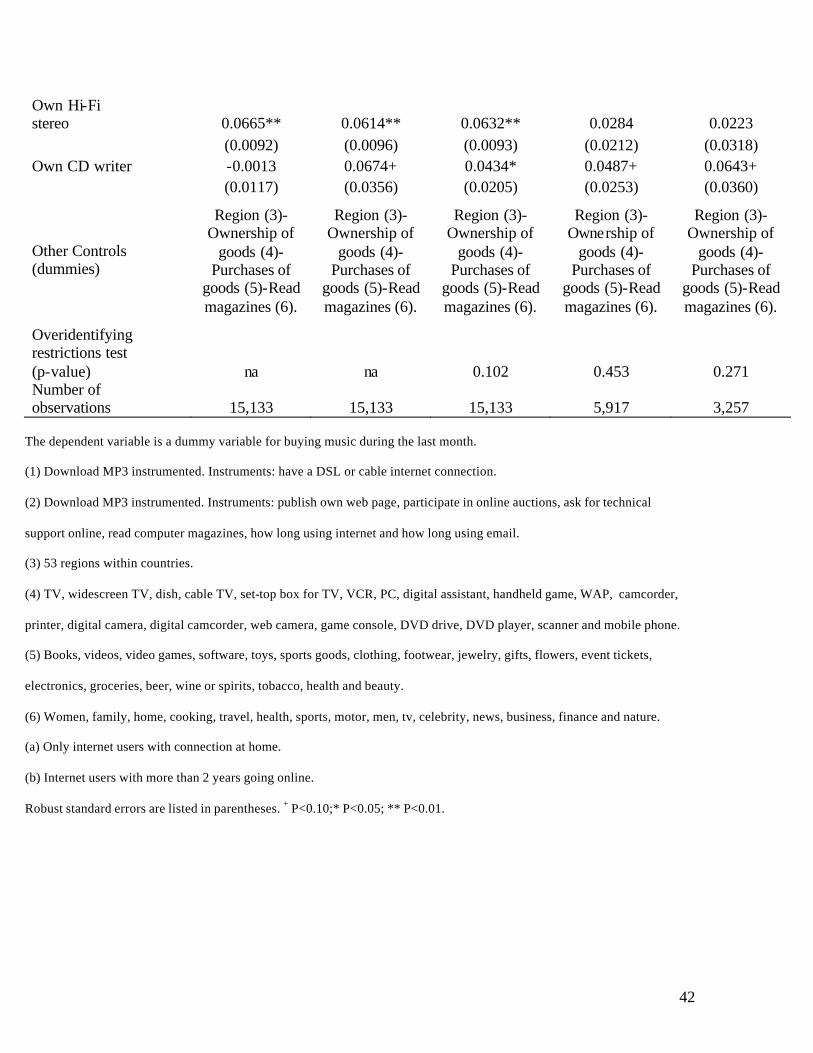
Given that the number of instruments exceeds the number of endogenous
variables, it is possible to test for overidentifying restrictions. The probability values for
this test are reported in the next to last row of Table 3. The results support the exclusion
of the instruments from the purchase equation.
Given the large change in the estimated coefficient in the instrumented
regressions in comparison with the OLS estimate, special scrutiny of the instruments is
necessary.
20 A rule of thumb for being concerned about weak instruments in the case of a single endogenous regressor is to have an F-value lower than 10. Staiger and Stock, (1997). 21 Napster was launched 2 years and 4 month before the fielding of the survey. The coefficient is similar but the SE is bigger when restricting to internet users with more than 3 years and with more than 4 years of internet experience.
23
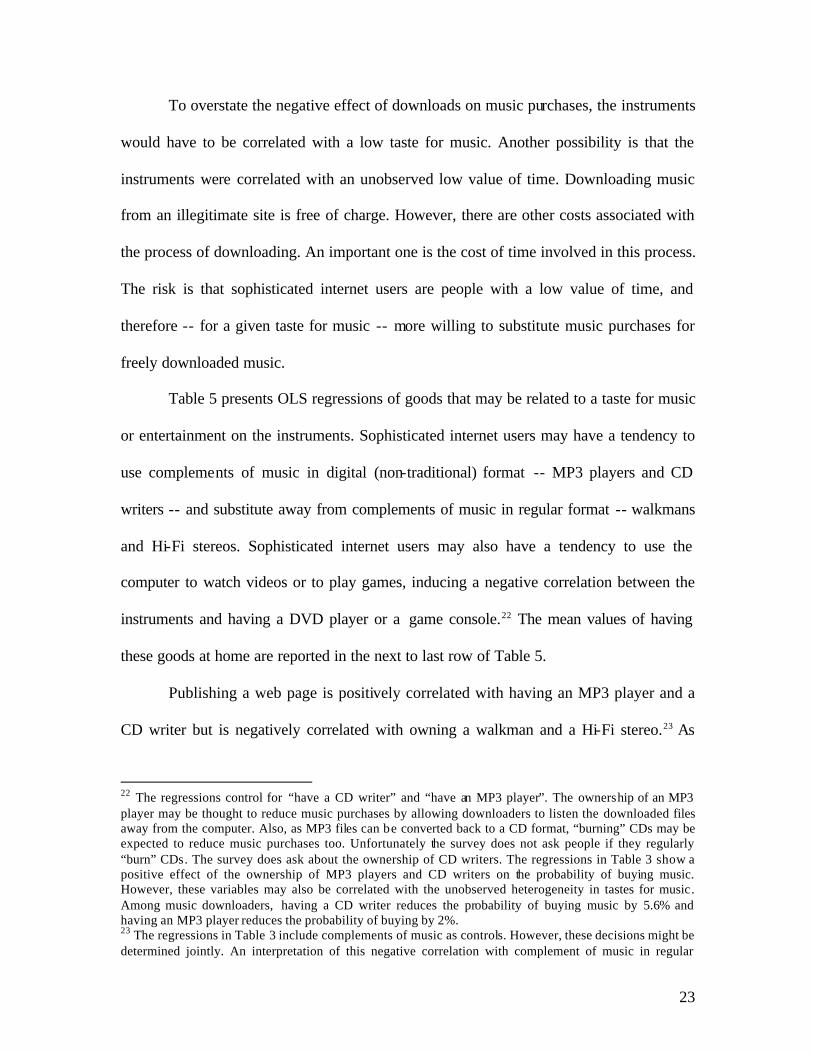
To overstate the negative effect of downloads on music purchases, the instruments
would have to be correlated with a low taste for music. Another possibility is that the
instruments were correlated with an unobserved low value of time. Downloading music
from an illegitimate site is free of charge. However, there are other costs associated with
the process of downloading. An important one is the cost of time involved in this process.
The risk is that sophisticated internet users are people with a low value of time, and
therefore -- for a given taste for music -- more willing to substitute music purchases for
freely downloaded music.
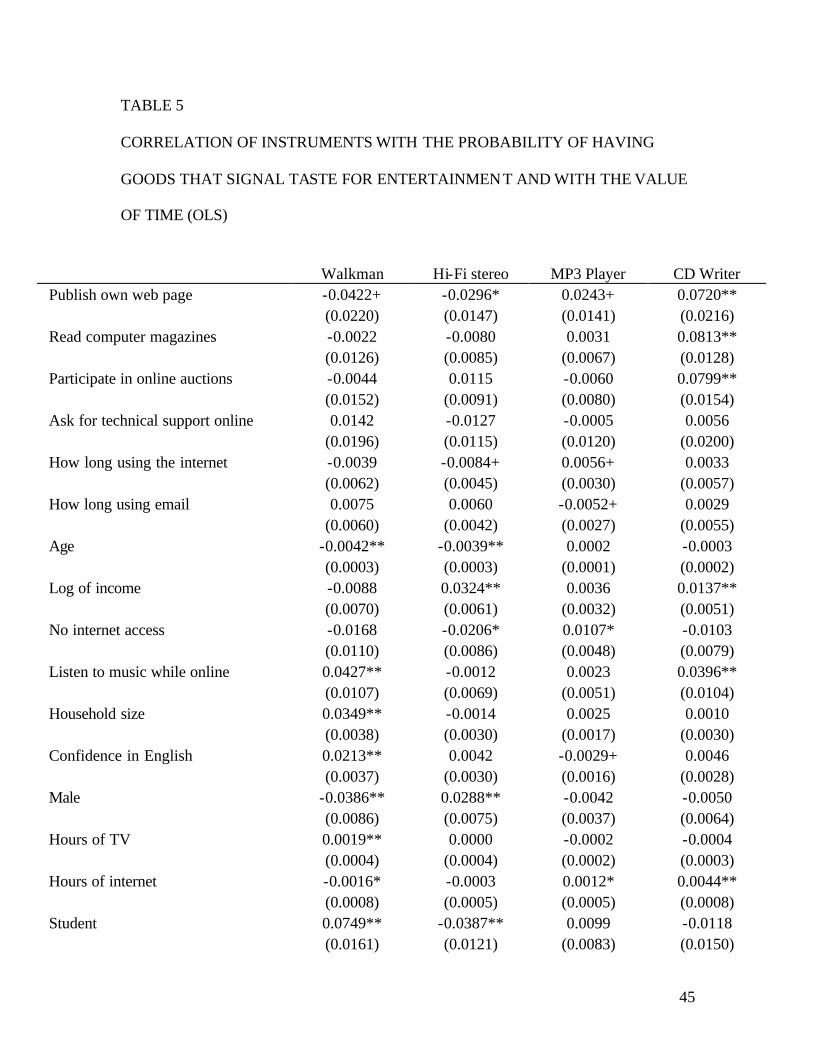
Table 5 presents OLS regressions of goods that may be related to a taste for music
or entertainment on the instruments. Sophisticated internet users may have a tendency to
use complements of music in digital (non-traditional) format -- MP3 players and CD
writers -- and substitute away from complements of music in regular format -- walkmans
and Hi-Fi stereos. Sophisticated internet users may also have a tendency to use the
computer to watch videos or to play games, inducing a negative correlation between the
instruments and having a DVD player or a game console.22 The mean values of having
these goods at home are reported in the next to last row of Table 5.
Publishing a web page is positively correlated with having an MP3 player and a
CD writer but is negatively correlated with owning a walkman and a Hi-Fi stereo.23 As
22 The regressions control for “have a CD writer” and “have an MP3 player”. The ownership of an MP3 player may be thought to reduce music purchases by allowing downloaders to listen the downloaded files away from the computer. Also, as MP3 files can be converted back to a CD format, “burning” CDs may be expected to reduce music purchases too. Unfortunately the survey does not ask people if they regularly “burn” CDs. The survey does ask about the ownership of CD writers. The regressions in Table 3 show a positive effect of the ownership of MP3 players and CD writers on the probability of buying music. However, these variables may also be correlated with the unobserved heterogeneity in tastes for music. Among music downloaders, having a CD writer reduces the probability of buying music by 5.6% and having an MP3 player reduces the probability of buying by 2%. 23 The regressions in Table 3 include complements of music as controls. However, these decisions might be determined jointly. An interpretation of this negative correlation with complement of music in regular
24
suggested before, this may be explained by a negative effect of music downloading on
purchases of complements of music on regular format. Excluding “own a web page” from
the list of instruments results in a similar estimated impact of downloading MP3 on the
probability of purchasing music.
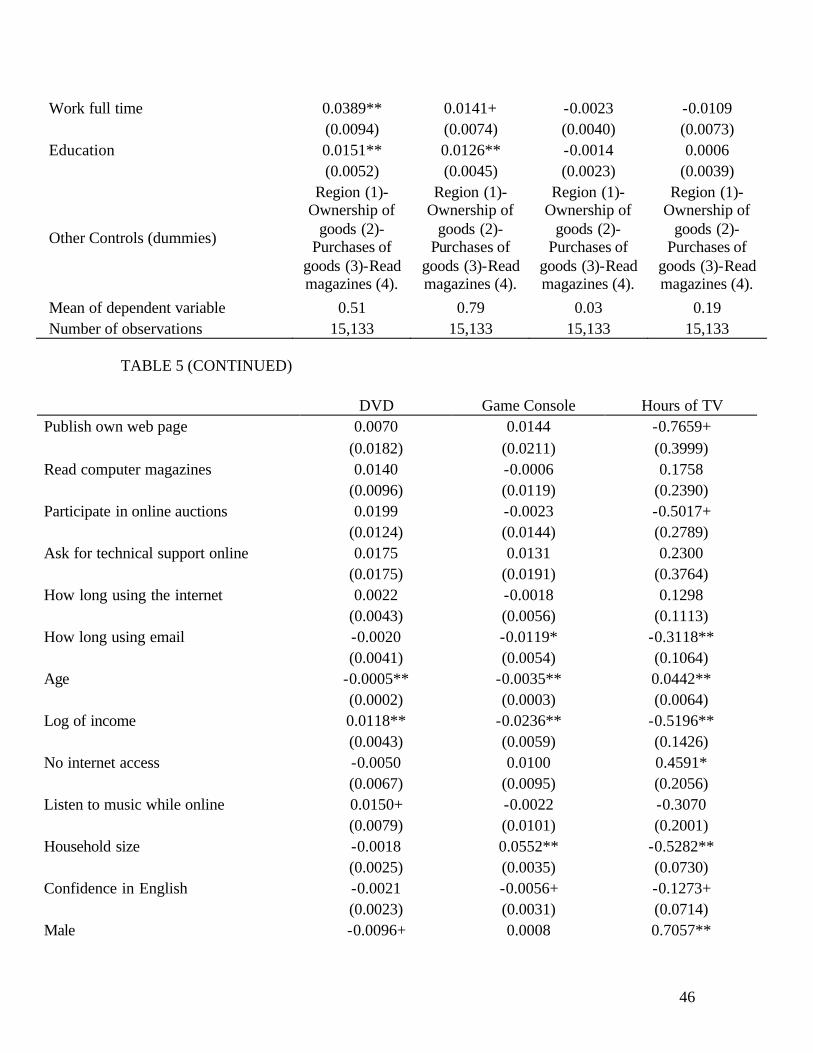
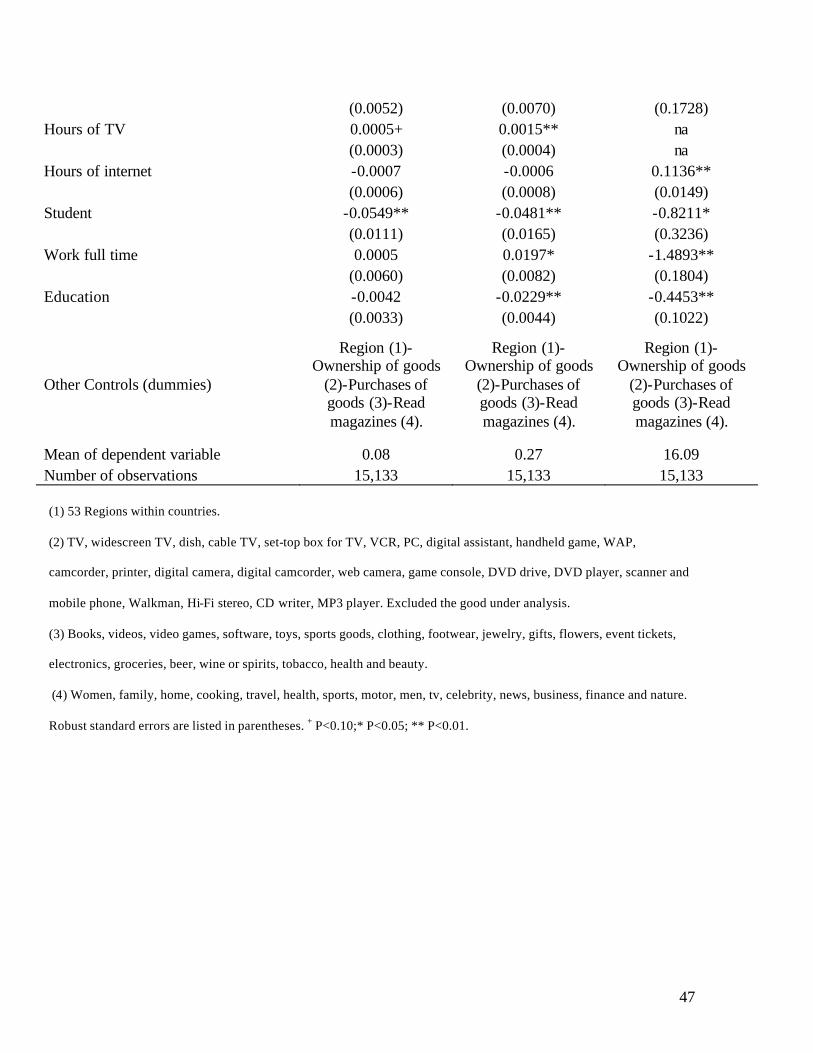
Table 5 also reports a OLS regression of the number of hours that they watch
television, an activity that may be thought to be negatively correlated with the value of
time, on the instruments. The number of hours of television watched per week correlates
negatively with “publish own web pages” and “ask for technical support online”,
suggesting that internet sophisticated people do not have an especially low value of time.
However, this analysis may not be valid if using the internet and watching television are
substitutes.
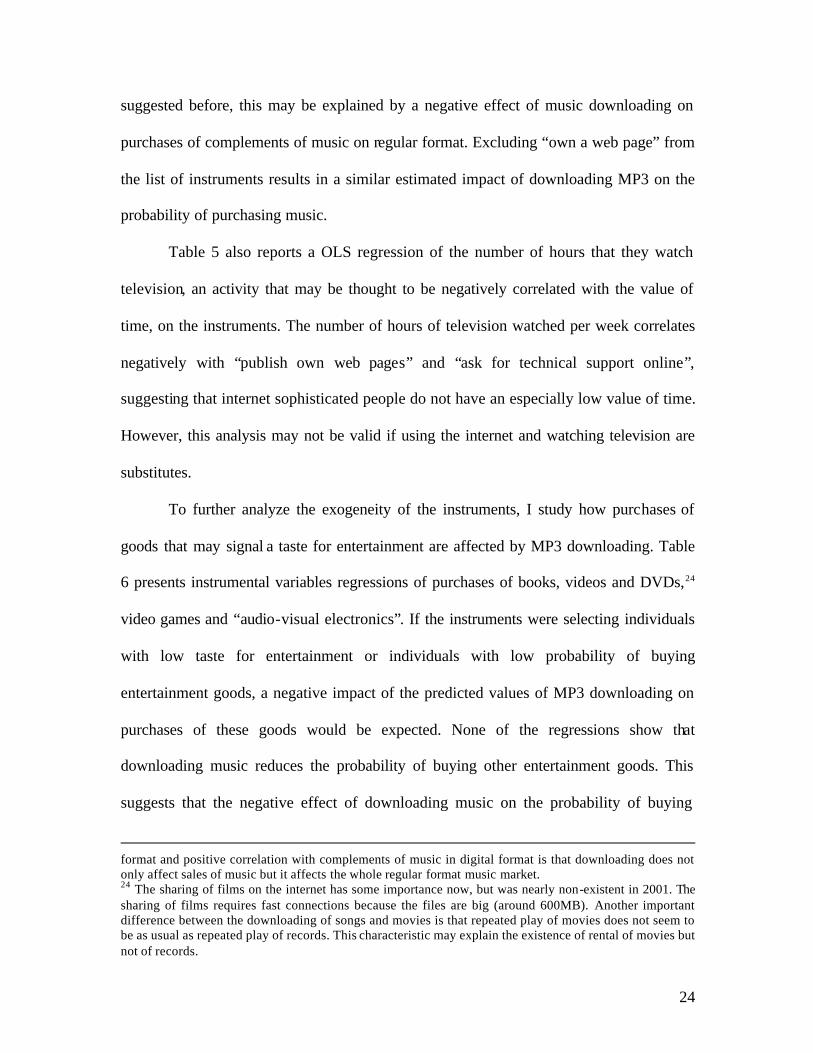
To further analyze the exogeneity of the instruments, I study how purchases of
goods that may signal a taste for entertainment are affected by MP3 downloading. Table
6 presents instrumental variables regressions of purchases of books, videos and DVDs,24
video games and “audio-visual electronics”. If the instruments were selecting individuals
with low taste for entertainment or individuals with low probability of buying
entertainment goods, a negative impact of the predicted values of MP3 downloading on
purchases of these goods would be expected. None of the regressions show that
downloading music reduces the probability of buying other entertainment goods. This
suggests that the negative effect of downloading music on the probability of buying
format and positive correlation with complements of music in digital format is that downloading does not only affect sales of music but it affects the whole regular format music market. 24 The sharing of films on the internet has some importance now, but was nearly non-existent in 2001. The sharing of films requires fast connections because the files are big (around 600MB). Another important difference between the downloading of songs and movies is that repeated play of movies does not seem to be as usual as repeated play of records. This characteristic may explain the existence of rental of movies but not of records.
25
music is not driven by using instruments that pick individuals with low taste for
entertainment goods.
One alternative explanation for the recent drop in music sales is that prices of
substitutes (DVDs and video games) have been dropping. The inclusion of prices of
DVDs and video games in the analysis is essential if time variation is the source of
identification. Note that Table 6 shows that purchasing music is positively correlated with
buying DVDs and games. The positive effect of downloading on purchases of other
entertainment goods may indicate that downloading music for free induces purchases of
alternative entertainment goods.
File sharing is an activity concentrated in the younger population, making it
difficult to estimate the effect of downloading for different age groups. 15% of the
population 40 years old and younger downloads music. On the other hand, the percentage
of downloaders among the population 40 and older is only 4%. When separating the
analysis for individuals younger than 40 years old from the 40 and older population, the
coefficient is similar to the results presented so far for the younger group. For the older
population, the coefficient is smaller but estimated imprecisely.
As mentioned before, having a high speed connection considerably reduces the
cost in downloading time. This suggests that the effect of downloading on sales should be
larger for downloaders with broadband. Despite the estimates presenting high standard
errors, separating MP3 downloaders with and without broadband shows a big reduction
in purchases among the first group.25
25 See the working paper version for this analysis, an analysis discriminating by country and other results not reported here.
26
VI- EFFECTS OF ONLINE MUSIC DOWNLOADING ON MUSIC SALES
Instrumenting with measures of internet sophistication, the results in the last
section indicate that downloading MP3 files online reduces the probability of buying
music during the month prior to the survey by 30%. Downloaded music may be shared
with people who do not download MP3s and affect their purchases as well. In this event,
the estimates understate the effect of online music downloading on music sales.
The database does not contain information on quantities of music purchased nor
on intensities of music downloads to calculate what music sales would have been in the
absence of music downloading. Moreover, the probability of buying music and intensity
of purchases may vary in complicated ways.
Another obstacle in calculating the impact on sales comes from the possibility of
having downloaders incorrectly measured. Forrester’s data overestimate the number of
internet users compare to the ITU (Table 2) suggesting that the number of downloaders
may be overestimated.
That said, and with the goal of having a back of the envelope estimate of the
predicted effect on sales, in this section I investigate this counterfactual.
Across the overall population, 9% regularly downloaded music in 2001.26
Therefore, if both digital music users and nonusers had the same propensity to buy music,
the effect on the music industry would be a reduction in music sales units of 2.7%.
26 Legal online digital delivery was nearly nonexistent in 2001.
27
But digital music users have a higher propensity to buy music, indicating that a
correction for the heterogeneity in the groups is needed. It was shown in Table 1 that the
probability of buying music for the group of people who download music is higher than
the probability for nonusers of peer-to peer systems. Also, using my estimate with a
treatment on the treated interpretation, the proportion of music downloaders who would
have bought music would have been around 30% higher if the possibility to download
music did not exist. This suggests that the probability of buying music for downloaders
would have been around double the probability of buying for non-downloaders.27
As there is no data on quantities of music purchased, an assumption about the
number of units bought is needed. A probably conservative assumption is that users and
nonusers of peer-to-peer systems, when reporting that they bought music during the
month prior to the survey, they bought the same quantity of units. With this assumption,
the estimated impact on units sold -- at the 2001 level of file-sharers -- would be a
reduction of 4.9%.28 If users of peer-to-peer systems not only have higher propensity to
buy music, but also would have bought more units conditional on buying, this would be
an underestimate of the impact.
In October of 2001 Napster was over and KaZaA was not yet an option. In the
year 2002, the IFPI reports a global increase in the number of users from 3 million in
2001 to 5 million (IFPI, January 2003). Assuming that this magnitude is representative of
the increase in the number of downloaders in the European countries considered, and that
these new downloaders have the same probability of buying than people who were
downloaders in October of 2001, sales in 2002 would have been around 7.8% higher.
27 (55.8+30)/37.7 28 ((0.09x2)/109)x(-0.3)
28
In summary, if music downloading reduces the probability of buying by 30%; if
15% of the population download music, if downloaders are twice as likely to buy music
than non-downloaders, if -- conditional on buying -- downloaders and non-downloaders
buy the same quantity of units, then sales in 2002 would have been 7.8%
(0.3x[(0.15x2)/115)]) higher than the level they experienced.
VII- CONCLUSION
Global music sales have experienced a large drop during the last four years. This
paper uses a European individual- level database to measure the impact of online music
downloads on the probability of buying music, and finds that file-sharing reduces this
probability. Using measures of internet sophistication as instruments, downloads may
explain a reduction in the probability of buying music of 30%.
The estimates in this paper are an important component of any welfare analysis of
file sharing or copyright. The well-known underproduction-underutilization trade-off has
not been very much informed empirically.
The interest is not exclusive to the music industry. Other digital copyrighted
goods such as movies, software, games and books are also being shared online. The
development of fast connections is likely to increase the impact of file sharing on sales of
these goods. This is only going to become an increasingly important issue in the next few
years.
29
Downloading copyrighted material is illegal under the current legal system. The
music industry is fighting file sharing in court.29 In the US, music piracy has been legally
fought on the basis of contributory and vicarious liability (Landes and Lichtman, 2003).
Under these doctrines, copyright holders sue parties that in some way contribute to or
benefit from the infringing conduct, instead of suing individuals. However, the new peer-
to-peer systems have proven to be more difficult to fight legally because they do not
require a central server to operate (Varian, 2000) and have alternative legitimate uses.
The other difficulty is that many of these new systems are established in countries with
different legal systems (KaZaA is registered in the South Pacific island nation of
Vanuatu, the software distributor is in Australia and the servers are in the Netherlands;
Chicago Tribune, 2003).
After running into difficulties shutting down file sharing systems, the RIAA
changed strategy and has been “gathering evidence and preparing lawsuits against
individual computer users who are illegally offering to ‘share’ substantial amounts of
copyrighted music over peer-to-peer networks”. In Europe, only since the middle of 2004
has the industry started suing individuals.
There is controversy about the effect of this strategy on the number of downloads.
While suing individuals who offer music -- as opposed to individuals who download files
-- may reduced the number of files available to download, it is not clear whether this
would actually affect the number of downloads. This is important when considering the
29 In Canada, royalties are imposed on digital media, recorders and players. However, these are royalties to copyright holders for private copying for personal use only and do not compensate for piracy or unauthorized copying of sound recordings either online or elsewhere. In Italy and Germany, blank CDs and burners pay a tax rate of between 5% and 10%. A legislation to extend taxes to the 15 EU nations has been passed last year and is pending ratification by the national parliaments (USATODAY, 2002). Another way to combat piracy is to flood the net with decoy files (Lichtman and Jacobson, 2000).
30
public good nature of the files offered online. Additionally, while it appears that the
number of users has decreased for some popular sites such as KaZaA, the legal strategy
appears to have induced individuals to use alternative and less popular sites and forums
where the risk of being prosecuted may be lower. The music industry claims that the
recovery of sales that occurred in 2004 may be explained by the success of the new legal
strategy.
31
REFERENCES
Angrist, Joshua, “Estimation Of Limited Dependent Variable Models With Dummy
Endogenous Regressors: Simple Strategies For Empirical Practice”, Journal of Business
& Economic Statistics, 19(1), January 2001.
Billboard, “Declaration Of Independents”, June 8, 2002.
Billboard, “Value-Added Tax Poses Problems For EU Digital Sales”, June 28, 2003.
Boldrin, Michele and Levine, David, “The Case Against Intellectual Property”, American
Economic Review: Papers and Proceedings, May 2002, 209-212.
British Phonographic Industry, “Market Information”, June 2003.
Business Week, "Inside Napster", August 14, 2000.
Business Week, "Big Music’s Broken Record", February 13, 2003.
Chicago Tribune, “KaZaA Sues Movie, Recording Industries”, January 28, 2003.
CNN.com, “Napster Usage Quadruples”, September 11, 2000.
32
CNN.com, “Study: CDs may soon go the way of vinyl”, September 3, 2003.
Fader, Peter. Expert Report, A&M Records, Inc v. Napster, Inc. 114 F Supp. 2d 896,
2000.
Fine, Michael, “Soundscan Study On Napster Use And Loss of Sales”, June 2000,
available at www.riaa.com.
Goolsbee, Austan, “In A World Without Borders: The Impact Of Taxes On Internet
Commerce”, Quarterly Journal of Economics, May 2000, Vol 115(2), 561-576.
Goolsbee, Austan, "Competition In The Computer Industry: Online Versus Retail",
Journal of Industrial Economics, 49(4), December 2001, 487-499.
Goolsbee, Austan and Brown, Jeffrey, "Does The Internet Make Markets More
Competitive? Evidence From The Life Insurance Industry", Journal of Political
Economy, June 2002, 110(3), 481-507.
Goolsbee, Austan and Klenow, Peter, "Evidence On Learning And Network Externalities
In The Diffusion Of Home Computers," Journal of Law and Economics, October 2002,
Vol XLV (2) (PT. 1), 317-344.
IFPI, “ The Recording Industry In Numbers”, October 2002.
33
IFPI, January 2003, available at http://www.ifpi.org/sitecontent/press/inthemedia09.html.
IFPI, “ The Recording Industry World Sales”, April 2003.
IFPI, “ The Recording Industry World Sales”, April 2004.
International Telecommunication Union, ITU, available at www.itu.org.
KaZaA.com, “KaZaA Media Desktop Sets Most Downloaded Software Record”, May
26, 2003.
Kai-Lung, Hui and Png, Ivan, “Piracy And The Legitimate Demand For Recorded
Music”, Contributions to Economic Analysis & Policy , Vol 2, Issue 1, Article 11, 2003.
Kane, Thomas, Staiger, Douglas and Rouse, Cecilia, “Estimating Returns To Schooling
When Schooling Is Misreported”, NBER, #7235, 1999.
Klein, Benjamin, Lerner, Andres and Murphy, Kevin “The Economics Of Copyright
“Fair Use” In A Networked World”, American Economic Review: Papers and
Proceedings, May 2002, 205-208.
34
Landes, William and Lichtman, Douglas, “Indirect Liability For Copyright Infringement:
Napster And Beyond”, Journal of Economics Perspectives, Vol. 17, No. 2, Spring 2003.
Lichtman, Douglas and Jacobson, David, “Anonymity A Double-Edged Sword For
Pirates Online”, The Chicago Tribune, April 13, 2000.
Liebowitz, Stan, “Will MP3 Downloads Annihilate the Record Industry? The Evidence
so Far”, University of Texas at Dallas, School of Management, Working Paper, June
(2003).
Liebowitz, Stan, “Peer-To-Peer Networks: Creative Destruction Or Just Plain
Destruction?”, Working Paper, University of Texas at Dallas, School of Management,
Working Paper, July (2004).
Liebowitz, Stan, “Pitfalls In Measuring The Impact Of File Sharing”, Working Paper,
University of Texas at Dallas, School of Management, Working Paper, July (2005).
Newey, Whitney, “Efficient Estimation Of Limited Dependent Variable Models With
Endogenous Explanatory Variables”, Journal of Econometrics, 36 (1987), 231-250.
New York Times, “Suit Settled Over Pricing Of Music CD’s At 3 Chains”, October 1,
2002.
35
Oberholzer, Felix and Strumpf, Koleman, “The Effect of File Sharing on Record Sales.
An Empirical Analysis”, Working Paper, (March 2004).
Official Journal of the European Union, September 30, 2002.
Recording Industry Association of America (RIAA), available at www.riaa.com.
Rivers, Douglas and Vuong, Quang, “Limited Information Estimators And Exogeneity
Tests For Simultaneous Probit Models”, Journal of Econometrics, 39(1988), 347-366.
Rob, Rafael and Waldfogel, Joel, “Piracy On The High C’s: Music Downloading, Sales
Displacement, And Social Welfare In A Sample Of College Students”, Unpublished
manuscript, April 2004.
Romer, Paul, “When Should We Use Intellectual Property Rights?”, American Economic
Review: Papers and Proceedings, May 2002, 213-216.
Standard & Poor’s, “Movies And Home Entertainment”, Industry Surveys, November
2002.
Staiger, Douglas and Stock, James, “Instrumental Variable Regression With Weak
Instruments”, Econometrica 65, n3 (1997), 557-586.
36
The Observer, “Inside The Web Of Thieves”, April 21, 2002.
USATODAY, “Europe's Music-Piracy Solution: Taxes”, February 6, 2002.
US District Court, Northern District of California, transcript of proceedings, July 26,
2000.
Varian, Hal, “The Internet Carries Profound Implications For Providers Of Information”,
New York Times, July 27, 2000.
Yahoo Buzz Index, available at http://buzz.yahoo.com/world/.
Zentner, Alejandro, “File Sharing and International Sales of Copyrighted Music. An
Empirical Analysis with a Panel of Countries”, Unpublished manuscript. University of
Chicago 2003.
37
FIGURE LEGENDS
FIGURE I
GLOBAL MUSIC SALES IN MILLION US$
NOTE: Local currency values are converted to dollars at the exchange rate of each year.
Music videos are included since 2001. Source: IFPI.
FIGURE II
GLOBAL MUSIC SALES IN MILLION UNITS
Note: Source: IFPI.
38
TABLE 1
SUMMARY STATISTICS
Overall Population % of internet users 50.7 % of people who regularly download MP3 9.0 % of people who bought music during the last month 39.3 % of people who bought music during the last month given that they regularly download MP3 55.8 % of people who bought music during the last month given that they do not regularly download MP3 37.7 % of people with DSL or cable internet connection 4.3 Number of observations 15,133
Internet Connection At Home
% of people who regularly download MP3 21.0 % of people who bought music during the last month 47.1 % of people who bought music during the last month given that they regularly download MP3 55.1 % of people who bought music during the last month given that they do not regularly download MP3 45.0 % of people with DSL or cable internet connection 11.0 Number of observations 5,917
Probability Of Buying Music France 0.33 Germany 0.48 Italy 0.34 Netherlands 0.30 Spain 0.27
39
Sweden 0.37 UK 0.53
40
TABLE 2
INTERNET PENETRATION (%)
Forrester (October 2001) ITU* Access At Home Overall Access Broadband Internet 2001 Internet 2002 Broadband 2002 France 28.6 (0.753) 39.2 (0.813) 2.3 (0.254) 26.3 31.3 2.4 Germany 43.8 (0.853) 55.6 (0.854) 4.8 (0.368) 37.3 42.3 3.9 Italy 40.1 (1.119) 53.1 (1.139) 1.4 (0.269) 26.8 30.1 1.5 Netherlands 58.8 (1.335) 66.7 (1.279) 15.2 (0.975) 49.0 53.0 7.2 Spain 18.1 (0.902) 33.2 (1.102) 1.8 (0.311) 18.2 19.3 1.1 (2001) Sweden 58.3 (2.449) 67.0 (2.336) 8.1 (1.357) 51.6 57.3 7.8 UK 47.8 (0.972) 59.9 (0.954) 3.8 (0.375) 32.9 40.6 2.3
* International Telecommunication Union.
Standard errors are listed in parentheses.
41
TABLE 3
ORDINARY LEAST SQUARES AND INSTRUMENTAL VARIABLES
PROBABILITY OF PURCHASING MUSIC
I II III IV V OLS IV(1) IV(2) IV(2) (a) IV(2) (b) Download MP3 0.0135 -0.4982* -0.3195* -0.3271* -0.3843* (0.0153) (0.2485) (0.1246) (0.1288) (0.1736) Age -0.0033** -0.0035** -0.0034** -0.0037** -0.0044** (0.0003) (0.0003) (0.0003) (0.0007) (0.0010) Log of income -0.0030 -0.0064 -0.0052 -0.0075 -0.0035 (0.0070) (0.0074) (0.0071) (0.0132) (0.0196) No internet access 0.0134 0.0065 0.0089 na na (0.0103) (0.0111) (0.0105) na na Listen to music while online 0.0667** 0.1391** 0.1138** 0.1218** 0.1181** (0.0115) (0.0371) (0.0209) (0.0207) (0.0260) Household size -0.0143** -0.0127** -0.0133** -0.0094 -0.0186* (0.0038) (0.0040) (0.0039) (0.0062) (0.0091) Confidence in English 0.0076* 0.0102* 0.0093* 0.0148* 0.0116 (0.0037) (0.0040) (0.0038) (0.0064) (0.0094) Male 0.0496** 0.0633** 0.0586** 0.0975** 0.1211** (0.0086) (0.0111) (0.0093) (0.0181) (0.0265) Hours of TV -0.0003 -0.0002 -0.0003 0.0000 -0.0003 (0.0004) (0.0004) (0.0004) (0.0008) (0.0011) Hours of internet -0.0024** 0.0040 0.0018 0.0020 0.0026 (0.0008) (0.0032) (0.0018) (0.0017) (0.0021) Student 0.0273 0.0701* 0.0552** 0.0352 0.0371 (0.0182) (0.0282) (0.0213) (0.0291) (0.0405) Work full time 0.0165+ 0.0052 0.0091 0.0056 -0.0112 (0.0095) (0.0113) (0.0100) (0.0158) (0.0232) Education -0.0072 -0.0111+ -0.0097+ -0.0057 0.0057 (0.0053) (0.0058) (0.0055) (0.0094) (0.0135) Own walkman 0.0773** 0.0801** 0.0791** 0.0783** 0.0718** (0.0087) (0.0090) (0.0088) (0.0144) (0.0203) Own MP3 player 0.0215 0.0510+ 0.0407+ 0.0202 0.0273 (0.0204) (0.0262) (0.0221) (0.0330) (0.0455)
42
Own Hi-Fi stereo 0.0665** 0.0614** 0.0632** 0.0284 0.0223 (0.0092) (0.0096) (0.0093) (0.0212) (0.0318) Own CD writer -0.0013 0.0674+ 0.0434* 0.0487+ 0.0643+ (0.0117) (0.0356) (0.0205) (0.0253) (0.0360)
Other Controls (dummies)
Region (3)-Ownership of
goods (4)-Purchases of
goods (5)-Read magazines (6).
Region (3)-Ownership of
goods (4)-Purchases of
goods (5)-Read magazines (6).
Region (3)-Ownership of
goods (4)-Purchases of
goods (5)-Read magazines (6).
Region (3)-Ownership of
goods (4)-Purchases of
goods (5)-Read magazines (6).
Region (3)-Ownership of
goods (4)-Purchases of
goods (5)-Read magazines (6).
Overidentifying restrictions test (p-value) na na 0.102 0.453 0.271 Number of observations 15,133 15,133 15,133 5,917 3,257
The dependent variable is a dummy variable for buying music during the last month.
(1) Download MP3 instrumented. Instruments: have a DSL or cable internet connection.
(2) Download MP3 instrumented. Instruments: publish own web page, participate in online auctions, ask for technical
support online, read computer magazines, how long using internet and how long using email.
(3) 53 regions within countries.
(4) TV, widescreen TV, dish, cable TV, set-top box for TV, VCR, PC, digital assistant, handheld game, WAP, camcorder,
printer, digital camera, digital camcorder, web camera, game console, DVD drive, DVD player, scanner and mobile phone.
(5) Books, videos, video games, software, toys, sports goods, clothing, footwear, jewelry, gifts, flowers, event tickets,
electronics, groceries, beer, wine or spirits, tobacco, health and beauty.
(6) Women, family, home, cooking, travel, health, sports, motor, men, tv, celebrity, news, business, finance and nature.
(a) Only internet users with connection at home.
(b) Internet users with more than 2 years going online.
Robust standard errors are listed in parentheses. + P<0.10;* P<0.05; ** P<0.01.
43
TABLE 4
FIRST STEP REGRESSIONS FOR THE PROBABILITY OF DOWNLOADING
MUSIC ONLINE
I II
OLS OLS Have broadband connection 0.0847** na (0.0174) na Publish own web page na 0.0636** na (0.0224) Read computer magazines na 0.0683** na (0.0111) Participate in online auctions na 0.0523** na (0.0203) Ask for technical support online na 0.0475** na (0.0143) How long using the internet na 0.0056 na (0.0049) How long using email na -0.0022 na (0.0047) Age -0.0003 -0.0003 (0.0002) (0.0002) Log of income -0.0059 -0.0038 (0.0041) (0.0041) No internet access -0.0125** -0.0071 (0.0045) (0.0051) Listen to music while online 0.1413** 0.1355** (0.0093) (0.0093) Household size 0.0028 0.0040+ (0.0024) (0.0023) Confidence in English 0.0053* 0.0031 (0.0021) (0.0021) Male 0.0266** 0.0186** (0.0047) (0.0047) Hours of TV 0.0003 0.0003 (0.0002) (0.0002) Hours of internet 0.0117** 0.0103** (0.0007) (0.0008)

44
Student 0.0835** 0.0845** (0.0134) (0.0133) Work full time -0.0212** -0.0223** (0.0052) (0.0052) Education -0.0070* -0.0088** (0.0030) (0.0029) Own walkman 0.0051 0.0059 (0.0046) (0.0045) Own MP3 player 0.0564** 0.0559** (0.0156) (0.0154) Own Hi-Fi stereo -0.0101* -0.0090* (0.0040) (0.0040) Own CD writer 0.1311** 0.1236** (0.0089) (0.0089)
Other Controls (dummies)
Region (3)-Ownership of goods
(4)-Purchases of goods (5)-
Read Magazines (6).
Region (3)-Ownership of goods
(4)-Purchases of goods (5)-
Read Magazines (6).
R2 0.30 0.31 F-test (global test of excluded in the second stage instruments) na
15.3 (p-value=0.000)
F-test (global test of the instruments interacted with prices) na na Number of observations 15,133 15,133
Dependent variable is a dummy variable for regularly download MP3 files. (mean among overall
population=0.09)
(1) 53 Regions within countries.
(2) TV, widescreen TV, dish, cable TV, set-top box for TV, VCR, PC, digital assistant, handheld game,
WAP, camcorder, printer, digital camera, digital camcorder, web camera, game console, DVD drive, DVD
player, scanner and mobile phone.
(3) Books, videos, video games, software, toys, sports goods, clothing, footwear, jewelry, gifts, flowers,
event tickets, electronics, groceries, beer, wine or spirits, tobacco, health and beauty.
(4) Women, family, home, cooking, travel, health, sports, motor, men, tv, celebrity, news, business, finance
and nature.
Robust standard errors are listed in parentheses. + P<0.10;* P<0.05; ** P<0.01.
45
TABLE 5
CORRELATION OF INSTRUMENTS WITH THE PROBABILITY OF HAVING
GOODS THAT SIGNAL TASTE FOR ENTERTAINMENT AND WITH THE VALUE
OF TIME (OLS)
Walkman Hi-Fi stereo MP3 Player CD Writer Publish own web page -0.0422+ -0.0296* 0.0243+ 0.0720** (0.0220) (0.0147) (0.0141) (0.0216) Read computer magazines -0.0022 -0.0080 0.0031 0.0813** (0.0126) (0.0085) (0.0067) (0.0128) Participate in online auctions -0.0044 0.0115 -0.0060 0.0799** (0.0152) (0.0091) (0.0080) (0.0154) Ask for technical support online 0.0142 -0.0127 -0.0005 0.0056 (0.0196) (0.0115) (0.0120) (0.0200) How long using the internet -0.0039 -0.0084+ 0.0056+ 0.0033 (0.0062) (0.0045) (0.0030) (0.0057) How long using email 0.0075 0.0060 -0.0052+ 0.0029 (0.0060) (0.0042) (0.0027) (0.0055) Age -0.0042** -0.0039** 0.0002 -0.0003 (0.0003) (0.0003) (0.0001) (0.0002) Log of income -0.0088 0.0324** 0.0036 0.0137** (0.0070) (0.0061) (0.0032) (0.0051) No internet access -0.0168 -0.0206* 0.0107* -0.0103 (0.0110) (0.0086) (0.0048) (0.0079) Listen to music while online 0.0427** -0.0012 0.0023 0.0396** (0.0107) (0.0069) (0.0051) (0.0104) Household size 0.0349** -0.0014 0.0025 0.0010 (0.0038) (0.0030) (0.0017) (0.0030) Confidence in English 0.0213** 0.0042 -0.0029+ 0.0046 (0.0037) (0.0030) (0.0016) (0.0028) Male -0.0386** 0.0288** -0.0042 -0.0050 (0.0086) (0.0075) (0.0037) (0.0064) Hours of TV 0.0019** 0.0000 -0.0002 -0.0004 (0.0004) (0.0004) (0.0002) (0.0003) Hours of internet -0.0016* -0.0003 0.0012* 0.0044** (0.0008) (0.0005) (0.0005) (0.0008) Student 0.0749** -0.0387** 0.0099 -0.0118 (0.0161) (0.0121) (0.0083) (0.0150)
46
Work full time 0.0389** 0.0141+ -0.0023 -0.0109 (0.0094) (0.0074) (0.0040) (0.0073) Education 0.0151** 0.0126** -0.0014 0.0006 (0.0052) (0.0045) (0.0023) (0.0039)
Other Controls (dummies)
Region (1)-Ownership of
goods (2)-Purchases of
goods (3)-Read magazines (4).
Region (1)-Ownership of
goods (2)-Purchases of
goods (3)-Read magazines (4).
Region (1)-Ownership of
goods (2)-Purchases of
goods (3)-Read magazines (4).
Region (1)-Ownership of
goods (2)-Purchases of
goods (3)-Read magazines (4).
Mean of dependent variable 0.51 0.79 0.03 0.19 Number of observations 15,133 15,133 15,133 15,133
TABLE 5 (CONTINUED)
DVD Game Console Hours of TV Publish own web page 0.0070 0.0144 -0.7659+ (0.0182) (0.0211) (0.3999) Read computer magazines 0.0140 -0.0006 0.1758 (0.0096) (0.0119) (0.2390) Participate in online auctions 0.0199 -0.0023 -0.5017+ (0.0124) (0.0144) (0.2789) Ask for technical support online 0.0175 0.0131 0.2300 (0.0175) (0.0191) (0.3764) How long using the internet 0.0022 -0.0018 0.1298 (0.0043) (0.0056) (0.1113) How long using email -0.0020 -0.0119* -0.3118** (0.0041) (0.0054) (0.1064) Age -0.0005** -0.0035** 0.0442** (0.0002) (0.0003) (0.0064) Log of income 0.0118** -0.0236** -0.5196** (0.0043) (0.0059) (0.1426) No internet access -0.0050 0.0100 0.4591* (0.0067) (0.0095) (0.2056) Listen to music while online 0.0150+ -0.0022 -0.3070 (0.0079) (0.0101) (0.2001) Household size -0.0018 0.0552** -0.5282** (0.0025) (0.0035) (0.0730) Confidence in English -0.0021 -0.0056+ -0.1273+ (0.0023) (0.0031) (0.0714) Male -0.0096+ 0.0008 0.7057**
47
(0.0052) (0.0070) (0.1728) Hours of TV 0.0005+ 0.0015** na (0.0003) (0.0004) na Hours of internet -0.0007 -0.0006 0.1136** (0.0006) (0.0008) (0.0149) Student -0.0549** -0.0481** -0.8211* (0.0111) (0.0165) (0.3236) Work full time 0.0005 0.0197* -1.4893** (0.0060) (0.0082) (0.1804) Education -0.0042 -0.0229** -0.4453** (0.0033) (0.0044) (0.1022)
Other Controls (dummies)
Region (1)-Ownership of goods
(2)-Purchases of goods (3)-Read magazines (4).
Region (1)-Ownership of goods
(2)-Purchases of goods (3)-Read magazines (4).
Region (1)-Ownership of goods
(2)-Purchases of goods (3)-Read magazines (4).
Mean of dependent variable 0.08 0.27 16.09 Number of observations 15,133 15,133 15,133
(1) 53 Regions within countries.
(2) TV, widescreen TV, dish, cable TV, set-top box for TV, VCR, PC, digital assistant, handheld game, WAP,
camcorder, printer, digital camera, digital camcorder, web camera, game console, DVD drive, DVD player, scanner and
mobile phone, Walkman, Hi-Fi stereo, CD writer, MP3 player. Excluded the good under analysis.
(3) Books, videos, video games, software, toys, sports goods, clothing, footwear, jewelry, gifts, flowers, event tickets,
electronics, groceries, beer, wine or spirits, tobacco, health and beauty.
(4) Women, family, home, cooking, travel, health, sports, motor, men, tv, celebrity, news, business, finance and nature.
Robust standard errors are listed in parentheses. + P<0.10;* P<0.05; ** P<0.01.
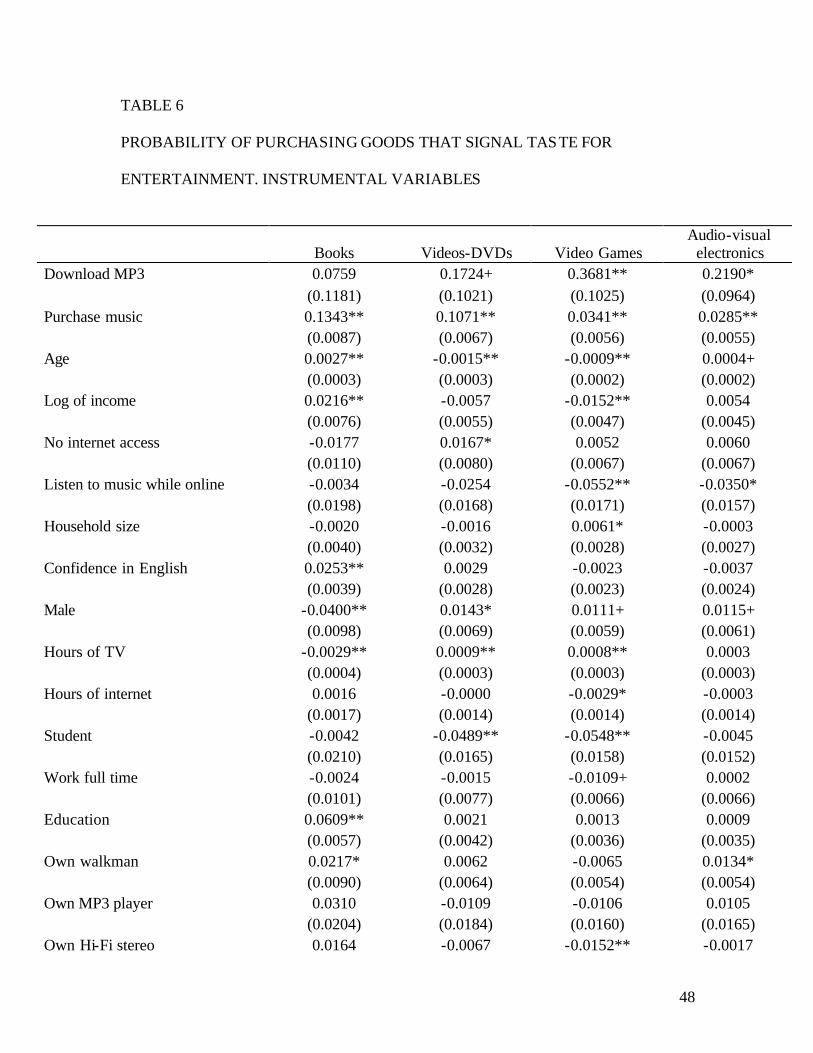
48
TABLE 6
PROBABILITY OF PURCHASING GOODS THAT SIGNAL TASTE FOR
ENTERTAINMENT. INSTRUMENTAL VARIABLES
Books Videos-DVDs Video Games Audio-visual electronics
Download MP3 0.0759 0.1724+ 0.3681** 0.2190* (0.1181) (0.1021) (0.1025) (0.0964) Purchase music 0.1343** 0.1071** 0.0341** 0.0285** (0.0087) (0.0067) (0.0056) (0.0055) Age 0.0027** -0.0015** -0.0009** 0.0004+ (0.0003) (0.0003) (0.0002) (0.0002) Log of income 0.0216** -0.0057 -0.0152** 0.0054 (0.0076) (0.0055) (0.0047) (0.0045) No internet access -0.0177 0.0167* 0.0052 0.0060 (0.0110) (0.0080) (0.0067) (0.0067) Listen to music while online -0.0034 -0.0254 -0.0552** -0.0350* (0.0198) (0.0168) (0.0171) (0.0157) Household size -0.0020 -0.0016 0.0061* -0.0003 (0.0040) (0.0032) (0.0028) (0.0027) Confidence in English 0.0253** 0.0029 -0.0023 -0.0037 (0.0039) (0.0028) (0.0023) (0.0024) Male -0.0400** 0.0143* 0.0111+ 0.0115+ (0.0098) (0.0069) (0.0059) (0.0061) Hours of TV -0.0029** 0.0009** 0.0008** 0.0003 (0.0004) (0.0003) (0.0003) (0.0003) Hours of internet 0.0016 -0.0000 -0.0029* -0.0003 (0.0017) (0.0014) (0.0014) (0.0014) Student -0.0042 -0.0489** -0.0548** -0.0045 (0.0210) (0.0165) (0.0158) (0.0152) Work full time -0.0024 -0.0015 -0.0109+ 0.0002 (0.0101) (0.0077) (0.0066) (0.0066) Education 0.0609** 0.0021 0.0013 0.0009 (0.0057) (0.0042) (0.0036) (0.0035) Own walkman 0.0217* 0.0062 -0.0065 0.0134* (0.0090) (0.0064) (0.0054) (0.0054) Own MP3 player 0.0310 -0.0109 -0.0106 0.0105 (0.0204) (0.0184) (0.0160) (0.0165) Own Hi-Fi stereo 0.0164 -0.0067 -0.0152** -0.0017
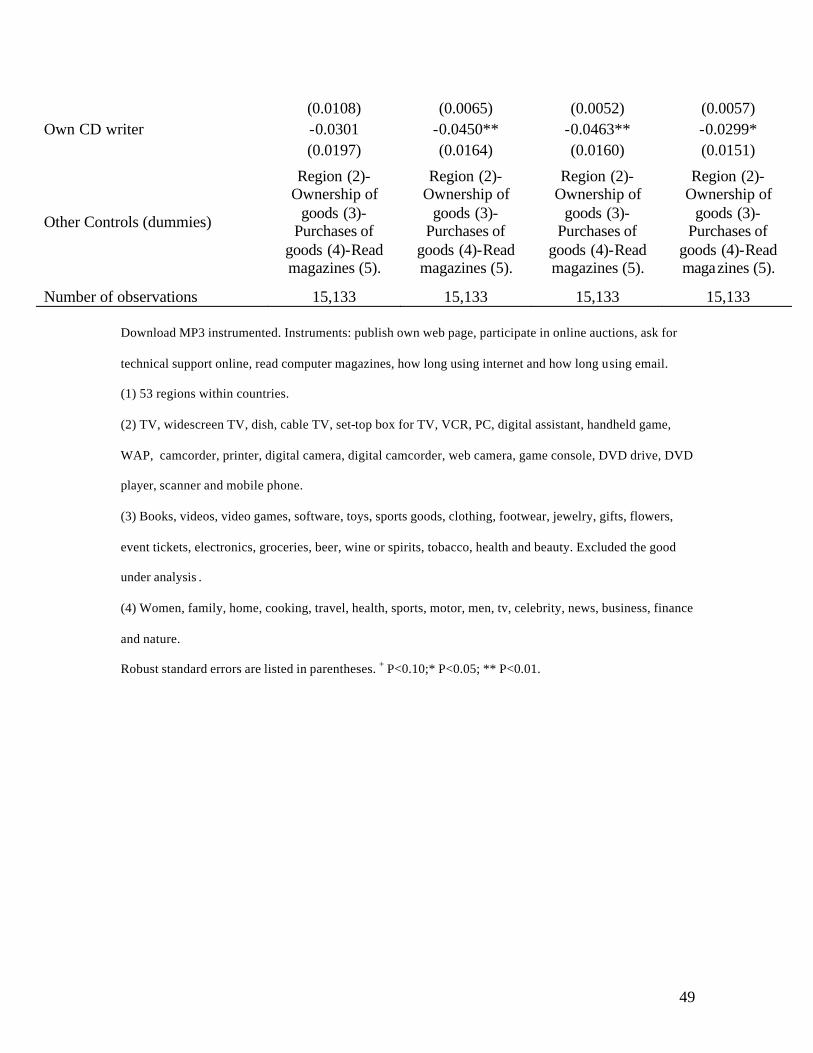
49
(0.0108) (0.0065) (0.0052) (0.0057) Own CD writer -0.0301 -0.0450** -0.0463** -0.0299* (0.0197) (0.0164) (0.0160) (0.0151)
Other Controls (dummies)
Region (2)- Ownership of
goods (3)-Purchases of
goods (4)-Read magazines (5).
Region (2)- Ownership of
goods (3)-Purchases of
goods (4)-Read magazines (5).
Region (2)- Ownership of
goods (3)-Purchases of
goods (4)-Read magazines (5).
Region (2)- Ownership of
goods (3)-Purchases of
goods (4)-Read magazines (5).
Number of observations 15,133 15,133 15,133 15,133 Download MP3 instrumented. Instruments: publish own web page, participate in online auctions, ask for
technical support online, read computer magazines, how long using internet and how long using email.
(1) 53 regions within countries.
(2) TV, widescreen TV, dish, cable TV, set-top box for TV, VCR, PC, digital assistant, handheld game,
WAP, camcorder, printer, digital camera, digital camcorder, web camera, game console, DVD drive, DVD
player, scanner and mobile phone.
(3) Books, videos, video games, software, toys, sports goods, clothing, footwear, jewelry, gifts, flowers,
event tickets, electronics, groceries, beer, wine or spirits, tobacco, health and beauty. Excluded the good
under analysis .
(4) Women, family, home, cooking, travel, health, sports, motor, men, tv, celebrity, news, business, finance
and nature.
Robust standard errors are listed in parentheses. + P<0.10;* P<0.05; ** P<0.01.
Related Documents