MEASURING THE EFFECT OF TENSION ON LIPID MEMBRANE VISCOSITY by MATTHEW REYER A THESIS Presented to the Department of Physics and the Robert D. Clark Honors College in partial fulfillment of the requirements for the degree of Bachelor of Science June 2015

Welcome message from author
This document is posted to help you gain knowledge. Please leave a comment to let me know what you think about it! Share it to your friends and learn new things together.
Transcript
MEASURING THE EFFECT OF TENSION ON LIPID
MEMBRANE VISCOSITY
by
MATTHEW REYER
A THESIS
Presented to the Department of Physics and the Robert D. Clark Honors College
in partial fulfillment of the requirements for the degree of Bachelor of Science
June 2015


iii
Acknowledgements
I would like to thank Professor Raghu Parthasarathy for welcoming me into his
lab and for being my scientific mentor for the past two years. I have no doubt that I
would not be where I am today, and that my future would be on much shakier grounds,
if not for his guidance.
I would also like to thank Tristan Hormel for introducing me to the world of
lipid membrane biophysics, for his programming expertise, and for being a generally
enjoyable person to work next to. Thanks Tristan, our conversations were generally
enjoyable.
I would also like to thank my parents, Mark and Barb, for putting up with me
and for their exemplary upholding of the typical parenting duties.
And finally, I would like to thank Mr. Matt Price of Lakeridge High School. If
Mr. Price ever reads this, I would like him to know it was he who inspired me to pursue
physics.
iv
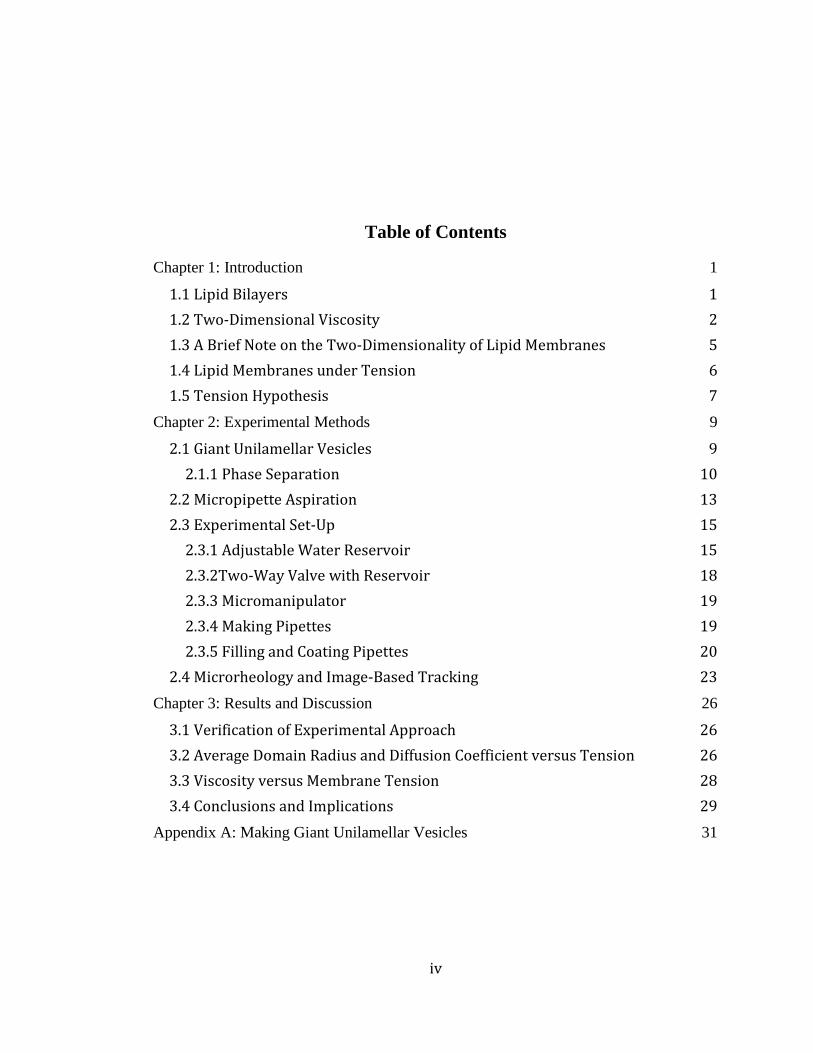
Table of Contents
Chapter 1: Introduction 1
1.1 Lipid Bilayers 1
1.2 Two-Dimensional Viscosity 2
1.3 A Brief Note on the Two-Dimensionality of Lipid Membranes 5
1.4 Lipid Membranes under Tension 6
1.5 Tension Hypothesis 7
Chapter 2: Experimental Methods 9
2.1 Giant Unilamellar Vesicles 9
2.1.1 Phase Separation 10
2.2 Micropipette Aspiration 13
2.3 Experimental Set-Up 15
2.3.1 Adjustable Water Reservoir 15
2.3.2Two-Way Valve with Reservoir 18
2.3.3 Micromanipulator 19
2.3.4 Making Pipettes 19
2.3.5 Filling and Coating Pipettes 20
2.4 Microrheology and Image-Based Tracking 23
Chapter 3: Results and Discussion 26
3.1 Verification of Experimental Approach 26
3.2 Average Domain Radius and Diffusion Coefficient versus Tension 26
3.3 Viscosity versus Membrane Tension 28
3.4 Conclusions and Implications 29
Appendix A: Making Giant Unilamellar Vesicles 31

v
List of Figures
Figure 1: Lipid Bilayer Illustration by Raghuveer Parthasarathy 1
Figure 2: Two Examples of Two-Dimensional Fluids 5
Figure 3: Two Phase-Separated GUVs 11
Figure 4: Schematic of Aspirated Phase-Separated, Giant Unilamellar Vesicle 14
Figure 5: Adjustable Water Reservoir 16
Figure 6: GUVs on a Glass Slide with Micropipette in Place 17
Figure 7: Water Reservoir in Equilibrium Pressure Position 17
Figure 8: Hydrostatic Pressure Calculation 18
Figure 9: Vacuum Filling System for Micropipettes 22
Figure 10: Three-Well Chamber for Filling Pipettes 22
Chapter 1: Introduction
1.1 Lipid Bilayers
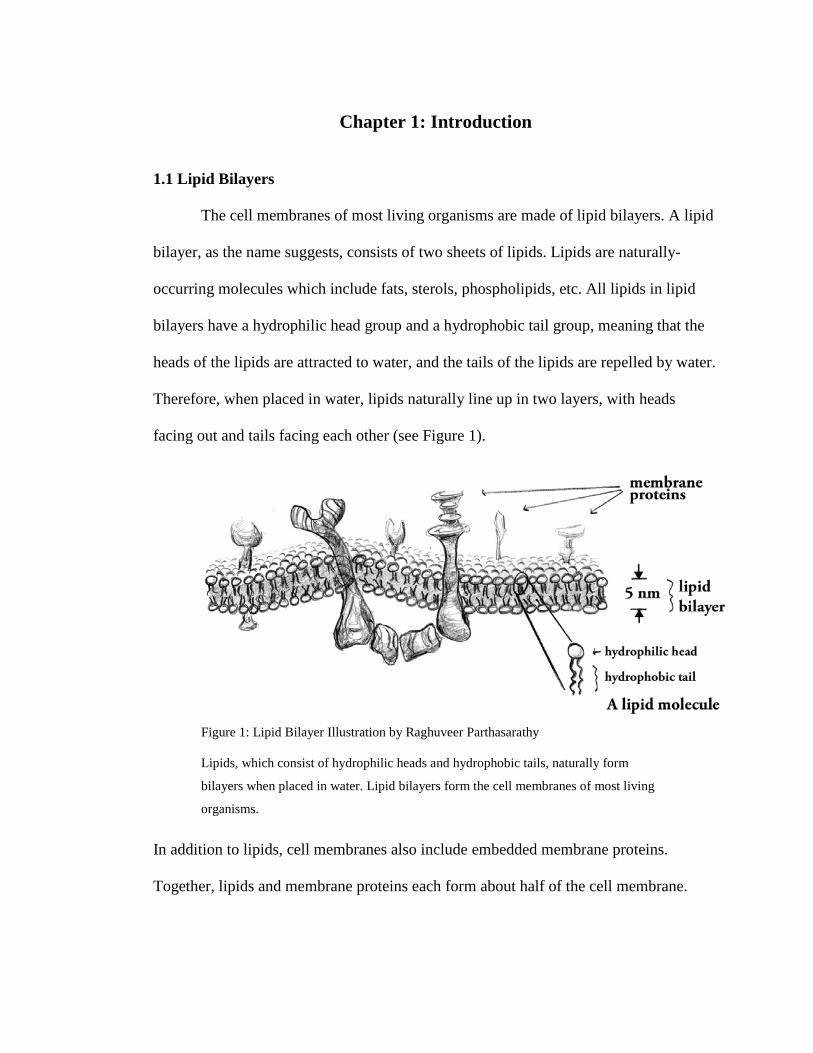
The cell membranes of most living organisms are made of lipid bilayers. A lipid
bilayer, as the name suggests, consists of two sheets of lipids. Lipids are naturally-
occurring molecules which include fats, sterols, phospholipids, etc. All lipids in lipid
bilayers have a hydrophilic head group and a hydrophobic tail group, meaning that the
heads of the lipids are attracted to water, and the tails of the lipids are repelled by water.
Therefore, when placed in water, lipids naturally line up in two layers, with heads
facing out and tails facing each other (see Figure 1).
Figure 1: Lipid Bilayer Illustration by Raghuveer Parthasarathy
Lipids, which consist of hydrophilic heads and hydrophobic tails, naturally form
bilayers when placed in water. Lipid bilayers form the cell membranes of most living
organisms.
In addition to lipids, cell membranes also include embedded membrane proteins.
Together, lipids and membrane proteins each form about half of the cell membrane.
2
Lipid bilayers typically contain several types of lipids, each with its own
physical property [1]. Lipid bilayers have both passive and active roles in cell function.
Because of the hydrophobic nature of their tails, lipid layers are impermeable to water-
soluble molecules such as ions, proteins, and sugars, making the lipid bilayer the ideal
membrane barrier for the cell and its organelles [2]. More actively, lipid bilayers are
involved in cell signaling, cell division, and cellular cargo transport [1,3,4].
All these active processes of the lipid membrane involve the motion of lipids
and proteins, and the bending of the membrane, implying that the lipid membrane is not
a solid or rigid structure, but rather a fluid. Indeed, it was the fluid mosaic model of
Singer and Nicolson which first described biological membranes as two-dimensional
(2D) fluids in which lipids and proteins can diffuse [5]. It is this fluidity which allows
for these active processes of the lipid bilayer, and therefore it is patently important for
cell function and biology in general. Therefore, it is of great interest and import to
characterize the physical parameters of this 2D fluid. The parameter of particular
interest in this paper is the 2D viscosity of the lipid membrane, as it is the 2D viscosity
which controls how fast lipid motion occurs, and consequently, the 2D viscosity sets the
timescale for many important cell functions.
1.2 Two-Dimensional Viscosity
Viscosity is a measure of a fluid’s resistance to flow or deform. The higher the
viscosity of a fluid, the more force it takes for things to move in it. Water has a lower
viscosity than, for example, honey or molasses. In the context of lipid membranes, the
higher the viscosity, the slower lipids move around. Our ability to accurately model
many cellular processes depends on our ability to measure the 2D viscosity of the lipid

3
membrane, for it is the 2D viscosity which sets the timescale for those functions which
depend on lipid and protein motion.
Unfortunately 2D viscosity is difficult to measure and remains poorly
quantified, especially compared to the typical three-dimensional (3D) viscosity, which
is commonly and easily measured. Whereas tools exist to directly measure the 3D
viscosity of liquids, 2D viscosity must be calculated indirectly by first measuring the
diffusion along the membrane. Diffusion is the random motion of molecules, driven by
ambient thermal energy. This motion is characterized by “random walks.” While each
“step” of a diffusing particle is random, by observing many diffusing particles over
time, statistics can be used to quantify the diffusive motion.
Diffusion of lipids can be observed experimentally, and mathematical models
exist which derive 2D viscosity from the numbers associated with that diffusion. The
first relevant equations are the Einstein relations, which describe the relation between
the diffusion coefficients of lipids and their corresponding drag coefficients. The
Einstein relations are:
(1) DR= kBTbR
(2) DT=kBTbT
where DR and DT refer to the rotational and translational diffusion coefficients,
respectively. For lipids, rotational diffusion refers to the motion around its head-to-tail
axis, and translational diffusion refers to its motion along the plane of the membrane. T
is the temperature of the fluid, kB is Boltzmann’s Constant, and bR and bT refer to the
rotational and translational drag coefficients, respectively. The diffusion coefficients
can be determined experimentally. Boltzmann’s constant and temperature are both

4
known, and the drag coefficients are derived from the other variables. With the drag
coefficients, we can solve for 2D viscosity by using one of two models: the Saffman-
Delbrück model, or the Hughes, Pailthorpe, White (HPW) model [6,7]. The Saffman-
Delbrück model is as follows:
(3) bT= (𝟒𝝅𝜼𝒎)𝒍𝒏�𝟐𝝐−𝟏�−𝜸
(4) bR=𝟒𝝅𝜼𝒎𝒂𝟐
where a is the membrane inclusion radius, i.e. the radius of the moving patch of lipids
or proteins, γ is Euler’s constant, ϵ is a ratio relating the viscosity of the membrane, the
viscosity of the fluid surrounding it (bulk viscosity), and a, and finally, ηm is the
viscosity of the membrane, the value we are trying to determine. The Saffman-
Delbrück model applies for systems with small ϵ, i.e. high membrane viscosities. The
HPW model extends the Saffman-Delbrück model to diffusing objects of any inclusion
radius. The equations however, are much more complicated than the Saffman-Delbrück
equations, and can only be solved numerically.
The Saffman-Delbrück equations provide the framework by which we can get
from observed diffusion to 2D estimates. Mathematically, the process is straight-
forward. Experimentally, the process becomes more complicated. Furthermore, it is
unknown how certain parameters affect the 2D viscosity of lipid membranes. One of
these untested parameters, the one which this paper will focus on, is tension. There are
real-life scenarios in which lipid membranes are subjected to heightened tension, and
the goal of this project is to see if tension has any effect on membrane viscosity and,
therefore, the motion of membrane molecules.

5
1.3 A Brief Note on the Two-Dimensionality of Lipid Membranes
Much emphasis has been placed on the lipid membrane being a two-dimensional
fluid. How accurate is this? Most fluids we encounter in everyday life are three-
dimensional; it is, in fact, odd to imagine a 2D fluid.
While it is true that there exist a non-zero number of atoms between the two
layers of lipid heads in a bilayer, in all, the bilayer is no more than five nanometers in
thickness (see Figure 1). Additionally, there is no space between the tails of the two
lipid layers, not even for water, due to the hydrophobic nature of the tails. The lipid
bilayer is as two-dimensional as possible in biology. Another example of a 2D fluid is a
soap film which, unlike a lipid bilayer, actually has space for water in between its two
layers of molecules (see Figure 2).
Figure 2: Two Examples of Two-Dimensional Fluids
Unlike a soap film, there is no space between the two layers of molecules in a lipid
bilayer. The lipid bilayer is as two-dimensional as it gets in biology.
Furthermore, and perhaps most importantly, the lipid motion we are concerned about
occurs in the plane of the lipid layer. Diffusion of particles across the membrane is not
relevant to this experiment. A single monolayer of lipids is on the scale of 1-2
nanometers in thickness, and it behaves fundamentally differently than a three-
dimensional fluid.

6
1.4 Lipid Membranes under Tension
As mentioned earlier, there are real-life scenarios in which lipid membranes
might be subjected to tension. For example, it is believed that cell crawling, which
occurs during wound healing and cancer metastasis, is controlled by membrane tension.
During cell crawling, a cell attaches to a surface, detaches and projects an extension of
its membrane, called a lamellipodium, and then reattaches at a point further along the
surface. It has been shown that the rate at which the lamellipodium extends and
consequently the rate at which cells crawl is controlled by membrane tension [8,9].
Additionally, the tension and tension distribution is believed to be fundamentally
different between stationary cells and moving cells [10]. Cells can crawl without any
external force driving the motion. In order to do this, they can actually alter their
tension in order to stretch.
Cells are able to create polarized distributions of signaling molecules along their
membranes, and this polarized distribution is necessary for biological processes such as
cell division, neurite formation, and cell motility. It was once believed that the polarized
distribution of signaling molecules, rather than a uniform distribution, was controlled by
diffusible molecules in the protruding edge of the cell membrane. Recently, though, the
Weiner Lab at University of California, San Francisco found that membrane tension
doubled in the protruding edge of the cell membrane, and that reducing membrane
tension led to a uniform distribution of signaling molecules. This suggested that it was
in fact tension, not diffusible molecules, which was responsible for cell polarity, and
therefore is an important factor in these cellular processes [11].
7
Membrane tension can also serve as a means by which cells and bacteria detect
forces being applied to them. Mechanosensors are molecules which respond to changes
in mechanical force. Bacteria contain two families of mechanosensitive channels, one of
which, MscL, is highly conserved. The MscL channel activates when it senses a change
in force. There are many avenues, though, through which a force can be changed. It is
now known that the MscL channel detects force changes by sensing the tension in the
membrane. It is also possible that tension is also the stimulus behind eukaryotic
Mechanosensors [12].
Many of these processes (cell crawling, signaling, etc.) are known to also be
influenced by membrane viscosity. Therefore, it seems that membrane tension and
viscosity are simultaneously significant factors in many processes. It would therefore be
interesting to know the influence the two variables have on each other, if any. This
question, whether or not tension affects membrane viscosity, is the focus of this paper.
1.5 Tension Hypothesis
My hypothesis is that high tension will lead to lower membrane viscosity.
Increasing tension should stretch out the lipid membrane, leading to more space
between the lipids, which will allow for the lipids to move more easily. If the lipids
move more quickly, then the diffusion coefficients referred to in equations (1) and (2)
will be higher, which would produce lower viscosity values.
In order to test this hypothesis, I use a technique called micropipette aspiration
on lipid vesicles. Lipid vesicles are model systems. Cell membranes are complex, but
lipid vesicles are made of a controlled lipid composition and are similar in size to cells.
Micropipette aspiration is a technique in which lipid vesicles are suctioned partially into

8
small, glass pipettes (~1-5 µm in radius). This suction stretches out the membrane of the
vesicle, creating tension. I built the micropipette aspiration device used in my
experiments, and developed many of the experimental techniques. The device and
techniques will continue to be used in future experiments involving tension on vesicles.
9
Chapter 2: Experimental Methods
2.1 Giant Unilamellar Vesicles
The vesicles I use in this experiment are called phase-separated Giant
Unilamellar Vesicles (GUVs). In biology, the term vesicle refers to a lipid bilayer
which has been rolled up into a sphere. It is essentially a hollow, spherical shell made of
a lipid bilayer. The vesicles I use for micropipette experiments are artificial, but there
are natural lipid vesicles with real biological functions. GUVs serve as an idealized, cell
model. The advantages of using artificial vesicles are that we can control their size and
composition, and can create numerous (roughly) similar vesicles at the same time.
Unilamellar means that there is a single wall of lipid bilayer in this vesicle.
Other model systems might be multilamellar, which means there are many lipid bilayers
stacked on top of each other. On average, GUVs are around 20-50 microns (µm) in size.
On the inside and outside of the lipid bilayers is a fluid meant to represent the
intra- and extracellular fluid a real cell would typically be surrounded by. In this case,
the fluid is a 0.1 Molar sucrose solution. GUVs are compositionally and structurally
similar to a cell membrane without all the subcellular components. Therefore, tension
experiments on GUVs are a simple analogue for tension experiments on real cells.
GUVs are formed by electroformation. First, a mixed-lipid composition is
deposited onto heated Indium Tin Oxide (ITO) coated glass slides. The lipids are then
dehydrated in a vacuum chamber for thirty minutes. After the vacuum chamber, the
glass slides are stuck together with lipid sides facing each other and a small piece of
Teflon placed in between to create a capacitor, which is then attached to a function

10
generator. The function generator outputs a sinusoidal alternating current for around
three hours [13, 14].
The lipid compositions I use to form the GUVs consist of 1,2-dipalmitoyl-sn-
glycero-3-phosphocholine (DPPC), 1,2-dioleoyl-sn-glycero-3-phosphocholine (DOPC),
and cholesterol. DPPC, DOPC, and cholesterol are all lipids. The ratios of DPPC,
DOPC, and cholesterol in the lipid compositions vary, with the concentration of each
individual lipid typically in the range of 20 to 40% of the total lipid mixture. In addition
to those three lipids, we also include a biotinylated lipid, which allows the membrane to
bond to a tracer particle if need be, and a fluorescent lipid probe (Texas Red DHPE),
which is what allows us to see the actual GUVs under a microscope. Both the
biotinylated lipid and the Texas Red DHPE typically make up about one percent of the
composition.
Though I have used many different compositions for vesicles in the past, with
both DOPC-dominant and DPPC-dominant compositions, I used a 2:1 DPPC:DOPC, 40
percent cholesterol, composition for the entirety of my micropipette experiments. I used
only one composition because although the viscosity values would certainly change for
different compositions, the overall relationship between membrane tension and
viscosity should not depend on the composition.
2.1.1 Phase Separation
In order to extract viscosity numbers we first need to observe diffusion to obtain
values for diffusion coefficients. Observing GUVs alone does not allow us to quantify
viscosity, because we are looking for motion on the membrane of the vesicle, and the
heads of lipids all look the same. It is impossible to track the motion of a lipid if it is

11
identical to its background. In order to solve this problem, I exploit the phenomenon of
phase-separation.
“Phase” refers to the phases of matter, such as the familiar gas, liquid, and solid.
The important phases in mixed-lipid membranes are the liquid-ordered and liquid-
disordered phases. At room temperature, DOPC exists in the liquid-disordered phase,
and DPPC exists in the liquid-ordered phase. In the presence of cholesterol, the two
different phases separate, and the lesser-concentrated lipids self-assemble into circular,
liquid domains [14, 15, 16]. The Texas Red fluorescent dye included in the GUV
composition binds differently to the two different phases, resulting in differently-
colored lipid domains. For the 2:1 DPPC:DOPC GUVs I use in these experiments, the
final result is a dark colored vesicle with bright, circular domains (see Figure 3, below).
Figure 3: Two Phase-Separated GUVs
Left: 2:1 DOPC:DPPC, 20% Cholesterol GUV exhibiting phase-separation. The dark
domains are DPPC, in the liquid-ordered phase
Right: 2:1 DPPC:DOPC, 40% Cholesterol GUV exhibiting phase-separation. The light
domains are DOPC, in the liquid-disordered phase. This is the composition I use in my
experiments.

12
Using a fluorescent microscope, we can see these GUVs and the individual lipid
domains. The lipid domains exhibit diffusive motion, so they are the objects that allow
us to observe diffusion in the bilayer. Using the diffusion numbers of those lipid
domains, which are derived experimentally, we can glean information on the viscosity
of the membrane using equations (3) and (4).
One convenient feature of phase-separated GUVs is that they provide all the
information needed to solve equations (3) and (4) for viscosity. Generally, there are two
scenarios. In order to solve the two equations, (3) and (4), for membrane viscosity, there
can be at most two unknowns including the viscosity. In one scenario, we can calculate
both the rotational and translational diffusion coefficients, in which case the two
unknowns are the viscosity, ηm, and the inclusion radius, a. The Parthasarathy lab has
done experiments in the past using paired fluorescent beads, anchored to lipid
membranes, as tracer particles in order to extract both the rotational and translational
diffusion coefficients. The reason the inclusion radius is considered an unknown is that
we cannot simply assume that the radius of the diffusing patch of lipids is the same as
the radius of the tracer particles, due to interactions between the particle and the
membrane which cannot be accurately quantified [17].
Fortunately, the inclusion radius in the case of phase-separated GUVs is just the
radius of the lipid domain, which can be observed experimentally. With the inclusion
radius known, we can skip the rotational equation (4) entirely, and solve for the
membrane viscosity using only equation (3). So, using phase-separated GUVs and
fluorescent microscopy, we can experimentally derive all the variables necessary to get
from diffusion numbers to viscosity.
13
2.2 Micropipette Aspiration
The question this thesis attempts to answer is whether or not tension has any
effect on membrane viscosity. Micropipette aspiration is the process by which I apply
tension to lipid vesicles. The mechanics of micropipette aspiration are conceptually
simple, though challenging to implement. A small, glass pipette (~1-5 microns in
radius) is attached by airtight tubing to a water reservoir. Adjusting the height of that
water reservoir leads to a pressure difference at the tip of the pipette. That pressure
difference can cause a flow into or out of the pipette and is the mechanism by which
GUVs are drawn to the tip of the pipette. The GUV is then partially suctioned into the
pipette, which stretches out the membrane of the vesicle, creating tension.

14
Figure 4: Schematic of Aspirated Phase-Separated, Giant Unilamellar Vesicle
A schematic of an aspirated GUV. To the left is a drawing by Raghu Parthasarathy
representing the aspirated vesicle and the relevant parameters. Rp is the radius of the
pipette. RO is the radius of the vesicle outside the pipette (also called RC). To the right
is an actual, experimental image of an aspirated GUV exhibiting phase separation.
From a still image of an aspirated vesicle (such as Figure 4, above), the membrane
tension can be calculated. Derived from the Laplace Pressure, the equation which gets
us from pressure and the geometry of the pipette and vesicle to a value for tension is:
(5) ∆𝑷 = 2𝑻𝑪( 1𝑹𝑃− 1
𝑹𝐶)
Where ΔP is the pressure difference accounted for by the change in height of the water
reservoir (original pressure, P0, is set at equilibrium), RP is the radius of the pipette
(and also the radius of the inner projection of the vesicle), RC (also called RO in Figure
4) is the radius of the vesicle outside the pipette, and TC is the tension across the
membrane of the vesicle [18, 19, 20].

15
2.3 Experimental Set-Up
In order to implement the procedure described above, I built a micropipette
aspiration system. The components of that system are described in the following
sections.
2.3.1 Adjustable Water Reservoir
The pressure control comes from an adjustable water reservoir. There are two
levels of height control: a large, coarse control, and a small, fine control. The large,
coarse control comes in the form of a meter-high metal slide, upon which the entire
stage holding the water reservoir can be moved. The height on the large control can be
measured to millimeter certainty.
The small, fine control is used when the stage holding the water reservoir is
locked into place relative to the metal slide. Its height can be adjusted fractions of a
millimeter at a time, and the exact height can be measured with tenth of a millimeter
certainty. Pictures and schematics of the adjustable water reservoir can be seen below.

16
Figure 5: Adjustable Water Reservoir
The height of the water reservoir can be adjusted by either sliding the stage to which it
is attached along the metal slide, or by turning the metal knob on the stage. Adjusting
the metal slide creates large, but less precise, adjustments. Adjusting the stage itself
using the metal knob allows small, precise adjustments.
GUV experiments are performed on a glass slide using a 60x magnification, contact
objective on a fluorescent microscope (see Figure 6 below). Due to the short working
distance of the contact objective, the tip of the micropipette must penetrate through the
droplet of GUVs and come very close to the surface of the slide, within roughly one
millimeter. Therefore, equilibrium pressure is considered to be when the surface of the
water reservoir is even with the tip of the pipette (see Figure 7).

17
Figure 6: GUVs on a Glass Slide with Micropipette in Place
GUV experiments are performed using a glass slide and a 60x magnification, contact
objective under a fluorescent microscope. The micropipette tip must penetrate the
surface of the GUV solution, and come within a millimeter of the glass slide.
Figure 7: Water Reservoir in Equilibrium Pressure Position
At equilibrium, the surface of the water reservoir (in the vertical cylinder on the right)
is even with the tip of the micropipette (on the left). The picture above actually shows
the system slightly out of equilibrium, as the water reservoir is higher than the tip of the
pipette.

18
The pressure applied to the vesicle comes from the hydrostatic pressure due to the
vertical drop of the water reservoir, and is simply:
(6) ΔP = ρgΔh
Where ρ is the density of the fluid in the water reservoir (which is typically water, and
therefore ρ = 1 g/mL), g is the gravitational acceleration, 9.8 m/s/s, and Δh is the height
change of the water reservoir (see Figure 8, below).
Figure 8: Hydrostatic Pressure Calculation
The hydrostatic pressure applied to the vesicle can be calculated simply using the
height change of the water reservoir, Δh.
The hydrostatic pressure from the height change of the water reservoir is the same
pressure we plug into equation (5), where we solve for membrane tension.
2.3.2Two-Way Valve with Reservoir
In Figure 5, the two-way valve attached to the water reservoir is on display. The
red knob can be turned to either create a path from the open-air, water reservoir to the
pipette, or from a closed syringe to the pipette. The open-air, water reservoir provides

19
the hydrostatic pressure used in the experiment. The closed syringe can apply much
larger forces, and can be used for a variety of reasons, such as clearing the pipette of
any lipid residue which may have accumulated, or for drawing far away vesicles closer
to the tip of the pipette.
2.3.3 Micromanipulator
The micropipettes are held in place by a metal rod attached to a
micromanipulator. The micromanipulator can move the pipette a few microns at a time
on three axes. It is attached to the stage which holds the glass slide with the GUVs. It
also holds pipettes in the vacuum device used for filling them (section 2.3.5)
2.3.4 Making Pipettes
Micropipettes start as glass capillaries. The glass capillaries are made of
borosilicate and have a 1.2 millimeter outer diameter, and a 1.0 millimeter inner
diameter. Using a Sutter horizontal pipette puller, which applies heat and pulls the
softened glass, the glass capillaries are made into closed pipettes, meaning that they
have taken on a pipette shape, but the tip of the pipettes are closed. These are not useful
in this experiment, as water needs to flow through the pipettes. The closed pipettes are
turned into open pipettes using a microforge from World Precision Instruments. The
microforge has a filament which can be heated up enough to melt the glass at the tip of
the pipette. Using this function, the tip of the pipette is melted slightly and attached to
the filament, which then retracts and breaks off the tip, leaving an open pipette. If this
has been done properly, the opening of the pipette should be somewhere between one
and five microns in radius.

20
After the tip of the pipette is broken off, though, the end will have jagged edges.
This is also detrimental to GUV experiments, as lipid vesicles are fragile and can burst
if the jagged edges pierce them. In order to fix this problem, the microforge can also fire
polish the edges of the micropipette. By turning the heat on the filament up to around
ninety percent of full capacity and bringing the pipette tip close to, but not in contact
with, the pipette, the heat from the filament can smooth the edges of the pipette tip. This
is not only helpful, but necessary for GUV experiments.
A smooth micropipette is not enough to perform GUV experiments, however, as
lipids can adhere to glass. If adhesion occurs, the tension numbers will not be accurate
because the membrane will stretch as a result of that adhesion rather than the pressure
from the water reservoir. In order to counter adhesion, the micropipettes are coated with
a filtered Bovine Serum Albumin (BSA) solution. BSA prevents lipids from sticking to
glass.
2.3.5 Filling and Coating Pipettes
The micropipettes must be filled completely before they are connected to the
pressure system tubing. The opening of the pipette is so small that it takes a significant
amount of force to pump liquid through the tip. Atmospheric pressure alone will not
provide enough force. It is also necessary for the pipettes to be completely free of air
bubbles; since gas is compressible, raising or lowering the water reservoir when there is
an air bubble in the pipette will merely expand or compress the air bubble, rather than
move liquid, which is the principal mechanism driving this experiment. It is also nearly
impossible to pump an air bubble out the tip of the micropipette.

21
In order to fill the micropipettes without air bubbles, the backs of fire-polished
micropipettes are attached by medical tubing to a vacuum. While there is vacuum inside
the pipettes, liquid can be drawn up through the tip of the pipette through capillary
action.
Using the same micromanipulator described in section 2.3.3, the pipettes are
held in place while attached to vacuum. They are then placed over an improvised three-
well chamber. In the first well is pure, deionized water, used to clear the pipette of any
residue which may be left over from the fabrication process.
In the second well is the filtered BSA solution. The tip of the pipette is left
submerged in the filtered BSA for at least fifteen minutes while simultaneously drawing
it in, in order to coat both the inside and the outside of the micropipette tip. Fifteen
minutes should be sufficient for coating pipettes, but should also be regarded as a
minimum.
The third well contains 0.1 Molar sucrose solution, the same solution used to
electroform the GUVs. The same solution is used in order to avoid osmosis across the
membrane, which would complicate the pressure calculation. The GUVs are also
submerged in the 0.1 Molar sucrose solution when experiments are being performed.

22
Figure 9: Vacuum Filling System for Micropipettes
A micropipette is wovne through a metal rod attached to a micromanipulator. The back
of the pipette is attached, by medical tubing, to vacuum, and liquid is drawn up into the
pipette through capillary action.
Figure 10: Three-Well Chamber for Filling Pipettes
The left well contains pure, deionized water. The middle well contains filtered BSA
solution. The right well contains .1 Molar sucrose solution. Food coloring was added
above for illustrative purposes.

23
2.4 Microrheology and Image-Based Tracking
Our technique for measuring diffusive motion in lipid membranes is called
passive microrheology. Rheology is the study of how materials flow in response to a
force applied to them, and microrheology is just rheology applied to small objects such
as cells or, in our case, GUVs. Passive microrheology refers to measurements that rely
on the Brownian motion of tracers without an applied external force, as opposed to
active microrheology, which depends on some force being applied to the object [21].
The position of particles undergoing Brownian motion or random walks cannot be
predicted with 100 percent accuracy, but Brownian motion is a statistical process,
meaning that models exist which can predict with some accuracy where the particle will
be after one step in relation to where it was in the last step.
In order to measure the diffusion coefficients of lipid domains, we image them
under a fluorescent microscope, and then analyze their paths. To create a connected
path which we can analyze on a computer, we must calculate the center of the domain
in each frame of the video and connect the centers to create a continuous track.
Calculating the center of the domain, though, is decidedly non-trivial. To do so, we
implement a particle-tracking program written in the MATLAB programming language
written by Tristan Hormel, a graduate student in the Parthasarathy Lab [22].
The program takes advantage of the fact that for any given imaged particle, the
distribution of its light intensity is radially symmetric about the center. Using this fact,
the program uses an algorithm which calculates the point in the image which maximizes
its symmetry and calls that point the center. The program needs to perform this
calculation for each frame of the video and connect the center of the domain in one
24
frame to the center of the domain, which has likely moved, in the next frame. The
accuracy of the particle tracking obviously depends on the quality and clarity of the
images.
By analyzing the continuous path of a lipid domain over time, it is possible to
calculate its translational diffusion coefficient. It is also necessary, though, to calculate
the size of the lipid domain. In order to calculate the size of a lipid domain, our program
uses two thresholds. First is a bandpass filter threshold, which processes a spatial image
in the frequency domain, then cuts off the high and low frequencies. What this equates
to is an overall smoothing of the image, and a highlighting of the domain edges.
The second filter is based on Otsu’s Method, which attempts to threshold image
clusters. The method separates foreground pixels from background pixels by assuming
they have different intensity values [23]. This is useful for separating domains from the
dominant lipid background.
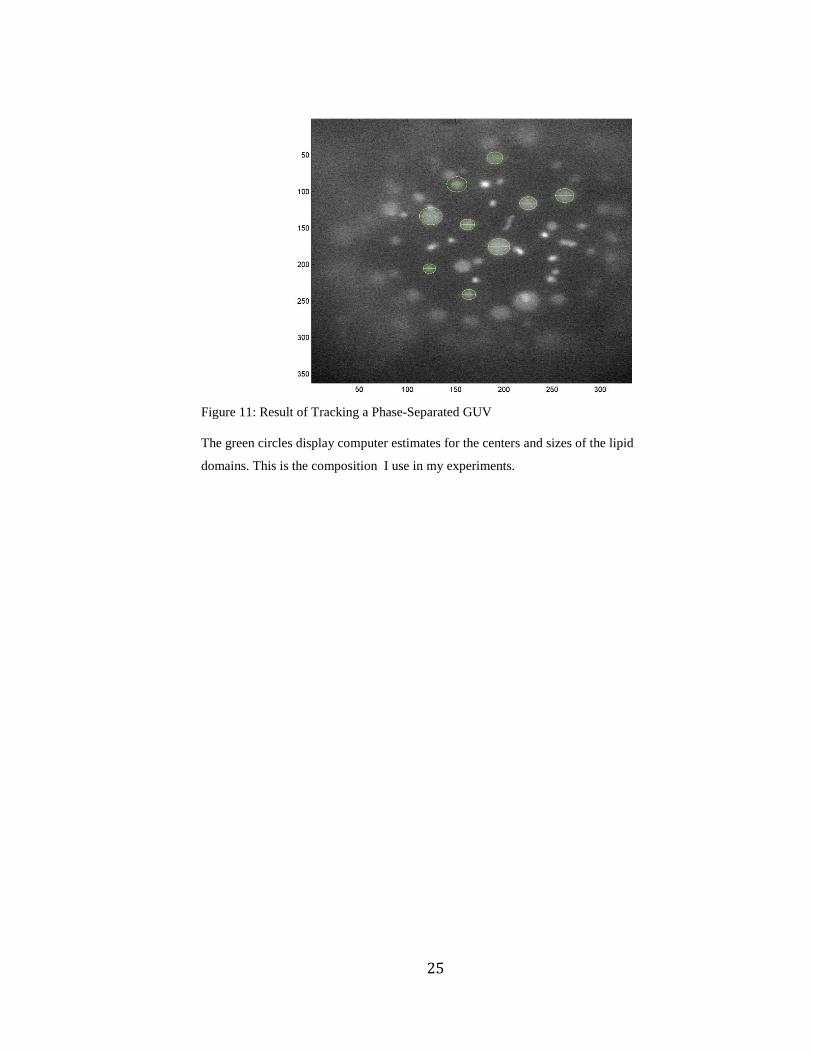
The result of this tracking for a single frame looks like Figure 11 below. The
tracking program would produce something similar for each frame to produce
continuous tracks for the lipid domains and average sizes for each domain.
25
Figure 11: Result of Tracking a Phase-Separated GUV
The green circles display computer estimates for the centers and sizes of the lipid
domains. This is the composition I use in my experiments.

26
Chapter 3: Results and Discussion
3.1 Verification of Experimental Approach
Micropipette aspiration of phase-separated vesicles has worked. Using this
approach, I have been able to probe wide ranges of vesicle sizes and membrane
tensions. The GUVs I have conducted experiments on have been anywhere from ten to
sixty microns in diameter. The membrane tensions I have induced with micropipette
aspiration have spanned two orders of magnitude, from under 100 µN/m, to over 2500
µN/m. These numbers indicate that the micropipette aspiration system I constructed, it
will be possible to conduct more experiments involving tension in lipid membranes in
the future. In fact, another undergraduate is being trained on the system now to carry on
these sorts of experiments.
3.2 Average Domain Radius and Diffusion Coefficient versus Tension
It appears that the average size of lipid domains decreases slightly as tension
expands. It is also interesting to note that the average domain radius appears to
converge as tension increases (see Figure 12).

27
Figure 12: Membrane Tension vs. Average Domain Radius
There appears to be a slight decrease in the average lipid domain radius as membrane
tension increases. The average radius also appears to converge at high tension.
At lower tensions, lipid domain radii, on average, spanned from about 0.9 to 2 microns
in radius, while at higher tensions, lipid domain radii spanned from about 0.7 to 0.8
microns.
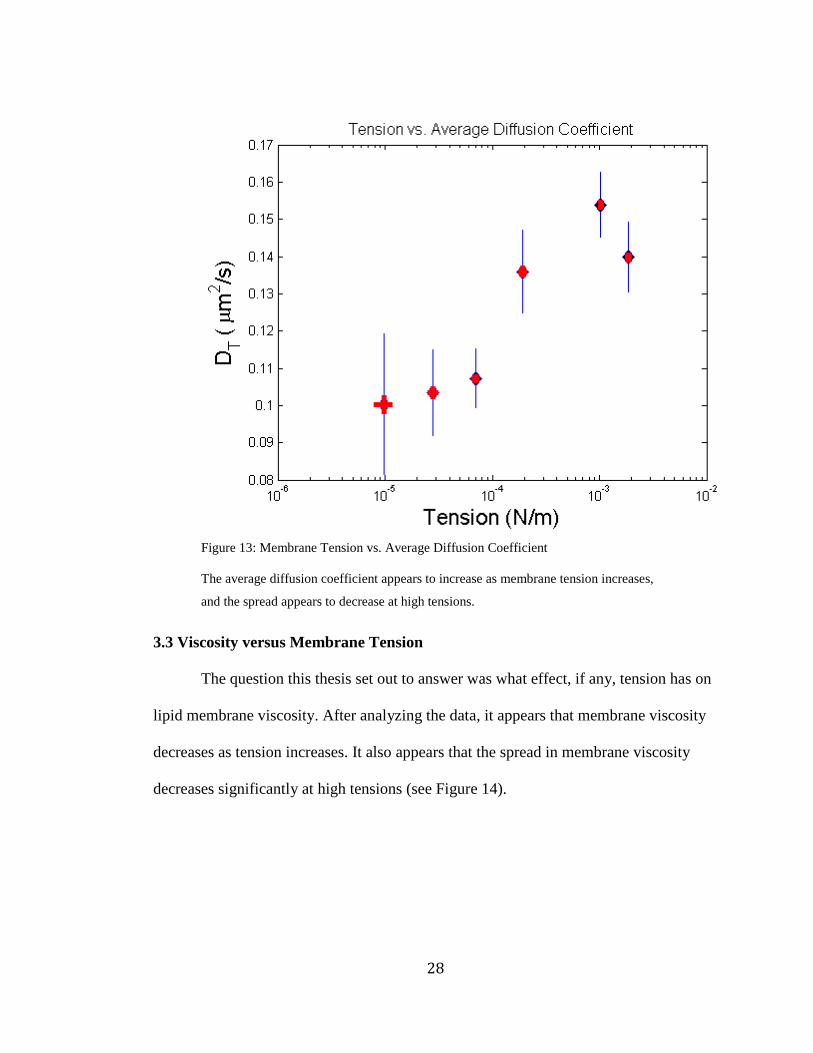
The average diffusion coefficient appears to increase as membrane tension
increases. Also, the spread in the diffusion coefficients seems to decrease at high
membrane tensions (see Figure 13). In fact, the data is quite convincing
28
Figure 13: Membrane Tension vs. Average Diffusion Coefficient
The average diffusion coefficient appears to increase as membrane tension increases,
and the spread appears to decrease at high tensions.
3.3 Viscosity versus Membrane Tension
The question this thesis set out to answer was what effect, if any, tension has on
lipid membrane viscosity. After analyzing the data, it appears that membrane viscosity
decreases as tension increases. It also appears that the spread in membrane viscosity
decreases significantly at high tensions (see Figure 14).

29
Figure 14: Membrane Tension vs. Viscosity
It appears that viscosity decreases as membrane tension increases, which is in line with
my original hypothesis. It also appears that the spread in membrane viscosity decreases
significantly at high tensions. The blue bars represent combined standard deviation,
while the red bars are the standard error. These points represent sixty GUVs
3.4 Conclusions and Implications
The micropipette aspiration system I designed is effective for performing
tension experiments on lipid vesicles. Using it, I have shown that lipid membrane
viscosity decreases as tension increases. This could have interesting implications for
biological processes which involve cell membranes stretching, such as metastasizing
cancer cells or cells undergoing division. The results of this experiment certainly
warrant further exploration into lipid membranes under tension.
This is the first time tension-mediated changes in membrane viscosity have been
measured. The intuitive explanation for the decrease in viscosity is that tension stretches

30
out the membrane, leading to more space between lipids, making motion in the
membrane easier. Though it is impossible to confirm this explanation without seeing
single lipids diffusing, the data at least supports the explanation.
Future experiments which might involve the micropipette aspiration system
include spanning large ranges of tension on the same vesicle, or testing the effect of
temperature on tension and membrane viscosity. It is known that both temperature and
tension affect the phase-transition behavior of mixed-lipid vesicles, and it would be
interesting to create a phase diagram which takes the two variables into account.
31
Appendix A: Making Giant Unilamellar Vesicles
The Parthasarathy Lab protocol for making Giant Unilamellar Vesicles is based
on both Tristan Ursell’s electroformation protocol and the Veatch-Keller protocol.
Materials
• Indium-tin-oxide (ITO) coated glass slide
• Silicone gasket material
• Binder clips
• Conductive Copper tape
Procedure
1. Cut an ITO glass slide in half. Place copper tape so that the length of it hangs significantly off the edge of the conducting side of the glass, and the width of it hangs only slightly off the glass. The conducting side of the glass can be found by testing it for resistance using a multimeter.
2. Clean ITO glass with ethanol and DI water. First rinse the ITO glass, then gently dab on ethanol using a Kim wipe, then repeat the ethanol and water rinse. Dry using nitrogen gas from tank.
3. Cut the silicone gasket material into a U-shape the size of one of the glass slide halves. Both halves will be held together with the silicone U placed in between
4. Clean the silicone gasket with plenty of soap and water.
5. For phase-separated GUVs, place the clean and dry ITO glass slides on a hot plate for at least ten minutes at 200 degrees Celsius.
6. After ten minutes, remove the glass slides and deposit your lipid composition onto the slides using a lipid syringe. The lipid syringe is a 10 µL syringe which should be cleaned out prior to use with chloroform. At most, 5 µL of lipid solution should be deposited onto the glass.

32
7. Place the glass slides in the desiccator and cover loosely with a piece of aluminum foil to block out the light. Turn on the vacuum and leave the slides covered for at least thirty minutes.
8. When thirty minutes have passed, form a capacitor by sandwiching the silicone U with the ITO glass slides. The lipid side of the slides should be facing each other. The slides can be held together with a binder clip, leaving the opening of the U uncovered
9. Backfill the capacitor with hydration solution using a syringe. The hydration solution is typically 0.1 M sucrose.
10. Seal the opening of the U with another binder clip.
11. Wire the capacitor to a function generator using alligator clips attached to the copper tape.
12. Set the function generator to produce a 10 Hz sine wave, with Vrms (root-mean-square) of 1.2 Volts, 0 Volt offset. Leave the slides attached and covered from light for two to three hours. Three hours seems to produce better GUVs
13. For phase-separated vesicles, the slides should also remain heated above their phase transition temperature for the entirety of the electroformation
14. When the two to three hours have passed, turn off the function generator and extract the vesicle solution using a designated vesicle syringe.
15. Store the vesicle solution at 4 degrees Celsius or, if making phase-separated vesicles, at room temperature or above.
16. GUVs are best to use within two to three days of formation
17. Glass slides can be re-used two more times if the cleaning protocol is followed after the vesicles have been extracted. After three uses, the slides should be discarded, and new glass should be used.

33
Bibliography
[1] Nag, K. (2008). Structure and dynamics of membranous interfaces. Hoboken, N.J.: Wiley.
[2] Phillips, R., Kondev, J., & Theriot, J. (2009). Physical biology of the cell. New York, NY: Garland Science.
[3] Parthasarathy, R., & Groves, J. (n.d.). Curvature and spatial organization in biological membranes. Soft Matter, 24-24
[4] Grakoui A1, Bromley SK, Sumen C, Davis MM, Shaw AS, Allen PM, Dustin ML, Science, 1999 Jul 9;285(5425):221-7
[5] Singer, S., & Nicolson, G. (1972). The Fluid Mosaic Model Of The Structure Of Cell Membranes. Science, 175, 720-731
[6] Saffman, P., & Delbruck, M. (1975). Brownian Motion in Biological Membranes. Proceedings of the National Academy of Sciences, 72(8), 3111-3113.
[7] B. D. Hughes, B. A. Pailthorpe and L. R. White (1981). The translational and rotational drag on a cylinder moving in a membrane. Journal of Fluid Mechanics, 110, pp 349-372
[8] Diz-Muñoz, A., Fletcher, D. A., & Weiner, O. D. (2013). Use the force: Membrane tension as an organizer of cell shape and motility. Trends in Cell Biology, 23(2), 47–53
[9] Raucher, D., & Sheetz, M. P. (2000). Cell Spreading and Lamellipodial Extension Rate Is Regulated by Membrane Tension. The Journal of Cell Biology, 148(1), 127–136.
[10] Schweitzer, Y., Lieber, A. D., Keren, K., & Kozlov, M. M. (2014). Theoretical Analysis of Membrane Tension in Moving Cells. Biophysical Journal, 106(1), 84–92. doi:10.1016/j.bpj.2013.11.009
[11] Houk, A. R., Jilkine, A., Mejean, C. O., Boltyanskiy, R., Dufresne, E. R., Angenent, S. B., … Weiner, O. D. (2012). Membrane tension maintains cell polarity by confining signals to the leading edge during neutrophil migration.Cell, 148(1-2), 175–188. doi:10.1016/j.cell.2011.10.050
[12] Iscla, I., & Blount, P. (2012). Sensing and Responding to Membrane Tension: The Bacterial MscL Channel as a Model System. Biophysical Journal, 103(2), 169–174. doi:10.1016/j.bpj.2012.06.021

34
[13] Veatch, S., & Keller, S. (2003). Separation of Liquid Phases in Giant Vesicles of Ternary Mixtures of Phospholipids and Cholesterol. Biophysical Journal, 85, 3074-3083
[14] Veatch, S., & Keller, S. (2002). Organization in Lipid Membranes Containing Cholesterol.Physical Review Letters, 89(26)
[15] Chen, D., & Santore, M. (2014). Large effect of membrane tension on the fluid-solid phase transitions of two-component phosphatidylcholine vesicles. Proceedings of the National Academy of Sciences, 111(1), 179-184.
[16] Marsh, D. (2010). Liquid-ordered phases induced by cholesterol: A compendium of binary phase diagrams. Biochimica Et Biophysica Acta (BBA) - Biomembranes, 688-699.
[17] Hormel, T., Kurihara, S., Brennan, M., & Parthasarathy, R. (2014). Measuring Lipid Membrane Viscosity using Rotational and Translational Particle Diffusion. Physical Review Letters, 112(18), 188101-5.
[18] De Gennes, P., Brochard-Wyart, F., & Quere, D. (2004). Capillarity and Wetting Phenomena: Drops, Bubbles, Pearls, Waves. New York, NY: Springer
[19] Portet, T., Gordon, S. E., & Keller, S. L. (2012). Increasing Membrane Tension Decreases Miscibility Temperatures; an Experimental Demonstration via Micropipette Aspiration. Biophysical Journal, 103(8), L35–L37.
[20] Hochmuth, R. (2000). Micropipette aspiration of living cells. Journal of Biomechanics, 33, 15-22.
[21] Chen, D., Wen, Q., Janmey, P., Crocker, J., & Yodh, A. (2010). Rheology of Soft Materials.Annual Review of Condensed Matter Physics, 301-322.
[22] Parthasarathy, R. (2012). Rapid, accurate particle tracking by calculation of radial symmetry centers. Nature Methods, 9(7), 724-726.
[23] Otsu, N. (1979). A Threshold Selection Method from Gray-Level Histograms. IEEE Transactions on Systems, Man, and Cybernetics, 9(1), 62-66.
Related Documents