ILLINOIS VALLEY COMMUNITY COLLEGE 2011-2013 Measures & Targets for K ey P erformance I ndicators Institutional Research Committee Harold Barnes Sue Isermann Joanne Jalley Betsy Klopcic Robert Mattson Tracy Morris Renee Prine Rick Serafini Lori Scroggs Cathy Bangert WWW . IVCC . EDU / IR

Welcome message from author
This document is posted to help you gain knowledge. Please leave a comment to let me know what you think about it! Share it to your friends and learn new things together.
Transcript
ILLINOIS VALLEY COMMUNITY COLLEGE
2011-2013
Measures & Targets for Key Performance Indicators
Institutional Research Committee
Harold Barnes
Sue Isermann
Joanne Jalley
Betsy Klopcic
Robert Mattson
Tracy Morris
Renee Prine
Rick Serafini
Lori Scroggs
Cathy Bangert
W W W . I V C C . E D U / I R
INTRODUCTION
The development of the measures and targets for Illinois Valley Community College (IVCC) Key
Performance Indicators (KPIs) for FY 2011-2013 is the product of work of the Institutional Research
Committee (IRC). The IRC is following a process developed by an action project team that began in
July 2008, and produced the KPI Measures and Targets for FY09 and FY10.
The IRC has used the following criteria to determine if a measure should continue to be included:
Does the measure provide information that will help IVCC to improve?
Does the measure encourage IVCC to value the right things?
Can the measure be readily understood by IVCC stakeholders and is it credible to them?
Is data already being collected or reported to IVCC stakeholders?
If not, can the data be obtained at a reasonable cost?
Is there a standard of comparison or benchmark against which progress can be measured?
Which Strategic Goal does it relate?
Which AQIP Category does it relate?
The IRC is following the process developed by the 2008-09 Action Project Team. The IRC has
reviewed the measures and targets to identify gaps, develop new performance measures and targets as
needed, and integrate these procedures into the College’s strategic planning process.
Measures which are items from surveys may or may not have targets which are significantly higher
than a comparison group or a prior year’s IVCC survey results. This is information that we receive
after the survey results are compiled. The IRC understands also that not all items are able to be
changed in an equal way. However, it is the committee’s intention to seek improvement in these
items gradually over time.
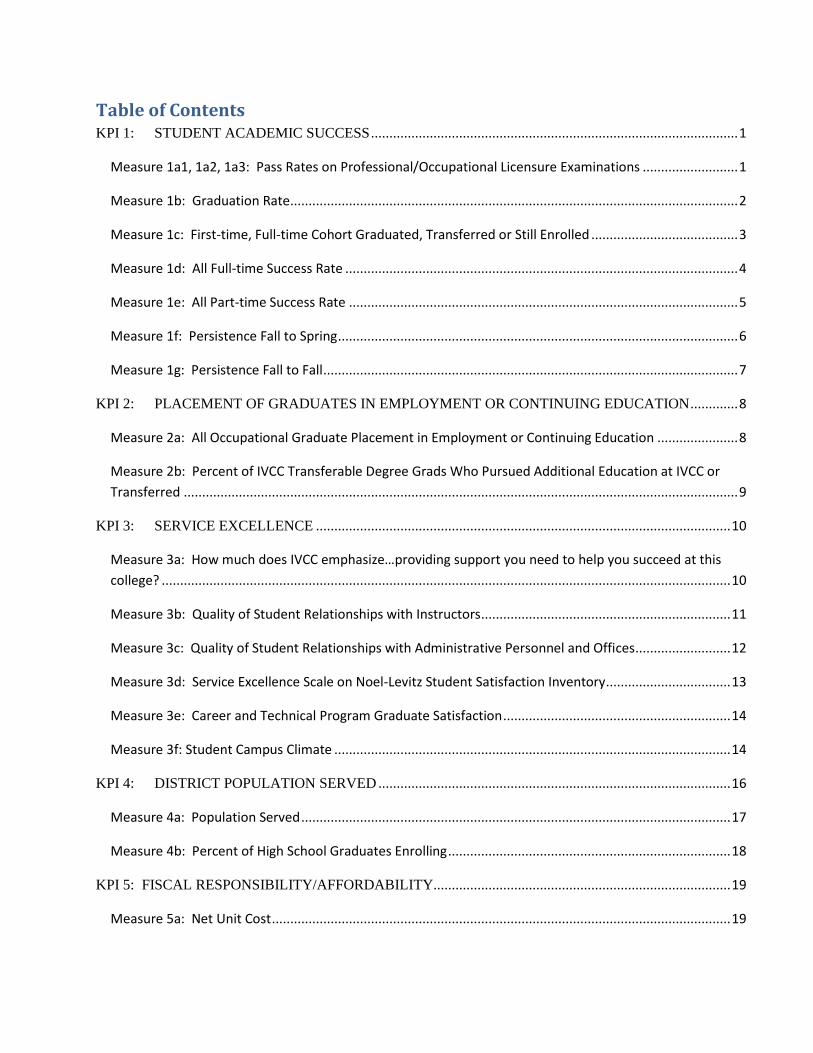
Table of Contents KPI 1: STUDENT ACADEMIC SUCCESS .................................................................................................... 1
Measure 1a1, 1a2, 1a3: Pass Rates on Professional/Occupational Licensure Examinations .......................... 1
Measure 1b: Graduation Rate .......................................................................................................................... 2
Measure 1c: First-time, Full-time Cohort Graduated, Transferred or Still Enrolled ........................................ 3
Measure 1d: All Full-time Success Rate ........................................................................................................... 4
Measure 1e: All Part-time Success Rate .......................................................................................................... 5
Measure 1f: Persistence Fall to Spring ............................................................................................................. 6
Measure 1g: Persistence Fall to Fall ................................................................................................................. 7
KPI 2: PLACEMENT OF GRADUATES IN EMPLOYMENT OR CONTINUING EDUCATION ............. 8
Measure 2a: All Occupational Graduate Placement in Employment or Continuing Education ...................... 8
Measure 2b: Percent of IVCC Transferable Degree Grads Who Pursued Additional Education at IVCC or
Transferred ....................................................................................................................................................... 9
KPI 3: SERVICE EXCELLENCE ................................................................................................................. 10
Measure 3a: How much does IVCC emphasize…providing support you need to help you succeed at this
college? ........................................................................................................................................................... 10
Measure 3b: Quality of Student Relationships with Instructors .................................................................... 11
Measure 3c: Quality of Student Relationships with Administrative Personnel and Offices .......................... 12
Measure 3d: Service Excellence Scale on Noel-Levitz Student Satisfaction Inventory .................................. 13
Measure 3e: Career and Technical Program Graduate Satisfaction .............................................................. 14
Measure 3f: Student Campus Climate ............................................................................................................ 14
KPI 4: DISTRICT POPULATION SERVED ................................................................................................ 16
Measure 4a: Population Served ..................................................................................................................... 17
Measure 4b: Percent of High School Graduates Enrolling ............................................................................. 18
KPI 5: FISCAL RESPONSIBILITY/AFFORDABILITY................................................................................. 19
Measure 5a: Net Unit Cost ............................................................................................................................. 19
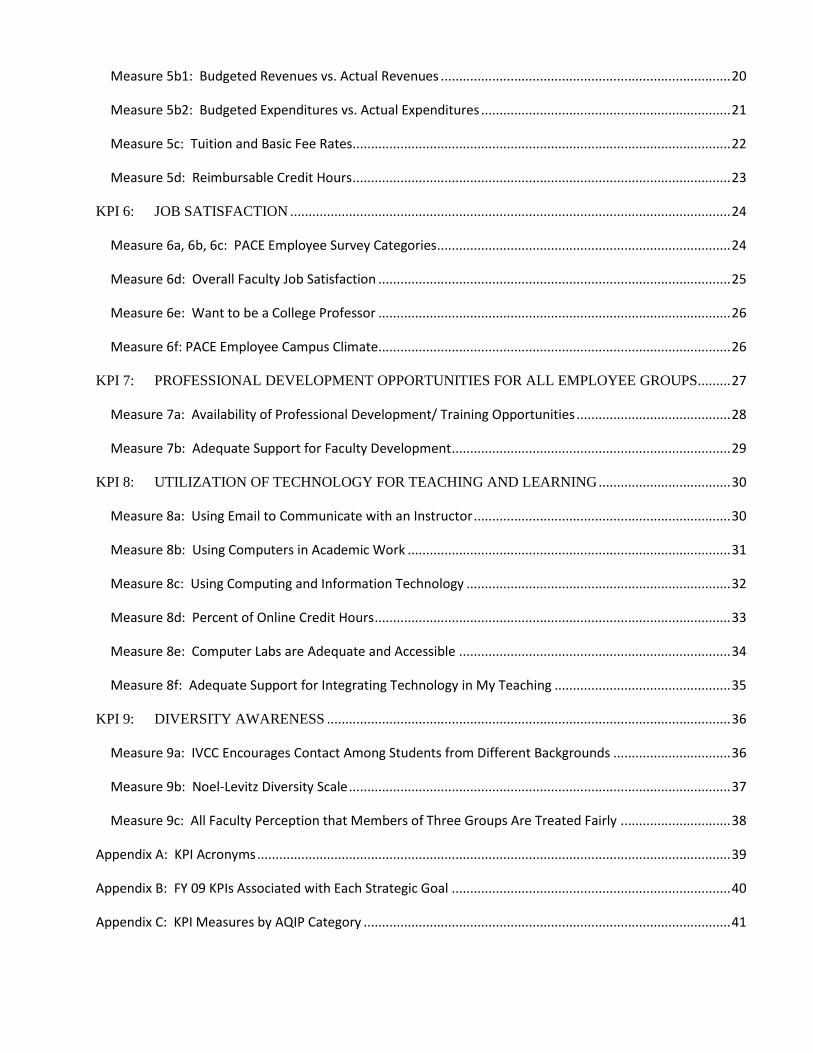
Measure 5b1: Budgeted Revenues vs. Actual Revenues ............................................................................... 20
Measure 5b2: Budgeted Expenditures vs. Actual Expenditures .................................................................... 21
Measure 5c: Tuition and Basic Fee Rates ....................................................................................................... 22
Measure 5d: Reimbursable Credit Hours ....................................................................................................... 23
KPI 6: JOB SATISFACTION ........................................................................................................................ 24
Measure 6a, 6b, 6c: PACE Employee Survey Categories ................................................................................ 24
Measure 6d: Overall Faculty Job Satisfaction ................................................................................................ 25
Measure 6e: Want to be a College Professor ................................................................................................ 26
Measure 6f: PACE Employee Campus Climate................................................................................................ 26
KPI 7: PROFESSIONAL DEVELOPMENT OPPORTUNITIES FOR ALL EMPLOYEE GROUPS......... 27
Measure 7a: Availability of Professional Development/ Training Opportunities .......................................... 28
Measure 7b: Adequate Support for Faculty Development ............................................................................ 29
KPI 8: UTILIZATION OF TECHNOLOGY FOR TEACHING AND LEARNING .................................... 30
Measure 8a: Using Email to Communicate with an Instructor ...................................................................... 30
Measure 8b: Using Computers in Academic Work ........................................................................................ 31
Measure 8c: Using Computing and Information Technology ........................................................................ 32
Measure 8d: Percent of Online Credit Hours ................................................................................................. 33
Measure 8e: Computer Labs are Adequate and Accessible .......................................................................... 34
Measure 8f: Adequate Support for Integrating Technology in My Teaching ................................................ 35
KPI 9: DIVERSITY AWARENESS .............................................................................................................. 36
Measure 9a: IVCC Encourages Contact Among Students from Different Backgrounds ................................ 36
Measure 9b: Noel-Levitz Diversity Scale ........................................................................................................ 37
Measure 9c: All Faculty Perception that Members of Three Groups Are Treated Fairly .............................. 38
Appendix A: KPI Acronyms ................................................................................................................................. 39
Appendix B: FY 09 KPIs Associated with Each Strategic Goal ............................................................................ 40
Appendix C: KPI Measures by AQIP Category .................................................................................................... 41
1
KPI 1: STUDENT ACADEMIC SUCCESS
(Relates to IVCC Strategic Goal 1, Assist all students in identifying and achieving their educational and career goals)
Measure 1a1, 1a2, 1a3: Pass Rates on Professional/Occupational Licensure
Examinations (Relates to AQIP Category 1, Helping students learn, and Category 2, Accomplishing other distinctive goals)
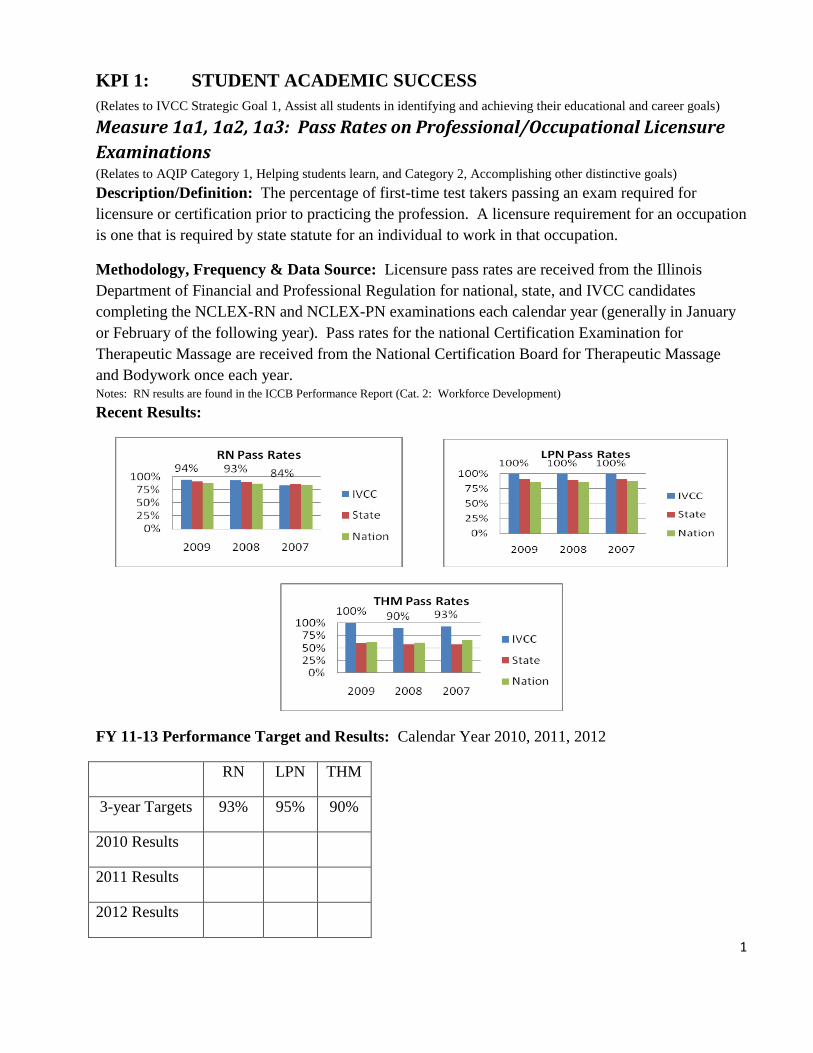
Description/Definition: The percentage of first-time test takers passing an exam required for
licensure or certification prior to practicing the profession. A licensure requirement for an occupation
is one that is required by state statute for an individual to work in that occupation.
Methodology, Frequency & Data Source: Licensure pass rates are received from the Illinois
Department of Financial and Professional Regulation for national, state, and IVCC candidates
completing the NCLEX-RN and NCLEX-PN examinations each calendar year (generally in January
or February of the following year). Pass rates for the national Certification Examination for
Therapeutic Massage are received from the National Certification Board for Therapeutic Massage
and Bodywork once each year. Notes: RN results are found in the ICCB Performance Report (Cat. 2: Workforce Development)
Recent Results:
FY 11-13 Performance Target and Results: Calendar Year 2010, 2011, 2012
RN LPN THM
3-year Targets 93% 95% 90%
2010 Results
2011 Results
2012 Results
2
KPI 1: STUDENT ACADEMIC SUCCESS (Relates to IVCC Strategic Goal 1, Assist all students in identifying and achieving their educational and career goals)
Measure 1b: Graduation Rate (Relates to AQIP Category 1, Helping students learn, and Category 2, Accomplishing other distinctive goals)
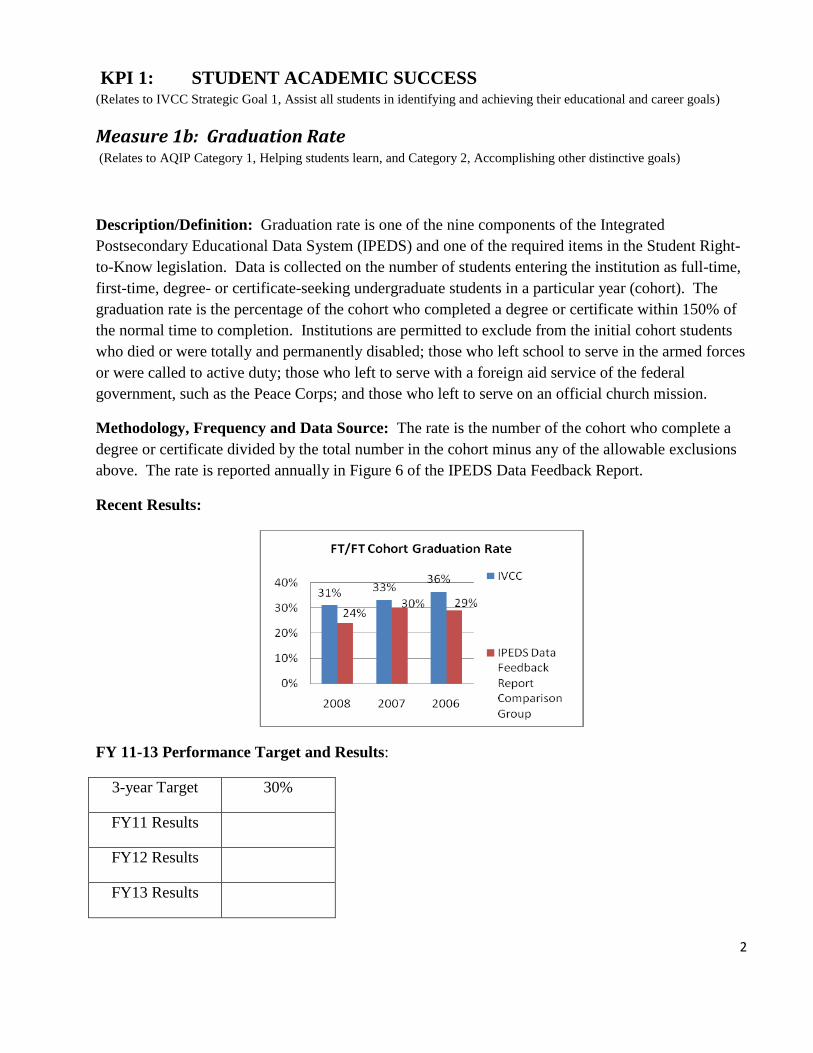
Description/Definition: Graduation rate is one of the nine components of the Integrated
Postsecondary Educational Data System (IPEDS) and one of the required items in the Student Right-
to-Know legislation. Data is collected on the number of students entering the institution as full-time,
first-time, degree- or certificate-seeking undergraduate students in a particular year (cohort). The
graduation rate is the percentage of the cohort who completed a degree or certificate within 150% of
the normal time to completion. Institutions are permitted to exclude from the initial cohort students
who died or were totally and permanently disabled; those who left school to serve in the armed forces
or were called to active duty; those who left to serve with a foreign aid service of the federal
government, such as the Peace Corps; and those who left to serve on an official church mission.
Methodology, Frequency and Data Source: The rate is the number of the cohort who complete a
degree or certificate divided by the total number in the cohort minus any of the allowable exclusions
above. The rate is reported annually in Figure 6 of the IPEDS Data Feedback Report.
Recent Results:
FY 11-13 Performance Target and Results:
3-year Target 30%
FY11 Results
FY12 Results
FY13 Results
3
KPI 1: STUDENT ACADEMIC SUCCESS (Relates to IVCC Strategic Goal 1, Assist all students in identifying and achieving their educational and career goals)
Measure 1c: First-time, Full-time Cohort Graduated, Transferred or Still
Enrolled (Relates to AQIP Category 1, Helping students learn)
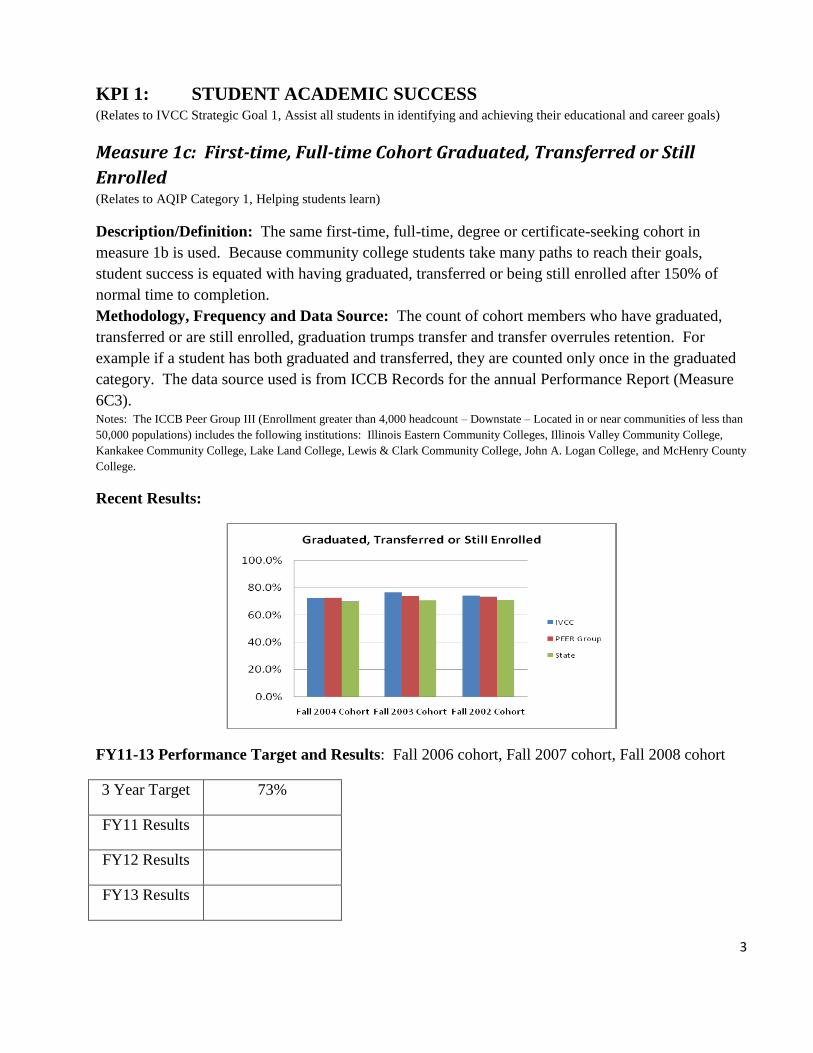
Description/Definition: The same first-time, full-time, degree or certificate-seeking cohort in
measure 1b is used. Because community college students take many paths to reach their goals,
student success is equated with having graduated, transferred or being still enrolled after 150% of
normal time to completion.
Methodology, Frequency and Data Source: The count of cohort members who have graduated,
transferred or are still enrolled, graduation trumps transfer and transfer overrules retention. For
example if a student has both graduated and transferred, they are counted only once in the graduated
category. The data source used is from ICCB Records for the annual Performance Report (Measure
6C3). Notes: The ICCB Peer Group III (Enrollment greater than 4,000 headcount – Downstate – Located in or near communities of less than
50,000 populations) includes the following institutions: Illinois Eastern Community Colleges, Illinois Valley Community College,
Kankakee Community College, Lake Land College, Lewis & Clark Community College, John A. Logan College, and McHenry County
College.
Recent Results:
FY11-13 Performance Target and Results: Fall 2006 cohort, Fall 2007 cohort, Fall 2008 cohort
3 Year Target 73%
FY11 Results
FY12 Results
FY13 Results
4
KPI 1: STUDENT ACADEMIC SUCCESS (Relates to IVCC Strategic Goal 1, Assist all students in identifying and achieving their educational and career goals)
Measure 1d: All Full-time Success Rate (Relates to AQIP Category 1, Helping students learn)
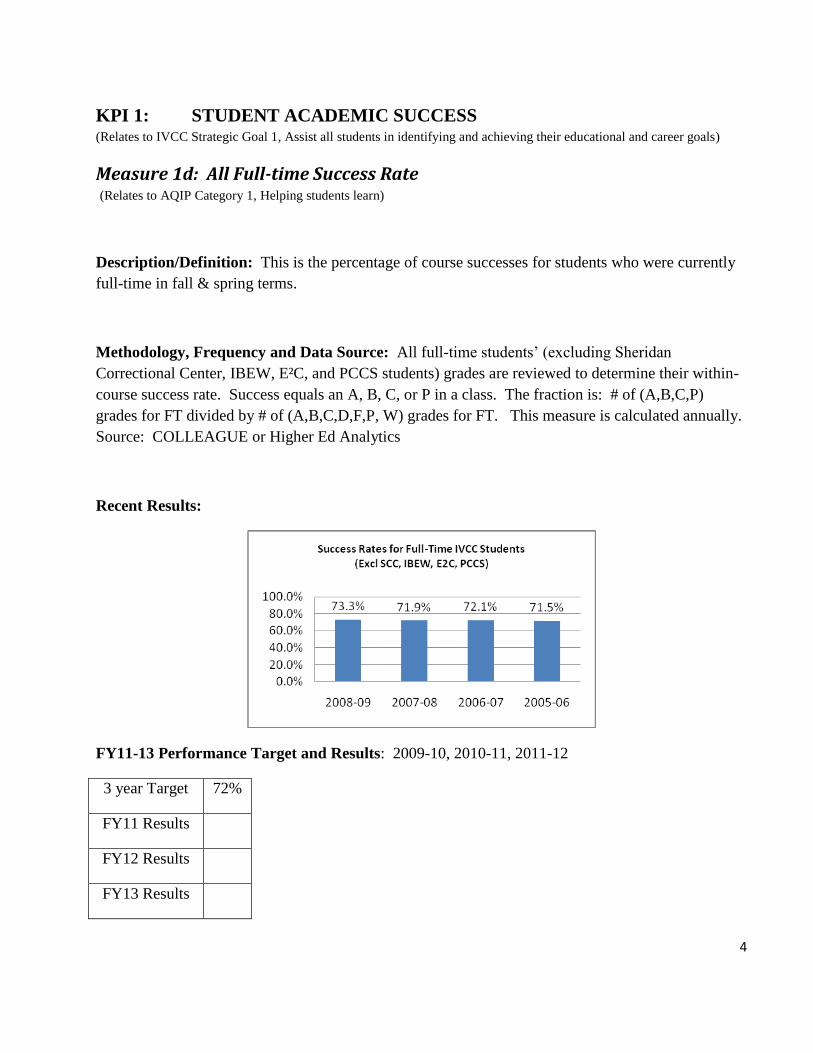
Description/Definition: This is the percentage of course successes for students who were currently
full-time in fall & spring terms.
Methodology, Frequency and Data Source: All full-time students’ (excluding Sheridan
Correctional Center, IBEW, E²C, and PCCS students) grades are reviewed to determine their within-
course success rate. Success equals an A, B, C, or P in a class. The fraction is: # of (A,B,C,P)
grades for FT divided by # of (A,B,C,D,F,P, W) grades for FT. This measure is calculated annually.
Source: COLLEAGUE or Higher Ed Analytics
Recent Results:
FY11-13 Performance Target and Results: 2009-10, 2010-11, 2011-12
3 year Target 72%
FY11 Results
FY12 Results
FY13 Results
5
KPI 1: STUDENT ACADEMIC SUCCESS (Relates to IVCC Strategic Goal 1, Assist all students in identifying and achieving their educational and career goals)
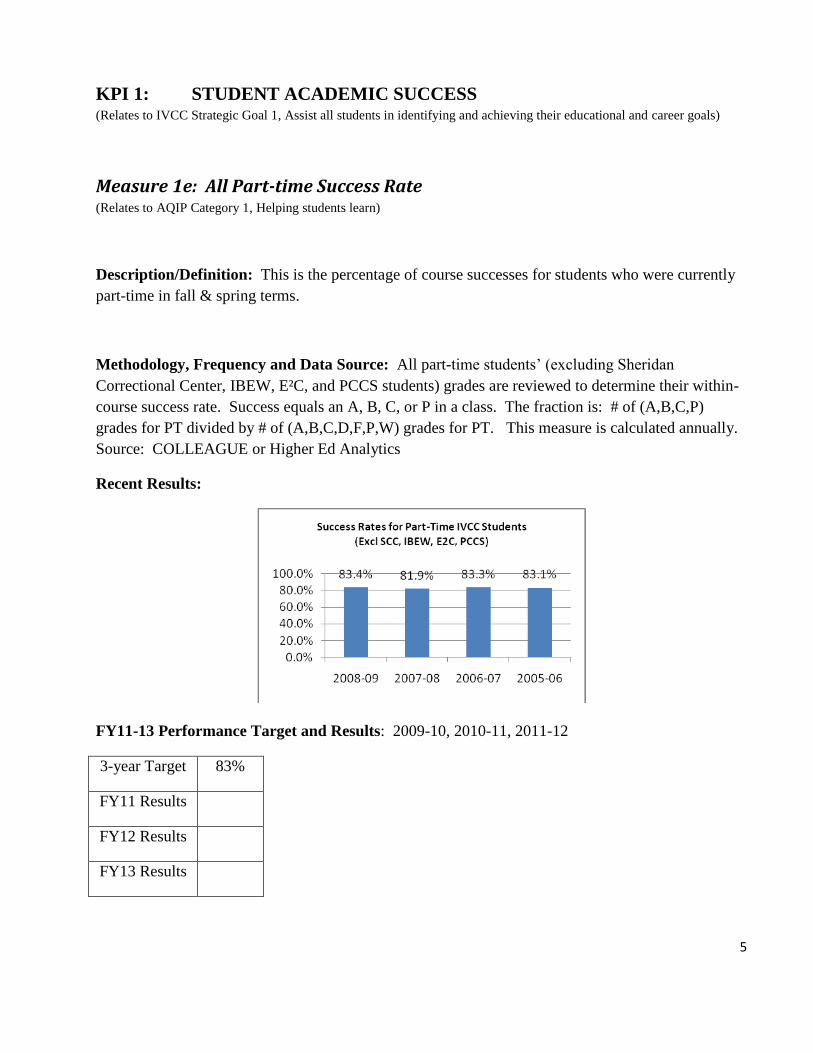
Measure 1e: All Part-time Success Rate (Relates to AQIP Category 1, Helping students learn)
Description/Definition: This is the percentage of course successes for students who were currently
part-time in fall & spring terms.
Methodology, Frequency and Data Source: All part-time students’ (excluding Sheridan
Correctional Center, IBEW, E²C, and PCCS students) grades are reviewed to determine their within-
course success rate. Success equals an A, B, C, or P in a class. The fraction is: # of (A,B,C,P)
grades for PT divided by # of (A,B,C,D,F,P,W) grades for PT. This measure is calculated annually.
Source: COLLEAGUE or Higher Ed Analytics
Recent Results:
FY11-13 Performance Target and Results: 2009-10, 2010-11, 2011-12
3-year Target 83%
FY11 Results
FY12 Results
FY13 Results
6
KPI 1: STUDENT ACADEMIC SUCCESS (Relates to IVCC Strategic Goal 1, Assist all students in identifying and achieving their educational and career goals)
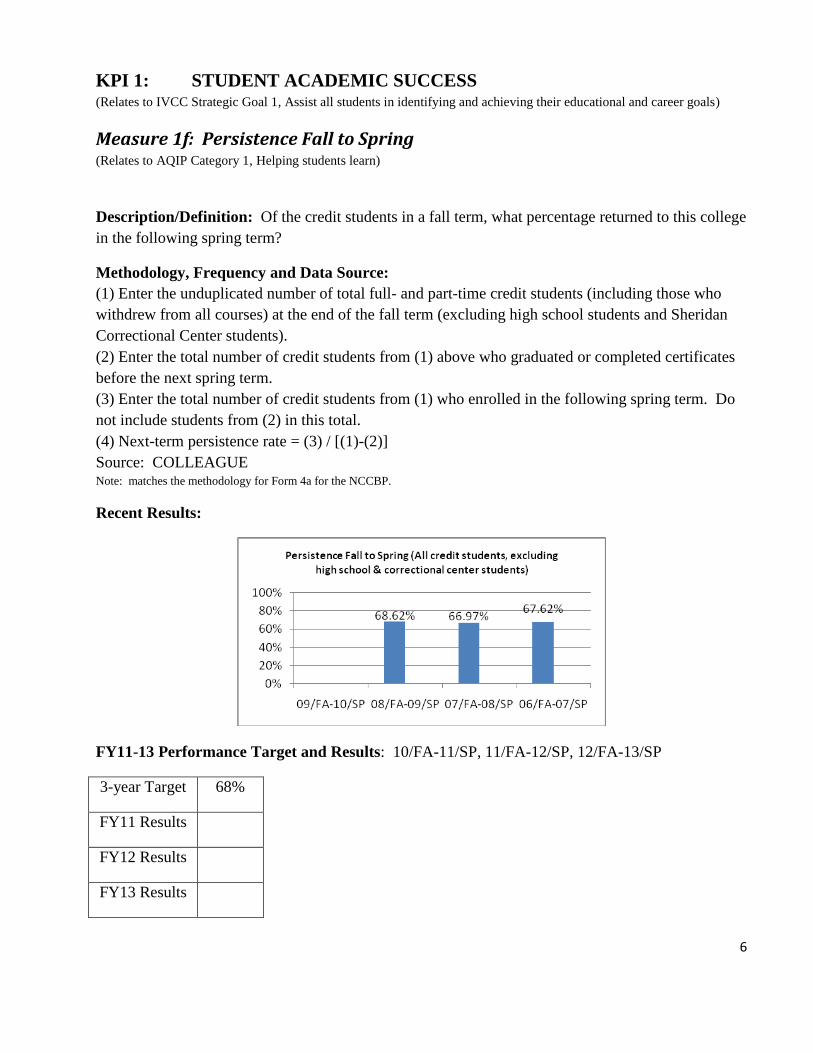
Measure 1f: Persistence Fall to Spring (Relates to AQIP Category 1, Helping students learn)
Description/Definition: Of the credit students in a fall term, what percentage returned to this college
in the following spring term?
Methodology, Frequency and Data Source:
(1) Enter the unduplicated number of total full- and part-time credit students (including those who
withdrew from all courses) at the end of the fall term (excluding high school students and Sheridan
Correctional Center students).
(2) Enter the total number of credit students from (1) above who graduated or completed certificates
before the next spring term.
(3) Enter the total number of credit students from (1) who enrolled in the following spring term. Do
not include students from (2) in this total.
(4) Next-term persistence rate = (3) / [(1)-(2)]
Source: COLLEAGUE Note: matches the methodology for Form 4a for the NCCBP.
Recent Results:
FY11-13 Performance Target and Results: 10/FA-11/SP, 11/FA-12/SP, 12/FA-13/SP
3-year Target 68%
FY11 Results
FY12 Results
FY13 Results
7
KPI 1: STUDENT ACADEMIC SUCCESS (Relates to IVCC Strategic Goal 1, Assist all students in identifying and achieving their educational and career goals)
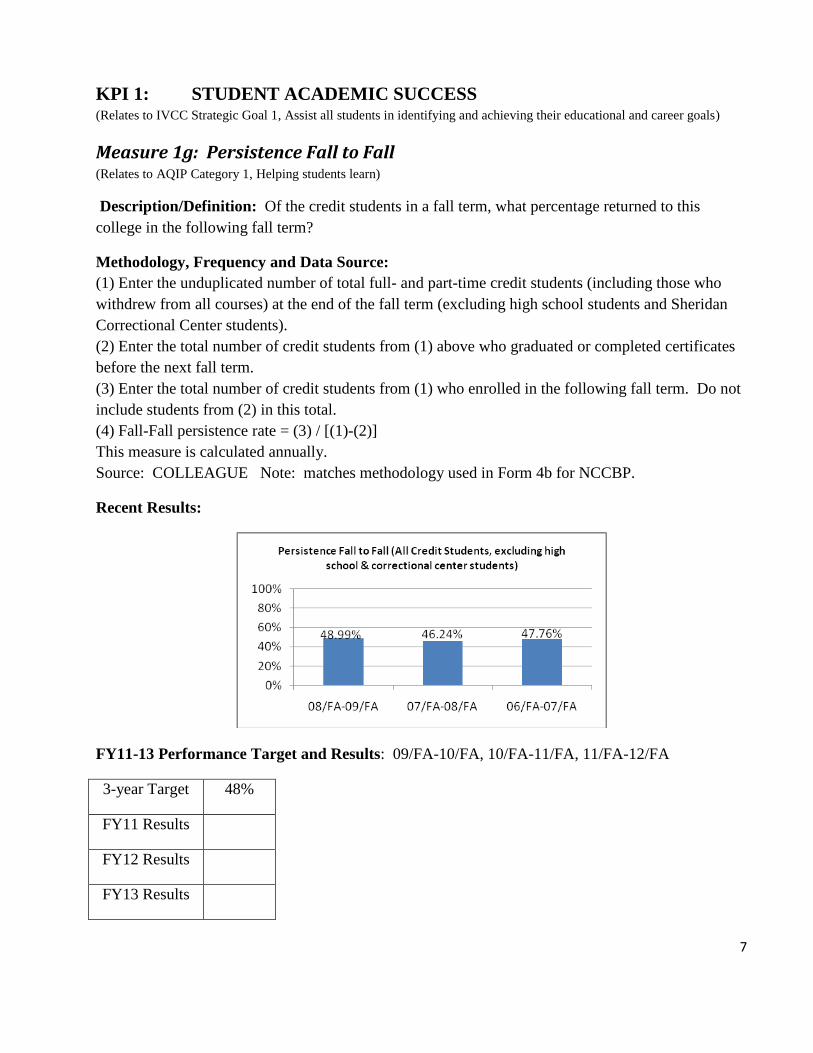
Measure 1g: Persistence Fall to Fall (Relates to AQIP Category 1, Helping students learn)
Description/Definition: Of the credit students in a fall term, what percentage returned to this
college in the following fall term?
Methodology, Frequency and Data Source:
(1) Enter the unduplicated number of total full- and part-time credit students (including those who
withdrew from all courses) at the end of the fall term (excluding high school students and Sheridan
Correctional Center students).
(2) Enter the total number of credit students from (1) above who graduated or completed certificates
before the next fall term.
(3) Enter the total number of credit students from (1) who enrolled in the following fall term. Do not
include students from (2) in this total.
(4) Fall-Fall persistence rate = (3) / [(1)-(2)]
This measure is calculated annually.
Source: COLLEAGUE Note: matches methodology used in Form 4b for NCCBP.
Recent Results:
FY11-13 Performance Target and Results: 09/FA-10/FA, 10/FA-11/FA, 11/FA-12/FA
3-year Target 48%
FY11 Results
FY12 Results
FY13 Results
8
KPI 2: PLACEMENT OF GRADUATES IN EMPLOYMENT OR
CONTINUING EDUCATION (Relates to IVCC Strategic Goal 1, Assist all students in identifying and achieving their educational and career goals and
Goal 2, Promote the value of higher education)
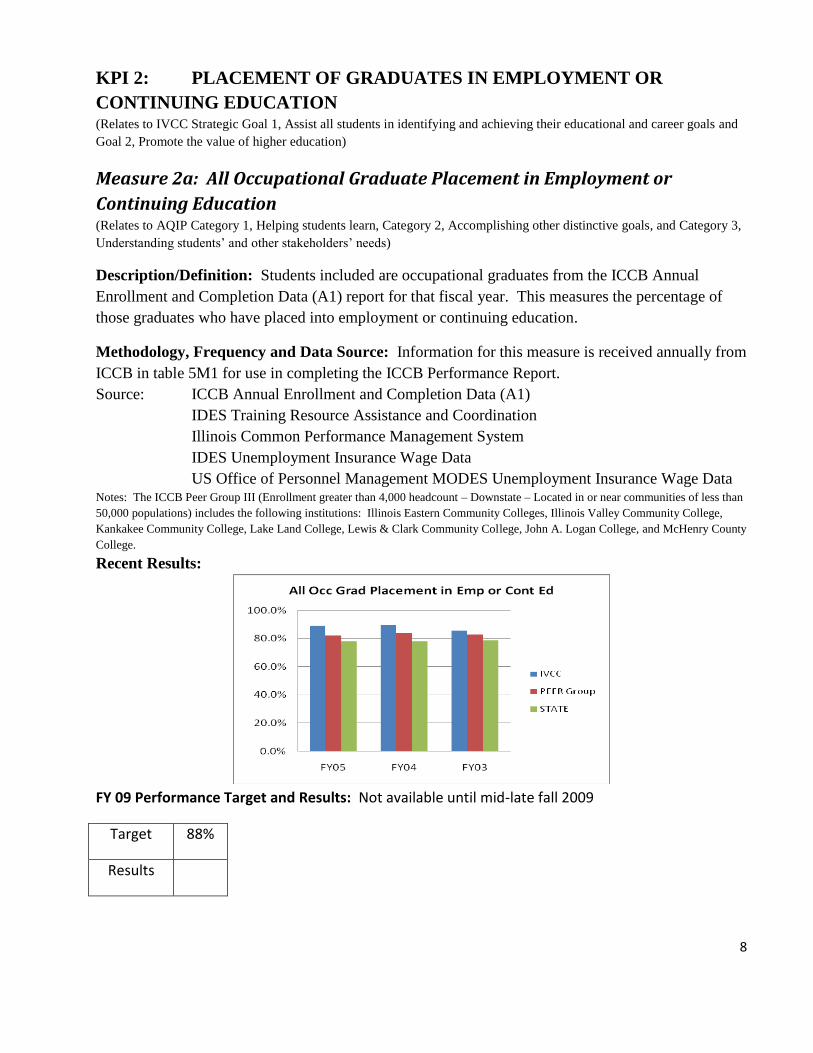
Measure 2a: All Occupational Graduate Placement in Employment or
Continuing Education (Relates to AQIP Category 1, Helping students learn, Category 2, Accomplishing other distinctive goals, and Category 3,
Understanding students’ and other stakeholders’ needs)
Description/Definition: Students included are occupational graduates from the ICCB Annual
Enrollment and Completion Data (A1) report for that fiscal year. This measures the percentage of
those graduates who have placed into employment or continuing education.
Methodology, Frequency and Data Source: Information for this measure is received annually from
ICCB in table 5M1 for use in completing the ICCB Performance Report.
Source: ICCB Annual Enrollment and Completion Data (A1)
IDES Training Resource Assistance and Coordination
Illinois Common Performance Management System
IDES Unemployment Insurance Wage Data
US Office of Personnel Management MODES Unemployment Insurance Wage Data Notes: The ICCB Peer Group III (Enrollment greater than 4,000 headcount – Downstate – Located in or near communities of less than
50,000 populations) includes the following institutions: Illinois Eastern Community Colleges, Illinois Valley Community College,
Kankakee Community College, Lake Land College, Lewis & Clark Community College, John A. Logan College, and McHenry County
College.
Recent Results:
FY 09 Performance Target and Results: Not available until mid-late fall 2009
Target 88%
Results
9
KPI 2: PLACEMENT OF GRADUATES IN EMPLOYMENT OR
CONTINUING EDUCATION (Relates to IVCC Strategic Goal 1, Assist all students in identifying and achieving their educational and career goals; and
Goal 2, Promote the value of higher education)
Measure 2b: Percent of IVCC Transferable Degree Grads Who Pursued
Additional Education at IVCC or Transferred
(Relates to AQIP Category 3, Understanding students’ and other stakeholders’ needs)
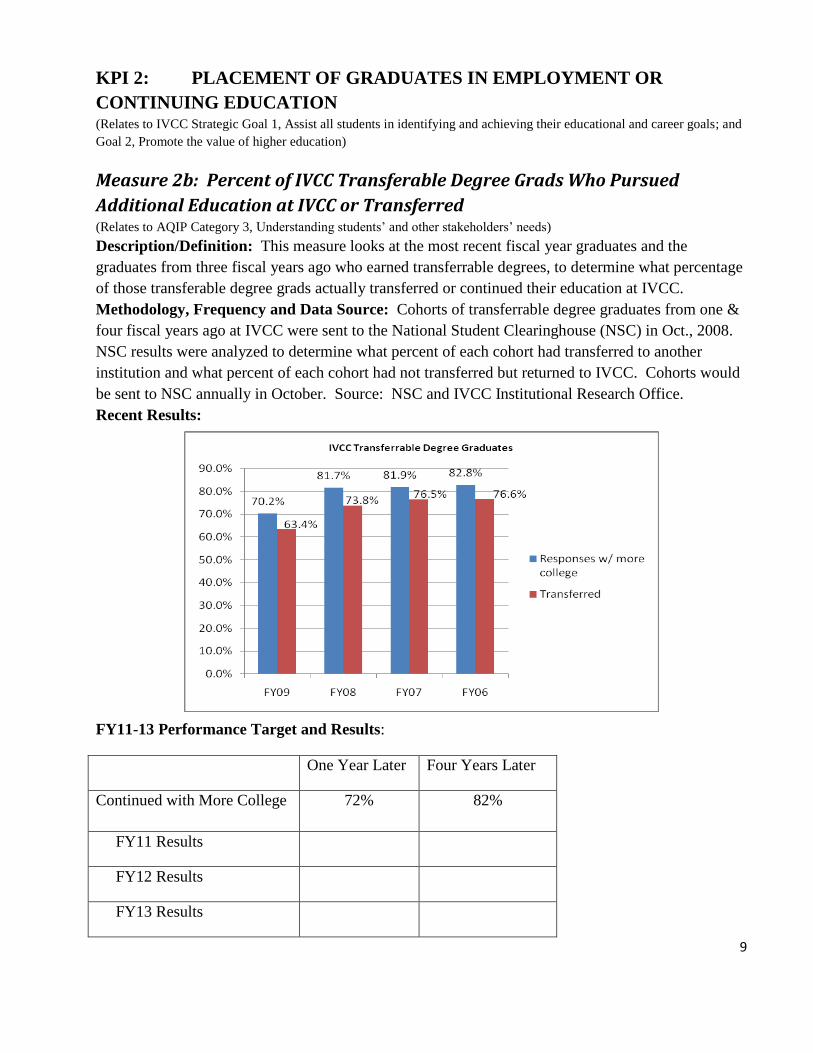
Description/Definition: This measure looks at the most recent fiscal year graduates and the
graduates from three fiscal years ago who earned transferrable degrees, to determine what percentage
of those transferable degree grads actually transferred or continued their education at IVCC.
Methodology, Frequency and Data Source: Cohorts of transferrable degree graduates from one &
four fiscal years ago at IVCC were sent to the National Student Clearinghouse (NSC) in Oct., 2008.
NSC results were analyzed to determine what percent of each cohort had transferred to another
institution and what percent of each cohort had not transferred but returned to IVCC. Cohorts would
be sent to NSC annually in October. Source: NSC and IVCC Institutional Research Office.
Recent Results:
FY11-13 Performance Target and Results:
One Year Later Four Years Later
Continued with More College 72% 82%
FY11 Results
FY12 Results
FY13 Results
10
KPI 3: SERVICE EXCELLENCE (Relates to IVCC Strategic Goal 3, Grow and nurture all resources needed to provide quality programs and services)
Measure 3a: How much does IVCC emphasize…providing support you need to
help you succeed at this college? (Relates to AQIP Category 3, Understanding students’ and other stakeholders’ needs)
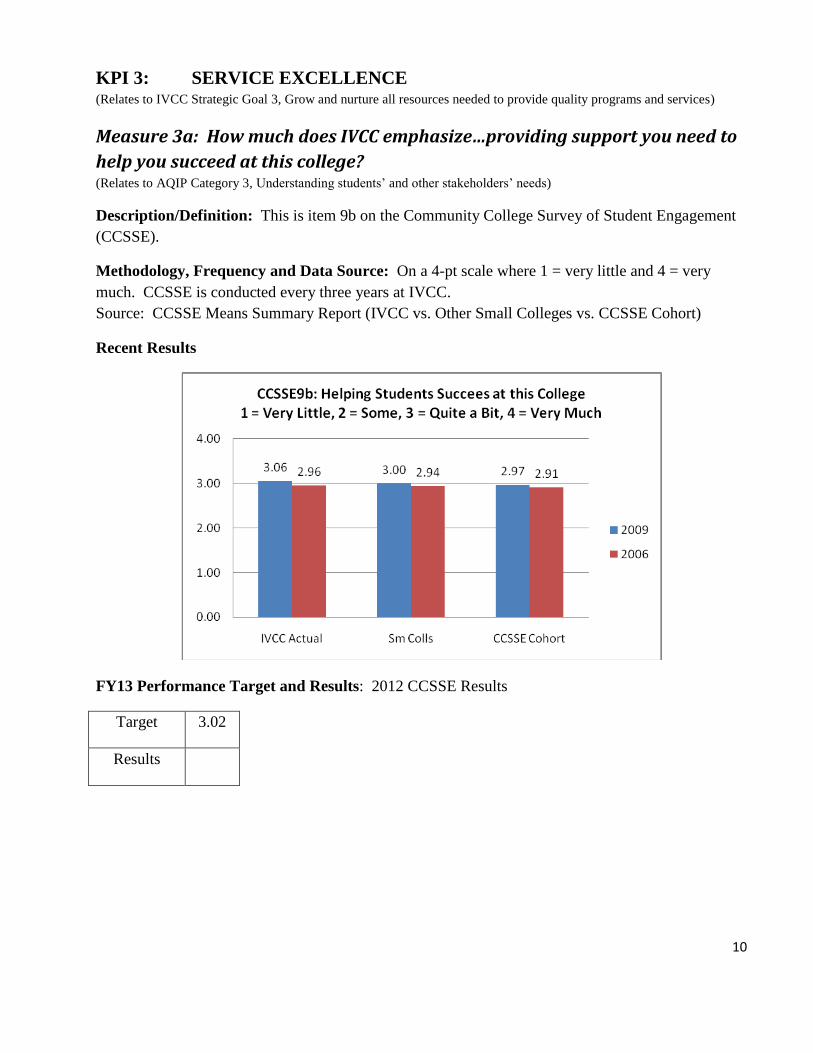
Description/Definition: This is item 9b on the Community College Survey of Student Engagement
(CCSSE).
Methodology, Frequency and Data Source: On a 4-pt scale where 1 = very little and 4 = very
much. CCSSE is conducted every three years at IVCC.
Source: CCSSE Means Summary Report (IVCC vs. Other Small Colleges vs. CCSSE Cohort)
Recent Results
FY13 Performance Target and Results: 2012 CCSSE Results
Target 3.02
Results
11
KPI 3: SERVICE EXCELLENCE (Relates to IVCC Strategic Goal 3, Grow and nurture all resources needed to provide quality programs and services)
Measure 3b: Quality of Student Relationships with Instructors (Relates to AQIP Category 3, Understanding students’ and other stakeholders’ needs)
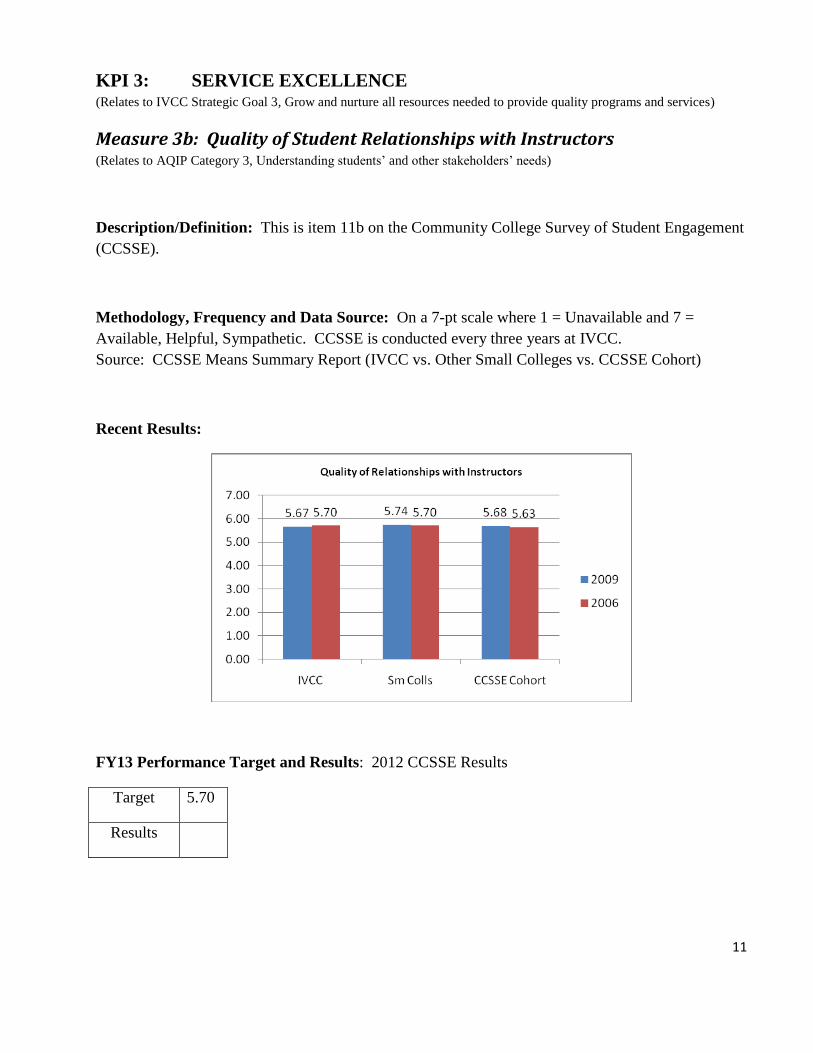
Description/Definition: This is item 11b on the Community College Survey of Student Engagement
(CCSSE).
Methodology, Frequency and Data Source: On a 7-pt scale where 1 = Unavailable and 7 =
Available, Helpful, Sympathetic. CCSSE is conducted every three years at IVCC.
Source: CCSSE Means Summary Report (IVCC vs. Other Small Colleges vs. CCSSE Cohort)
Recent Results:
FY13 Performance Target and Results: 2012 CCSSE Results
Target 5.70
Results
12
KPI 3: SERVICE EXCELLENCE (Relates to IVCC Strategic Goal 3, Grow and nurture all resources needed to provide quality programs and services)
Measure 3c: Quality of Student Relationships with Administrative Personnel
and Offices (Relates to AQIP Category 3, Understanding students’ and other stakeholders’ needs)
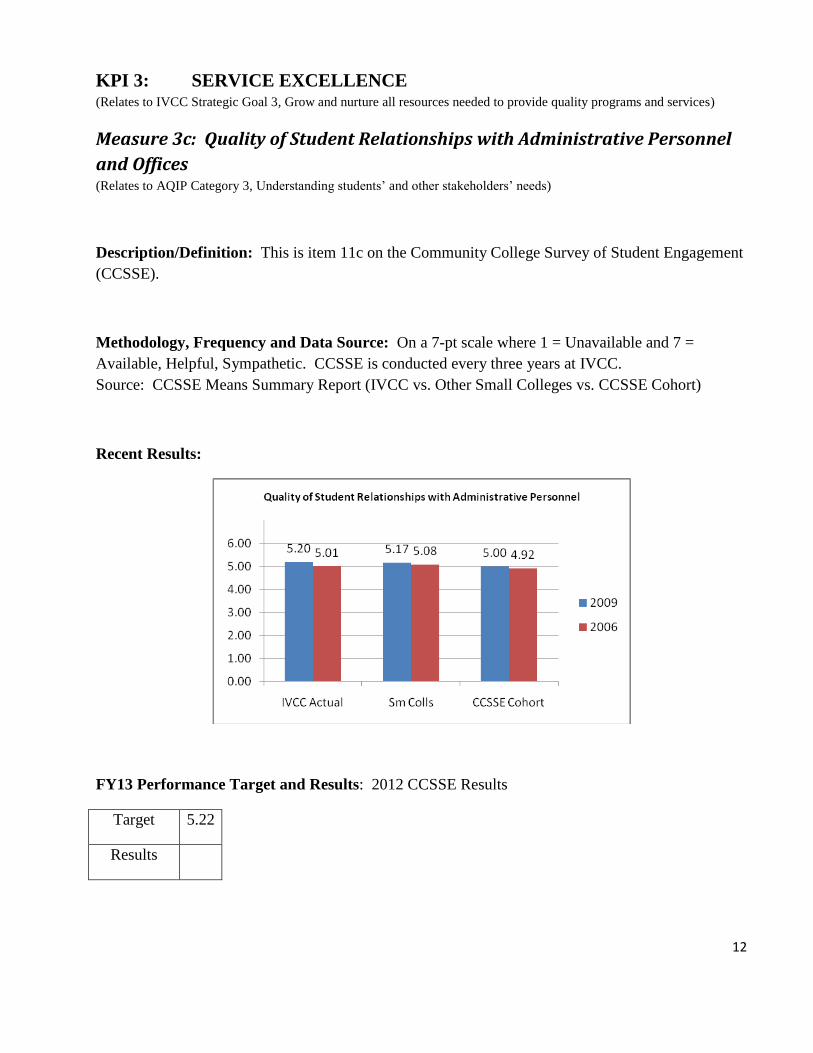
Description/Definition: This is item 11c on the Community College Survey of Student Engagement
(CCSSE).
Methodology, Frequency and Data Source: On a 7-pt scale where 1 = Unavailable and 7 =
Available, Helpful, Sympathetic. CCSSE is conducted every three years at IVCC.
Source: CCSSE Means Summary Report (IVCC vs. Other Small Colleges vs. CCSSE Cohort)
Recent Results:
FY13 Performance Target and Results: 2012 CCSSE Results
Target 5.22
Results
13
KPI 3: SERVICE EXCELLENCE (Relates to IVCC Strategic Goal 3, Grow and nurture all resources needed to provide quality programs and services)
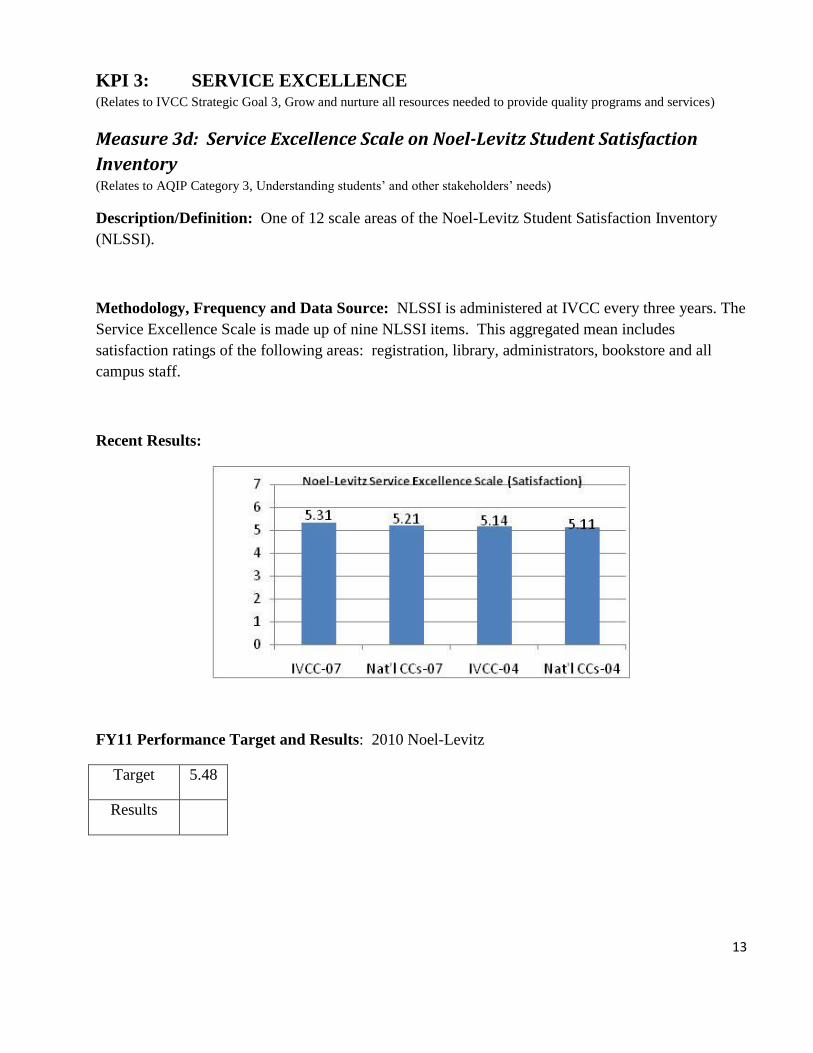
Measure 3d: Service Excellence Scale on Noel-Levitz Student Satisfaction
Inventory (Relates to AQIP Category 3, Understanding students’ and other stakeholders’ needs)
Description/Definition: One of 12 scale areas of the Noel-Levitz Student Satisfaction Inventory
(NLSSI).
Methodology, Frequency and Data Source: NLSSI is administered at IVCC every three years. The
Service Excellence Scale is made up of nine NLSSI items. This aggregated mean includes
satisfaction ratings of the following areas: registration, library, administrators, bookstore and all
campus staff.
Recent Results:
FY11 Performance Target and Results: 2010 Noel-Levitz
Target 5.48
Results
14
KPI 3: SERVICE EXCELLENCE (Relates to IVCC Strategic Goal 3, Grow and nurture all resources needed to provide quality programs and services)
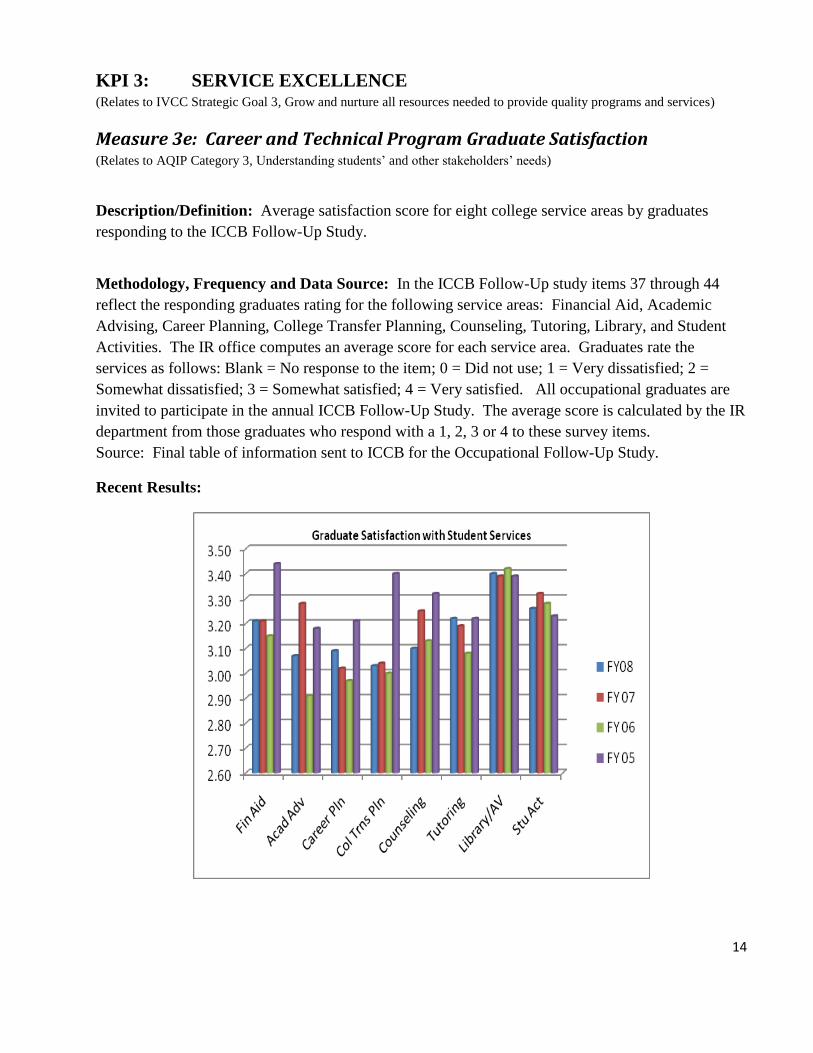
Measure 3e: Career and Technical Program Graduate Satisfaction (Relates to AQIP Category 3, Understanding students’ and other stakeholders’ needs)
Description/Definition: Average satisfaction score for eight college service areas by graduates
responding to the ICCB Follow-Up Study.
Methodology, Frequency and Data Source: In the ICCB Follow-Up study items 37 through 44
reflect the responding graduates rating for the following service areas: Financial Aid, Academic
Advising, Career Planning, College Transfer Planning, Counseling, Tutoring, Library, and Student
Activities. The IR office computes an average score for each service area. Graduates rate the
services as follows: Blank = No response to the item; 0 = Did not use; 1 = Very dissatisfied; 2 =
Somewhat dissatisfied; 3 = Somewhat satisfied; 4 = Very satisfied. All occupational graduates are
invited to participate in the annual ICCB Follow-Up Study. The average score is calculated by the IR
department from those graduates who respond with a 1, 2, 3 or 4 to these survey items.
Source: Final table of information sent to ICCB for the Occupational Follow-Up Study.
Recent Results:
15
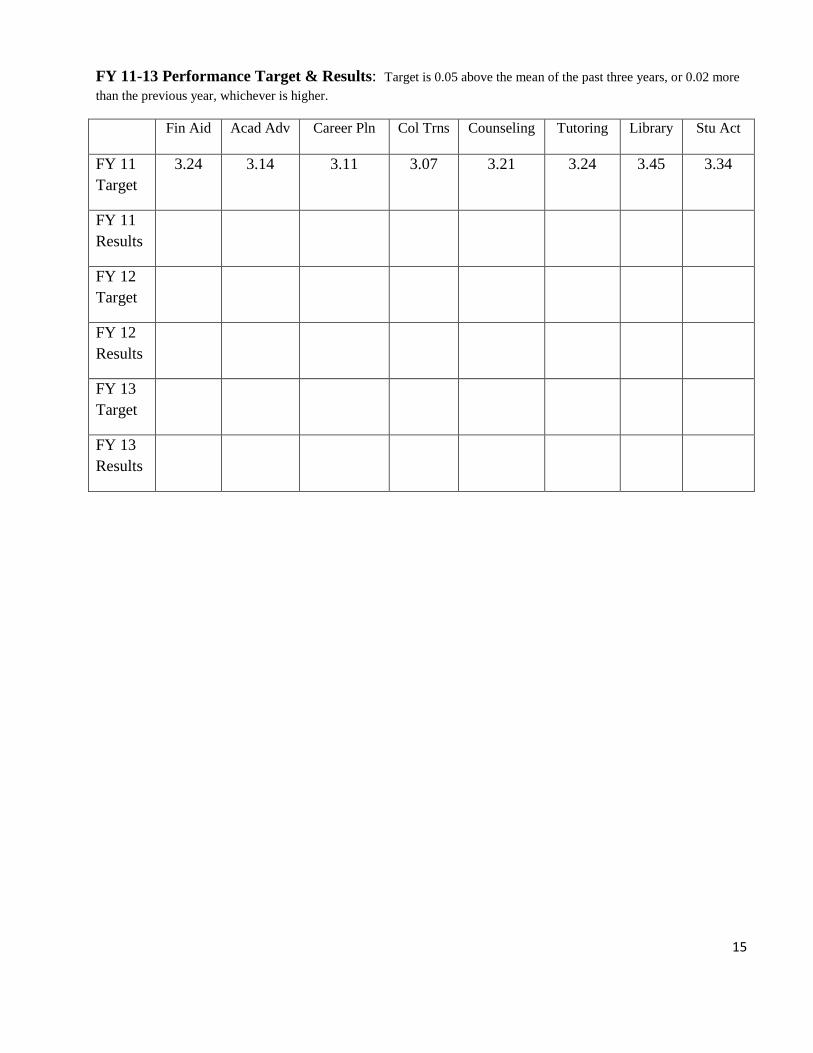
FY 11-13 Performance Target & Results: Target is 0.05 above the mean of the past three years, or 0.02 more
than the previous year, whichever is higher.
Fin Aid Acad Adv Career Pln Col Trns Counseling Tutoring Library Stu Act
FY 11
Target
3.24 3.14 3.11 3.07 3.21 3.24 3.45 3.34
FY 11
Results
FY 12
Target
FY 12
Results
FY 13
Target
FY 13
Results
16
KPI 3: SERVICE EXCELLENCE (Relates to IVCC Strategic Goal 5, Demonstrate IVCC’s core values through and inclusive and collaborative
environment)
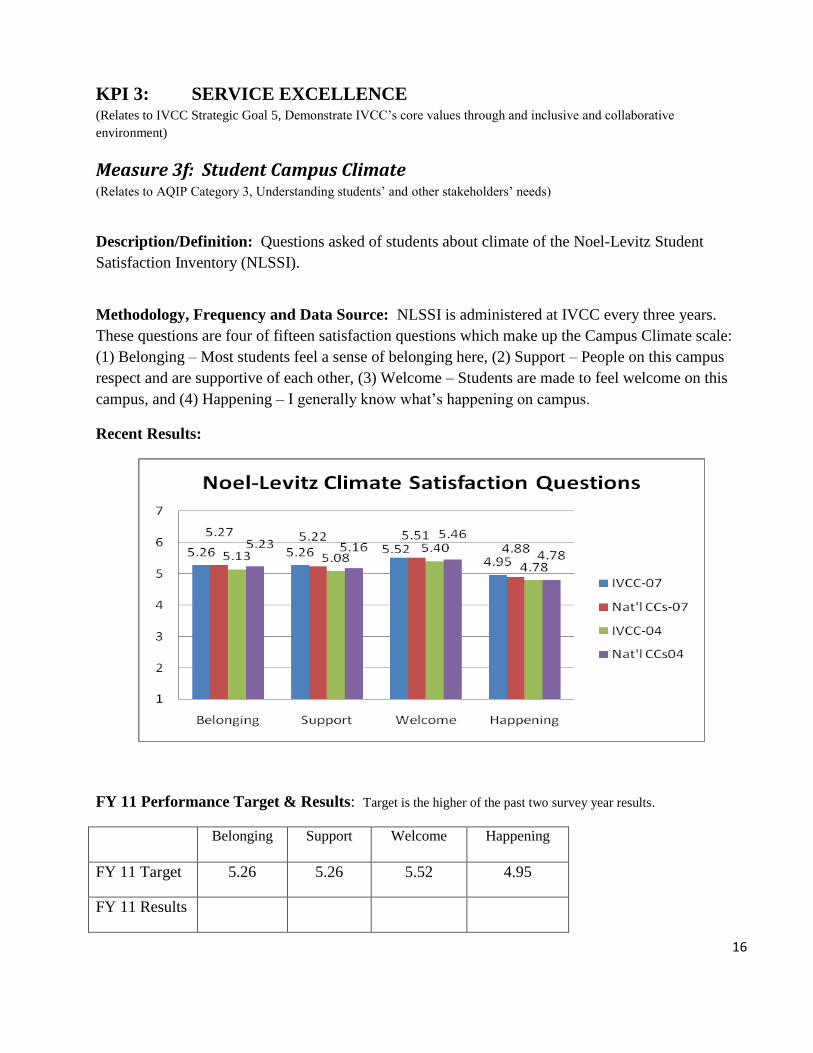
Measure 3f: Student Campus Climate (Relates to AQIP Category 3, Understanding students’ and other stakeholders’ needs)
Description/Definition: Questions asked of students about climate of the Noel-Levitz Student
Satisfaction Inventory (NLSSI).
Methodology, Frequency and Data Source: NLSSI is administered at IVCC every three years.
These questions are four of fifteen satisfaction questions which make up the Campus Climate scale:
(1) Belonging – Most students feel a sense of belonging here, (2) Support – People on this campus
respect and are supportive of each other, (3) Welcome – Students are made to feel welcome on this
campus, and (4) Happening – I generally know what’s happening on campus.
Recent Results:
FY 11 Performance Target & Results: Target is the higher of the past two survey year results.
Belonging Support Welcome Happening
FY 11 Target 5.26 5.26 5.52 4.95
FY 11 Results
17
KPI 4: DISTRICT POPULATION SERVED (Relates to IVCC Strategic Goal 2, Promote the value of higher education)
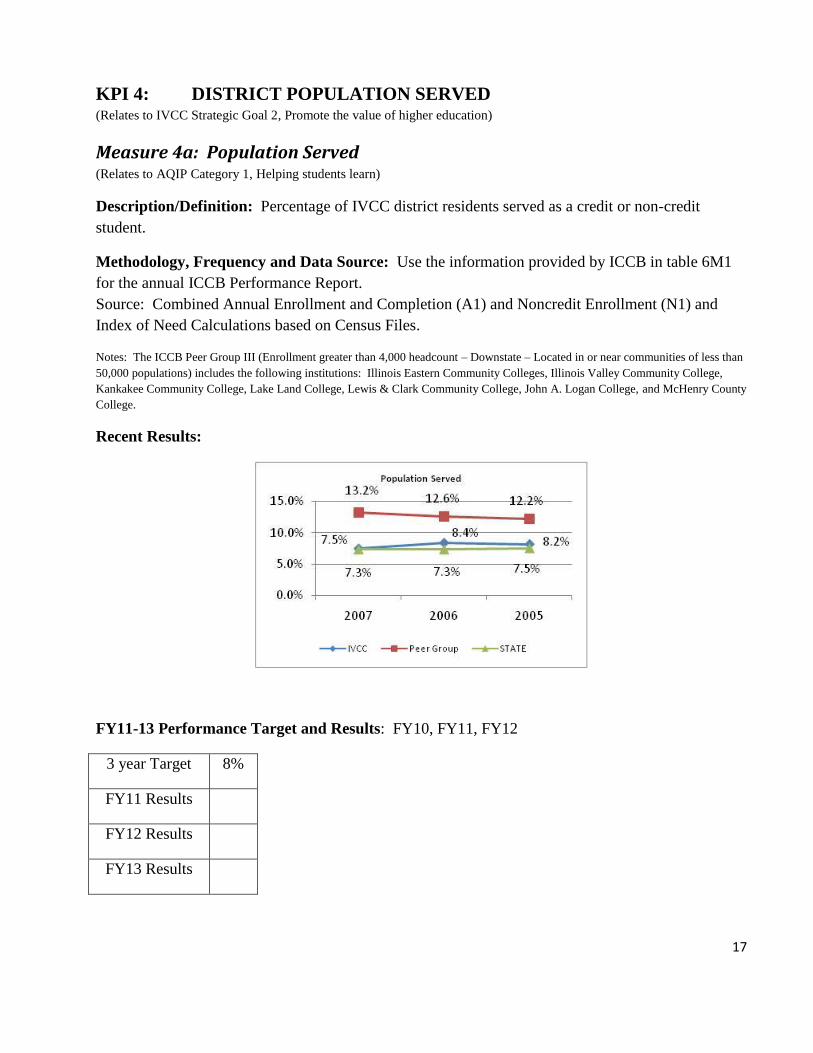
Measure 4a: Population Served (Relates to AQIP Category 1, Helping students learn)
Description/Definition: Percentage of IVCC district residents served as a credit or non-credit
student.
Methodology, Frequency and Data Source: Use the information provided by ICCB in table 6M1
for the annual ICCB Performance Report.
Source: Combined Annual Enrollment and Completion (A1) and Noncredit Enrollment (N1) and
Index of Need Calculations based on Census Files.
Notes: The ICCB Peer Group III (Enrollment greater than 4,000 headcount – Downstate – Located in or near communities of less than
50,000 populations) includes the following institutions: Illinois Eastern Community Colleges, Illinois Valley Community College,
Kankakee Community College, Lake Land College, Lewis & Clark Community College, John A. Logan College, and McHenry County
College.
Recent Results:
FY11-13 Performance Target and Results: FY10, FY11, FY12
3 year Target 8%
FY11 Results
FY12 Results
FY13 Results
18
KPI 4: DISTRICT POPULATION SERVED (Relates to IVCC Strategic Goal 2, Promote the value of higher education)
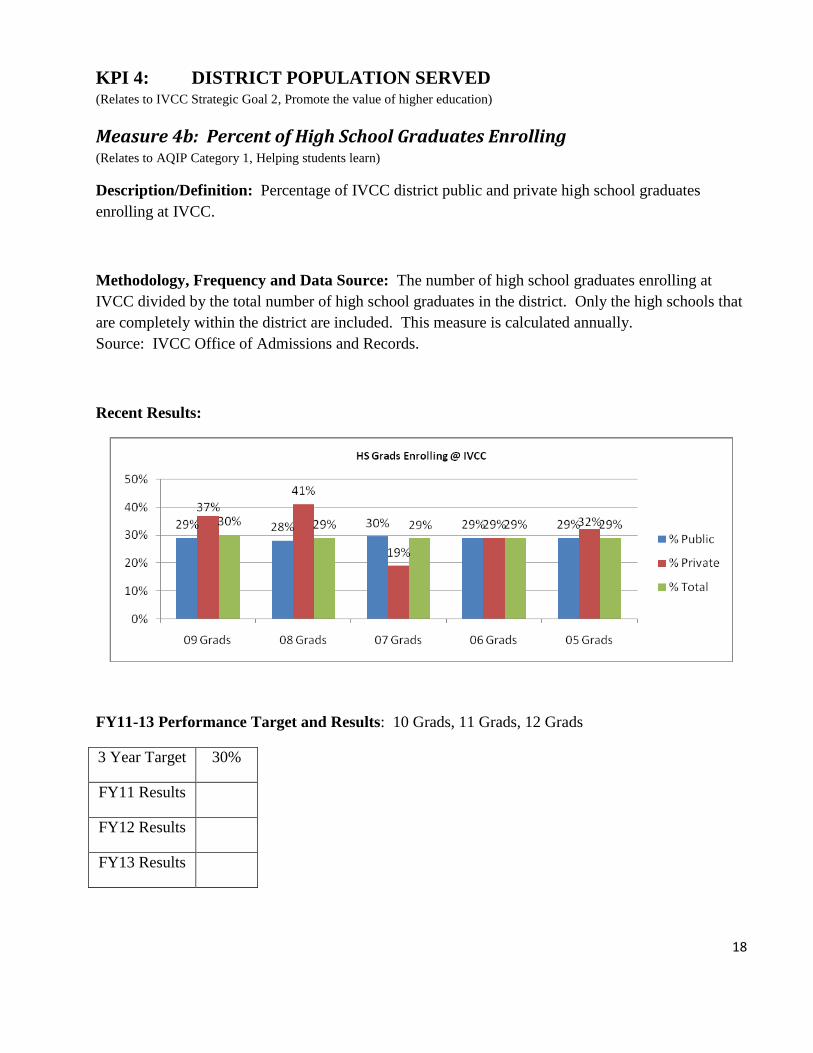
Measure 4b: Percent of High School Graduates Enrolling (Relates to AQIP Category 1, Helping students learn)
Description/Definition: Percentage of IVCC district public and private high school graduates
enrolling at IVCC.
Methodology, Frequency and Data Source: The number of high school graduates enrolling at
IVCC divided by the total number of high school graduates in the district. Only the high schools that
are completely within the district are included. This measure is calculated annually.
Source: IVCC Office of Admissions and Records.
Recent Results:
FY11-13 Performance Target and Results: 10 Grads, 11 Grads, 12 Grads
3 Year Target 30%
FY11 Results
FY12 Results
FY13 Results
19
KPI 5: FISCAL RESPONSIBILITY/AFFORDABILITY (Relates to IVCC Strategic Goal 3, Grow and nurture all resources needed to provide quality programs and services)
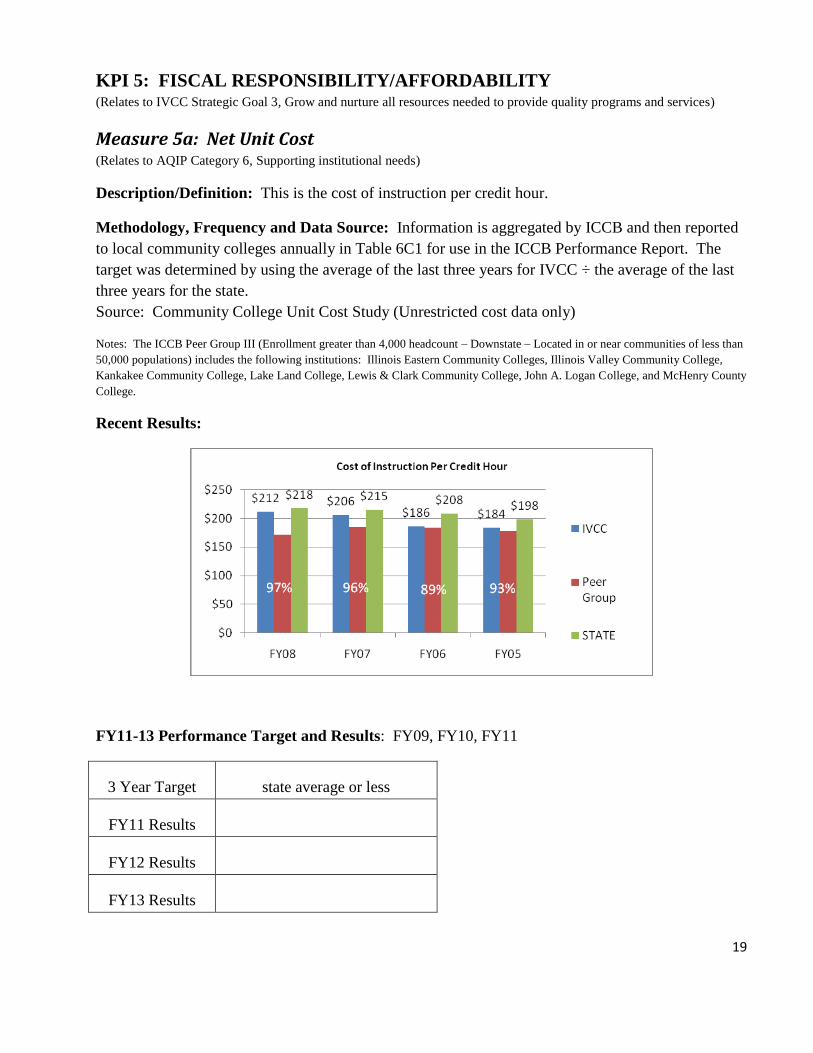
Measure 5a: Net Unit Cost (Relates to AQIP Category 6, Supporting institutional needs)
Description/Definition: This is the cost of instruction per credit hour.
Methodology, Frequency and Data Source: Information is aggregated by ICCB and then reported
to local community colleges annually in Table 6C1 for use in the ICCB Performance Report. The
target was determined by using the average of the last three years for IVCC ÷ the average of the last
three years for the state.
Source: Community College Unit Cost Study (Unrestricted cost data only)
Notes: The ICCB Peer Group III (Enrollment greater than 4,000 headcount – Downstate – Located in or near communities of less than
50,000 populations) includes the following institutions: Illinois Eastern Community Colleges, Illinois Valley Community College,
Kankakee Community College, Lake Land College, Lewis & Clark Community College, John A. Logan College, and McHenry County
College.
Recent Results:
FY11-13 Performance Target and Results: FY09, FY10, FY11
3 Year Target state average or less
FY11 Results
FY12 Results
FY13 Results
20
KPI 5: FISCAL RESPONSIBILITY/AFFORDABILITY (Relates to IVCC Strategic Goal 3 Grow and nurture all resources needed to provide quality programs and services)
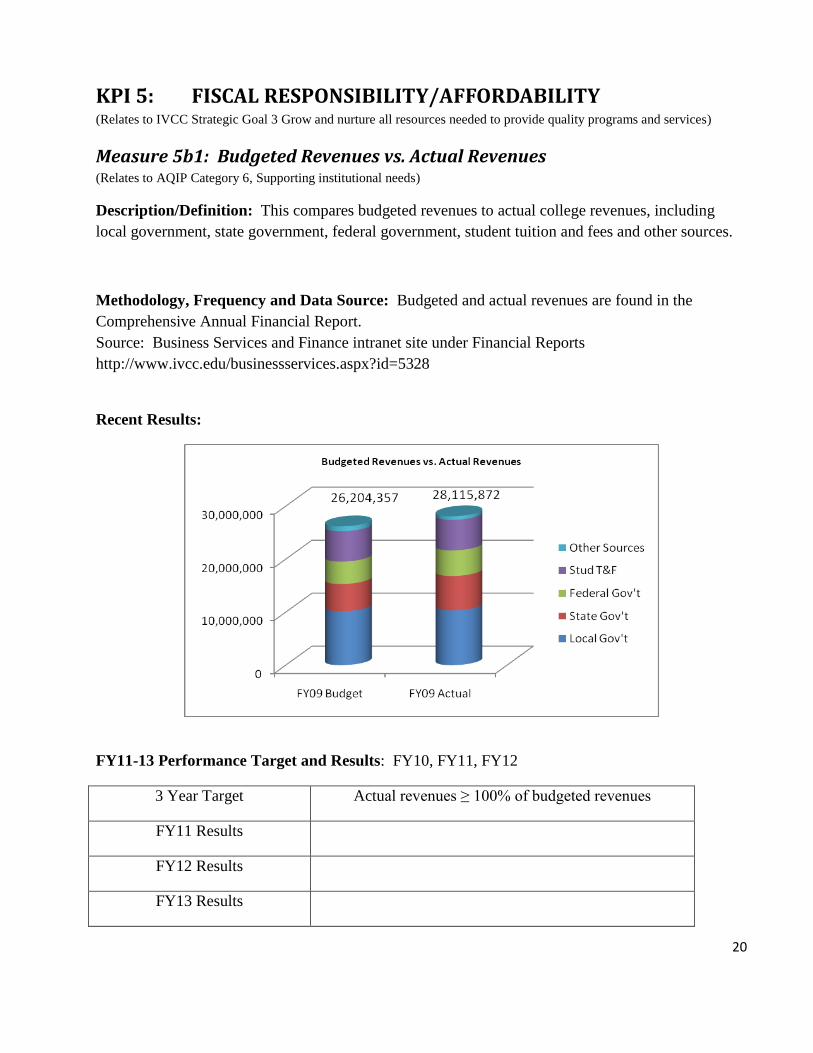
Measure 5b1: Budgeted Revenues vs. Actual Revenues (Relates to AQIP Category 6, Supporting institutional needs)
Description/Definition: This compares budgeted revenues to actual college revenues, including
local government, state government, federal government, student tuition and fees and other sources.
Methodology, Frequency and Data Source: Budgeted and actual revenues are found in the
Comprehensive Annual Financial Report.
Source: Business Services and Finance intranet site under Financial Reports
http://www.ivcc.edu/businessservices.aspx?id=5328
Recent Results:
FY11-13 Performance Target and Results: FY10, FY11, FY12
3 Year Target Actual revenues ≥ 100% of budgeted revenues
FY11 Results
FY12 Results
FY13 Results
21
KPI 5: FISCAL RESPONSIBILITY/AFFORDABILITY (Relates to IVCC Strategic Goal 3, Grow and nurture all resources needed to provide quality programs and services)
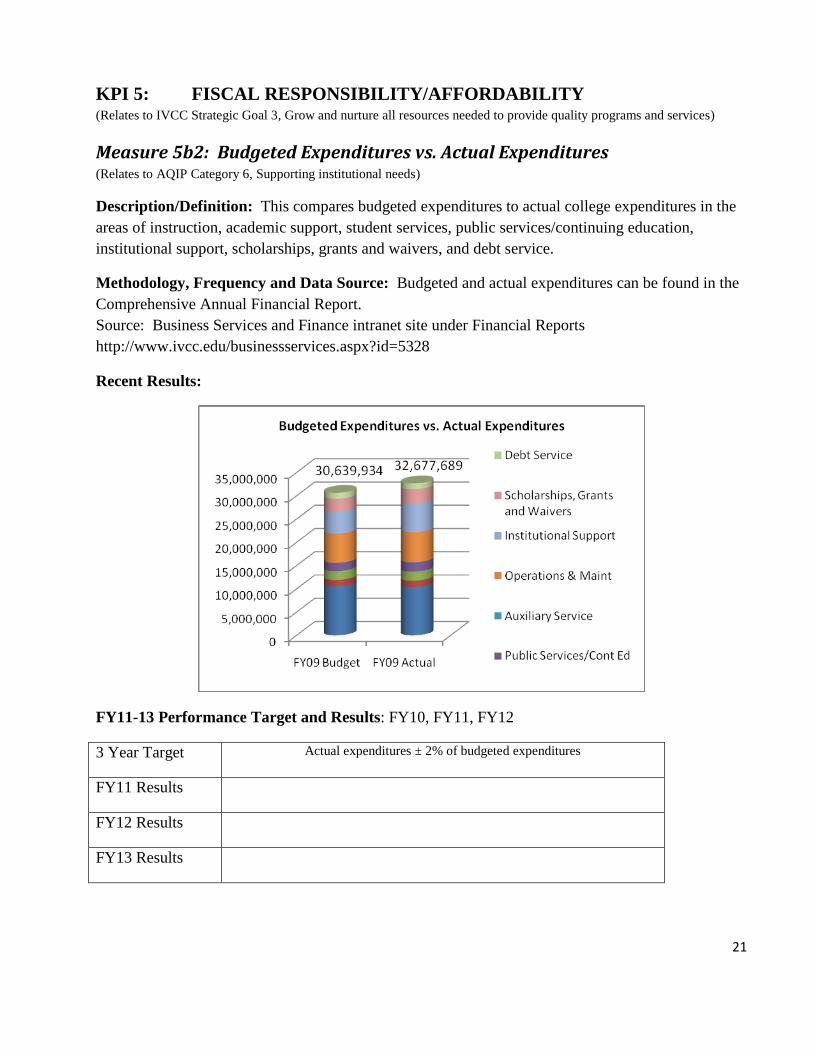
Measure 5b2: Budgeted Expenditures vs. Actual Expenditures (Relates to AQIP Category 6, Supporting institutional needs)
Description/Definition: This compares budgeted expenditures to actual college expenditures in the
areas of instruction, academic support, student services, public services/continuing education,
institutional support, scholarships, grants and waivers, and debt service.
Methodology, Frequency and Data Source: Budgeted and actual expenditures can be found in the
Comprehensive Annual Financial Report.
Source: Business Services and Finance intranet site under Financial Reports
http://www.ivcc.edu/businessservices.aspx?id=5328
Recent Results:
FY11-13 Performance Target and Results: FY10, FY11, FY12
3 Year Target Actual expenditures ± 2% of budgeted expenditures
FY11 Results
FY12 Results
FY13 Results
22
KPI 5: FISCAL RESPONSIBILITY/AFFORDABILITY (Relates to IVCC Strategic Goal 3, Grow and nurture all resources needed to provide quality programs and services)
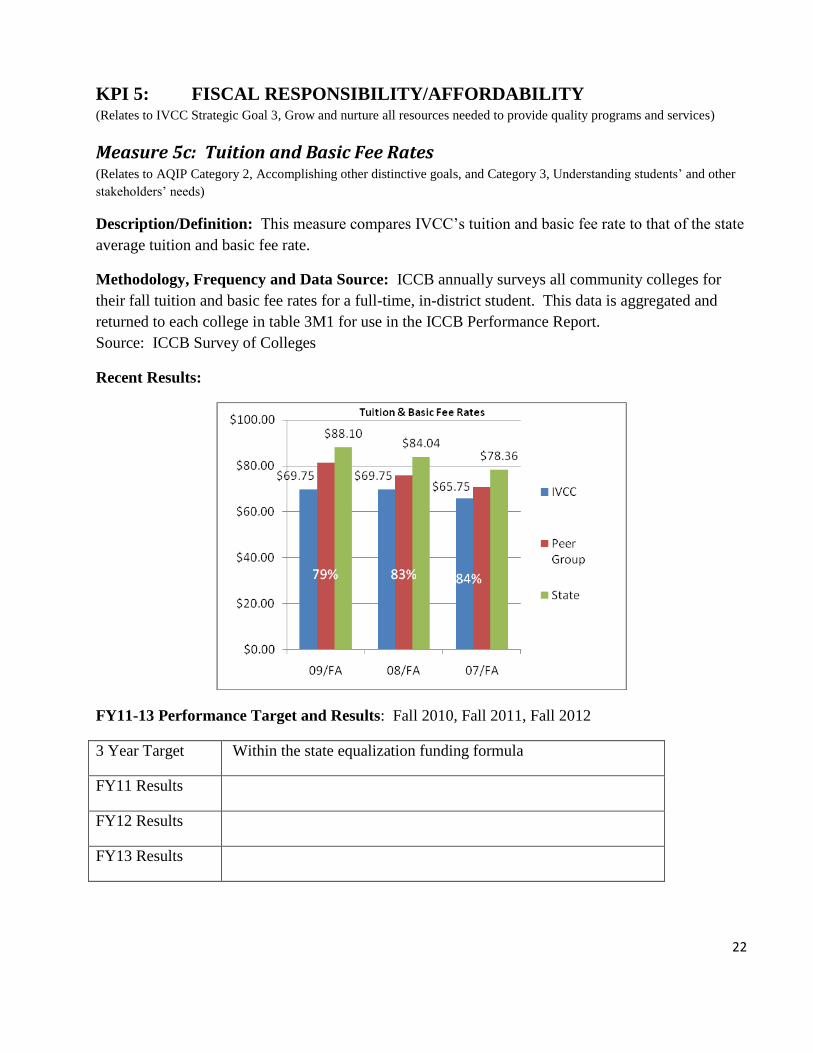
Measure 5c: Tuition and Basic Fee Rates (Relates to AQIP Category 2, Accomplishing other distinctive goals, and Category 3, Understanding students’ and other
stakeholders’ needs)
Description/Definition: This measure compares IVCC’s tuition and basic fee rate to that of the state
average tuition and basic fee rate.
Methodology, Frequency and Data Source: ICCB annually surveys all community colleges for
their fall tuition and basic fee rates for a full-time, in-district student. This data is aggregated and
returned to each college in table 3M1 for use in the ICCB Performance Report.
Source: ICCB Survey of Colleges
Recent Results:
FY11-13 Performance Target and Results: Fall 2010, Fall 2011, Fall 2012
3 Year Target Within the state equalization funding formula
FY11 Results
FY12 Results
FY13 Results
23
KPI 5: FISCAL RESPONSIBILITY/AFFORDABILITY (Relates to IVCC Strategic Goal 3, Grow and nurture all resources needed to provide quality programs and services)
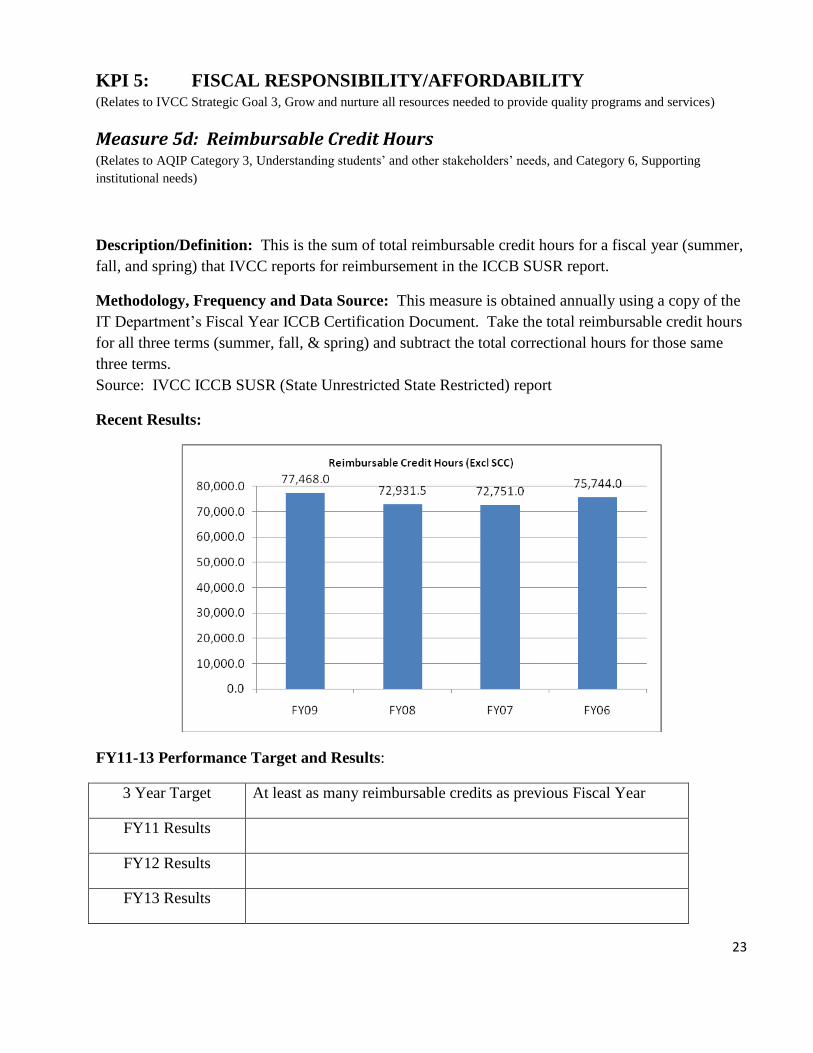
Measure 5d: Reimbursable Credit Hours (Relates to AQIP Category 3, Understanding students’ and other stakeholders’ needs, and Category 6, Supporting
institutional needs)
Description/Definition: This is the sum of total reimbursable credit hours for a fiscal year (summer,
fall, and spring) that IVCC reports for reimbursement in the ICCB SUSR report.
Methodology, Frequency and Data Source: This measure is obtained annually using a copy of the
IT Department’s Fiscal Year ICCB Certification Document. Take the total reimbursable credit hours
for all three terms (summer, fall, & spring) and subtract the total correctional hours for those same
three terms.
Source: IVCC ICCB SUSR (State Unrestricted State Restricted) report
Recent Results:
FY11-13 Performance Target and Results:
3 Year Target At least as many reimbursable credits as previous Fiscal Year
FY11 Results
FY12 Results
FY13 Results
24
KPI 6: JOB SATISFACTION (Relates to IVCC Strategic Goal 3, Grow and nurture all resources needed to provide quality programs and services
and IVCC Strategic Goal 5, Demonstrate IVCC’s Core Values through an inclusive and collaborative environment.)
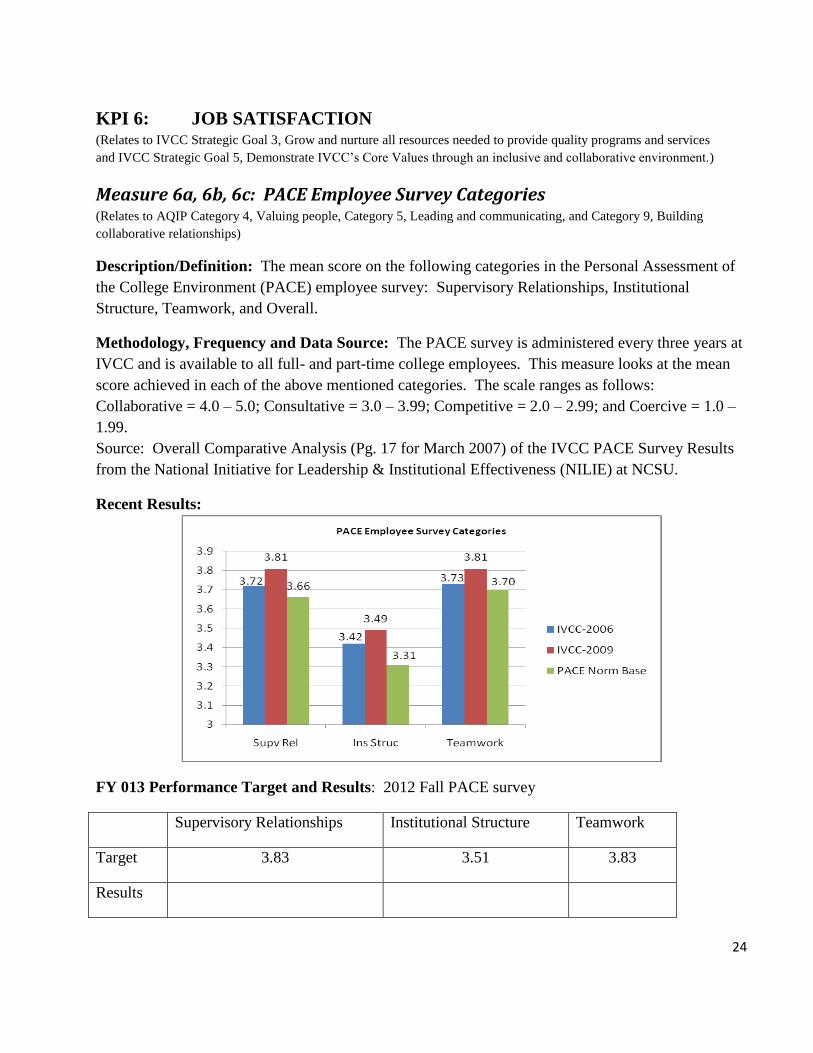
Measure 6a, 6b, 6c: PACE Employee Survey Categories (Relates to AQIP Category 4, Valuing people, Category 5, Leading and communicating, and Category 9, Building
collaborative relationships)
Description/Definition: The mean score on the following categories in the Personal Assessment of
the College Environment (PACE) employee survey: Supervisory Relationships, Institutional
Structure, Teamwork, and Overall.
Methodology, Frequency and Data Source: The PACE survey is administered every three years at
IVCC and is available to all full- and part-time college employees. This measure looks at the mean
score achieved in each of the above mentioned categories. The scale ranges as follows:
Collaborative = 4.0 – 5.0; Consultative = 3.0 – 3.99; Competitive = 2.0 – 2.99; and Coercive = 1.0 –
1.99.
Source: Overall Comparative Analysis (Pg. 17 for March 2007) of the IVCC PACE Survey Results
from the National Initiative for Leadership & Institutional Effectiveness (NILIE) at NCSU.
Recent Results:
FY 013 Performance Target and Results: 2012 Fall PACE survey
Supervisory Relationships Institutional Structure Teamwork
Target 3.83 3.51 3.83
Results
25
KPI 6: JOB SATISFACTION (Relates to IVCC Strategic Goal 3, Grow and nurture all resources needed to provide quality programs and services)
Measure 6d: Overall Faculty Job Satisfaction (Relates to AQIP Category 3, Understanding students’ and other stakeholders’ needs, Category 4, Valuing people, and
Category 5, Leading & communicating)
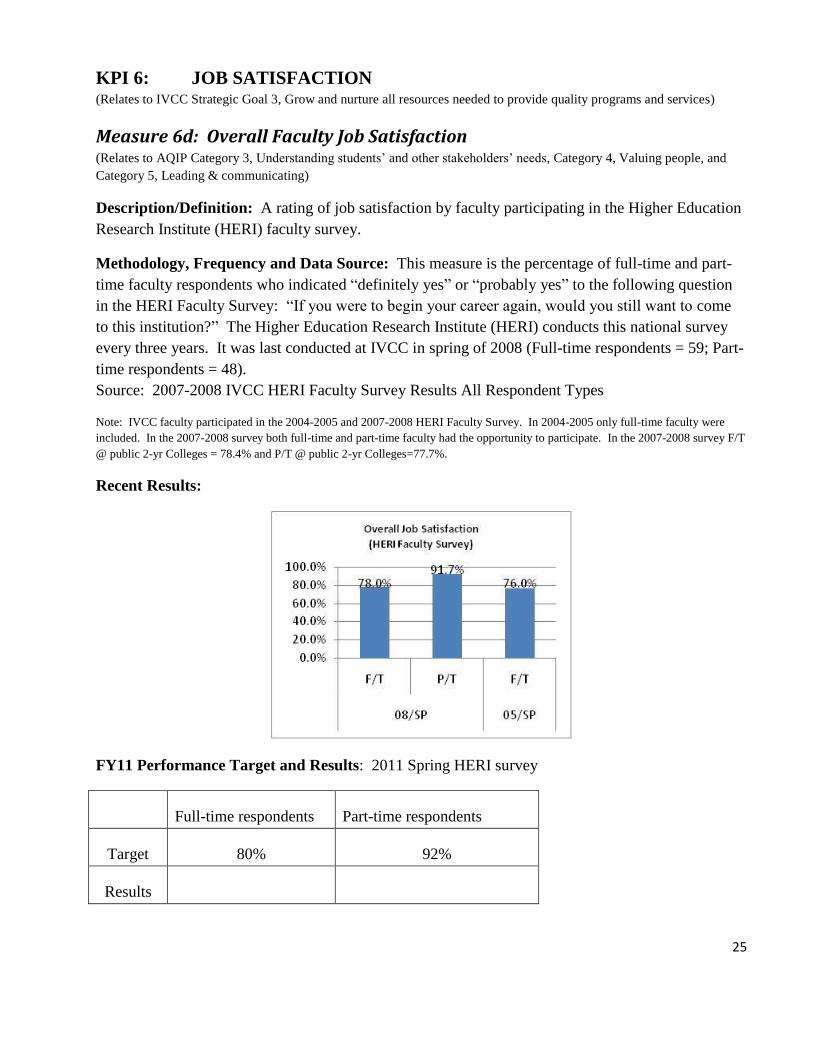
Description/Definition: A rating of job satisfaction by faculty participating in the Higher Education
Research Institute (HERI) faculty survey.
Methodology, Frequency and Data Source: This measure is the percentage of full-time and part-
time faculty respondents who indicated “definitely yes” or “probably yes” to the following question
in the HERI Faculty Survey: “If you were to begin your career again, would you still want to come
to this institution?” The Higher Education Research Institute (HERI) conducts this national survey
every three years. It was last conducted at IVCC in spring of 2008 (Full-time respondents = 59; Part-
time respondents = 48).
Source: 2007-2008 IVCC HERI Faculty Survey Results All Respondent Types
Note: IVCC faculty participated in the 2004-2005 and 2007-2008 HERI Faculty Survey. In 2004-2005 only full-time faculty were
included. In the 2007-2008 survey both full-time and part-time faculty had the opportunity to participate. In the 2007-2008 survey F/T
@ public 2-yr Colleges = 78.4% and P/T @ public 2-yr Colleges=77.7%.
Recent Results:
FY11 Performance Target and Results: 2011 Spring HERI survey
Full-time respondents Part-time respondents
Target 80% 92%
Results
26
KPI 6: JOB SATISFACTION (Relates to IVCC Strategic Goal 3, Grow and nurture all resources needed to provide quality programs and services)
Measure 6e: Want to be a College Professor (Relates to AQIP Category 4, Valuing people)
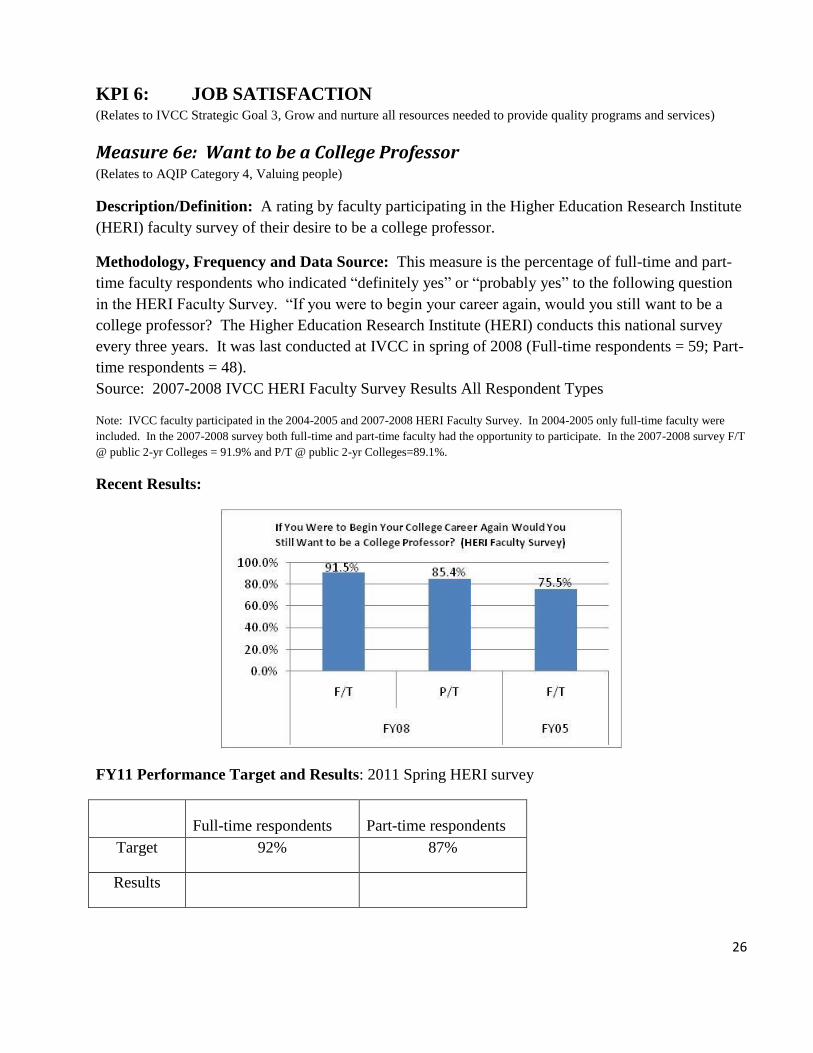
Description/Definition: A rating by faculty participating in the Higher Education Research Institute
(HERI) faculty survey of their desire to be a college professor.
Methodology, Frequency and Data Source: This measure is the percentage of full-time and part-
time faculty respondents who indicated “definitely yes” or “probably yes” to the following question
in the HERI Faculty Survey. “If you were to begin your career again, would you still want to be a
college professor? The Higher Education Research Institute (HERI) conducts this national survey
every three years. It was last conducted at IVCC in spring of 2008 (Full-time respondents = 59; Part-
time respondents = 48).
Source: 2007-2008 IVCC HERI Faculty Survey Results All Respondent Types
Note: IVCC faculty participated in the 2004-2005 and 2007-2008 HERI Faculty Survey. In 2004-2005 only full-time faculty were
included. In the 2007-2008 survey both full-time and part-time faculty had the opportunity to participate. In the 2007-2008 survey F/T
@ public 2-yr Colleges = 91.9% and P/T @ public 2-yr Colleges=89.1%.
Recent Results:
FY11 Performance Target and Results: 2011 Spring HERI survey
Full-time respondents Part-time respondents
Target 92% 87%
Results
27
KPI 6: JOB SATISFACTION (Relates to IVCC Strategic Goal 5, Demonstrate IVCC’s Core Values through an inclusive and collaborative
environment)
Measure 6f: PACE Employee Campus Climate (Relates to AQIP Category 4, Valuing people, and Category 5, Leading and communicating)
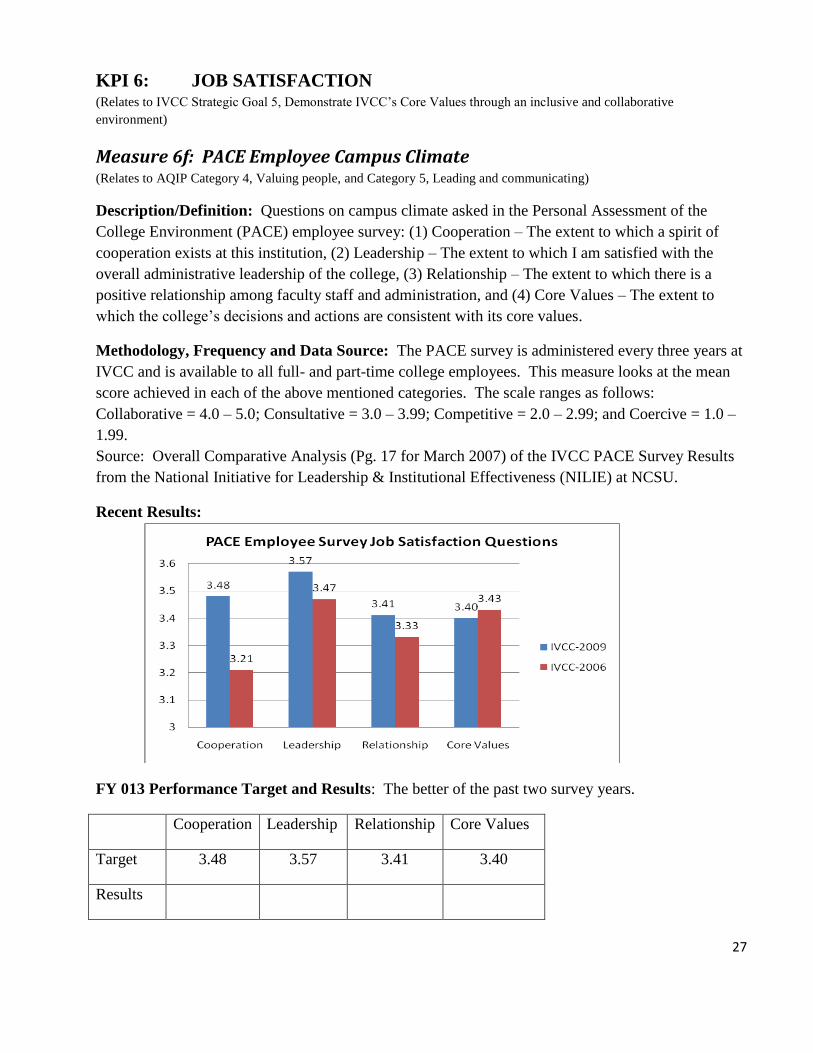
Description/Definition: Questions on campus climate asked in the Personal Assessment of the
College Environment (PACE) employee survey: (1) Cooperation – The extent to which a spirit of
cooperation exists at this institution, (2) Leadership – The extent to which I am satisfied with the
overall administrative leadership of the college, (3) Relationship – The extent to which there is a
positive relationship among faculty staff and administration, and (4) Core Values – The extent to
which the college’s decisions and actions are consistent with its core values.
Methodology, Frequency and Data Source: The PACE survey is administered every three years at
IVCC and is available to all full- and part-time college employees. This measure looks at the mean
score achieved in each of the above mentioned categories. The scale ranges as follows:
Collaborative = 4.0 – 5.0; Consultative = 3.0 – 3.99; Competitive = 2.0 – 2.99; and Coercive = 1.0 –
1.99.
Source: Overall Comparative Analysis (Pg. 17 for March 2007) of the IVCC PACE Survey Results
from the National Initiative for Leadership & Institutional Effectiveness (NILIE) at NCSU.
Recent Results:
FY 013 Performance Target and Results: The better of the past two survey years.
Cooperation Leadership Relationship Core Values
Target 3.48 3.57 3.41 3.40
Results
28
KPI 7: PROFESSIONAL DEVELOPMENT OPPORTUNITIES FOR ALL
EMPLOYEE GROUPS (Relates to IVCC Strategic Goal 3, Grow and nurture all resources needed to provide quality programs and services)
Measure 7a: Availability of Professional Development/Training
Opportunities (Relates to AQIP Category 4, Valuing people, and Category 6, Supporting institutional needs)
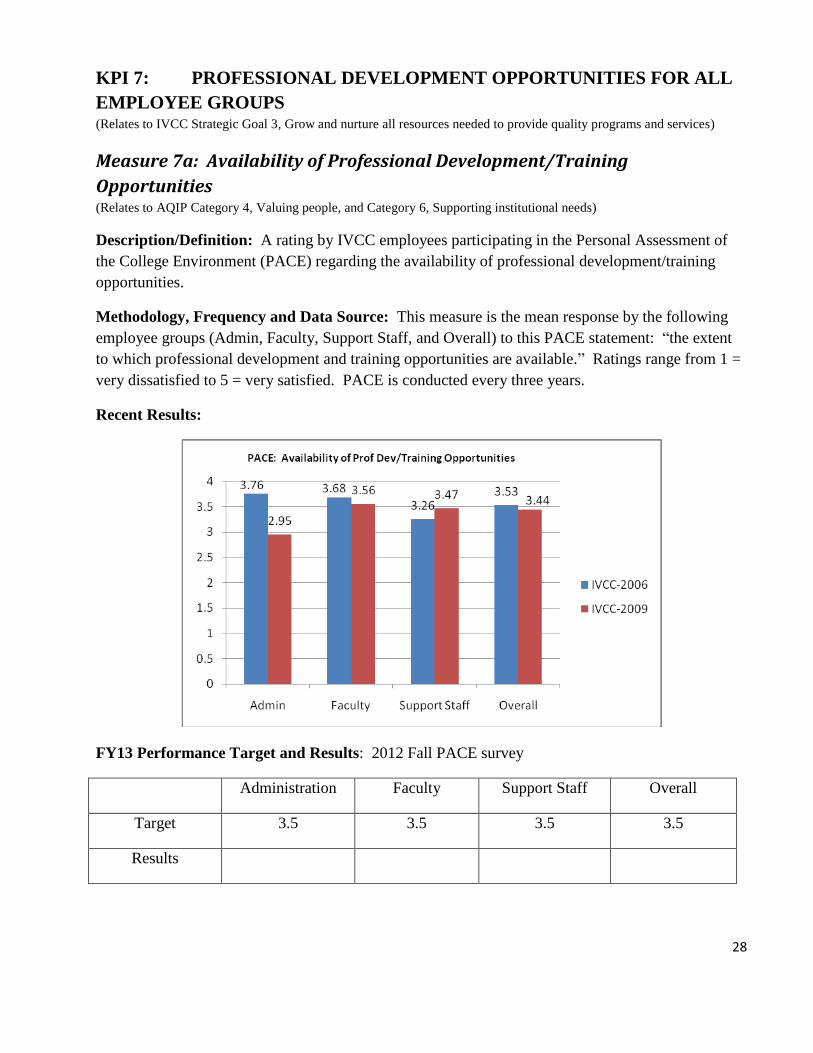
Description/Definition: A rating by IVCC employees participating in the Personal Assessment of
the College Environment (PACE) regarding the availability of professional development/training
opportunities.
Methodology, Frequency and Data Source: This measure is the mean response by the following
employee groups (Admin, Faculty, Support Staff, and Overall) to this PACE statement: “the extent
to which professional development and training opportunities are available.” Ratings range from 1 =
very dissatisfied to 5 = very satisfied. PACE is conducted every three years.
Recent Results:
FY13 Performance Target and Results: 2012 Fall PACE survey
Administration Faculty Support Staff Overall
Target 3.5 3.5 3.5 3.5
Results
29
KPI 7: PROFESSIONAL DEVELOPMENT OPPORTUNITIES FOR ALL
EMPLOYEE GROUPS (Relates to IVCC Strategic Goal 3, Grow and nurture all resources needed to provide quality programs and services)
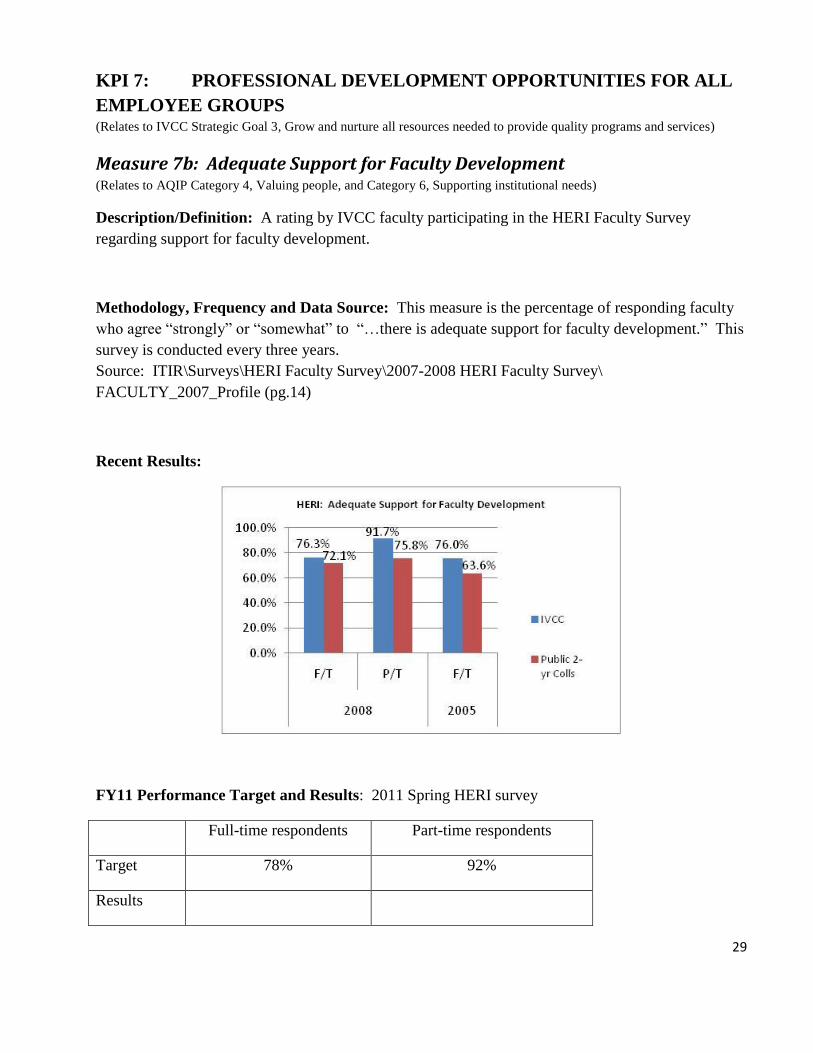
Measure 7b: Adequate Support for Faculty Development (Relates to AQIP Category 4, Valuing people, and Category 6, Supporting institutional needs)
Description/Definition: A rating by IVCC faculty participating in the HERI Faculty Survey
regarding support for faculty development.
Methodology, Frequency and Data Source: This measure is the percentage of responding faculty
who agree “strongly” or “somewhat” to “…there is adequate support for faculty development.” This
survey is conducted every three years.
Source: ITIR\Surveys\HERI Faculty Survey\2007-2008 HERI Faculty Survey\
FACULTY_2007_Profile (pg.14)
Recent Results:
FY11 Performance Target and Results: 2011 Spring HERI survey
Full-time respondents Part-time respondents
Target 78% 92%
Results
30
KPI 8: UTILIZATION OF TECHNOLOGY FOR TEACHING AND
LEARNING (Relates to IVCC Strategic Goal 1, Assist all students in identifying and achieving their educational and career goals)
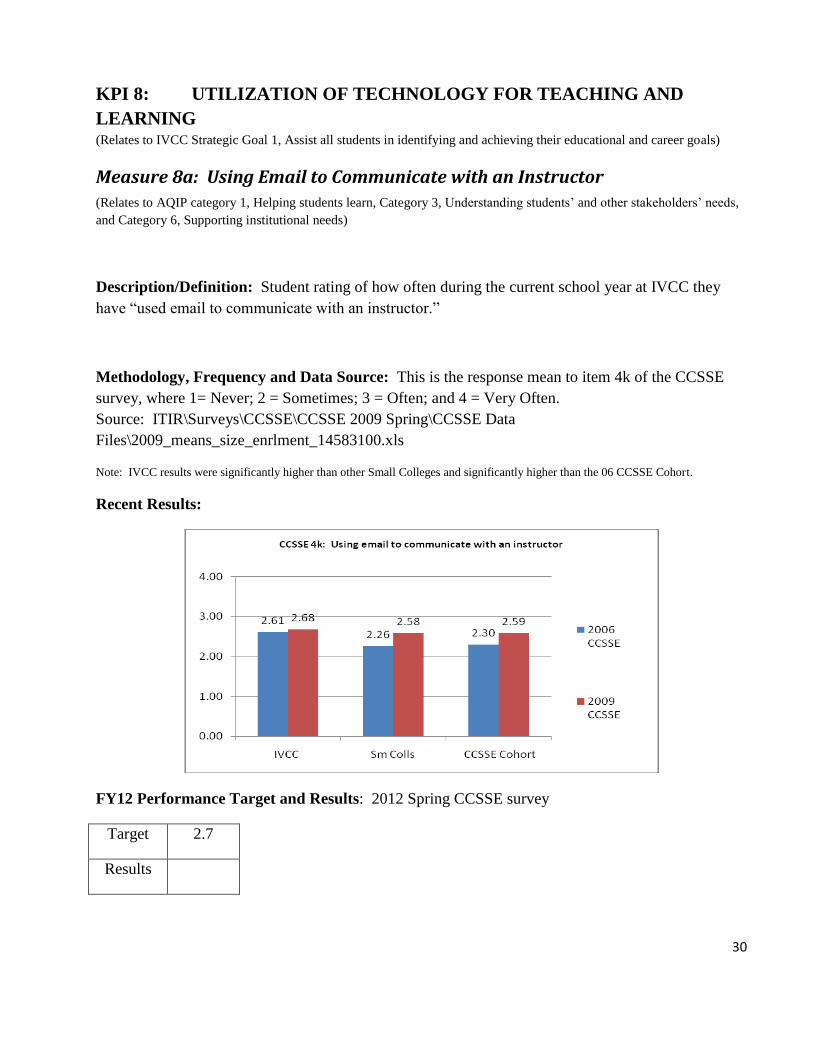
Measure 8a: Using Email to Communicate with an Instructor
(Relates to AQIP category 1, Helping students learn, Category 3, Understanding students’ and other stakeholders’ needs,
and Category 6, Supporting institutional needs)
Description/Definition: Student rating of how often during the current school year at IVCC they
have “used email to communicate with an instructor.”
Methodology, Frequency and Data Source: This is the response mean to item 4k of the CCSSE
survey, where 1= Never; 2 = Sometimes; 3 = Often; and 4 = Very Often.
Source: ITIR\Surveys\CCSSE\CCSSE 2009 Spring\CCSSE Data
Files\2009_means_size_enrlment_14583100.xls
Note: IVCC results were significantly higher than other Small Colleges and significantly higher than the 06 CCSSE Cohort.
Recent Results:
FY12 Performance Target and Results: 2012 Spring CCSSE survey
Target 2.7
Results
31
KPI 8: UTILIZATION OF TECHNOLOGY FOR TEACHING AND
LEARNING (Relates to IVCC Strategic Goal 1, Assist all students in identifying and achieving their educational and career goals)
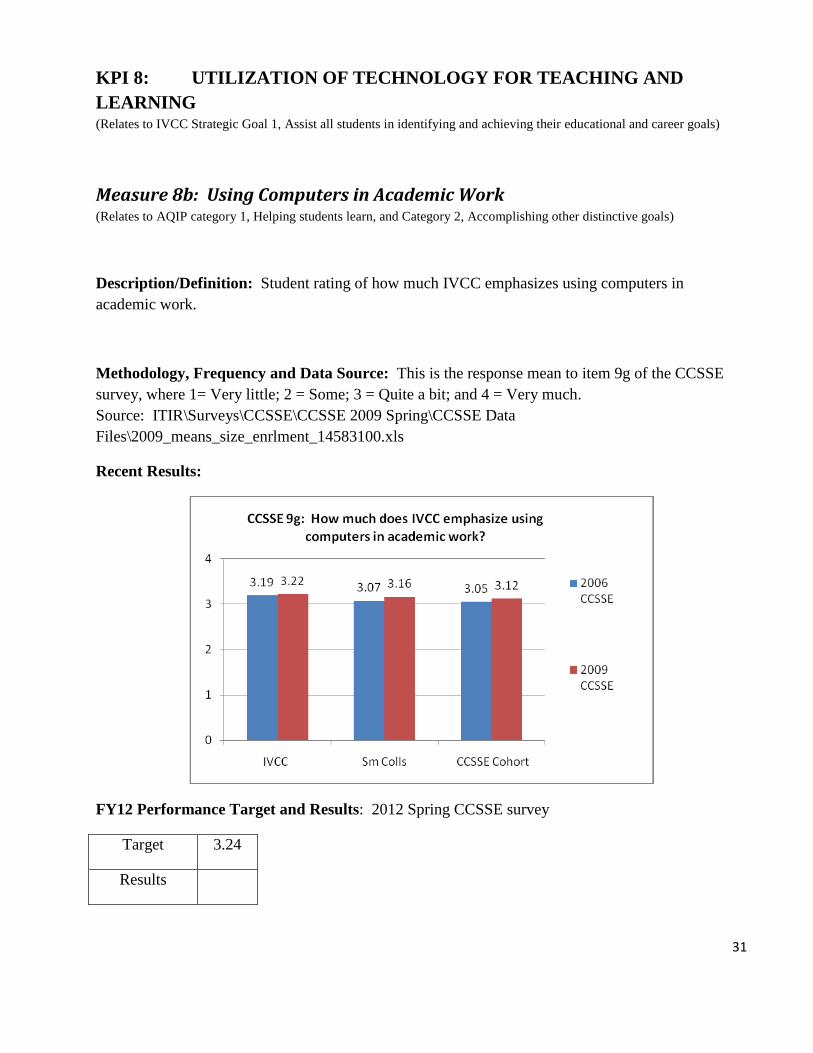
Measure 8b: Using Computers in Academic Work (Relates to AQIP category 1, Helping students learn, and Category 2, Accomplishing other distinctive goals)
Description/Definition: Student rating of how much IVCC emphasizes using computers in
academic work.
Methodology, Frequency and Data Source: This is the response mean to item 9g of the CCSSE
survey, where 1= Very little; 2 = Some; 3 = Quite a bit; and 4 = Very much.
Source: ITIR\Surveys\CCSSE\CCSSE 2009 Spring\CCSSE Data
Files\2009_means_size_enrlment_14583100.xls
Recent Results:
FY12 Performance Target and Results: 2012 Spring CCSSE survey
Target 3.24
Results

32
KPI 8: UTILIZATION OF TECHNOLOGY FOR TEACHING AND
LEARNING (Relates to IVCC Strategic Goal 1, Assist all students in identifying and achieving their educational and career goals)
Measure 8c: Using Computing and Information Technology
(Relates to AQIP Category 1, Helping students learn, and Category 2, Accomplishing other distinctive objectives)
Description/Definition: Student rating of how much their experience at IVCC contributed to their
knowledge, skills, and personal development… using computing and information technology.
Methodology, Frequency and Data Source: This is the response mean to item 12g of the CCSSE
survey, where 1= Very little; 2 = Some; 3 = Quite a bit; and 4 = Very much.
Source: ITIR\Surveys\CCSSE\CCSSE 2009 Spring\CCSSE Data Files\ 2009_ means_ size_
enrlment_14583100.xls
Recent Results:
FY12 Performance Target and Results: 2012 Spring CCSSE survey
Target 2.7
Results
33
KPI 8: UTILIZATION OF TECHNOLOGY FOR TEACHING AND
LEARNING (Relates to IVCC Strategic Goal 1, Assist all students in identifying and achieving their educational and career goals)
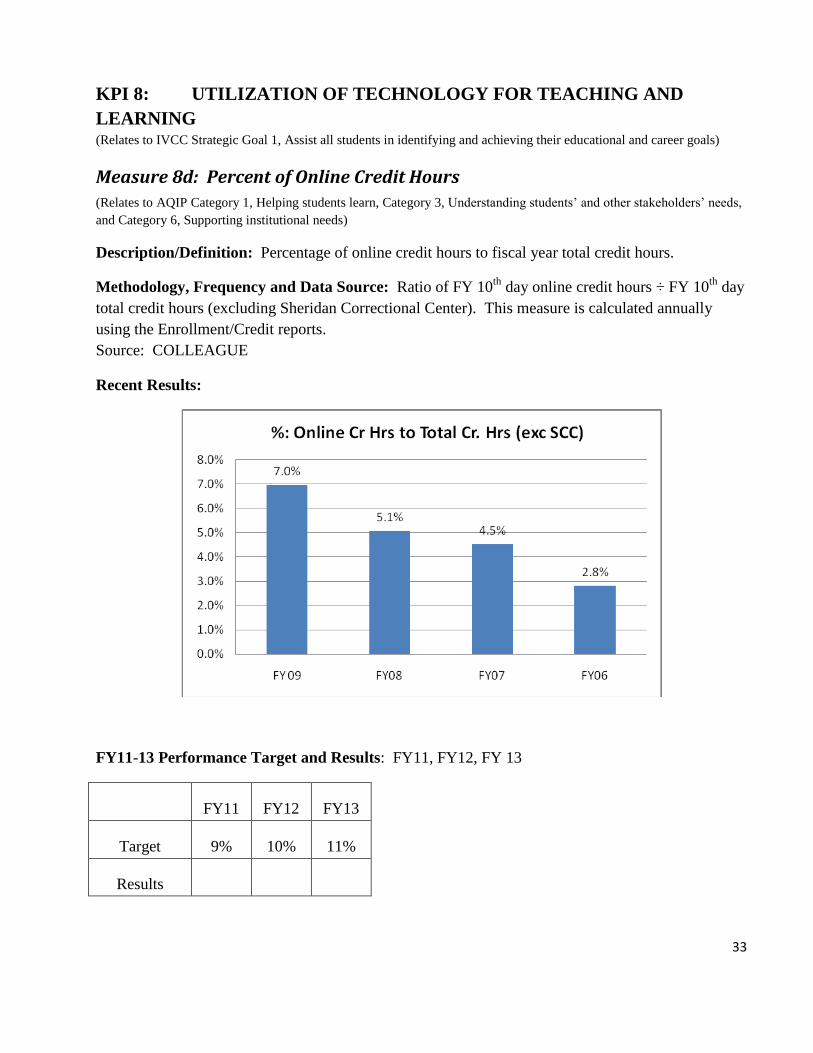
Measure 8d: Percent of Online Credit Hours
(Relates to AQIP Category 1, Helping students learn, Category 3, Understanding students’ and other stakeholders’ needs,
and Category 6, Supporting institutional needs)
Description/Definition: Percentage of online credit hours to fiscal year total credit hours.
Methodology, Frequency and Data Source: Ratio of FY 10th
day online credit hours ÷ FY 10th
day
total credit hours (excluding Sheridan Correctional Center). This measure is calculated annually
using the Enrollment/Credit reports.
Source: COLLEAGUE
Recent Results:
FY11-13 Performance Target and Results: FY11, FY12, FY 13
FY11 FY12 FY13
Target 9% 10% 11%
Results
34
KPI 8: UTILIZATION OF TECHNOLOGY FOR TEACHING AND
LEARNING (Relates to IVCC Strategic Goal 1, Assist all students in identifying and achieving their educational and career goals)
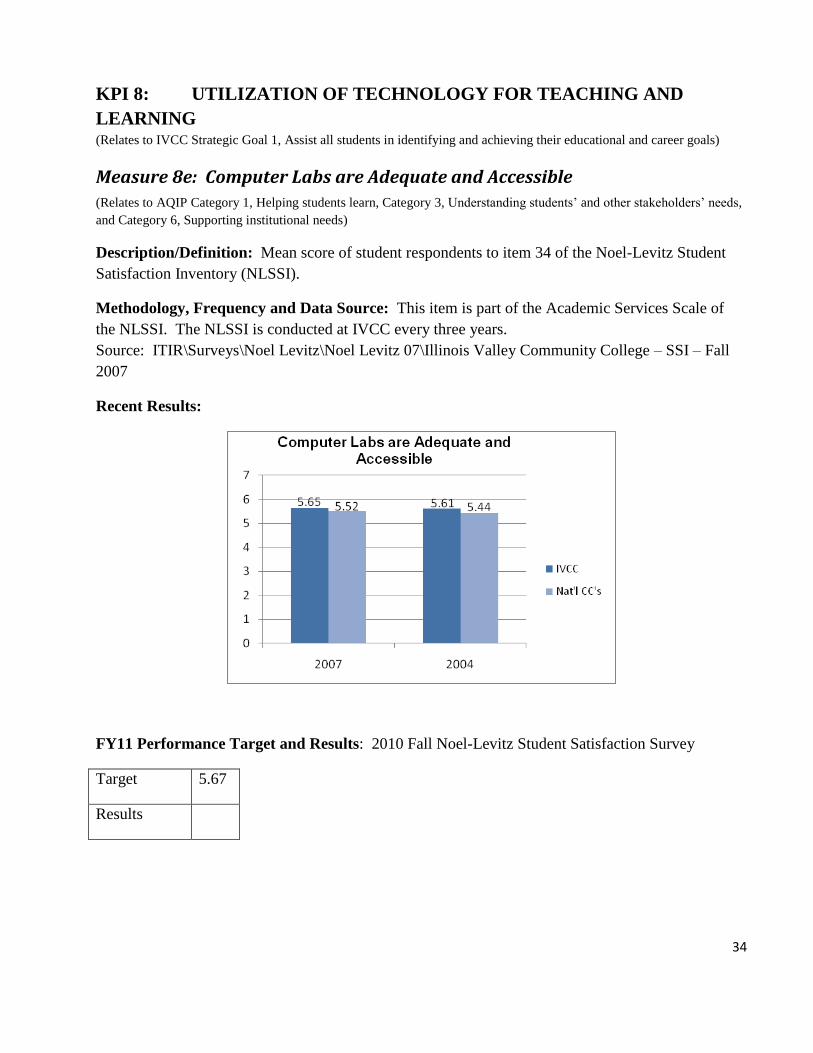
Measure 8e: Computer Labs are Adequate and Accessible
(Relates to AQIP Category 1, Helping students learn, Category 3, Understanding students’ and other stakeholders’ needs,
and Category 6, Supporting institutional needs)
Description/Definition: Mean score of student respondents to item 34 of the Noel-Levitz Student
Satisfaction Inventory (NLSSI).
Methodology, Frequency and Data Source: This item is part of the Academic Services Scale of
the NLSSI. The NLSSI is conducted at IVCC every three years.
Source: ITIR\Surveys\Noel Levitz\Noel Levitz 07\Illinois Valley Community College – SSI – Fall
2007
Recent Results:
FY11 Performance Target and Results: 2010 Fall Noel-Levitz Student Satisfaction Survey
Target 5.67
Results
35
KPI 8: UTILIZATION OF TECHNOLOGY FOR TEACHING AND
LEARNING (Relates to IVCC Strategic Goal 1, Assist all students in identifying and achieving their educational and career goals)
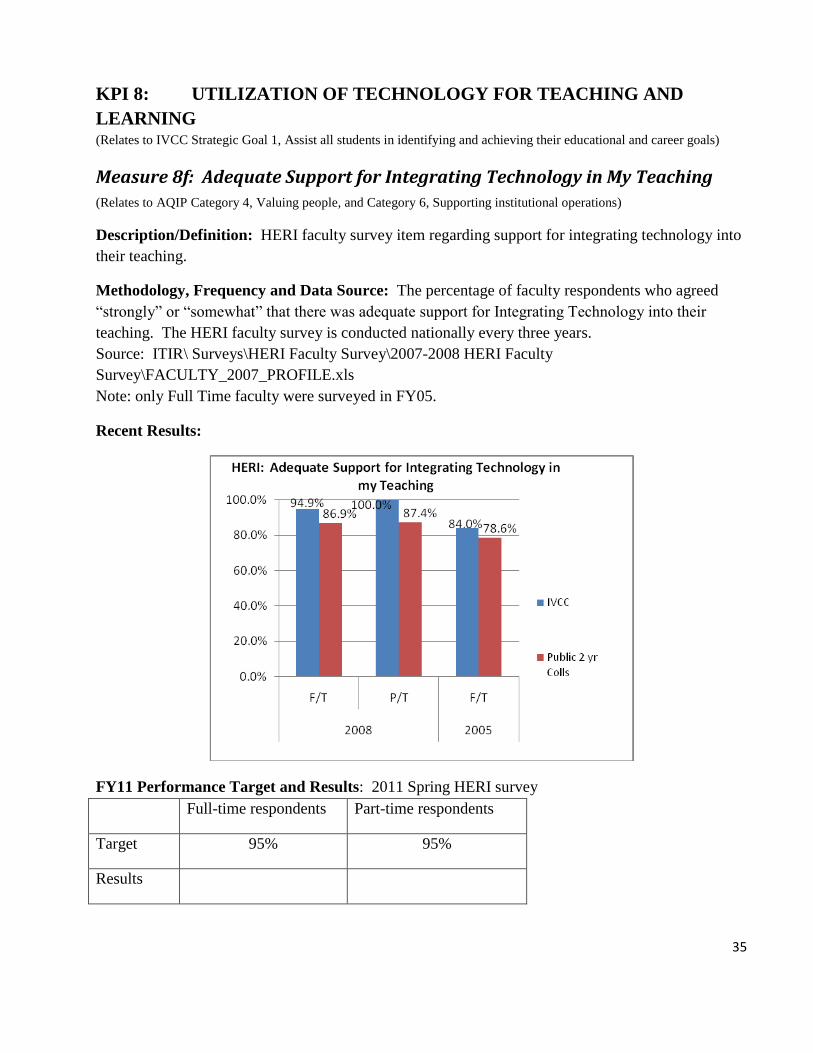
Measure 8f: Adequate Support for Integrating Technology in My Teaching
(Relates to AQIP Category 4, Valuing people, and Category 6, Supporting institutional operations)
Description/Definition: HERI faculty survey item regarding support for integrating technology into
their teaching.
Methodology, Frequency and Data Source: The percentage of faculty respondents who agreed
“strongly” or “somewhat” that there was adequate support for Integrating Technology into their
teaching. The HERI faculty survey is conducted nationally every three years.
Source: ITIR\ Surveys\HERI Faculty Survey\2007-2008 HERI Faculty
Survey\FACULTY_2007_PROFILE.xls
Note: only Full Time faculty were surveyed in FY05.
Recent Results:
FY11 Performance Target and Results: 2011 Spring HERI survey
Full-time respondents Part-time respondents
Target 95% 95%
Results
36
KPI 9: DIVERSITY AWARENESS (Relates to IVCC Strategic Goal 4, Promote understanding of diverse cultures and beliefs)
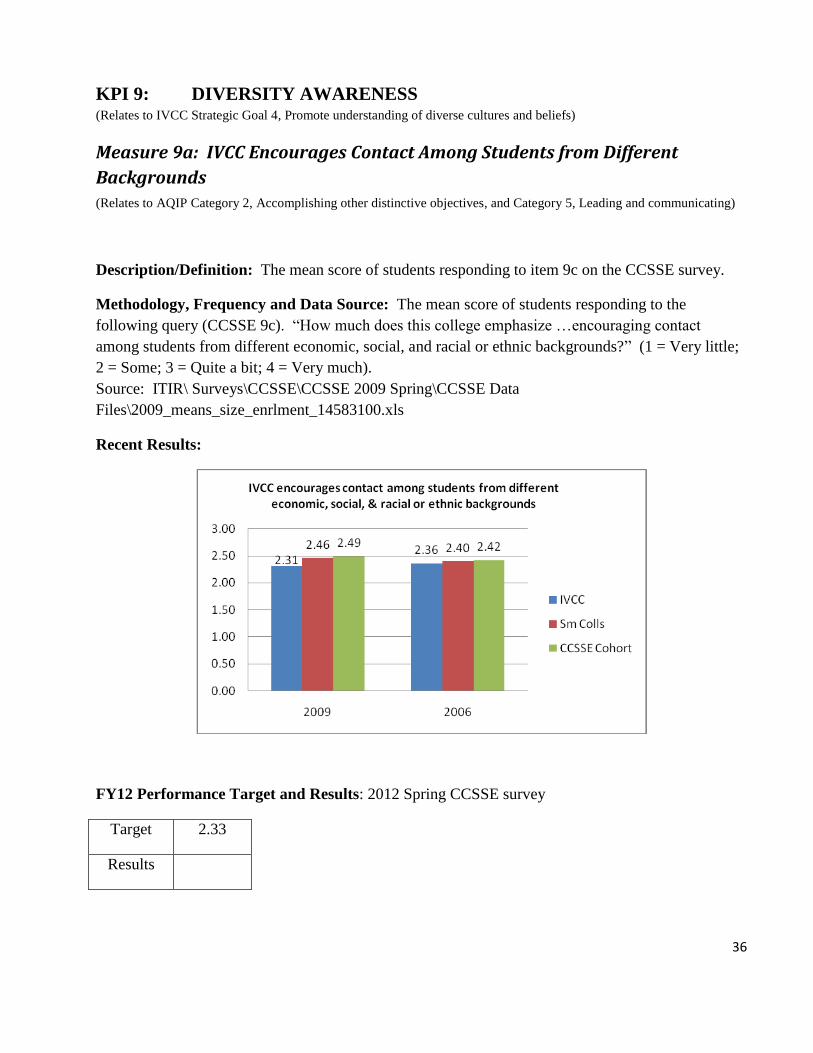
Measure 9a: IVCC Encourages Contact Among Students from Different
Backgrounds
(Relates to AQIP Category 2, Accomplishing other distinctive objectives, and Category 5, Leading and communicating)
Description/Definition: The mean score of students responding to item 9c on the CCSSE survey.
Methodology, Frequency and Data Source: The mean score of students responding to the
following query (CCSSE 9c). “How much does this college emphasize …encouraging contact
among students from different economic, social, and racial or ethnic backgrounds?” (1 = Very little;
2 = Some; 3 = Quite a bit; 4 = Very much).
Source: ITIR\ Surveys\CCSSE\CCSSE 2009 Spring\CCSSE Data
Files\2009_means_size_enrlment_14583100.xls
Recent Results:
FY12 Performance Target and Results: 2012 Spring CCSSE survey
Target 2.33
Results
37
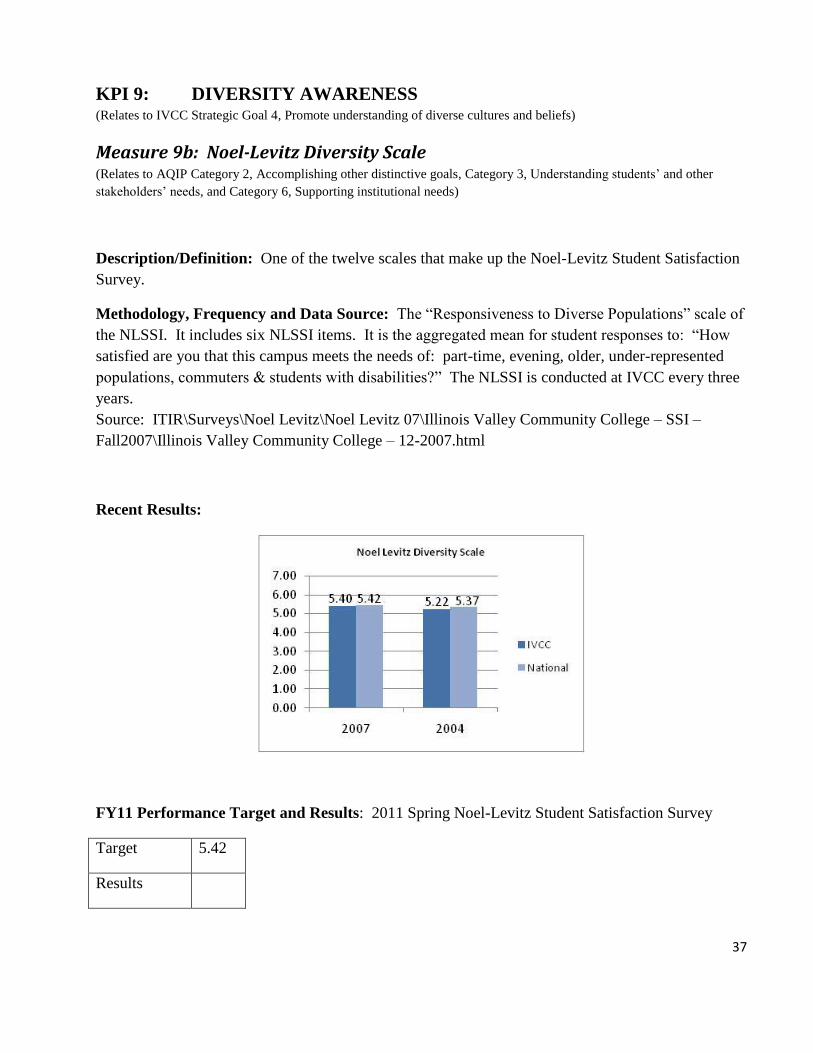
KPI 9: DIVERSITY AWARENESS (Relates to IVCC Strategic Goal 4, Promote understanding of diverse cultures and beliefs)
Measure 9b: Noel-Levitz Diversity Scale (Relates to AQIP Category 2, Accomplishing other distinctive goals, Category 3, Understanding students’ and other
stakeholders’ needs, and Category 6, Supporting institutional needs)
Description/Definition: One of the twelve scales that make up the Noel-Levitz Student Satisfaction
Survey.
Methodology, Frequency and Data Source: The “Responsiveness to Diverse Populations” scale of
the NLSSI. It includes six NLSSI items. It is the aggregated mean for student responses to: “How
satisfied are you that this campus meets the needs of: part-time, evening, older, under-represented
populations, commuters & students with disabilities?” The NLSSI is conducted at IVCC every three
years.
Source: ITIR\Surveys\Noel Levitz\Noel Levitz 07\Illinois Valley Community College – SSI –
Fall2007\Illinois Valley Community College – 12-2007.html
Recent Results:
FY11 Performance Target and Results: 2011 Spring Noel-Levitz Student Satisfaction Survey
Target 5.42
Results
38
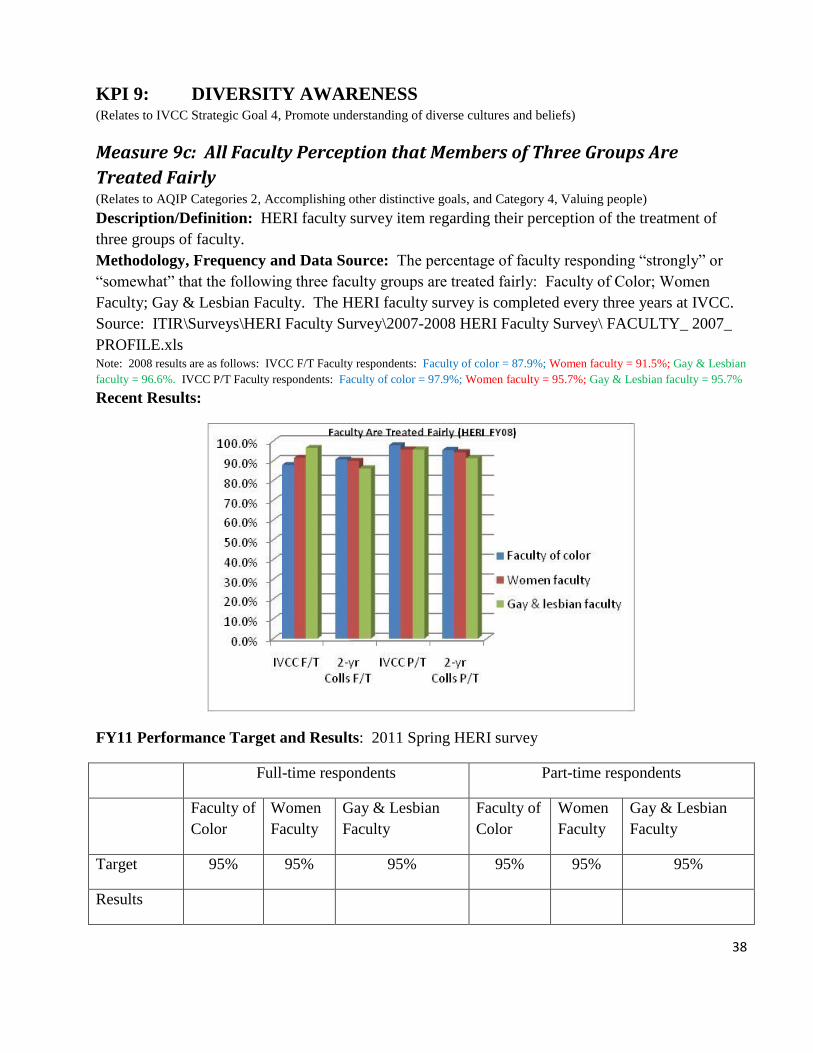
KPI 9: DIVERSITY AWARENESS (Relates to IVCC Strategic Goal 4, Promote understanding of diverse cultures and beliefs)
Measure 9c: All Faculty Perception that Members of Three Groups Are
Treated Fairly (Relates to AQIP Categories 2, Accomplishing other distinctive goals, and Category 4, Valuing people)
Description/Definition: HERI faculty survey item regarding their perception of the treatment of
three groups of faculty.
Methodology, Frequency and Data Source: The percentage of faculty responding “strongly” or
“somewhat” that the following three faculty groups are treated fairly: Faculty of Color; Women
Faculty; Gay & Lesbian Faculty. The HERI faculty survey is completed every three years at IVCC.
Source: ITIR\Surveys\HERI Faculty Survey\2007-2008 HERI Faculty Survey\ FACULTY_ 2007_
PROFILE.xls Note: 2008 results are as follows: IVCC F/T Faculty respondents: Faculty of color = 87.9%; Women faculty = 91.5%; Gay & Lesbian
faculty = 96.6%. IVCC P/T Faculty respondents: Faculty of color = 97.9%; Women faculty = 95.7%; Gay & Lesbian faculty = 95.7%
Recent Results:
FY11 Performance Target and Results: 2011 Spring HERI survey
Full-time respondents Part-time respondents
Faculty of
Color
Women
Faculty
Gay & Lesbian
Faculty
Faculty of
Color
Women
Faculty
Gay & Lesbian
Faculty
Target 95% 95% 95% 95% 95% 95%
Results
39
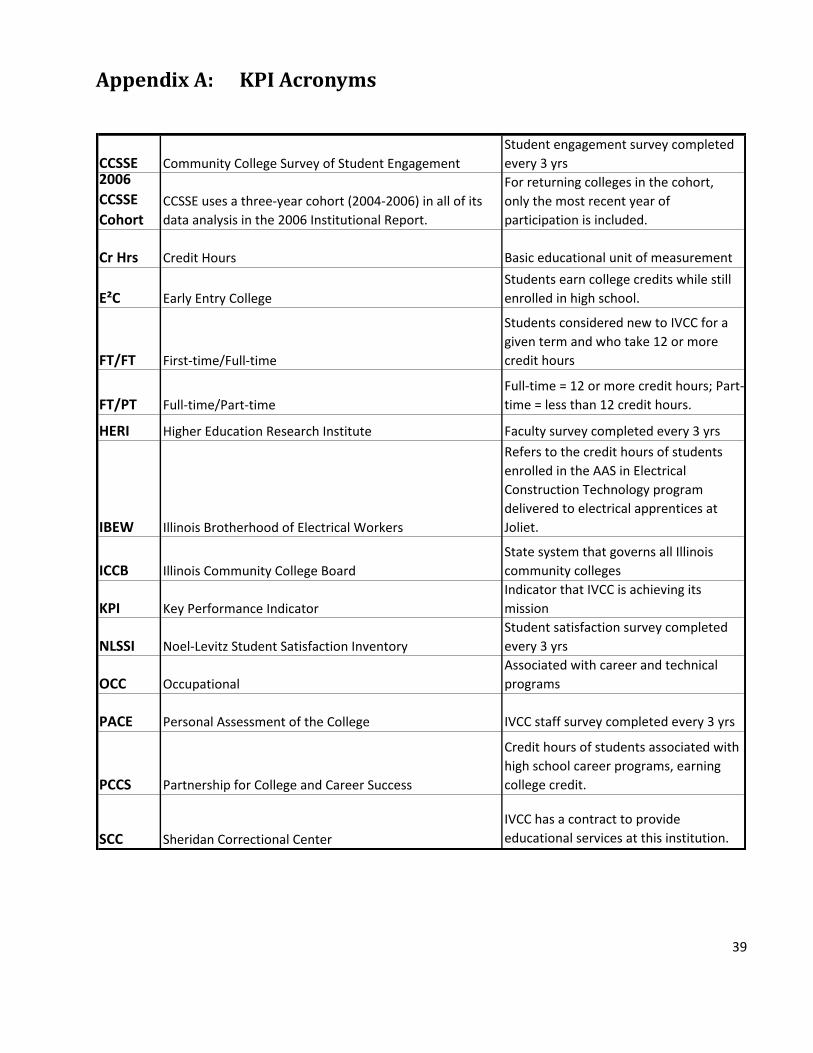
Appendix A: KPI Acronyms
CCSSE Community College Survey of Student Engagement
Student engagement survey completed
every 3 yrs2006
CCSSE
CohortCCSSE uses a three-year cohort (2004-2006) in all of its
data analysis in the 2006 Institutional Report.
For returning colleges in the cohort,
only the most recent year of
participation is included.
Cr Hrs Credit Hours Basic educational unit of measurement
E²C Early Entry College
Students earn college credits while still
enrolled in high school.
FT/FT First-time/Full-time
Students considered new to IVCC for a
given term and who take 12 or more
credit hours
FT/PT Full-time/Part-time
Full-time = 12 or more credit hours; Part-
time = less than 12 credit hours.
HERI Higher Education Research Institute Faculty survey completed every 3 yrs
IBEW Illinois Brotherhood of Electrical Workers
Refers to the credit hours of students
enrolled in the AAS in Electrical
Construction Technology program
delivered to electrical apprentices at
Joliet.
ICCB Illinois Community College Board
State system that governs all Illinois
community colleges
KPI Key Performance Indicator
Indicator that IVCC is achieving its
mission
NLSSI Noel-Levitz Student Satisfaction Inventory
Student satisfaction survey completed
every 3 yrs
OCC Occupational
Associated with career and technical
programs
PACE Personal Assessment of the College IVCC staff survey completed every 3 yrs
PCCS Partnership for College and Career Success
Credit hours of students associated with
high school career programs, earning
college credit.
SCC Sheridan Correctional Center
IVCC has a contract to provide
educational services at this institution.
40
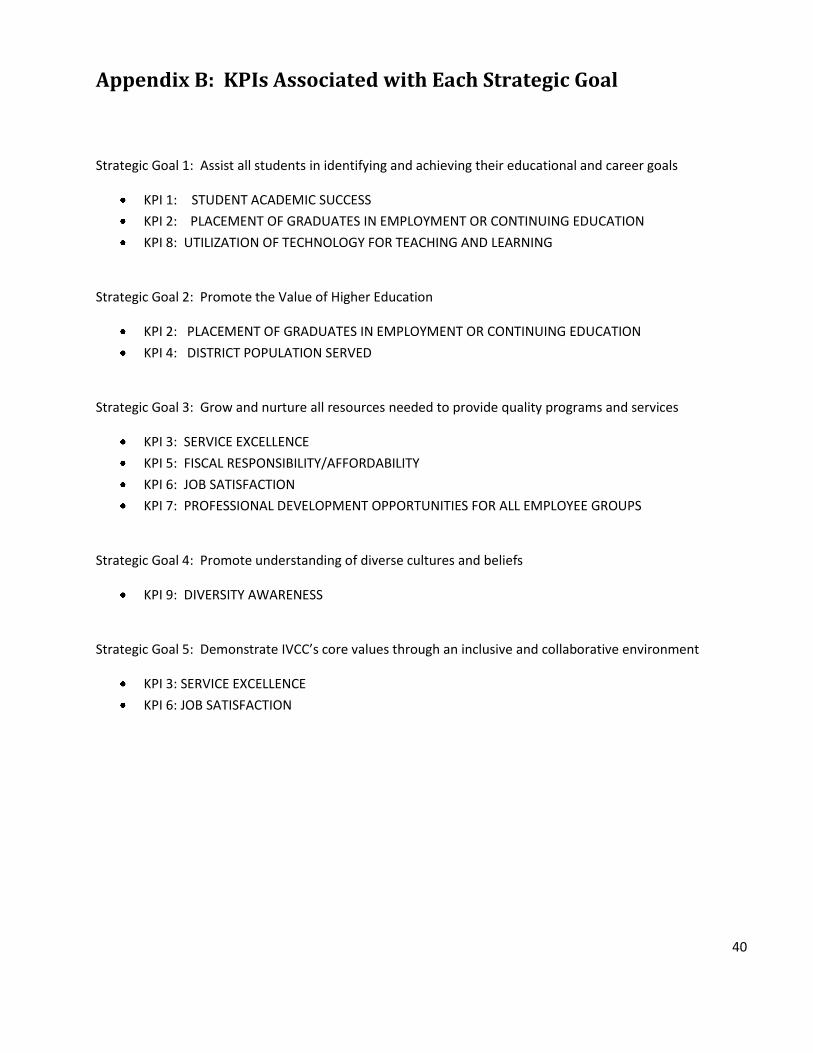
Appendix B: KPIs Associated with Each Strategic Goal
Strategic Goal 1: Assist all students in identifying and achieving their educational and career goals
KPI 1: STUDENT ACADEMIC SUCCESS
KPI 2: PLACEMENT OF GRADUATES IN EMPLOYMENT OR CONTINUING EDUCATION
KPI 8: UTILIZATION OF TECHNOLOGY FOR TEACHING AND LEARNING
Strategic Goal 2: Promote the Value of Higher Education
KPI 2: PLACEMENT OF GRADUATES IN EMPLOYMENT OR CONTINUING EDUCATION
KPI 4: DISTRICT POPULATION SERVED
Strategic Goal 3: Grow and nurture all resources needed to provide quality programs and services
KPI 3: SERVICE EXCELLENCE
KPI 5: FISCAL RESPONSIBILITY/AFFORDABILITY
KPI 6: JOB SATISFACTION
KPI 7: PROFESSIONAL DEVELOPMENT OPPORTUNITIES FOR ALL EMPLOYEE GROUPS
Strategic Goal 4: Promote understanding of diverse cultures and beliefs
KPI 9: DIVERSITY AWARENESS
Strategic Goal 5: Demonstrate IVCC’s core values through an inclusive and collaborative environment
KPI 3: SERVICE EXCELLENCE
KPI 6: JOB SATISFACTION
41
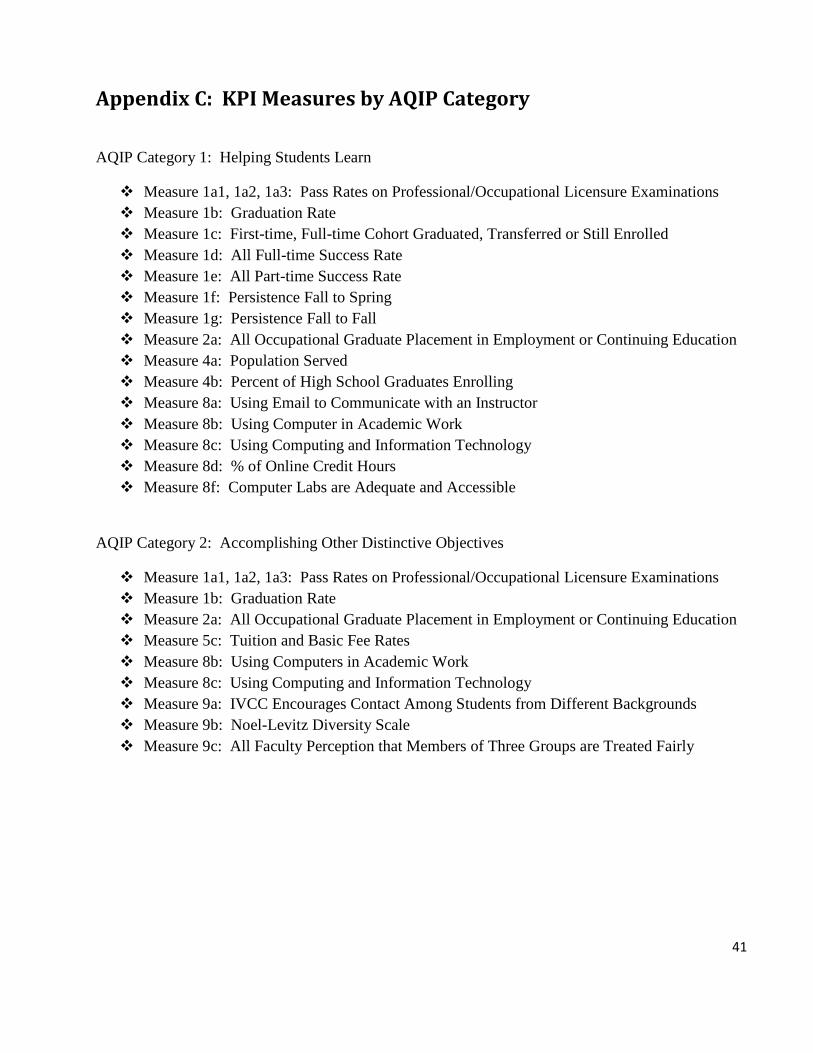
Appendix C: KPI Measures by AQIP Category
AQIP Category 1: Helping Students Learn
Measure 1a1, 1a2, 1a3: Pass Rates on Professional/Occupational Licensure Examinations
Measure 1b: Graduation Rate
Measure 1c: First-time, Full-time Cohort Graduated, Transferred or Still Enrolled
Measure 1d: All Full-time Success Rate
Measure 1e: All Part-time Success Rate
Measure 1f: Persistence Fall to Spring
Measure 1g: Persistence Fall to Fall
Measure 2a: All Occupational Graduate Placement in Employment or Continuing Education
Measure 4a: Population Served
Measure 4b: Percent of High School Graduates Enrolling
Measure 8a: Using Email to Communicate with an Instructor
Measure 8b: Using Computer in Academic Work
Measure 8c: Using Computing and Information Technology
Measure 8d: % of Online Credit Hours
Measure 8f: Computer Labs are Adequate and Accessible
AQIP Category 2: Accomplishing Other Distinctive Objectives
Measure 1a1, 1a2, 1a3: Pass Rates on Professional/Occupational Licensure Examinations
Measure 1b: Graduation Rate
Measure 2a: All Occupational Graduate Placement in Employment or Continuing Education
Measure 5c: Tuition and Basic Fee Rates
Measure 8b: Using Computers in Academic Work
Measure 8c: Using Computing and Information Technology
Measure 9a: IVCC Encourages Contact Among Students from Different Backgrounds
Measure 9b: Noel-Levitz Diversity Scale
Measure 9c: All Faculty Perception that Members of Three Groups are Treated Fairly
42
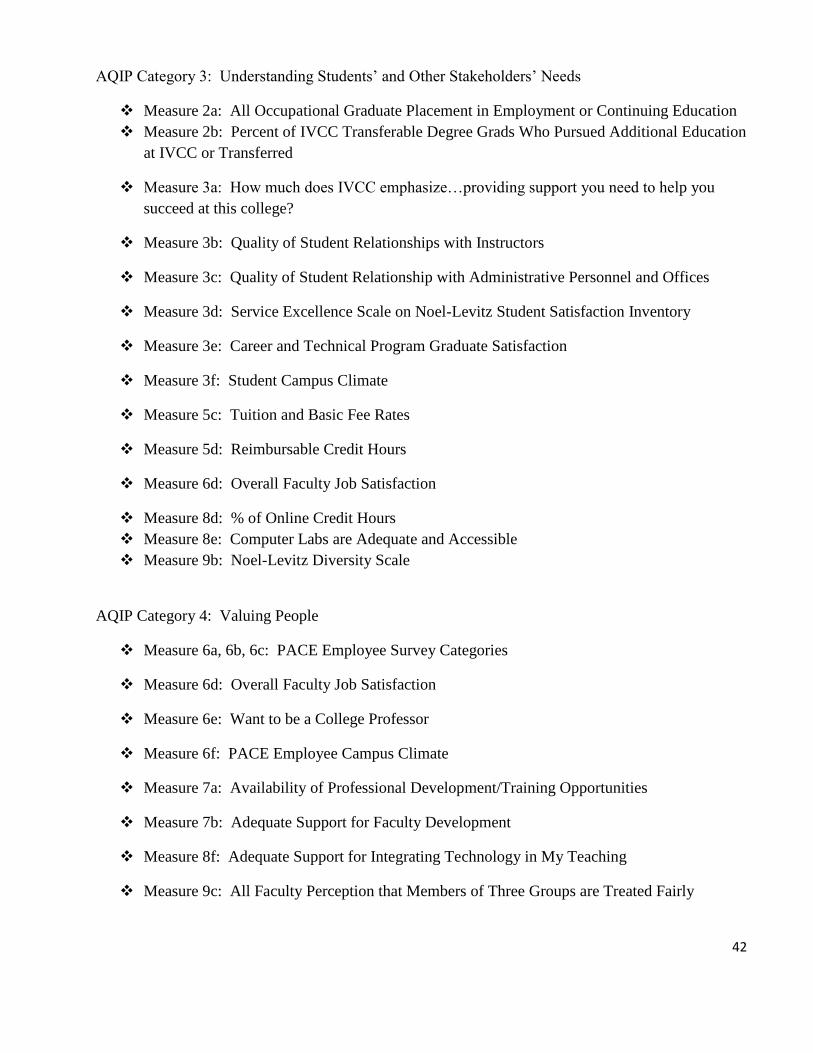
AQIP Category 3: Understanding Students’ and Other Stakeholders’ Needs
Measure 2a: All Occupational Graduate Placement in Employment or Continuing Education
Measure 2b: Percent of IVCC Transferable Degree Grads Who Pursued Additional Education
at IVCC or Transferred
Measure 3a: How much does IVCC emphasize…providing support you need to help you
succeed at this college?
Measure 3b: Quality of Student Relationships with Instructors
Measure 3c: Quality of Student Relationship with Administrative Personnel and Offices
Measure 3d: Service Excellence Scale on Noel-Levitz Student Satisfaction Inventory
Measure 3e: Career and Technical Program Graduate Satisfaction
Measure 3f: Student Campus Climate
Measure 5c: Tuition and Basic Fee Rates
Measure 5d: Reimbursable Credit Hours
Measure 6d: Overall Faculty Job Satisfaction
Measure 8d: % of Online Credit Hours
Measure 8e: Computer Labs are Adequate and Accessible
Measure 9b: Noel-Levitz Diversity Scale
AQIP Category 4: Valuing People
Measure 6a, 6b, 6c: PACE Employee Survey Categories
Measure 6d: Overall Faculty Job Satisfaction
Measure 6e: Want to be a College Professor
Measure 6f: PACE Employee Campus Climate
Measure 7a: Availability of Professional Development/Training Opportunities
Measure 7b: Adequate Support for Faculty Development
Measure 8f: Adequate Support for Integrating Technology in My Teaching
Measure 9c: All Faculty Perception that Members of Three Groups are Treated Fairly
43
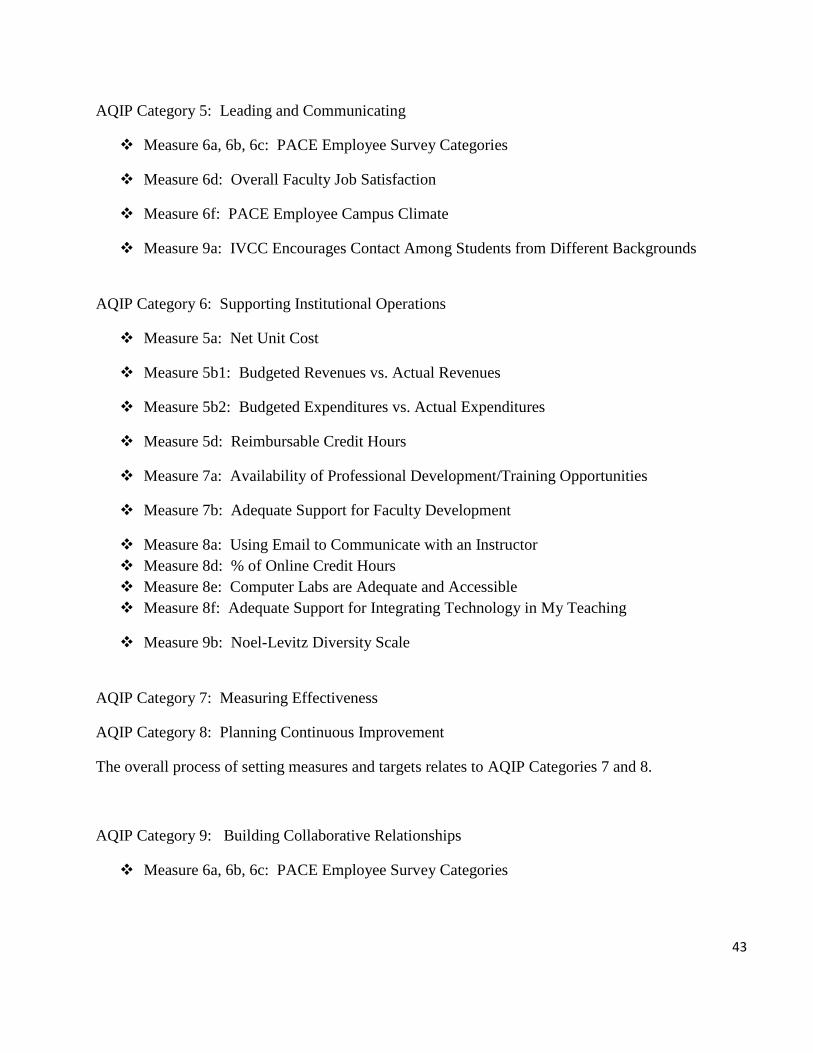
AQIP Category 5: Leading and Communicating
Measure 6a, 6b, 6c: PACE Employee Survey Categories
Measure 6d: Overall Faculty Job Satisfaction
Measure 6f: PACE Employee Campus Climate
Measure 9a: IVCC Encourages Contact Among Students from Different Backgrounds
AQIP Category 6: Supporting Institutional Operations
Measure 5a: Net Unit Cost
Measure 5b1: Budgeted Revenues vs. Actual Revenues
Measure 5b2: Budgeted Expenditures vs. Actual Expenditures
Measure 5d: Reimbursable Credit Hours
Measure 7a: Availability of Professional Development/Training Opportunities
Measure 7b: Adequate Support for Faculty Development
Measure 8a: Using Email to Communicate with an Instructor
Measure 8d: % of Online Credit Hours
Measure 8e: Computer Labs are Adequate and Accessible
Measure 8f: Adequate Support for Integrating Technology in My Teaching
Measure 9b: Noel-Levitz Diversity Scale
AQIP Category 7: Measuring Effectiveness
AQIP Category 8: Planning Continuous Improvement
The overall process of setting measures and targets relates to AQIP Categories 7 and 8.
AQIP Category 9: Building Collaborative Relationships
Measure 6a, 6b, 6c: PACE Employee Survey Categories
Related Documents