Welcome message from author
This document is posted to help you gain knowledge. Please leave a comment to let me know what you think about it! Share it to your friends and learn new things together.
Transcript
EUROPEAN ORGANIZATION FOR NUCLEAR RESEARCH
CERN{PPE/94{08
12 January 1994
Measurements of the Lineshape of
the Z� and Determination of
Electroweak Parameters from its
Hadronic and Leptonic Decays
DELPHI Collaboration
Abstract
During the LEP running periods in 1990 and 1991 DELPHI has accumulated ap-proximately 450,000 Z0 decays into hadrons and charged leptons. The increasedevent statistics coupled with improved analysis techniques and improved knowl-edge of the LEP beam energies permit signi�cantly better measurements of themass and width of the Z0 resonance. Model independent �ts to the cross sectionsand leptonic forward-backward asymmetries yield the following Z0 parameters:the mass and total width M
Z= 91:187 � 0:009 GeV, �
Z= 2:486 � 0:012 GeV,
the hadronic and leptonic partial widths �had = 1:725 � 0:012 GeV, �l =83:01 � 0:52 MeV, the invisible width �inv = 512 � 10 MeV, the ratio ofhadronic to leptonic partial widths Rl = 20:78 � 0:15, and the Born levelhadronic peak cross section �0 = 40:90 � 0:28 nb. Using these results andthe value of �s determined from DELPHI data, the number of light neu-trino species is determined to be 3:08 � 0:05. The individual leptonic widthsare found to be: �e = 82:93 � 0:70 MeV, �� = 83:20 � 1:11 MeV and�� = 82:89 � 1:31 MeV. Using the measured leptonic forward-backward asym-metries and assuming lepton universality, the squared vector and axial-vectorcouplings of the Z0 to charged leptons are found to be g2Vl = (1:47�0:51)�10�3
and g2Al= 0:2483 � 0:0016. A full Standard Model �t to the data yields a
value of the top mass mt = 115+52�82(expt:)
+23�24(Higgs) GeV, corresponding to a
value of the weak mixing angle sin2� lepteff = 0:2339�0:0015(expt:)+0:0001
�0:0004(Higgs).Values are obtained for the variables S and T, or �1 and �3 which parameterizeelectroweak loop e�ects.
(To be submitted to Nuclear Physics B)
ii
P.Abreu20, W.Adam7, T.Adye37, E.Agasi30, R.Aleksan39 , G.D.Alekseev14 , A.Algeri13 , P.Allport21 ,
S.Almehed23 , F.M.L.Almeida Junior48 , S.J.Alvsvaag4, U.Amaldi7, A.Andreazza27, P.Antilogus24 , W-D.Apel15 ,
R.J.Apsimon37, Y.Arnoud39, B.�Asman45, J-E.Augustin18 , A.Augustinus30 , P.Baillon7 , P.Bambade18, F.Barao20,
R.Barate12, G.Barbiellini47 , D.Y.Bardin14 , G.J.Barker34, A.Baroncelli41 , O.Barring7 , J.A.Barrio25, W.Bartl51 ,
M.J.Bates37, M.Battaglia13 , M.Baubillier22 , K-H.Becks53, M.Begalli36 , P.Beilliere6 , Yu.Belokopytov43 ,
P.Beltran9, A.C.Benvenuti5, M.Berggren18 , D.Bertrand2 , F.Bianchi46 , M.Bigi46 , M.S.Bilenky14 , P.Billoir22 ,
J.Bjarne23, D.Bloch8 , J.Blocki52 , S.Blyth34 , V.Bocci38 , P.N.Bogolubov14 , T.Bolognese39 , M.Bonesini27 ,
W.Bonivento27 , P.S.L.Booth21, G.Borisov43 , C.Bosio41 , B.Bostjancic44 , S.Bosworth34, O.Botner49,
E.Boudinov43 , B.Bouquet18 , C.Bourdarios18 , T.J.V.Bowcock21, M.Bozzo11, S.Braibant2 , P.Branchini41 ,
K.D.Brand35, R.A.Brenner13, H.Briand22 , C.Bricman2 , L.Brillault22 , R.C.A.Brown7, P.Bruckman16 ,
J-M.Brunet6, A.Budziak16 , L.Bugge32 , T.Buran32, A.Buys7, J.A.M.A.Buytaert7, M.Caccia27, M.Calvi27 ,
A.J.Camacho Rozas42 , R.Campion21 , T.Camporesi7, V.Canale38, K.Cankocak45 , F.Cao2, F.Carena7,
P.Carrilho48 , L.Carroll21, C.Caso11, M.V.Castillo Gimenez50 , A.Cattai7, F.R.Cavallo5, L.Cerrito38,
V.Chabaud7, A.Chan1, Ph.Charpentier7 , J.Chauveau22, P.Checchia35, G.A.Chelkov14, L.Chevalier39 ,
P.Chliapnikov43 , V.Chorowicz22, J.T.M.Chrin50, V.Cindro44, P.Collins34 , J.L.Contreras18, R.Contri11 ,
E.Cortina50, G.Cosme18, F.Couchot18, H.B.Crawley1, D.Crennell37 , G.Crosetti11, J.Cuevas Maestro33 ,
S.Czellar13 , E.Dahl-Jensen28 , J.Dahm53, B.Dalmagne18 , M.Dam32, G.Damgaard28, E.Daubie2 , A.Daum15,
P.D.Dauncey7, M.Davenport7 , J.Davies21, W.Da Silva22 , C.Defoix6, P.Delpierre26 , N.Demaria46 ,
A.De Angelis7 , H.De Boeck2, W.De Boer15, S.De Brabandere2 , C.De Clercq2, M.D.M.De Fez Laso50,
C.De La Vaissiere22 , B.De Lotto47, A.De Min27 , L.De Paula48 , H.Dijkstra7, L.Di Ciaccio38 , F.Djama8,
J.Dolbeau6 , M.Donszelmann7 , K.Doroba52, M.Dracos8, J.Drees53, M.Dris31, Y.Dufour7, F.Dupont12 , D.Edsall1 ,
L-O.Eek49, R.Ehret15, T.Ekelof49, G.Ekspong45 , A.Elliot Peisert7 , M.Elsing53 , J-P.Engel8, N.Ershaidat22 ,
M.Espirito Santo20, V.Falaleev43 , D.Fassouliotis31 , M.Feindt7 , A.Ferrer50, T.A.Filippas31 , A.Firestone1 ,
H.Foeth7, E.Fokitis31 , F.Fontanelli11 , K.A.J.Forbes21, J-L.Fousset26, S.Francon24, B.Franek37 , P.Frenkiel6 ,
D.C.Fries15, A.G.Frodesen4, R.Fruhwirth51 , F.Fulda-Quenzer18 , H.Furstenau7, J.Fuster7, D.Gamba46 ,
M.Gandelman17 , C.Garcia50, J.Garcia42, C.Gaspar7, U.Gasparini35 , Ph.Gavillet7 , E.N.Gazis31, J-P.Gerber8,
P.Giacomelli7 , D.Gillespie7 , R.Gokieli52 , B.Golob44 , V.M.Golovatyuk14 , J.J.Gomez Y Cadenas7, G.Gopal37 ,
L.Gorn1, M.Gorski52 , V.Gracco11, F.Grard2, E.Graziani41 , G.Grosdidier18 , B.Grossetete22, P.Gunnarsson45 ,
J.Guy37, U.Haedinger15, F.Hahn53, M.Hahn45, S.Hahn53, S.Haider30 , Z.Hajduk16, A.Hakansson23 ,
A.Hallgren49 , K.Hamacher53, G.Hamel De Monchenault39 , W.Hao30, F.J.Harris34, V.Hedberg23, R.Henriques20 ,
J.J.Hernandez50, J.A.Hernando50, P.Herquet2, H.Herr7, T.L.Hessing21, I.Hietanen13, C.O.Higgins21, E.Higon50 ,
H.J.Hilke7, T.S.Hill1, S.D.Hodgson34 , T.Hofmokl52, S-O.Holmgren45 , P.J.Holt34, D.Holthuizen30 , P.F.Honore6,
M.Houlden21 , J.Hrubec51, K.Huet2, K.Hultqvist45 , P.Ioannou3, P-S.Iversen4, J.N.Jackson21, R.Jacobsson45 ,
P.Jalocha16, G.Jarlskog23 , P.Jarry39, B.Jean-Marie18, E.K.Johansson45, M.Jonker7, L.Jonsson23, P.Juillot8 ,
G.Kalkanis3 , G.Kalmus37, F.Kapusta22 , M.Karlsson45 , E.Karvelas9 , S.Katsanevas3, E.C.Katsou�s31,
R.Keranen7, B.A.Khomenko14, N.N.Khovanski14, B.King21, N.J.Kjaer28, H.Klein7, A.Klovning4 , P.Kluit30 ,
A.Koch-Mehrin53 , J.H.Koehne15, B.Koene30, P.Kokkinias9 , M.Koratzinos32 , A.V.Korytov14, V.Kostioukhine43 ,
C.Kourkoumelis3 , O.Kouznetsov14, P.H.Kramer53, M.Krammer51, C.Kreuter15, J.Krolikowski52 , I.Kronkvist23 ,
W.Kucewicz16 , K.Kulka49 , K.Kurvinen13 , C.Lacasta50, C.Lambropoulos9 , J.W.Lamsa1, L.Lanceri47 ,
P.Langefeld53 , V.Lapin43, I.Last21, J-P.Laugier39, R.Lauhakangas13 , G.Leder51, F.Ledroit12, R.Leitner29 ,
Y.Lemoigne39 , J.Lemonne2, G.Lenzen53, V.Lepeltier18 , J.M.Levy8, E.Lieb53, J.Lindgren13 , R.Lindner53 ,
A.Lipniacka18 , I.Lippi35 , B.Loerstad23 , M.Lokajicek10 , J.G.Loken34, A.Lopez-Fernandez7, M.A.Lopez Aguera42,
M.Los30, D.Loukas9 , J.J.Lozano50, P.Lutz6, L.Lyons34 , G.Maehlum32 , J.Maillard6 , A.Maio20 , A.Maltezos9 ,
F.Mandl51 , J.Marco42, B.Marechal48 , M.Margoni35 , J-C.Marin7, C.Mariotti41 , A.Markou9, T.Maron53,
S.Marti50 , C.Martinez-Rivero42 , F.Martinez-Vidal50 , F.Matorras42, C.Matteuzzi27, G.Matthiae38 ,
M.Mazzucato35 , M.Mc Cubbin21 , R.Mc Kay1, R.Mc Nulty21 , J.Medbo49 , C.Meroni27 , W.T.Meyer1,
M.Michelotto35 , I.Mikulec51 , L.Mirabito24 , W.A.Mitaro�51 , G.V.Mitselmakher14 , U.Mjoernmark23, T.Moa45,
R.Moeller28 , K.Moenig7, M.R.Monge11 , P.Morettini11 , H.Mueller15 , W.J.Murray37, B.Muryn16 , G.Myatt34,
F.Naraghi12 , F.L.Navarria5, P.Negri27, S.Nemecek10, W.Neumann53, N.Neumeister51, R.Nicolaidou3 ,
B.S.Nielsen28 , V.Nikolaenko43 , P.E.S.Nilsen4, P.Niss45, A.Nomerotski35, V.Obraztsov43, A.G.Olshevski14 ,
R.Orava13, A.Ostankov43, K.Osterberg13, A.Ouraou39, P.Paganini18 , M.Paganoni27 , R.Pain22, H.Palka16 ,
Th.D.Papadopoulou31 , L.Pape7, F.Parodi11 , A.Passeri41, M.Pegoraro35 , J.Pennanen13 , L.Peralta20 ,
H.Pernegger51, M.Pernicka51 , A.Perrotta5, C.Petridou47 , A.Petrolini11 , G.Piana11 , F.Pierre39, M.Pimenta20 ,
S.Plaszczynski18 , O.Podobrin15 , M.E.Pol17, G.Polok16 , P.Poropat47, V.Pozdniakov14 , M.Prest47, P.Privitera38 ,
A.Pullia27 , D.Radojicic34 , S.Ragazzi27 , H.Rahmani31 , J.Rames10, P.N.Rato�19, A.L.Read32, M.Reale53 ,
P.Rebecchi18 , N.G.Redaelli27 , M.Regler51 , D.Reid7 , P.B.Renton34, L.K.Resvanis3 , F.Richard18 , J.Richardson21 ,
J.Ridky10 , G.Rinaudo46 , A.Romero46, I.Roncagliolo11 , P.Ronchese35, C.Ronnqvist13 , E.I.Rosenberg1, E.Rosso7,
P.Roudeau18 , T.Rovelli5 , W.Ruckstuhl30 , V.Ruhlmann-Kleider39 , A.Ruiz42, K.Rybicki16 , H.Saarikko13 ,
iii
Y.Sacquin39 , G.Sajot12, J.Salt50, J.Sanchez25, M.Sannino11;40 , S.Schael7, H.Schneider15 , M.A.E.Schyns53,
G.Sciolla46 , F.Scuri47, A.M.Segar34, A.Seitz15, R.Sekulin37 , M.Sessa47, R.Seufert15, R.C.Shellard36 ,
I.Siccama30 , P.Siegrist39 , S.Simonetti11 , F.Simonetto35 , A.N.Sisakian14 , G.Skjevling32 , G.Smadja39;24 ,
N.Smirnov43 , O.Smirnova14 , G.R.Smith37 , R.Sosnowski52 , D.Souza-Santos36 , T.Spassov20, E.Spiriti41 ,
S.Squarcia11 , H.Staeck53, C.Stanescu41 , S.Stapnes32 , G.Stavropoulos9 , F.Stichelbaut7 , A.Stocchi18, J.Strauss51,
J.Straver7, R.Strub8, B.Stugu4, M.Szczekowski52 , M.Szeptycka52 , P.Szymanski52 , T.Tabarelli27 , O.Tchikilev43 ,
G.E.Theodosiou9 , Z.Thome48, A.Tilquin26 , J.Timmermans30, V.G.Timofeev14, L.G.Tkatchev14, T.Todorov8,
D.Z.Toet30, O.Toker13, A.Tomaradze2, B.Tome20, E.Torassa46, L.Tortora41, D.Treille7 , W.Trischuk7 ,
G.Tristram6, C.Troncon27, A.Tsirou7, E.N.Tsyganov14, M.Turala16, M-L.Turluer39, T.Tuuva13, I.A.Tyapkin22 ,
M.Tyndel37 , S.Tzamarias21, B.Ueberschaer53 , S.Ueberschaer53, O.Ullaland7 , V.Uvarov43, G.Valenti5 ,
E.Vallazza7 , J.A.Valls Ferrer50, C.Vander Velde2, G.W.Van Apeldoorn30 , P.Van Dam30, M.Van Der Heijden30 ,
W.K.Van Doninck2 , J.Van Eldik30 , P.Vaz7, G.Vegni27, L.Ventura35, W.Venus37, F.Verbeure2, M.Verlato35,
L.S.Vertogradov14, D.Vilanova39 , P.Vincent24, L.Vitale47, E.Vlasov43 , A.S.Vodopyanov14 , M.Vollmer53 ,
M.Voutilainen13 , V.Vrba10, H.Wahlen53 , C.Walck45, F.Waldner47 , A.Wehr53, M.Weierstall53 , P.Weilhammer7 ,
A.M.Wetherell7 , J.H.Wickens2, M.Wielers15 , G.R.Wilkinson34 , W.S.C.Williams34 , M.Winter8 , G.Wormser18,
K.Woschnagg49 , A.Zaitsev43, A.Zalewska16 , L.Zanini46 , D.Zavrtanik44 , E.Zevgolatakos9 , N.I.Zimin14, M.Zito39 ,
D.Zontar44 , R.Zuberi34 , G.Zumerle35 , J.Zuniga50
1Ames Laboratory and Department of Physics, Iowa State University, Ames IA 50011, USA2Physics Department, Univ. Instelling Antwerpen, Universiteitsplein 1, B-2610 Wilrijk, Belgiumand IIHE, ULB-VUB, Pleinlaan 2, B-1050 Brussels, Belgiumand Facult�e des Sciences, Univ. de l'Etat Mons, Av. Maistriau 19, B-7000 Mons, Belgium3Physics Laboratory, University of Athens, Solonos Str. 104, GR-10680 Athens, Greece4Department of Physics, University of Bergen, All�egaten 55, N-5007 Bergen, Norway5Dipartimento di Fisica, Universit�a di Bologna and INFN, Via Irnerio 46, I-40126 Bologna, Italy6Coll�ege de France, Lab. de Physique Corpusculaire, IN2P3-CNRS, F-75231 Paris Cedex 05, France7CERN, CH-1211 Geneva 23, Switzerland8Centre de Recherche Nucl�eaire, IN2P3 - CNRS/ULP - BP20, F-67037 Strasbourg Cedex, France9Institute of Nuclear Physics, N.C.S.R. Demokritos, P.O. Box 60228, GR-15310 Athens, Greece10FZU, Inst. of Physics of the C.A.S. High Energy Physics Division, Na Slovance 2, CS-180 40, Praha 8, Czechoslovakia11Dipartimento di Fisica, Universit�a di Genova and INFN, Via Dodecaneso 33, I-16146 Genova, Italy12Institut des Sciences Nucl�eaires, IN2P3-CNRS, Universit�e de Grenoble 1, F-38026 Grenoble, France13Research Institute for High Energy Physics, SEFT, P.O. Box 9, FIN-00014 University of Helsinki, Finland14Joint Institute for Nuclear Research, Dubna, Head Post O�ce, P.O. Box 79, 101 000 Moscow, Russian Federation15Institut f�ur Experimentelle Kernphysik, Universit�at Karlsruhe, Postfach 6980, D-76128 Karlsruhe, Germany16High Energy Physics Laboratory, Institute of Nuclear Physics, Ul. Kawiory 26a, PL-30055 Krakow 30, Poland17Centro Brasileiro de Pesquisas F�isicas, rua Xavier Sigaud 150, RJ-22290 Rio de Janeiro, Brazil18Universit�e de Paris-Sud, Lab. de l'Acc�el�erateur Lin�eaire, IN2P3-CNRS, Bat 200, F-91405 Orsay, France19School of Physics and Materials, University of Lancaster, GB-Lancaster LA1 4YB, UK20LIP, IST, FCUL - Av. Elias Garcia, 14-1o, P-1000 Lisboa Codex, Portugal21Department of Physics, University of Liverpool, P.O. Box 147, GB-Liverpool L69 3BX, UK22LPNHE, IN2P3-CNRS, Universit�es Paris VI et VII, Tour 33 (RdC), 4 place Jussieu, F-75252 Paris Cedex 05, France23Department of Physics, University of Lund, S�olvegatan 14, S-22363 Lund, Sweden24Universit�e Claude Bernard de Lyon, IPNL, IN2P3-CNRS, F-69622 Villeurbanne Cedex, France25Universidad Complutense, Avda. Complutense s/n, E-28040 Madrid, Spain26Univ. d'Aix - Marseille II - CPP, IN2P3-CNRS, F-13288 Marseille Cedex 09, France27Dipartimento di Fisica, Universit�a di Milano and INFN, Via Celoria 16, I-20133 Milan, Italy28Niels Bohr Institute, Blegdamsvej 17, DK-2100 Copenhagen 0, Denmark29NC, Nuclear Centre of MFF, Charles University, Areal MFF, V Holesovickach 2, CS-180 00, Praha 8, Czechoslovakia30NIKHEF-H, Postbus 41882, NL-1009 DB Amsterdam, The Netherlands31National Technical University, Physics Department, Zografou Campus, GR-15773 Athens, Greece32Physics Department, University of Oslo, Blindern, N-1000 Oslo 3, Norway33Dpto. Fisica, Univ. Oviedo, C/P.Jimenez Casas, S/N-33006 Oviedo, Spain34Department of Physics, University of Oxford, Keble Road, Oxford OX1 3RH, UK35Dipartimento di Fisica, Universit�a di Padova and INFN, Via Marzolo 8, I-35131 Padua, Italy36Depto. de Fisica, Ponti�cia Univ. Cat�olica, C.P. 38071 RJ-22453 Rio de Janeiro, Brazil37Rutherford Appleton Laboratory, Chilton, GB - Didcot OX11 OQX, UK38Dipartimento di Fisica, Universit�a di Roma II and INFN, Tor Vergata, I-00173 Rome, Italy39Centre d'Etude de Saclay, DSM/DAPNIA, F-91191 Gif-sur-Yvette Cedex, France40Dipartimento di Fisica-Universit�a di Salerno, I-84100 Salerno, Italy41Istituto Superiore di Sanit�a, Ist. Naz. di Fisica Nucl. (INFN), Viale Regina Elena 299, I-00161 Rome, Italy42C.E.A.F.M., C.S.I.C. - Univ. Cantabria, Avda. los Castros, S/N-39006 Santander, Spain43Inst. for High Energy Physics, Serpukov P.O. Box 35, Protvino, (Moscow Region), Russian Federation44J. Stefan Institute and Department of Physics, University of Ljubljana, Jamova 39, SI-61000 Ljubljana, Slovenia45Fysikum, Stockholm University, Box 6730, S-113 85 Stockholm, Sweden46Dipartimento di Fisica Sperimentale, Universit�a di Torino and INFN, Via P. Giuria 1, I-10125 Turin, Italy47Dipartimento di Fisica, Universit�a di Trieste and INFN, Via A. Valerio 2, I-34127 Trieste, Italyand Istituto di Fisica, Universit�a di Udine, I-33100 Udine, Italy
48Univ. Federal do Rio de Janeiro, C.P. 68528 Cidade Univ., Ilha do Fund~ao BR-21945-970 Rio de Janeiro, Brazil49Department of Radiation Sciences, University of Uppsala, P.O. Box 535, S-751 21 Uppsala, Sweden50IFIC, Valencia-CSIC, and D.F.A.M.N., U. de Valencia, Avda. Dr. Moliner 50, E-46100 Burjassot (Valencia), Spain51Institut f�ur Hochenergiephysik, �Osterr. Akad. d. Wissensch., Nikolsdorfergasse 18, A-1050 Vienna, Austria52Inst. Nuclear Studies and University of Warsaw, Ul. Hoza 69, PL-00681 Warsaw, Poland53Fachbereich Physik, University of Wuppertal, Postfach 100 127, D-5600 Wuppertal 1, Germany
1
1 Introduction
The study of the lineshape of the Z0 resonance and the analysis of its hadronic andleptonic decays is of primary importance in the determination of the parameters of theelectroweak theory. The mass of the Z0 is a fundamental parameter of the theory. Thehadronic and leptonic decay widths, and the leptonic forward-backward asymmetries, aresensitive to the as yet unknown masses of the top quark and Higgs boson. Within thecontext of the Standard Model, the decay width of the Z0 into invisible channels allowsan accurate determination of the number of light neutrino species. Although previousmeasurements have ruled out two or four conventional neutrino species, it is neverthelessimportant to measure the number of neutrino species as accurately as possible in orderto limit non-standard models, or conversely, to show evidence for physics beyond theStandard Model.
In ref. [1], measurements of the Z0 parameters were reported based on an integrated lu-minosity of approximately 6.5 pb�1 accumulated by DELPHI during 1989 and 1990. Thepresent paper gives details of the data collected in 1991, corresponding to approximately10 pb�1, taken at 7 di�erent centre-of-mass energies in a scan around the Z0 peak. Com-pared to the previously published results, the 1991 data bene�tted from smaller statisti-cal and systematic uncertainties. The absolute luminosity was determined, as previously,from the Small Angle Tagger (SAT). However the relative luminosities at the di�erentscan energies were measured by the Very Small Angle Tagger (VSAT), thereby e�ectivelyeliminating the statistical errors of the SAT measurement and giving a substantial gain inthe overall sensitivity of the measurements. In the light of improved understanding of theSAT monitor, the cross sections of ref. [1] have been re-evaluated with reduced systematicerrors. A crucial element of the 1991 scan was the improvement in the understandingof the LEP machine energies as a result of the measurements by the process of resonantdepolarization [2].
This paper is organised as follows. In Section 2 some details of the LEP energy deter-minations are given. Section 3 contains a brief description of the DELPHI detector andtrigger system. In Section 4 accounts are given of the absolute luminosity measurementusing the SAT, and of the relative luminosity measurements using the VSAT. The selec-tion of hadronic decays and the measurement of the hadronic cross section are describedin Section 5. Section 6 contains an account of the selection of leptonic Z0 decays, the de-termination of the cross sections and the measurement of forward-backward asymmetries.In Section 7 the results of �ts to the data are reported and in Section 8 interpretationswithin the context of the Standard Model are given. Fits in terms of parameters which aresensitive to physics beyond the Standard Model are presented in Section 9, and Section10 gives limits on the possible contribution of new particle production to the measuredwidth and invisible width of the Z0. Section 11 gives a summary of the results.
2 The Energy of the LEP Beams
Resonant depolarization of the electron beam at 46.5 GeV was observed on �ve sepa-rate occasions during the 1991 data-taking period. These results have been published [2].The temperatures of the LEP magnets were carefully monitored during the depolariza-tion measurements and throughout the scans. For each of the LEP �lls an energy is givenwhich takes account of temperature and aging e�ects and the non-linear response of theLEP magnets. The principal uncertainties are as follows.

2
� The absolute energy scale is determined with a precision of �5:3 MeV at 93 GeVcentre-of-mass energy (
ps) by resonant depolarization of the electron beam.
� For the other collision energies a local energy scale correction is applied to accountfor the non-linear response of the dipole magnets. The uncertainty in this correctionis fully correlated energy-to-energy, and is up to �7:5 MeV at 88 GeV.
� An uncertainty is included for non-reproducibility. This includes the observed spreadof the polarization measurements and uncertainties due to temperature e�ects andthe status of the radiofrequency accelerating cavities. This uncertainty is uncorre-lated energy-to-energy and �ll-to-�ll. It is estimated to be �10�4ps, and decreasesinversely as the square root of the number of �lls at a given energy.
� Point-to-point errors are included to allow for higher order terms in the non-linearitycorrection. These are random energy-to-energy, and amount to �3 � 10�5ps.
� The energies for the 1990 runs have been re-evaluated using the most recent infor-mation. The absolute energy scale of the 1990 data is assigned an uncertainty of�26 MeV.
On 14th August 1991, just before the start of the systematic scan, the energy of theLEP beams showed a step of �15 MeV [3]. Data taken before this time (`pre-scan' points)have therefore a larger energy uncertainty and are treated separately in the �ts.
At each energy setting of the LEP machine the collision energies have a spread whichcan be approximated by a Gaussian of width 51 � 5 MeV.
In a recent publication [3] the precise LEP energy measurements combined with thedata of the LEP collaborations, including some of the data reported in this paper, havebeen used to determine an accurate value for the Z mass. The result, 91:187�0:007 GeV,includes an uncertainty of �6 MeV coming from the LEP energy measurements.
3 The Apparatus and Trigger System
A detailed description of the DELPHI apparatus can be found in ref. [4]. For thepresent analysis the following parts of the detector are relevant:
� for the measurement of charged particles the Microvertex Detector (VD), the InnerDetector (ID), the Time Projection Chamber (TPC), the Outer Detector(OD) andthe Forward Chambers A and B (FCA and FCB);
� for the measurement of electromagnetic energy the High-density Projection Chamber(HPC) and the Forward Electromagnetic Calorimeter (FEMC); these detectors werealso used for identifying minimum ionizing particles;
� for the measurement of the hadronic energy and muon identi�cation the HadronCalorimeter (HCAL), which covered both the barrel and endcap regions;
� for muon identi�cation the barrel (MUB) and endcap (MUF) muon chambers;� for the trigger, besides the detectors mentioned above, the barrel Time of Flightcounters (TOF), the endcap scintillators (HOF) and a scintillator layer embeddedin the HPC;
� for the measurement of luminosity (Section 4) the Small Angle Tagger (SAT) andthe Very Small Angle Tagger (VSAT).
A major improvement with respect to the 1990 running was the replacement of the two-layer Microvertex Detector in 1991 by one having three layers of silicon strip detectorssurrounding a beam pipe of reduced diameter. This detector now has a higher chance ofhaving two or more hits associated to a particle trajectory and this leads to a reductionin the momentum and vertex reconstruction errors in the barrel region [5].
3
The event trigger for the 1991 data is largely as described in refs. [1] and [4]. Howeverin addition a trigger based on the barrel muon chambers was used. The trigger e�cienciesfor the hadronic and leptonic events were measured in events taken with redundant triggercombinations. For hadronic events the trigger e�ciency was greater than 99.9% over thewhole angular range. For e+e� events the e�ciency was greater than 99.9% in the polarangle range between 44� and 136�, for �+�� events (99:9� 0:1)% between 20� and 160�,and for �+�� events (99:9 � 0:1)% between 25� and 155�.
A right-handed coordinate system is used in this paper. The z-axis points along theelectron beam direction, and the y-axis is vertical. The polar angle � is measured withrespect to the z-axis, and the azimuthal angle � is measured with respect to the horizontalplane.
4 The Luminosity Measurement
This section summarizes the progress in the luminositymeasurementmade by DELPHIsince the published results of the 1990 data [1]. The major steps of improvement are thefollowing:
� the published 1990 Small Angle Tagger luminosity data were re-analysed, leading toa smaller systematic uncertainty on the overall normalization;
� the absolute luminosity in 1991 was measured with the SAT with still better accuracythan in 1990;
� the 1991 relative point-to-point luminosity was also derived from the Bhabha ratemeasured with the Very Small Angle Tagger [6], for which the visible cross sectionis more than 15 times larger than for the SAT. This permits a reduction of about20% in the statistical uncertainties on the mass and the total width of the Z0.
4.1 The SAT Measurement
The SAT luminosity measurement is based on the observation of small angle Bhabhascattering in calorimeters consisting of lead sheets and plastic scintillating �bres, coveringthe polar angle range from 43 to 135 mrad. The �ducial region is accurately de�ned bya precisely machined lead mask in front of one of the calorimeters. An additional \�mask" covers �15� around the vertical junction between the two calorimeter half-barrels.Improvements to the detector and the analysis since the published results of the 1990data [1] are pointed out below.
4.1.1 SAT Triggers
The triggers for luminosity events were based on pulse-height sums of 24 channels in 24overlapping sectors of 30� per endcap. The primary Bhabha trigger required a coplanarcoincidence of energy depositions, each above 12 GeV (10 GeV in 1990). A secondaryBhabha trigger introduced for the 1991 data taking required a coincidence of energydepositions above 30 GeV without the coplanarity requirement. In order to measurethe Bhabha trigger e�ciency, events with a single energy deposition above 30 GeV weretriggered and, to keep the rate to a tolerable level, a fraction was selected for readout. Ofthe 9867 selected Bhabha events for which the single arm trigger was active, none weremissing the coincidence requirement. In addition, the fraction of Bhabha events withoutthe primary Bhabha trigger but with the secondary one was less than 10�4. The primarytrigger was thus essentially 100% e�cient with a statistical accuracy of about 0.02%.
4
A \delayed Bhabha" trigger (coincidence in one calorimeter with the other arm froma di�erent beam crossing) with the same 30 GeV thresholds and lack of coplanarityrequirement as the secondary Bhabha trigger, was used to monitor the o�-momentumelectron background during 1991. A similar trigger with 10 GeV thresholds was active in1990 but the relatively large rate made an extrapolation to the sample of selected Bhabhaevents very uncertain.
4.1.2 Event Selection
The event selection was based on the reconstructed energies and positions of the show-ers with the maximum number of readout elements in each calorimeter . A study ofradiative Bhabha events with three reconstructed showers showed that the fraction of ac-cepted Bhabha events in which the showers with maximum energy did not also have themaximum number of readout elements was less than 10�4. The acceptance was de�nedby the following selections on showers:
1. radius in the masked calorimeter inside the outer ring of readout elements;2. radius in the unmasked calorimeter more than 2.5 cm from the inner edge;3. less than half of the shower energy in the masked calorimeter in the inner ring of
readout elements;4. energy in each calorimeter greater than 0:65 � Ebeam;5. � angle in the masked calorimeter more than 8� from the vertical (y) axis.
Selections 1 and 2 were performed with the shower centroids but the precision ofthese selections was improved in the 1991 data by calibrating the calorimeter geometryto that of the silicon tracker (see Section 4.1.3). Selection 3 and, to a lesser extent,selection 4 were based on the e�ect of the acceptance masks on the energy depositionin the calorimeter. Selection 5 was used to reject the background caused by the tailof the showers penetrating the �-mask and the gap between the calorimeter halves andproducing spurious energy depositions in the photodiode readout system. By scanningrejected events the systematic uncertainty was estimated to be about the same as thefraction of the data removed by selection 5, namely 0:15%.
A correction was applied for a non-linear energy response which is not included in thedetector simulation. The correction function was �tted to the peak in the Bhabha energydistribution as a function of the LEP centre-of-mass energy. The low energy behaviourof this parameterization is in agreement with test beam data (3 - 9 GeV) taken with oneof the calorimeter modules in November 1990, and with the total energy seen in fullyreconstructed e+e� events. The e�ect of this correction together with the softer energyspectrum predicted by BHLUMI [7] brings the distribution of the minimum of the twoprimary shower energies of the data into excellent agreement with the simulation. Theuncertainty due to selection 4 is reduced to 0.25%, compared to the 0.4% estimated for theoriginal analysis of the 1990 data. This 0.25% error arises from the residual uncertaintyin the non-linear behaviour and the di�culty of resolving the separate components of thelow energy tail due to radiation, the edges of the masks and the details of the calorimeterresponse.
During the shutdown of LEP between 1991 and 1992 the geometry of the mask systemwas measured on a 3-D measurement machine that was precise to 3 �m. The masks weremeasured before and after dismounting and mounting both the calorimeter halves andthe two halves of the masks system several times. As a result of these measurementsand cross-checks with the detector geometry in the simulation, the luminosity had tobe corrected by +0.84%. A precision similar to the one quoted in ref. [1] (0.15%) is
5
estimated, but with an additional term of the same size to account for the observednon-reproducibility of the mounting operation.
4.1.3 The SAT Silicon Tracker
In 1991 a two-plane silicon tracker with radial pitch 1 mm and azimuthal segmentationof 5� was introduced and operated for one third of the beam crossings during the �rst 65%of the data taking. Distortions in the calorimeter position reconstruction were measuredby the tracker in events in which there were unambiguous 2-hit tracks pointing to theimpact point reconstructed by the calorimeter. In this way the two 0.25% uncertainties[1] on the acceptance cuts made by the calorimeter at the minimum scattering angleopposite the mask and the maximum scattering angle in the masked calorimeter arereduced to a single uncertainty of 0.1%. The residual uncertainty is primarily due tothe conservatively estimated 400 �m uncertainty in the diameter of the tracker and thelimited statistics of the data sample with the tracker active.
4.1.4 Backgrounds
The background of Bhabha events producing spurious large energy depositions belowthe acceptance of the ring mask was reduced by a factor of two in 1991 by inserting13 mm thick cylindrical lead masks inside the calorimeters. This shielding also served toreduce the single arm trigger rates, leading to an improved measurement of the triggere�ciency.
Backgrounds from two-photon processes and e+e� ! were calculated and foundto be negligible. The accidental coincidence of high energy o�-momentum electrons wasstudied with various techniques with the following results:
1. The rates of single o�-momentum electrons in each calorimeter were separately mea-sured. The probability of an accidental coincidence was calculated from these ratesto be less than 0:01%.
2. Extrapolating the tails of the acoplanarity distribution through the �20� region ofthe signal gave an upper limit for the background of 0:01%.
3. The number of delayed Bhabha triggers was less than 0:1% of the number of acceptedBhabha events. In addition, only a small fraction of the single showers (due to thenature of the trigger, it was not possible to read out both of the calorimeters) inthe delayed Bhabha events fell within the geometric acceptance of the luminositymeasurement.
4.1.5 The Theoretical Cross Section
The luminosity is the number of selected Bhabha events, corrected for backgroundsand ine�ciencies, divided by the theoretical cross section into the SAT acceptance, that isthe visible cross section �vis. The calculation of �vis was based on the detailed simulationof Bhabha events produced by the O(�) event generator BABAMC [8]. Higher ordercorrections were calculated with the event generator BHLUMI V2.01 [7]. The uncertaintyin the theoretical cross section is estimated to be 0.3%, which includes the 0.25% estimateof Jadach and co-workers [7] plus an additional contribution of 0.1% added because thehigher order corrections were made by reweighting the BABAMC events. The reweightingwas done according to the unsmeared minimum energy spectrum of the events acceptedby the analysis cuts. The electroweak corrections were computed with BABAMC andcon�rmed by the calculation in ref. [9].
6
The event generation and detector simulation were carried out at a centre-of-massenergy of 91:1 GeV. The visible cross section was found to be 27:09 nb, including higherorder and electroweak corrections. The extrapolation to other energies was performed bycorrecting for the 1=s dependence of QED and the energy variation of the electroweake�ects [7,9]. Ten times more simulated events, concentrated in the critical regions, wereused for this analysis than for the published 1990 results [1].
4.1.6 Results
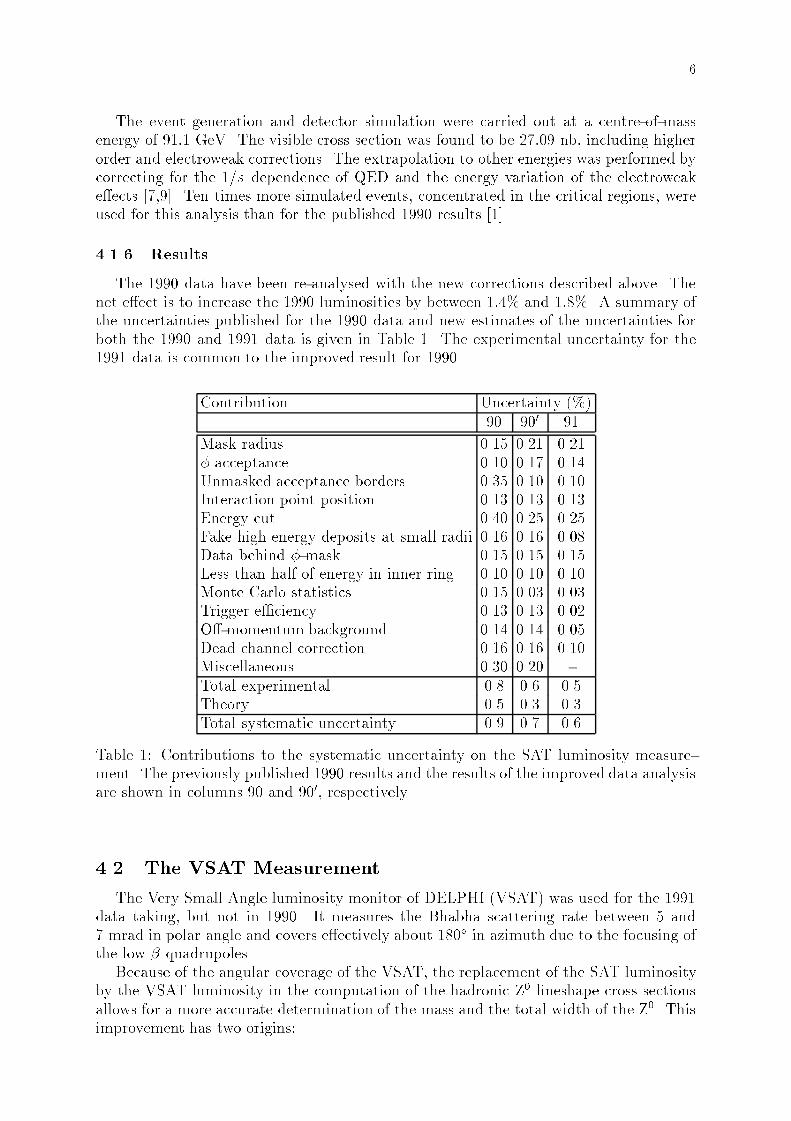
The 1990 data have been re-analysed with the new corrections described above. Thenet e�ect is to increase the 1990 luminosities by between 1:4% and 1:8%. A summary ofthe uncertainties published for the 1990 data and new estimates of the uncertainties forboth the 1990 and 1991 data is given in Table 1. The experimental uncertainty for the1991 data is common to the improved result for 1990.
Contribution Uncertainty (%)90 900 91
Mask radius 0.15 0.21 0.21� acceptance 0.10 0.17 0.14Unmasked acceptance borders 0.35 0.10 0.10Interaction point position 0.13 0.13 0.13Energy cut 0.40 0.25 0.25Fake high energy deposits at small radii 0.16 0.16 0.08Data behind �-mask 0.15 0.15 0.15Less than half of energy in inner ring 0.10 0.10 0.10Monte Carlo statistics 0.15 0.03 0.03Trigger e�ciency 0.13 0.13 0.02O�-momentum background 0.14 0.14 0.05Dead channel correction 0.16 0.16 0.10Miscellaneous 0.30 0.20 -
Total experimental 0.8 0.6 0.5Theory 0.5 0.3 0.3Total systematic uncertainty 0.9 0.7 0.6
Table 1: Contributions to the systematic uncertainty on the SAT luminosity measure-ment. The previously published 1990 results and the results of the improved data analysisare shown in columns 90 and 900, respectively.
4.2 The VSAT Measurement
The Very Small Angle luminosity monitor of DELPHI (VSAT) was used for the 1991data taking, but not in 1990. It measures the Bhabha scattering rate between 5 and7 mrad in polar angle and covers e�ectively about 180� in azimuth due to the focusing ofthe low � quadrupoles.
Because of the angular coverage of the VSAT, the replacement of the SAT luminosityby the VSAT luminosity in the computation of the hadronic Z0 lineshape cross sectionsallows for a more accurate determination of the mass and the total width of the Z0. Thisimprovement has two origins:
7
� the contribution of the Bhabha statistics to the statistical uncertainty in the crosssections, which is still sizeable for the hadronic lineshape determined with the SATluminosity, becomes almost negligible;
� the contribution of the electroweak interference to the visible cross section of theVSAT is negligible, contrary to the SAT which measures Bhabha events producedat larger polar angles. Thus the lineshape determined with the VSAT luminosity isfree of uncertainties related to the lack of knowledge of the energy dependence ofthe electroweak interference.
As to the absolute luminosity, the systematic errors, mainly connected to absolutegeometrical uncertainties and to theory, are larger for the VSAT than for the SAT.Therefore, for the purpose of the present lineshape determination, the data taken atthe Z0 peak are used to normalize the VSAT data to the SAT absolute luminosity.
A brief description of the detector is given below, followed by the main features of theanalysis. More details can be found in ref. [6].
The detector consists of 4 small electromagnetic calorimeter modules located symmet-rically in the horizontal plane around an elliptical section of the LEP beam pipe at 7.7 mon each side of the intersection point, immediately behind the low � superconductingquadrupoles.
The detector modules contain 12 tungsten absorbers of 2 radiation lengths, each in-terspaced with 11 full area silicon planes (FAD) for the energy measurement. The energy
resolution for transversely contained showers is 35%=qE(GeV). The electromagnetic
shower coordinates, in the horizontal (x) and vertical (y) directions, are given by siliconstrip planes with 1 mm pitch placed at 5 (x-plane), 7 (y-plane), and 9 (x-plane) radiationlengths, i.e. close to the shower maximum. The position resolution is about 200 �m.
The Bhabha selection was based on the following requirements:
� trigger coincidence between the modules on opposite sides of DELPHI, requiring anenergy deposition of at least 20 GeV in the central nine planes of each module;
� energy of both electrons larger than 70% of the beam energy;� reconstructed x and y positions of both electrons at least 1 mm from the detectoredges.
The analysis of events triggered by delayed back-to-back coincidences showed that thebackground due to accidentals amounted to about 0:3%.
Various simulations based on the BABAMC generator [8] were used as an overall cross-check of the performance of the detector and for producing a matrix which allowed theextraction of beam dependent corrections to the detector acceptance. The parameterswhich need to be considered are:
� interaction point position (x, y and z);� beam tilt (x0, y0);� beam width (�x, �y);� beam divergence (�x0, �y0);� quadrupole current (obtained from the low-� settings).
To determine the beam position, size, divergence and tilt, the distributions in x andy of the centroids of the showers produced by the Bhabha events measured in the stripplanes were analysed. Several features of these distributions are strictly correlated to thebeam parameters:
� the mean value of the di�erence in x between the opposite modules of each diagonalarm, �x, is mainly related to the beam position in x;
8
� the width of the �x-distribution, ��x, is mainly related to the beam divergence inx;
� the rate asymmetry , asy, between the two diagonal arms is related to the tilt in x;� similar beam parameters can be extracted in y, although the values are smaller andthe sensitivity much less.
The VSAT position measurements of the Bhabha pair can also be used to measure thelocation of the interaction point in x, y and z.
To correct for the variation of the accepted cross section as a function of the beamparameters, the values of the observables (�x, ��x, �y, ��y, asy) were averaged overapproximately 2500 Bhabha events, corresponding to about 5 nb�1 of integrated luminos-ity. The correction was expressed as an analytic function of these variables (and of the �setting parameters), with coe�cients determined by the simulation program. The majorsystematic errors are due to the corrections, and include the statistical and systematicerror on the observables, the errors on the correction coe�cients, the uncertainty fromthe detector edge cut, the energy cut and the trigger stability. Table 2 summarizes thevarious contributions to the systematic error.
Errors from the correction factors do not scale with statistics. However, they averageout when summing over all the data taken at a given energy point, leaving only a smallresidual.
The measurement errors which a�ect the values of the observables used to determinethe corrections due to variations in the beam parameters arise from:
� a statistical uncertainty related to the size of the data sample used to determine thevalues of the observables;
� biases in the position reconstruction, due to uctuations in the strip calibrationconstants, position reconstruction ine�ciencies, etc.. Such uctuations have beenmonitored in each machine �ll and found to have a completely negligible e�ect onthe accepted cross section, except for the detector edge cut which is discussed below;
� rapid variations of beam parameters such as the position or divergence, on a timescale of a few seconds or minutes, which cause a broadening of the measured dis-tributions. The e�ect of this on the acceptance was estimated by comparing theintegrated luminosity calculated with acceptance corrections evaluated as above, tothe luminosity of the same data sample with the corrections evaluated for a threetimes larger set of Bhabha events around a given data point. For a typical machine�ll, the comparison shows a di�erence of 0:03% in the calculated acceptance for �xand of 0:08% for ��x.
Uncertainties related to the �ducial region cut are dominated by the de�nition of theinner edge of the detector, where the rate is highest. Since events with maximum signalon the �rst strip are rejected, any uctuation in the calibration constants of the �rst twostrips will cause uctuations in the number of accepted events. An uncertainty in theluminosity of 0:04% at each energy point is attributed to this e�ect.
The energy calibration constants are rather stable and provide an absolute energymeasurement within 0:5%. However, to reduce the uctuations in the accepted events,the detector was recalibrated for each machine �ll to the beam energy. The conservativelyestimated 0:5% calibration uncertainty results in a 0:02% uncertainty for each energypoint.
The remaining errors due to variations in trigger e�ciency and background subtractionare negligible. The trigger e�ciency was found to be very stable and larger than 99:9%.
9
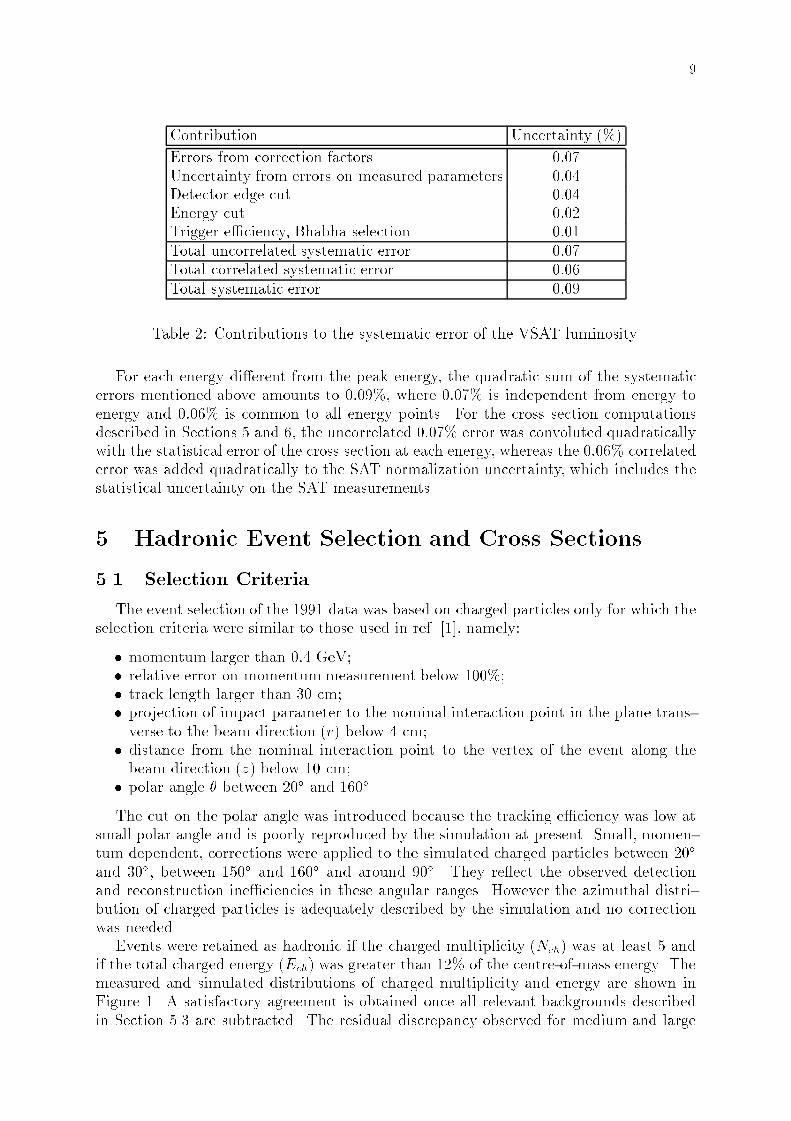
Contribution Uncertainty (%)
Errors from correction factors 0:07Uncertainty from errors on measured parameters 0:04Detector edge cut 0:04Energy cut 0:02Trigger e�ciency, Bhabha selection 0:01Total uncorrelated systematic error 0:07Total correlated systematic error 0:06Total systematic error 0:09
Table 2: Contributions to the systematic error of the VSAT luminosity.
For each energy di�erent from the peak energy, the quadratic sum of the systematicerrors mentioned above amounts to 0:09%, where 0:07% is independent from energy toenergy and 0:06% is common to all energy points. For the cross section computationsdescribed in Sections 5 and 6, the uncorrelated 0:07% error was convoluted quadraticallywith the statistical error of the cross section at each energy, whereas the 0:06% correlatederror was added quadratically to the SAT normalization uncertainty, which includes thestatistical uncertainty on the SAT measurements.
5 Hadronic Event Selection and Cross Sections
5.1 Selection Criteria
The event selection of the 1991 data was based on charged particles only for which theselection criteria were similar to those used in ref. [1], namely:
� momentum larger than 0:4 GeV;� relative error on momentum measurement below 100%;� track length larger than 30 cm;� projection of impact parameter to the nominal interaction point in the plane trans-verse to the beam direction (r) below 4 cm;
� distance from the nominal interaction point to the vertex of the event along thebeam direction (z) below 10 cm;
� polar angle � between 20� and 160�.
The cut on the polar angle was introduced because the tracking e�ciency was low atsmall polar angle and is poorly reproduced by the simulation at present. Small, momen-tum dependent, corrections were applied to the simulated charged particles between 20�
and 30�, between 150� and 160� and around 90�. They re ect the observed detectionand reconstruction ine�ciencies in these angular ranges. However the azimuthal distri-bution of charged particles is adequately described by the simulation and no correctionwas needed.
Events were retained as hadronic if the charged multiplicity (Nch) was at least 5 andif the total charged energy (Ech) was greater than 12% of the centre-of-mass energy. Themeasured and simulated distributions of charged multiplicity and energy are shown inFigure 1. A satisfactory agreement is obtained once all relevant backgrounds describedin Section 5.3 are subtracted. The residual discrepancy observed for medium and large
10
values of Ech is mainly attributed to di�erences in momentum resolution and trackinge�ciency between reality and the simulation, with a smaller fraction of the discrepancycoming from the choice of the generators and fragmentation functions used in the MonteCarlo program.
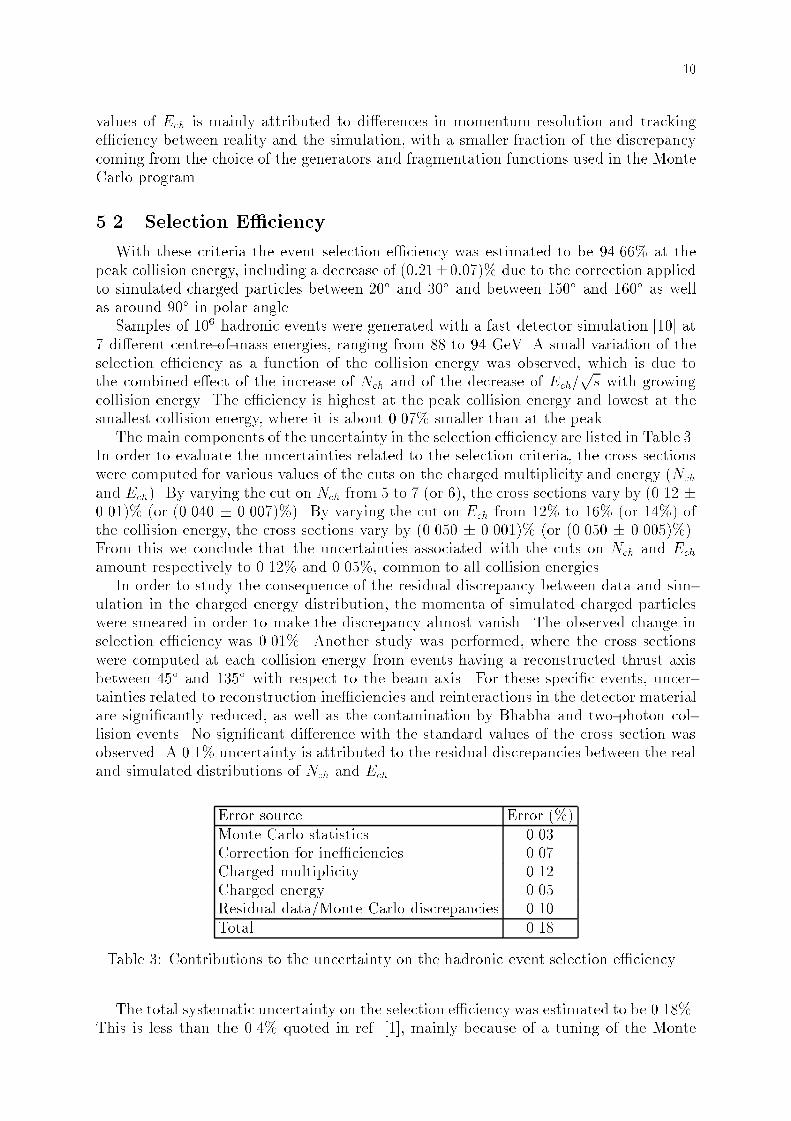
5.2 Selection E�ciency
With these criteria the event selection e�ciency was estimated to be 94.66% at thepeak collision energy, including a decrease of (0:21�0:07)% due to the correction appliedto simulated charged particles between 20� and 30� and between 150� and 160� as wellas around 90� in polar angle.
Samples of 106 hadronic events were generated with a fast detector simulation [10] at7 di�erent centre-of-mass energies, ranging from 88 to 94 GeV. A small variation of theselection e�ciency as a function of the collision energy was observed, which is due tothe combined e�ect of the increase of Nch and of the decrease of Ech=
ps with growing
collision energy. The e�ciency is highest at the peak collision energy and lowest at thesmallest collision energy, where it is about 0.07% smaller than at the peak.
The main components of the uncertainty in the selection e�ciency are listed in Table 3.In order to evaluate the uncertainties related to the selection criteria, the cross sectionswere computed for various values of the cuts on the charged multiplicity and energy (Nch
and Ech). By varying the cut on Nch from 5 to 7 (or 6), the cross sections vary by (0.12 �0.01)% (or (0.040 � 0.007)%). By varying the cut on Ech from 12% to 16% (or 14%) ofthe collision energy, the cross sections vary by (0.050 � 0.001)% (or (0.050 � 0.005)%).From this we conclude that the uncertainties associated with the cuts on Nch and Ech
amount respectively to 0.12% and 0.05%, common to all collision energies.In order to study the consequence of the residual discrepancy between data and sim-
ulation in the charged energy distribution, the momenta of simulated charged particleswere smeared in order to make the discrepancy almost vanish. The observed change inselection e�ciency was 0.01%. Another study was performed, where the cross sectionswere computed at each collision energy from events having a reconstructed thrust axisbetween 45� and 135� with respect to the beam axis. For these speci�c events, uncer-tainties related to reconstruction ine�ciencies and reinteractions in the detector materialare signi�cantly reduced, as well as the contamination by Bhabha and two-photon col-lision events. No signi�cant di�erence with the standard values of the cross section wasobserved. A 0.1% uncertainty is attributed to the residual discrepancies between the realand simulated distributions of Nch and Ech.
Error source Error (%)
Monte Carlo statistics 0.03Correction for ine�ciencies 0.07Charged multiplicity 0.12Charged energy 0.05Residual data/Monte Carlo discrepancies 0.10
Total 0.18
Table 3: Contributions to the uncertainty on the hadronic event selection e�ciency.
The total systematic uncertainty on the selection e�ciency was estimated to be 0.18%.This is less than the 0.4% quoted in ref. [1], mainly because of a tuning of the Monte
11
Carlo generation parameters, of a better simulation of the secondary interactions in thedetector material and a better understanding of the momentum resolution. These im-provements result in a better agreement between simulated and measured charged energyand multiplicity distributions.
A total of 243,000 events was selected in 1991, corresponding to an integrated lumi-nosity of 10.7 pb�1.
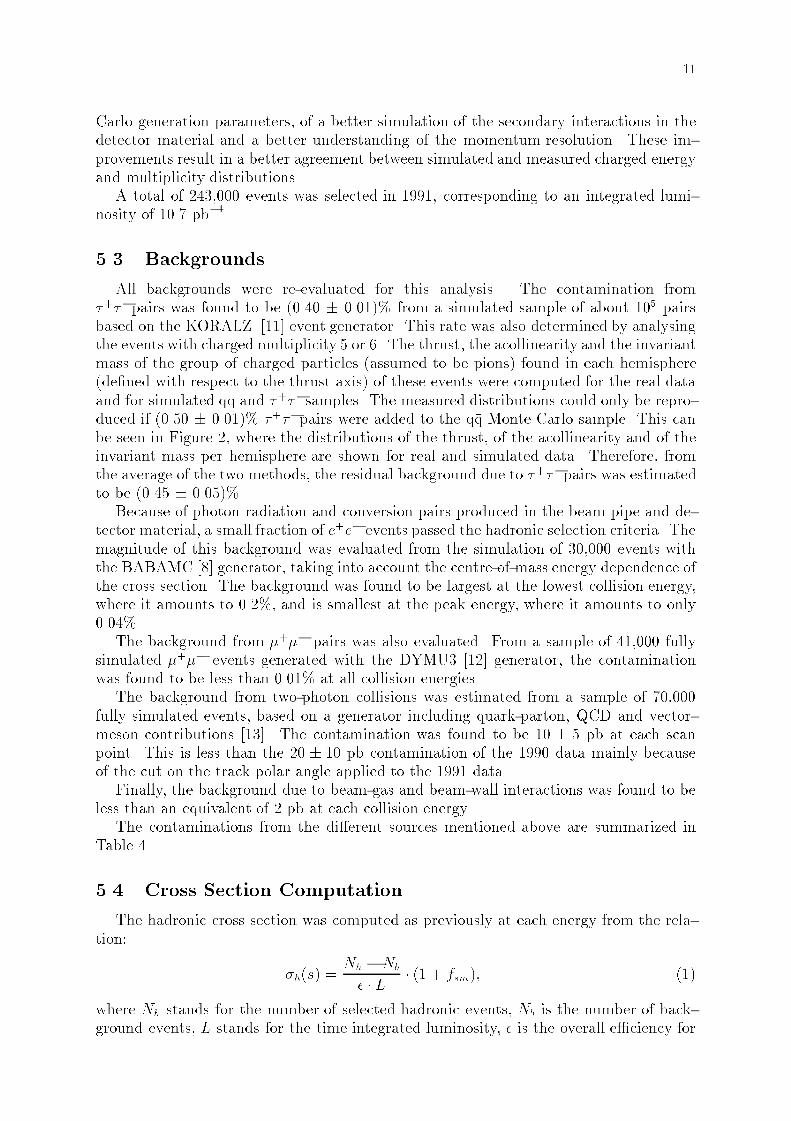
5.3 Backgrounds
All backgrounds were re-evaluated for this analysis. The contamination from�+��pairs was found to be (0.40 � 0.01)% from a simulated sample of about 105 pairsbased on the KORALZ [11] event generator. This rate was also determined by analysingthe events with charged multiplicity 5 or 6. The thrust, the acollinearity and the invariantmass of the group of charged particles (assumed to be pions) found in each hemisphere(de�ned with respect to the thrust axis) of these events were computed for the real dataand for simulated q�q and �+��samples. The measured distributions could only be repro-duced if (0.50 � 0.01)% �+��pairs were added to the q�q Monte Carlo sample. This canbe seen in Figure 2, where the distributions of the thrust, of the acollinearity and of theinvariant mass per hemisphere are shown for real and simulated data. Therefore, fromthe average of the two methods, the residual background due to �+��pairs was estimatedto be (0.45 � 0.05)%.
Because of photon radiation and conversion pairs produced in the beam pipe and de-tector material, a small fraction of e+e� events passed the hadronic selection criteria. Themagnitude of this background was evaluated from the simulation of 30,000 events withthe BABAMC [8] generator, taking into account the centre-of-mass energy dependence ofthe cross section. The background was found to be largest at the lowest collision energy,where it amounts to 0.2%, and is smallest at the peak energy, where it amounts to only0.04%.
The background from �+�� pairs was also evaluated. From a sample of 41,000 fullysimulated �+�� events generated with the DYMU3 [12] generator, the contaminationwas found to be less than 0.01% at all collision energies.
The background from two-photon collisions was estimated from a sample of 70,000fully simulated events, based on a generator including quark-parton, QCD and vector-meson contributions [13]. The contamination was found to be 10 � 5 pb at each scanpoint. This is less than the 20 � 10 pb contamination of the 1990 data mainly becauseof the cut on the track polar angle applied to the 1991 data.
Finally, the background due to beam-gas and beam-wall interactions was found to beless than an equivalent of 2 pb at each collision energy.
The contaminations from the di�erent sources mentioned above are summarized inTable 4.
5.4 Cross Section Computation
The hadronic cross section was computed as previously at each energy from the rela-tion:
�h(s) =Nh �Nb
� � L � (1 + fsm); (1)
where Nh stands for the number of selected hadronic events, Nb is the number of back-ground events, L stands for the time integrated luminosity, � is the overall e�ciency for
12
Background source Contamination Error�+�� 0.45% � 0.05%e+e� 0.04 � 0.2% negligible�+�� < 10�4 negligibletwo-photon collisions 10 pb � 5 pbbeam-gas/wall interactions < 2 pb negligible
Table 4: Magnitude of the di�erent backgrounds with their uncertainty.
hadronic events, and fsm is an s-dependent correction factor due to the spread in thecollision energy mentioned in Section 2. This factor is calculated using an approximatelineshape and is applied to all cross sections reported in this paper.
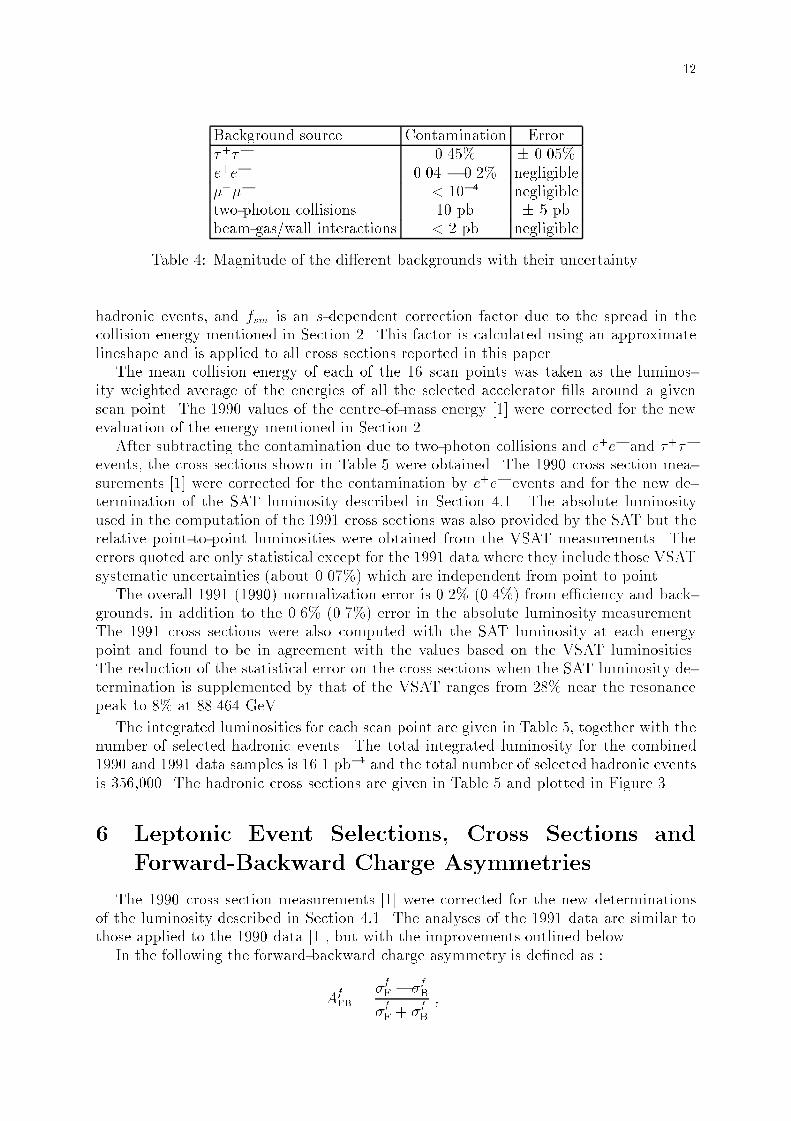
The mean collision energy of each of the 16 scan points was taken as the luminos-ity weighted average of the energies of all the selected accelerator �lls around a givenscan point. The 1990 values of the centre-of-mass energy [1] were corrected for the newevaluation of the energy mentioned in Section 2.
After subtracting the contamination due to two-photon collisions and e+e� and �+��
events, the cross sections shown in Table 5 were obtained. The 1990 cross section mea-surements [1] were corrected for the contamination by e+e� events and for the new de-termination of the SAT luminosity described in Section 4:1. The absolute luminosityused in the computation of the 1991 cross sections was also provided by the SAT but therelative point-to-point luminosities were obtained from the VSAT measurements. Theerrors quoted are only statistical except for the 1991 data where they include those VSATsystematic uncertainties (about 0.07%) which are independent from point to point.
The overall 1991 (1990) normalization error is 0.2% (0.4%) from e�ciency and back-grounds, in addition to the 0.6% (0.7%) error in the absolute luminosity measurement.The 1991 cross sections were also computed with the SAT luminosity at each energypoint and found to be in agreement with the values based on the VSAT luminosities.The reduction of the statistical error on the cross sections when the SAT luminosity de-termination is supplemented by that of the VSAT ranges from 28% near the resonancepeak to 8% at 88.464 GeV.
The integrated luminosities for each scan point are given in Table 5, together with thenumber of selected hadronic events. The total integrated luminosity for the combined1990 and 1991 data samples is 16.1 pb�1 and the total number of selected hadronic eventsis 356,000. The hadronic cross sections are given in Table 5 and plotted in Figure 3.
6 Leptonic Event Selections, Cross Sections and
Forward-Backward Charge Asymmetries
The 1990 cross section measurements [1] were corrected for the new determinationsof the luminosity described in Section 4:1. The analyses of the 1991 data are similar tothose applied to the 1990 data [1], but with the improvements outlined below.
In the following the forward-backward charge asymmetry is de�ned as :
AfFB
=�
fF � �
fB
�fF + �
fB
;
13
Collision energy Cross sections Integ. L. Number of(GeV) (nb) (nb�1) events
1990 1991
88.223 4.48 � 0.12 367.5 160288.464 5.15 � 0.09 711.1 3495
89.222 8.48 � 0.16 444.1 365589.455 9.99 � 0.13 632.7 602390.208 17.86 � 0.18 622.6 10589
90.217 18.00 � 0.28 389.0 677790.240* 18.83 � 0.61 56.8 101891.208 30.10 � 0.12 2482.5 70993
91.217 30.54 � 0.15 2831.7 8331191.239* 29.96 � 0.09 4221.8 12019091.953 24.78 � 0.21 666.1 15702
92.209 21.57 � 0.31 423.0 880392.953 14.12 � 0.16 634.6 8531
93.208 12.58 � 0.20 467.2 568593.702 10.07 � 0.13 681.2 6536
94.202 7.82 � 0.15 470.9 3565
Table 5: DELPHI hadronic cross sections measured in 1990 and in 1991. The two 1991pre-scan points are marked with a star. The uncertainties quoted are statistical. They donot include overall normalization uncertainties coming from e�ciencies and backgrounds(0.2% in 1991, 0.4% in 1990) and from the absolute luminosity (0.6% in 1991, 0.7% in1990).
where �fF (�
fB) is the cross section for the production of a charged lepton f � with cos� > 0
(< 0), where � is the polar angle of the f � with respect to the incident e� direction.
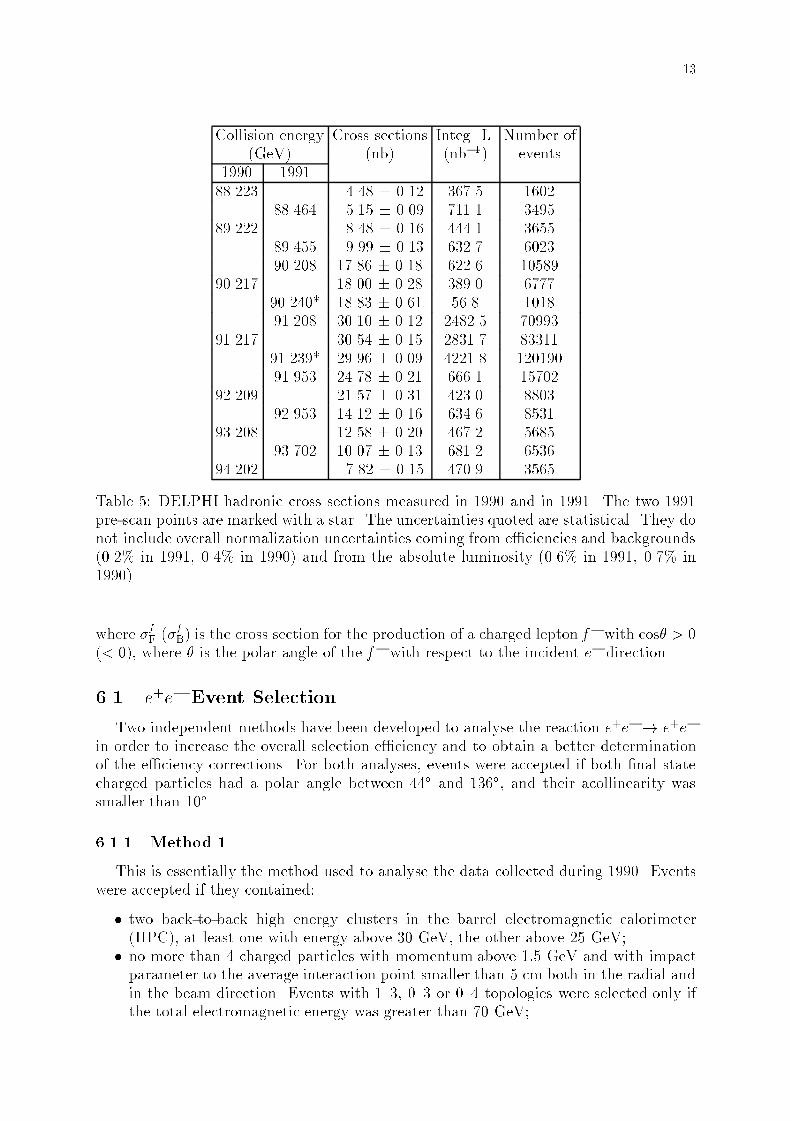
6.1 e+e� Event Selection
Two independent methods have been developed to analyse the reaction e+e� ! e+e�
in order to increase the overall selection e�ciency and to obtain a better determinationof the e�ciency corrections. For both analyses, events were accepted if both �nal statecharged particles had a polar angle between 44� and 136�, and their acollinearity wassmaller than 10�.
6.1.1 Method 1
This is essentially the method used to analyse the data collected during 1990. Eventswere accepted if they contained:
� two back-to-back high energy clusters in the barrel electromagnetic calorimeter(HPC), at least one with energy above 30 GeV, the other above 25 GeV;
� no more than 4 charged particles with momentum above 1:5 GeV and with impactparameter to the average interaction point smaller than 5 cm both in the radial andin the beam direction. Events with 1{3, 0{3 or 0{4 topologies were selected only ifthe total electromagnetic energy was greater than 70 GeV;
14
� hits in the VD compatible with one charged track per hemisphere in topologies 0{0and 0{1.
To avoid possible small losses of events due to bad reconstruction of one shower in theHPC, events were also accepted with :
� one very energetic electromagnetic cluster with energy above 40 GeV;� at least one charged particle in each hemisphere;� no energy deposited beyond the �rst 1.5 interaction lengths of the Hadron Calorime-ter.
The energy cuts quoted were used at the peak energy; they were scaled according to theevent centre-of-mass energy at the other scan points. Since this selection was essentiallybased on the HPC, the regions in polar and azimuthal angles where this detector hasgaps between modules were excluded from the analysis.
Two improvements were introduced with respect to the analysis of reference [1]. First,the three layers of the microvertex detector were used to count, with full azimuthalcoverage, the particles originating from the vertex. In this way, annihilation events intotwo photons were rejected with almost 100% e�ciency, and negligible loss of e�ciencyin the e+e� selection. Second, the improvement in the detector simulation allowed the�ducial region to be extended down to �0:7� in � from the HPC gaps (compared to �1:0�used in the past). The cut in polar angle at (90 � 2)� was maintained.
A total of 6670 events was selected with this analysis. The selection e�ciency wasestimated to be (89:71 � 0:23)% using a sample of 21642 simulated e+e� events in the �acceptance region. This value does not include the loss due to the exclusion of the 4� polarangle region around 90� which amounted to about 4% (depending on energy), becausethis was computed using two independent programs ALIBABA [14] and TOPAZ0 [15].
With a sample of 38131 simulated �+�� events, the percentage of �+�� events passingthe selection cuts was estimated to be (1:46 � 0:07)%. Backgrounds from other sourceswere estimated to be negligible.
The �nal result is not completely stable against variations of the cuts used to select theevents. These instabilities are attributed to the non-perfect modelling of the simulatedevents, with e�ects both on the selection e�ciency and on the background estimations. Byvarying the energy cut values by �20%, the systematic error from this e�ect is evaluatedto be 0:25%. Small additional contributions to the systematic error come from the triggere�ciency and from the acceptance region de�nition (�0:20%). The overall systematicerror of the cross sections obtained with this method is found to be �0:40%, to be addedto the uncertainty in the luminosity.
6.1.2 Method 2
In this method, e+e� events were selected with two independent sets of experimentalcuts, chosen in such a way as to minimize the correlations between the two sets. As inmethod 1, a cut in polar angle at 90 � 2� was applied. In one set (selection A), eventswere accepted if they had :
� at least two opposite track segments seen by the microvertex detector (VD) and nomore than four in total;
� two high energy electromagnetic clusters observed in the HPC, at least one withenergy above 35 GeV and another above 25 GeV. If the most energetic clusterpointed to within 2� of a gap in the HPC, then the energy of the second cluster was
15
de�ned as the HPC energy plus the energy measured in the �rst layer of the barrelHCAL. In this case there should be no energy in layers 3 and 4 of the barrel HCAL.
In the second set (selection B), events were accepted if they had:
� at least 2 charged particle tracks, of momentumgreater than 1:5 GeV and distance ofclosest approach to the nominal vertex position less than 5 cm, seen by the DELPHItracking system (except VD) with acollinearity less than 10�, and no more than fourtracks in total;
� the sum in quadrature of the momenta of the highest momentum charged particlesin each hemisphere greater than 45 GeV;
� the ionization, as measured by the TPC, of all tracks in the event compatible withthe electron hypothesis;
� no energy observed in the last three layers of HCAL associated to the impact pointsof the two highest momentum charged particles;
� the Outer Detector hit pattern associated to the impact points of the tracks incom-patible with the pattern of a non-showering particle;
� no hit in the muon chambers associated to the tracks.
As in the previous analysis, the energy cut values were scaled with the centre-of-massenergy of the events.
In total, 7203 events were selected with this method. Considering the selections A andB as independent, the e�ciency of each of them and their overall e�ciency can be easilycomputed by a comparison of the number of events selected by each one separately orby both simultaneously. To get a correct result, the contribution of background eventspassing the cuts had �rst to be subtracted. The presence of background in the sample ofselected events has two consequences. First, it increases the number of selected events,second it biases the estimate of the selection e�ciency towards smaller values. Usingthe �+�� simulated events quoted in the discussion of method 1, the percentage of tauevents passing the cuts was found to be 0:55% for selection A and 0:73% for selection B,with only 0:04% of events passing both selections. Backgrounds from other sources wereestimated to be negligible. After the background correction, the overall e�ciency of thetwo selections was measured to be (97:10�0:14)%. No evidence of variation of this numberwith centre-of-mass energy was observed, the measurements being completely consistentwith statistical uctuations about a constant value. This measured e�ciency does notinclude the loss due to the exclusion of the polar angle region around 90�. The simulatede+e� events were used to estimate and remove the bias caused by the correlation betweenthe two selections due to the detector structure or to the kinematics of the events. Thebias on the combined e�ciency was found to be less than 0:1%. The �nal cross sectionresults have a slight dependence on the value of the cuts used in the event selection,mainly on the track momentum cut. By varying the cut values by �20%, the systematicerror from this e�ect was estimated to be 0:34%. Adding other small contributions fromtrigger e�ciency and acceptance de�nition, the overall systematic error with method 2 is0:42%.
6.1.3 Cross Sections and Asymmetries
The cross sections obtained with the two methods are quite compatible. In the follow-ing analysis the average of the two results will be used. Taking into account the correlationbetween the errors of the two measurements, the systematic error on the average was es-timated to be 0:37%. To allow a �t of the results with the ZFITTER package [16], the
16
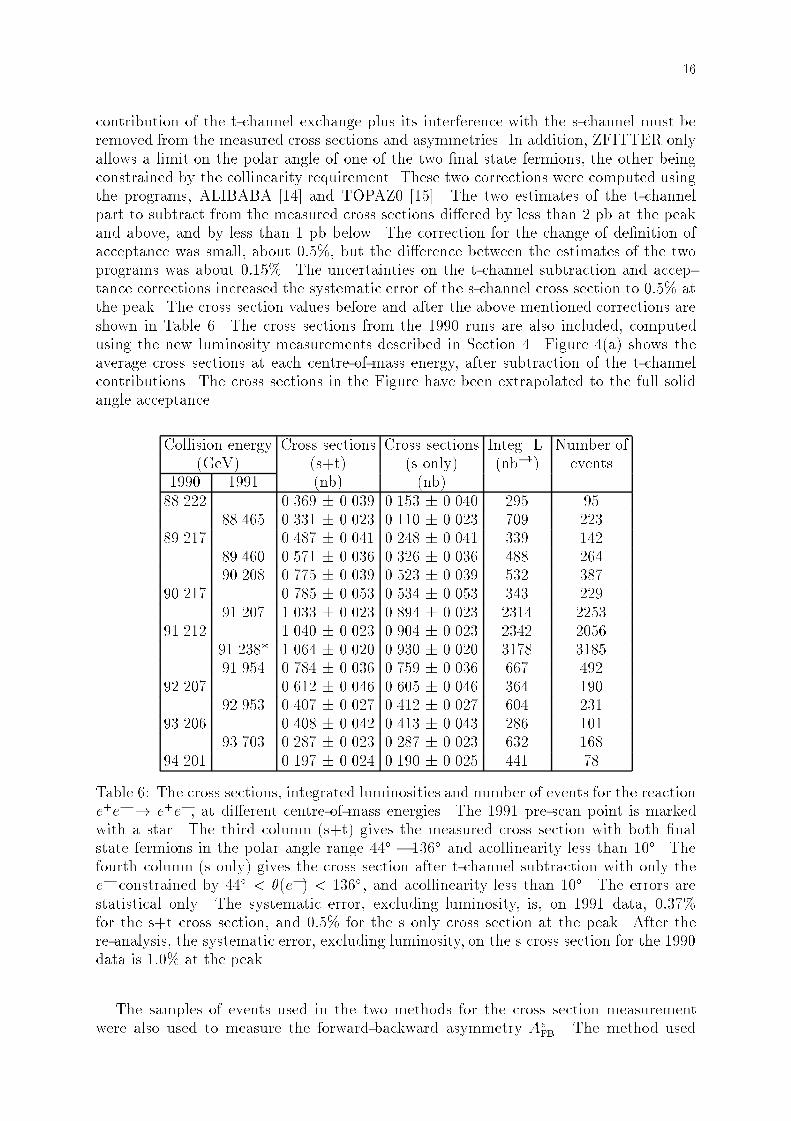
contribution of the t-channel exchange plus its interference with the s-channel must beremoved from the measured cross sections and asymmetries. In addition, ZFITTER onlyallows a limit on the polar angle of one of the two �nal state fermions, the other beingconstrained by the collinearity requirement. These two corrections were computed usingthe programs, ALIBABA [14] and TOPAZ0 [15]. The two estimates of the t-channelpart to subtract from the measured cross sections di�ered by less than 2 pb at the peakand above, and by less than 1 pb below. The correction for the change of de�nition ofacceptance was small, about 0:5%, but the di�erence between the estimates of the twoprograms was about 0:15%. The uncertainties on the t-channel subtraction and accep-tance corrections increased the systematic error of the s-channel cross section to 0:5% atthe peak. The cross section values before and after the above mentioned corrections areshown in Table 6. The cross sections from the 1990 runs are also included, computedusing the new luminosity measurements described in Section 4. Figure 4(a) shows theaverage cross sections at each centre-of-mass energy, after subtraction of the t-channelcontributions. The cross sections in the Figure have been extrapolated to the full solidangle acceptance.
Collision energy Cross sections Cross sections Integ. L. Number of(GeV) (s+t) (s only) (nb�1) events
1990 1991 (nb) (nb)
88.222 0.369 � 0.039 0.153 � 0.040 295 9588.465 0.331 � 0.023 0.110 � 0.023 709 223
89.217 0.487 � 0.041 0.248 � 0.041 339 14289.460 0.571 � 0.036 0.326 � 0.036 488 26490.208 0.775 � 0.039 0.523 � 0.039 532 387
90.217 0.785 � 0.053 0.534 � 0.053 343 22991.207 1.033 � 0.023 0.894 � 0.023 2314 2253
91.212 1.040 � 0.023 0.904 � 0.023 2342 205691.238* 1.064 � 0.020 0.930 � 0.020 3178 318591.954 0.784 � 0.036 0.759 � 0.036 667 492
92.207 0.612 � 0.046 0.605 � 0.046 364 19092.953 0.407 � 0.027 0.412 � 0.027 604 231
93.206 0.408 � 0.042 0.413 � 0.043 286 10193.703 0.287 � 0.023 0.287 � 0.023 632 168
94.201 0.197 � 0.024 0.190 � 0.025 441 78
Table 6: The cross sections, integrated luminosities and number of events for the reactione+e� ! e+e�, at di�erent centre-of-mass energies. The 1991 pre-scan point is markedwith a star. The third column (s+t) gives the measured cross section with both �nalstate fermions in the polar angle range 44� � 136� and acollinearity less than 10�. Thefourth column (s only) gives the cross section after t-channel subtraction with only thee� constrained by 44� < �(e�) < 136�, and acollinearity less than 10�. The errors arestatistical only. The systematic error, excluding luminosity, is, on 1991 data, 0:37%for the s+t cross section, and 0:5% for the s only cross section at the peak. After there-analysis, the systematic error, excluding luminosity, on the s cross section for the 1990data is 1:0% at the peak.
The samples of events used in the two methods for the cross section measurementwere also used to measure the forward-backward asymmetry Ae
FB. The method used
17
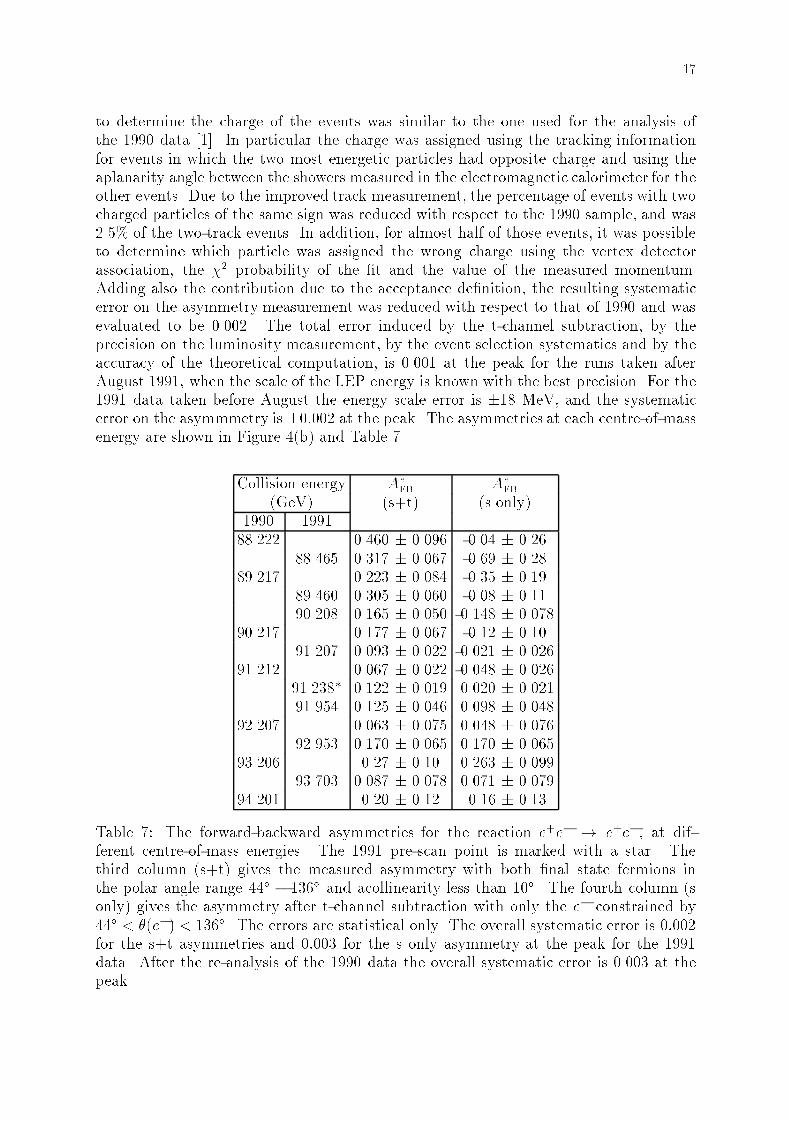
to determine the charge of the events was similar to the one used for the analysis ofthe 1990 data [1]. In particular the charge was assigned using the tracking informationfor events in which the two most energetic particles had opposite charge and using theaplanarity angle between the showers measured in the electromagnetic calorimeter for theother events. Due to the improved track measurement, the percentage of events with twocharged particles of the same sign was reduced with respect to the 1990 sample, and was2.5% of the two-track events. In addition, for almost half of those events, it was possibleto determine which particle was assigned the wrong charge using the vertex detectorassociation, the �2 probability of the �t and the value of the measured momentum.Adding also the contribution due to the acceptance de�nition, the resulting systematicerror on the asymmetry measurement was reduced with respect to that of 1990 and wasevaluated to be 0.002. The total error induced by the t-channel subtraction, by theprecision on the luminosity measurement, by the event selection systematics and by theaccuracy of the theoretical computation, is 0.001 at the peak for the runs taken afterAugust 1991, when the scale of the LEP energy is known with the best precision. For the1991 data taken before August the energy scale error is �18 MeV, and the systematicerror on the asymmmetry is �0:002 at the peak. The asymmetries at each centre-of-massenergy are shown in Figure 4(b) and Table 7.
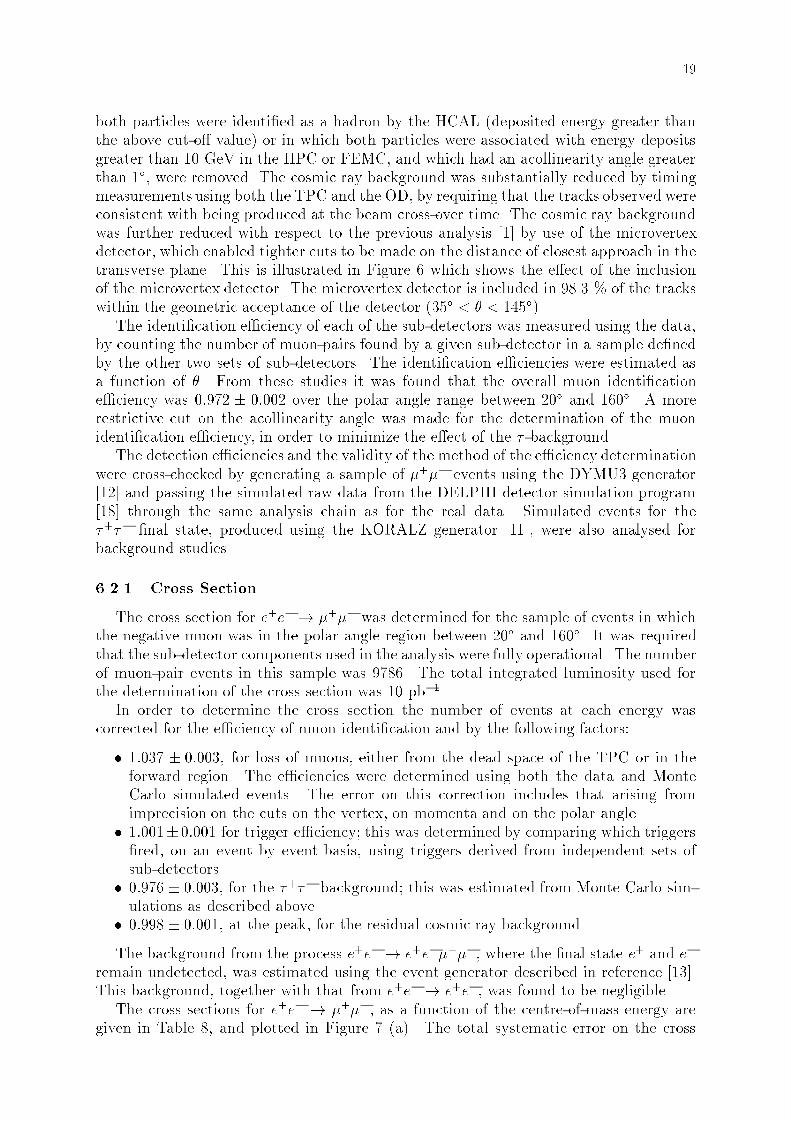
Collision energy AeFB
AeFB
(GeV) (s+t) (s only)1990 199188.222 0.460 � 0.096 -0.04 � 0.26
88.465 0.317 � 0.067 -0.69 � 0.2889.217 0.223 � 0.084 -0.35 � 0.19
89.460 0.305 � 0.060 -0.08 � 0.1190.208 0.165 � 0.050 -0.148 � 0.078
90.217 0.177 � 0.067 -0.12 � 0.1091.207 0.093 � 0.022 -0.021 � 0.026
91.212 0.067 � 0.022 -0.048 � 0.02691.238* 0.122 � 0.019 0.020 � 0.02191.954 0.125 � 0.046 0.098 � 0.048
92.207 0.063 � 0.075 0.048 � 0.07692.953 0.170 � 0.065 0.170 � 0.065
93.206 0.27 � 0.10 0.263 � 0.09993.703 0.087 � 0.078 0.071 � 0.079
94.201 0.20 � 0.12 0.16 � 0.13
Table 7: The forward-backward asymmetries for the reaction e+e� ! e+e�, at dif-ferent centre-of-mass energies. The 1991 pre-scan point is marked with a star. Thethird column (s+t) gives the measured asymmetry with both �nal state fermions inthe polar angle range 44� � 136� and acollinearity less than 10�. The fourth column (sonly) gives the asymmetry after t-channel subtraction with only the e� constrained by44� < �(e�) < 136�. The errors are statistical only. The overall systematic error is 0:002for the s+t asymmetries and 0:003 for the s only asymmetry at the peak for the 1991data. After the re-analysis of the 1990 data the overall systematic error is 0.003 at thepeak.
18
6.2 �+�� Event Selection
The analysis procedure for the selection of candidate e+e� ! �+�� events in thebarrel region was similar to that presented in ref. [1], however improvements in the tracke�ciency in the forward regions allowed the angular acceptance to be extended. In thepresent analysis the polar angle range for the determination of cross sections was increasedto 20� < � < 160� (from 32:9� < � < 147:1� in 1990). For the determination of theforward-backward asymmetry the polar angle range was further extended to 11� < � <
169� (from 15� < � < 165� in 1990). This larger angular acceptance for the asymmetrymeasurements is important as the size of the error is related to the maximum absolutevalue of cos � in the data sample.
Events were retained if they satis�ed the following selection criteria:
� there were two charged particles, both having momenta greater than 15 GeV , andcoming from the interaction region. The size of this region was dependent on whichdetectors participated in the track �t. For tracks in which the microvertex detectorparticipated, this region was de�ned by jzj less than 4.5 cm and r less than 0.2 cm.If microvertex measurements were not used, but the TPC or ID participated in thetrack �t, the accepted region was extended to r less than 1.5 cm. For other tracks(mainly in the forward region) the requirement was r less than 5 cm;
� the acollinearity angle between the two charged particle tracks was less than 10�;� there were no additional charged particles with momenta greater than 5 GeV, exceptif the fastest particle had a momentum greater than 40 GeV. The latter requirementreduced the rejection of muon pair events in which the third particle had arisen fromradiative e�ects.
The momentum resolution was considerably improved compared to that of the pre-vious analysis by the inclusion of the 3 layer microvertex detector in the track �t. Themomentum resolution was about 4% in the barrel region, where there is microvertex cov-erage, and rose to about 20% at the extreme values of �. Figure 5 shows the distributionof the electric charge multiplied by the inverse of the momentum. A clear separation ofthe charges, which is important in the measurement of the forward-backward asymmetry,can be seen. The small tails of the momentum distribution at low values of the inversemomentumare mainly due to reconstructed tracks in which information from one or moreof the tracking detectors was not available in the track �t.
Five sub-detectors were used in the muon identi�cation:
� for the MUB and MUF, identi�cation was based on the association of the positions ofthe muon chamber hits with those expected from the extrapolation of the tracks [17];
� for the HCAL, it was required that the energy deposited was consistent with thatexpected for a minimum ionizing particle, possibly accompanied by a �-ray orBremsstrahlung photon; namely that the total energy deposited was less than acut-o� value (which was 10 GeV at � = 90�, increasing to about 15 GeV at � = 55�,and thereafter independent of �) and that there were energy deposits in at least twoof the four layers;
� for the HPC and FEMC it was required that there were energy depositions and thatthese were consistent with those expected from a minimum ionizing particle (i.e. lessthan 1 GeV within �5� in � and �10� in � around the track extrapolated to theentry point of the calorimeter).
It was required that each particle was identi�ed as a muon by at least one of the sub-detectors mentioned above in either the barrel or forward regions. Events in which one or
19
both particles were identi�ed as a hadron by the HCAL (deposited energy greater thanthe above cut-o� value) or in which both particles were associated with energy depositsgreater than 10 GeV in the HPC or FEMC, and which had an acollinearity angle greaterthan 1�, were removed. The cosmic ray background was substantially reduced by timingmeasurements using both the TPC and the OD, by requiring that the tracks observed wereconsistent with being produced at the beam cross-over time. The cosmic ray backgroundwas further reduced with respect to the previous analysis [1] by use of the microvertexdetector, which enabled tighter cuts to be made on the distance of closest approach in thetransverse plane. This is illustrated in Figure 6 which shows the e�ect of the inclusionof the microvertex detector. The microvertex detector is included in 98.3 % of the trackswithin the geometric acceptance of the detector (35� < � < 145�).
The identi�cation e�ciency of each of the sub-detectors was measured using the data,by counting the number of muon-pairs found by a given sub-detector in a sample de�nedby the other two sets of sub-detectors. The identi�cation e�ciencies were estimated asa function of �. From these studies it was found that the overall muon identi�catione�ciency was 0:972 � 0:002 over the polar angle range between 20� and 160�. A morerestrictive cut on the acollinearity angle was made for the determination of the muonidenti�cation e�ciency, in order to minimize the e�ect of the � -background.
The detection e�ciencies and the validity of the method of the e�ciency determinationwere cross-checked by generating a sample of �+�� events using the DYMU3 generator[12] and passing the simulated raw data from the DELPHI detector simulation program[18] through the same analysis chain as for the real data. Simulated events for the�+�� �nal state, produced using the KORALZ generator [11], were also analysed forbackground studies.
6.2.1 Cross Section
The cross section for e+e� ! �+�� was determined for the sample of events in whichthe negative muon was in the polar angle region between 20� and 160�. It was requiredthat the sub-detector components used in the analysis were fully operational. The numberof muon-pair events in this sample was 9786. The total integrated luminosity used forthe determination of the cross section was 10 pb�1.
In order to determine the cross section the number of events at each energy wascorrected for the e�ciency of muon identi�cation and by the following factors:
� 1:037 � 0:003, for loss of muons, either from the dead space of the TPC or in theforward region. The e�ciencies were determined using both the data and MonteCarlo simulated events. The error on this correction includes that arising fromimprecision on the cuts on the vertex, on momenta and on the polar angle.
� 1:001�0:001 for trigger e�ciency; this was determined by comparing which triggers�red, on an event by event basis, using triggers derived from independent sets ofsub-detectors.
� 0:976 � 0:003, for the �+�� background; this was estimated from Monte Carlo sim-ulations as described above.
� 0:998 � 0:001, at the peak, for the residual cosmic ray background.
The background from the process e+e� ! e+e��+��, where the �nal state e+ and e�
remain undetected, was estimated using the event generator described in reference [13].This background, together with that from e+e� ! e+e�, was found to be negligible.
The cross sections for e+e� ! �+��, as a function of the centre-of-mass energy aregiven in Table 8, and plotted in Figure 7 (a). The total systematic error on the cross
20
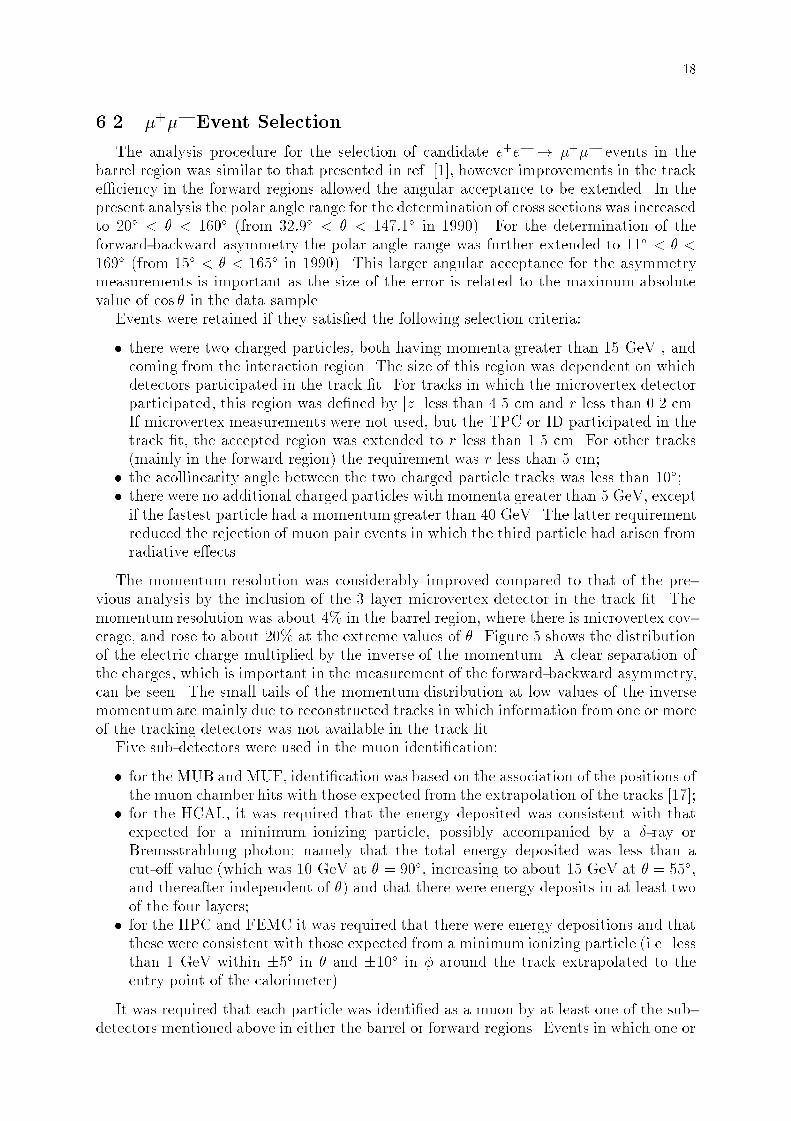
section is 0.5%, in addition to the error on the luminosity. The results for the 1990 data,with luminosity modi�ed as described in Section 4, are also given in Table 8.
Collision energy Cross sections Cross sections (4�) Integ. L. Number of(GeV) (nb) (nb) (nb�1) events
1990 1991
88.221 0.216 � 0.032 316 4988.468 0.227 � 0.020 0.267 � 0.023 629 137
89.216 0.416 � 0.040 401 11989.461 0.436 � 0.027 0.502 � 0.030 647 26990.212 0.750 � 0.034 0.853 � 0.039 633 448
90.217 1.073 � 0.065 374 27691.210 1.275 � 0.024 1.443 � 0.028 2274 2757
91.212 1.513 � 0.031 2330 245791.243* 1.293 � 0.019 1.463 � 0.021 3993 491191.956 1.120 � 0.042 1.268 � 0.046 680 725
92.207 1.159 � 0.074 307 25292.956 0.568 � 0.031 0.647 � 0.036 634 344
93.209 0.590 � 0.048 372 15593.704 0.415 � 0.030 0.477 � 0.035 492 195
94.200 0.406 � 0.038 413 120
Table 8: The number of selected events, integrated luminosities and cross sections fore+e� ! �+�� for di�erent centre-of-mass energies measured in 1990 and 1991. The 1991pre-scan point is marked with a star. For 1991, the results are given in column 3 for theevents satisfying the selection criteria that both muon momenta are above 15 GeV, thepolar angle of the negative muon satis�es 20� < � < 160� and that the acollinearity angleis lower than 10�. The uncertainties quoted are statistical. The total systematic error onthe cross section data for 1991 is 0.5%, in addition to the error on the luminosity. Theresults for 1990 correspond to 4� detection and are corrected for the cuts on momenta andacollinearity. The uncertainties quoted are again statistical only. The total systematicerror on the cross section is 0.8%, in addition to the uncertainty in the luminosity. Alsogiven in column 4, for convenience, are the 1991 results corrected to 4� detection. The1991 results used in the �ts are those from column 3, as the extrapolation to 4� introducesan additional theoretical uncertainty.
6.2.2 Forward - Backward Asymmetry
For this analysis, events with a detected muon within the polar angle region between11� and 169�, and which passed the muon pair selection as described above, were used.Since an absolute normalization is not required, less restrictive criteria on the run condi-tions were applied. Further, the polar angle range was extended to increase the sensitivityof the measured asymmetries. A total of 11465 events was retained from which A
�FB
wasextracted at each energy point using a maximum likelihood �t to the angular distribu-tion of the scattered ��. In the absence of charge-asymmetric and forward-backwardasymmetric ine�ciencies, this method does not require e�ciency corrections. Since thelikelihood �t uses the lowest order form for the angular distribution, higher order pho-tonic corrections are not taken into account. Therefore a comparison was made between
21
the �rst order form and the di�erential cross section computed using ZFITTER [16] andapplying the experimental cuts described above. The maximal di�erence observed leadsto a common systematic error of 0.001 for all energies. The value of A
�FB
di�ers by 0.002using the angle of the scattered �+ for the �t. This e�ect does not depend on statistical uctuations of events with hard radiative photons but can be traced back to a di�erentmeasurement of the angles in both hemispheres. As this systematic di�erence is not fullyunderstood, the averaged value cos �� = cos 1
2(�� + � � �+)= cos 1
2(�� � � + �+), where
��; �+ are the polar angles of the negative and positive muons respectively, was used inthe computation of the asymmetry. There is a contribution of 0.001 to the systematicerror arising from these e�ects.
The A�FB
values were also computed by counting the forward and backward scattered��, correcting for the cos � dependent e�ciency and extrapolating to the full solid angle,as described in ref. [1]. The values obtained for both methods are listed in Table 9 andshow good agreement within the expected statistical di�erence.
Collision energy Number of A�FB
A�FB
(GeV) events (counting) (likelihood)1990 199188.221 72 -0.23 � 0.11 -0.14 � 0.11
88.464 152 -0.269 � 0.080 -0.267 � 0.07389.216 162 -0.17 � 0.08 -0.21 � 0.08
89.456 282 -0.269 � 0.059 -0.248 � 0.05490.211 518 -0.138 � 0.045 -0.155 � 0.042
90.217 325 -0.11 � 0.06 -0.08 � 0.0591.210 3364 -0.004 � 0.018 -0.012 � 0.017
91.212 3437 0.024 � 0.017 0.007 � 0.01791.239* 5674 0.022 � 0.014 0.019 � 0.01391.954 774 0.061 � 0.037 0.065 � 0.034
92.207 387 0.04 � 0.05 0.01 � 0.0592.952 370 0.100 � 0.053 0.105 � 0.050
93.209 217 0.15 � 0.07 0.12 � 0.0793.701 331 0.145 � 0.056 0.156 � 0.051
94.200 163 0.25 � 0.08 0.21 � 0.08
Table 9: Measurement of the �+�� forward-backward asymmetry for di�erent cen-tre-of-mass energies for 1990 and 1991 data. The results are corrected to the full solidangle, but not for the cuts on momenta and acollinearity. The errors are statistical only,the systematic error on these points is 0.005 for the 1990 data and 0.003 for the 1991data. The 1991 pre-scan point is marked with a star.
The wrong determination of charges was indicated by events with a charge confusion;that is, two muons of apparently the same charge. The data sample contained 24/21events with negative/positive charges measured in both hemispheres. These events pro-vided a j cos �j dependent probability that a track was measured with the wrong charge.
This led to an estimated relative systematic error of�A
�
FB
A�
FB
= 0:001 and a maximal error
of 0.002, if the maximum possible correlation was considered. The charge acceptancewas extracted from the mean values of the momentum distributions for both chargesin each hemisphere. Di�erences may lead to events in the low momentum region being
22
excluded from the event sample in a way which depends on the charge of the muon. Thecorresponding systematic error was estimated to be 0.001. A background of 2% of �+��
events was estimated with a Monte Carlo study of 100,000 �+��( ) events generated withKORALZ [11] and passing the full detector simulation and analysis chain. The remainingevents have a similar asymmetry to the muon data and thus do not cause any signi�cantsystematic error. The cosmic ray background contributes mainly to the o� peak measure-ments. The rate and angular distribution of cosmic ray events were estimated by utilizingthe region outside the interaction point and extrapolating the results into the interactionregion. The values of A�
FBwere corrected for this background and the systematic error
from this source was below 0.001. Adding all of these e�ects in quadrature gave a totalestimated systematic error on the asymmetry of 0.003. The results of the asymmetrymeasurements are given in Table 9 and plotted in Figure 7 (b).
The results of the measurements of A�FB
for the 1990 data are also given in Table 9;the estimated systematic error on these data is 0.005.
6.3 �+�� Event Selection
The analysis for selection of Z0 ! �+�� events di�ered in a number of respects fromthat previously presented [1]. The cross sections were estimated with events selected inthe polar angle region between 43� and 137� as before but with an improved e�ciency andreduced systematic errors. The asymmetry measurements were made with events selectedin the extended polar angle region from 25� to 155�. The selection took advantage of themissing energy and momentum carried by the 2 or more neutrinos produced to rejectother leptonic decays of the Z0, and used the low multiplicity and presence of isolatedparticles or very collimated jets to reject hadronic events.
The event axis was taken as the thrust axis and the event divided into two hemispherescorresponding to each � . In order that the treatment should be the same independently ofthe number of charged particle tracks, the most energetic charged particle (leading track)of each side was chosen to de�ne the corresponding � quantities. The leading track in atleast one of the hemispheres was required to be in the accepted polar angle range. Tode�ne calorimetric energies, a cone of 30� (half opening angle) around the leading trackwas de�ned and all energy inside it was added as the � energy.
A �rst set of cuts was applied to remove Z0 ! hadrons and two-photon events:
2 � Nch � 6; �iso � 160�; Evis > 8 GeV;
where Nch is the number of charged particles, as reconstructed in the TPC, coming froma �ducial region around the average interaction point (r < 5 cm and jzj < 10 cm); �isois the minimum angle between a pair of charged particles in opposite hemispheres andEvis is the total energy, de�ned as the sum of the charged particle momenta and neutralelectromagnetic energy. The cut in �iso limited the maximum acollinearity in two chargedparticle events and the opening angle of the jet for higher multiplicity events.
Two further cuts were used to reject leptonic Z0 decays, e+e�( ) and �+��( ):
Prad < 1:0; Erad < 1:0:
These two variables are de�ned as Prad =
pp21+p2
2
Pbeamand Erad =
pe21+e2
2
Ebeam, where p1(p2) and
e1(e2) are the momentum and electromagnetic energy assigned to each � as explainedabove.
Cosmic, beam-gas and beam-wall events were rejected with impact parameter cuts:
jz1j < 4:5 cm; jz2j < 4:5 cm; r1 < 1:5 cm; r2 < 1:5 cm;
23
where r1 and r2 are the impact parameters in the transverse plane of the two leadingtracks with respect to the average interaction point and z1 and z2 are the distances alongthe beam between the point of closest approach and the interaction point.
Finally, extra cuts were applied only for 1{1 topology events, to remove remainingbackground a�ecting this topology :
�acol > 0:5�; j~PT j > 0:4 GeV; jz1 � z2j < 3 cm;
where j~PT j is the event transverse momentum relative to the beam axis, and �acol is theacollinearity angle of the two charged particles. The cut on acollinearity reduces thedilepton and cosmic ray backgrounds. The cut on j~PT j reduces the background due totwo-photon events. The �nal cut further reduces the cosmic ray background.
The selection e�ciency was determined from Monte Carlo data, produced using KO-RALZ [11] with detailed detector response simulated, and processed with the standardDELPHI analysis programs, with small corrections for di�erences found between dataand simulation.
The e�ciency dependence on centre-of-mass energy was checked by simulating, witha simpli�ed detector response[10], 100,000 �+�� at each of the 7 beam energy points. Nodeviation greater than expected statistical uctuations was observed , indicating that thevariation in e�ciency was less than 0:1%.
By simulation a selection e�ciency of (52:82 � 0:34)% was obtained, equivalent to(81:76 � 0:53)% within the polar angle region between 43� and 137�. The systematicerror on the e�ciency arose from the sensitivity to the selections, principally for Erad,�acol and �iso. A total of 6528 events was selected.
Backgrounds were estimated from data, and cross-checked with simulated events. Thecosmic ray background was estimated to be less than 0.05% using the timing informationfrom the Outer Detector . The overall background was estimated to be (1:9 � 0:4)%from other Z0 decays and 2:0 � 0:6 pb from two-photon and up to 2.1 pb, depending oncentre-of-mass energy, from Bhabha processes.
The cross sections are given in Table 10 and shown in Figure 8 (a).
The measurement of A�FB
was made using the maximum likelihood method. Theselections used for the cross section measurement were used for the barrel region and afurther set of selections introduced for the regions 25� < � < 43� and 137� < � < 155�.These were:
Erad < 0:9
and, if both leading tracks lay between the Forward Electromagnetic Calorimeter and theHPC (35� < � < 43� and 137� < � < 145�):
Prad < 0:9; �acol > 2�;
where �acol was de�ned for all events using the resultant momentum of all particles ineach hemisphere. These tight cuts were required to remove e+e� events with a highe�ciency in a region with no electromagnetic calorimetry. The average e�ciency forthe extra events selected outside the barrel was estimated from Monte Carlo simulationto be (59:2 � 1:0)%. Backgrounds were estimated from Monte Carlo simulation to be(6:0� 1:4)%, dominated by the e+e� channel which contributed (3:6� 1:0)%. A total of7916 candidate events was selected.
To calculate A�FB, it was necessary to reconstruct the �� pair production direction
and to identify the charges. The thrust axis was used for the direction . Monte Carlosimulations showed that the r.m.s. of the di�erence between the cos � of the generated pair
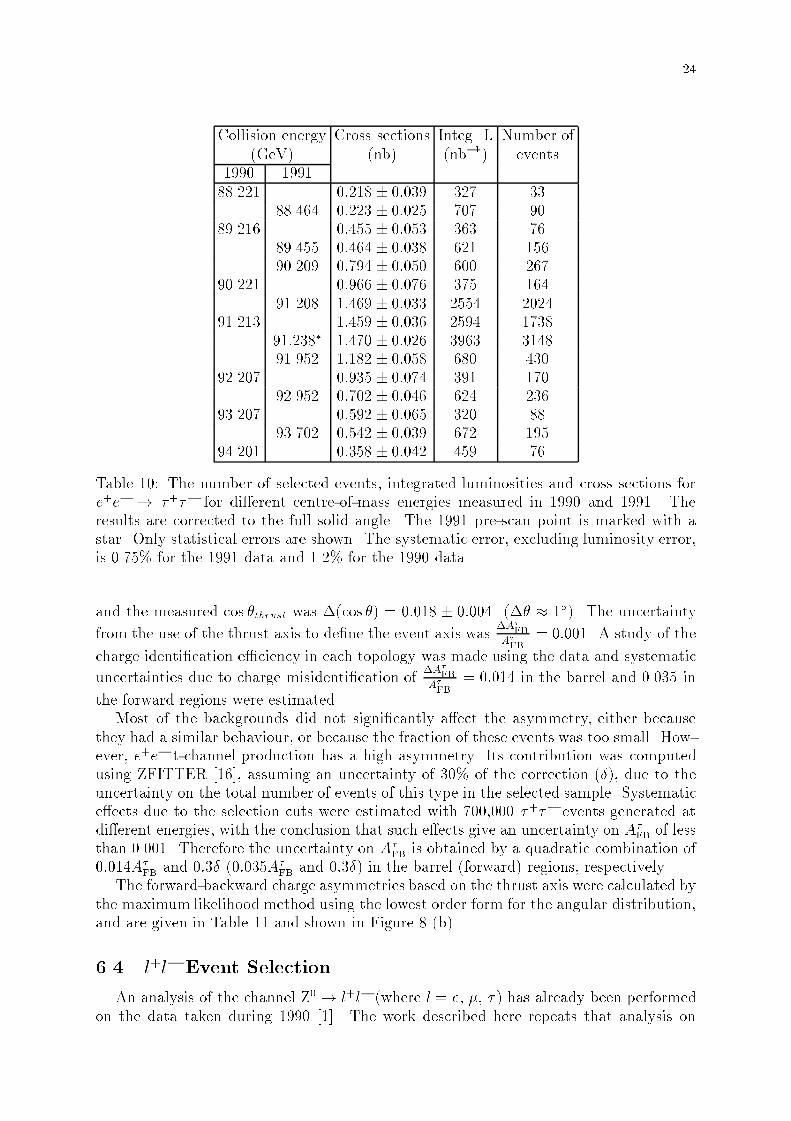
24
Collision energy Cross sections Integ. L Number of
(GeV) (nb) (nb�1) events1990 1991
88.221 0:218 � 0:039 327 3388.464 0:223 � 0:025 707 90
89.216 0:455 � 0:053 363 7689.455 0:464 � 0:038 621 15690.209 0:794 � 0:050 600 267
90.221 0:966 � 0:076 375 16491.208 1:469 � 0:033 2554 2024
91.213 1:459 � 0:036 2594 173891:238� 1:470 � 0:026 3963 314891.952 1:182 � 0:058 680 430
92.207 0:935 � 0:074 391 17092.952 0:702 � 0:046 624 236
93.207 0:592 � 0:065 320 8893.702 0:542 � 0:039 672 195
94.201 0:358 � 0:042 459 76
Table 10: The number of selected events, integrated luminosities and cross sections fore+e� ! �+�� for di�erent centre-of-mass energies measured in 1990 and 1991. Theresults are corrected to the full solid angle. The 1991 pre-scan point is marked with astar. Only statistical errors are shown. The systematic error, excluding luminosity error,is 0.75% for the 1991 data and 1.2% for the 1990 data.
and the measured cos �thrust was �(cos �) = 0:018 � 0:004 (�� � 1�). The uncertainty
from the use of the thrust axis to de�ne the event axis was�A�
FB
A�FB
= 0:001. A study of the
charge identi�cation e�ciency in each topology was made using the data and systematic
uncertainties due to charge misidenti�cation of�A�
FB
A�FB
= 0:014 in the barrel and 0.035 in
the forward regions were estimated .Most of the backgrounds did not signi�cantly a�ect the asymmetry, either because
they had a similar behaviour, or because the fraction of these events was too small. How-ever, e+e� t-channel production has a high asymmetry. Its contribution was computedusing ZFITTER [16], assuming an uncertainty of 30% of the correction (�), due to theuncertainty on the total number of events of this type in the selected sample. Systematice�ects due to the selection cuts were estimated with 700,000 �+�� events generated atdi�erent energies, with the conclusion that such e�ects give an uncertainty on A�
FBof less
than 0.001. Therefore the uncertainty on A�FB
is obtained by a quadratic combination of0:014A�
FBand 0:3� (0:035A�
FBand 0:3�) in the barrel (forward) regions, respectively.
The forward-backward charge asymmetries based on the thrust axis were calculated bythe maximum likelihood method using the lowest order form for the angular distribution,and are given in Table 11 and shown in Figure 8 (b).
6.4 l+l� Event Selection
An analysis of the channel Z0 ! l+l� (where l = e; �; � ) has already been performedon the data taken during 1990 [1]. The work described here repeats that analysis on
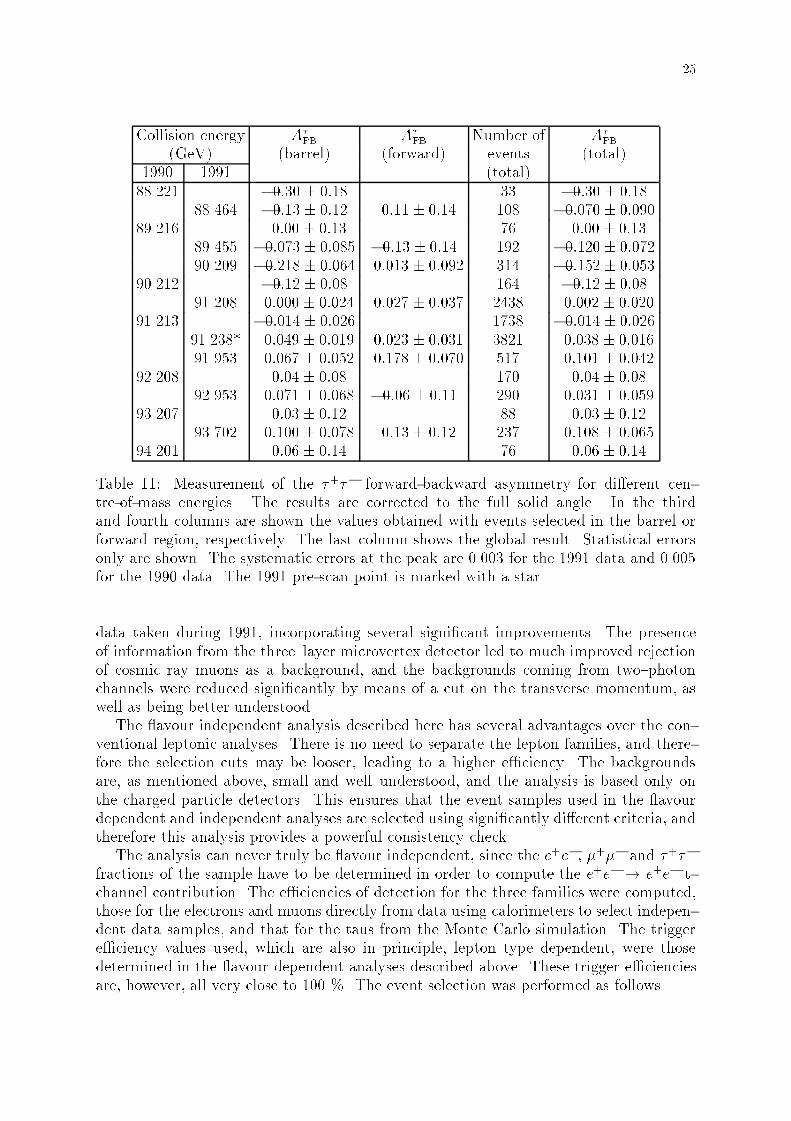
25
Collision energy A�FB
A�FB
Number of A�FB
(GeV) (barrel) (forward) events (total)1990 1991 (total)
88.221 �0:30 � 0:18 33 �0:30 � 0:1888.464 �0:13 � 0:12 0:11� 0:14 108 �0:070 � 0:090
89.216 0:00 � 0:13 76 0:00 � 0:1389.455 �0:073 � 0:085 �0:13 � 0:14 192 �0:120 � 0:07290.209 �0:218 � 0:064 0:013 � 0:092 314 �0:152 � 0:053
90.212 �0:12 � 0:08 164 �0:12 � 0:0891.208 0:000 � 0:024 0:027 � 0:037 2438 0:002 � 0:020
91.213 �0:014 � 0:026 1738 �0:014 � 0:02691.238* 0:049 � 0:019 0:023 � 0:031 3821 0:038 � 0:01691.953 0:067 � 0:052 0:178 � 0:070 517 0:101 � 0:042
92.208 0:04 � 0:08 170 0:04 � 0:0892.953 0:071 � 0:068 �0:06 � 0:11 290 0:031 � 0:059
93.207 0:03 � 0:12 88 0:03 � 0:1293.702 0:100 � 0:078 0:13� 0:12 237 0:108 � 0:065
94.201 0:06 � 0:14 76 0:06 � 0:14
Table 11: Measurement of the �+�� forward-backward asymmetry for di�erent cen-tre-of-mass energies. The results are corrected to the full solid angle. In the thirdand fourth columns are shown the values obtained with events selected in the barrel orforward region, respectively. The last column shows the global result. Statistical errorsonly are shown. The systematic errors at the peak are 0.003 for the 1991 data and 0.005for the 1990 data. The 1991 pre-scan point is marked with a star.
data taken during 1991, incorporating several signi�cant improvements. The presenceof information from the three{layer microvertex detector led to much improved rejectionof cosmic ray muons as a background, and the backgrounds coming from two{photonchannels were reduced signi�cantly by means of a cut on the transverse momentum, aswell as being better understood.
The avour independent analysis described here has several advantages over the con-ventional leptonic analyses. There is no need to separate the lepton families, and there-fore the selection cuts may be looser, leading to a higher e�ciency. The backgroundsare, as mentioned above, small and well{understood, and the analysis is based only onthe charged particle detectors. This ensures that the event samples used in the avourdependent and independent analyses are selected using signi�cantly di�erent criteria, andtherefore this analysis provides a powerful consistency check.
The analysis can never truly be avour independent, since the e+e�, �+�� and �+��
fractions of the sample have to be determined in order to compute the e+e� ! e+e� t-channel contribution. The e�ciencies of detection for the three families were computed,those for the electrons and muons directly from data using calorimeters to select indepen-dent data samples, and that for the taus from the Monte Carlo simulation. The triggere�ciency values used, which are also in principle, lepton type dependent, were thosedetermined in the avour dependent analyses described above. These trigger e�cienciesare, however, all very close to 100 %. The event selection was performed as follows.
26
� The event had to have between 2 and 6 `good' charged particles in the TPC, where`good' implies that the particle had more than 0:2 GeV momentum and originatedfrom within of � 4.5 cm in z and 3.0 cm in r from the average interaction point.
� The analysis was restricted to the barrel region only; it was required that there were2 or more `good' charged particles having a polar angle between 43� and 137�.
� Dividing the event into two hemispheres by a plane perpendicular to the thrust axis,it was required that one hemisphere should contain one charged particle only andthe other between 1 and 5 charged particles.
� For the group of 1 to 5 charged particles (hereafter called the `jet' although no jet{�nding algorithm is used) a resultant momentumwas calculated, and it was requiredthat this momentum vector should deviate by no more than 20� from the backwardsprojection of the direction of the isolated charged particle (they should have anacollinearity of less than 20� for any topology).
� No charged particle in the jet should be at an angle of more than 30� from theresultant.
� In order to eliminate beam-gas and two-photon events it was demanded that at leastone charged particle in the event should have a momentum greater than 3:0 GeV.
� To reduce the background from two{photon events it was required that, if there wereonly two charged particles and both had a momentum less than 10 GeV, the totalmissing transverse momentum with respect to the beam direction should exceed0:4 GeV.
� To reduce the background from cosmic ray muons, it was required that, if therewere only two charged particles in the event, both particles should originate froma much smaller region around the average interaction point. For events where themicrovertex detector information was present for both particles and there was a wellreconstructed interaction point, this was 0.15 cm in r and 4.5 cm in z. If any of thisinformation was missing (this was the case for approximately 15% of the data) thevalues were 1.5 cm and 4.5 cm, respectively.
These criteria resulted in the selection of 23,169 events for use in the cross section andasymmetry calculations, with a corresponding total integrated luminosity of 10.7 pb�1. Are-analysis of the 1990 data was also made using the same selections as given above. Alsothe two-layer microvertex detector was included in the track-�t, leading to an improvedrejection of cosmics and a better momentum resolution.
6.4.1 E�ciencies
Events from the e+e� and �+�� channels are primarily of the 1 � 1 topology, hencethe major loss for these channels was the failure to reconstruct one or both of the twoparticles and the subsequent rejection of the event in the selection criteria. Track losscan be divided into two sources | the passing of a particle through an insensitive region(`crack') of the TPC, (4.24 �0.15)%, and the failure to detect a particle in a `live' region.The `live{space' losses were (0.00 �0.30)% and (1.00 �0.39)% for muons and electronsrespectively, giving �nal reconstruction e�ciencies per track of (95.76 �0.34)% and (94.80�0.42)% for muons and electrons, respectively.
It is di�cult to select a sample of taus from the data in a manner independent ofthat described in this Section 6.4, as is required for a determination of the detectione�ciency, so a sample of Monte Carlo events generated using KORALZ [11] was treatedwith exactly the same analysis procedure as the real data. The e�ciency was found to be(55.51 � 0.51)%, which corresponds to an e�ciency of (83.30 � 0.77)% for �+�� events
27
in the barrel region. Both these �gures include a correction of (0.65 � 0.25)% to matchthe di�erences in the losses in the TPC cracks between Monte Carlo simulation and data.
A correction must also be applied for the trigger e�ciencies. The correction factor wasthe average value for the individual lepton channels, weighted by the estimated numberof events from that channel in the sample.
6.4.2 Backgrounds
There are several backgrounds to the leptonic channels which must be considered.The three primary ones are those arising from cosmic ray muons, two{photon events andZ0 events with hadronic �nal states. The background from cosmic rays was calculatedusing the distribution of impact parameters within the data, and extrapolating into theselected region. It was found to be 98 events with two charged particles and 82 eventswith three. The relative background from events with three detected charged particleswas larger because of the less stringent vertex selection criteria for this topology. Thecosmic background events were distributed over the energy range according to the totalintegrated luminosity recorded at each point, as an approximation to the time spenttaking data at each energy. The �nal estimate of the background on the peak was 0.61%with an error of 0.04%.
The two{photon background was studied using the generator described in ref. [13].The contributions from the e+e�e+e�, e+e��+��, e+e��+��, e+e�hadrons channelswere all evaluated separately by generating 50,000 to 100,000 events of each sort. It wasfound that the initial demands on the momentum reduced the background considerably,and then that the missing transverse momentum cut was extremely powerful in rejectingthe e+e�e+e� and e+e��+�� cases, whilst the isolation angle cuts (those on openingangle and acollinearity) were e�ective against the e+e��+�� and e+e�hadrons states.The results were investigated for model dependence and stability to the simulated beamenergy. The �nal result is a total two-photon background cross section of 5:8�0:3 pb. Theerror represents a combination of the statistical error on the number of events passing thecuts and the estimated error from the generator for each contribution. This backgroundis non{resonant and is to be subtracted from the �nal cross sections after they have beencorrected for e�ciencies and backgrounds, but before they are scaled up to 4� solid angle.
The hadronic background was calculated from a sample of 152,000 Monte Carlo eventssimulating the 1991 running conditions, of which 1749 had 8 or fewer charged particles.Of this sample only 16 passed the �nal cuts (the isolation angle cut being the moste�ective). This number, as a fraction of the number of initial hadrons, was then scaledusing the hadron cross section at each energy to produce a resonant background of (0.12�0.03)% where the error comes from the low statistics and uncertainty in the accuracyof the Monte Carlo simulation at these low multiplicities.
6.4.3 Cross Section
The cross section was calculated for each of the energies at which LEP producedcollisions in 1991, with the point nearest to the Z0 mass split into two for data collectedin the early part of the year, and that collected during the line{scan. The number of eventsselected at each point was modi�ed by corrections for the backgrounds given above, andcorrected by a factor of 1.001 for the trigger e�ciency. The number of electrons withinthe sample was then determined using the individual selection e�ciencies, and hence thecontribution of e+e� t{channel was computed and subtracted. The remaining total was
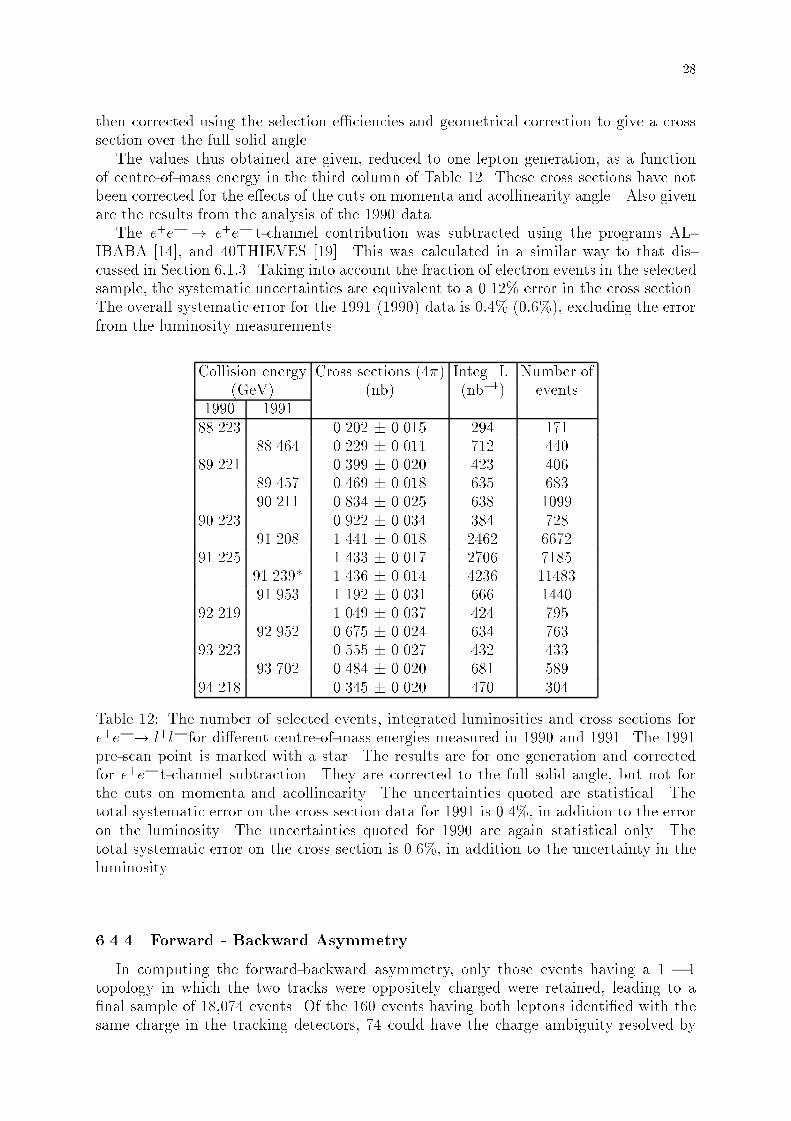
28
then corrected using the selection e�ciencies and geometrical correction to give a crosssection over the full solid angle.
The values thus obtained are given, reduced to one lepton generation, as a functionof centre-of-mass energy in the third column of Table 12. These cross sections have notbeen corrected for the e�ects of the cuts on momenta and acollinearity angle . Also givenare the results from the analysis of the 1990 data.
The e+e� ! e+e� t-channel contribution was subtracted using the programs AL-IBABA [14], and 40THIEVES [19]. This was calculated in a similar way to that dis-cussed in Section 6:1:3. Taking into account the fraction of electron events in the selectedsample, the systematic uncertainties are equivalent to a 0.12% error in the cross section.The overall systematic error for the 1991 (1990) data is 0:4% (0:6%), excluding the errorfrom the luminosity measurements.
Collision energy Cross sections (4�) Integ. L. Number of(GeV) (nb) (nb�1) events
1990 1991
88.223 0.202 � 0.015 294 17188.464 0.229 � 0.011 712 440
89.221 0.399 � 0.020 423 40689.457 0.469 � 0.018 635 68390.211 0.834 � 0.025 638 1099
90.223 0.922 � 0.034 384 72891.208 1.441 � 0.018 2462 6672
91.225 1.433 � 0.017 2706 718591.239* 1.436 � 0.014 4236 1148391.953 1.192 � 0.031 666 1440
92.219 1.049 � 0.037 424 79592.952 0.675 � 0.024 634 763
93.223 0.555 � 0.027 432 43393.702 0.484 � 0.020 681 589
94.218 0.345 � 0.020 470 304
Table 12: The number of selected events, integrated luminosities and cross sections fore+e� ! l+l� for di�erent centre-of-mass energies measured in 1990 and 1991. The 1991pre-scan point is marked with a star. The results are for one generation and correctedfor e+e� t-channel subtraction. They are corrected to the full solid angle, but not forthe cuts on momenta and acollinearity. The uncertainties quoted are statistical. Thetotal systematic error on the cross section data for 1991 is 0.4%, in addition to the erroron the luminosity. The uncertainties quoted for 1990 are again statistical only. Thetotal systematic error on the cross section is 0.6%, in addition to the uncertainty in theluminosity.
6.4.4 Forward - Backward Asymmetry
In computing the forward-backward asymmetry, only those events having a 1 � 1topology in which the two tracks were oppositely charged were retained, leading to a�nal sample of 18,074 events. Of the 160 events having both leptons identi�ed with thesame charge in the tracking detectors, 74 could have the charge ambiguity resolved by
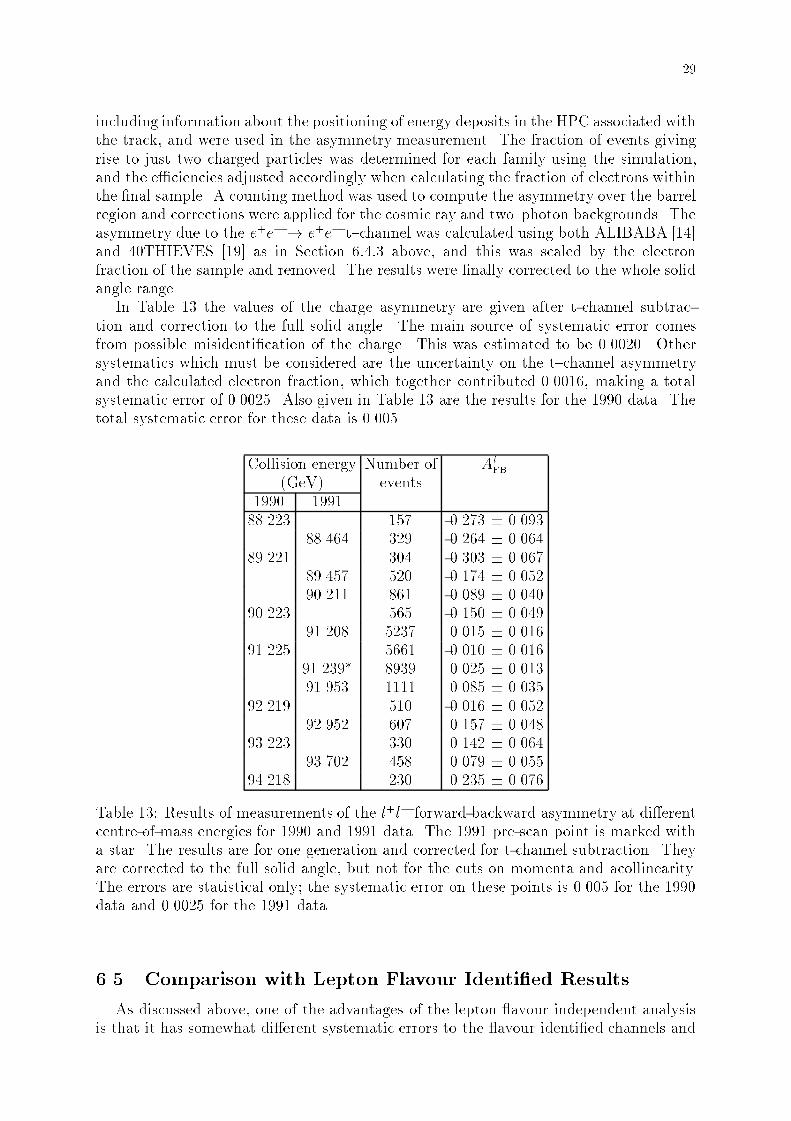
29
including information about the positioning of energy deposits in the HPC associated withthe track, and were used in the asymmetry measurement. The fraction of events givingrise to just two charged particles was determined for each family using the simulation,and the e�ciencies adjusted accordingly when calculating the fraction of electrons withinthe �nal sample. A counting method was used to compute the asymmetry over the barrelregion and corrections were applied for the cosmic ray and two{photon backgrounds. Theasymmetry due to the e+e� ! e+e� t{channel was calculated using both ALIBABA [14]and 40THIEVES [19] as in Section 6:4:3 above, and this was scaled by the electronfraction of the sample and removed. The results were �nally corrected to the whole solidangle range.
In Table 13 the values of the charge asymmetry are given after t-channel subtrac-tion and correction to the full solid angle. The main source of systematic error comesfrom possible misidenti�cation of the charge. This was estimated to be 0.0020. Othersystematics which must be considered are the uncertainty on the t{channel asymmetryand the calculated electron fraction, which together contributed 0.0016, making a totalsystematic error of 0.0025. Also given in Table 13 are the results for the 1990 data. Thetotal systematic error for these data is 0.005.
Collision energy Number of AlFB
(GeV) events1990 199188.223 157 -0.273 � 0.093
88.464 329 -0.264 � 0.06489.221 304 -0.303 � 0.067
89.457 520 -0.174 � 0.05290.211 861 -0.089 � 0.040
90.223 565 -0.150 � 0.04991.208 5237 0.015 � 0.016
91.225 5661 -0.010 � 0.01691.239* 8939 0.025 � 0.01391.953 1111 0.085 � 0.035
92.219 510 -0.016 � 0.05292.952 607 0.157 � 0.048
93.223 330 0.142 � 0.06493.702 458 0.079 � 0.055
94.218 230 0.235 � 0.076
Table 13: Results of measurements of the l+l� forward-backward asymmetry at di�erentcentre-of-mass energies for 1990 and 1991 data. The 1991 pre-scan point is marked witha star. The results are for one generation and corrected for t-channel subtraction. Theyare corrected to the full solid angle, but not for the cuts on momenta and acollinearity.The errors are statistical only; the systematic error on these points is 0.005 for the 1990data and 0.0025 for the 1991 data.
6.5 Comparison with Lepton Flavour Identi�ed Results
As discussed above, one of the advantages of the lepton avour independent analysisis that it has somewhat di�erent systematic errors to the avour identi�ed channels and
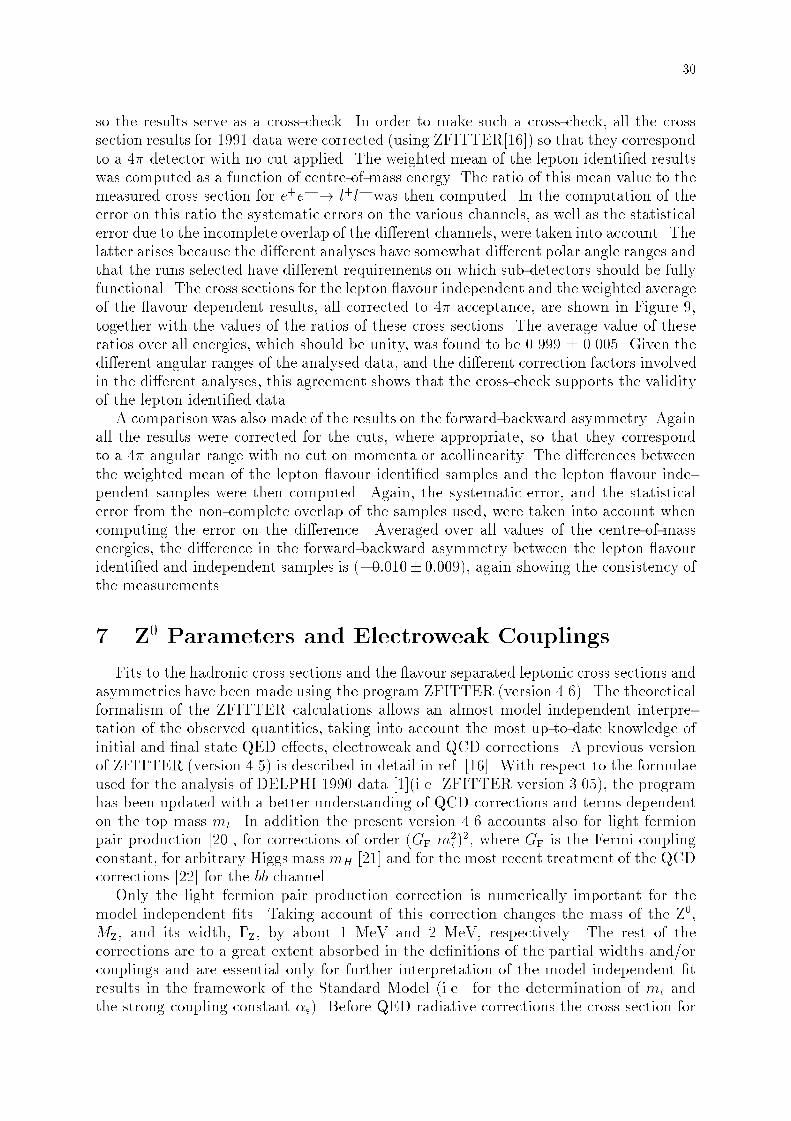
30
so the results serve as a cross-check. In order to make such a cross-check, all the crosssection results for 1991 data were corrected (using ZFITTER[16]) so that they correspondto a 4� detector with no cut applied. The weighted mean of the lepton identi�ed resultswas computed as a function of centre-of-mass energy. The ratio of this mean value to themeasured cross section for e+e� ! l+l� was then computed. In the computation of theerror on this ratio the systematic errors on the various channels, as well as the statisticalerror due to the incomplete overlap of the di�erent channels, were taken into account. Thelatter arises because the di�erent analyses have somewhat di�erent polar angle ranges andthat the runs selected have di�erent requirements on which sub-detectors should be fullyfunctional. The cross sections for the lepton avour independent and the weighted averageof the avour dependent results, all corrected to 4� acceptance, are shown in Figure 9,together with the values of the ratios of these cross sections. The average value of theseratios over all energies, which should be unity, was found to be 0.999 � 0.005. Given thedi�erent angular ranges of the analysed data, and the di�erent correction factors involvedin the di�erent analyses, this agreement shows that the cross-check supports the validityof the lepton identi�ed data.
A comparison was also made of the results on the forward-backward asymmetry. Againall the results were corrected for the cuts, where appropriate, so that they correspondto a 4� angular range with no cut on momenta or acollinearity. The di�erences betweenthe weighted mean of the lepton avour identi�ed samples and the lepton avour inde-pendent samples were then computed. Again, the systematic error, and the statisticalerror from the non-complete overlap of the samples used, were taken into account whencomputing the error on the di�erence. Averaged over all values of the centre-of-massenergies, the di�erence in the forward-backward asymmetry between the lepton avouridenti�ed and independent samples is (�0:010� 0:009), again showing the consistency ofthe measurements.
7 Z0 Parameters and Electroweak Couplings
Fits to the hadronic cross sections and the avour separated leptonic cross sections andasymmetries have been made using the program ZFITTER (version 4.6). The theoreticalformalism of the ZFITTER calculations allows an almost model independent interpre-tation of the observed quantities, taking into account the most up-to-date knowledge ofinitial and �nal state QED e�ects, electroweak and QCD corrections. A previous versionof ZFITTER (version 4.5) is described in detail in ref. [16]. With respect to the formulaeused for the analysis of DELPHI 1990 data [1](i.e. ZFITTER version 3.05), the programhas been updated with a better understanding of QCD corrections and terms dependenton the top mass mt. In addition the present version 4.6 accounts also for light fermionpair production [20], for corrections of order (G
Fm2
t )2, where G
Fis the Fermi coupling
constant, for arbitrary Higgs mass mH [21] and for the most recent treatment of the QCDcorrections [22] for the b�b channel.
Only the light fermion pair production correction is numerically important for themodel independent �ts. Taking account of this correction changes the mass of the Z0,M
Z, and its width, �
Z, by about 1 MeV and 2 MeV, respectively. The rest of the
corrections are to a great extent absorbed in the de�nitions of the partial widths and/orcouplings and are essential only for further interpretation of the model independent �tresults in the framework of the Standard Model (i.e. for the determination of mt andthe strong coupling constant �s). Before QED radiative corrections the cross section for
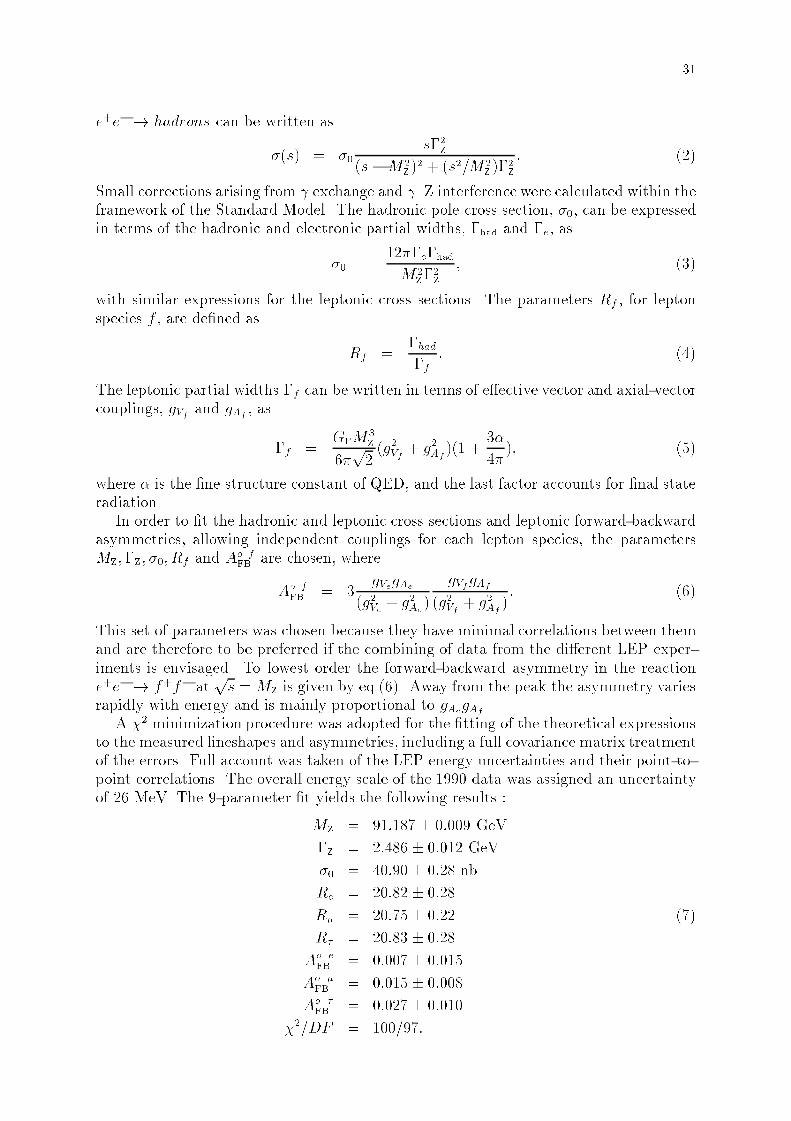
31
e+e� ! hadrons can be written as
�(s) = �0s�2
Z
(s�M2Z)2 + (s2=M2
Z)�2
Z
: (2)
Small corrections arising from exchange and {Z interference were calculated within theframework of the Standard Model. The hadronic pole cross section, �0, can be expressedin terms of the hadronic and electronic partial widths, �
hadand �e, as
�0 =12��e�had
M2Z�2Z
; (3)
with similar expressions for the leptonic cross sections. The parameters Rf , for leptonspecies f , are de�ned as
Rf =�had
�f: (4)
The leptonic partial widths �f can be written in terms of e�ective vector and axial-vectorcouplings, gVf and gAf
, as
�f =GFM3
Z
6�p2(g2Vf + g2Af
)(1 +3�
4�); (5)
where � is the �ne structure constant of QED, and the last factor accounts for �nal stateradiation.
In order to �t the hadronic and leptonic cross sections and leptonic forward-backwardasymmetries, allowing independent couplings for each lepton species, the parametersM
Z;�
Z; �0; Rf and Ao
FB
f are chosen, where
AoFB
f = 3gVegAe
(g2Ve + g2Ae)
gVf gAf
(g2Vf + g2Af): (6)
This set of parameters was chosen because they have minimal correlations between themand are therefore to be preferred if the combining of data from the di�erent LEP exper-iments is envisaged. To lowest order the forward-backward asymmetry in the reactione+e� ! f+f� at
ps = M
Zis given by eq.(6). Away from the peak the asymmetry varies
rapidly with energy and is mainly proportional to gAegAf.
A �2 minimization procedure was adopted for the �tting of the theoretical expressionsto the measured lineshapes and asymmetries, including a full covariance matrix treatmentof the errors. Full account was taken of the LEP energy uncertainties and their point-to-point correlations. The overall energy scale of the 1990 data was assigned an uncertaintyof 26 MeV. The 9-parameter �t yields the following results :
MZ
= 91:187 � 0:009 GeV
�Z
= 2:486 � 0:012 GeV
�0 = 40:90 � 0:28 nb
Re = 20:82 � 0:28
R� = 20:75 � 0:22 (7)
R� = 20:83 � 0:28
AoFB
e = 0:007 � 0:015
AoFB
� = 0:015 � 0:008
AoFB
� = 0:027 � 0:010
�2=DF = 100=97:
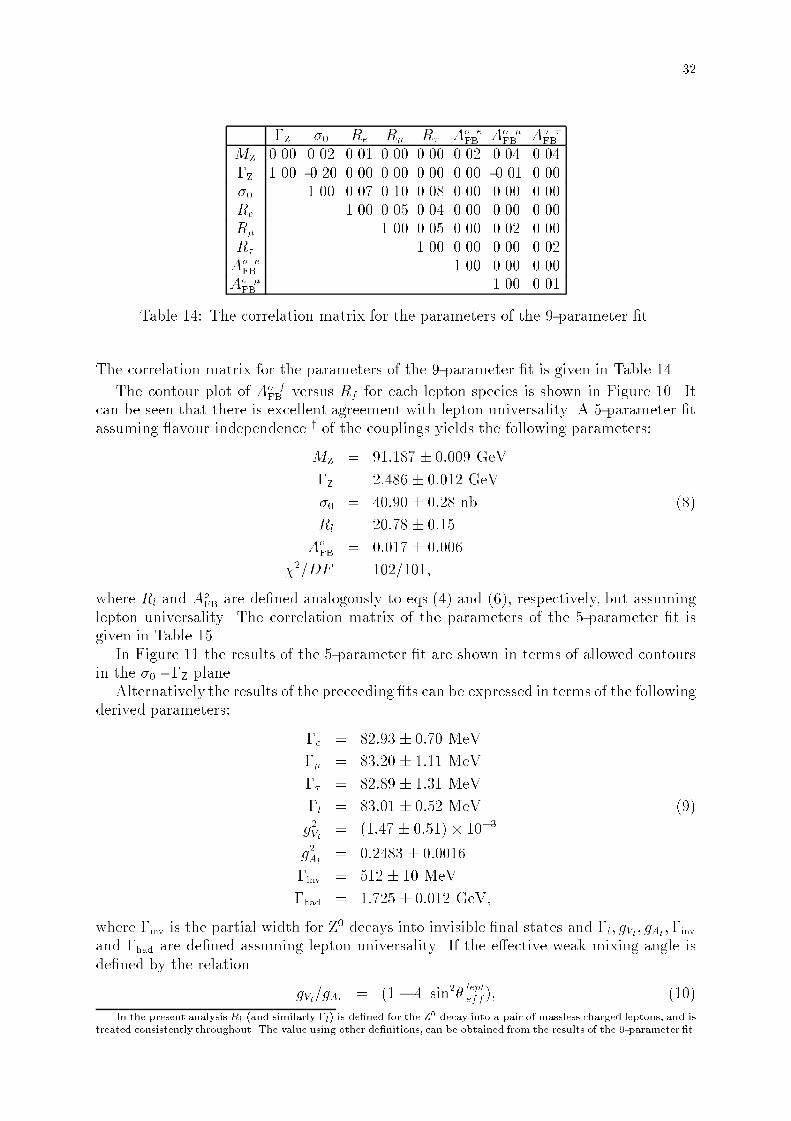
32
�Z
�0 Re R� R� AoFB
e AoFB
� AoFB
�
MZ
0.00 0.02 0.01 0.00 0.00 0.02 0.04 0.04�Z
1.00 -0.20 0.00 0.00 0.00 0.00 -0.01 0.00�0 1.00 0.07 0.10 0.08 0.00 0.00 0.00Re 1.00 0.05 0.04 0.00 0.00 0.00R� 1.00 0.05 0.00 0.02 0.00R� 1.00 0.00 0.00 0.02AoFB
e 1.00 0.00 0.00AoFB
� 1.00 0.01
Table 14: The correlation matrix for the parameters of the 9-parameter �t.
The correlation matrix for the parameters of the 9-parameter �t is given in Table 14.
The contour plot of AoFB
f versus Rf for each lepton species is shown in Figure 10. Itcan be seen that there is excellent agreement with lepton universality. A 5-parameter �tassuming avour independence y of the couplings yields the following parameters:
MZ
= 91:187 � 0:009 GeV
�Z
= 2:486 � 0:012 GeV
�0 = 40:90 � 0:28 nb (8)
Rl = 20:78 � 0:15
AoFB
= 0:017 � 0:006
�2=DF = 102=101;
where Rl and AoFB
are de�ned analogously to eqs.(4) and (6), respectively, but assuminglepton universality. The correlation matrix of the parameters of the 5-parameter �t isgiven in Table 15.
In Figure 11 the results of the 5-parameter �t are shown in terms of allowed contoursin the �0 - �Z plane.
Alternatively the results of the preceeding �ts can be expressed in terms of the followingderived parameters:
�e = 82:93 � 0:70 MeV
�� = 83:20 � 1:11 MeV
�� = 82:89 � 1:31 MeV
�l = 83:01 � 0:52 MeV (9)
g2Vl = (1:47 � 0:51)� 10�3
g2Al= 0:2483 � 0:0016
�inv
= 512 � 10 MeV
�had
= 1:725 � 0:012 GeV;
where �inv
is the partial width for Z0 decays into invisible �nal states and �l; gVl; gAl;�
inv
and �had
are de�ned assuming lepton universality. If the e�ective weak mixing angle isde�ned by the relation
gVl=gAl= (1� 4 sin2� lept
eff ); (10)yIn the present analysis Rl (and similarly �l) is de�ned for the Z
0 decay into a pair of massless charged leptons, and is
treated consistently throughout. The value using other de�nitions, can be obtained from the results of the 9-parameter �t.
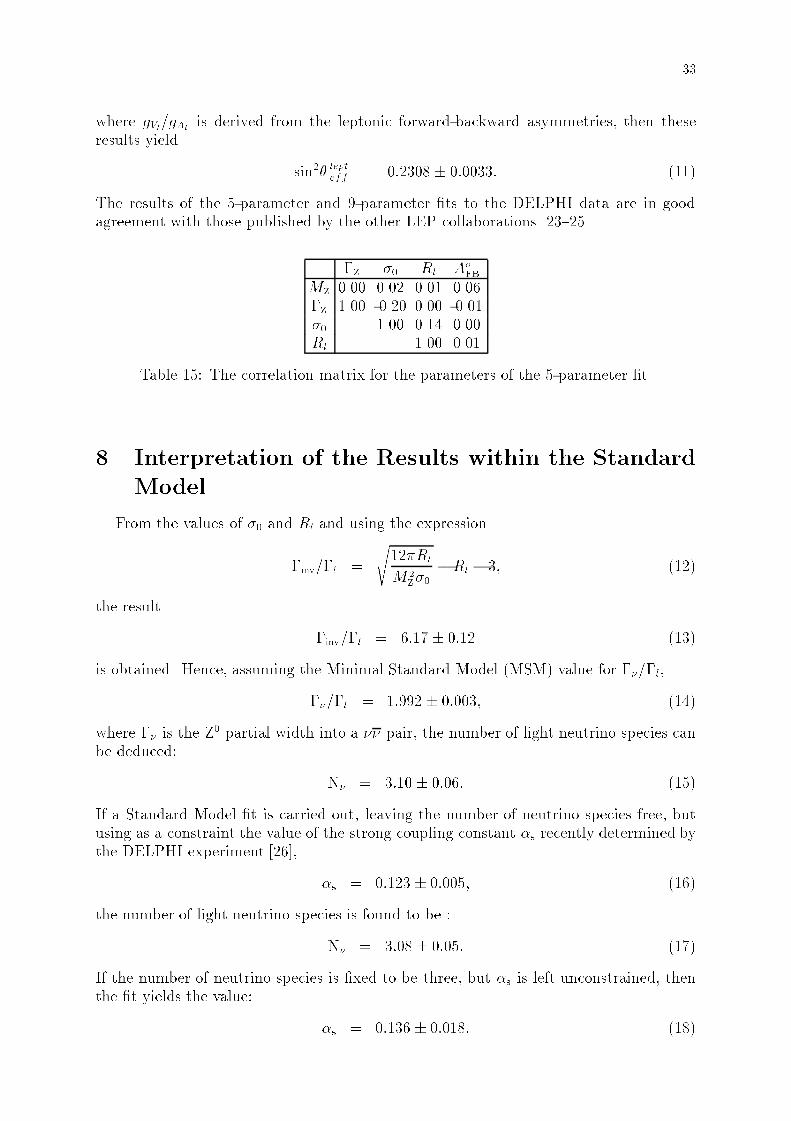
33
where gVl=gAlis derived from the leptonic forward-backward asymmetries, then these
results yield
sin2� lepteff = 0:2308 � 0:0033: (11)
The results of the 5-parameter and 9-parameter �ts to the DELPHI data are in goodagreement with those published by the other LEP collaborations [23{25].
�Z
�0 Rl AoFB
MZ0.00 0.02 0.01 0.06
�Z
1.00 -0.20 0.00 -0.01�0 1.00 0.14 0.00Rl 1.00 0.01
Table 15: The correlation matrix for the parameters of the 5-parameter �t.
8 Interpretation of the Results within the Standard
Model
From the values of �0 and Rl and using the expression
�inv=�l =
s12�Rl
M2Z�0�Rl � 3; (12)
the result
�inv=�l = 6:17 � 0:12 (13)
is obtained. Hence, assuming the Minimal Standard Model (MSM) value for ��=�l,
��=�l = 1:992 � 0:003; (14)
where �� is the Z0 partial width into a �� pair, the number of light neutrino species can
be deduced:
N� = 3:10 � 0:06: (15)
If a Standard Model �t is carried out, leaving the number of neutrino species free, butusing as a constraint the value of the strong coupling constant �s recently determined bythe DELPHI experiment [26],
�s = 0:123 � 0:005; (16)
the number of light neutrino species is found to be :
N� = 3:08 � 0:05: (17)
If the number of neutrino species is �xed to be three, but �s is left unconstrained, thenthe �t yields the value:
�s = 0:136 � 0:018: (18)
34
The consistency of these results with the MSM can be seen in Figures 10 and 11 wherethe predictions for a range of values of mt, �s and mH are shown.
A Standard Model �t, assuming three neutrino species, to the cross section and asym-metry data using the value of �s from eq.(16) as a constraint, yields the following valuefor the top quark mass:
mt = 115+52�82(expt:)
+23�24(Higgs) GeV; (19)
where (Higgs) represents the variation due to Higgs boson masses in the range 60 to1000 GeV, with central value 300 GeV. The lower experimental limit is badly determinedand is in any case excluded by searches at hadron colliders [27].
This value of mt corresponds to:
sin2� lepteff = 0:2339�0:0015(expt:)+0:0001
�0:0004(Higgs): (20)
9 Fits in Terms of the Variables S and T
The standard variables used in the analysis of LEP data (�Z;�
had;�l, etc.) can be
expressed in terms of variables S and T [28,29] which parameterize loop e�ects, throughthe relationships
� = 1 + �(MZ)T (21)
�r = �rMSM
+�(M
Z)S
4s20c20
� �(MZ)T;
where
�rMSM
= 1� ��p2G
FM2
Zs20c
20
s20 = sin2�MS(M2
Z) (22)
c20 = 1� s20:
The weak mixing angle �MS
is de�ned in the MS renormalization scheme (see refs. [28,29]).The values S = T = 0 are de�ned to correspond to mt = 140 GeV , mH = 300 GeV and�s = 0:123. The results of the �t are shown in Figure 12. The central values are:
S = �1:33� 1:19 (23)
T = �0:72� 0:71:
In an alternative approach [30] the e�ects of new physics in the gauge boson vacuumpolarization diagrams can be expressed in terms of the parameters �1, �2 and �3. The LEPdata do not constrain the parameter �2. The parameters �1 and �3 are uniquely de�nedfrom the measured values of the leptonic width �l and forward-backward asymmetryAo
FB
atps = M
Z. Using the values of �l and Ao
FBgiven in Section 7, the following values are
obtained:
�1 = �0:0049 � 0:0066 (24)
�3 = �0:0044 � 0:0106:
These parameters have the advantage that their values do not depend on the massesof the top-quark and Higgs boson, or on �s. However, in the interpretation of theseparameters to investigate, for example, physics beyond the MSM, these quantities mustof course be speci�ed.
35
10 Lower Bounds on New Particle Masses
The absence of any signi�cant departure of the observed values of �Zand �
invfrom the
MSM predictions has been converted into lower mass bounds of new particles connectedwith physics beyond the MSM.
The approach described in ref. [1] was repeated in order to determine 95% con�dencelevel upper limits of the potential extra total and invisible widths, �new
Zand �new
inv, associ-
ated to these new particles. The values found are:
�newZ
< 27 MeV (25)
�newinv
< 26 MeV:
With these values the lower mass bounds published in ref. [1] remain essentially un-changed.
11 Summary
During 1990 and 1991 approximately 450,000 Z0 decays into hadrons and charged lep-tons were observed in the DELPHI detector. The increased event statistics coupled withimprovements to the detector and the analysis techniques have allowed the hadronic andleptonic cross sections and the leptonic forward-backward asymmetries to be measuredwith high precision. The 1990 data have been re-evaluated with improved luminositymeasurements. For the 1991 data, the use of the high rate luminosity monitor VSAThas signi�cantly reduced the statistical errors. Using the accurate determinations of theLEP energy, model independent �ts to the data yield signi�cantly improved determina-tions of the Z0 resonance parameters. A avour independent analysis gives leptonic crosssections and asymmetries compatible with those measured in the individual channels.Lepton universality of the Z0 partial widths is con�rmed at the 2% level. Assuminglepton universality the following parameters are obtained:
MZ
= 91:187 � 0:009 GeV
�Z
= 2:486 � 0:012 GeV
�0 = 40:90 � 0:28 nb
Rl = 20:78 � 0:15
AoFB
= 0:017 � 0:006:
From the values of �0 and Rl, the number of light neutrino species has been determinedto be
N� = 3:10� 0:06
or, if DELPHI measurements of the strong coupling constant �s [26] are used as a con-straint,
N� = 3:08 � 0:05:
All cross sections and asymmetries measured are consistent with the Standard Modelexpectations. A �t within the context of that model, using also the DELPHI determina-tion of �s [26], constrains the value of the top mass to be
mt = 115+52�82(expt:)
+23�24(Higgs) GeV;
36
corresponding to a value of the weak mixing angle
sin2�lepteff = 0:2339�0:0015(expt:)+0:0001
�0:0004(Higgs):
Fits to the data have also been performed using variables which parameterize elec-troweak loop e�ects, and which are sensitive to physics beyond the Minimal StandardModel.
Acknowledgements
We are greatly indebted to our technical collaborators and to the funding agencies fortheir support in building and operating the DELPHI detector, and to the members ofthe CERN-SL Division for the excellent performance of the LEP collider.
37
References
[1] DELPHI Collaboration, P. Abreu et al., Nucl. Phys. B367 (1991) 511.[2] L. Arnaudon et al., Phys. Lett. B284 (1992) 431 .[3] The Working Group on LEP Energy and the LEP Collaborations ALEPH, DEL-
PHI, L3 and OPAL, Phys. Lett. B307 (1993) 187.[4] DELPHI Collaboration, P. Aarnio et al. , Nucl. Instr. & Meth. A303 (1991) 233.[5] N. Bingefors et al., Nucl. Instr. & Meth. A328 (1993) 447.[6] DELPHI Collaboration, \High precision relative luminosity measurement with
a Very Small Angle Tagger (VSAT) in DELPHI", DELPHI Note 92-77 (1992),unpublished.
[7] S. Jadach et al., Comput. Phys. Commun. 70 (1992) 305.[8] F.A. Berends, W. Hollik and R.Kleiss, Nucl. Phys. B304 (1988) 712.[9] W. Beenaker and B. Pietrzyk, Phys. Lett. B296 (1992) 241.[10] J. Cuevas et al., Nucl. Instr. & Meth. A274 (1989) 459.[11] S. Jadach, B.F.L. Ward, Z. Was, Comput. Phys. Commun., 66 (1991) 276.[12] J.E. Campagne and R. Zitoun, Z. Phys. C43 (1989) 469.[13] S. Nova, A. Olchevski and T. Todorov, \Monte Carlo event generator for two
photon processes", DELPHI Note 90-35 (1990), unpublished.[14] W.J.P. Beenakker, F.A. Berends and S.C. van der Marck, Nucl. Phys.B349 (1991)
323.[15] G. Montagna et al., Nucl. Phys. B401 (1993) 3, and Comput. Phys. Commun. 76
(1993) 328.[16] D. Bardin et al., \ZFITTER: An Analytical Program for Fermion Pair Production
in e+e� Annihilation", preprint CERN-TH 6443/92 (1992) and references therein.[17] N. Crosland, G. Wilkinson and P. Kluit, \EMMASS muon identi�cation within
DELPHI", DELPHI Note 92-17 (1992), unpublished.[18] DELPHI collaboration, \DELPHI Event generation and detector simulation -
User guide", DELPHI Note 89-67 (1989), unpublished.[19] M. Cacciari et al., Phys. Lett. B268 (1991) 44.[20] B. Kniehl et al., Phys.Lett. B209 (1988) 337; S. Jadach, M. Skrzypec and M.
Martinez, Phys. Lett. B280 (1992) 129.[21] R. Barbieri et al., \Two loop heavy top e�ects in the Standard Model", preprint
CERN-TH 6713/92 (1992).[22] K. G. Chetyrkin et al., Phys.Lett. B282 (1992) 221; K. G. Chetyrkin et al.,
Phys.Lett. B248 (1990) 359.[23] ALEPH Collaboration, D. Buskulic et al., Z. Phys. C60 (1993) 71.[24] L3 Collaboration, O. Adriani et al., \Results from the L3 Experiment at LEP",
preprint CERN-PPE/93-31, Physics Reports to be published.[25] OPAL Collaboration, P.D. Acton et al., Z. Phys. C58 (1993) 219.[26] DELPHI Collaboration, P. Abreu et al., Z. Phys. C59 (1992) 21.[27] CDF Collaboration, F. Abe et al., Phys. Rev. Lett. 68 (1992) 447.[28] W.J. Marciano and J.L. Rosner, Phys. Rev. Lett. 65 (1990) 2963.[29] M.E. Peskin and T. Takeuchi, Phys. Rev. Lett. 65, (1991) 964.[30] G. Altarelli and R. Barbieri, Phys. Lett. B253 (1991) 161; G. Altarelli, R.
Barbieri and S. Jadach, Nucl. Phys. B369 (1992) 3; G. Altarelli, R. Barbieriand F. Caravaglios, Nucl. Phys. B405 (1993) 3.
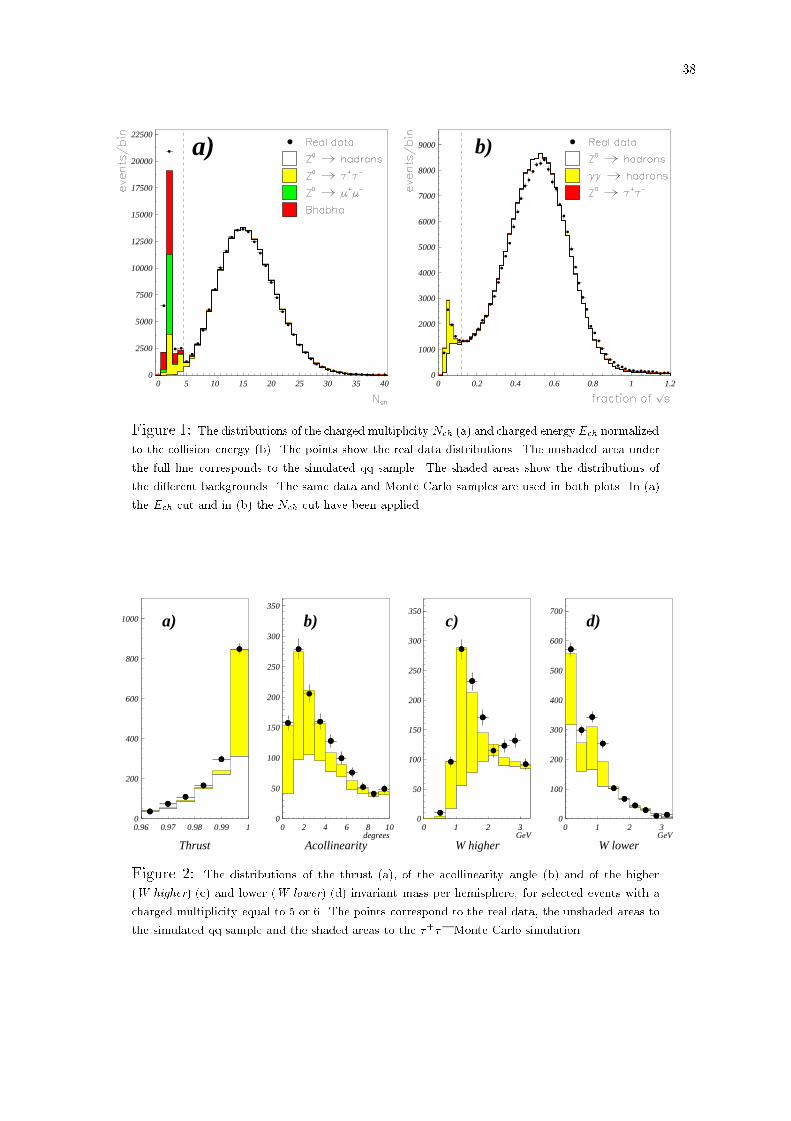
38
0
2500
5000
7500
10000
12500
15000
17500
20000
22500
0 5 10 15 20 25 30 35 40
a)
0
1000
2000
3000
4000
5000
6000
7000
8000
9000
0 0.2 0.4 0.6 0.8 1 1.2
b)
Figure 1: The distributions of the charged multiplicity Nch (a) and charged energy Ech normalized
to the collision energy (b). The points show the real data distributions. The unshaded area under
the full line corresponds to the simulated q�q sample. The shaded areas show the distributions of
the di�erent backgrounds. The same data and Monte Carlo samples are used in both plots. In (a)
the Ech cut and in (b) the Nch cut have been applied.
Thrust
0
200
400
600
800
1000
0.96 0.97 0.98 0.99 1
a)
Acollinearity
0
50
100
150
200
250
300
350
0 2 4 6 8 10
b)
degreesW higher
0
50
100
150
200
250
300
350
0 1 2 3
c)
GeVW lower
0
100
200
300
400
500
600
700
0 1 2 3
d)
GeV
Figure 2: The distributions of the thrust (a), of the acollinearity angle (b) and of the higher
(W higher) (c) and lower (W lower) (d) invariant mass per hemisphere, for selected events with a
charged multiplicity equal to 5 or 6. The points correspond to the real data, the unshaded areas to
the simulated q�q sample and the shaded areas to the �+�� Monte Carlo simulation.
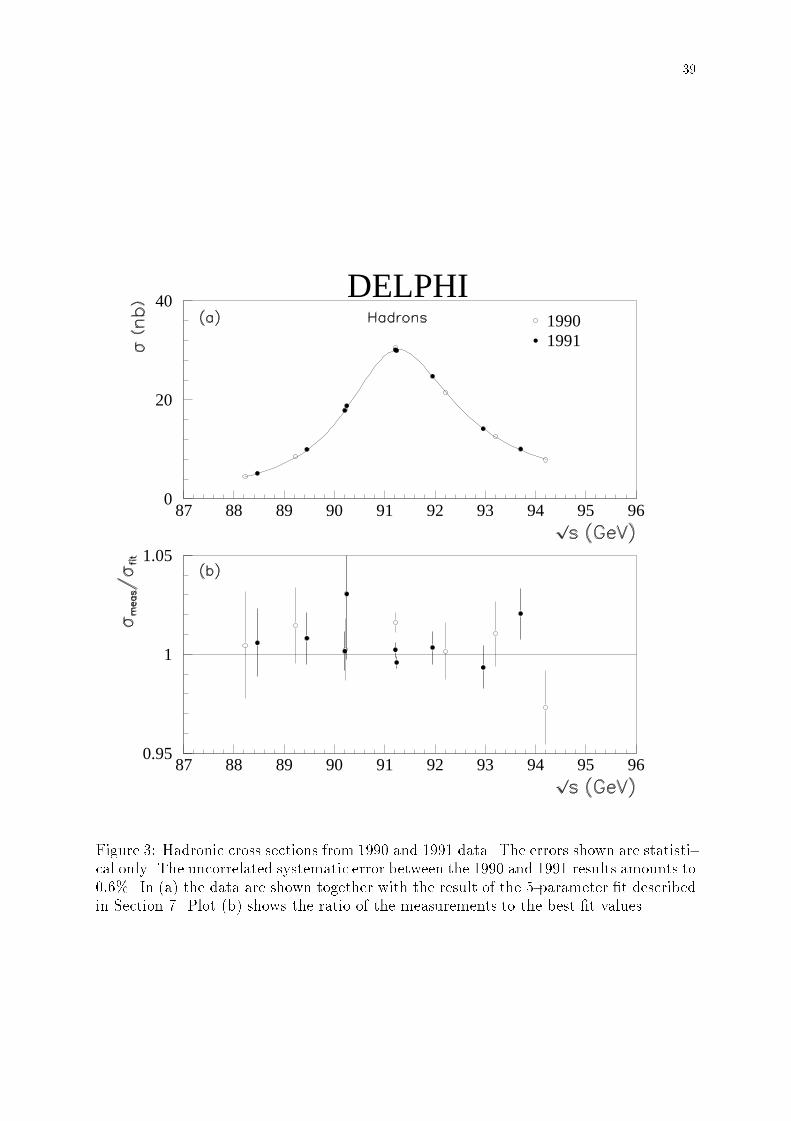
39
0
20
40
87 88 89 90 91 92 93 94 95 96
19901991
DELPHI
0.95
1
1.05
87 88 89 90 91 92 93 94 95 96
Figure 3: Hadronic cross sections from 1990 and 1991 data. The errors shown are statisti-cal only. The uncorrelated systematic error between the 1990 and 1991 results amounts to0:6%. In (a) the data are shown together with the result of the 5-parameter �t describedin Section 7. Plot (b) shows the ratio of the measurements to the best �t values.
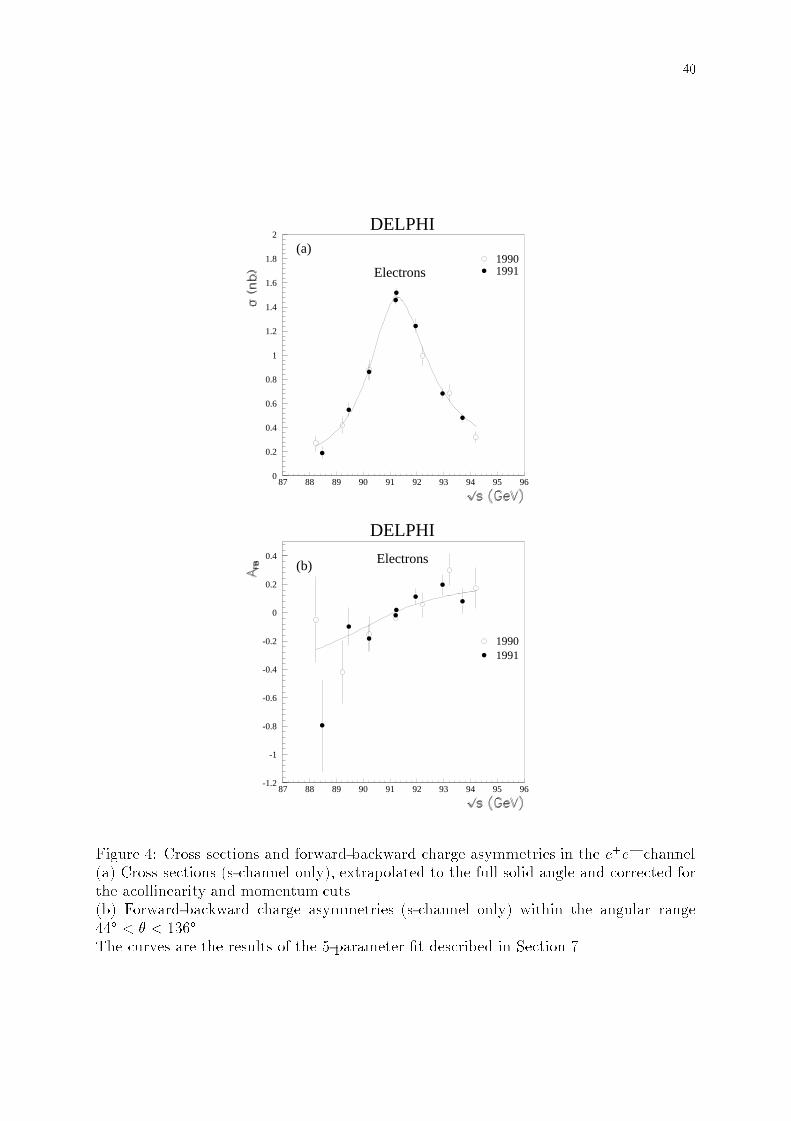
40
0
0.2
0.4
0.6
0.8
1
1.2
1.4
1.6
1.8
2
87 88 89 90 91 92 93 94 95 96
19901991
DELPHI
Electrons
(a)
-1.2
-1
-0.8
-0.6
-0.4
-0.2
0
0.2
0.4
87 88 89 90 91 92 93 94 95 96
19901991
DELPHI
Electrons(b)
Figure 4: Cross sections and forward-backward charge asymmetries in the e+e� channel(a) Cross sections (s-channel only), extrapolated to the full solid angle and corrected forthe acollinearity and momentum cuts.(b) Forward-backward charge asymmetries (s-channel only) within the angular range44� < � < 136�.The curves are the results of the 5-parameter �t described in Section 7.
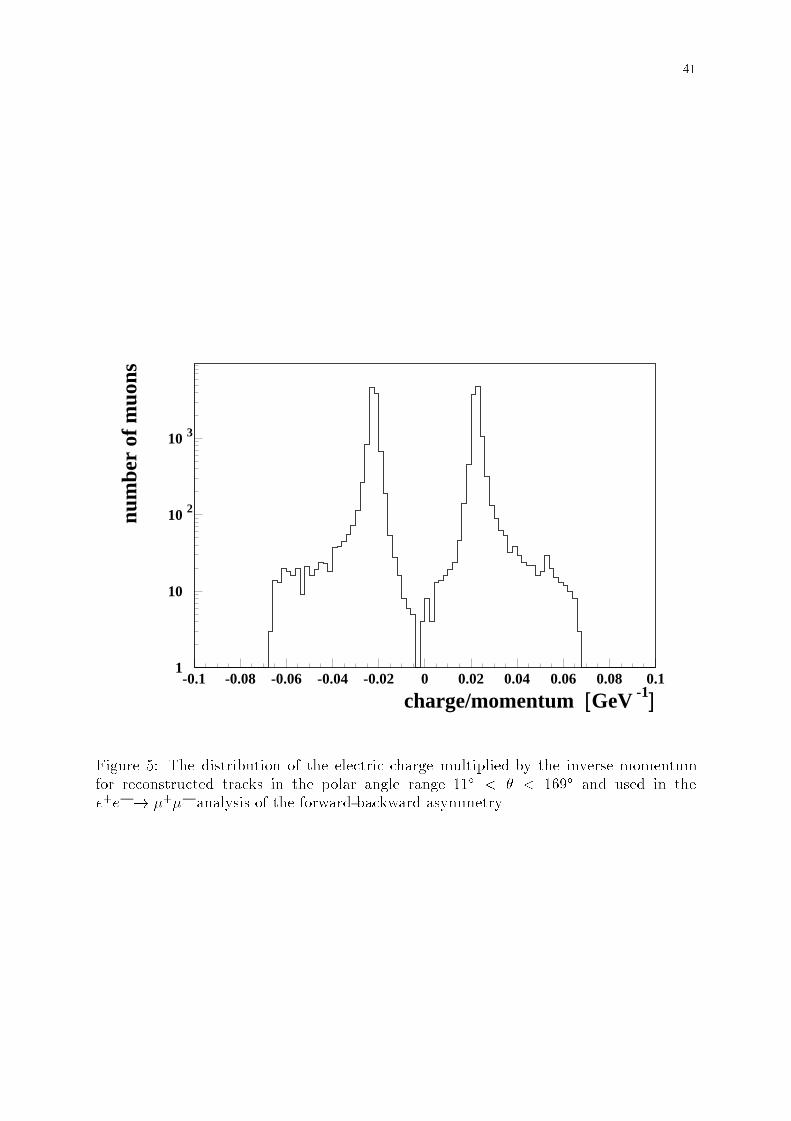
41
1
10
10 2
10 3
-0.1 -0.08 -0.06 -0.04 -0.02 0 0.02 0.04 0.06 0.08 0.1
charge/momentum [GeV -1]
num
ber
of m
uons
Figure 5: The distribution of the electric charge multiplied by the inverse momentumfor reconstructed tracks in the polar angle range 11� < � < 169� and used in thee+e� ! �+�� analysis of the forward-backward asymmetry.
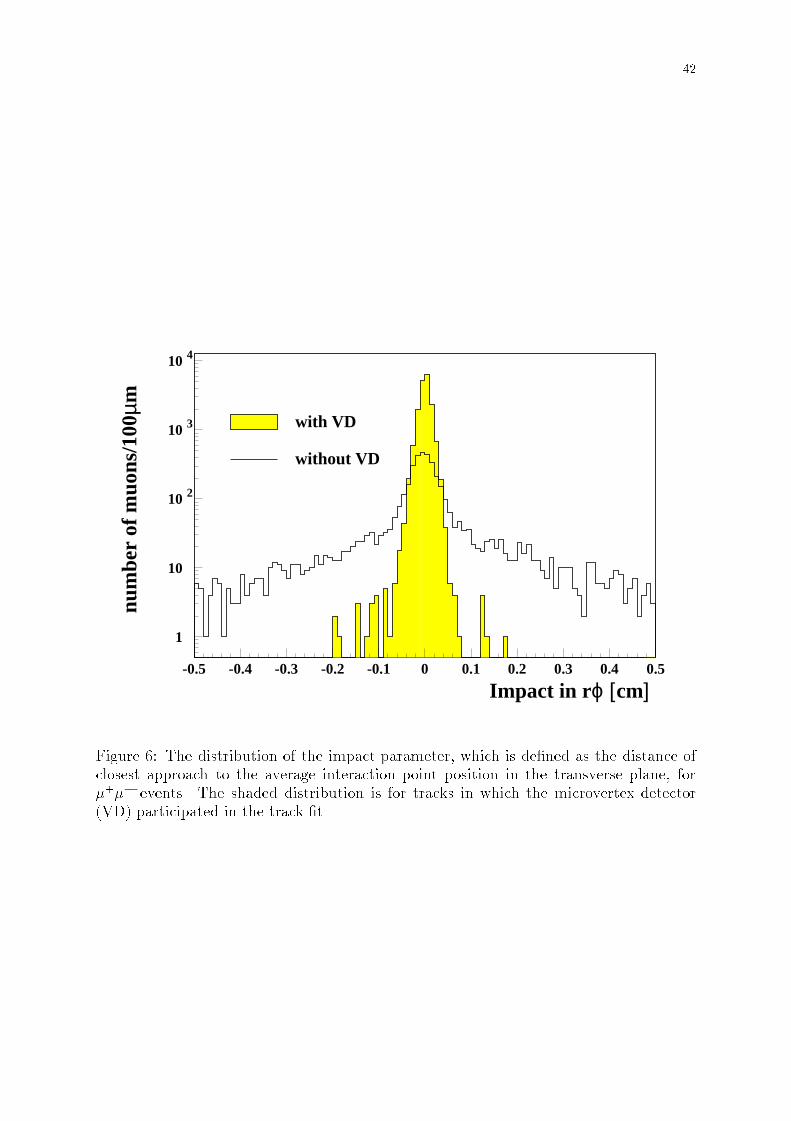
42
1
10
10 2
10 3
10 4
-0.5 -0.4 -0.3 -0.2 -0.1 0 0.1 0.2 0.3 0.4 0.5
with VD
without VD
Impact in r ϕ [cm]
num
ber
of m
uons
/100
µm
Figure 6: The distribution of the impact parameter, which is de�ned as the distance ofclosest approach to the average interaction point position in the transverse plane, for�+�� events. The shaded distribution is for tracks in which the microvertex detector(VD) participated in the track �t.
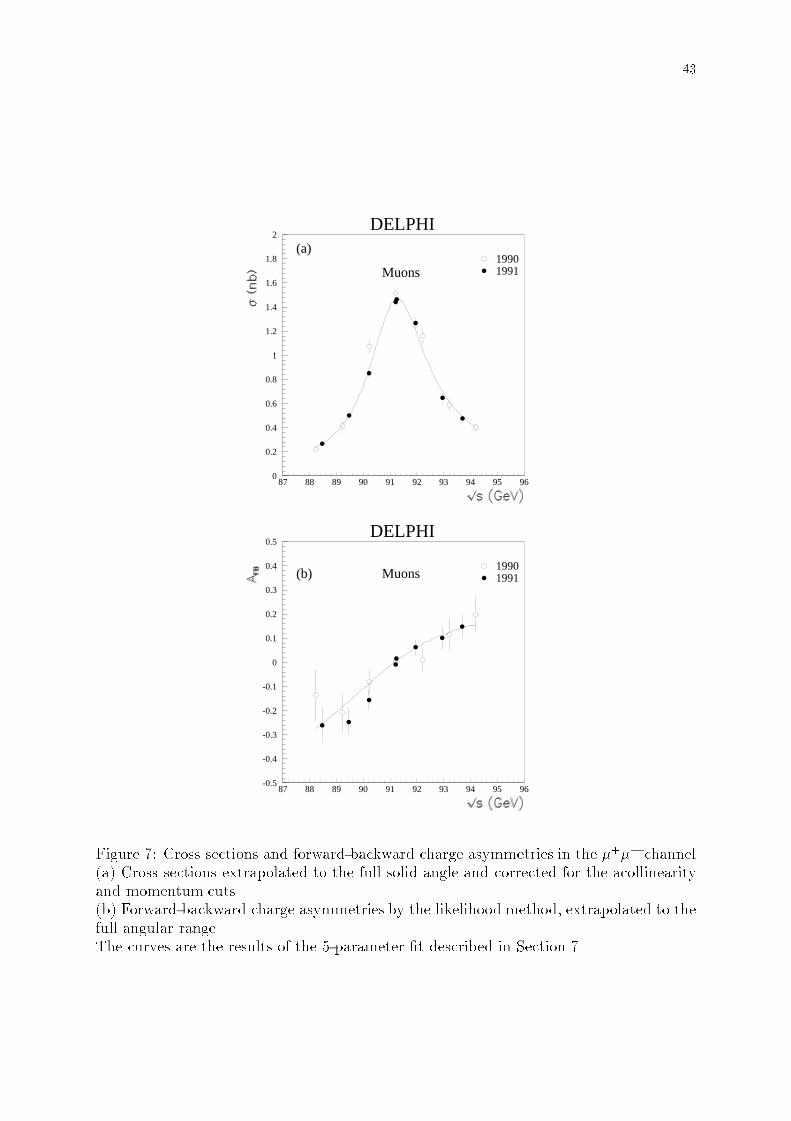
43
0
0.2
0.4
0.6
0.8
1
1.2
1.4
1.6
1.8
2
87 88 89 90 91 92 93 94 95 96
19901991
DELPHI
Muons
(a)
-0.5
-0.4
-0.3
-0.2
-0.1
0
0.1
0.2
0.3
0.4
0.5
87 88 89 90 91 92 93 94 95 96
19901991
DELPHI
Muons(b)
Figure 7: Cross sections and forward-backward charge asymmetries in the �+�� channel(a) Cross sections extrapolated to the full solid angle and corrected for the acollinearityand momentum cuts.(b) Forward-backward charge asymmetries by the likelihood method, extrapolated to thefull angular range.The curves are the results of the 5-parameter �t described in Section 7.
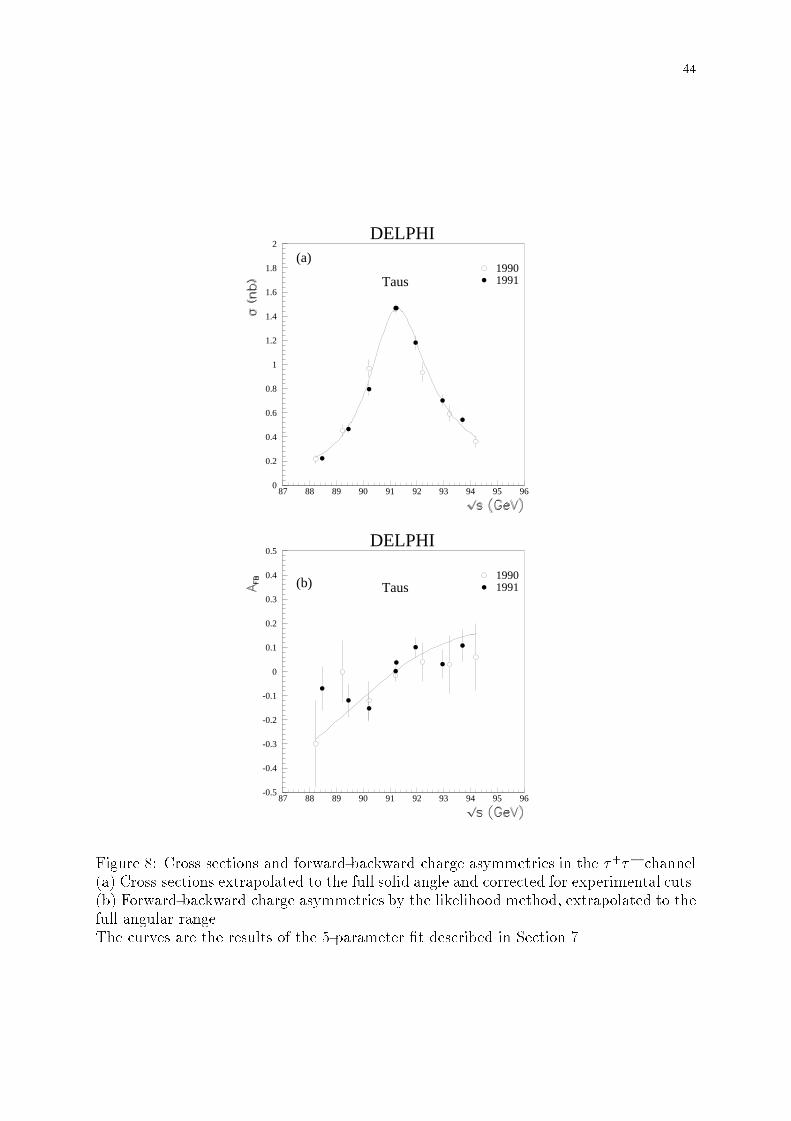
44
0
0.2
0.4
0.6
0.8
1
1.2
1.4
1.6
1.8
2
87 88 89 90 91 92 93 94 95 96
19901991
DELPHI
Taus
(a)
-0.5
-0.4
-0.3
-0.2
-0.1
0
0.1
0.2
0.3
0.4
0.5
87 88 89 90 91 92 93 94 95 96
19901991
DELPHI
Taus(b)
Figure 8: Cross sections and forward-backward charge asymmetries in the �+�� channel(a) Cross sections extrapolated to the full solid angle and corrected for experimental cuts.(b) Forward-backward charge asymmetries by the likelihood method, extrapolated to thefull angular range.The curves are the results of the 5-parameter �t described in Section 7.
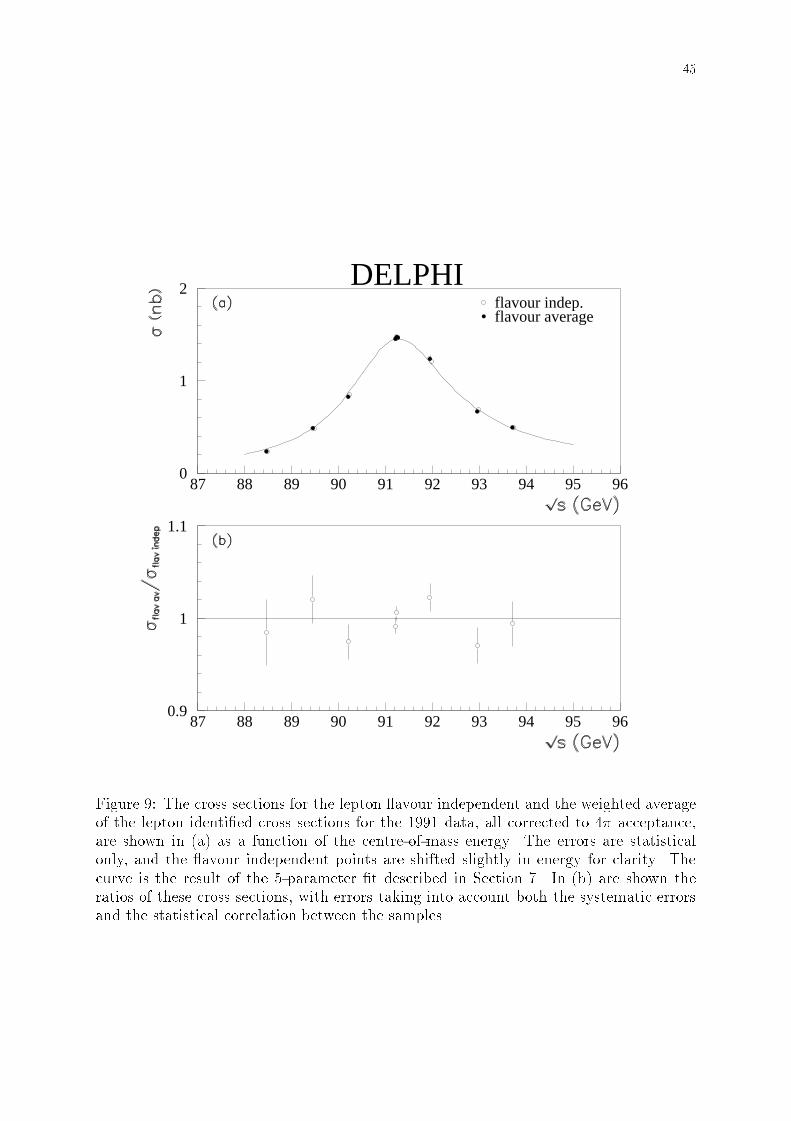
45
0
1
2
87 88 89 90 91 92 93 94 95 96
flavour indep.flavour average
DELPHI
0.9
1
1.1
87 88 89 90 91 92 93 94 95 96
Figure 9: The cross sections for the lepton avour independent and the weighted averageof the lepton identi�ed cross sections for the 1991 data, all corrected to 4� acceptance,are shown in (a) as a function of the centre-of-mass energy. The errors are statisticalonly, and the avour independent points are shifted slightly in energy for clarity. Thecurve is the result of the 5-parameter �t described in Section 7. In (b) are shown theratios of these cross sections, with errors taking into account both the systematic errorsand the statistical correlation between the samples.
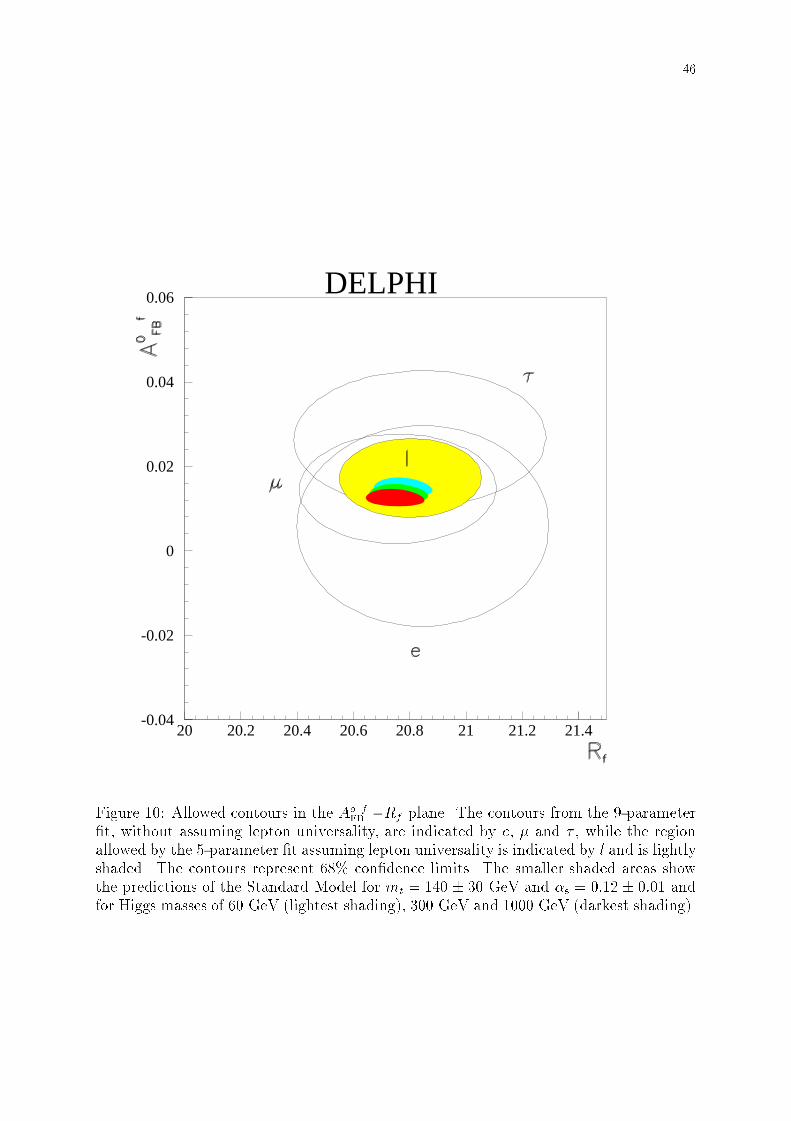
46
-0.04
-0.02
0
0.02
0.04
0.06
20 20.2 20.4 20.6 20.8 21 21.2 21.4
DELPHI
Figure 10: Allowed contours in the AoFB
f - Rf plane. The contours from the 9-parameter�t, without assuming lepton universality, are indicated by e, � and � , while the regionallowed by the 5-parameter �t assuming lepton universality is indicated by l and is lightlyshaded. The contours represent 68% con�dence limits. The smaller shaded areas showthe predictions of the Standard Model for mt = 140 � 30 GeV and �s = 0:12 � 0:01 andfor Higgs masses of 60 GeV (lightest shading), 300 GeV and 1000 GeV (darkest shading).
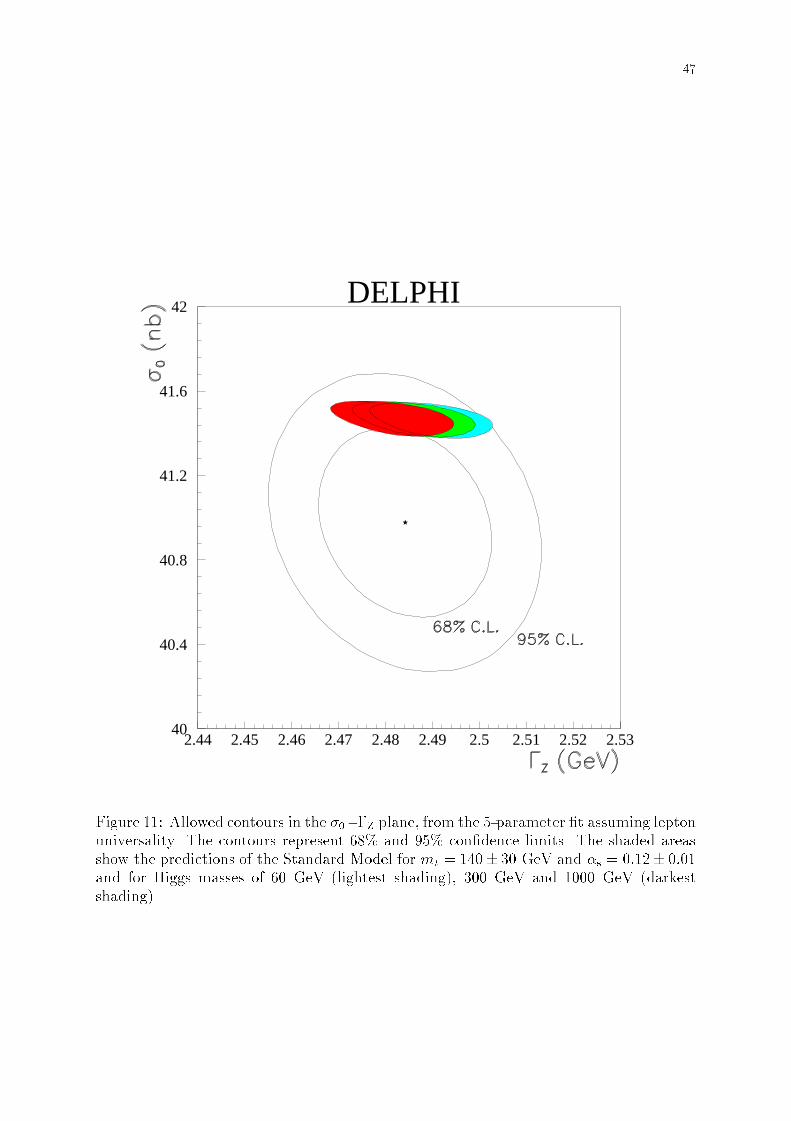
47
40
40.4
40.8
41.2
41.6
42
2.44 2.45 2.46 2.47 2.48 2.49 2.5 2.51 2.52 2.53
DELPHI
Figure 11: Allowed contours in the �0 - �Z plane, from the 5-parameter �t assuming leptonuniversality. The contours represent 68% and 95% con�dence limits. The shaded areasshow the predictions of the Standard Model for mt = 140� 30 GeV and �s = 0:12� 0:01and for Higgs masses of 60 GeV (lightest shading), 300 GeV and 1000 GeV (darkestshading).
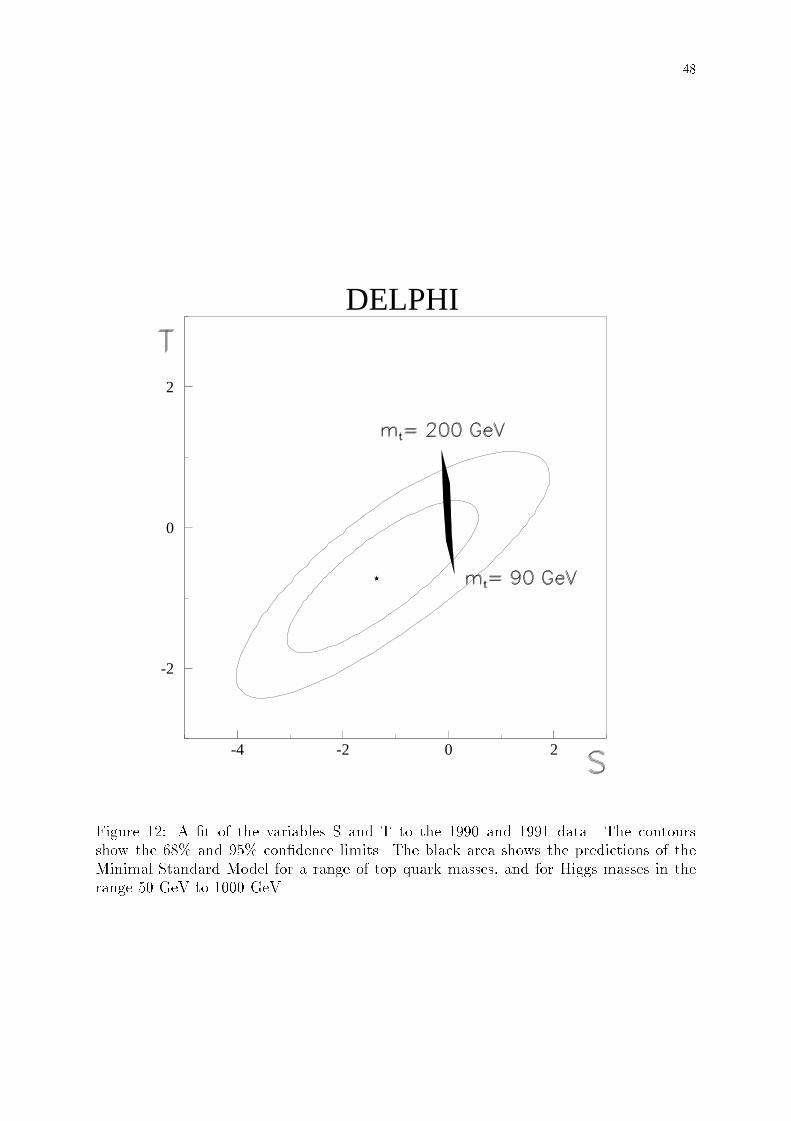
48
-2
0
2
-4 -2 0 2
DELPHI
Figure 12: A �t of the variables S and T to the 1990 and 1991 data. The contoursshow the 68% and 95% con�dence limits. The black area shows the predictions of theMinimal Standard Model for a range of top quark masses, and for Higgs masses in therange 50 GeV to 1000 GeV
Related Documents