Measurement Of Service Quality In Healthcare Organization Dinesh Amjeriya 1 , Rakesh Kumar Malviya 2 Student-ujjain engineering college Ujjain ABSTRACT Defining and measuring the quality of service has been a major challenge in healthcare industry. The service quality measurement scale (SERVQUAL) is used in research to measure quality of service in a hospital service environment. SERVQUAL as an effective approach has been studied and its role in the analysis of the difference between patient expectations and service providers‟ perceptions has been highlighted through a case study conducted at XYZ Hospital which is one of the best hospitals in Ujjain giving quality service to patients. The main objective of this project is to demonstrate the use of SERVQUAL for measuring patient‟s perceptions of health care quality in XYZ Hospital. The research methodology consists of preparing a detailed questionnaire based on twelve SERVQUAL attributes. Opinion of 62 patients in hospital is taken to find out the service quality perceived by them. The data obtained is analyzed using software SPSS. Result of study showed that hospital service attributes have positive impact and are significant to build patient satisfaction. The result of this study is expected to give more knowledge about the importance of service quality (SERVQUAL), so that the hospital can use them as initial building block for management of hospital to evaluate its service and further improve it. This result can be conveniently generalized for any other organization in Indian context. Keywords:- Service, Quality, SERVQUAL, Healthcare Industry, Customer Satisfaction. 1. INTRODUCTION Today the healthcare industry has emerged as one of the most challenging sector as well as one of the largest service sector industries in India with estimated revenue of about US $ 30 International Journal of Engineering Research & Technology (IJERT) Vol. 1 Issue 8, October - 2012 ISSN: 2278-0181 1 www.ijert.org

Welcome message from author
This document is posted to help you gain knowledge. Please leave a comment to let me know what you think about it! Share it to your friends and learn new things together.
Transcript

Measurement Of Service Quality In Healthcare Organization
Dinesh Amjeriya1, Rakesh Kumar Malviya2
Student-ujjain engineering college Ujjain
ABSTRACT
Defining and measuring the quality of service has been a major challenge in healthcare
industry. The service quality measurement scale (SERVQUAL) is used in research to
measure quality of service in a hospital service environment. SERVQUAL as an effective
approach has been studied and its role in the analysis of the difference between patient
expectations and service providers‟ perceptions has been highlighted through a case study
conducted at XYZ Hospital which is one of the best hospitals in Ujjain giving quality
service to patients. The main objective of this project is to demonstrate the use of
SERVQUAL for measuring patient‟s perceptions of health care quality in XYZ Hospital.
The research methodology consists of preparing a detailed questionnaire based on twelve
SERVQUAL attributes. Opinion of 62 patients in hospital is taken to find out the service
quality perceived by them. The data obtained is analyzed using software SPSS. Result of
study showed that hospital service attributes have positive impact and are significant to
build patient satisfaction. The result of this study is expected to give more knowledge about
the importance of service quality (SERVQUAL), so that the hospital can use them as initial
building block for management of hospital to evaluate its service and further improve it.
This result can be conveniently generalized for any other organization in Indian context.
Keywords:- Service, Quality, SERVQUAL, Healthcare Industry, Customer Satisfaction.
1. INTRODUCTION
Today the healthcare industry has emerged as one of the most challenging sector as well as
one of the largest service sector industries in India with estimated revenue of about US $ 30
International Journal of Engineering Research & Technology (IJERT)
Vol. 1 Issue 8, October - 2012
ISSN: 2278-0181
1www.ijert.org
IJERT

billion constituting 6% of the GDP (Rajashekhar et al., 2009). The Indian healthcare
Industry, though still nascent in size and dynamic compared to other countries, has also
benefited from this economic boom.
Internal marketing is important strategy to boost a service that will make the
customer satisfy (Bolton and Drew 1991). This project start with the concept of service
quality, customer satisfaction and followed by study on different models of measuring
service quality but focusing mostly on SERVQUAL approach, which is the most common
method for measuring service quality. The purpose of the project is to find the most
important service quality dimensions that affect customer satisfaction in healthcare service
in XYZ hospital located in Ujjain city. Since SERVQUAL model is a comprehensive
method, it is adopted and deployed to encompass various aspects of service quality in
relation to this case hospital. Questionnaire survey is adopted as methodology for this
project.
Objectives of Project
Following are major objectives of this project that have been identified
To study the importance and impact of service quality in hospital.
To find the most important dimensions of service quality that affects the customer
satisfaction in hospital.
To determine the customers expectations from hospital service.
Expected Deliverables
The expected deliverables that have been identified are as follows:
A comprehensive list of applicable Variables.
Most Critical, Critical, and Sub Critical Success factors for better healthcare services.
Managerial implications of the study.
Various Suggestions to the case hospital.
CHAPTER 2
LITERATURE REVIEW
This Chapter will give an overview of literature and models that are related to the field and
objectives presented in the previous Chapter. In this Chapter, concepts of services,
characteristics of services, service quality, services in hospitals, hospital service quality
dimensions and service quality model of hospital services are introduce in order to give a
clear idea about the project area.
Services:- The rapid development of the service sector in developed market economies and
the growing scale of international transactions in services have been major features of the
world‟s economic development over the last few decades. Additional revenues and growth
stimulated by these exports have, in turn, influenced favorably the potential for internal
reforms, facilitating structural adjustments and modernization. (Pascal, 1987) .
Customer Satisfaction
Customer satisfaction is the key factor determining how successful the organization will be
in customer relationships (Reichheld, 1996); therefore it is very important to measure it.
Quality of
Product/service Customer
Satisfaction Profitability
International Journal of Engineering Research & Technology (IJERT)
Vol. 1 Issue 8, October - 2012
ISSN: 2278-0181
2www.ijert.org
IJERT

Fig. 2.2: Dependence between quality, satisfaction and profitability
Characteristics of a Service
There are six characteristics to a service which will be discussed in Fig. below
Fig.: Characteristics of Services
Service Quality
The purpose of the research is to find the most important service quality dimensions that
affect customer satisfaction in hospital service in Ujjain. Since SERVQUAL model is
founded a comprehensive method, we are going to adopt and deploy it to encompass
various aspects of service quality in relation to the hospital industry in Ujjain. Besides, a
questionnaire has been designed based on literature in order to examine all service quality
dimensions in SERVQUAL model.
Parasuraman, Zeithaml, and Berry (1985); “Service quality is determined by the differences
between customer‟s expectations of services provider‟s performance and their evaluation of
the services they received”.
Service Quality Model
Gap 1: Gap between consumer expectations and management perceptions:
Gap 2: Gap between management perception and service quality specification:
Gap 3: Gap between Service quality specifications and actual service delivery:.
Gap 4: Gap between service delivery and external communications: Consumer
Gap 5: Gap between perceived service and expected service:
Figure 2.5 shows these 5 gaps in the conceptual model of service quality
Intangibility Inseparability Perishibility Lack of
ownership Heterogeneity Variability
International Journal of Engineering Research & Technology (IJERT)
Vol. 1 Issue 8, October - 2012
ISSN: 2278-0181
3www.ijert.org
IJERT

Fig. 2.5: Conceptual Model of Service Quality (source: PZB, 1985)
2.4.4 SERVQUAL
The SERVQUAL instrument developed by Parasuraman et al., (1985) has proved popular,
being used in many studies of service quality.
The SERVQUAL instrument consists of 42 statements for assessing consumer
perceptions and expectations regarding the quality of a service. Respondents are asked to
rate their level of agreement or disagreement with the given statements on a 5-point Likert
scale. Consumers‟ perceptions are based on the actual service they receive, while
consumers‟ expectations are based on past experiences and information received. The
statements represent the determinants or dimensions of service quality. Refinement of this
work reduces the original service dimensions used by consumers to judge the quality of a
service from ten to five.
The 12 key dimensions (Parasuraman et al., 1985) that were identified are given in Table
2.1
GAP 4
GAP 2
GAP 1
GAP
3
GAP
5 Consumer
Marketer
Management
perceptions of
consumer
expectations
Translation of
perceptions into
service quality
specifications
Service delivery External
communications
to consumers
Perceived service
Personal needs Past experience
Expected services
Word of mouth
communications
International Journal of Engineering Research & Technology (IJERT)
Vol. 1 Issue 8, October - 2012
ISSN: 2278-0181
4www.ijert.org
IJERT

Table 2.1: SERVQUAL attributes and definition according to hospitals
S. No. Servqual
Attribute
Definition Modified Definition for Hospital
Industry
1 Reliability Ability to perform the
promised service
dependability and accurately
Speed of Service
Speed of registration
Accuracy of treatment
2 Responsiveness Willingness to help customers
and provide prompt service
Speed of response to
complaints
Concern to patient
Desire for helping
3 Assurance Knowledge and courtesy of
employees and their ability to
inspire trust and confidence
Doctor concern to patients
Nurse attitude to patients
Room security
4 Empathy Caring, individualized
attention the firm provides its
customers
Ease of communication
Attention and patience of
the nurses
5 Tangibles Physical facilities, equipment,
and appearance of personnel
Availiability of medical
devices
Cleanliness and tranquility
of patient room
Choices of menu and
potion
Furniture are present in
patient room
Electricity available for
emergency
Pathology lab
Employee performance
6 Competence Possession of required skills
and knowledge to perform the
service
Doctors qualification
Qualification of staff in
hospital
Experience of doctors
Reputation of doctors
7 Access Approachability and ease of
contact
No. of hours doctors
sitting in the chamber
No. of rounds
taken/day/week
8 Courtesy Politeness, respect , and
friendliness
Politeness of the staff to
patient
International Journal of Engineering Research & Technology (IJERT)
Vol. 1 Issue 8, October - 2012
ISSN: 2278-0181
5www.ijert.org
IJERT

Behaviour of the staff and
doctors
9 Communication Keeping customers informed
in language they can
understand and listening to
them.
Counselling facility
Communication and ITC
Computerized registration
facility
Computerized billing
facility
Computerized dispensary
10 Credibility Trustworthiness,
believability, honesty. It
involves having the
customer‟s best interests at
heart
Truthworthyness
Doctors faith
Belief
11 Security The freedom from danger,
risk, or doubt.
Alarm provided for danger
Fire proof arrangement
Accidental facility
General safety
12 Understanding
/Knowing the
patient
Making an effort to
understand the Customer‟s
needs
To know what type of
dieses patient suffering
from
What type of problem
arises to patient
3. METHODOLOGY
This presents brief description of the research methodology used for the project. This
includes data collection, statistical methods used for project like Pearson correlation and
linear multiple regression. In this project, software SPSS 11 which provides the descriptive
statistics and other statistical tools is used.
Data Collection
For this study relevant data is collected by using a questionnaire consists of 42 questions
based on 12 SERVQUAL attributes in XYZ hospital in Ujjain. While collecting data there
were some problems associated such as:
Around 250 patients were asked to fill questions but only 62 responded positively.
Language of questionnaire was a problem for few respondents. They were explained
about questions in Hindi.
The hospital employees refused to participate in data collection.
International Journal of Engineering Research & Technology (IJERT)
Vol. 1 Issue 8, October - 2012
ISSN: 2278-0181
6www.ijert.org
IJERT
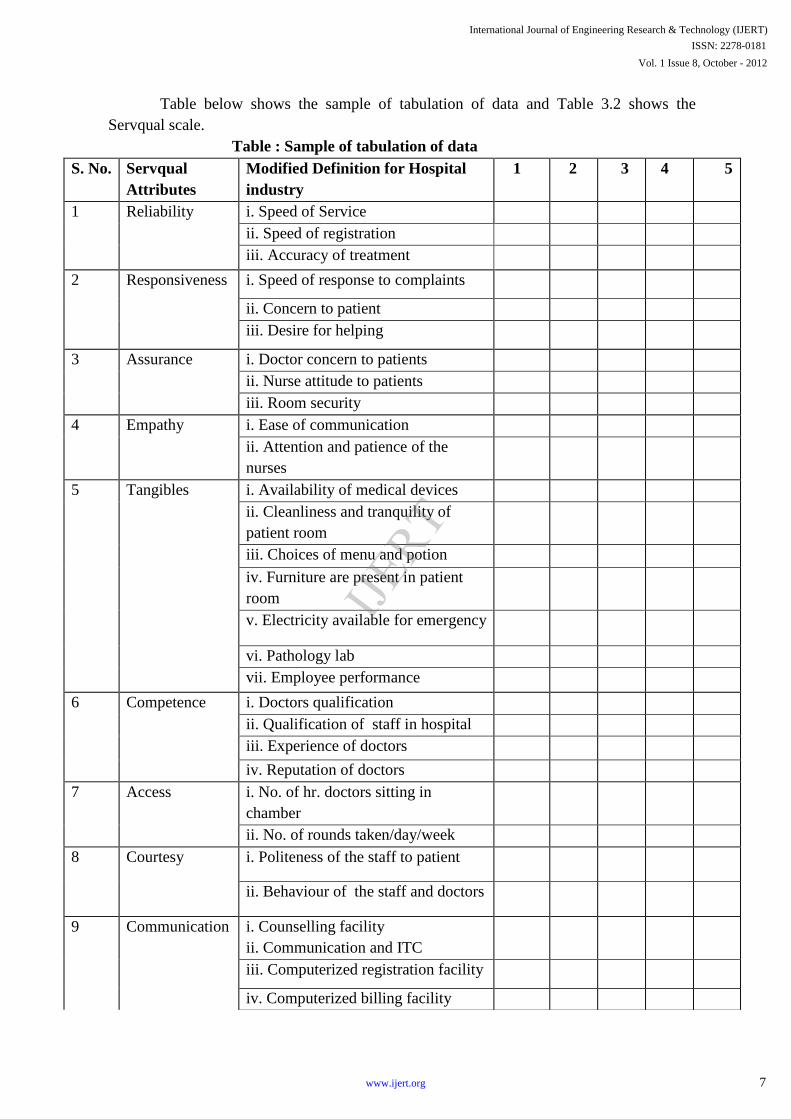
Table below shows the sample of tabulation of data and Table 3.2 shows the
Servqual scale.
Table : Sample of tabulation of data
S. No. Servqual
Attributes
Modified Definition for Hospital
industry
1 2 3 4 5
1 Reliability i. Speed of Service
ii. Speed of registration
iii. Accuracy of treatment
2 Responsiveness i. Speed of response to complaints
ii. Concern to patient
iii. Desire for helping
3 Assurance i. Doctor concern to patients
ii. Nurse attitude to patients
iii. Room security
4 Empathy i. Ease of communication
ii. Attention and patience of the
nurses
5 Tangibles i. Availability of medical devices
ii. Cleanliness and tranquility of
patient room
iii. Choices of menu and potion
iv. Furniture are present in patient
room
v. Electricity available for emergency
vi. Pathology lab
vii. Employee performance
6 Competence i. Doctors qualification
ii. Qualification of staff in hospital
iii. Experience of doctors
iv. Reputation of doctors
7 Access i. No. of hr. doctors sitting in
chamber
ii. No. of rounds taken/day/week
8 Courtesy i. Politeness of the staff to patient
ii. Behaviour of the staff and doctors
9 Communication i. Counselling facility
ii. Communication and ITC
iii. Computerized registration facility
iv. Computerized billing facility
International Journal of Engineering Research & Technology (IJERT)
Vol. 1 Issue 8, October - 2012
ISSN: 2278-0181
7www.ijert.org
IJERT

Table 3.2: Servqual Scale
Descriptive Statistics
Statistics is the science of the collection, organization, and interpretation of data. It deals
with all aspects of this, including the planning of data collection in terms of the design of
surveys and experiments.
3.3.1 Mean:- In mathematics and statistics, the arithmetic mean, often referred to as simply
the mean or average when the context is clear, is a method to derive the central tendency of
a sample space.
Suppose we have sample space . Then the arithmetic mean A is defined via
the equation
Where A = Mean
n= Sample Space
3.3.2 Standard Deviation:- Standard deviation is a widely used measurement of variability
or diversity used in statistics and probability theory.
Standard deviation is a statistical measure of spread or variability. The standard
deviation is the root mean square (RMS) deviation of the values from their arithmetic
mean.
S = Σ(X-μ) 2 Eq. 3.2
n-1
Where S= Standard deviation
v. Computerized dispensary
10 Credibility i. Truthworthyness
ii. Doctors faith
iii. Belief
11 Security i. Alarm provided for danger
ii. Fire proof arrangement
iii. Accidental facility
iv. General safety
12 Understanding
/Knowing the
patient
i. To know what type of dieses
patient suffering from
ii. what type of problem arises to
patient
1 2 3 4 5
Very Slow Slow Medium Fast Very Fast
Weak Little Satisfactory Satisfactory Good Very Good
Little bit Somewhat Moderately Accurate Very Accurate
Lower Satisfactory Mediocre Higher Excellent
Minimum Somewhat Average Mostly Maximum
Eq. 3.1
International Journal of Engineering Research & Technology (IJERT)
Vol. 1 Issue 8, October - 2012
ISSN: 2278-0181
8www.ijert.org
IJERT

X= Individual score
μ = Mean of all scores
n= Sample size
3.3.3 Reliability and Validity:- In statistics, reliability is the consistency of a set of
measurements or of a measuring instrument, often used to describe a test. Validity is often
assessed along with reliability, the extent to which a measurement gives consistent results.
(Seyed, 2008)
Cronbach's α is defined as
Where K is the number of components
is the variance of the observed total test scores
And the variance of component i for the current sample of persons
3.4 Pearson Correlation:- Correlation is a technique for investigating the relationship
between two quantitative, continuous variables, for example, age and blood pressure.
Pearson's correlation coefficient (r) is a measure of the strength of the association
between the two variables. The variables are not designated as dependent or independent.
The two most popular correlation coefficients are: Spearman's correlation coefficient rho (r)
and Pearson's product-moment correlation coefficient.
The value of a correlation coefficient can vary from +1 to -1. A minus one
indicates a perfect negative correlation, while a plus one (+1) indicates a perfect positive
correlation. A correlation of zero (0) means there is no relationship between the two
variables.
Mathematical Representation of Pearson Correlation
The mathematical formula for Pearson Correlation is given as shown below:
Where x and y are two variables or the sample means of X and Y and
Sx and Sy are the sample standard deviations of X and Y.
3.5 Multiple Regression:- Simple regression is used to examine the relationship between
one dependent and one independent variable. After performing an analysis, the regression
statistics can be used to predict the dependent variable when the independent variable is
known.
Multiple regression is a statistical technique that allows us to predict someone‟s score on
one variable on the basis of their scores on several other variables. Beta (standardised
regression coefficients)
The beta value is a measure of how strongly each predictor variable influences the criterion
variable. The beta is measured in units of standard deviation
R Square
R is a measure of the correlation between the observed value and the predicted value of the
criterion variable. In the example, above this would be the correlation between the levels of
Eq. 3.3
Eq. 3.4
International Journal of Engineering Research & Technology (IJERT)
Vol. 1 Issue 8, October - 2012
ISSN: 2278-0181
9www.ijert.org
IJERT
job satisfaction reported by participants and the levels predicted for them by our predictor
variable
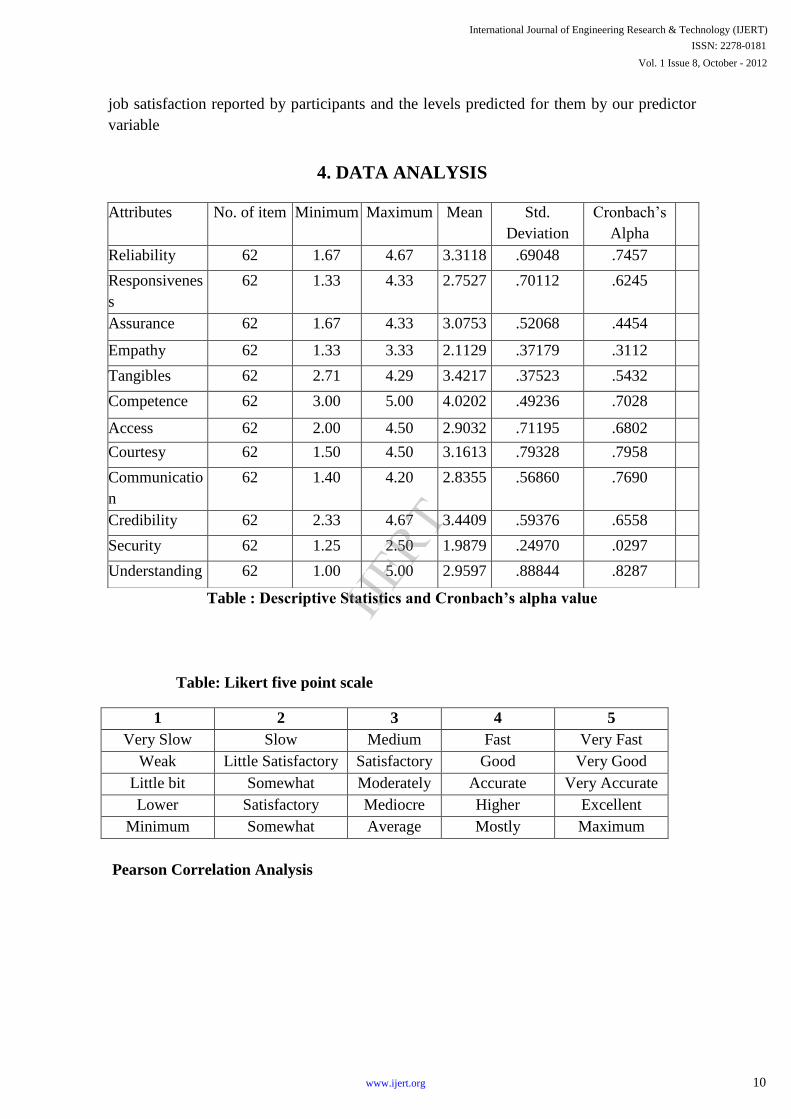
4. DATA ANALYSIS
Table : Descriptive Statistics and Cronbach’s alpha value
Table: Likert five point scale
Pearson Correlation Analysis
Attributes No. of item Minimum Maximum Mean Std.
Deviation
Cronbach‟s
Alpha
Reliability 62 1.67 4.67 3.3118 .69048 .7457
Responsivenes
s
62 1.33 4.33 2.7527 .70112 .6245
Assurance 62 1.67 4.33 3.0753 .52068 .4454
Empathy 62 1.33 3.33 2.1129 .37179 .3112
Tangibles 62 2.71 4.29 3.4217 .37523 .5432
Competence 62 3.00 5.00 4.0202 .49236 .7028
Access 62 2.00 4.50 2.9032 .71195 .6802
Courtesy 62 1.50 4.50 3.1613 .79328 .7958
Communicatio
n
62 1.40 4.20 2.8355 .56860 .7690
Credibility 62 2.33 4.67 3.4409 .59376 .6558
Security 62 1.25 2.50 1.9879 .24970 .0297
Understanding 62 1.00 5.00 2.9597 .88844 .8287
1 2 3 4 5
Very Slow Slow Medium Fast Very Fast
Weak Little Satisfactory Satisfactory Good Very Good
Little bit Somewhat Moderately Accurate Very Accurate
Lower Satisfactory Mediocre Higher Excellent
Minimum Somewhat Average Mostly Maximum
International Journal of Engineering Research & Technology (IJERT)
Vol. 1 Issue 8, October - 2012
ISSN: 2278-0181
10www.ijert.org
IJERT

Table 4.3: Correlation Coefficients between SERVQUAL attributes using Pearson Correlation Coefficient
** Correlation is significant at the 0.01 level (2-tailed).* Correlation is significant at the 0.05 level (2-tailed)
Variables Reliability Responsiveness Assurance Empathy Tangibles Competence Access Courtesy Communicatio
n
Credibility Securit
y
Understanding
Reliability 1
Responsiveness .358** 1
Assurance .349** .321* 1
Empathy .343** .472** .520** 1
Tangibles .268* .367** .406** .302* 1
Competence .343** .383** .282* .383** .448** 1
Access .157 .373** .330** .176 .094 .052 1
Courtesy .371** .284* .307* .308* .267* .443** .507** 1
Communication .261* .151 .345** .306* .414** .340** .337** .445** 1
Credibility .383** .393** .433** .472** .350** .521** .174 .514** .387** 1
Security .133 .225 .217 .147 .293* .310* .097 .082 .234 .212 1
Understanding .448** .212 .568** .262* .378** .424** .227 .422** .347** .583** .173 1
International Journal of Engineering Research & Technology (IJERT)
Vol. 1 Issue 8, October - 2012ISSN: 2278-0181
11www.ijert.org
IJERT

Table 4.4: Multiple Regression analysis between SERVQUAL attributes
*p<.05, **p<.01, ***p<.001
Multiple Regression Analysis
Multiple regression analysis is conducted to visualize the causal relationship between
various variables. Multiple Regression analysis computed by choosing six dependent
variables and six independent variables. The dependent variables are responsiveness,
Assurance, Empathy, Courtesy, Communication, Credibility and Independent variables are
Reliability, Tangibles, Competence, Access, Security, Understanding and their relationship
shows the positive and negative impact on the attributes. Results of regression analysis are
summarized above in Table 4.4.
„Responsiveness‟ has a significant relationship with „access‟, greater the value of
these factors greater will be response to service in healthcare industry hence it is important
parameter to give a strong positive relationship. Next variable „assurance‟ is strongly
dependent on „understanding‟ it means greater the values of this variable better will be the
assurance between service provided in healthcare organization. „Courtesy‟ has a
statistically significant correlation with „competence‟ and „access‟, indicating that
„courtesy‟ may be improved by improving the „competence‟ and „access‟. „Courtesy‟ has
negative relation with „security‟ indicating that higher „Security‟ leads to compromise in
courtesy. „Communication‟ is depending on „tangibles‟ and „access‟ it means higher
communication with customers gives higher access to customers. „Credibility‟ may be
improved by improving „competence‟ and „understanding‟.
R squared is comprehensible measure for indicating the percentage variation in the
dependent variable which is accounted for by the independent variable (Sancheti & Kapoor,
1998). The R-square value is an indicator of how well the model explains the variance
(Shukla et al, 2011). R square values ranges from 0.225 to 0.48 which implies that 22.5% to
48% of the variation in the dependent variable has been explained by the independent
Variable
Dependent
Independent Responsiveness Assurance Empathy Courtesy Communication Credibility
Reliability .230 .083 .210 .135 .052 .086
Tangibles .210 .210 .128 .020 .260* .033
Competence .244 -.048 .256 .346** .129 .301**
Access .335*** .199 .122 .448*** .269** .051
Security .052 .069 -.007 -.114 .068 .025
Understanding -.159 .414*** -.015 .125 .098 .389***
R square .355 .416 .225 .480 .305 .442
F 5.056 6.541 2.663 8.449 4.028 7.265
International Journal of Engineering Research & Technology (IJERT)
Vol. 1 Issue 8, October - 2012
ISSN: 2278-0181
12www.ijert.org
IJERT
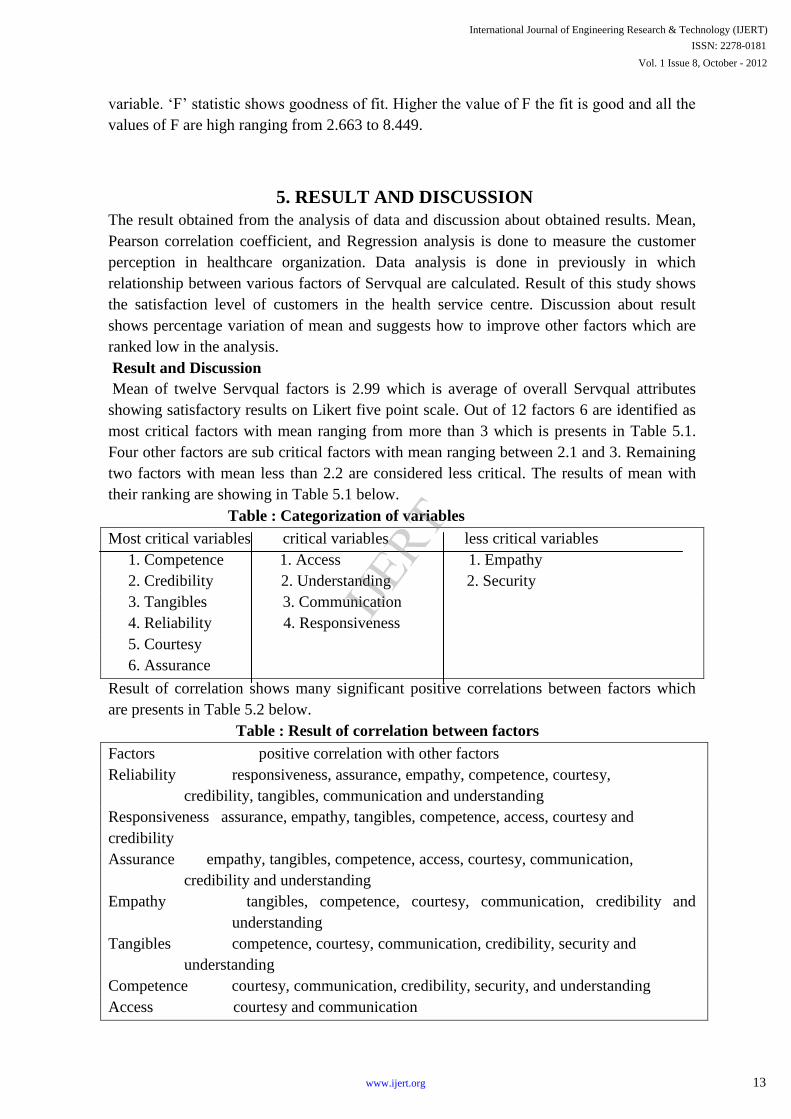
variable. „F‟ statistic shows goodness of fit. Higher the value of F the fit is good and all the
values of F are high ranging from 2.663 to 8.449.
5. RESULT AND DISCUSSION
The result obtained from the analysis of data and discussion about obtained results. Mean,
Pearson correlation coefficient, and Regression analysis is done to measure the customer
perception in healthcare organization. Data analysis is done in previously in which
relationship between various factors of Servqual are calculated. Result of this study shows
the satisfaction level of customers in the health service centre. Discussion about result
shows percentage variation of mean and suggests how to improve other factors which are
ranked low in the analysis.
Result and Discussion
Mean of twelve Servqual factors is 2.99 which is average of overall Servqual attributes
showing satisfactory results on Likert five point scale. Out of 12 factors 6 are identified as
most critical factors with mean ranging from more than 3 which is presents in Table 5.1.
Four other factors are sub critical factors with mean ranging between 2.1 and 3. Remaining
two factors with mean less than 2.2 are considered less critical. The results of mean with
their ranking are showing in Table 5.1 below.
Table : Categorization of variables
Most critical variables critical variables less critical variables
1. Competence 1. Access 1. Empathy
2. Credibility 2. Understanding 2. Security
3. Tangibles 3. Communication
4. Reliability 4. Responsiveness
5. Courtesy
6. Assurance
Result of correlation shows many significant positive correlations between factors which
are presents in Table 5.2 below.
Table : Result of correlation between factors
Factors positive correlation with other factors
Reliability responsiveness, assurance, empathy, competence, courtesy,
credibility, tangibles, communication and understanding
Responsiveness assurance, empathy, tangibles, competence, access, courtesy and
credibility
Assurance empathy, tangibles, competence, access, courtesy, communication,
credibility and understanding
Empathy tangibles, competence, courtesy, communication, credibility and
understanding
Tangibles competence, courtesy, communication, credibility, security and
understanding
Competence courtesy, communication, credibility, security, and understanding
Access courtesy and communication
International Journal of Engineering Research & Technology (IJERT)
Vol. 1 Issue 8, October - 2012
ISSN: 2278-0181
13www.ijert.org
IJERT

Courtesy communication, credibility and understanding
Communication credibility and understanding
Credibility understanding
Table : Result of multiple regression between factors
Dependent factors Positive relation with Independent factors
Responsiveness Access
Assurance Understanding
Courtesy Competence and Access
Communication Access and Tangibles
Credibility Understanding and Competence
The result obtained from this study shows that level of Servqual is not very good but
overall mean of the Servqual attribute is less which shows that service given by the
healthcare system is satisfactory. The level of service can be increased by improving
various attributes such as attention of nurses, ease of communication and security. These
factors can contribute to large extent to improve the Servqual.
6. CONCLUSIONS
Following major Conclusions are drawn after careful analysis of data and discusses these
of:
The contribution of this study is the identification of factors that determine customer
satisfaction with the quality of services provided in healthcare organization. The
study is based on empirical research.
Determinants identified are reliability and responsiveness, assurance, empathy,
tangibles, competence, access, courtesy, communication, credibility, security, and
understanding.
In order to improve service quality, it is necessary to contact employee regularly and
assess their service experiences. Reliability, competence, courtesy, tangibles,
assurance and credibility factors are considered most important by patients. These
factors determine customer‟s satisfaction in XYZ hospital and may be different
from determinants of satisfaction with healthcare organization as a whole.
The study thus provides a direction for healthcare whereby areas for improving services
may be identified and user (patient) satisfaction, specifically in hospital, may be
enhanced. Like the external customers, an internal customer too considers categories of
service attributes, such as reliability and responsiveness, in judging the quality of
internal services.
With the knowledge of the internal service quality dimensions, the service organizations
can then judge how well the organization or employee performed on each dimension
and managers could identify the weakness in order to make improvement. Indian hospitals
need to concentrate on reliability and responsiveness, the dimensions of service
International Journal of Engineering Research & Technology (IJERT)
Vol. 1 Issue 8, October - 2012
ISSN: 2278-0181
14www.ijert.org
IJERT

quality and allocate resources to provide better service and ultimately better service to
external customers.
The significant gaps and importance was associated to reliability, responsiveness, empathy
and all servqual dimensions implying that the health center is still only “cure centre”
and not “care centre”. Leadership should be committed to create a service oriented culture
that permeates to all levels of the organization.
Scope of Future Work
This study largely focused on SERVQUAL being the measurement tool for measuring the
service quality. With the development of healthcare industry, some areas which are not
covered in this study are interesting and need to be explored. In addition, the limitation and
shortcoming of this study also provide implications for future research. Future research
could add extensions to this study. This research needs further analysis. While this research
yields a number of very interesting results, we believe that there are a number of things that
should be done to confirm our results. Firstly medical tourism in India contributing
maximum percentage all over world which gives the financial support to government and
also decreasing the unemployment problem. Secondly, education in medical science is now
more advantageous to improve knowledge and standard. Thirdly, healthcare industries are
in competitive global market to give a service all over India. At the end, in this competitive
market, service quality is one of the key elements which bring customer satisfaction.
Suggestions to Case Organization
The results clearly establish the areas where quality improvements are more demanding.
Further, it provides directions for hospital managers and policymakers to develop strategies
which will meet patients‟ expectations of service quality restore patients' trust in public
hospitals and increase thus their competitiveness. Finally, it gives support to the view that,
although difficult, service quality in the health sector can be measured and consequently be
monitored systematically in order to narrow previously identified gaps and take corrective
actions when necessary. Though the results obtained from this study following the
suggestions to XYZ hospital Ujjain are made;
Tangibles:
1. They should have better equipment& technology.
2. Availability of physical facilities should be visually appealing.
3. Bathroom should be very clean.
4. Water purifier should have good company.
5. Room should be clean and clear.
6. Meals should be nutritious and better in taste.
7. Food should be fresh.
8. Staff should respect privacy and good behave.
9. Room should be quiet.
10. Parking should be convenient.
Assurance:
1. Food should be delivered on time to time.
2. When staff of the institutions promises to do something by a certain time, they
should do it.
International Journal of Engineering Research & Technology (IJERT)
Vol. 1 Issue 8, October - 2012
ISSN: 2278-0181
15www.ijert.org
IJERT

3. They should keep patients' records accurately and systematically.
Responsiveness:
1. They should be expected to tell their customer exactly when services will be
performed.
2. Patients who will be discharged should expect prompt service from employees of the
hospital for the discharging operations.
3. Patients who come to hospital should expect prompt service from employees of the
hospital for the admission operation.
4. Employees of the hospital should always be willing to help their patients.
5. Employee of the hospital should address customers' questions appropriately about any
procedure.
6. Treatment should be explained to the patient very clearly.
7. Discharge should be explained to the patients' family.
Reliability:
1. Customer should be able to trust staff of the hospital.
2. Patient should be positive that they have recovered well before they are discharged.
3. Patients should be able to feel safe in their transactions with these institutions'
employees.
Courtesy:
1. Employees should be polite during admissions procedure.
2. Employees should be polite during housekeeping process.
3. Nurses‟ behaviour should be very polite to customers.
4. Nurses should be cheerful.
Empathy:
1. Patients should expect employees to know what they need from them.
2. Patients should expect nurses to give them their personal attention.
6.6 Concluding Remarks
Healthcare Industry has gained lot of importance in India due to arrival of super specialty
hospitals and resulting health tourism. This study provides an opportunity to evaluate the
application of operations management tools in service organization. SERVQUAL model is
used to evaluate quality of service in XYZ hospital of Ujjain & many important conclusions
which have significant managerial implications are drawn.
REFERENCES
1) Babakus, E., and Mangold, W. (1992), “Adapting the SERVQUAL Scale to
Hospital”, Journal of Health Services Research, Vol. 26, No. 5, pp. 7767-87.
2) Boltan, R. N., and Drew, J. H. (1991), “A longitudinal analysis of the impact of service
change of customers attitude “, Journal of Marketing, Vol. 55, pp. 10-19.
3) Buttle, F. (1996), “SERVQUAL: review, critique, research agenda” European Journal
of Marketing, Vol. 30, No. 1, pp. 8-32.
International Journal of Engineering Research & Technology (IJERT)
Vol. 1 Issue 8, October - 2012
ISSN: 2278-0181
16www.ijert.org
IJERT

4) Cristina, F. (2009), “Adaptation and application of the Servqual scale in higher
education”, São Paulo State University, Brazil.
5) Çaha, H. (2006), “Service Quality in Private Hospitals in Turkey”, Journal of
Economic and Social Research, Vol. 9, No. 1, pp. 55-69.
6) Drucker, P. (1991), “Innovation and entrepreneurship: Practice and Principles”,
Louisiana, Louisiana State University Press.
7) Glaveli, N., Karassavidou, E., and Chrissoleon, T. (2008), “Health Care Quality in
Greek NHS Hospitals: No one knows better than patients”, Department of
Economics, Aristotle, University of Thesssaloniki.
8) Grönroos, C. (1984), “A service quality model and its marketing implications”,
European Journal of Marketing, Vol. 18, pp. 36-44.
9) Gronroos, C. (1988), “Service Quality, the Six Criteria of Good Service”, Quality Review
of Business 3, New York: St. John‟s University Press.
10) Hossein, S. S. (2008), “Measuring service quality using servqual model, a case study of
e-retailing in Iran”, Journal of marketing, Vol. 1, No. 1, pp. 1-32.
11) Kotler, P. (2003), Marketing Management, Pearson Education, Inc. Eleventh edition,
pp. 446-456.
12) Nandan, G., Shefali (2010), “Determinants of Customer Satisfaction on Service Quality:
A Study of Railway Platforms in India”, Journal of Public Transportation, Vol. 13,
No. 1, pp. 108-10.
13) Parasuraman, A., Zeithaml, V.A., and Berry, L.L. (1985), "A Conceptual Model of
Service Quality and its Implications for Future Research", Journal of Marketing,
Vol. 49, No. 4, pp. 41-50.
14) Parasuraman, A., Zeithaml, V. A., and Berry, L.L. (1988), “SERVQUAL-A Multiple
Item Scale for Measuring Customer Perception of Service Quality”, Journal of
Retailing, Vol. 64, No. 1, pp. 12-30.
15) Ratna, H. N. (2007), “The analysis of service quality with servqual approach and its
effect to customer satisfaction at the hospital business”, Widyatama University,
Indonesia, Vol. 1, No. 1, pp. 1-10.
16) Randheer, K., AL-Motawa, A. A., Vijay, J. P. (2011), “Measuring commuters‟
perception on service quality using servqual in public transportation”, International
Journal of Marketing Studies, Vol. 3, No. 1, pp. 21-31.
17) Sachdev, B., Verma, V. (2004), “Relative importance of service quality dimensions: a
multisectoral study”, Journal of Service Research, Vol. 4, No. 1, pp. 98-106.
18) Shukla, A. C., Deshmukh, S. G. and Kanda, A. (2009), „„Green supply chain
management: challenges in Indian context‟‟, paper presented at the National
Conference on Mapping for Excellence: Challenges Ahead, Pioneer Institute of
Professional Studies, Indore, 16 February.
19) Zeithaml, V. A., Berry, L.L. and Parasuraman, A. (1991), “The nature and determinants of
customer expectations of service”, working paper 91-113, Marketing Science Institute,
Cambridge, MA.
International Journal of Engineering Research & Technology (IJERT)
Vol. 1 Issue 8, October - 2012
ISSN: 2278-0181
17www.ijert.org
IJERT

Web Resources
1) PricewaterhouseCoopers, Emerging Market Report: “Health in India 2007”,
http://www.cdc.gov/ncidod/dvbid/dengue/ Viewed on 13 may 2011.
2) Ministry of Health and Family Welfare (2005), Government of India; http://
mohfw.nic.in/np2005.htm Viewed on 13 may 2011.
3) Department of AYUSH, Ministry of Health and Family Welfare, Government of
India; http://indianmedicine.nic.in/summary-of-infrastructure.asp Viewed on 21 may
2011.
4) Statistical Review chapter 7, Correlation and Regression;
http://www.ncbi.nlm.nih.gov Viewed on 23 April 2011.
International Journal of Engineering Research & Technology (IJERT)
Vol. 1 Issue 8, October - 2012
ISSN: 2278-0181
18www.ijert.org
IJERT

Related Documents