Measurement of relative cerebral blood volume using BOLD contrast and mild hypoxic hypoxia Richard G. Wise a,b, ⁎ , Kyle T.S. Pattinson a,c , Daniel P. Bulte a , Richard Rogers a,c , Irene Tracey a,c , Paul M. Matthews a,d , Peter Jezzard a a Department of Clinical Neurology, Centre for Functional Magnetic Resonance Imaging of the Brain (FMRIB), John Radcliffe Hospital, University of Oxford, OX3 9DU Oxford, UK b Cardiff University Brain Research Imaging Centre (CUBRIC), School of Psychology, Cardiff University, Park Place, CF10 3AT Cardiff, UK c Nuffield Department of Anaesthetics, John Radcliffe Hospital, University of Oxford, OX3 9DU Oxford, UK d Department of Clinical Neurosciences, Imperial College London and GSK Clinical Imaging Centre, Hammersmith Hospital, W12 0NN London, UK Received 29 October 2009; revised 17 May 2010; accepted 18 June 2010 Abstract Relative cerebral blood volume (CBV) was estimated using a mild hypoxic challenge in humans, combined with BOLD contrast gradient- echo imaging at 3 T. Subjects breathed 16% inspired oxygen, eliciting mild arterial desaturation. The fractional BOLD signal change induced by mild hypoxia is expected to be proportional to CBV under conditions in which there are negligible changes in cerebral perfusion. By comparing the regional BOLD signal changes arising with the transition between normoxia and mild hypoxia, we calculated CBV ratios of 1.5±0.2 (mean±S.D.) for cortical gray matter to white matter and 1.0±0.3 for cortical gray matter to deep gray matter. © 2010 Elsevier Inc. All rights reserved. Keywords: BOLD; Hypoxia; Cerebral blood volume; fMRI 1. Introduction Cerebral blood volume (CBV) is an important physio- logical parameter in the clinical study of cerebral pathology and also in neuroscientific research into brain function. For example, angiogenesis of brain tumors is associated with elevated blood volume. Clinically, CBV is often estimated by dynamic susceptibility-weighted contrast enhanced MRI employing an exogenous paramagnetic agent such as Gd- DTPA [1–4]. A more recent and less invasive development for noninvasive CBV measurement is known as vascular space occupancy or VASO [5]. This measures blood volume changes by observing the signal from brain tissue after nulling the signal from blood. Brain tissue signal therefore decreases as blood volume increases with increased brain activity. VASO provides a complementary measure of brain activity to BOLD contrast and is a somewhat more quantitative measure insofar as it provides a single physiological parameter, CBV, one of the components contributing to BOLD contrast. Alternative image contrasts based on alterations in the oxygenation state of hemoglobin have also been used to assess relative CBV. Van Zijl et al. [6] reported CBV measurement in the cat brain using spin-echo signal changes induced by hypoxia. The same group also measured CBV from alterations in BOLD signal as a result of varying arterial carbon dioxide tensions [7]. More recently, in humans, Bulte et al. [8] used hyperoxia-induced BOLD contrast in a T2*- weighted acquisition to estimate CBV. Hyperoxia, assuming an unaltered rate of metabolic oxygen consumption, induces an increase in cerebral venous blood oxygen saturation and hence an increase in T2*. This image contrast is heavily weighted towards the venous side of the vasculature because hyperoxia has little effect on arterial blood oxygen saturation. Hypoxic hypoxia has been applied safely in human MRI studies of cerebral physiology. Rostrup et al. [9] have demonstrated the decrease of T2* with increasing deoxyhe- moglobin concentration during hypoxia in gray matter and Available online at www.sciencedirect.com Magnetic Resonance Imaging 28 (2010) 1129 – 1134 ⁎ Corresponding author. Cardiff University Brain Research Imaging Centre (CUBRIC), School of Psychology, Cardiff University, Park Place, CF10 3AT Cardiff, UK. Tel.: +44 2920 870358; fax: +44 2920 870339. E-mail address: [email protected] (R.G. Wise). 0730-725X/$ – see front matter © 2010 Elsevier Inc. All rights reserved. doi:10.1016/j.mri.2010.06.002

Welcome message from author
This document is posted to help you gain knowledge. Please leave a comment to let me know what you think about it! Share it to your friends and learn new things together.
Transcript
Available online at www.sciencedirect.com
Magnetic Resonance Imaging 28 (2010) 1129–1134
Measurement of relative cerebral blood volume using BOLD contrast andmild hypoxic hypoxia
Richard G. Wisea,b,⁎, Kyle T.S. Pattinsona,c, Daniel P. Bultea, Richard Rogersa,c,Irene Traceya,c, Paul M. Matthewsa,d, Peter Jezzarda
aDepartment of Clinical Neurology, Centre for Functional Magnetic Resonance Imaging of the Brain (FMRIB), John Radcliffe Hospital,University of Oxford, OX3 9DU Oxford, UK
bCardiff University Brain Research Imaging Centre (CUBRIC), School of Psychology, Cardiff University, Park Place, CF10 3AT Cardiff, UKcNuffield Department of Anaesthetics, John Radcliffe Hospital, University of Oxford, OX3 9DU Oxford, UK
dDepartment of Clinical Neurosciences, Imperial College London and GSK Clinical Imaging Centre, Hammersmith Hospital, W12 0NN London, UK
Received 29 October 2009; revised 17 May 2010; accepted 18 June 2010
Abstract
Relative cerebral blood volume (CBV) was estimated using a mild hypoxic challenge in humans, combined with BOLD contrast gradient-echo imaging at 3 T. Subjects breathed 16% inspired oxygen, eliciting mild arterial desaturation. The fractional BOLD signal change inducedby mild hypoxia is expected to be proportional to CBV under conditions in which there are negligible changes in cerebral perfusion. Bycomparing the regional BOLD signal changes arising with the transition between normoxia and mild hypoxia, we calculated CBV ratios of1.5±0.2 (mean±S.D.) for cortical gray matter to white matter and 1.0±0.3 for cortical gray matter to deep gray matter.© 2010 Elsevier Inc. All rights reserved.
Keywords: BOLD; Hypoxia; Cerebral blood volume; fMRI
1. Introduction
Cerebral blood volume (CBV) is an important physio-logical parameter in the clinical study of cerebral pathologyand also in neuroscientific research into brain function. Forexample, angiogenesis of brain tumors is associated withelevated blood volume. Clinically, CBV is often estimatedby dynamic susceptibility-weighted contrast enhanced MRIemploying an exogenous paramagnetic agent such as Gd-DTPA [1–4]. A more recent and less invasive developmentfor noninvasive CBV measurement is known as vascularspace occupancy or VASO [5]. This measures blood volumechanges by observing the signal from brain tissue afternulling the signal from blood. Brain tissue signal thereforedecreases as blood volume increases with increased brainactivity. VASO provides a complementary measure of brain
⁎ Corresponding author. Cardiff University Brain Research ImagingCentre (CUBRIC), School of Psychology, Cardiff University, Park PlaceCF10 3AT Cardiff, UK. Tel.: +44 2920 870358; fax: +44 2920 870339.
E-mail address: [email protected] (R.G. Wise).
0730-725X/$ – see front matter © 2010 Elsevier Inc. All rights reserved.doi:10.1016/j.mri.2010.06.002
,
activity to BOLD contrast and is a somewhat morequantitative measure insofar as it provides a singlephysiological parameter, CBV, one of the componentscontributing to BOLD contrast.
Alternative image contrasts based on alterations in theoxygenation state of hemoglobin have also been used toassess relative CBV. Van Zijl et al. [6] reported CBVmeasurement in the cat brain using spin-echo signal changesinduced by hypoxia. The same group also measured CBVfrom alterations in BOLD signal as a result of varying arterialcarbon dioxide tensions [7]. More recently, in humans, Bulteet al. [8] used hyperoxia-induced BOLD contrast in a T2*-weighted acquisition to estimate CBV. Hyperoxia, assumingan unaltered rate of metabolic oxygen consumption, inducesan increase in cerebral venous blood oxygen saturation andhence an increase in T2*. This image contrast is heavilyweighted towards the venous side of the vasculature becausehyperoxia has little effect on arterial blood oxygen saturation.
Hypoxic hypoxia has been applied safely in human MRIstudies of cerebral physiology. Rostrup et al. [9] havedemonstrated the decrease of T2* with increasing deoxyhe-moglobin concentration during hypoxia in gray matter and
1130 R.G. Wise et al. / Magnetic Resonance Imaging 28 (2010) 1129–1134
white matter, while volunteers breathed an inspired fractionof oxygen of 10%. More recent studies have investigated theeffect of hypoxia in reducing the BOLD response to changesin neural activity [10,11]. Here we present an alternativemethod for assessing relative CBV using a mild hypoxicchallenge in conjunction with a gradient-echo BOLDimaging approach at 3 T.
Mild hypoxia results in a small decrease in arterial oxygensaturation without significant increases in cerebral bloodflow (CBF) [12]. Since we expect no change in CBF oroxygen consumption (CMRO2) [13,14] between normoxiaand mild hypoxia, the decrease in arterial oxygen saturationwould result in an approximately equal decrease in venousoxygen saturation with no change in CBV [15]. According toOgawa et al [16], the contribution to the BOLD effect in theextravascular water compartment in a gradient-echo exper-iment may be described by
R24BOLD = k Hct 1−Yð Þf gbCBV ð1Þ
where k is a field-dependent constant, Hct is the hematocrit, Yis the fractional blood oxygenation, β is of order 1–2 (closerto 1 at 3 T) and CBV is the blood volume fraction of capillaryand venous vessels. In a gradient-echo experiment, themeasured signal is therefore proportional to exp(−TE R2*)where TE is echo time [17]. Therefore, with small changes inR2* (ΔR2*) resulting from hypoxia, the fractional signalchange may be modeled as ΔS/S0≈−ΔR2* TE. This impliesthatΔS/S0 is directly proportional to CBV for a small changein blood oxygenation alone. We use this relationship whencomparing BOLD signal changes induced bymild hypoxia toestimate CBV ratios between cerebral cortical gray matter,white matter and deep gray matter.
2. Methods
2.1. Subjects and data acquisition
Eight volunteers (two female) aged 31±6 years (mean±S.D.)underwent gradient-echo echo-planar imaging (EPI) at 3 T(Varian Unity Inova) using a hybrid interleaved BOLDcontrast/pulsed arterial spin labeling (PASL) imagingsequence. A total of 1108 volumes were acquired (TR=1.75s, in-plane resolution 4×4 mm, five 6-mm-thick axial slicesextending in a superior direction from the thalamus). TE was32 ms for the BOLD acquisition. A QUIPSSII [18,19]sequence was used for relative measurements of CBF toidentify potential changes under mild hypoxia [TE=22 ms,tag excitation time (TI2)=1.4 s, tag saturation time (TI1)=0.7s, 10-cm inversion slab was 1.5 cm from the imaging slab]. AT1-weighted whole-brain structural scan was also acquired(1×1×3-mm voxels) for purposes of image registration andtissue segmentation. Subjects breathed through a loose-fittingface mask, an inspired oxygen fraction of 21% (normoxia) or16% (mild hypoxia equivalent to an altitude of approximately2200 m above sea level), switched every 4 min. The hypoxic
gas mixture was achieved by delivering a 12% oxygen(balance nitrogen) mixture into a 1:1 entrainment venturidevice (Intersurgical, Wokingham, UK), achieving a 16%inspired fraction of oxygen [20]. Inspired and expired oxygenfractions were confirmed by analysis during the experimentof gas samples drawn from a noninvasive nasal cannula. End-tidal oxygen (PETO2
) and carbon dioxide (PETCO2) were
recorded (AEI Technologies, Pennsylvania, USA) as arepresentative measure of arterial partial pressures of oxygenand carbon dioxide [21] (Fig. 1A and C). Peripheral arterialoxygen saturation (SpO2) was recorded at the finger usingdigital pulse oximetry (Multigas 9500, MR EquipmentCorp.). The study was approved by the Oxfordshire ClinicalResearch Ethics Committee and volunteers gave informedwritten consent.
2.2. Data analysis
The MR data were motion corrected using MCFLIRTwithin the FMRIB Software Library (http://www.fmrib.ox.ac.uk/fsl [22]). BOLD data were high-pass temporallyfiltered (Gaussian-weighted least-squares straight line fittingwith a high-pass filter cut-off of 720 s). Fractional BOLDsignal changes with hypoxia were expressed relative to themean of the first 60 volumes acquired during normoxia,before the presentation of any hypoxic periods to thesubjects. This prevents the hypoxic periods contaminatingthe baseline state. Mean BOLD signal time courses fromcortical gray matter, deep gray matter and white matterregions were extracted. These regions were identified afterregistration of EPI functional data to T1-weighted structuralscans, and segmentation of the T1-weighted images by tissueclass was performed using the FMRIB automated segmen-tation tool [23].
The relationship between fractional changes in BOLDsignal and CBV depends on the fractional blood oxygen-ation (Y). It is necessary therefore to compare the measuredperipheral arterial oxygen saturation (SpO2) with therecorded BOLD signal. As can been seen from Fig. 1B,the digital resolution of the recorded SpO2 signal isrelatively poor at only 1%. Given what ought to be atight relationship between partial pressure of arterial oxygenand arterial oxygen saturation, we recalculated the SpO2
time series from the higher resolution recordings of PETO2
(Fig. 1A). Recorded SpO2 was plotted against recordedPETO2
(Fig. 1D), but with a lag introduced into the timeseries chosen to maximize the correlation between PETO2
and SpO2. This lag derives from the time taken for oxygensaturation to fall in the body and the averaging delayinherent in the pulse oximeter. A sigmoidal curve,emulating the hemoglobin oxygen-dissociation curve, wasfitted to the SpO2–PETO2
plot (e.g., Fig. 1D) and the refinedSpO2 values were extracted for each value of PETO2
.The BOLD signal time courses were regressed (FMRIB
improved linear model [24]) against the derived SpO2 timeseries to establish the fractional change in BOLD signal for a

Fig. 1. Physiological recordings from one representative volunteer. (A) End-tidal oxygen (PETO2) recorded breath by breath throughout the interleaved BOLD-
PASL scan. (B) Peripheral arterial oxygen saturation recorded from a finger probe (SpO2). (C) End-tidal carbon dioxide (PETCO2) showing no significant changes
with the hypoxia protocol. (D) Oxygen dissociation curve showing the variation of arterial blood oxygen saturation with end-tidal oxygen. The plotted sigmoidalline of best fit indicates the relationship used to estimate blood oxygen saturation values from the PETO2
for this subject for regression with the BOLD signal.SpO2 values lagged behind PETO2
recordings by 20–30 s, estimated from the maximum of the cross-correlation between these signals.
1131R.G. Wise et al. / Magnetic Resonance Imaging 28 (2010) 1129–1134
unit change in blood oxygen saturation. Incorporated intothis regression was an empirically determined 30-s delay forchanges in BOLD signal following a measured change inPETO2
(used to derive SpO2). This was established from themaximum of the group mean cross-correlation performedbetween BOLD signal and PETO2
-derived SpO2. This delayin achieving oxygen desaturation (and hence change inBOLD signal) following a change in PETO2
arises from theequilibration time taken for oxygen to leave the blood andtissue compartments as the blood volume circulates throughthe lungs. The PETCO2
time series (example in Fig. 1C) wasincluded in the linear regression as a potential nuisancecovariate that may alter CBF and BOLD signal [25]. A 6-sdelay of the BOLD signal was incorporated for the PETCO2
regression, established in a previous study [26]. Theregression coefficients for fractional BOLD signal changewith decreasing blood oxygen saturation were comparedbetween tissue types of interest.
CBF-sensitive image volumes were pair-wise subtractedto yield time series with image intensity assumed propor-tional to local CBF. As for the BOLD data, CBF signal wasaveraged over the gray matter regions of interest andnormalized to the initial normoxic period. An identicalregression procedure was performed as for the regionalBOLD signals to identify potential hypoxia-induced regionalchanges in CBF.
3. Results
3.1. Physiological parameters
Group mean SpO2 fell from 97.5±0.9% during normoxiato 94.5±1.3% during the hypoxic periods (mean±S.D. acrosssubjects) with corresponding PETO2
values of 111.0±3.5mmHg and 82.6±4.3 mmHg, respectively. This represents asignificant effect on both parameters (Pb.01, one-tailedpaired t test) as a result of the mild hypoxic challenge. Therewas no significant change in PETCO2
values during hypoxia(40.8±4.1 mmHg) compared to normoxia (40.5±4.2 mmHg).Fig. 1 shows the physiological parameters recorded from onerepresentative volunteer.
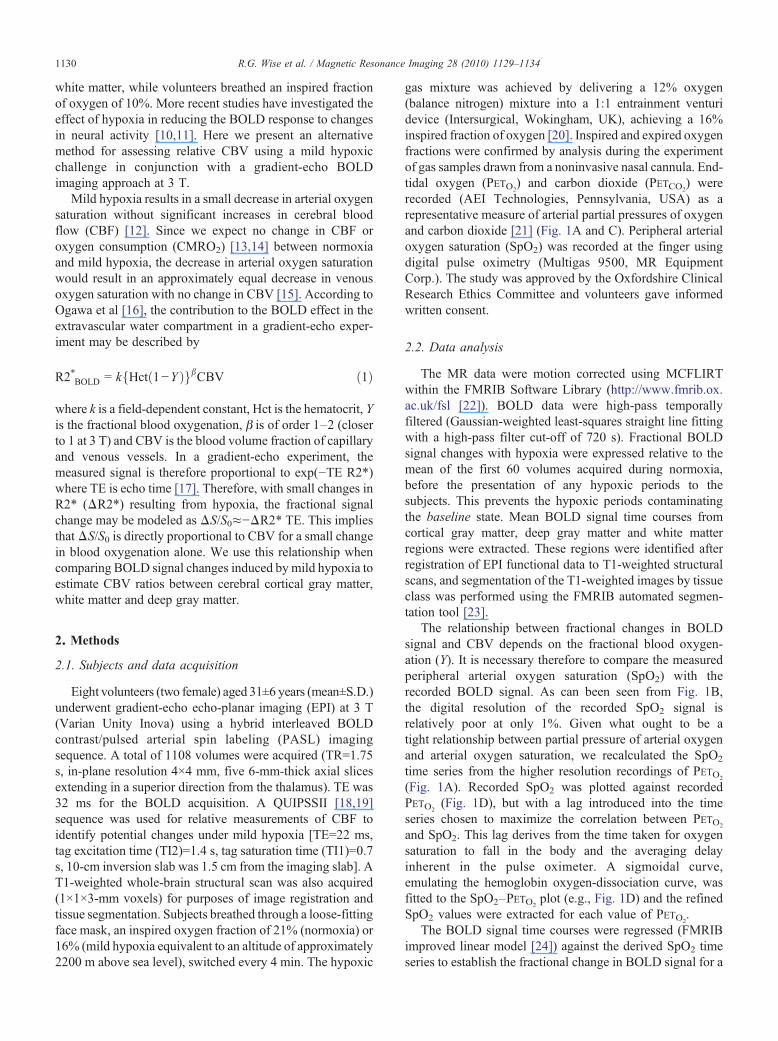
3.2. Regional BOLD signal
There was a statistically significant regression (one-tailedPb.05) between regional BOLD signal and SpO2 in all eightsubjects for cortical gray matter and for seven out of eightsubjects in each of deep gray matter and white matter.Fig. 2A shows one representative volunteer. The BOLDsignal was observed to decrease during hypoxic periods asexpected from the reasoning above. The group mean(±standard deviation across subjects) ratio for the BOLDsignal change in cortical gray matter compared to whitematter was 1.5±0.2. For cortical gray matter compared to
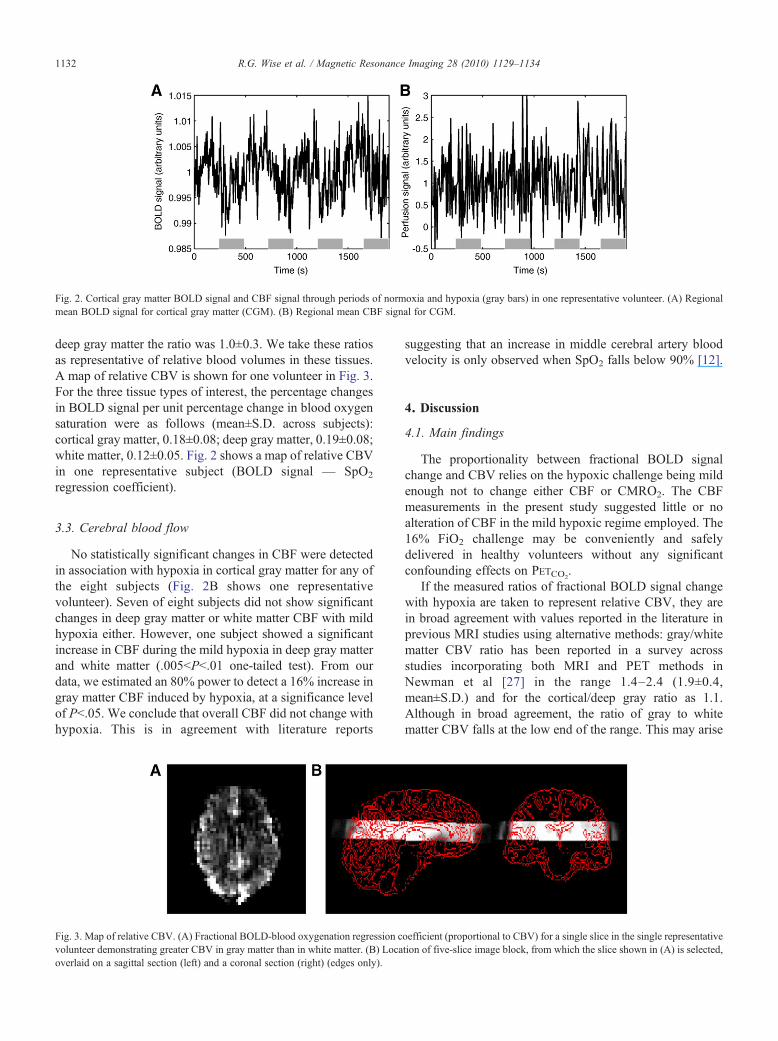
Fig. 2. Cortical gray matter BOLD signal and CBF signal through periods of normoxia and hypoxia (gray bars) in one representative volunteer. (A) Regionalmean BOLD signal for cortical gray matter (CGM). (B) Regional mean CBF signal for CGM.
1132 R.G. Wise et al. / Magnetic Resonance Imaging 28 (2010) 1129–1134
deep gray matter the ratio was 1.0±0.3. We take these ratiosas representative of relative blood volumes in these tissues.A map of relative CBV is shown for one volunteer in Fig. 3.For the three tissue types of interest, the percentage changesin BOLD signal per unit percentage change in blood oxygensaturation were as follows (mean±S.D. across subjects):cortical gray matter, 0.18±0.08; deep gray matter, 0.19±0.08;white matter, 0.12±0.05. Fig. 2 shows a map of relative CBVin one representative subject (BOLD signal — SpO2
regression coefficient).
3.3. Cerebral blood flow
No statistically significant changes in CBF were detectedin association with hypoxia in cortical gray matter for any ofthe eight subjects (Fig. 2B shows one representativevolunteer). Seven of eight subjects did not show significantchanges in deep gray matter or white matter CBF with mildhypoxia either. However, one subject showed a significantincrease in CBF during the mild hypoxia in deep gray matterand white matter (.005bPb.01 one-tailed test). From ourdata, we estimated an 80% power to detect a 16% increase ingray matter CBF induced by hypoxia, at a significance levelof Pb.05. We conclude that overall CBF did not change withhypoxia. This is in agreement with literature reports
Fig. 3. Map of relative CBV. (A) Fractional BOLD-blood oxygenation regression cvolunteer demonstrating greater CBV in gray matter than in white matter. (B) Locaoverlaid on a sagittal section (left) and a coronal section (right) (edges only).
suggesting that an increase in middle cerebral artery bloodvelocity is only observed when SpO2 falls below 90% [12].
4. Discussion
4.1. Main findings
The proportionality between fractional BOLD signalchange and CBV relies on the hypoxic challenge being mildenough not to change either CBF or CMRO2. The CBFmeasurements in the present study suggested little or noalteration of CBF in the mild hypoxic regime employed. The16% FiO2 challenge may be conveniently and safelydelivered in healthy volunteers without any significantconfounding effects on PETCO2
.If the measured ratios of fractional BOLD signal change
with hypoxia are taken to represent relative CBV, they arein broad agreement with values reported in the literature inprevious MRI studies using alternative methods: gray/whitematter CBV ratio has been reported in a survey acrossstudies incorporating both MRI and PET methods inNewman et al [27] in the range 1.4–2.4 (1.9±0.4,mean±S.D.) and for the cortical/deep gray ratio as 1.1.Although in broad agreement, the ratio of gray to whitematter CBV falls at the low end of the range. This may arise
oefficient (proportional to CBV) for a single slice in the single representativetion of five-slice image block, from which the slice shown in (A) is selected,

1133R.G. Wise et al. / Magnetic Resonance Imaging 28 (2010) 1129–1134
in part from partial volume contributions to tissue regions ofinterest following tissue segmentation.
4.2. Arterial and venous blood oxygen saturation
Under conventional “task activation” BOLD fMRI thefractional blood oxygenation, Y, in expression (1) is assumedto be venous (Y=Yv) as the arterial blood is close to beingsaturated with oxygen (Ya=1). However, we present acombined arterial and venous decrease of oxygenationresulting from inspiratory hypoxia. The change in R2*may be described in the normal way (assuming similargeometric factors at play for the venous and arterial vessels)except that we consider an “effective” fractional bloodoxygenation Y=Yb, following the approach of Lin et al. [15]:
Yb = 1 − að ÞYa + aYv ð2Þwhere α is the cerebral venous volume fraction. Therefore,during inspiratory hypoxia, changes in the effective bloodoxygenation arise from those changes in the arterial andvenous compartments:
ΔYb = 1 − að ÞΔYa + aΔYv ð3Þ
In the case of mild hypoxia, mild enough that perfusion isnot increased and mild enough not to interfere with the rateof cerebral metabolic oxygen consumption (CMRO2)[13,14,28], the absolute reduction in arterial oxygensaturation and venous oxygen saturation would be equal.In the present study, arterial oxygen saturation dropped by3% from 97.5% to 94.5%. Thus preserved CBF and CMRO2
would lead to an equal reduction in venous oxygen saturationfrom, for example, 60% to 57% (values presented here forillustration only [29] but not measured in the current study).ThusΔYb=ΔYa and the relationship holds between R2*BOLDand CBV, where CBV is now a combined arterial andvenous blood volume. The contribution to the signal changeof the arterial and venous compartments depends on theirrelative volumes 1−α and α, respectively. The fraction ofblood volume ascribed to the venous side of the cerebralvasculature is normally found to be around α=0.7–0.8 [30].
The finger pulse oximetry measurements, indicatingarterial oxygen saturation, were of resolution 1% saturation,limited by the monitoring equipment. They would haveexhibited a lag and smoothing (introduced by signalaveraging within the patient monitoring system used) withrespect to the true arterial blood oxygenation changes in theblood flowing to the brain from the lungs. The end-tidalpartial pressure of oxygen should provide a less temporallysmoothed and better resolved estimate of changes in arterialoxygen partial pressure induced by the respiratory chal-lenge. We therefore used our peripheral arterial pulseoximetry measures to “calibrate” the PETO2
recordingsallowing the PETO2
recordings to be used as a surrogatefor subsequent correlation with the BOLD signal. Thenonlinear empirical relationship in our data between themeasured blood oxygen saturation and PETO2
is to be
expected from the hemoglobin oxygen dissociation curve(Fig. 1D), providing us with confidence in this procedure,relating these two experimental measurements.
Our proposed method for measuring relative CBV has amixed arterial and venous contribution unlike the hyperoxia-based CBV method in which the signal is weighted towardsthe venous side [8] as a result of maintaining the normal highlevel of arterial oxygen saturation. In the present study, wemeasured only arterial oxygen saturation as the venouscerebral oxygen saturation was expected to fall in parallelwith the arterial saturation under the assumption of unalteredoxygen extraction from the blood. This could, however, betested in the future with recent techniques for measuring bulkvenous oxygen saturation based on the T2 of venous blood[29]. Furthermore, measurement of the venous oxygensaturation when combined with respiratory interventions tomodulate oxygenation may permit the estimation offractional venous CBV.
Quantifying the arterial and venous compartments wouldbe useful for example in modeling stimulus-induced BOLDresponses. Intravascular contributions, although likely to besmall, could also be estimated explicitly when calculatingCBV from BOLD signal change with hypoxia. The methodpresented here should be relatively insensitive to localdifferences in R2* arising from imperfect shimming as themethod does not require reference to the baseline R2*. Ourmethod could be further refined with flow crushing gradientsbeing incorporated into the sequence to minimize the effectof large vessels. It is worth noting that should the hypoxiamove into the regime of increasing CBF, the reduction invenous blood oxygen saturation by virtue of this hypoxiawould be smaller than the reduction in arterial bloodoxygenation. This would induce a smaller than expectedhypoxia-related BOLD signal decrease and a potentialunderestimate of CBV.
4.3. Benefits and limitations
The proposed method is currently limited to measure-ments of relative blood volume. Absolute quantification ofCBV from R2* would require a calibration of thegeometrical factors and knowledge of the hematocritaccording to R24BOLD = k Hct 1−Yð Þf gbCBV. It takes sever-al minutes to average enough data to estimate the relativeCBV from small BOLD signal changes. Therefore, theproposed technique is limited in the extent to which it couldbe applied to examine dynamic changes in CBV such as seenin functional activation studies. For this application theVASO technique is likely to be more appropriate.
We are not currently proposing this method as a clinicalmeasurement technique. It is intended as an alternative tothe current methods for examining normal brain physiol-ogy and responses to physiological challenges. Itsapplication to clinical populations would need to becarefully tested due to the nature of an inspiratory hypoxicchallenge, albeit very mild. In clinical populations such as

1134 R.G. Wise et al. / Magnetic Resonance Imaging 28 (2010) 1129–1134
those with cerebrovascular disease, e.g., compromisedlocal perfusion, the situation may be one of locallyincreased oxygen extraction fraction (OEF) during inspi-ratory normoxia. Our assumptions about the mild hypoxianot altering CMRO2 and/or OEF further may thereforebreak down under such circumstances of pathology.
It is beneficial to have methods for measuring CBV thatdo not require injection of a contrast agent, although thismethod does require delivery of a mildly hypoxic gasmixture and so in many circumstances may be lessconvenient than the VASO or hyperoxia techniques. Thehypoxia method, in common with the hyperoxia method, hasthe convenience of being based upon a relatively standardT2*-weighted EPI sequence available on many scanners thatmay lack specific pulse sequences for VASO. Furthermore,the simultaneous ASL method may be dispensed with aslong as the hypoxia is mild enough not to stimulate a changein CBF, i.e., SpO2 N90%. The method could provide apromising way of evaluating CBV changes as a result ofneural and cerebrovascular activity.
Acknowledgments
We acknowledge the generous support of the UKMedicalResearch Council (RW, KP, IT, PMM, PJ), the UKEngineering and Physical Sciences Research Council (DB)and the Higher Education Funding Council for England (IT).
References
[1] Sourbron S, Ingrisch M, Siefert A, Reiser M, Herrmann K.Quantification of cerebral blood flow, cerebral blood volume, andblood-brain-barrier leakage with DCE-MRI. Magn Reson Med 2009;62(1):205–17.
[2] Johnson G, Wetzel SG, Cha S, Babb J, Tofts PS. Measuring bloodvolume and vascular transfer constant from dynamic, T(2)*-weightedcontrast-enhanced MRI. Magn Reson Med 2004;51(5):961–8.
[3] Kuppusamy K, Lin W, Cizek GR, Haacke EM. In vivo regionalcerebral blood volume: quantitative assessment with 3D T1-weightedpre- and postcontrast MR imaging. Radiology 1996;201(1):106–12.
[4] Rosen BR, Belliveau JW, Vevea JM, Brady TJ. Perfusion imagingwith NMR contrast agents. Magn Reson Med 1990;14(2):249–65.
[5] Lu H, Golay X, Pekar JJ, Van Zijl PC. Functional magnetic resonanceimaging based on changes in vascular space occupancy. Magn ResonMed 2003;50(2):263–74.
[6] van Zijl PC, Eleff SM, Ulatowski JA, et al. Quantitative assessment ofblood flow, blood volume and blood oxygenation effects in functionalmagnetic resonance imaging. Nat Med 1998;4(2):159–67.
[7] Ulatowski JA, Oja JM, Suarez JI, Kauppinen RA, Traystman RJ, vanZijl PC. In vivo determination of absolute cerebral blood volume usinghemoglobin as a natural contrast agent: an MRI study using alteredarterial carbon dioxide tension. J Cereb Blood FlowMetab 1999;19(7):809–17.
[8] Bulte D, Chiarelli P, Wise R, Jezzard P. Measurement of cerebral bloodvolume in humans using hyperoxic MRI contrast. J Magn ResonImaging 2007;26(4):894–9.
[9] Rostrup E, Larsson HB, Toft PB, Garde K, Henriksen O. Signalchanges in gradient echo images of human brain induced by hypo- andhyperoxia. NMR Biomed 1995;8(1):41–7.
[10] Ho YC, Vidyasagar R, Shen Y, Balanos GM, Golay X, Kauppinen RA.The BOLD response and vascular reactivity during visual stimulationin the presence of hypoxic hypoxia. NeuroImage 2008;41(2):179–88.
[11] Rostrup E, Larsson HB, Born AP, Knudsen GM, Paulson OB. Changesin BOLD and ADC weighted imaging in acute hypoxia during sea-level and altitude adapted states. NeuroImage 2005;28(4):947–55.
[12] Gupta AK, Menon DK, Czosnyka M, Smielewski P, Jones JG.Thresholds for hypoxic cerebral vasodilation in volunteers. AnesthAnalg 1997;85(4):817–20.
[13] Emoto SE, Kintner D, Feyzi JM,GilboeDD. Relating cerebral ischemiaand hypoxia to insult intensity. J Neurochem 1988;50(6):1952–8.
[14] Sicard KM, Duong TQ. Effects of hypoxia, hyperoxia, andhypercapnia on baseline and stimulus-evoked BOLD, CBF, andCMRO2 in spontaneously breathing animals. NeuroImage 2005;25(3):850–8.
[15] Lin W, Paczynski RP, Celik A, Kuppusamy K, Hsu CY, Powers WJ.Experimental hypoxemic hypoxia: changes in R2* of brain parenchy-ma accurately reflect the combined effects of changes in arterial andcerebral venous oxygen saturation. Magn Reson Med 1998;39(3):474–81.
[16] Ogawa S, Menon RS, Tank DW, et al. Functional brain mapping byblood oxygenation level-dependent contrast magnetic resonanceimaging. A comparison of signal characteristics with a biophysicalmodel. Biophys J 1993;64(3):803–12.
[17] Buxton RB, Uludag K, Dubowitz DJ, Liu TT. Modeling thehemodynamic response to brain activation. NeuroImage 2004;23(Suppl 1):S220–33.
[18] Wong EC, Buxton RB, Frank LR. Quantitative imaging of perfusionusing a single subtraction (QUIPSS and QUIPSS II). Magn Reson Med1998;39(5):702–8.
[19] Luh WM, Wong EC, Bandettini PA, Hyde JS. QUIPSS II with thin-slice TI1 periodic saturation: a method for improving accuracy ofquantitative perfusion imaging using pulsed arterial spin labeling.Magn Reson Med 1999;41(6):1246–54.
[20] Pattinson KT, Bowes M, Wise RG, Parkes MJ, Morrell MJ. Evaluationof a non-invasive method of assessing opioid induced respiratorydepression. Anaesthesia 2005;60(5):426–32.
[21] Robbins PA, Conway J, Cunningham DA, Khamnei S, Paterson DJ. Acomparison of indirect methods for continuous estimation of arterialPCO2 in men. J Appl Physiol 1990;68(4):1727–31.
[22] Jenkinson M, Bannister P, Brady M, Smith S. Improved optimizationfor the robust and accurate linear registration and motion correction ofbrain images. NeuroImage 2002;17(2):825–41.
[23] Zhang Y, Brady M, Smith S. Segmentation of brain MR imagesthrough a hidden Markov random field model and the expectation-maximization algorithm. IEEE Trans Med Imaging 2001;20(1):45–57.
[24] Woolrich MW, Ripley BD, Brady M, Smith SM. Temporalautocorrelation in univariate linear modeling of FMRI data. Neuro-Image 2001;14(6):1370–86.
[25] Rostrup E, Larsson HB, Toft PB, et al. Functional MRI of CO2 inducedincrease in cerebral perfusion. NMR Biomed 1994;7(1-2):29–34.
[26] Wise RG, Ide K, Poulin MJ, Tracey I. Resting fluctuations in arterialcarbon dioxide induce significant low frequency variations in BOLDsignal. NeuroImage 2004;21(4):1652–64.
[27] Newman GC, Delucia-Deranja E, Tudorica A, Hospod FE, Patlak CS.Cerebral blood volume measurements by T*2-weighted MRI andcontrast infusion. Magn Reson Med 2003;50(4):844–55.
[28] MintunMA, Lundstrom BN, Snyder AZ, Vlassenko AG, Shulman GL,Raichle ME. Blood flow and oxygen delivery to human brain duringfunctional activity: theoretical modeling and experimental data. ProcNatl Acad Sci U S A 2001;98(12):6859–64.
[29] Lu H, Ge Y. Quantitative evaluation of oxygenation in venous vesselsusing T2-relaxation-under-spin-tagging MRI. Magn Reson Med 2008;60(2):357–63.
[30] An H, Lin W. Cerebral venous and arterial blood volumes can beestimated separately in humans using magnetic resonance imaging.Magn Reson Med 2002;48(4):583–8.
Related Documents