Exp Fluids manuscript No. (will be inserted by the editor) Measurement of flow separation in a human vocal folds model Petr ˇ Sidlof · Olivier Doar´ e · Olivier Cadot · Antoine Chaigne Received: date / Accepted: date Abstract The paper provides experimental data on flow sep- aration from a model of the human vocal folds. Data were measured on a four-times scaled physical model, where one vocal fold was fixed and the other oscillated due to fluid- structure interaction. The vocal folds were fabricated from silicone rubber and placed on elastic support in the wall of a transparent wind tunnel. A PIV system was used to visu- alize the flow fields immediately downstream of the glottis and to measure the velocity fields. From the visualizations, the position of the flow separation point was evaluated using a semiautomatic procedure and plotted for different airflow velocities. The separation point position was quantified rel- ative to the orifice width separately for the left and right vo- cal folds to account for flow asymmetry. The results indicate that the flow separation point remains close to the narrowest cross-section during most of the vocal fold vibration cycle, but moves significantly further downstream shortly prior to and after glottal closure. Keywords vocal folds · human larynx · flow separation · airflow · PIV PACS PACS 43.70Aj · PACS 47.80Jk P. ˇ Sidlof Academy of Sciences of the Czech Republic Institute of Thermomechanics Dolejˇ skova 5, 182 00 Prague 8, Czech Republic and Technical University of Liberec, Faculty of Mechatronics, Informatics and Interdisciplinary Studies Studentsk´ a 2, 461 17 Liberec 1 Liberec, Czech Republic E-mail: [email protected] O. Doar´ e · O. Cadot · A. Chaigne ´ Ecole Nationale Sup´ erieure de Techniques Avanc´ ees – membre de ParisTech, Unit´ e de M´ ecanique Chemin de la Huni` ere, 91761 Palaiseau cedex, France 1 Introduction Human voice is created by expiring air from the lungs through a narrow constriction called the glottis. This constriction is formed by the vocal folds, located in the larynx. The vocal folds (also called the vocal cords) are two symmetric soft tissue structures fixed between the thyroid cartilage and ary- tenoid cartilages. Basically they are composed of the thy- roarytenoid muscle and ligament covered by mucosa. Under certain conditions (subglottal pressure, glottal width, longi- tudinal tissue tension) the vocal folds can start to oscillate and in regular phonation close the channel periodically, thus creating disturbances of the pressure field. These pressure disturbances are further filtered by the vocal tract, radiated from the mouth, and perceived as voice. The concept of fluid-structure-acoustic interaction be- tween the airflow, elastic vocal folds, and sub- and supra- glottal acoustic spaces relies on knowledge of aerodynamics in the larynx. However, due to periodic closure of the glottal channel during vocal fold vibration and inherent unsteadi- ness of the airflow, the aerodynamic effects in the larynx are very complex. In spite of the progress in fundamental re- search of human voice production during recent years, some features of the glottal flow are not yet fully understood, one of them being flow separation from the vocal fold surfaces. From the fluid-mechanical point of view, the human lar- ynx can be seen as a nearly planar nozzle with time-varying clearance. In the convergent part the airflow accelerates. Near the narrowest cross-section, airflow separates due to adverse pressure gradient and forms a jet (see Fig. 1). Although flow separation in divergent ducts has been intensively studied, usable criteria predicting flow separation are known only for simple cases. Fox and Kline (1962) published performance maps for straight and conical diffusers: in these cases the most important factors are the area ratio, divergence angle and inlet boundary layer blockage. Generally, the authors

Welcome message from author
This document is posted to help you gain knowledge. Please leave a comment to let me know what you think about it! Share it to your friends and learn new things together.
Transcript
Exp Fluids manuscript No.(will be inserted by the editor)
Measurement of flow separation in a human vocal folds model
Petr Sidlof · Olivier Doare · Olivier Cadot · Antoine Chaigne
Received: date / Accepted: date
Abstract The paper provides experimental data on flow sep-aration from a model of the human vocal folds. Data weremeasured on a four-times scaled physical model, where onevocal fold was fixed and the other oscillated due to fluid-structure interaction. The vocal folds were fabricated fromsilicone rubber and placed on elastic support in the wall ofa transparent wind tunnel. A PIV system was used to visu-alize the flow fields immediately downstream of the glottisand to measure the velocity fields. From the visualizations,the position of the flow separation point was evaluated usinga semiautomatic procedure and plotted for different airflowvelocities. The separation point position was quantified rel-ative to the orifice width separately for the left and right vo-cal folds to account for flow asymmetry. The results indicatethat the flow separation point remains close to the narrowestcross-section during most of the vocal fold vibration cycle,but moves significantly further downstream shortly prior toand after glottal closure.
Keywords vocal folds · human larynx · flow separation ·airflow · PIV
PACS PACS 43.70Aj · PACS 47.80Jk
P. SidlofAcademy of Sciences of the Czech RepublicInstitute of ThermomechanicsDolejskova 5, 182 00 Prague 8, Czech RepublicandTechnical University of Liberec,Faculty of Mechatronics, Informatics and Interdisciplinary StudiesStudentska 2, 461 17 Liberec 1 Liberec, Czech RepublicE-mail: [email protected]
O. Doare · O. Cadot · A. ChaigneEcole Nationale Superieure de Techniques Avancees –membre de ParisTech, Unite de MecaniqueChemin de la Huniere, 91761 Palaiseau cedex, France
1 Introduction
Human voice is created by expiring air from the lungs througha narrow constriction called the glottis. This constriction isformed by the vocal folds, located in the larynx. The vocalfolds (also called the vocal cords) are two symmetric softtissue structures fixed between the thyroid cartilage and ary-tenoid cartilages. Basically they are composed of the thy-roarytenoid muscle and ligament covered by mucosa. Undercertain conditions (subglottal pressure, glottal width, longi-tudinal tissue tension) the vocal folds can start to oscillateand in regular phonation close the channel periodically, thuscreating disturbances of the pressure field. These pressuredisturbances are further filtered by the vocal tract, radiatedfrom the mouth, and perceived as voice.
The concept of fluid-structure-acoustic interaction be-tween the airflow, elastic vocal folds, and sub- and supra-glottal acoustic spaces relies on knowledge of aerodynamicsin the larynx. However, due to periodic closure of the glottalchannel during vocal fold vibration and inherent unsteadi-ness of the airflow, the aerodynamic effects in the larynx arevery complex. In spite of the progress in fundamental re-search of human voice production during recent years, somefeatures of the glottal flow are not yet fully understood, oneof them being flow separation from the vocal fold surfaces.
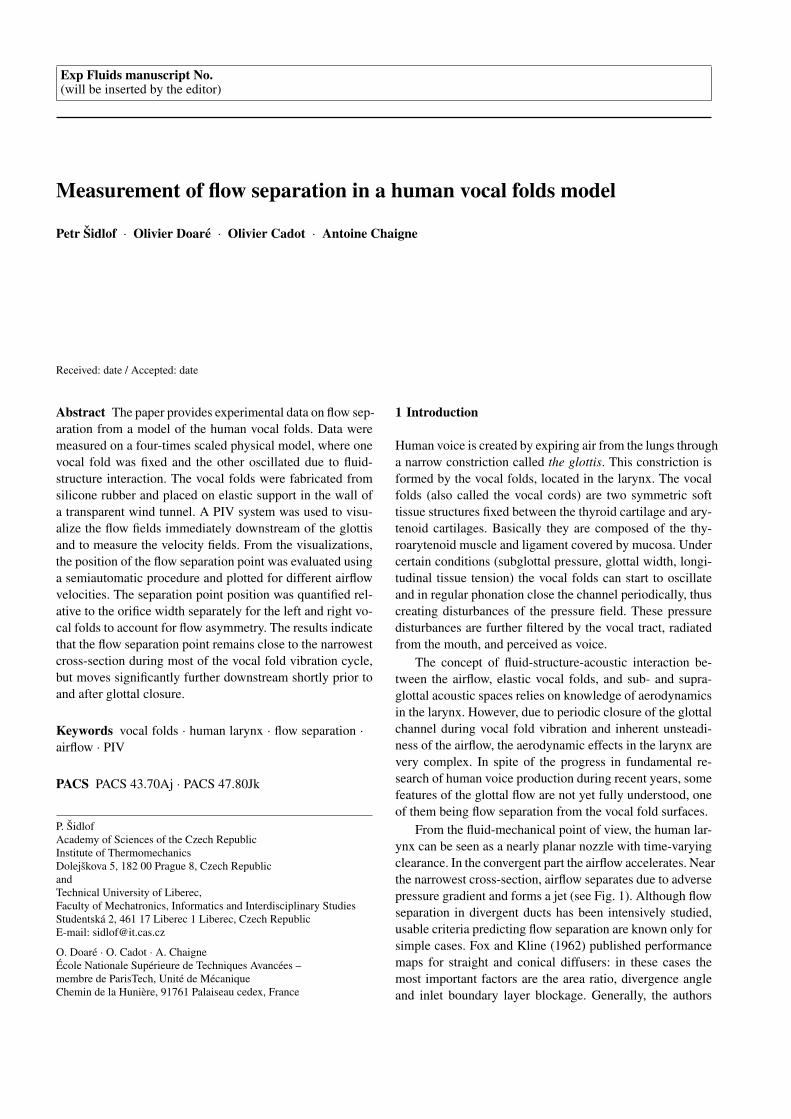
From the fluid-mechanical point of view, the human lar-ynx can be seen as a nearly planar nozzle with time-varyingclearance. In the convergent part the airflow accelerates. Nearthe narrowest cross-section, airflow separates due to adversepressure gradient and forms a jet (see Fig. 1). Although flowseparation in divergent ducts has been intensively studied,usable criteria predicting flow separation are known only forsimple cases. Fox and Kline (1962) published performancemaps for straight and conical diffusers: in these cases themost important factors are the area ratio, divergence angleand inlet boundary layer blockage. Generally, the authors
2
show that the boundary layer does not separate and the flowremains attached to both walls only for low divergence half-angles (less than 10o for short diffusers, less than 1o for longones). As the divergence angle increases, the flow shifts totransitory stall and further to bistable stall, when the flowseparates from one wall only. For even higher divergenceangles and diffuser lengths, there is jet flow, where the main-stream almost ignores the walls and passes at nearly constantarea.
For the much more complex case of flow past humanvocal folds, however, there are no general criteria predictingwhere exactly the flow separation takes place, as this canbe influenced by many factors: interaction of the jet withsupraglottal turbulent and vortical structures; flow interrup-tion during glottal closure and formation of the new jet whenthe glottis reopens; whether or not the boundary layer hasenough time to develop, etc. Yet the information on the flowseparation position is essential, e.g., in simplified compu-tational models of phonation, where the airflow is usuallymodeled by Bernoulli or Euler equations. These models, stillwidely used due to their computational efficiency, requireprior knowledge of the separation point position to obtainrealistic pressure distributions along the vocal folds.
The importance of the flow separation point movementwas assessed theoretically in the paper of Krane and Wei(2006). Zhang (2008) showed in his sensitivity study thatthe flow separation location has significant impact on theeigenmode-coupling effect of the flow-induced stiffness, whichhe regards as a primary mechanism of phonation onset. Heconcludes that the high sensitivity to the flow separation lo-cation indicates to the need for phonation models to be ca-pable of accurate prediction of flow separation.
In the simplified computational models of phonation, theposition of the separation point is either fixed to the superiormargin of the vocal folds (Story and Titze 1995; Horaceket al 2005; Zanartu et al 2007; Zhang et al 2007) or sup-posed to move along the divergent part of the glottis. In thiscase, its position is usually specified using a semiempiricalcriterion, which states that the jet separates at the positionwhere the channel cross-section A reaches
A/Amin = FSC, (1)
where Amin is the minimum glottal cross-section (see Fig. 1)and FSC is a constant which can be called “flow separationcoefficient”. In different published papers, various values ofFSC are used: Deverge et al (2003) sets FSC = 1.2 (based onthe pioneer work of Pelorson et al (1994) and private com-munication with Liljencrants), the model of Lucero (1998)assumes FSC = 1.1. In their comparative study, Decker andThomson (2007) tested different values of the flow separa-tion coefficient: FSC = 1.2 and FSC = 1.47 (according tofinite volume computations of Alipour et al (1996); Alipour
and Scherer (2004)). Recently, Cisonni et al (2008) pub-lished data on the flow separation point coefficient computedby inverse simplified flow models. According to their re-sults, the coefficient remains almost constant with a valueFSC = 1.08 when a Poiseuille model is employed, or oscil-late in the range FSC = 1.02−1.07 when a Bernoulli modelis used.
Fig. 1 Symmetric airflow in the glottis (idealization). Physiologicalorientation – flow in the inferior-to-superior direction.
It appears that a criterion for flow separation positionexpressed by equation (1) approximately holds for steady orquasi-steady flow, but its validity for intrinsically unsteadypulsating flow past vibrating vocal folds is questionable. Vi-lain et al (2004) discusses this issue and proposes to solvethe glottal flow alternatively by Thwaites’ method withinthe boundary layer. This is done by Hirtum et al (2005),whose simplified Navier-Stokes solver predicts FSC = 1.2−−1.75.
The next controversial issue is that the criterion (1) im-plicitly assumes that the glottal flow is symmetric with re-gard to glottal mid-plane and that it separates at the samelocation on the right and left vocal folds. However, many ofthe recent works on glottal airflow dynamics, both compu-tational and experimental, show that in reality the behaviorof the glottal jet is more complex and strongly asymmetric.During vocal fold vibration, the location where the airflowseparates might move down- and upstream considerably.
Hofmans et al (2003), solving the Navier-Stokes equa-tions by the “viscous vortex-blob” method, obtained FSC =
1.2 for a narrow glottis and FSC = 1.4−1.6 for widely ab-ducted vocal folds. The finite volume computations of Alipourand Scherer (2004) yielded FSC = 1.1−1.9. Thomson et al(2005) were among the first to include fluid-structure inter-action in a FEM model and compared the computational re-sults with experiments on a true-scale rubber physical model,but did not investigate flow separation. The paper of Suh andFrankel (2007), who solved the Favre-filtered compressibleNavier-Stokes equations in 3D by finite element method,was focused on flow-acoustic interaction. Tao et al (2007),

3
using the Flotran solver coupled to a 2-mass model pro-grammed in ANSYS APDL, pointed out that the asymmetryof the driving force on the vocal folds and their displace-ment asymmetry can reach 11%. Recently, Sciamarella andQuere (2008) analyzed the flow past vibrating rigid vocalfolds using a multigrid finite difference method and showedthat the mobility of the flow separation point is nontrivialand only rarely quasi-static. The flow separation coefficient,which was evaluated, ranged between FSC = 1.0−1.3.
Before the laser flow measurement methods were avail-able, the experimental papers on glottal aerodynamics, e.g.Barney et al (1999); Alipour and Scherer (2006), used hot-wire anemometry to measure flow velocity, or discrete pres-sure taps to obtain pressure distributions (Scherer et al 2001).Neither of these methods provides sufficient spatial resolu-tion to evaluate the position of the flow separation point.Shinwari et al (2003), using a 7.5 times scaled plexiglassstatic model with vocal folds in different configurations, mea-sured pressure distributions and obtained, among others, somequantitative data on flow separation in terms of distance fromthe minimal cross-section. For various transglottal pressures,the separation point was at 0.23 cm on the vocal fold wherethe flow was attached, and at 0.02 cm on the opposite one.
With the development of laser flow visualization tech-niques and PIV, the possibilities of flow field measurementsextended considerably. First glottal flow visualizations andPIV measurements were published by Triep et al (2005),who used a three times scaled hydrodynamic setup, and Erathand Plesniak (2006a,b) on a static 7.5 times life-size vo-cal fold model. Kucinschi et al (2006) confronted his Fluentcomputations with pressure and flow rate measurements ona mechanically driven physical model, but did not assess ve-locity fields. Li et al (2006) used a similar technique (witha static physical model) and tried to evaluate the flow sep-aration points, although only qualitatively. Like Triep et al(2005), Krane et al (2007) made measurements on an exter-nally driven model of the human glottis in a water channel,which operated at lower frequencies.
Very detailed PIV data on glottal flow were publishedby Neubauer et al (2007), who used a life-sized model ofThomson et al (2005) and quasi phase-locked PIV to mea-sure near-field flow structures. The paper provides detaileddata on jet core velocity, jet inclination angle, and also onthe flow separation point, however only qualitatively. Thepaper of Becker et al (2009) is focused on elucidation of themechanisms of sound production in the larynx. The authorsused a synthetic life-sized self-oscillating vocal fold model.Their results demonstrate the existence of the Coanda effectin phonation. Erath and Plesniak (2010) published a detailedstudy on asymmetric flow features in the glottis. Using anexternally driven 7.5 times life-sized model precisely mim-icking vocal fold oscillation, they quantify jet skewing in thedivergent part of the glottis and deduce implications of flow
asymmetries on sound production. In a recent paper, Triepand Brucker (2010) used an improved experimental setupequipped with time-resolved PIV to show that the supra-glottal flow field is highly 3D. His results also show thatthe presence of the ventricular folds decreases the pressureloss and stabilizes the jet during the divergent phase.
In spite of the considerable amount of data publishedon supraglottal velocity fields, there seems to be a lack ofmeasurements with sufficient resolution to draw systematicconclusions regarding airflow separation in human phona-tion. This paper presents an experimental study providingquantitative data on the position of the flow separation pointduring vocal fold vibration. The glottal airflow in a physi-cal self-oscillating vocal fold model was visualized using aphase-locked PIV system. The location of the flow separa-tion point was evaluated from the visualizations by a semi-automatic procedure.
2 Methods
2.1 Vocal fold model
A new physical model of human vocal folds was designedfor the current study. The model was proposed as a vocal-fold-shaped element vibrating in a rectangular channel. Un-like most of the physical models reported in previous works,in this case the vocal fold vibration was flow-induced, notexternally forced. The shape of the vocal folds that has beenmost widely used in mathematical and physical modeling ofhuman voice, seems to be model “M5”, proposed by Schereret al (2001, 2002) and used, among others, in theoretical andexperimental studies by him, Thomson et al (2005), or Erathand Plesniak (2006a). The geometry of the “M5” model ispiecewise linear with rounded corners. It is based on datafrom X-ray databases, and provides an and easily parametriz-able approximation of the vocal fold shape during oscilla-tion. In this work, the authors decided to specify the shapeof the model vocal folds according to their own measure-ments of excised female human larynges in prephonatoryposition. The description of the methods used and a detailedquantitative specification of the vocal fold shape measuredcan be found in (Sidlof et al 2008). The shape was describedby a piecewise cubic spline. Unlike the “M5” model, theshape is not composed of straight segments, but changes thecurvature continuously. In the region where flow separationtakes place (in the divergent part, downstream of the narrow-est cross-section), the radius of curvature is approximately5.4 mm (which scales to 1.35 mm lifesize).
The model vocal folds were cast using RTV-II type 69199two-compound silicone rubber. In the configuration presentedhere, the upper vocal fold was fixed to the channel wall inorder to avoid asymmetric modes of vibration and situations
4
Table 1 Comparison of the relevant dimensional and dimensionlessparameters: mean subglottal velocity U0, channel height H0, vocal foldthickness L, oscillation/vortex shedding frequency f , transglottal pres-sure ∆ p, Reynolds and Strouhal number Re and St.
real larynx physical model
U0 [m/s] 1–10 1.4–2.5H0 [mm] 10–20 40L [mm] 10 40f [Hz] 100–400 10–14∆ p [Pa] 200–2000 50–250
Re 600–6000 3000–6000St 0.1–1 0.2–0.3
where the vocal folds vibrate with significantly different am-plitudes or even dissimilar frequencies. The second siliconevocal fold, glued on a light rigid support, was mounted onfour flat springs into the wall of the channel. The prephona-tory adduction of the vocal folds can be set precisely by twoadjusting screws.
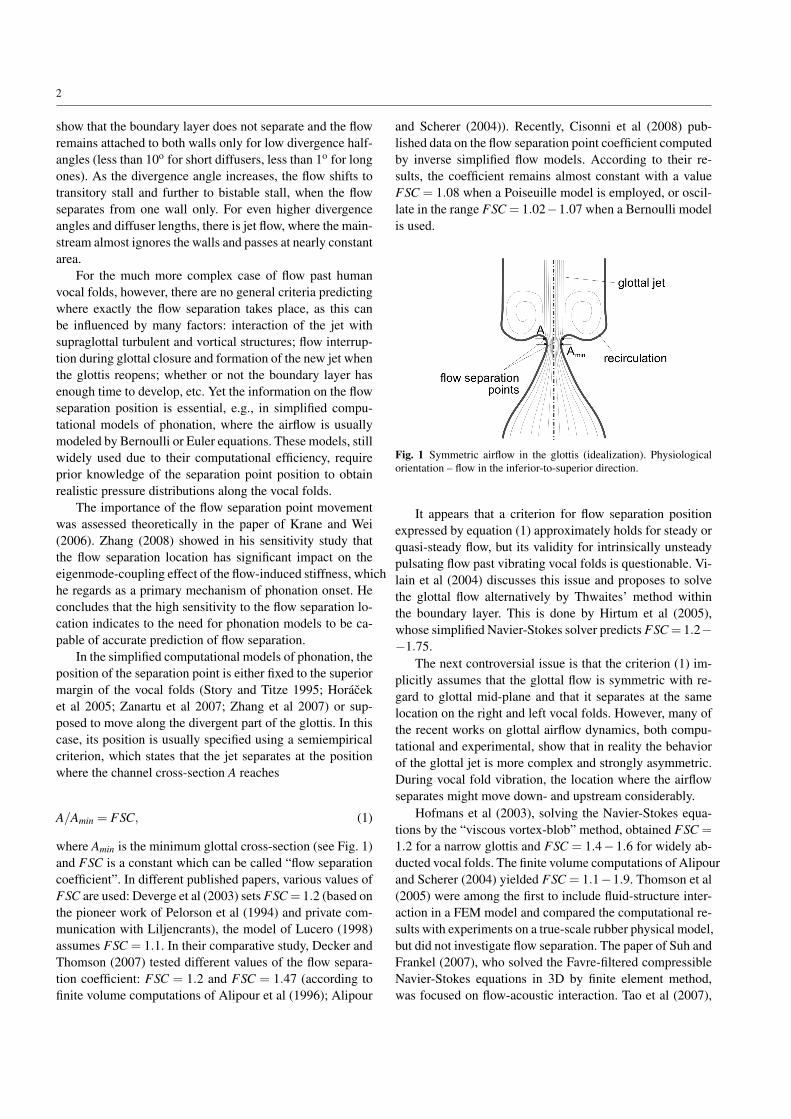
Fig. 2 Overview of the important dimensional parameters: channelheight H0, inlet flow velocity U0, characteristic length (vocal fold thick-ness) L and frequency f , mass m and stiffness k.
The physical dimensions of the real human larynx arevery small, making the design of a life-sized physical modela very difficult issue. In order to to perform high-resolutionmeasurements on a mechanical model with well-defined prop-erties, the physical model was scaled up by a factor of four.Tab. 1 summarizes the important dimensional and dimen-sionless parameters of the real larynx and the physical model,particularly the Reynolds and Strouhal numbers
Re =U0L
ν, St =
f LU0
(2)
based on the mean subglottal velocity U0, kinematic viscos-ity ν , fundamental frequency of vibration f and vocal foldthickness L (see Fig. 2).
The elasticity of the vocal folds is modeled mainly by thestiffness of the flat springs. As shown in Fig. 4, each springwas clamped to a rigid beam on one side, and screwed to therigid support of the vocal fold on the other. The dimensions
(85× 10× 0.5 mm) and material (brass alloy, Young mod-ulus 100 GPa) of the springs were designed so that the firstnatural frequency of the system matched the desired scaledfrequency. After fabrication, the force-deflection curve ofthe springs was measured. Within the operational limits, theresponse was roughly linear (slightly hardening under heav-ier loads), with stiffness about 200 N/m per one spring. Thestiffness of the silicone rubber itself would be too large toallow self-sustained oscillation with the desired frequency,and plays important role during vocal fold collisions only.
The elastic support gives the vocal fold three degreesof freedom. The first is the “heaving” (10) mode of vibra-tion, where the vocal fold translates along the y-axis (seeFig. 2 for orientation of the coordinate system). In the sec-ond, “rocking” (11) mode, the mass rotates about the z-axis.The elastic support itself does not block the third, undesired,“torsional” (20) mode, where the vocal fold rotates about thex-axis. Frequency analysis of the impulse response showsthat the natural frequency of the largely dominant heavingmode is 11.0 Hz. The second highest peak in the spectrum(about 20 dB lower than the first one) at 21.9 Hz belongsto the torsional mode. The high-speed camera recordings offlow-induced vibration revealed, however, that the torsionalmode is suppressed by collisions against the opposite vo-cal fold and most likely also by the aerodynamic damping,since this mode did not occur even for vibration without col-lisions at low flow rates. The rocking mode manifests as anindistinct peak at 38 Hz. As a result, the flow-induced vibra-tion occurs slightly above the first natural frequency and hasmostly the character of the first (10) mode.
2.2 Experimental setup
The vocal fold model was mounted in a plexiglass windtunnel. A centrifugal fan regulated by a frequency inverterdrives the flow through a honeycomb screen into a long cir-cular channel intended to suppress the inlet turbulence (seeFig. 4, 3). Further, the channel cross-section contracts smoothlyby factor f ≈ 6 into a rectangular 100×40 mm inlet of themeasuring section with the vocal folds. Downstream of thevocal folds, the channel continues 40 cm to simulate the vo-cal tract and terminates freely into ambient air.
To allow free motion of the vocal fold, there has to bea small gap between the vocal fold and the channel walls.The leakage flow at the inferior margin (left edge in Fig. 3)was blocked by a thin membrane. Since the mean supraglot-tal pressure in the model was close to atmospheric pressure,the leakage at the superior margin was not important. Theairflow along the side walls, which could not be completelyavoided, did not significantly influence the supraglottal ve-locity fields measured in the channel mid-plane.
The setup was equipped with accelerometers (Bruel&Kjær4507C), mounted below the apex and leading edge of the vo-

5
cal fold to record vocal fold vibration. The frequency spectraof the acceleration signal were used to detect the frequencyof vibration of the vocal fold. To capture the subglottal pres-sure including the DC part of the signal, dynamic pressuretransducers (Validyne DP15TL, steel membrane 0.125 PSI FS)were used. Two microphones (G.R.A.S. 1/8” condenser mi-crophone type 4138 mounted flush with the wall, G.R.A.S.1/2” prepolarized free field microphone type 40BE locatedat the channel exit) recorded the supraglottal dynamic pres-sure and the radiated acoustic pressure. To measure the meanflow in the channel, an ultrasonic gas flowmeter (GE Pana-metric GC 868) was fixed near the downstream end of thecircular channel. The diagram in Fig. 3 shows the locationsand wiring of transducers used. The important dimensionsare summarized in Fig. 4.
Fig. 4 Schematic of the vocal fold model and important dimensions ofthe wind tunnel (in millimeters).
The PIV system consisted of a Nd:YAG laser (New WaveResearch Solo III, maximum repetition rate 15 Hz, 120 mJ)laser unit, and the PIV camera and unit (La Vision ImagerPRO, 1600× 1200 pix, max. 15 frames/s). The flow wasseeded from an olive oil atomizer upstream of the honey-comb screen. The camera lens (Canon macro TV zoom),fixed 1.5 cm from the plexiglass wall, had a field of viewof about 60 × 45 mm, providing spatial resolution of theraw camera frames of 0.037 mm/pix. The PIV settings wereas follows: delay between pulses 20 µs, interrogation area32×32 pix, 50% overlap. In order to remove the laser sheetreflections on the vocal fold surface, the raw images werepreprocessed using sliding background image subtraction.The postprocessing options consisted of multi-pass correla-tion, peak validation, median filtering and smoothing.
The laser and camera were triggered by a rectified sig-nal from one of the accelerometers. Hence, the system wasphase-locked with the vocal fold vibration to measure thevelocity fields at precisely defined phases of the oscillationcycle. Due to the low repetition frequency of the laser sys-tem (15 Hz), only one pulse could be generated per one os-cillation cycle. The phase difference between the laser andvocal fold oscillation was set in such a way, that during
40 subsequent periods of vibration 40 camera frames wererecorded, covering the whole oscillation cycle. The setup ofthe optics allowed recording the 2D flow field immediatelydownstream of the glottis. Due to oil particle deposition onthe walls, frequent cleaning was necessary between experi-mental runs to preserve sufficient image sharpness.
2.3 Determination of the flow separation point from therecorded camera frames
Traditionally, the term “flow separation point” used in sim-plified models of glottal flow assumes that the glottal flow issymmetric with regard to the glottis midline, as depicted inFig. 1. In this case, it is sufficient to quantify the separationpoint position by the glottal area at the critical place. How-ever, flow visualizations and PIV measurements on physicalmodels, as well as computational flow simulations based onfinite element or finite volume codes, show that this is rarelythe case: the glottal jet tends to attach to one of the vocal foldsurfaces and significantly skews from the glottis midline po-sition (see Fig. 5 for a schematic representation of the flowpattern).
Fig. 5 Asymmetric flow in the glottis. Physiological orientation – flowin the inferior-to-superior direction.
Such asymmetric flow was observed in measurementspresented in this paper, too. Therefore, it was necessary tointroduce a suitable coordinate system to describe the posi-tion of the “left” and “right” separation point independently,still allowing to correlate the new results to previously usedcriteria for flow separation.
First, the narrowest cross-section was located (definedby the left and right VF apex in Fig. 6). The line is not nec-essarily perpendicular to the channel, because during vibra-tion the apex of the vocal fold moves slightly in the hori-zontal direction (that is, in the inferior-superior direction inphysiological orientation). Then, the “left” and “right” flowseparation coefficients FSCL and FSCR can be defined sim-

6
Fig. 3 Diagram of the experimental setup used for the measurements of vocal fold vibration and for visualization of the supraglottal flow.1. Rietschle Thomas centrifugal fan (2200 W, ∆ pmax = 29 mbar, Qmax = 2770 m3/h). 2. Omron Sysdrive 3G3MV frequency inverter (380 V,0 – 60 Hz). 3. GE Panametric GC 868 ultrasonic gas flowmeter. 4. Validyne DP15TL dynamic pressure transducer (steel membrane 0.125 PSI FS).5. Validyne CD23 amplifier. 6.,7. Bruel&Kjær 4507C accelerometers. 8. Bruel&Kjær Nexus conditioning amplifier type 2692 (frequency bandpass1 Hz – 1 kHz). 9. G.R.A.S. 1/8” condenser microphone type 4138, G.R.A.S. preamplifier type 26AJ. 10. G.R.A.S. 1/2” prepolarized free fieldmicrophone type 40BE, G.R.A.S. preamplifier type 26AJ. 11. Bruel&Kjær Nexus conditioning amplifier type 2690. 12. New Wave Research PIVlaser SOLO 3-15. 13. New Wave Research SOLO III laser unit. 14. LaVision Imager PRO camera unit. 15. PC - 2proc Intel Xeon, software Davisv7. 16. Philips PM5715 TTL/pulse generator. 17. National Instruments NI DAQPad-6015 data acquisition card. 18. PC - software NI LabViewv7.1. 19. LaVision Imager PRO camera (1600× 1200 pixel, Canon macro TV zoom lens). 20. Kimo water manometer (precision 0.5 mm H2O(5 Pa)).
ply as the distance of the respective flow separation pointfrom the axis divided by half of the orifice width:
FSCL =wL
d/2, FSCR =
wR
d/2. (3)
Such a description is a generalization of the symmetricaldefinition (1). If the vocal fold vibration and supraglottalvelocity field were perfectly symmetrical with regard to theglottal axis, the definitions would be equivalent.
In principle, the position of the flow separation pointmay be evaluated from the vector fields calculated by thePIV method. However, in the PIV velocity field a singlevector is computed typically from a 32× 32 pixel “interro-gation” area, which means that the resolution of the vectorfield is much lower than the resolution of the original image.Moreover, the vector represents a statistical mean of particlevelocities within the interrogation area. Consequently, thevector fields tend to smooth out small-scale turbulent effectsand large velocity gradients.
However, when the optical setup is properly focused andthe glottal area well illuminated by the laser sheet, it is possi-ble to exploit directly the raw camera double-frames, which
Fig. 6 Definition of the flow separation coefficient. Experimental con-figuration – flow direction from the left to the right.
provide more detailed information on the small-scale flowfeatures, although not quantitative. When the two cameraframes are played consecutively in image analysis software,the boundary between the fast moving particles within the

7
Fig. 7 Raw image recorded by the PIV camera (first frame of thedouble-frame) showing the positions of seeding particles (top). Whenplayed consecutively with the second frame, the glottal jet contoursand the position where the jet separates from the vocal fold surface areclearly visible. Instantaneous vector velocity field computed by PIV(bottom). Measurement 012 (Re = 5400), regular vocal fold vibrationwith a collision in each cycle. Frequency of vibration 13.2 Hz.
glottal jet and almost immobile particles in the supraglottalarea becomes clearly evident. Fig. 7 shows the raw cameraframe and the computed PIV velocity field. The still figurecannot display the motion of the particles used to locate theseparation points, but provides a basic insight into what flowscales are lost in the PIV field. Using this technique, it ispossible to discern the glottal jet contour and the position ofthe flow separation point with an accuracy on the order of0.1 mm. Even when taking into account the possible errorintroduced by the partly subjective character of the method,the uncertainty of the position of the flow separation pointis well below 0.5 mm. In the rare cases where the glottal jetwas not clearly recognizable, the position of the separationpoint was not recorded and the value was rejected.
Technically, the evaluation procedure of the flow sep-aration point was as follows (performed using high-speedcamera image analysis software Olympus i-SPEED 2):
– the images were calibrated using the known height of thechannel
– for each phase of the vocal fold oscillation, the positionof the “left” and “right” flow separation point and of thevocal fold apex was located manually,
– the coordinates of the four points were recorded by thesoftware and the left and right flow separation coeffi-cients were calculated automatically according to equa-tion (3).
3 Results
3.1 Dynamic and acoustic measurements
Although it was not the primary objective of this study tomeasure the dynamic response of the structure to flow exci-tation and the sound signal, these results help understand thedynamic and acoustic properties of the system. The vibra-tion of the vocal fold is shown in Fig. 8. The figure depictsnine phases of one oscillation cycle from measurement 012,corresponding to regular vocal fold vibration with a collisionin each cycle. The third phase (top right) is in the maximumglottis opening. The eighth phase (bottom, in the middle)was taken in the middle of the of the contact period, wherethe vocal folds approached most. This phase also reveals themaximum deformation of the vocal folds.
Figs. 9, 10 show the waveforms and spectra of the vocalfold acceleration, subglottal pressure, supraglottal pressure,and radiated acoustic pressure. The mechanical vibration forthe lower flow rate (Fig. 9) is nearly sinusoidal. The non-harmonic spectral frequency of 78.5 Hz, significant also inthe spectrum of the subglottal pressure, corresponds prob-ably to subglottal acoustic resonance. In the waveforms ofthe microphone signals strong broadband noise is present,caused by turbulence in the supraglottal region.
The accelerometer waveform for Re = 5400 (Fig. 10)clearly shows the vocal fold collisions, which are visible aspeaks on the positive half-waves. The acoustic signals arewell correlated with the vocal fold motion, and have a pe-riodic structure with harmonic frequencies in their spectra.The subglottal pressure appears to include less noise, but thisis probably caused by the fact that unlike measuring micro-phones, the dynamic pressure transducer used was unable tocapture high-frequency components. It is apparent that in theconfiguration used, the best signal to trigger the PIV systemis the acceleration, which has best periodicity and signal-to-noise ratio.
3.2 Flow visualizations and PIV measurements
Fig. 11 shows a typical velocity field downstream of theglottis evaluated by the PIV method. The vocal folds in the

8
Fig. 8 Flow-induced vibration of the vocal fold – nine phases of anoscillation cycle. Measurement 012 (Re = 5400), regular vocal fold vi-bration with a collision in each cycle. Frequency of vibration 13.2 Hz.
Fig. 9 Waveforms (left) and frequency spectra (right) of the accelera-tion, subglottal pressure, supraglottal pressure and pressure radiated atthe channel exit. Measurement 002 (Re = 3500), vocal fold vibrationwithout a collisions. Frequency of vibration 11.7 Hz.
Fig. 10 Waveforms (left) and frequency spectra (right) of the accelera-tion, subglottal pressure, supraglottal pressure and pressure radiated atthe channel exit. Measurement 012 (Re = 5400), regular vocal fold vi-bration with a collision in each cycle. Frequency of vibration 13.2 Hz.
left part of the figure were masked out to show better theircontours and to remove meaningless vectors. The vector plotreveals the glottal jet, which separates from the vocal foldsurfaces and enters into the supraglottal domain. The jet isskewed to the right in this particular case. This tendency wasobserved throughout all the measurement sets, supportingthe assumption that the Coanda effect is present in humanphonation. In some of the measurements, the direction ofthe jet axis switched direction occasionally. However, thejet skewed preferentially to the right as in this case, proba-bly due to slight asymmetry in the geometry of the left andright vocal folds, and possibly also due to the fact that theleft (upper) vocal fold was fixed, while the right (bottom)one vibrated. In the region between the right vocal fold sur-face and the jet, a large recirculation vortex can be seen.
The flow visualizations (accompanied by acoustic anddynamic measurements) were performed systematically forincreasing flow rates. These ranged from the lowest possibleairflow able to induce self-sustained vocal fold oscillationsup to the highest values realistic in human phonation.

9
Fig. 12 Fluctuation of the left and right flow separation coefficients and of the orifice width. Measurements 012s-w (Re = 5400, with glottalclosure). Dashed lines delimit the boundaries of vocal fold vibration phases (opening phase, closing and closed phase).
Fig. 11 Typical instantaneous flow velocity field downstream of theglottis. Measurement 002d (Re = 3500, without glottal closure), middleof the closing phase.
3.3 Position of the flow separation point
The essence of this work is quantification of the flow separa-tion point locations during vocal fold vibration, as explainedin section 2.3. During phonation, the glottal velocity fieldis not perfectly periodic and the location of the flow sep-aration point in a specific phase can vary over subsequentcycles of vibration. Due to the highly arduous procedure ofevaluation of the separation point, it is impossible to pro-vide proper statistical information. However, it is importantto asses the fluctuation of the flow separation point posi-tion at least in one case. For this purpose, four measure-ments recorded at identical conditions (Reynolds numberRe = 5400, vocal fold vibrations with collisions) were an-alyzed. In order to superimpose the results of these mea-surements, where the frequency of vibration varied slightly(< 0.1 Hz) and the double-frames were not taken in exactlyidentical phases, it was necessary to extract in each case pre-cisely one period, allign the four measurements, interpolateand resample the data.
The results in Fig. 12 show that during most of the vi-bration cycle the flow separation coefficients have low varia-
tion. Near glottal closure, the data are much more scattered.This is caused by the fact that when the vocal folds collideand the jet is interrupted, the flow is highly nonstationaryand the decaying or evolving jet is more susceptible to inter-actions with turbulent structures. In certain measurements,it was even observed that the jet changes direction over sub-sequent cycles and attaches to the left or right vocal fold ina random way.
In the following, the results of flow separation point mea-surements for three flow rates are presented. Fig. 13 sum-marizes the results for Re = 3500, flow rate Q = 5.5 L/s,transglottal pressure difference ∆ p = 45 Pa, frequency ofvibration f = 10.9 Hz (corresponding to Q = 1.4 L/s, ∆ p =
720 Pa and f = 173 Hz lifesize). As can be seen from theorifice width plot in the right, in this case the vocal foldsdid not collide throughout the oscillation cycle. Such vocalfold vibration can be observed in certain types of breathyphonation.
Fig. 13 also shows the development of the left and rightflow separation coefficients during 40 phases of the vocalfold oscillation cycle. The opening and closing phases areseparated by dashed lines. The vocal folds approximate themost between frames #5-7, where the opening phase be-gins (see the orifice width plot in Fig. 13). In a large partof the oscillation period, both left and right flow separationcoefficients stay between 1.0 and 1.5. Near glottal closureand reopening, however, the FSCR sharply increases up toabout 5.5. This is a quantification of an effect which canbe seen almost universally in all measurements – when theglottal gap gets very narrow, the jet weakens and tends toattach to one of the vocal fold surfaces (in this case the rightone). Since the airflow separates very far from the narrowestcross-section, the separation coefficients reach much highervalues than usually assumed.
The effect is even more prominent in cases where the vo-cal folds collide and the glottal gap closes. Fig. 14 shows theflow separation coefficients and orifice width for Re = 5400,Q = 8.58 L/s, ∆ p = 150 Pa and f = 13.4 Hz (which corre-spond to Q = 2.1 L/s, ∆ p = 2400 Pa and f = 214 Hz life-size). Again, when the glottis is wide open, the flow separa-

10
tion coefficient is close to 1.1, increases to about 1.5 in themiddle of the opening/closing phases and sharply rises up to20 near vocal fold contact. The jet was attached mostly tothe right vocal fold, but the left separation coefficient nearthe glottis opening increased up to values around 5, as inprevious cases. Fig. reffig:012v-FSPdistance proves that theincrease of the FSC near glottal closure is not caused by thefact, that the glottal gap d – denominator in equation 3 issmall: the distance of the flow separation point from the vo-cal fold apex itself increases, too. This shows that the airflowseparates further downstream, than when the glottis is wideopen.
For the case shown in Fig. 15 (Re = 6600, Q = 10.4 L/s,∆ p = 230 Pa, f = 13.8 Hz, corresponding to Q = 2.6 L/s,∆ p = 3600 Pa and f = 220 Hz lifesize), FSCR has a plateauat 1.12 and shortly before glottal closure sharply rises upto 20. The FSCL data are more scattered, but show similarbehavior.
The physical model vibrated well for a broad range ofhigher airflow velocities, also. The quantified data on flowseparation showed very similar behavior even for these highvelocities. Nevertheless, since these flow rates are beyondthe physiologically relevant limits, the results are not shownhere.
4 Discussion and conclusions
The main objective of this paper was to provide experimen-tal quantitative data on glottal aerodynamics and namely onthe position of the flow separation point during phonation. Aphysical, four-times scaled vocal fold model was designedto perform the measurements. The geometry of the vocalfolds was based on measurement of excised human laryn-ges in phonation position, and is slightly different from the“M5” approximation commonly used in modeling studies.Further, the authors believe that in order to get representativeexperimental data on the aerodynamics of human phonationusing physical models, it is desirable that the model be self-oscillating, rather than externally driven. However, the re-quirement of a self-excited system brings numerous com-plications and technical limitations. First of all, the physicalmodel does not provide enough free parameters (e.g., thesubglottal velocity U0) to be set independently, and thus itcannot be ensured that the dynamic similarity of the modeland the real larynx is perfect. In current measurements, nev-ertheless, the pertinent Reynolds and Strouhal numbers liewithin the bounds encountered in human phonation.
From the same reason, the flow-induced vibration of thevocal fold model is not precisely identical with that foundin the real larynx. The convergent-divergent shaping of theglottis is not mimicked by the model to the extent that canbe reached in externally driven models: the current model
vibrates dominantly in the 10 mode and it mostly resem-bles the “convergent” M5 geometry. Therefore, the resultsare relevant e.g. for glottal opening or for situations closeto breathy voice, where the subglottal pressure is not high,prephonatory glottal diameter nonzero and where there isstrong reason to believe that the glottal shape changes fromdivergent to convergent shortly before closing. However, con-sidering that the shape of the medial surface of real vo-cal folds during vibrations can to be more complex (notstrictly straight convergent or straight divergent as in the M5model), the authors assume that the results on flow separa-tion locations measured using the model with a curved shapecan have certain relevance to the other cases of phonation,too.
It should be also noted that the flow rates in the modelare rather high relative to values known from human phona-tion, and the duration of the phase when the vocal folds areclosed (which is usually quantified by the closed quotient,CQ) lies in the lower bound of values encountered duringloud speech. Nevertheless, the experience from other self-oscillating physical models (Pelorson et al 1994; Thomsonet al 2005; Becker et al 2009) shows that it is difficult to de-sign a system behaving identically to the real vocal larynx,and even using approximate physical models, important andrelevant results can be obtained.
The physical model was equipped with accelerometersmonitoring vocal fold vibration. To measure the dynamicpressures and acoustic signals in the sub- and supraglottalspaces, pressure transducers and microphones were mountedin the setup. A PIV system synchronized with the vocal foldvibration was used to visualize the supraglottal airflow andto evaluate the position of the flow separation points alongthe vocal fold surfaces during their vibration. The airflow inthe glottis can be to first approximation considered as two-dimensional: one may assume that the flow velocity doesnot change significantly along the length of the vocal folds(i.e., along the anterior-posterior axis z, see Fig. 2) in thevery proximity of the glottis. This is not true further down-stream, where turbulent structures dominate the flow field– the vorticity, aligned originally along the z-axis, interactswith the velocity field and creates inevitably a 3D velocityfield. But when focused on the flow separation from the vo-cal fold surface, it is possible to draw meaningful data fromPIV measurements in the coronal (x-y) plane.
In simplified glottal flow models based on Bernoulli orEuler equations where flow separation is taken into account,the position of the flow separation point is commonly con-sidered as constant with respect to the narrowest cross-section.This implicitly assumes that the airflow is symmetric andseparates at the same location from the left and right vo-cal fold. In current work, a modified criterion for flow sep-aration (left and right flow separation coefficient – FSC),generalizing the classical criterion, was proposed. The re-

11
Fig. 13 Measurement 002c (Re = 3500, without glottal closure), one oscillation cycle. Left and right flow separation coefficient, orifice width.
Fig. 14 Measurement 012v (Re = 5400, with glottal closure), one oscillation cycle. Left and right flow separation coefficient, orifice width.
Fig. 15 Measurement 017c (Re = 6600, with glottal closure), one oscillation cycle. Left and right flow separation coefficient, orifice width.
Fig. 16 Measurement 012v (Re = 5400, with glottal closure), one oscillation cycle. Distance of the left and right flow separation point from thevocal fold apex.
12
sults suggest that the usage of the classical flow separationcriterion with constant values ranging between 1.1 and 1.5seems to be quite plausible, at least for the part of the oscil-lation cycle where the vocal folds are not too close together.Shortly before and after glottis closure, however, the aero-dynamic effects are apparently much more complex and thecriterion does not hold any more. The measured values ofFSC demonstrate a general trend: shortly prior to and afterglottal closure, either of the coefficients sharply increases,i.e., the glottal jet separates much further downstream of thenarrowest cross-section. This is consistent with the quali-tative results of Neubauer et al (2007), who observed thatduring glottis opening, the jet is attached to the VF wall andstrongly curved.
In a perfectly symmetrical glottal channel, the supraglot-tal flow field is bistable: the glottal jet does not remain sym-metric, but tends to attach to either side of the channel. In theexperiments, one of the directions was always preferential,although not exclusive. It seems that this was caused by mi-nor asymmetries of the geometry, rather than by the fact thatone of the model vocal folds was static. The same behaviorwas observed in the study of Erath and Plesniak (2010), whoshowed that even minor geometric irregularities cause the jetto skew to one of the directions with a high probability.
The physiological analogy to the current experimentalsetup would be unilateral vocal fold paralysis. The fact thatone of the vocal folds in the model does not vibrate limits tocertain extent the applicability of the results to real phona-tion. The current study is focused primarily on glottal aero-dynamics and specifically dynamics of the glottal jet, whichshould not be largely different from the situation in the reallarynx. Moreover, there have been even more dissimilar ar-rangements successfully used in experimental studies withsynthetic and excised larynges, e.g. the hemilarynx config-uration (one vocal fold colliding against symmetry plane).As long as a physical model representing all the importantqualities of the real human larynx at once is not available, itis worth using approximative models which inevitably differfrom reality in certain aspects.
The techniques used in this study for determining the lo-cation of flow separation were relatively laborious and time-consuming, and required perfect adjustment of the experi-mental setup, in particular clean and well-focused optics. Assome of the measurements did not provide sufficient con-trast and resolution, only three measurements were evalu-ated. Even though these do not represent a comprehensivestatistical dataset, the authors believe that the results pro-vide important new quantitative information, which cannotbe found in the current literature.
In subsequent studies, several construction details andmeasurement techniques could be further improved. The state-of-the-art of the current PIV laser and camera systems, forinstance, would allow a time-resolved measurement.
The current experimental setup does not contain a modelof ventricular folds. It can be speculated what the influenceof the ventricular folds on the position of the flow sepa-ration point is: depending on their distance from the vocalfolds, they might both straighten the glottal flow axially, ormake it skew laterally even more. The authors believe it is agood starting point to obtain experimental data not biased bythe presence of the ventricular folds. However, in the futureit would be appropriate to perform a parametric study withvarious ventricular fold shapes and locations and determinetheir effect on supraglottal aerodynamics. With these mod-ifications, the experimental setup could provide even moresystematic and precise data on airflow separation and help toenlighten some of the fundamental aspects of human phona-tion.
Acknowledgements The research has been financially supported bythe Grant Agency of the Academy of Sciences of the Czech Republic,project KJB200760801 Mathematical modeling and experimental in-vestigation of fluid-structure interaction in human vocal folds, researchplan AV0Z20760514. The support of ENSTA ParisTech, who providedthe experimental background, is also gratefully acknowledged.
References
Alipour F, Scherer RC (2004) Flow separation in a computational os-cillating vocal fold model. Journal of the Acoustical Society ofAmerica 116(3):1710–1719
Alipour F, Scherer RC (2006) Characterizing glottal jet turbulence.Journal of the Acoustical Society of America 119(2):1063–1073
Alipour F, Fan C, Scherer RC (1996) A numerical simulation of laryn-geal flow in a forced-oscillation glottal model. Computer Speechand Language 10:75–93
Barney A, Shadle C, Davies P (1999) Fluid flow in a dynamic mechan-ical model of the vocal folds and tract. i. measurements and theory.Journal of the Acoustical Society of America 105(1):444–455
Becker S, Kniesburges S, Muller S, Delgado A, Link G, KaltenbacherM, Dollinger M (2009) Flow-structure-acoustic interaction in ahuman voice model. Journal of the Acoustical Society of Amer-ica 125(3):1351–1361
Cisonni J, Hirtum AV, Pelorson X, Willems J (2008) Theoreti-cal simulation and experimental validation of inverse quasi-one-dimensional steady and unsteady glottal flow models. Journal ofthe Acoustical Society of America 124(1):535–545
Decker G, Thomson S (2007) Computational simulations of vocalfold vibration: Bernoulli versus navier-stokes. Journal of Voice21(3):273–284
Deverge M, Pelorson X, Vilain C, Lagree P, Chentouf F, Willems J,Hirschberg A (2003) Influence of collision on the flow throughin-vitro rigid models of the vocal folds. Journal of the AcousticalSociety of America 114(6 Pt 1):3354–3362
Erath B, Plesniak M (2006a) The occurrence of the coanda effect inpulsatile flow through static models of the human vocal folds. Ex-periments in Fluids 41:735–748
Erath B, Plesniak M (2006b) The occurrence of the coanda effect inpulsatile flow through static models of the human vocal folds.Journal of the Acoustical Society of America 120(2):1000–1011
Erath B, Plesniak M (2010) An investigation of asymmetric flow fea-tures in a scaled-up driven model of the human vocal folds. Exper-iments in Fluids DOI 10.1007/s00348-009-0809-0

13
Fox R, Kline S (1962) Flow regime data and design methods for curvedsubsonic diffusers. Transactions of ASME, Journal of Basic Engi-neering 84:303–312
Hirtum AV, Pelorson X, Lagree P (2005) In vitro validation of someflow assumptions for the prediction of the pressure distributionduring obstructive sleep apnoea. Medical and Biological Engineer-ing and Computing 43:162–171
Hofmans G, Groot G, Ranucci M, Graziani G, Hirschberg A (2003)Unsteady flow through in-vitro models of the glottis. Journal ofthe Acoustical Society of America 113(3):1658–1675
Horacek J, Sidlof P, Svec JG (2005) Numerical simulation of self-oscillations of human vocal folds with hertz model of impactforces. Journal of Fluids and Structures 20(6):853–869
Sidlof P, Svec JG, Horacek J, Vesely J, Klepacek I, Havlık R (2008)Geometry of human vocal folds and glottal channel for mathemat-ical and biomechanical modeling of voice production. Journal ofBiomechanics 41(5):985–995
Krane M, Wei T (2006) Theoretical assessment of unsteady aerody-namic effects in phonation. Journal of the Acoustical Society ofAmerica 120(3):1578–1588
Krane M, Barry M, Wei T (2007) Unsteady behavior of flow in ascaled-up vocal folds model. Journal of the Acoustical Society ofAmerica 122(6):3659–3670
Kucinschi B, Scherer R, Dewitt K, Ng T (2006) An experimental anal-ysis of the pressures and flows within a driven mechanical modelof phonation. Journal of the Acoustical Society of America 119(5Pt 1):3011–3021
Li S, Scherer R, Wan M, Wang S, Wu H (2006) The effect of glottalangle on intraglottal pressure. Journal of the Acoustical Society ofAmerica 119(1):539–548
Lucero J (1998) Optimal glottal configuration for ease of phonation.Journal of Voice 12(2):151–158
Neubauer J, Zhang Z, Miraghaie R, Berry D (2007) Coherent struc-tures of the near field flow in a self-oscillating physical modelof the vocal folds. Journal of the Acoustical Society of America121(2):1102–1118
Pelorson X, Hirschberg A, van Hassel R, Wijnands A, Auregan Y(1994) Theoretical and experimental study of quasisteady-flowseparation within the glottis during phonation. application to amodified two-mass model. Journal of the Acoustical Society ofAmerica 96(6):3416–3431
Scherer R, Shinwari D, Witt KD, Zhang C, Kucinschi B, Afjeh A(2001) Intraglottal pressure profiles for a symmetric and obliqueglottis with a divergence angle of 10 degrees. Journal of the Acous-tical Society of America 109(4):1616–1630
Scherer RC, Shinwari D, Witt KJD, Zhang C, Kucinschi BR, Af-jeh AA (2002) Intraglottal pressure distributions for a sym-metric and oblique glottis with a uniform duct. Journal ofthe Acoustical Society of America 112(4):1253–1256, URLhttp://www.ncbi.nlm.nih.gov/pubmed/12398430
Sciamarella D, Quere PL (2008) Solving for unsteady airflow in a glot-tal model with immersed moving boundaries. European Journal ofMechanics B/Fluids 27:42–53
Shinwari D, Scherer R, Dewitt K, Afjeh A (2003) Flow visualizationand pressure distributions in a model of the glottis with a sym-metric and oblique divergent angle of 10 degrees. Journal of theAcoustical Society of America 113(1):487–497
Story B, Titze I (1995) Voice simulation with a body-cover modelof the vocal folds. Journal of the Acoustical Society of America97(2):1249–1260
Suh J, Frankel S (2007) Numerical simulation of turbulence transitionand sound radiation for flow through a rigid glottal model. Journalof the Acoustical Society of America 121(6):3728–3739
Tao C, Zhang Y, Hottinger D, Jiang J (2007) Asymmetric airflowand vibration induced by the coanda effect in a symmetric modelof the vocal folds. Journal of the Acoustical Society of America
122(4):2270–2278Thomson S, Mongeau L, Frankel S (2005) Aerodynamic transfer of en-
ergy to the vocal folds. Journal of the Acoustical Society of Amer-ica 118(3 Pt 1):1689–1700
Triep M, Brucker C (2010) Three-dimensional nature of the glottal jet.Journal of the Acoustical Society of America 127(3):1537–1547,DOI 10.1121/1.3299202
Triep M, Brucker C, Schroder W (2005) High-speed piv measurementsof the flow downstream of a dynamic mechanical model of thehuman vocal folds. Experiments in Fluids 39:232–245
Vilain C, Pelorson X, Fraysse C, Deverge M, Hirschberg A, WillemsJ (2004) Experimental validation of a quasi-steady theory for the-flow through the glottis. Journal of sound and vibration 276:475–490
Zanartu M, Mongeau L, Wodicka G (2007) Influence of acoustic load-ing on an effective single mass model of the vocal folds. Journalof the Acoustical Society of America 121(2):1119–1129
Zhang Z (2008) Influence of flow separation location on phona-tion onset. J Acoust Soc Am 124(3):1689–1694, DOI10.1121/1.2957938, URL http://dx.doi.org/10.1121/1.2957938
Zhang Z, Neubauer J, Berry D (2007) Physical mechanisms of phona-tion onset: a linear stability analysis of an aeroelastic continuummodel of phonation. Journal of the Acoustical Society of America122(4):2279–2295
Related Documents


