Progress In Electromagnetics Research C, Vol. 20, 255–268, 2011 MEASUREMENT METHOD FOR SENSITIVITY ANALY- SIS OF PROXIMITY SENSOR AND SENSOR ANTENNA INTEGRATION IN A HANDHELD DEVICE S. Myllymaki, A. Huttunen, and H. Jantunen Microelectronics and Material Physics Laboratories University of Oulu, P. O. Box 4500, FI-90014, Finland M. Berg and E. Salonen Centre for Wireless Communications University of Oulu, P. O. Box 4500, FI-90014, Finland Abstract—A method for measuring the sensitivity of a capacitive proximity sensor and an application using the sensor as a proximity detector in mobile phone antennas is presented. 2D sensor data plots were physically more exact for tuning sensor placement. 3D sensor data plots were suitable for sensor intensity comparison, highlighting sensor differences in multiple sensor applications and effects in sensor‘s output due to shadowing mechanical objects. The antenna proximity sensor was measured and optimised with sensitivity measurements. In a PIFA application the antenna load could be detected from both sides and from above the antenna on a scale of 4.03 · 10 -14 F to 4.33 · 10 -14 F. The cases present all possible positions of holding a phone used in either the “calling” or “browsing” mode. The method and the application emphasise the physical sensitivity and electrical fields of the sensor. The characteristics can be further improved by using other sensor types, sensor data fusion and advanced imitation of multisensory spatial interaction by humans and animals. 1. INTRODUCTION Tactile, motion and presence sensors are widely used in companies that utilise process automation. Sensors that measure slightly different physical features in automation devices, robots, or handheld devices Received 4 March 2011, Accepted 22 March 2011, Scheduled 28 March 2011 Corresponding author: Sami Myllymaki ([email protected].fi).

Welcome message from author
This document is posted to help you gain knowledge. Please leave a comment to let me know what you think about it! Share it to your friends and learn new things together.
Transcript
Progress In Electromagnetics Research C, Vol. 20, 255–268, 2011
MEASUREMENT METHOD FOR SENSITIVITY ANALY-SIS OF PROXIMITY SENSOR AND SENSOR ANTENNAINTEGRATION IN A HANDHELD DEVICE
S. Myllymaki, A. Huttunen, and H. Jantunen
Microelectronics and Material Physics LaboratoriesUniversity of Oulu, P. O. Box 4500, FI-90014, Finland
M. Berg and E. Salonen
Centre for Wireless CommunicationsUniversity of Oulu, P. O. Box 4500, FI-90014, Finland
Abstract—A method for measuring the sensitivity of a capacitiveproximity sensor and an application using the sensor as a proximitydetector in mobile phone antennas is presented. 2D sensor data plotswere physically more exact for tuning sensor placement. 3D sensordata plots were suitable for sensor intensity comparison, highlightingsensor differences in multiple sensor applications and effects in sensor‘soutput due to shadowing mechanical objects. The antenna proximitysensor was measured and optimised with sensitivity measurements.In a PIFA application the antenna load could be detected from bothsides and from above the antenna on a scale of 4.03 · 10−14 F to4.33 · 10−14 F. The cases present all possible positions of holding aphone used in either the “calling” or “browsing” mode. The methodand the application emphasise the physical sensitivity and electricalfields of the sensor. The characteristics can be further improved byusing other sensor types, sensor data fusion and advanced imitation ofmultisensory spatial interaction by humans and animals.
1. INTRODUCTION
Tactile, motion and presence sensors are widely used in companiesthat utilise process automation. Sensors that measure slightly differentphysical features in automation devices, robots, or handheld devices
Received 4 March 2011, Accepted 22 March 2011, Scheduled 28 March 2011Corresponding author: Sami Myllymaki ([email protected]).
256 Myllymaki et al.
are usually placed in difficult physical locations as a result of thewidespread trend of saving room in electronics. From the designer’spoint of view, noise and ambient circumstances complicate sensing.Therefore, new capabilities not fully offered by current techniquesare needed for the design process of devices and sensors. Softwaredevelopment trends such as open source code and reconfigurableplatform characteristics offer a new type of product development and anew user experience in terms of products, and various physical sensorsare needed. The combination of different sensors such as tactile,presence and machine vision is climbing into new convergence [1, 2].
The advantages of proximity sensors are precise sensing ofgeometric positions. Contactless sensing of objects and process eventsprovide fast switching operation with a nearly unlimited amountof switching cycles. Monitoring and safeguarding processes aretypical environments where proximity sensors are used for detectionof occasions and faults. Tactile and pressure sensors are oftenimplemented in force sensor usage such as robot gripping, devicecontacts or human safety issues. Current problems are high cost,difficulty in measuring in complex conditions and fusion of differentsensor data [3–6]. Several applications, such as parallel manipulatorsin robots [5, 8], need multiple proximity sensors. Robots used in humanenvironments have to use adaptation in order to execute complicatedtasks in 3D space. The number of degrees of freedom is increased,which further leads to complicated alternative situations and problemshave to be solved with incomplete information.
Capacitive sensors are a sensor type widely used for proximitydetection. They are used for safety functions in chainsaws (10-cmdistance) [7], in robot hand applications (0–8-cm distance) [8] and forseat occupancy sensing in cars [9], at operating frequencies of 80 kHz,250 kHz and 500 kHz, respectively.
This paper describes the use of capacitive sensors in mobilephones. User proximity causes detrimental effects in the antennasof handheld devices, since human tissue in close proximity decreasesthe phone’s efficiency. Much energy is consumed and shorter batterylife hinders use of the devices [10–14]. The mentioned effect inphones cannot be fully compensated with current techniques [15, 16].One technique for detecting user-antenna proximity is a capacitiveproximity sensor; the method for evaluating the proximity effect isintroduced in [17, 18]. Proximity sensors have to be combined withimpedance matching or antenna selection techniques in order to realizethe benefits of the sensor system. A capacitive sensor can sense the userproximity effect regardless of antenna matching, which is complexlychanged when more than one electrical resonance is used in the same
Progress In Electromagnetics Research C, Vol. 20, 2011 257
band or when matching is modified by a resistive component, e.g.,human tissue absorption. In addition, capacitive sensors sense allantennas in multiple antenna applications. This characteristic savestime and energy, since the communication signal is not used for sensingpurposes. Obviously, due to the room-saving trend of recent years,extra room for capacitive sensors is not available. Thus, sensors haveto be designed without extra room requirements in current devices.
The combination of proximity sensors and limited availability ofroom challenges designers and devices. Capacitive sensors offering asimple sensing method attract interest but are skipped due to roomlimitation issues. A method for evaluating the effectivity of capacitivesensors is presented in detail here. The method is based on figuring outthe sensitivity of the sensor in terms of an object’s geometrical position.It can be used to compare different sensors or different sensor locations.A proximity sensor can be shadowed by many other objects inside thedevice, e.g., connectors and metal frames. This evaluation method canhelp the designer select optimum sensors for the device under design,saving time and resulting in a better final user experience.
This paper presents a method for evaluating the sensitivity of acapacitive sensor implemented in a mobile phone. Section 2 describesthe details of the method, the system and calibration to measure thesensitivity of the sensor. Section 3 presents measurement results ina mobile phone antenna application. A discussion and conclusion arepresented in Sections 4 and 5.
2. MEASUREMENT SYSTEM
The sensitivity of a sensor as a key design parameter is dependent onthe place where the sensor is located. Sensitivity can be presented asthe sensor output in terms of an object’s geometrical position, i.e., theobject’s distance from the sensor. The object should resemble a realobject as much as possible, which means that in the detection of humanpresence the object has to resemble human tissue at low frequency(16 kHz). Furthermore, sensors behind shadowing objects such asmetal cases have to be measured in real usage conditions. Under thesecircumstances, the final product, having mature and robust testingbehind it, is able provide a positive user experience.
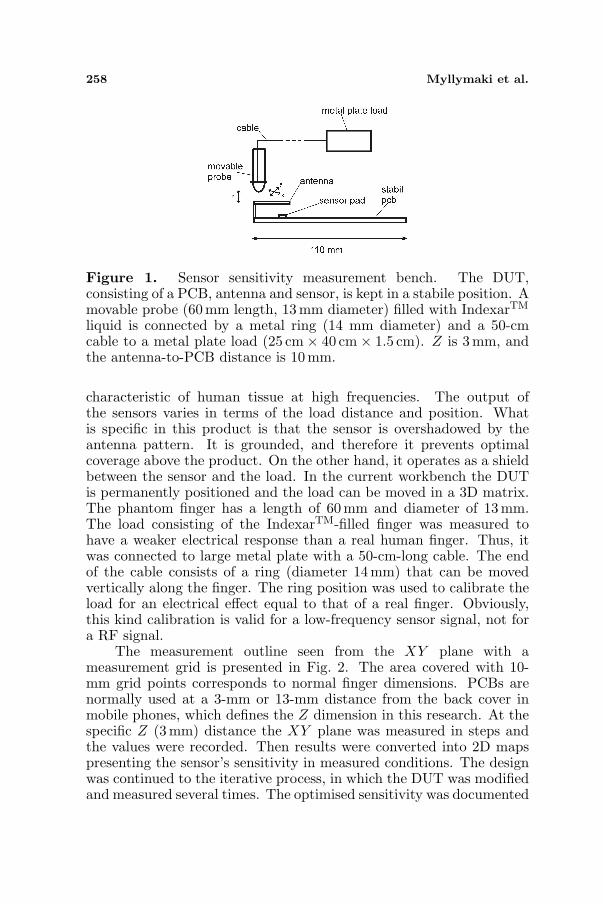
Figure 1 shows a sensitivity measurement system for a capacitivesensor in the case of a mobile phone. The method can be applied inthe same manner in corresponding products. The system consists of adevice under test (DUT) and a movable load representing a phantomfinger in this study. The phantom finger is a finger-sized plasticpackage filled with IndexarTM liquid, which has electrical parameters
258 Myllymaki et al.
Figure 1. Sensor sensitivity measurement bench. The DUT,consisting of a PCB, antenna and sensor, is kept in a stabile position. Amovable probe (60mm length, 13mm diameter) filled with IndexarTM
liquid is connected by a metal ring (14 mm diameter) and a 50-cmcable to a metal plate load (25 cm× 40 cm × 1.5 cm). Z is 3 mm, andthe antenna-to-PCB distance is 10mm.
characteristic of human tissue at high frequencies. The output ofthe sensors varies in terms of the load distance and position. Whatis specific in this product is that the sensor is overshadowed by theantenna pattern. It is grounded, and therefore it prevents optimalcoverage above the product. On the other hand, it operates as a shieldbetween the sensor and the load. In the current workbench the DUTis permanently positioned and the load can be moved in a 3D matrix.The phantom finger has a length of 60 mm and diameter of 13 mm.The load consisting of the IndexarTM-filled finger was measured tohave a weaker electrical response than a real human finger. Thus, itwas connected to large metal plate with a 50-cm-long cable. The endof the cable consists of a ring (diameter 14 mm) that can be movedvertically along the finger. The ring position was used to calibrate theload for an electrical effect equal to that of a real finger. Obviously,this kind calibration is valid for a low-frequency sensor signal, not fora RF signal.
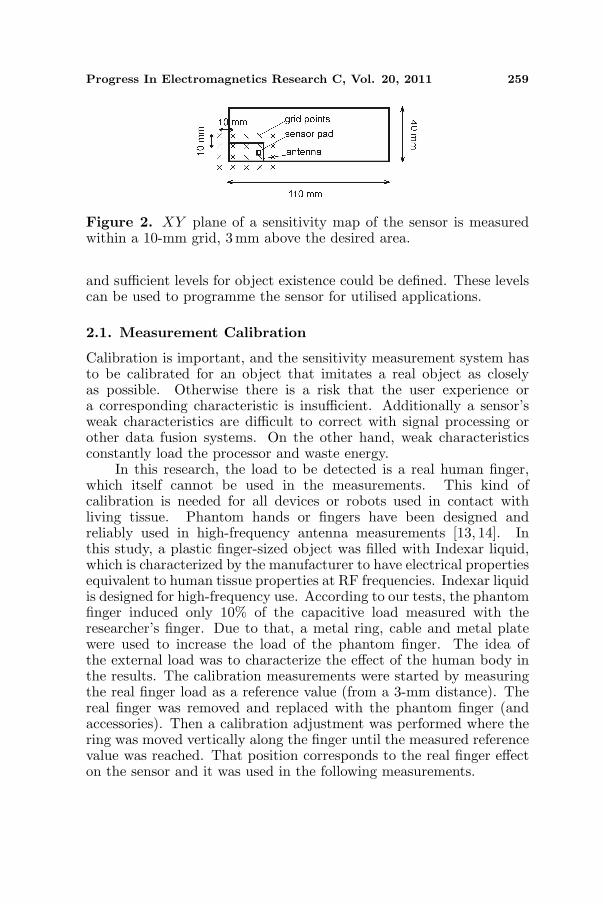
The measurement outline seen from the XY plane with ameasurement grid is presented in Fig. 2. The area covered with 10-mm grid points corresponds to normal finger dimensions. PCBs arenormally used at a 3-mm or 13-mm distance from the back cover inmobile phones, which defines the Z dimension in this research. At thespecific Z (3mm) distance the XY plane was measured in steps andthe values were recorded. Then results were converted into 2D mapspresenting the sensor’s sensitivity in measured conditions. The designwas continued to the iterative process, in which the DUT was modifiedand measured several times. The optimised sensitivity was documented
Progress In Electromagnetics Research C, Vol. 20, 2011 259
Figure 2. XY plane of a sensitivity map of the sensor is measuredwithin a 10-mm grid, 3 mm above the desired area.
and sufficient levels for object existence could be defined. These levelscan be used to programme the sensor for utilised applications.
2.1. Measurement Calibration
Calibration is important, and the sensitivity measurement system hasto be calibrated for an object that imitates a real object as closelyas possible. Otherwise there is a risk that the user experience ora corresponding characteristic is insufficient. Additionally a sensor’sweak characteristics are difficult to correct with signal processing orother data fusion systems. On the other hand, weak characteristicsconstantly load the processor and waste energy.
In this research, the load to be detected is a real human finger,which itself cannot be used in the measurements. This kind ofcalibration is needed for all devices or robots used in contact withliving tissue. Phantom hands or fingers have been designed andreliably used in high-frequency antenna measurements [13, 14]. Inthis study, a plastic finger-sized object was filled with Indexar liquid,which is characterized by the manufacturer to have electrical propertiesequivalent to human tissue properties at RF frequencies. Indexar liquidis designed for high-frequency use. According to our tests, the phantomfinger induced only 10% of the capacitive load measured with theresearcher’s finger. Due to that, a metal ring, cable and metal platewere used to increase the load of the phantom finger. The idea ofthe external load was to characterize the effect of the human body inthe results. The calibration measurements were started by measuringthe real finger load as a reference value (from a 3-mm distance). Thereal finger was removed and replaced with the phantom finger (andaccessories). Then a calibration adjustment was performed where thering was moved vertically along the finger until the measured referencevalue was reached. That position corresponds to the real finger effecton the sensor and it was used in the following measurements.
260 Myllymaki et al.
3. RESULTS
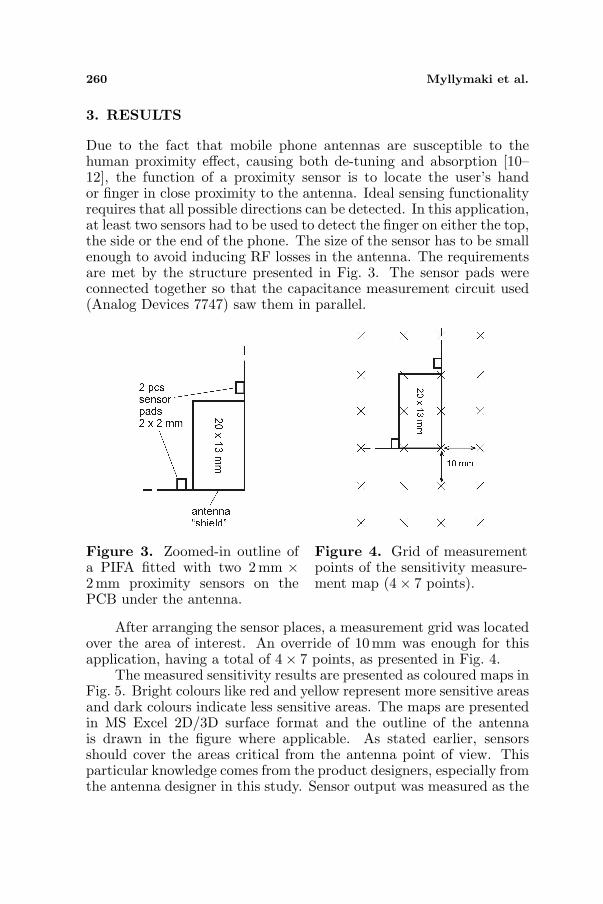
Due to the fact that mobile phone antennas are susceptible to thehuman proximity effect, causing both de-tuning and absorption [10–12], the function of a proximity sensor is to locate the user’s handor finger in close proximity to the antenna. Ideal sensing functionalityrequires that all possible directions can be detected. In this application,at least two sensors had to be used to detect the finger on either the top,the side or the end of the phone. The size of the sensor has to be smallenough to avoid inducing RF losses in the antenna. The requirementsare met by the structure presented in Fig. 3. The sensor pads wereconnected together so that the capacitance measurement circuit used(Analog Devices 7747) saw them in parallel.
Figure 3. Zoomed-in outline ofa PIFA fitted with two 2 mm ×2mm proximity sensors on thePCB under the antenna.
Figure 4. Grid of measurementpoints of the sensitivity measure-ment map (4× 7 points).
After arranging the sensor places, a measurement grid was locatedover the area of interest. An override of 10mm was enough for thisapplication, having a total of 4× 7 points, as presented in Fig. 4.
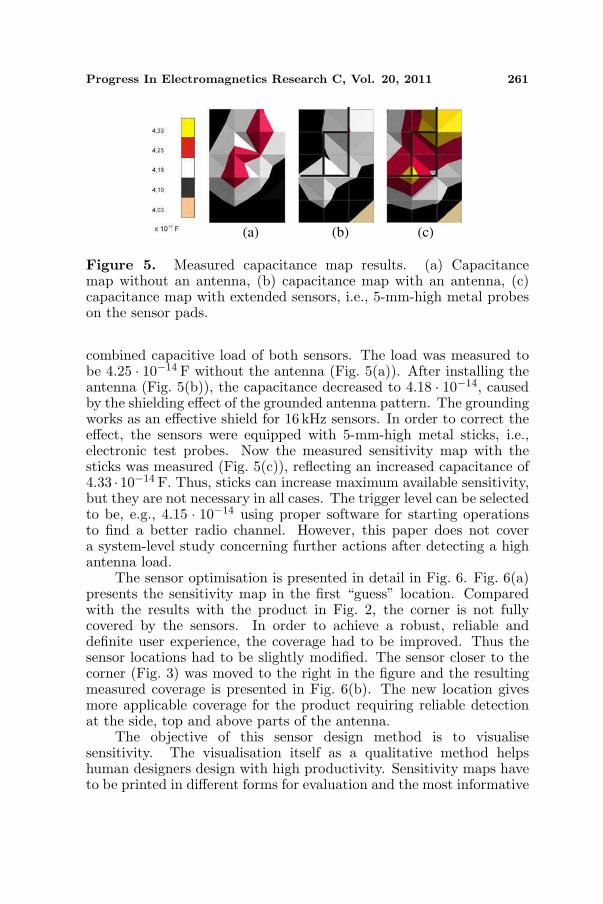
The measured sensitivity results are presented as coloured maps inFig. 5. Bright colours like red and yellow represent more sensitive areasand dark colours indicate less sensitive areas. The maps are presentedin MS Excel 2D/3D surface format and the outline of the antennais drawn in the figure where applicable. As stated earlier, sensorsshould cover the areas critical from the antenna point of view. Thisparticular knowledge comes from the product designers, especially fromthe antenna designer in this study. Sensor output was measured as the
Progress In Electromagnetics Research C, Vol. 20, 2011 261
(a) (b) (c)
Figure 5. Measured capacitance map results. (a) Capacitancemap without an antenna, (b) capacitance map with an antenna, (c)capacitance map with extended sensors, i.e., 5-mm-high metal probeson the sensor pads.
combined capacitive load of both sensors. The load was measured tobe 4.25 · 10−14 F without the antenna (Fig. 5(a)). After installing theantenna (Fig. 5(b)), the capacitance decreased to 4.18 · 10−14, causedby the shielding effect of the grounded antenna pattern. The groundingworks as an effective shield for 16 kHz sensors. In order to correct theeffect, the sensors were equipped with 5-mm-high metal sticks, i.e.,electronic test probes. Now the measured sensitivity map with thesticks was measured (Fig. 5(c)), reflecting an increased capacitance of4.33 ·10−14 F. Thus, sticks can increase maximum available sensitivity,but they are not necessary in all cases. The trigger level can be selectedto be, e.g., 4.15 · 10−14 using proper software for starting operationsto find a better radio channel. However, this paper does not covera system-level study concerning further actions after detecting a highantenna load.
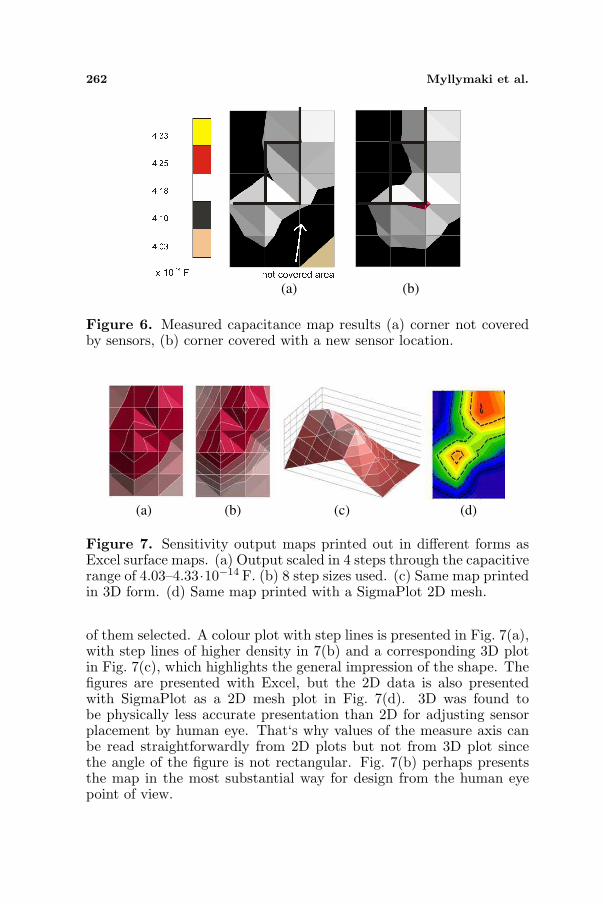
The sensor optimisation is presented in detail in Fig. 6. Fig. 6(a)presents the sensitivity map in the first “guess” location. Comparedwith the results with the product in Fig. 2, the corner is not fullycovered by the sensors. In order to achieve a robust, reliable anddefinite user experience, the coverage had to be improved. Thus thesensor locations had to be slightly modified. The sensor closer to thecorner (Fig. 3) was moved to the right in the figure and the resultingmeasured coverage is presented in Fig. 6(b). The new location givesmore applicable coverage for the product requiring reliable detectionat the side, top and above parts of the antenna.
The objective of this sensor design method is to visualisesensitivity. The visualisation itself as a qualitative method helpshuman designers design with high productivity. Sensitivity maps haveto be printed in different forms for evaluation and the most informative
262 Myllymaki et al.
(a) (b)
Figure 6. Measured capacitance map results (a) corner not coveredby sensors, (b) corner covered with a new sensor location.
(a) (b) (c) (d)
Figure 7. Sensitivity output maps printed out in different forms asExcel surface maps. (a) Output scaled in 4 steps through the capacitiverange of 4.03–4.33·10−14 F. (b) 8 step sizes used. (c) Same map printedin 3D form. (d) Same map printed with a SigmaPlot 2D mesh.
of them selected. A colour plot with step lines is presented in Fig. 7(a),with step lines of higher density in 7(b) and a corresponding 3D plotin Fig. 7(c), which highlights the general impression of the shape. Thefigures are presented with Excel, but the 2D data is also presentedwith SigmaPlot as a 2D mesh plot in Fig. 7(d). 3D was found tobe physically less accurate presentation than 2D for adjusting sensorplacement by human eye. That‘s why values of the measure axis canbe read straightforwardly from 2D plots but not from 3D plot sincethe angle of the figure is not rectangular. Fig. 7(b) perhaps presentsthe map in the most substantial way for design from the human eyepoint of view.
Progress In Electromagnetics Research C, Vol. 20, 2011 263
(a) (b)
(c) (d)
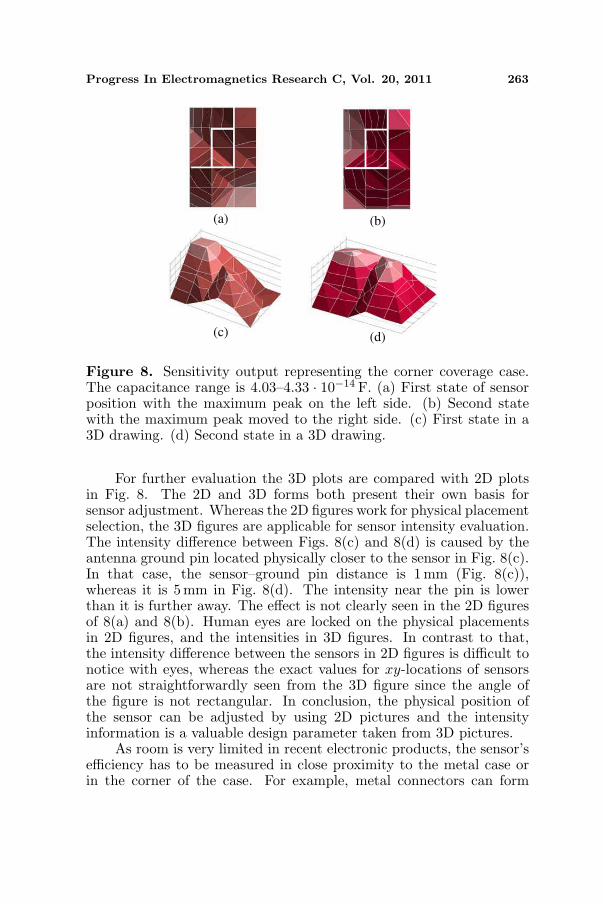
Figure 8. Sensitivity output representing the corner coverage case.The capacitance range is 4.03–4.33 · 10−14 F. (a) First state of sensorposition with the maximum peak on the left side. (b) Second statewith the maximum peak moved to the right side. (c) First state in a3D drawing. (d) Second state in a 3D drawing.
For further evaluation the 3D plots are compared with 2D plotsin Fig. 8. The 2D and 3D forms both present their own basis forsensor adjustment. Whereas the 2D figures work for physical placementselection, the 3D figures are applicable for sensor intensity evaluation.The intensity difference between Figs. 8(c) and 8(d) is caused by theantenna ground pin located physically closer to the sensor in Fig. 8(c).In that case, the sensor–ground pin distance is 1 mm (Fig. 8(c)),whereas it is 5mm in Fig. 8(d). The intensity near the pin is lowerthan it is further away. The effect is not clearly seen in the 2D figuresof 8(a) and 8(b). Human eyes are locked on the physical placementsin 2D figures, and the intensities in 3D figures. In contrast to that,the intensity difference between the sensors in 2D figures is difficult tonotice with eyes, whereas the exact values for xy-locations of sensorsare not straightforwardly seen from the 3D figure since the angle ofthe figure is not rectangular. In conclusion, the physical position ofthe sensor can be adjusted by using 2D pictures and the intensityinformation is a valuable design parameter taken from 3D pictures.
As room is very limited in recent electronic products, the sensor’sefficiency has to be measured in close proximity to the metal case orin the corner of the case. For example, metal connectors can form
264 Myllymaki et al.
(a) (b)
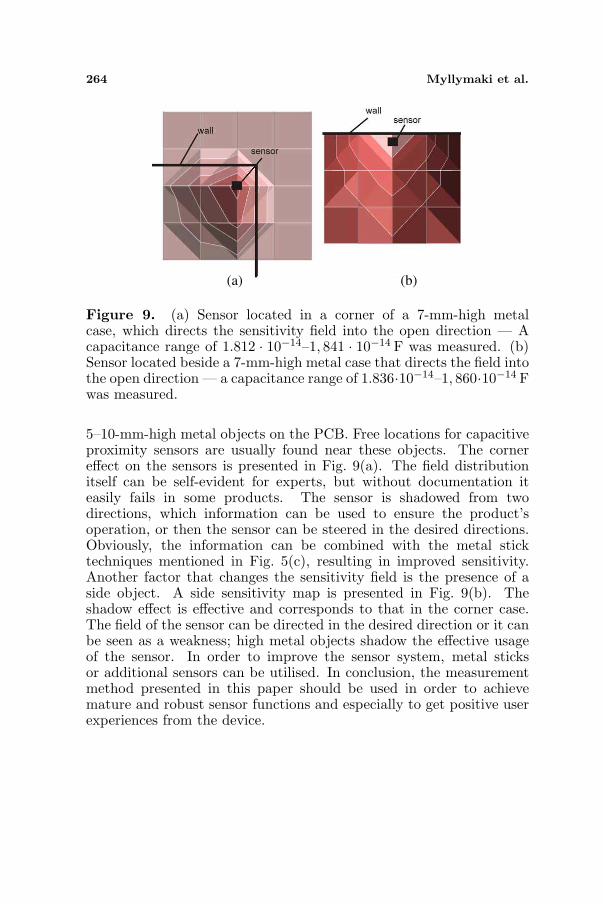
Figure 9. (a) Sensor located in a corner of a 7-mm-high metalcase, which directs the sensitivity field into the open direction — Acapacitance range of 1.812 · 10−14–1, 841 · 10−14 F was measured. (b)Sensor located beside a 7-mm-high metal case that directs the field intothe open direction — a capacitance range of 1.836·10−14–1, 860·10−14 Fwas measured.
5–10-mm-high metal objects on the PCB. Free locations for capacitiveproximity sensors are usually found near these objects. The cornereffect on the sensors is presented in Fig. 9(a). The field distributionitself can be self-evident for experts, but without documentation iteasily fails in some products. The sensor is shadowed from twodirections, which information can be used to ensure the product’soperation, or then the sensor can be steered in the desired directions.Obviously, the information can be combined with the metal sticktechniques mentioned in Fig. 5(c), resulting in improved sensitivity.Another factor that changes the sensitivity field is the presence of aside object. A side sensitivity map is presented in Fig. 9(b). Theshadow effect is effective and corresponds to that in the corner case.The field of the sensor can be directed in the desired direction or it canbe seen as a weakness; high metal objects shadow the effective usageof the sensor. In order to improve the sensor system, metal sticksor additional sensors can be utilised. In conclusion, the measurementmethod presented in this paper should be used in order to achievemature and robust sensor functions and especially to get positive userexperiences from the device.
Progress In Electromagnetics Research C, Vol. 20, 2011 265
4. DISCUSSION
Proximity sensors used as safety products in chainsaws, as robot handsor as seat occupancy sensors in cars have physical sizes of 25 cm2 or30 cm2 to 16µm2 [7–9], having a high size variation caused by differentrealisations. Some are manufactured as large physical electrodes,whereas others are integrated into IC electronics. Large electrodeshave higher natural sensitivity since the area increases their physicalcoverage. Small size and integration limit coverage and sensitivity.The sensitivity measurement method is especially advisable for smallsensors. Furthermore, electronics packages can have various shieldingeffects due to, e.g., bonded wires or metal frames that are used asconnectors or electromagnetic radiation shields. It is recommendedthat final products are tested from the sensor sensitivity point of view,knowing that measurements are quickly arranged with the presentedtest bench system.
In current applications, mobile phone antennas are sensitive tothe proximity of dielectric or conductive material [10–14]. Thischaracteristic and its deteriorating effects on the phone can bedecreased by using sensors and correction methods [15, 18]. Theplacement of sensors is challenging because of limited room andthe hand/finger load varies in terms of direction and intensity.Additionally the antenna causes shielding effects for the sensor.Sensitivity measurements are a key method for achieving reliable sensorusage in this challenging application. Large coverage, sensibility andcheap realisation are benefits that offer a good background for positiveuser experiences in the final product.
Proximity sensor research is going on with electrical-field-formingcomponents [19] and sensor signal processing [20]. The direction ofthese studies supports this research. The efficiency of a single sensorcan be increased by improving materials and optimising structures [19].Different types of sensors, their characteristics such as resolution, rangelimitation, bias, variance, update rate, and environmental changes suchas temperature, scale-factor effects and noise need signal processingand sensor data fusion in order to make the right decisions in terms ofthat information [20]. Various examples of robot applications representthe most challenging environment in the field, since the robots used inreal life, as people know, are surprising and changing all the time [3–6, 8]. Additionally, natural human sensing and sensor data fusion areimitated in a combination of tactile and eye coordination systems [1],which has been under research in [2]. Previous studies are very valuableand they can be complemented by the sensitivity measurement methodpresented in this paper. Improved user experiences (in the case of
266 Myllymaki et al.
handheld devices) can be fulfilled and assured by combining thosesensor studies and methods together.
5. CONCLUSION
This paper presented a method for measuring the sensitivity of acapacitive proximity sensor and an application where the sensor wasused as a proximity detector of a mobile phone antenna. 2D sensordata plots were more exact for tuning of sensor’s physical placementwith human eyes. 3D sensor data plots were more suitable forsensor intensity evaluation, which highlights the differences betweensensors in multiple sensor applications or effects in sensor’s outputdue to shadowing mechanical objects. The designer can get a betterunderstanding of sensor shielding objects from 3D plots than from2D plots. It is clear that the design of sensor applications should bearranged by using them simultaneously.
An antenna proximity sensor was measured and optimised withsensitivity measurements. In the current application the antenna loadcould be detected from both sides and from above the antenna on ascale of 4.03 · 10−14 F to 4.33 · 10−14 F. The cases present all possiblepositions of holding a phone used in either the “calling” or “browsing”mode. The requirements are met with two sensors located on the PCBat opposite ends of the antenna and close to the PCB sides.
This paper, the method and the application emphasise thephysical sensitivity and the electrical fields of the sensor. Thecharacteristics can be further improved by using other sensor types,sensor data fusion and advanced imitation of multisensory spatialinteraction by humans and animals.
REFERENCES
1. Macaluso, E. and J. Driver, “Multisensory spatial interactions: Awindow onto functional integration in the human brain,” Trendsin Neurosciences, Vol. 28, 263–271, 2005.
2. Laschi, C., G. Asuni, E. Guglielmelli, G. Teti, R. Johansson,H. Konosu, Z. Wasik, M. C. Carrozza, and P. Dario, “A bio-inspired predictive sensory-motor coordination scheme for robotreaching and preshaping,” Autonomous Robots, Vol. 25, No. 1–2,85–101, 2008.
3. Yamada, Y., T. Morizono, and Y. Umetani, “Highly softviscoelastic robot skin with a contact object-location-sensingcapability,” IEEE Trans. Ind. Electron., Vol. 52, No. 4, 960–968,Aug. 2005.
Progress In Electromagnetics Research C, Vol. 20, 2011 267
4. Ohashi, E., T. Aiko, T. Tsuji, H. Nishi, and K. Ohnishi, “Collisionavoidance method of humanoid robot with arm force,” IEEETrans. Ind. Electron., Vol. 54, No. 3, 1632–1641, Jun. 2007.
5. Tsuji, T., K. Ohnishi, and A. Sabanovic, “A controller designmethod based on functionality,” IEEE Trans. Ind. Electron.,Vol. 54, No. 6, 3335–3343, Dec. 2007.
6. Iwata, H. and S. Sugano, “Human-robot-contact-state identifica-tion based on tactile recognition,” IEEE Trans. Ind. Electron.,Vol. 52, No. 6, 1468–1477, Dec. 2005.
7. Norgia, M. and C. Svelto, “RF-capacitive proximity sensor forsafety applications,” IEEE International Instrumentation andMeasurement Technology Conference, 1–4, May 2007.
8. Lee, H.-K., S.-I. Chang, and E. Yoon, “Dual-mode capacitiveproximity sensor for robot application: Implementation of tactileand proximity sensing capability on a single polymer platformusing shared electrodes,” IEEE Sensors Journal, Vol. 9, No. 12,1748–1755, Dec. 2009.
9. George, B., H. Zangl, T. Bretterklieber, and G. Brasseur,“A combined inductive-capacitive proximity sensor and itsapplication to seat occupancy sensing,” IEEE InternationalInstrumentation and Measurement Technology Conference, 13–17,May 2009.
10. Pelosi, M., O. Franek, M. B. Knudsen, M. Christensen, andG. F. Pedersen, “A grip study for talk and data modes in mobilephones,” IEEE Transactions on Antennas and Propagation,Vol. 57, No. 4, 856–865, Apr. 2009.
11. Krogerus, J., J. Toivanen, C. Icheln, and P. Vainikainen, “Effectof the human body on total radiated power and the 3-Dradiation element of mobile handsets,” IEEE Transactions onInstrumentation and Measurement, Vol. 56, 2375–2385, Dec. 2007.
12. Berg, M., M. Sonkki, and E. Salonen, “Experimental study ofhand and head effects to mobile antenna radiation properties,”Proc. 3rd Eur. Conf. on Antennas and Propagation, 437–440,Berlin, Germany, Mar. 23–27, 2009.
13. Li, C.-H., E. Ofli, N. Chavannes, E. Cherubini, H. U. Gerber, andN. Kuster, “Effects of hand phantom and different use elementson mobile phone antenna radiation performance,” IEEE Antennasand Propagation Society International Symposium, 1–4, Jul. 2008.
14. Ofli, E., C.-H. Li, N. Chavannes, and N. Custer, “Analysis andoptimization of mobile phone antenna radiation performance inthe presence of head and hand phantoms,” Turk. J. Elec. Engin.,Vol. 16, No. 1, 67–77, 2008.
268 Myllymaki et al.
15. Ranta, T. and R. Novak, “Antenna tuning approach aids cellularhandsets,” Microwaves & RF, 82–92, Nov. 2008.
16. Komulainen, M., M. Berg, H. Jantunen, E. T. Salonen, andC. Free, “A frequency tuning method for a planar inverted-F antenna,” IEEE Transactions on Antennas and Propagation,Vol. 56, 944–950, 2008.
17. Myllymaki, S., A. Huttunen, M. Berg, M. Komulainen, andH. Jantunen, “Method for measuring user-induced load on mobileterminal antenna,” Electronics Letters, Vol. 45, No. 21, 1065–1066,Oct. 2009.
18. Myllymaki, S., A. Huttunen, V. K. Palukuru, H. Jantunen,M. Berg, and E. T. Salonen, “Capacitive recognition of theuser‘s hand grip position in mobile handsets,” Progress InElectromagnetics Research B, Vol. 22, 203–220, 2010.
19. Abu-Abed, A. S. and R. G. Lindquist, “Capacitive interdigitalsensor with inhomogeneous nematic liquid crystal film,” ProgressIn Electromagnetics Research B, Vol. 7, 75–87, 2008.
20. Garcıa, J. G., J. G. Ortega, A. S. Garcıa, and S. S. Martınez,“Robotic software architecture for multisensor fusion system,”IEEE Trans. Ind. Electron., Vol. 56, No. 3, 2009.
Related Documents