Measurement for Improvement

Measurement for Improvement. Hello & Welcome: what are you here for?
Dec 23, 2015
Welcome message from author
This document is posted to help you gain knowledge. Please leave a comment to let me know what you think about it! Share it to your friends and learn new things together.
Transcript

Measurement for Improvement
Hello & Welcome:
what are you here for?
Results of our pre-session survey…1. I would describe myself as (tick one only):• Early Years Practitioner but measurement beginner• Tester (already collecting data on measures developed by others)• Person involved in developing local measures• Measurement advisor who provides support to improvement teams• Other (please specify)
2. I feel comfortable with (tick all that apply):• Testing• Data collection when I am told what to count• Developing measures• Using Excel spreadsheets• Run charts• Statistical Process Control (SPC) charts• Other (please specify)
Results of our pre-session survey…3. I am most interested to learn about (tick one only):• Testing• Data collection when I am told what to count• Developing measures• Using excel spreadsheets• Run charts• Statistical Process Control (SPC) charts• Something Else / In Addition (please specify)
4. Are there any triumphs/challenges you would be willing and interested to mention in the session?
• No• Yes (please feel free to provide your name if you would like to share)

Results of our pre-session survey…5. Are you a member of the EYC Extranet• Yes• No• Don't know
6. Which of the following mostly fits with what you do? (tick one only)• I set up measures, enter data and produce leadership reports on the Extranet• I enter data on the Extranet once the measure has been set up• I collect data in a spreadsheet and give it to someone else to put on the Extranet• I collect data in a spreadsheet and give it to someone else but don't know what they do with
it• I only collect data in a spreadsheet locally• I only collect data locally only in some other format• I have not been involved in collecting any data• Other
Turn to your neighbour• What have been your biggest learnings or
challenges regarding data gathering and measurement for your Early Years work?– Developing measures– Agreeing definitions– Collecting data (who, when, frequency)– Analysis– Reporting/presenting data– Other?

The Improvement Guide, API
The PDSA cycle provides the tactical approach to work
10
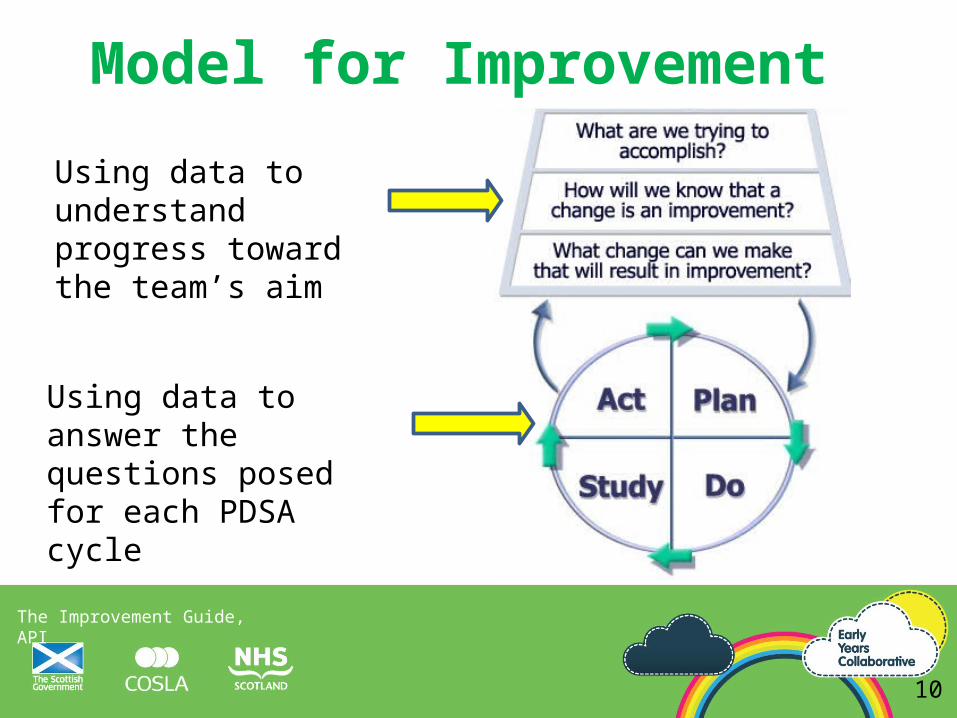
Model for Improvement
The three questions provide the strategy Our focus today
The Improvement Guide, API
Using data to understand progress toward the team’s aim
Using data to answer the questions posed for each PDSA cycle
10
Model for Improvement

Andreas Schleicher
Without data, you are just another person with an opinion
11
With data, it’s hard not to have an opinion
… it’s a pivot point for conversation
12

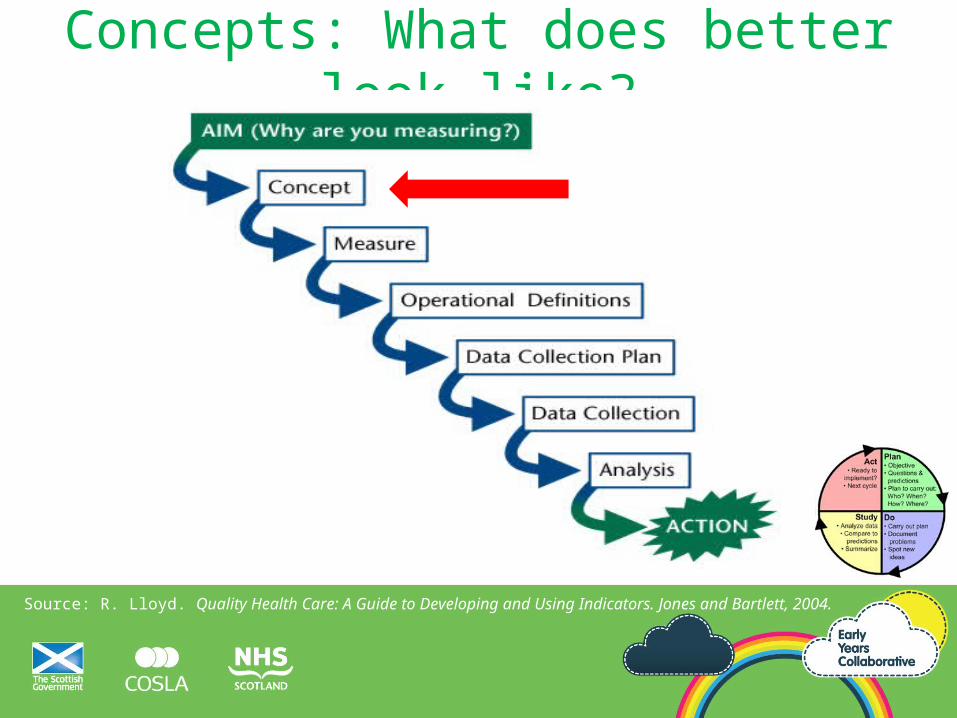
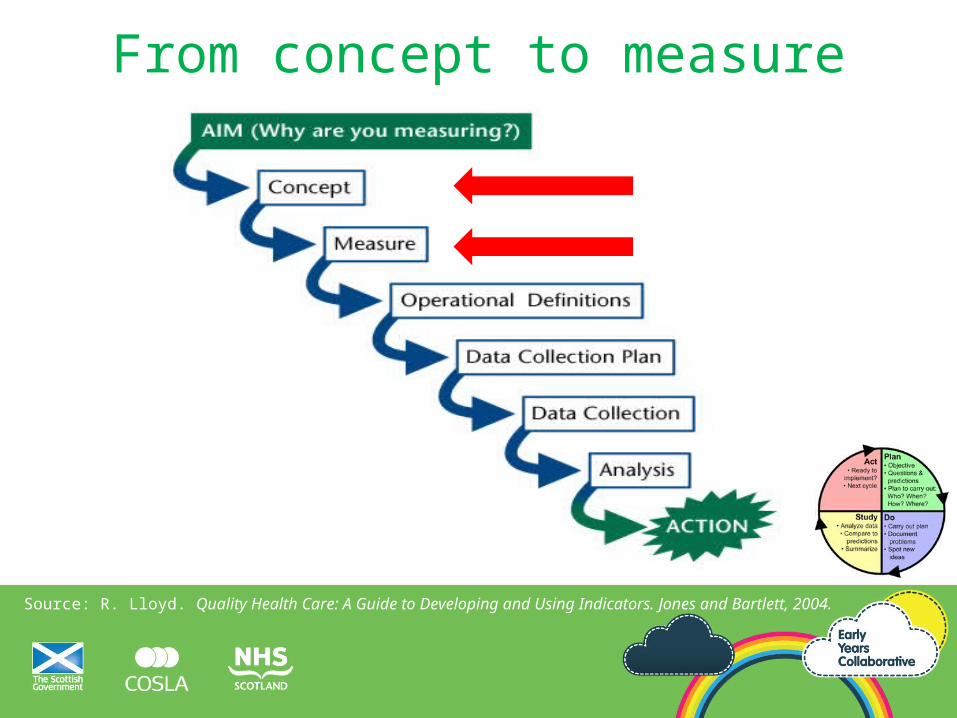
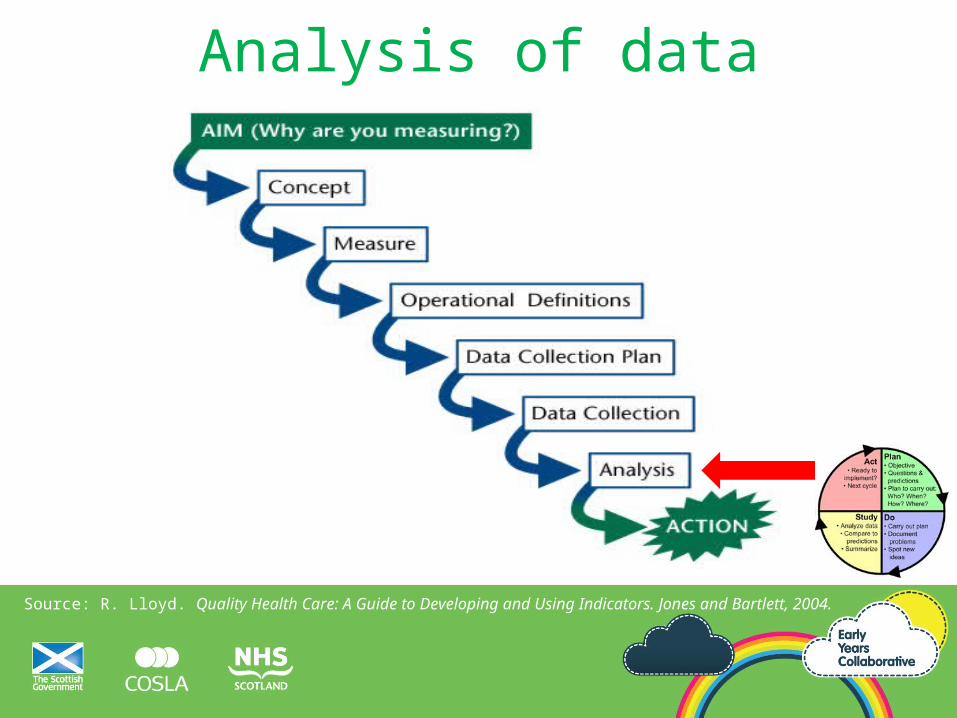
The Quality Measurement Journey
Source: R. Lloyd. Quality Health Care: A Guide to Developing and Using Indicators. Jones and Bartlett, 2004.
(How good? By when?)
PDSA

Case Study• Promoting Bedtime Reading• Lochrin and Grassmarket Nursery Schools• Edinburgh• Lead: Donna Murray

The Quality Measurement Journey
Source: R. Lloyd. Quality Health Care: A Guide to Developing and Using Indicators. Jones and Bartlett, 2004.
(How good? By when?)
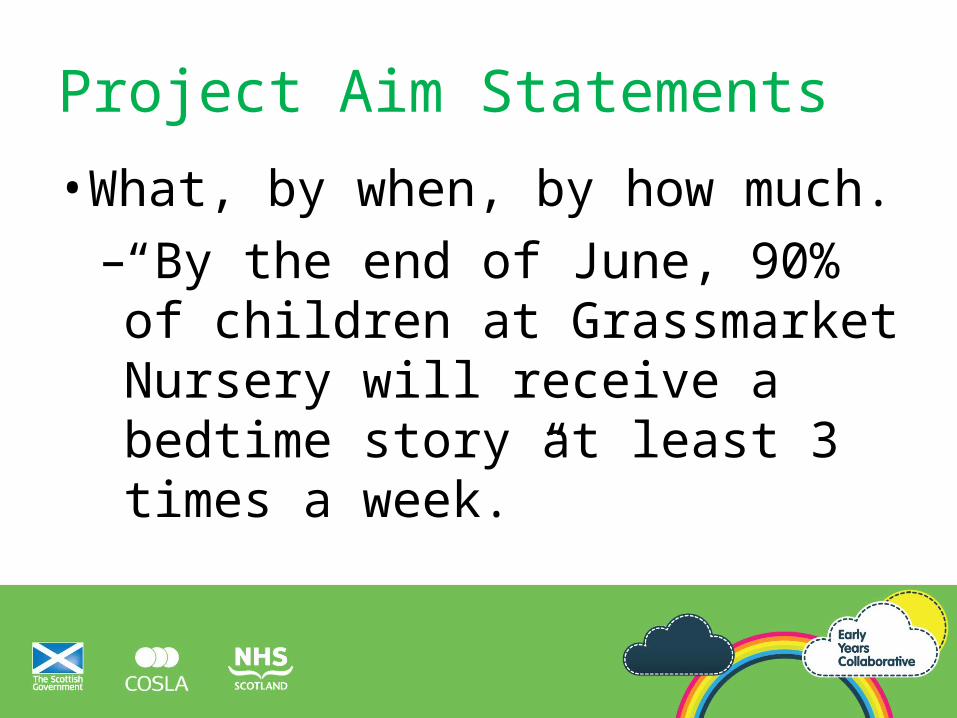
Project Aim Statements
• What, by when, by how much.–“By the end of June, 90% of
children at Grassmarket Nursery will receive a bedtime story at least 3 times a week.”
Source: R. Lloyd. Quality Health Care: A Guide to Developing and Using Indicators. Jones and Bartlett, 2004.
Concepts: What does better look like?
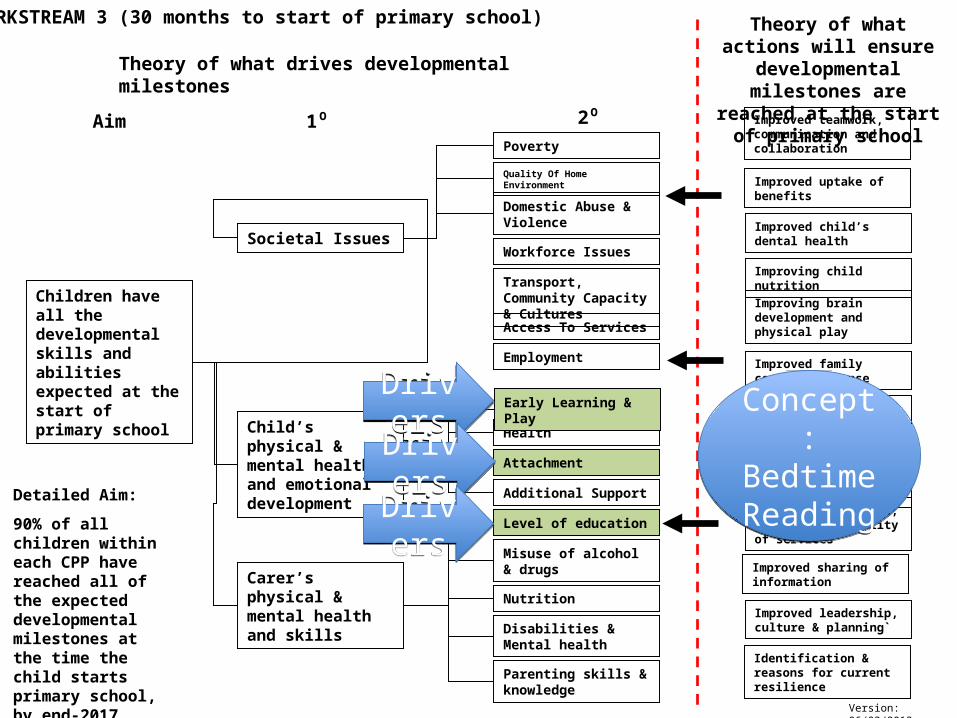
Children have all the developmental skills and abilities expected at the start of primary school
Societal Issues
Child’s physical & mental health and emotional development
Improved sharing of information
Improved management, planning and quality of services
Improved joint working
Improved identification
Detailed Aim:
90% of all children within each CPP have reached all of the expected developmental milestones at the time the child starts primary school, by end-2017
Health
Improved child’s dental health
Improving child nutrition
Attachment
Improved stability / permanence for LAC
Improved uptake of benefits
Improved family centred response
Improved leadership, culture & planning`
Improved teamwork, communication and collaboration
Improving brain development and physical play
Early Learning & Play
WORKSTREAM 3 (30 months to start of primary school)
Identification & reasons for current resilience
Aim 1⁰ 2⁰
Theory of what drives developmental milestones
Theory of what actions will ensure developmental
milestones are reached at the start of primary school
Poverty
Quality Of Home Environment
Domestic Abuse & Violence
Workforce Issues
Transport, Community Capacity & Cultures
Access To Services
Employment
Carer’s physical & mental health and skills
Level of education
Misuse of alcohol & drugs
Nutrition
Disabilities & Mental health
Parenting skills & knowledge
Additional Support
Version: 06/03/2013
DriversDrivers
DriversDrivers
DriversDrivers
Concept:Bedtime Reading
Concept:Bedtime Reading
Source: R. Lloyd. Quality Health Care: A Guide to Developing and Using Indicators. Jones and Bartlett, 2004.
From concept to measure

Children have all the developmental skills and abilities expected at the start of primary school
Societal Issues
Child’s physical & mental health and emotional development
Improved sharing of information
Improved management, planning and quality of services
Improved joint working
Improved identification
Detailed Aim:
90% of all children within each CPP have reached all of the expected developmental milestones at the time the child starts primary school, by end-2017
Health
Improved child’s dental health
Improving child nutrition
Attachment
Improved stability / permanence for LAC
Improved uptake of benefits
Improved family centred response
Improved leadership, culture & planning`
Improved teamwork, communication and collaboration
Improving brain development and physical play
Early Learning & Play
Identification & reasons for current resilience
Aim 1⁰ 2⁰Poverty
Quality Of Home Environment
Domestic Abuse & Violence
Workforce Issues
Transport, Community Capacity & Cultures
Access To Services
Employment
Carer’s physical & mental health and skills
Level of education
Misuse of alcohol & drugs
Nutrition
Disabilities & Mental health
Parenting skills & knowledge
Additional Support
Version: 06/03/2013
DriversDrivers
DriversDrivers
DriversDrivers
Concept:Bedtime Reading
Concept:Bedtime Reading
These driver diagrams show lots of concepts,
but few measures (numbers, %, rate)
From concept to measure: not trivial

Our example: concept to measure• (Driver) Concept is ‘Bedtime reading’• Measures to provide feedback on the concept
– % receiving a story– % of stories read at bedtime– % of parents reporting improved bedtime routine– % enjoying the bedtime story– % reporting increase in bedtime story reading
Source: R. Lloyd. Quality Health Care: A Guide to Developing and Using Indicators. Jones and Bartlett, 2004.
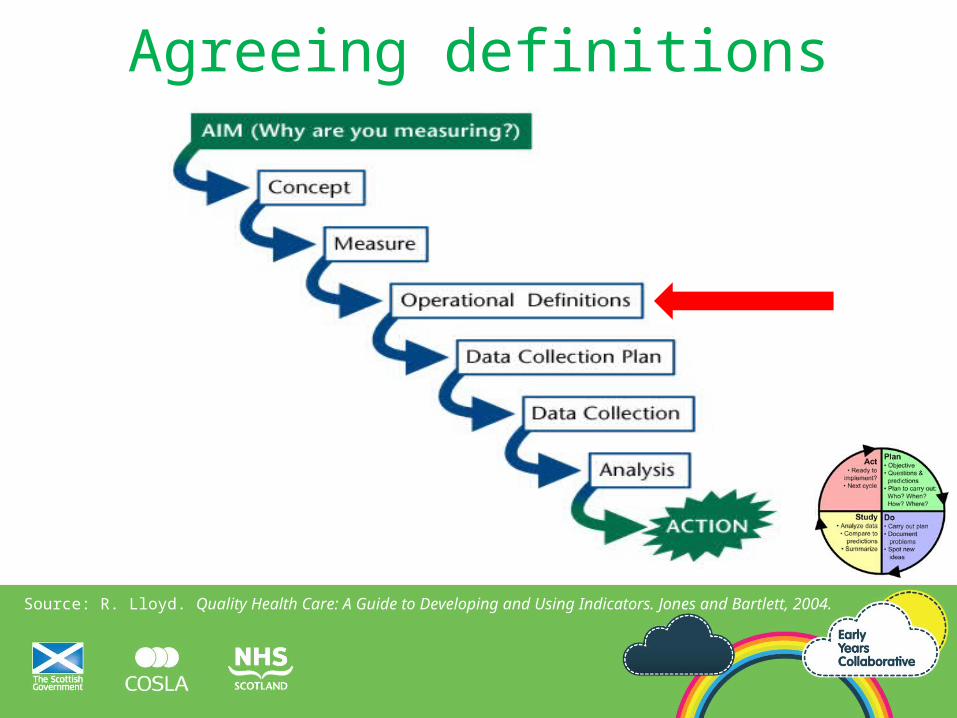
Agreeing definitions

An operational definition…… is a description, in quantifiable terms, of what to measure and the steps to measure itconsistently
• Gives communicable meaning to a concept
• Is clear & unambiguous
• Specifies measurement methods & equipment
• Identifies agreed criteria for recognition
© 2010 Institute for Healthcare Improvement/ R Lloyd21

• Method of measurement?
• Criteria for recognition?
22
An operational definition…
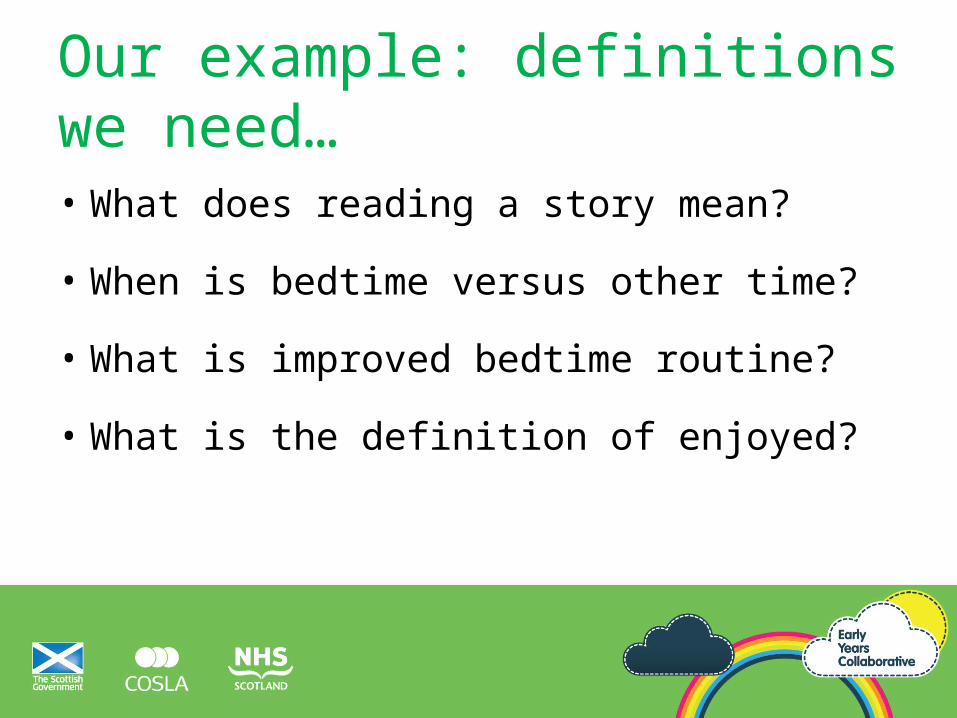
Our example: definitions we need…
• What does reading a story mean?
• When is bedtime versus other time?
• What is improved bedtime routine?
• What is the definition of enjoyed?
Source: R. Lloyd. Quality Health Care: A Guide to Developing and Using Indicators. Jones and Bartlett, 2004.
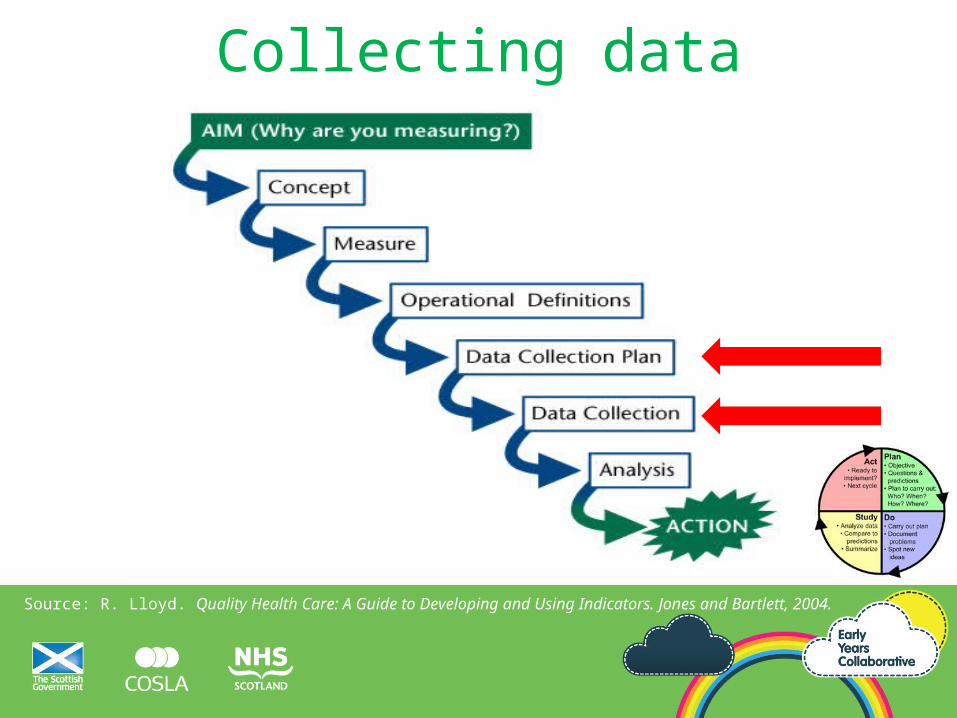
Collecting data

• Who will collect the data?
• How often?
• How?
• Stratification?
• Will sampling be required?
Planning data collection
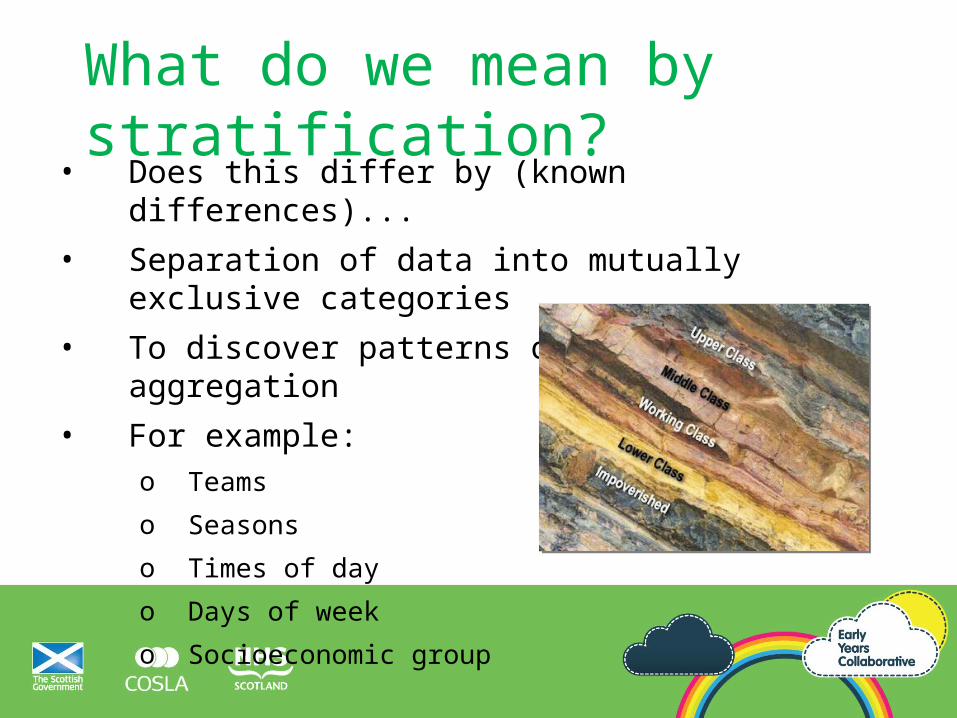
What do we mean by stratification?
• Does this differ by (known differences)...
• Separation of data into mutually exclusive categories
• To discover patterns obscured by aggregation
• For example:o Teams
o Seasons
o Times of day
o Days of week
o Socioeconomic group
Sampling:
how many, how often?

Balance ease of collection
with
reduction in random variation

Data in PDSA cycles• Collect useful data not perfect data (learning not
evaluation)
• Use pencil/ paper until info system is ready
• Use sampling to reduce workload of data collection
• Use qualitative data (feedback) rather than wait for quantitative data
• Record what went wrong during data collection
Integrate data into the day• Collect data within current work
• Develop easy-use forms/information systems for practitioners
• Clearly define roles and responsibilities for data collection
• Set aside time to review data with those who collect it

So for our example…• All children are included, no sampling. 7 days a week.
• Donna will inquire with each parent at drop off Monday through Friday.
• Data will be captured on a paper form.
• Donna inputs daily data into spreadsheet following drop off.
Source: R. Lloyd. Quality Health Care: A Guide to Developing and Using Indicators. Jones and Bartlett, 2004.
Analysis of data
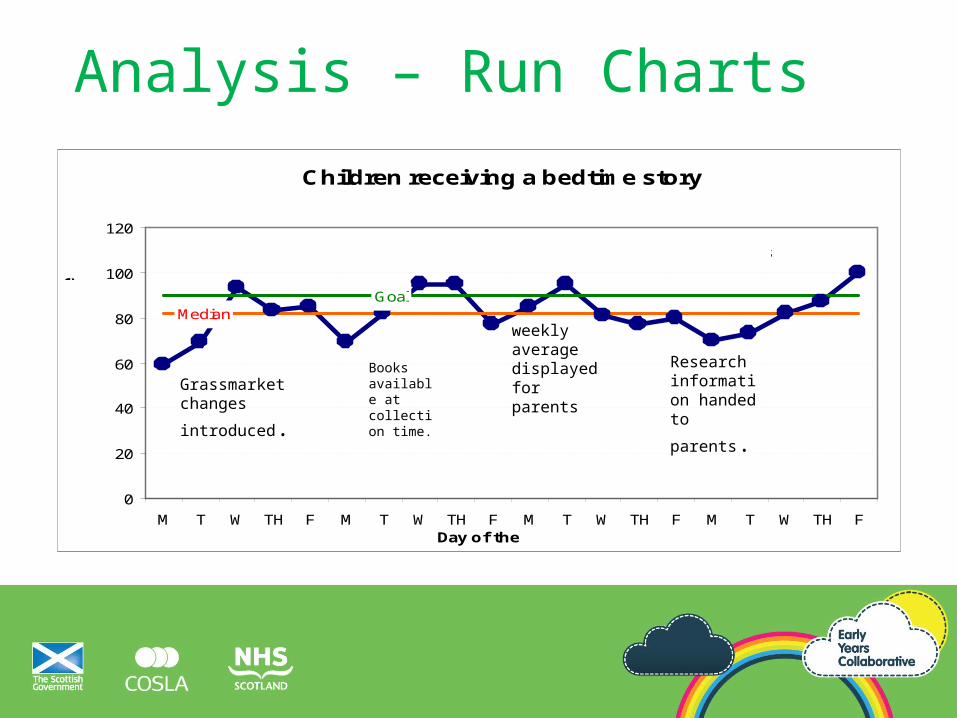
Analysis – Run Charts
Children receiving a bedtime story
MedianGoal
0
20
40
60
80
100
120
M T W TH F M T W TH F M T W TH F M T W TH FDay of the week
Perc
en
tag
e
of
ch
ild
ren
.
Parents survey
Grassmarket changes
introduced.
Books available at collection time.
Research information handed to
parents.
weekly average displayed for parents

The Quality Measurement Journey
Source: R. Lloyd. Quality Health Care: A Guide to Developing and Using Indicators. Jones and Bartlett, 2004.
(How good? By when?)
PDSA
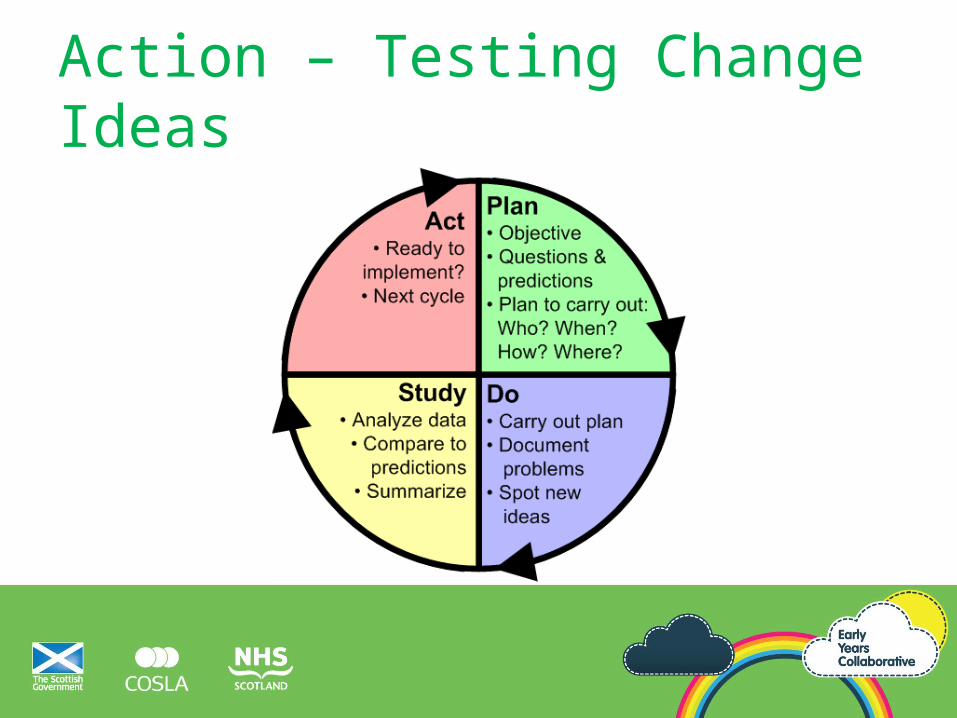
Action – Testing Change Ideas
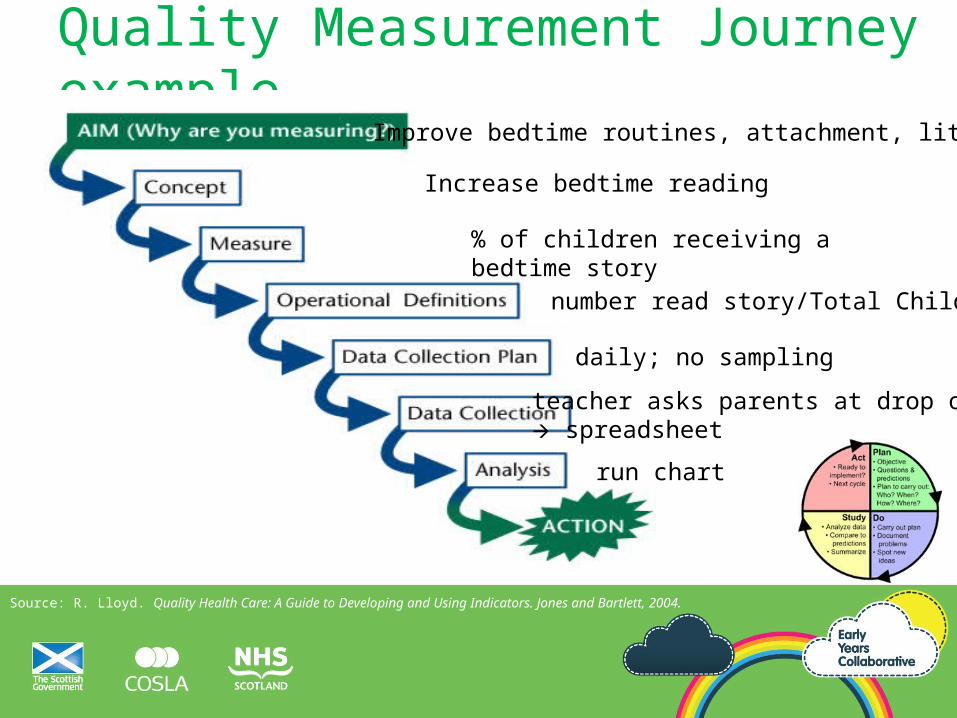
Quality Measurement Journey example
Source: R. Lloyd. Quality Health Care: A Guide to Developing and Using Indicators. Jones and Bartlett, 2004.
Improve bedtime routines, attachment, literacy
Increase bedtime reading
% of children receiving a bedtime story
number read story/Total Children
daily; no sampling
teacher asks parents at drop off, spreadsheet
run chart
QUESTIONS?

Let’s build a run chart
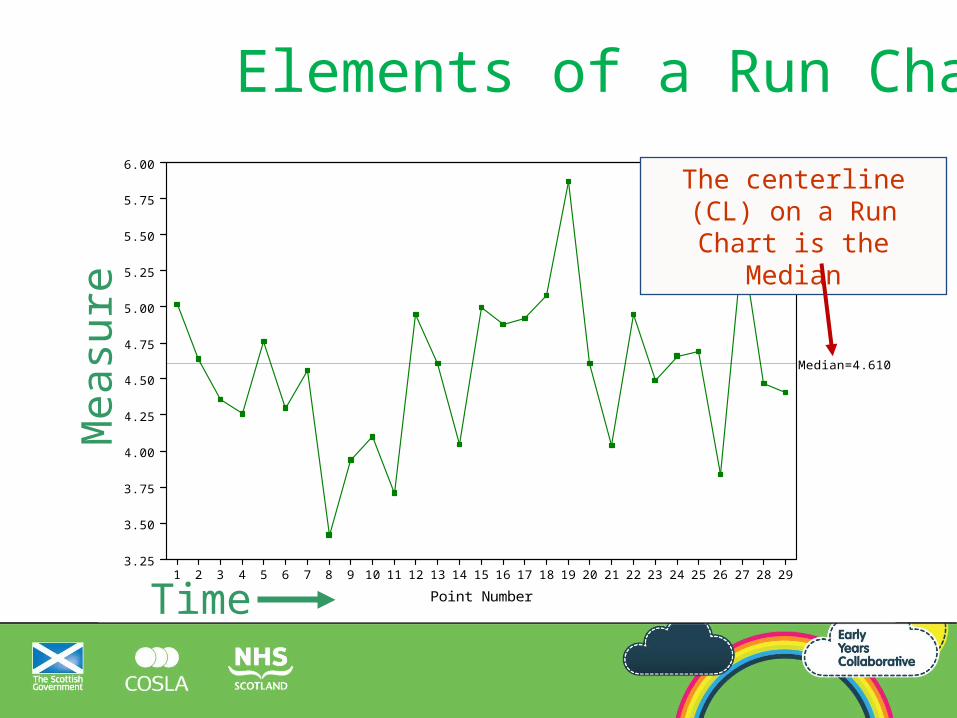
1 2 3 4 5 6 7 8 9 10 11 12 13 14 15 16 17 18 19 20 21 22 23 24 25 26 27 28 29
Point Number
Po
un
ds
of R
ed
Ba
g W
ast
e
3.25
3.50
3.75
4.00
4.25
4.50
4.75
5.00
5.25
5.50
5.75
6.00
Median=4.610
Mea
sure
Time
The centerline (CL) on a Run Chart is the Median
Elements of a Run Chart

Let’s build a run chart
Month% of children attending Nursery
13-Jan-2013 17%13-Feb-2013 15%13-Mar-2013 9%13-Apr-2013 23%13-May-2013 11%13-Jun-2013 12%13-Jul-2013 23%13-Aug-2013 49%13-Sep-2013 43%13-Oct-2013 78%13-Nov-2013 70%13-Dec-2013 55%13-Jan-2014 75%13-Feb-2014 72%13-Mar-2014 60%13-Apr-2014 55%13-May-2014 62%13-Jun-2014 78%
Let’s build a run chart in Excel.
Related Documents