MEASUREMENTS AND INSTRUMENTATION LABORATORY –131353

Welcome message from author
This document is posted to help you gain knowledge. Please leave a comment to let me know what you think about it! Share it to your friends and learn new things together.
Transcript

MEASUREMENTS AND INSTRUMENTATION LABORATORY –131353

LIST OF EXPERIMENTS
S.NO TITLE PAGE NO
1MEASUREMENT OF RESISTANCE USING
WHEATSTONE BRIDGE2 MEASUREMENT OF RESISTANCE USING
KELVIN’S DOUBLE BRIDGE.3 MEASUREMENT OF CAPACITANCE USING
SCHERING BRIDGE.4 MEASUREMENT OF INDUCTANCE USING
MAXWELLS BRIDGE.5 CALIBRATION OF 1 ENERGYMETER.
6 MEASUREMENT OF 3 PHASE POWER AND POWER FACTOR
7 INSTRUMENTATION AMPLIFIER.
8 STUDY OF DISPLACEMENT TRANSDUCER - LVDT
9 STUDY OF PRESSURE TRANSDUCER
10 A/D CONVERTER
11 D/A CONVERTER
12 STUDY OF TRANSIENTS
13 CALIBRATION OF CURRENT TRANSFORMER
14 MEASUREMENT OF IRON LOSS (MAXWELL BRIDGE)

EXPT. NO. 1 MEASUREMENT OF RESISTANCE USING WHEATSTONE BRIDGE
AIM:
To measure the given medium resistance using Wheatstone bridge.
OBJECTIVE:
To study the working of bridge under balanced and unbalanced condition and to
study the sensitivity of bridge.
APPARATUS REQUIRED:
SL.NO
NAME OF THE APPRATUS
RANGE TYPE QTY
1234
Wheat stone Bridge kitUnknown resistanceMultimeterConnecting Wires.
CIRCUIT DIAGRAM:
THEORY:
FORMULAE USED:
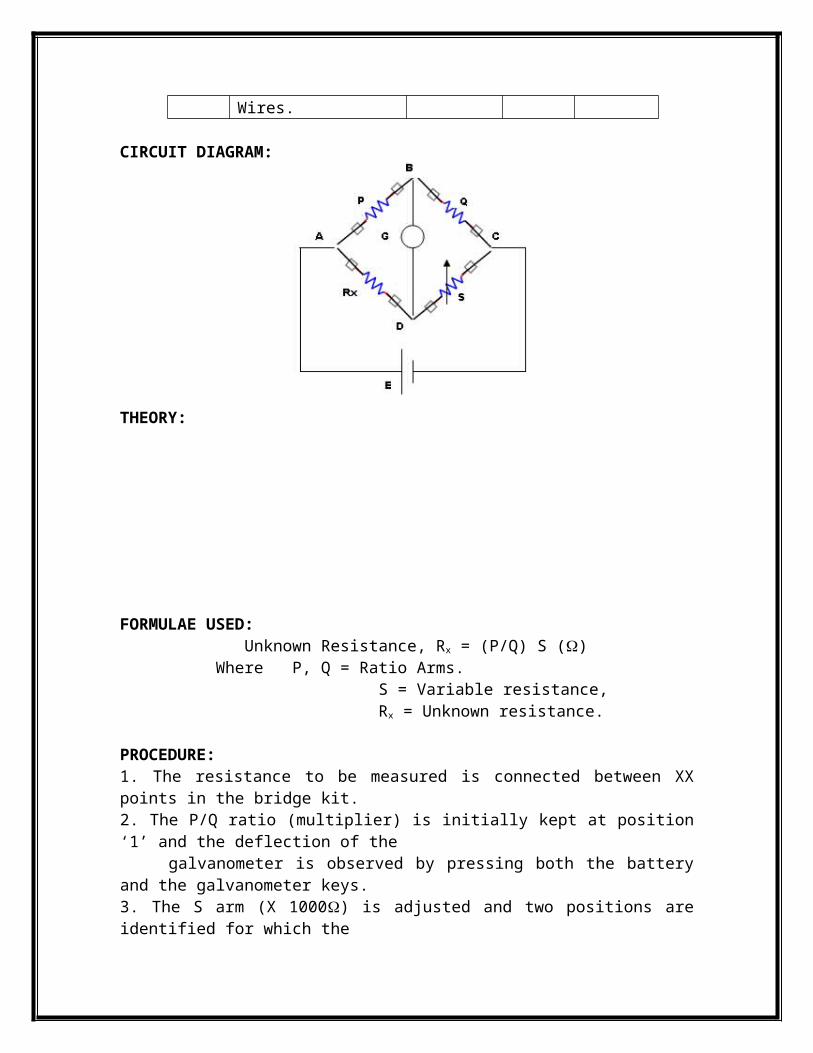
Unknown Resistance, Rx = (P/Q) S ()Where P, Q = Ratio Arms.
S = Variable resistance, Rx = Unknown resistance.
PROCEDURE:1. The resistance to be measured is connected between XX points in the bridge kit.2. The P/Q ratio (multiplier) is initially kept at position ‘1’ and the deflection of the galvanometer is observed by pressing both the battery and the galvanometer keys.3. The S arm (X 1000) is adjusted and two positions are identified for which the deflection of the galvanometer is on either side of the null point and kept at the lowest value of S. Then the x100, x10, x1 knobs of S are adjusted to get null deflection. If necessary the sensitivity knob may be adjusted to get appreciable deflection. [If not possible P/Q ratio is kept at any other suitable value ie, any one of ratios provided.]4. The value of unknown resistance is read. (S value)5. Steps 3 and 4 are repeated for some other P/Q ratio. The mean value is taken.6. The experiment is repeated with other samples provided.
NOTE: The above experiment may be used for measuring resistance of the samples less than 1 to greater than 10k with lesser sensitivity.
TABULAR COLUMN:
S.NO SAMPLE P/Q RATIO(MULTIPLIER)
S VALUE ()
UNKNOWNRESISTANCE RX ()
CALCULATION:
RESULT:
EXPT. NO. 2 MEASUREMENT OF RESISTANCE USING KELVIN’S DOUBLE BRIDGE

AIM:
To measure the given low resistance using Kelvin’s double bridge method.
OBJECTIVE:
To study the working of bridge under balanced and unbalanced condition and to
study the sensitivity of bridge.
APPARATUS REQUIRED:
SL.NO
NAME OF THE APPRATUS
RANGE TYPE QTY
1234
Kelvin Double bridge kit Unknown resistanceMultimeterConnecting Wires
CIRCUIT DIAGRAM:
THEORY:
FORMULA USED: Rx = (P/Q) S ohms Where P, Q first set of ratio arms. p, q Second set of ratio arms. S Standard resistance, Rx unknown resistance.
PROCEDURE:
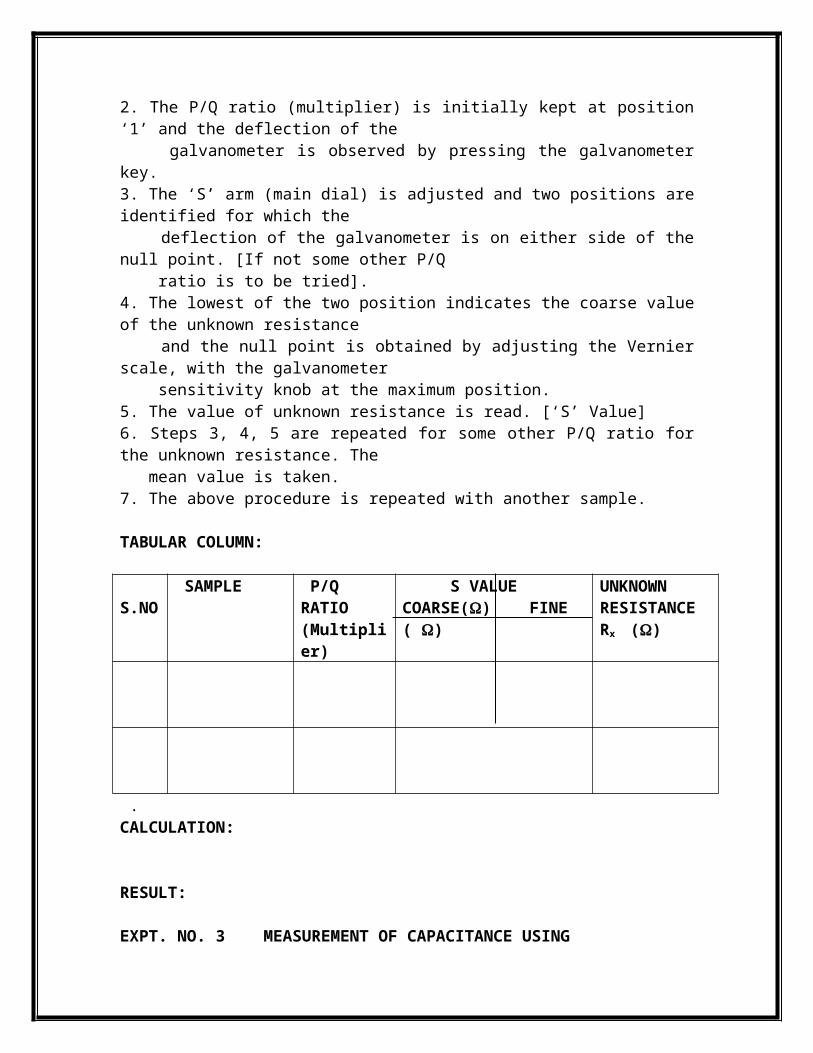
1. The resistance to be measured is connected such that the leads from +C and + P are connected to one end and those from –C and –P are connected to the other end in the kit.2. The P/Q ratio (multiplier) is initially kept at position ‘1’ and the deflection of the galvanometer is observed by pressing the galvanometer key.3. The ‘S’ arm (main dial) is adjusted and two positions are identified for which the deflection of the galvanometer is on either side of the null point. [If not some other P/Q ratio is to be tried].4. The lowest of the two position indicates the coarse value of the unknown resistance and the null point is obtained by adjusting the Vernier scale, with the galvanometer sensitivity knob at the maximum position.5. The value of unknown resistance is read. [‘S’ Value]6. Steps 3, 4, 5 are repeated for some other P/Q ratio for the unknown resistance. The mean value is taken.7. The above procedure is repeated with another sample.
TABULAR COLUMN:
S.NO
SAMPLE P/Q RATIO(Multiplier)
S VALUECOARSE() FINE ( )
UNKNOWN RESISTANCERx ()
.CALCULATION:
RESULT: EXPT. NO. 3 MEASUREMENT OF CAPACITANCE USING

SCHERING BRIDGE
AIM:
To measure the unknown capacitance using Schering bridge.
OBJECTIVE:
To measure the unknown capacitance and to study about dissipation factor.
APPARATUS REQUIRED:
SL.NO
NAME OF THE APPRATUS
RANGE TYPE QTY
12345
Schering Bridge kit Unknown capacitanceMultimeterConnecting WiresCRO
CIRCUIT DIAGRAM:
THEORY:

FORMULA USED:
1. Unknown capacitance, Cx = (R1/R2) C3,Where C3 is known capacitance in µF
R2 is Non-Inductive Variable Resistor 2. Dissipation factor, D = ω R1 C1 = ω Rx Cx
PROCEDURE:
1. The oscillator AB and the bridge AB terminals are connected.2. From the CD terminals of the bridge, the detector (loudspeaker) is connected
through an imbalance amplifier.3. Connections of the bridge arm are made as per the circuit diagram.4. The value of R2 is selected arbitrarily (say1K) and R1 is kept at maximum
position.5. The kit is switched on and R1 is decreased until the null point is observed as a dip
in the sound from the loudspeaker.6. The capacitor C1 can be varied for fine balance adjustment.7. When the balance condition is reached, the trainer kit is switched OFF and the
value R1 is measured using a multimeter.8. The value of unknown capacitance and dissipation factor is calculated.9. The experiment is repeated for various samples provided.
TABULAR COLUMN:
S.NO SAMPLE R2 () R1 () UNKNOWN CAPACITANCE Cx (µF)
CALCULATION:
RESULT:
EXPT. NO. 4 MEASUREMENT OF INDUCTANCE USING

MAXWELLS BRIDGE
AIM:To find the unknown inductance and Q factor of a given coil.
OBJECTIVE:To find the unknown inductance of the given coil using bridge circuit and to study that Maxwell inductance- capacitance bridge is suitable for the measurement of low Q coils.
APPARATUS REQUIRED:
SL.NO
NAME OF THE APPRATUS
RANGE TYPE QTY
1
23456
Maxwell’s inductance Capacitance Bridge kit Unknown InductanceMultimeterConnecting WiresCROBridge oscillator 1 kHZ
CIRCUIT DIAGRAM:
THEORY:
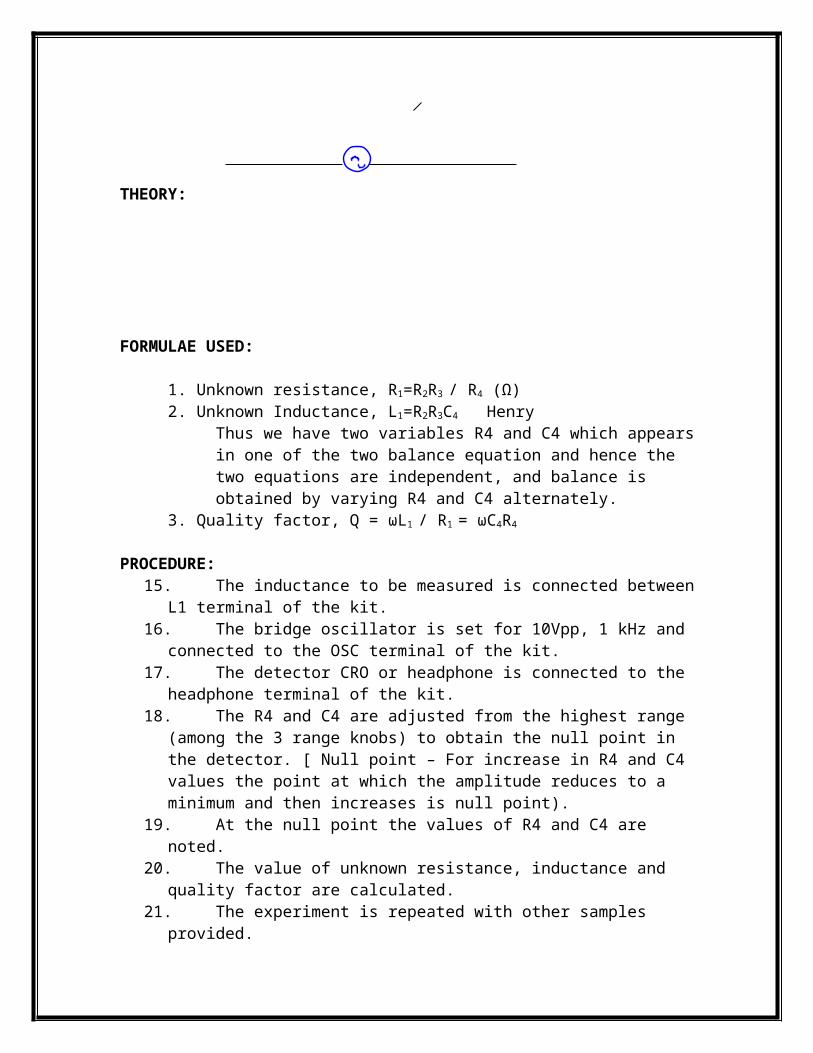
FORMULAE USED:
R3L1
R1
R2R4
C4D

1. Unknown resistance, R1=R2R3 / R4 (Ω)2. Unknown Inductance, L1=R2R3C4 Henry
Thus we have two variables R4 and C4 which appears in one of the two balance equation and hence the two equations are independent, and balance is obtained by varying R4 and C4 alternately.
3. Quality factor, Q = ωL1 / R1 = ωC4R4
PROCEDURE:1. The inductance to be measured is connected between L1 terminal of the kit.2. The bridge oscillator is set for 10Vpp, 1 kHz and connected to the OSC terminal
of the kit.3. The detector CRO or headphone is connected to the headphone terminal of the kit.4. The R4 and C4 are adjusted from the highest range (among the 3 range knobs) to
obtain the null point in the detector. [ Null point – For increase in R4 and C4 values the point at which the amplitude reduces to a minimum and then increases is null point).
5. At the null point the values of R4 and C4 are noted.6. The value of unknown resistance, inductance and quality factor are calculated.7. The experiment is repeated with other samples provided.
TABULAR COLUMN:
S.NO SAMPLE R4(Ω) C4 (F) UNKNOWN INDUCTANCE(H)
CALCULATION:
RESULT:
EXPT. NO. 5 CALIBRATION OF SINGLE PHASE ENERGYMETER
AIM:
To calibrate the given single phase energy meter at unity and other power factors

OBJECTIVE:
1. To study the working of energy meter.
2. To accurately calibrate the meter at unity and other power factor.
3. To study the % of error for the given energy meter.
APPARATUS REQUIRED:
SL.NO
NAME OF THE APPRATUS
RANGE TYPE QTY
123456
Energy meterWattmeterAmmeter VoltmeterStop watchConnecting Wires
CIRCUIT DIAGRAM:
NAME PLATE DETAILS:
RATED CURRENT
RATED VOLTAGE
FREQUENCY
REVOLUTIONS/KWH

THEORY:
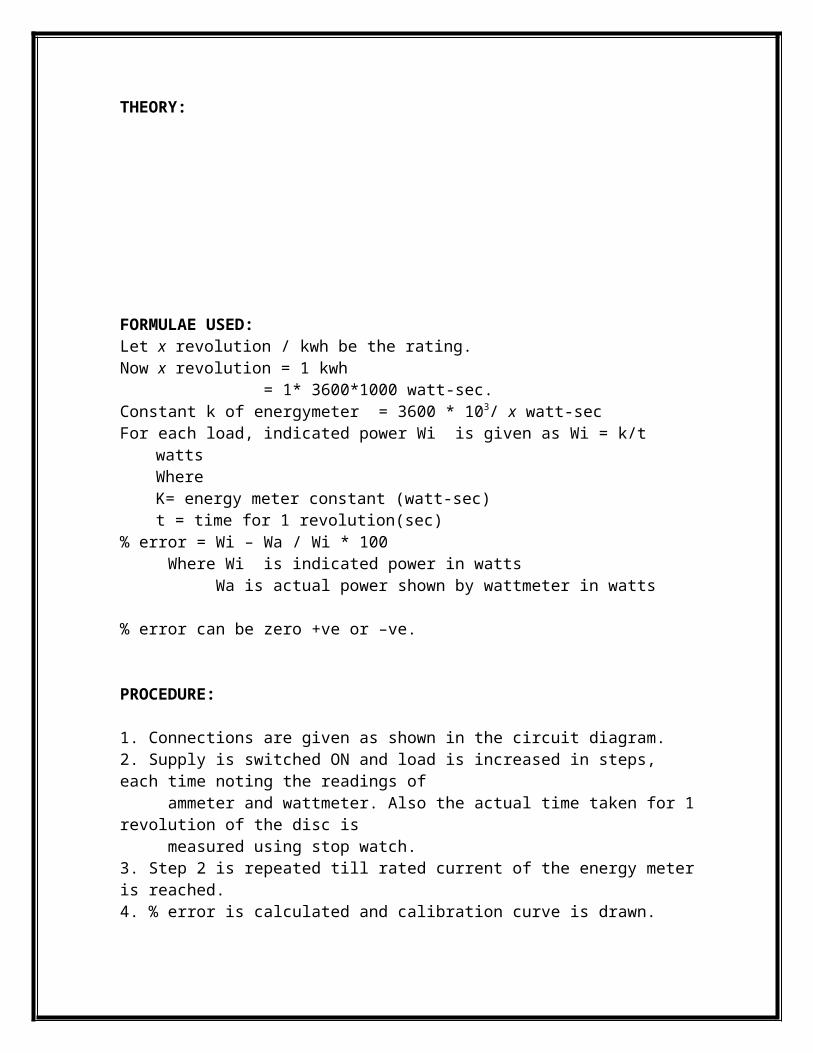
FORMULAE USED: Let x revolution / kwh be the rating.Now x revolution = 1 kwh
= 1* 3600*1000 watt-sec.Constant k of energymeter = 3600 * 103/ x watt-secFor each load, indicated power Wi is given as Wi = k/t watts
WhereK= energy meter constant (watt-sec)t = time for 1 revolution(sec)
% error = Wi – Wa / Wi * 100Where Wi is indicated power in watts
Wa is actual power shown by wattmeter in watts
% error can be zero +ve or –ve.
PROCEDURE:
1. Connections are given as shown in the circuit diagram.2. Supply is switched ON and load is increased in steps, each time noting the readings of ammeter and wattmeter. Also the actual time taken for 1 revolution of the disc is measured using stop watch.3. Step 2 is repeated till rated current of the energy meter is reached.4. % error is calculated and calibration curve is drawn.
TABULAR COLUMN:
S.NO LOAD CURRENT
WATTMETERREADING, Wa
INDICATEDPOWER, Wi
Time taken , t
% ERROR

I (Amps) (W) (W) (secs)
CALCULATION:
MODEL GRAPH:
+Ve % Error 0 Wi
-Ve
NOTE:From the calibration curve it is possible to predict the error in recording the
energy. So the correction can be applied to the energy meter reading so that correct energy reading can be obtained and used.
RESULT:
EXPT. NO. 6 MEASUREMENT OF THREE PHASE POWER AND POWER FACTOR
AIM

To conduct a suitable experiment on a 3-phase load connected in star or delta to measure the three phase power and power factor using 2 wattmeter method.
OBJECTIVES
1. To study the working of wattmeter
2. To accurately measure the 3 phase power
3. To accurately measure the power factor
4. To study the concept of star connected load and delta connected load
APPARATUS REQUIRED:
S.NO NAME OF THE APPRATUS RANGE TYPE QTY12345
Ammeter VoltmeterWattmeter Connecting Wires3 phase inductive load
CIRCUIT DIAGRAM:
THEORY:

FORMULA USED:
1. Total power, P = W1+W2 (W)2. = Tan-1 3 [(W1-W2) /(W1+W2)]3. P.F = Cos
PROCEDURE:
1. Connection are made as per the circuit diagram, keeping the inductive load in the initial position.
2. Supply switch is closed and reading of ammeter and wattmeter are noted .If one of the wattmeter reads negative, then its potential coils (C and V) are interchanged and
reading is taken as negative.3. The above procedure is repeated for different values of inductive coil. Care should be taken that current should not exceed 10A during the experiment.
TABULAR COLUMN:
S.NO I W1 W2 POWER, P P.F Cos
(Amps) (Watts) (Watts) (Watts)
CALCULATION:
RESULT:
EXPT. NO. 7 INSTRUMENTATION AMPLIFIER.
AIM:
To study the working of instrumentation amplifier.
OBJECTIVE:
1. To study the characteristic of operational amplifier.
2. To study the use of operational amplifier as instrumentation amplifier.
APPARATUS REQUIRED:
S.NO NAME OF THE APPRATUS RANGE TYPE QTY1234
Instrumentation Amplifier KitDual RPS Multi meterConnecting Wires
PIN DIAGRAM:PIN DIAGRAM OF IC741
CIRCUIT DIAGRAM:
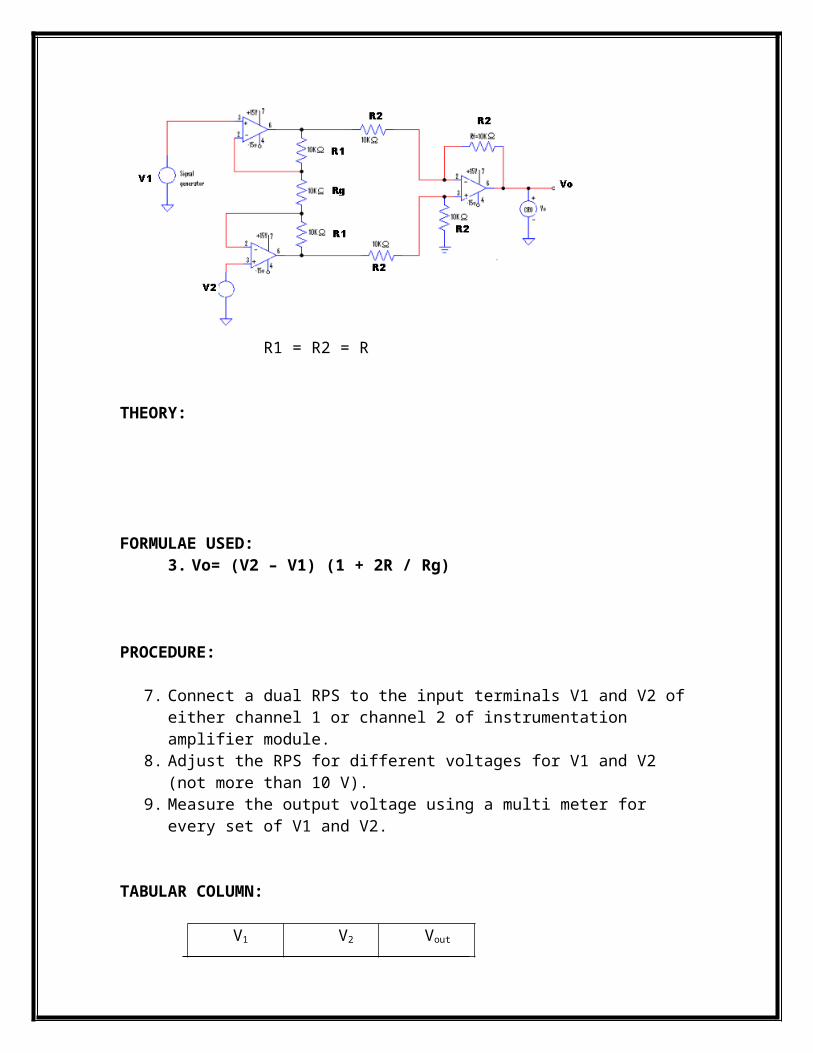
R1 = R2 = R
THEORY:

FORMULAE USED:1. Vo= (V2 – V1) (1 + 2R / Rg)
PROCEDURE:
1. Connect a dual RPS to the input terminals V1 and V2 of either channel 1 or channel 2 of instrumentation amplifier module.
2. Adjust the RPS for different voltages for V1 and V2 (not more than 10 V).3. Measure the output voltage using a multi meter for every set of V1 and V2.
TABULAR COLUMN:
V1 (v) V2 (v) Vout (v)
RESULT:EXPT. NO. 8 STUDY OF DISPLACEMENT TRANSDUCER - LVDT
AIM
To study the operation of LVDT- Linear Variable Differential Transformer

OBJECTIVE:
1. To study the basic principle of LVDT.
2. Study of signal conditioning circuit.
3. Study of LVDT as transducer.
APPARATUS REQUIRED:
S.NO NAME OF THE APPRATUS RANGE TYPE QTY1234
LVDT kitMultimeterConnecting Wires
THEORY:
CIRCUIT DIAGRAM:
Fig.1

Fig.2
PATCHING DIAGRAM:

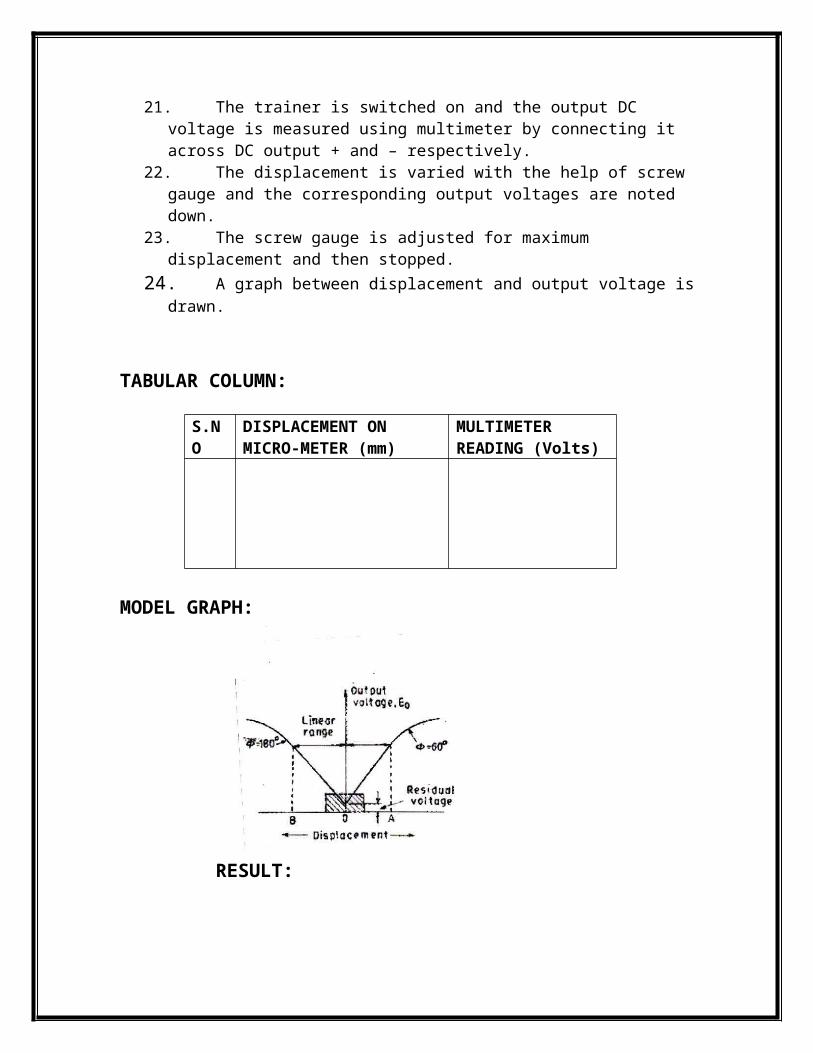
PROCEDURE:1. The trainer is switched and power supply is checked for +12V and -12Vwith the
help of multi meter.2. The trainer is switched off and connections are made as per the patching diagram.3. The LVDT is connected in the kit through connector provided in the circuit.4. The displacement of LVDT is kept at one end by using screw guage.5. The trainer is switched on and the output DC voltage is measured using
multimeter by connecting it across DC output + and – respectively.6. The displacement is varied with the help of screw gauge and the corresponding
output voltages are noted down.7. The screw gauge is adjusted for maximum displacement and then stopped.8. A graph between displacement and output voltage is drawn.
TABULAR COLUMN:
S.NO DISPLACEMENT ONMICRO-METER (mm)
MULTIMETER READING (Volts)
MODEL GRAPH:
RESULT:

EXPT. NO 9 STUDY OF PRESSURE TRANSDUCER
AIM
To study the operation of a pressure transducer – Strain gauge.
OBJECTIVES
1. To study the basic principle of Strain gauge.
2. Study of Strain gauge as transducer.
APPARATUS REQUIRED:S.NO NAME OF THE APPARATUS RANGE TYPE QUANTITY 12
Pressure measurement module Multimeter
THEORY:
FORMULAE USED:
% Error = [(Gauge pressure – displayed pressure) / displayed pressure] * 100
PROCEDURE:
1. Install the pressure cell setup and interface the 9 pin D connector with the pressure measurement module. Switch ON the module.
2. Calibrate the pressure measurement module by the following procedure. Open the air release valve and exhaust the tank inlet air and nullify the output voltage by using zero adjustment pot, then close the air release valve and apply 20 Psi pressure to the cylinder and adjust the display to 20 Psi by using gain adjustment POT.
3. After calibration open the air release valve and exhaust the tank inlet air.4. Close the air release valve and press the pump piston and note down the bridge
voltage in mV across T2 and T3, output voltage in V across T5 and GND and the displayed pressure in Psi in the indicator. Repeat the procedure for increasing values of pressure and tabulate the readings.(Pressure should not exceed 20 Psi)
5. Plot the error calibration curve.

CIRCUIT DIAGRAM:
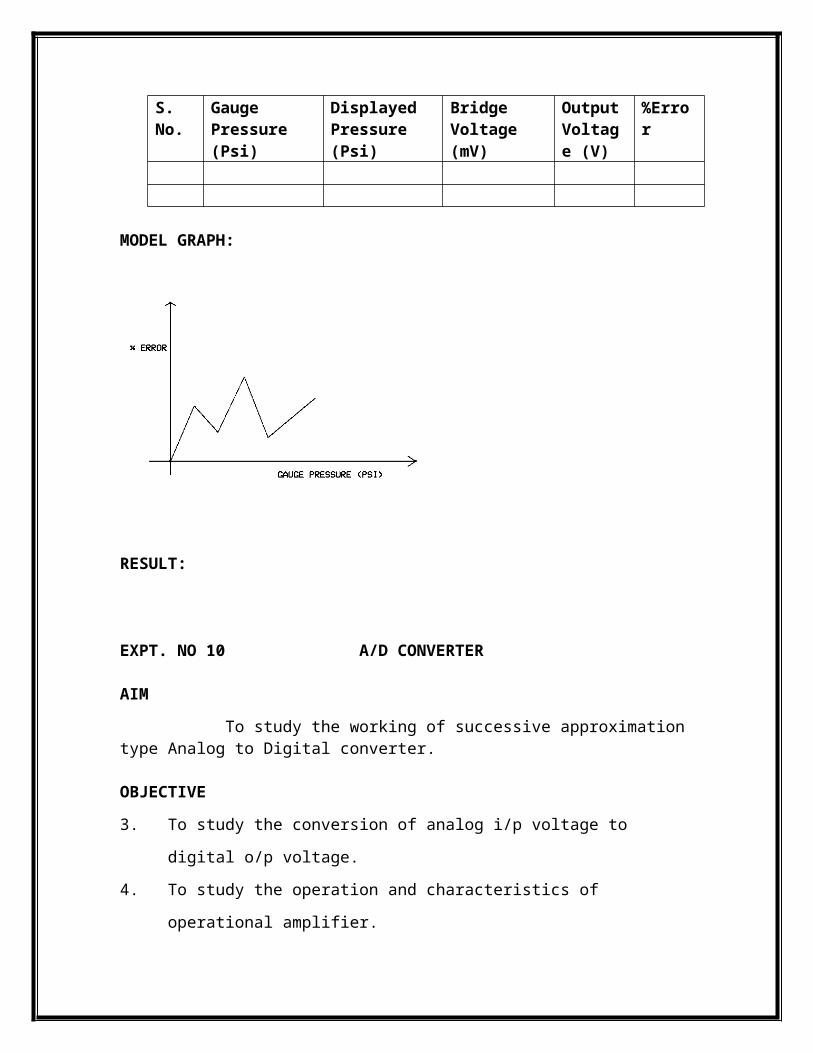
TABULAR COLUMN:
S. No. Gauge Pressure (Psi)
Displayed Pressure (Psi)
Bridge Voltage (mV)
Output Voltage (V)
%Error
MODEL GRAPH:
RESULT:

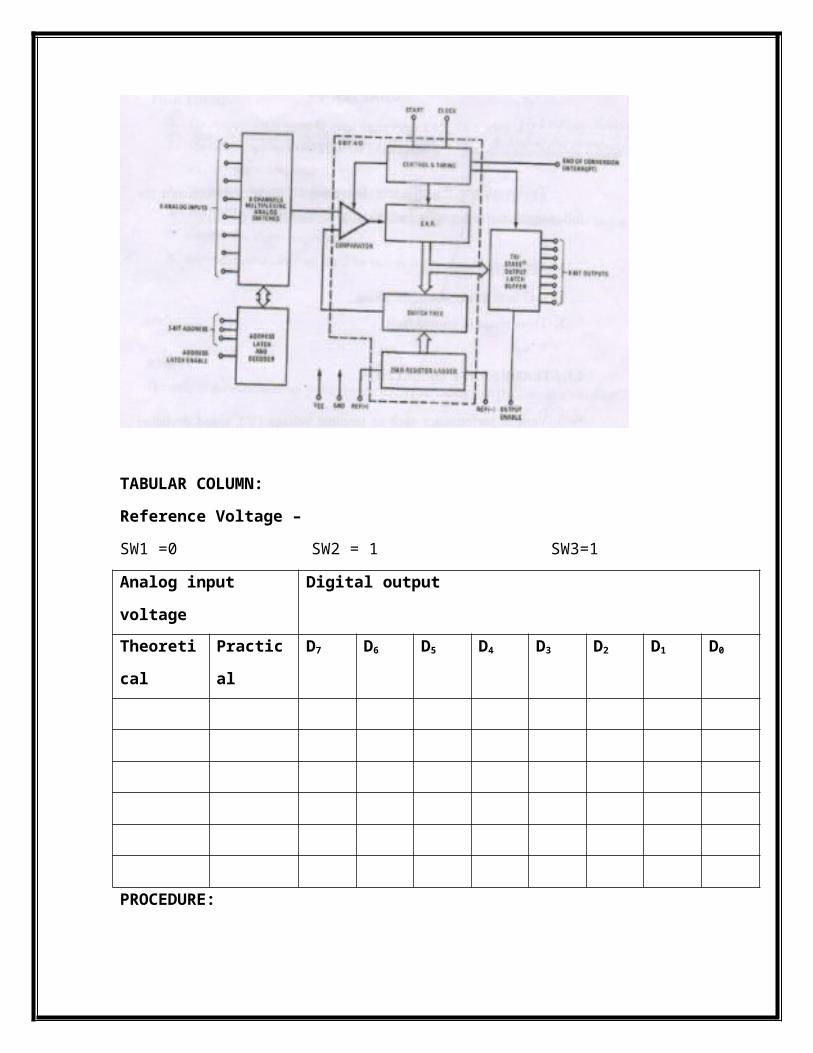
EXPT. NO 10 A/D CONVERTER
AIM
To study the working of successive approximation type Analog to Digital converter.
OBJECTIVE
1. To study the conversion of analog i/p voltage to digital o/p voltage.
2. To study the operation and characteristics of operational amplifier.
APPARATUS REQUIRED:
S.NO NAME OF THE APPARATUS RANGE TYPE QUANTITY 1234
A/D Converter kitRPS MultimeterConnecting Wires
THEORY:
FORMULAE USED:
Input voltage, Vin = Vref [D7 2-1 + D6 2-2 + D5 2-3 + ………. + D0 2-8]Where,
Vref = Reference voltageD7, D6,D5,……D0 = 8 bit digital outputD7 - MSB of digital dataD0 – LSB of digital data
CIRCUIT DIAGRAM:

TABULAR COLUMN:
Reference Voltage –
SW1 =0 SW2 = 1 SW3=1
Analog input voltage Digital output
Theoretical Practical D7 D6 D5 D4 D3 D2 D1 D0
PROCEDURE:
1. The channel 3 is selected by using switches SW1, SW2, SW3 by keeping them in 011 position.
2. Vref is measured using multi meter across pin 6 and 1 by keeping the pot at maximum position.
3. The analog voltage to be converted is set by using the pot and the voltage set is measured by using multi meter.
4. The ALE switch SW5 is pressed once to send the data to SAR.

5. The SOC switch SW4 is pressed once to obtain the digital data for the given input voltage. The digital output obtained is noted.
6. The procedure is repeated from step 2 for various values of analog input voltage.
RESULT:
EXPT. NO. 11 D/A CONVERTER

AIM
To study the working of an 8 bit weighted resistor type Digital to Analog
converter.
OBJECTIVE
1. To study the conversion of binary voltage to analog o/p voltage
2. To study the operation and characteristics of operational amplifier
APPRATUS REQUIRED:
S.NO NAME OF THE APPRATUS RANGE TYPE QTY1234
D/A Converter kitRPS MultimeterConnecting Wires
THEORY:
FORMULAE USED:
Eo = Vref [(2 Xo – 255) / 256]Where Xo is the equivalent decimal value of the given digital output.
CIRCUIT DIAGRAM:

PROCEDURE:
1. The connections are made as per the circuit diagram.
2. Vref is measured across P2 terminal by keeping the pot knob in maximum position.
3. The binary input is applied by closing the appropriate switches.
4. The analog output across P2 terminal by using multi meter.
5. The procedure is repeated for various binary input values.
TABULAR COLUMN:
S.No. Digital Input Analog outputBinary Decimal equivalent Theoretical Practical
RESULT:
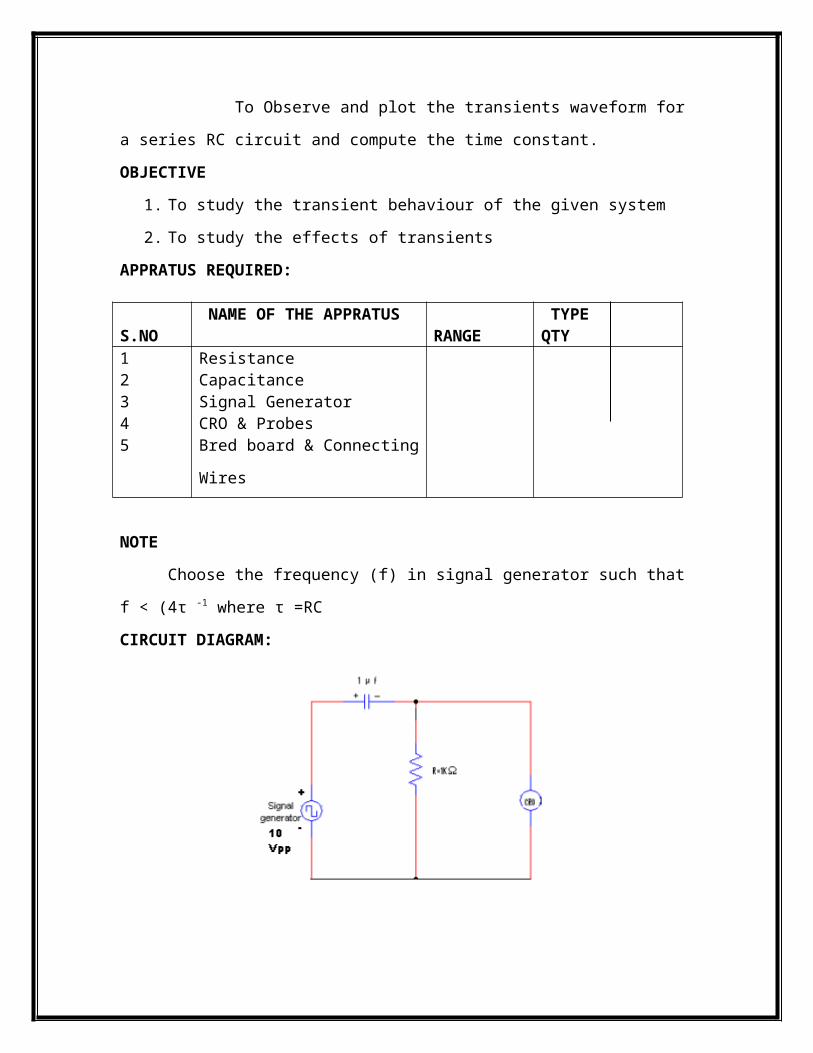
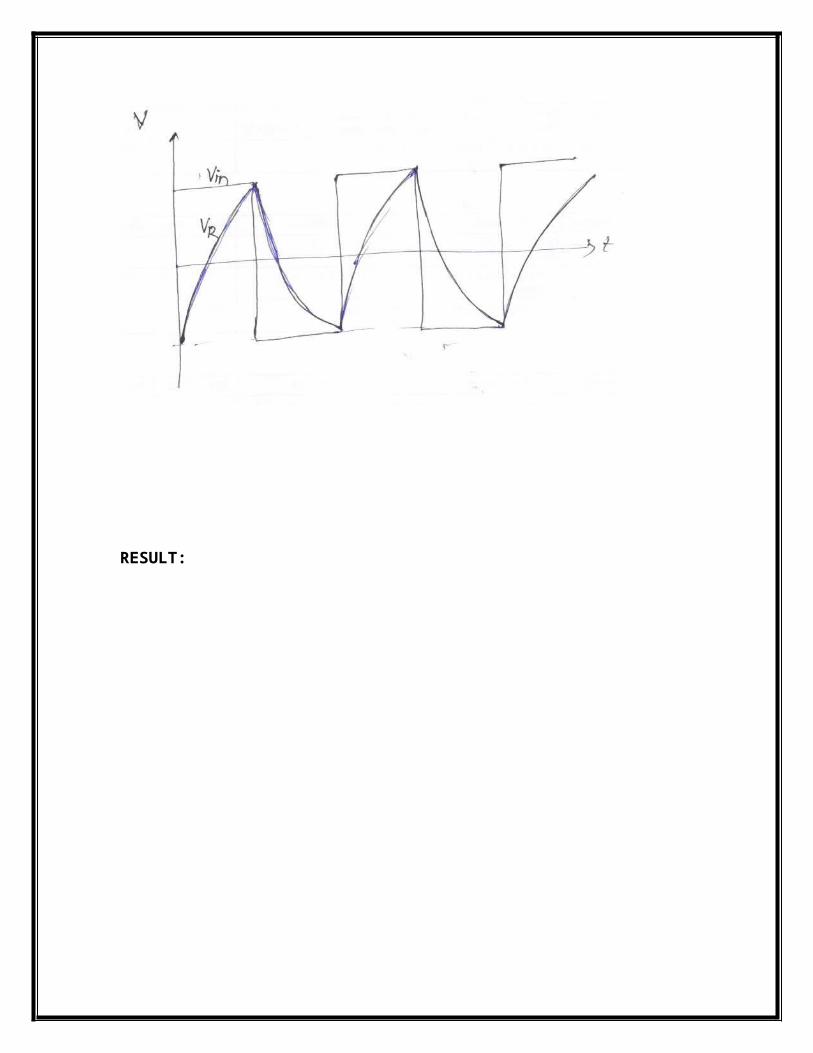
EXPT.NO. 12 STUDY OF TRANSIENTS

(a) RC TRANSIENTS:
AIM
To Observe and plot the transients waveform for a series RC circuit and compute
the time constant.
OBJECTIVE
1. To study the transient behaviour of the given system
2. To study the effects of transients
APPRATUS REQUIRED:
S.NO NAME OF THE APPRATUS RANGE TYPE QTY12345
Resistance CapacitanceSignal Generator CRO & ProbesBred board & Connecting Wires
NOTE
Choose the frequency (f) in signal generator such that f < (4τ -1 where τ =RC
CIRCUIT DIAGRAM:
PROCEDURE:
1. Connections are made as per the circuit diagram.

2. Signal generator is adjusted for an input of 10 Vpp square wave and designed
frequency and then applied to the circuit.
3. The voltage across resistor , VR = Ve- t/RC is observed in the CRO and the time
taken by the output to reach 36.8% of its final value (discharging time) is noted.
MODEL GRAPH:
RESULT:

(b) RL TRANSIENTS:
AIM:
To observe and plot the transient waveform for a series RL circuit and to compute
the time constant
OBJECTIVE
1. To study the transient behavior of the given system
2. To study the effects of transients
APPRATUS REQUIRED:
S.NO NAME OF THE APPRATUS RANGE TYPE QTY12345
Resistance Inductor Signal Generator CRO & ProbesBred board & Connecting Wires
NOTE
Choose the frequency (f) in signal generator such that f < (4 τ)-1 where τ =L/R
CIRCUIT DIAGRAM:
PROCEDURE:
1. Connections are made as per the circuit diagram.
2. Signal generator is adjusted for an input of 10 Vpp square wave and designed
frequency and then applied to the circuit.

3. The voltage across resistor , VR =V ( 1 - e- tR/L) is observed in the CRO and the
time taken by the output to reach 63.2% of its final value (charging time) is noted.
MODEL GRAPH:
RESULT:

EXPT. NO. 13 CALIBRATION OF CURRENT TRANSFORMER
AIM
To study the working of current transformer
OBJECTIVE
1. To study the current transformation concept
2. To study the efficiency of a given current transformer
3. To study the loss components in the circuit
APPRATUS REQUIRED:
S.NO NAME OF THE APPRATUS RANGE TYPE QTY1234
Current Transformer VoltmeterAmmeterResistive Load
THEORY:
FORMULAE USED:
% Ratio error =[( nominal ratio – actual ratio) / actual ratio] x 100
= [ (Kn - Kact) / Kact ]Where
Kact = magnitude of actual primary current / magnitude of actual secondary current Kn = rated primary current / rated secondary current
Inductive reactance in Ω, XL = 2πfLWhere L is inductance of CT secondary in H
Impedance in Ω, Z = √ R2 + XL2
Secondary burden due to load, VA = I2 Z
PRECAUTIONS:
1. SPST 1 and SPST 2 should be kept closed before switching ON the supply.2. SPST2 should be opened before applying the load.

CIRCUIT DIAGRAM:
PROCEDURE:1. Connections are made as per the circuit diagram.2. DPST is closed on the primary side and no load voltage and current are noted.3. SPST 2 is opened and then load is applied in steps. For each load applied, line
voltage, primary current, secondary current, and load values are noted down. Also resistance and inductance values of CT secondary are measured using LCR meter.
4. The % error and secondary burden due to lad are calculated. 5. A graph is drawn between primary current and secondary current is drawn.
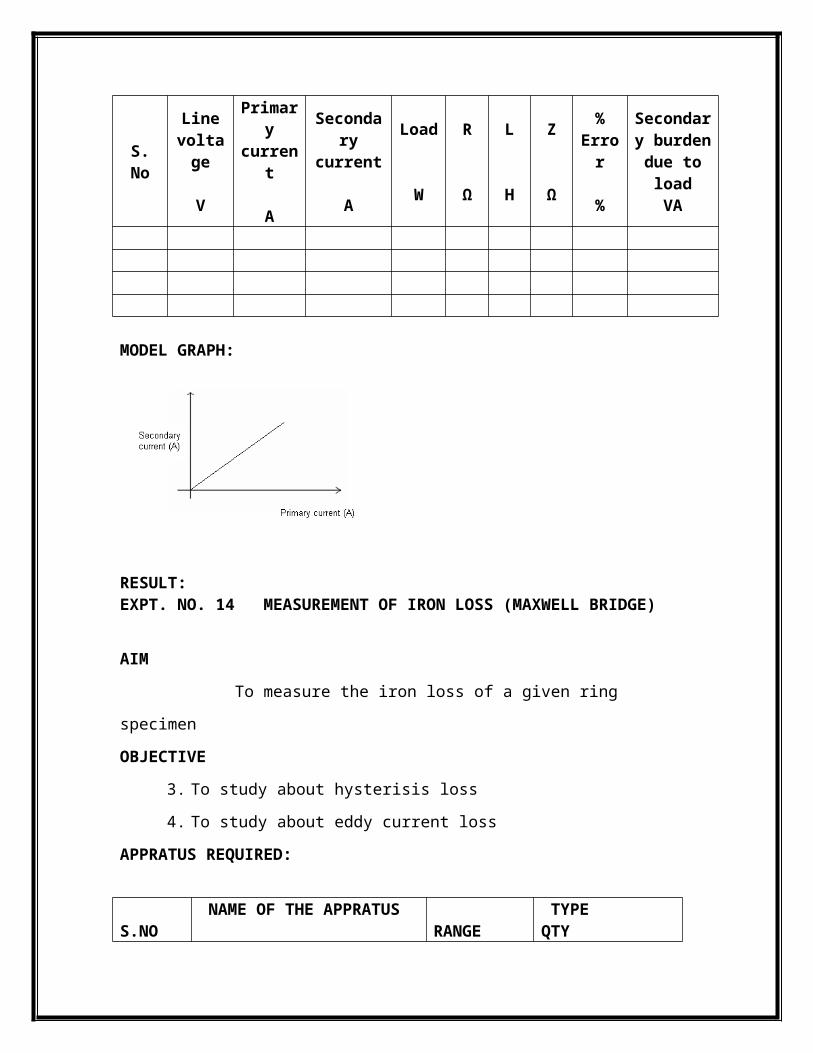
TABULAR COLUMN:
S. No
Line voltage
V
Primary current
A
Secondary current
A
Load
W
R
Ω
L
H
Z
Ω
%Error
%
Secondary burden
due to loadVA
MODEL GRAPH:
RESULT:

EXPT. NO. 14 MEASUREMENT OF IRON LOSS (MAXWELL BRIDGE)
AIM
To measure the iron loss of a given ring specimen
OBJECTIVE
1. To study about hysterisis loss
2. To study about eddy current loss
APPRATUS REQUIRED:
S.NO NAME OF THE APPRATUS RANGE TYPE QTY1234
Measurement of iron loss trainerRing SpecimenMultimeterCRO
THEORY:
FORMULAE USED:
1. Unknown resistance, R1=R2R3 / R4 (Ω)2. Unknown Inductance, L1=R2R3C4 Henry 3. Iron loss = I1
2 x (R1 – Rw) Where,
Rw is the winding resistance of the ring specimen measured using multimeter.

CIRCUIT DIAGRAM:
PROCEDURE:
1. Patch the circuit as per the circuit diagram
2. The pot 2(R4) is kept in the maximum position and R3 is selected as 10 Ω
initially.
3. The trainer kit is switched ON
4. Adjust pot 1 (R2) and obtain the null position in the CRO.
5. At the bridge balance condition note down the current I1 using multi meter(in
mA range selection) connected in series with R3 .
6. Switch OFF the trainer kit and note down the value of R2 and winding resistance
of ring specimen using multi meter.
7. Steps 3 to 6 are repeated for other two settings of R3.
8. The entire procedure is repeated for other samples of ring specimens provided in
the kit.
TABULAR COLUMN: R4 = __________ (Ω)
S.No. Specimen
No.
R2 (Ω) R3(Ω) I1 (mA) RW(Ω) R1(Ω) L1(H) Iron loss
(W)
1. 1 10
2. 100
3. 1000
4. 2 10
5. 100
6. 1000
7. 3 10
8. 100
9. 1000
RESULT:

Faculty Name : Mrs. V. DEVI MAHESWARAN Designation: ASSISTANT PROFESSOR
Department : E.E.E. Faculty Code : EE48
Subject Name : M & I Laboratory Subject Code : 131353
Year : II Semester : III
Degree & Branch : B.E. – E.E.E. Batch : A2
MEASUREMENTS AND INSTRUMENTATION LABORATORY –131353
LIST OF EXPERIMENTS

S.NO TITLE PAGE NO
1MEASUREMENT OF RESISTANCE USING
WHEATSTONE BRIDGE2 MEASUREMENT OF RESISTANCE USING
KELVIN’S DOUBLE BRIDGE.3 MEASUREMENT OF CAPACITANCE USING
SCHERING BRIDGE.4 MEASUREMENT OF INDUCTANCE USING
MAXWELLS BRIDGE.5 CALIBRATION OF 1 ENERGYMETER.
6 MEASUREMENT OF 3 PHASE POWER AND POWER FACTOR
7 INSTRUMENTATION AMPLIFIER.
8 STUDY OF DISPLACEMENT TRANSDUCER - LVDT
9 STUDY OF PRESSURE TRANSDUCER
10 A/D CONVERTER
11 D/A CONVERTER
12 STUDY OF TRANSIENTS
13 CALIBRATION OF CURRENT TRANSFORMER
14 MEASUREMENT OF IRON LOSS (MAXWELL BRIDGE)

EXPT. NO. 1 MEASUREMENT OF RESISTANCE USING WHEATSTONE BRIDGE
AIM:
To measure the given medium resistance using Wheatstone bridge.
OBJECTIVE:
To study the working of bridge under balanced and unbalanced condition and to
study the sensitivity of bridge.
APPARATUS REQUIRED:
SL.NO
NAME OF THE APPRATUS
RANGE TYPE QTY
1234
Wheat stone Bridge kitUnknown resistanceMultimeterConnecting Wires.
CIRCUIT DIAGRAM:
THEORY:
FORMULAE USED: Unknown Resistance, Rx = (P/Q) S ()

Where P, Q = Ratio Arms. S = Variable resistance, Rx = Unknown resistance.
PROCEDURE:1. The resistance to be measured is connected between XX points in the bridge kit.2. The P/Q ratio (multiplier) is initially kept at position ‘1’ and the deflection of the galvanometer is observed by pressing both the battery and the galvanometer keys.3. The S arm (X 1000) is adjusted and two positions are identified for which the deflection of the galvanometer is on either side of the null point and kept at the lowest value of S. Then the x100, x10, x1 knobs of S are adjusted to get null deflection. If necessary the sensitivity knob may be adjusted to get appreciable deflection. [If not possible P/Q ratio is kept at any other suitable value ie, any one of ratios provided.]4. The value of unknown resistance is read. (S value)5. Steps 3 and 4 are repeated for some other P/Q ratio. The mean value is taken.6. The experiment is repeated with other samples provided.
NOTE: The above experiment may be used for measuring resistance of the samples less than 1 to greater than 10k with lesser sensitivity.
TABULAR COLUMN:
S.NO SAMPLE P/Q RATIO(MULTIPLIER)
S VALUE ()
UNKNOWNRESISTANCE RX ()
CALCULATION:
RESULT:
EXPT. NO. 2 MEASUREMENT OF RESISTANCE USING KELVIN’S DOUBLE BRIDGE

AIM:
To measure the given low resistance using Kelvin’s double bridge method.
OBJECTIVE:
To study the working of bridge under balanced and unbalanced condition and to
study the sensitivity of bridge.
APPARATUS REQUIRED:
SL.NO
NAME OF THE APPRATUS
RANGE TYPE QTY
1234
Kelvin Double bridge kit Unknown resistanceMultimeterConnecting Wires
CIRCUIT DIAGRAM:
THEORY:

FORMULA USED: Rx = (P/Q) S ohms Where P, Q first set of ratio arms. p, q Second set of ratio arms. S Standard resistance, Rx unknown resistance.
PROCEDURE:
1. The resistance to be measured is connected such that the leads from +C and + P are connected to one end and those from –C and –P are connected to the other end in the kit.2. The P/Q ratio (multiplier) is initially kept at position ‘1’ and the deflection of the galvanometer is observed by pressing the galvanometer key.3. The ‘S’ arm (main dial) is adjusted and two positions are identified for which the deflection of the galvanometer is on either side of the null point. [If not some other P/Q ratio is to be tried].4. The lowest of the two position indicates the coarse value of the unknown resistance and the null point is obtained by adjusting the Vernier scale, with the galvanometer sensitivity knob at the maximum position.5. The value of unknown resistance is read. [‘S’ Value]6. Steps 3, 4, 5 are repeated for some other P/Q ratio for the unknown resistance. The mean value is taken.7. The above procedure is repeated with another sample.
TABULAR COLUMN:
S.NO
SAMPLE P/Q RATIO(Multiplier)
S VALUECOARSE() FINE ( )
UNKNOWN RESISTANCERx ()
.CALCULATION:
RESULT: EXPT. NO. 3 MEASUREMENT OF CAPACITANCE USING
SCHERING BRIDGE

AIM:
To measure the unknown capacitance using Schering bridge.
OBJECTIVE:
To measure the unknown capacitance and to study about dissipation factor.
APPARATUS REQUIRED:
SL.NO
NAME OF THE APPRATUS
RANGE TYPE QTY
12345
Schering Bridge kit Unknown capacitanceMultimeterConnecting WiresCRO
CIRCUIT DIAGRAM:
THEORY:

FORMULA USED:
1. Unknown capacitance, Cx = (R1/R2) C3,Where C3 is known capacitance in µF
R2 is Non-Inductive Variable Resistor 2. Dissipation factor, D = ω R1 C1 = ω Rx Cx
PROCEDURE:
10. The oscillator AB and the bridge AB terminals are connected.11. From the CD terminals of the bridge, the detector (loudspeaker) is connected
through an imbalance amplifier.12. Connections of the bridge arm are made as per the circuit diagram.13. The value of R2 is selected arbitrarily (say1K) and R1 is kept at maximum
position.14. The kit is switched on and R1 is decreased until the null point is observed as a dip
in the sound from the loudspeaker.15. The capacitor C1 can be varied for fine balance adjustment.16. When the balance condition is reached, the trainer kit is switched OFF and the
value R1 is measured using a multimeter.17. The value of unknown capacitance and dissipation factor is calculated.18. The experiment is repeated for various samples provided.
TABULAR COLUMN:
S.NO SAMPLE R2 () R1 () UNKNOWN CAPACITANCE Cx (µF)
CALCULATION:
RESULT:
EXPT. NO. 4 MEASUREMENT OF INDUCTANCE USING MAXWELLS BRIDGE

AIM:To find the unknown inductance and Q factor of a given coil.
OBJECTIVE:To find the unknown inductance of the given coil using bridge circuit and to study that Maxwell inductance- capacitance bridge is suitable for the measurement of low Q coils.
APPARATUS REQUIRED:
SL.NO
NAME OF THE APPRATUS
RANGE TYPE QTY
1
23456
Maxwell’s inductance Capacitance Bridge kit Unknown InductanceMultimeterConnecting WiresCROBridge oscillator 1 kHZ
CIRCUIT DIAGRAM:
THEORY:
FORMULAE USED:
1. Unknown resistance, R1=R2R3 / R4 (Ω)
R3L1
R1
R2R4
C4D

2. Unknown Inductance, L1=R2R3C4 Henry Thus we have two variables R4 and C4 which appears in one of the two balance equation and hence the two equations are independent, and balance is obtained by varying R4 and C4 alternately.
3. Quality factor, Q = ωL1 / R1 = ωC4R4
PROCEDURE:8. The inductance to be measured is connected between L1 terminal of the kit.9. The bridge oscillator is set for 10Vpp, 1 kHz and connected to the OSC terminal
of the kit.10. The detector CRO or headphone is connected to the headphone terminal of the kit.11. The R4 and C4 are adjusted from the highest range (among the 3 range knobs) to
obtain the null point in the detector. [ Null point – For increase in R4 and C4 values the point at which the amplitude reduces to a minimum and then increases is null point).
12. At the null point the values of R4 and C4 are noted.13. The value of unknown resistance, inductance and quality factor are calculated.14. The experiment is repeated with other samples provided.
TABULAR COLUMN:
S.NO SAMPLE R4(Ω) C4 (F) UNKNOWN INDUCTANCE(H)
CALCULATION:
RESULT:
EXPT. NO. 5 CALIBRATION OF SINGLE PHASE ENERGYMETER
AIM:
To calibrate the given single phase energy meter at unity and other power factors

OBJECTIVE:
4. To study the working of energy meter.
5. To accurately calibrate the meter at unity and other power factor.
6. To study the % of error for the given energy meter.
APPARATUS REQUIRED:
SL.NO
NAME OF THE APPRATUS
RANGE TYPE QTY
123456
Energy meterWattmeterAmmeter VoltmeterStop watchConnecting Wires
CIRCUIT DIAGRAM:
NAME PLATE DETAILS:
RATED CURRENT
RATED VOLTAGE
FREQUENCY
REVOLUTIONS/KWH

THEORY:
FORMULAE USED: Let x revolution / kwh be the rating.Now x revolution = 1 kwh
= 1* 3600*1000 watt-sec.Constant k of energymeter = 3600 * 103/ x watt-secFor each load, indicated power Wi is given as Wi = k/t watts
WhereK= energy meter constant (watt-sec)t = time for 1 revolution(sec)
% error = Wi – Wa / Wi * 100Where Wi is indicated power in watts
Wa is actual power shown by wattmeter in watts
% error can be zero +ve or –ve.
PROCEDURE:
1. Connections are given as shown in the circuit diagram.2. Supply is switched ON and load is increased in steps, each time noting the readings of ammeter and wattmeter. Also the actual time taken for 1 revolution of the disc is measured using stop watch.3. Step 2 is repeated till rated current of the energy meter is reached.4. % error is calculated and calibration curve is drawn.
TABULAR COLUMN:
S.NO LOAD CURRENT I (Amps)
WATTMETERREADING, Wa (W)
INDICATEDPOWER, Wi (W)
Time taken , t (secs)
% ERROR

CALCULATION:
MODEL GRAPH:
+Ve % Error 0 Wi
-Ve
NOTE:From the calibration curve it is possible to predict the error in recording the
energy. So the correction can be applied to the energy meter reading so that correct energy reading can be obtained and used.
RESULT:
EXPT. NO. 6 MEASUREMENT OF THREE PHASE POWER AND POWER FACTOR
AIM
To conduct a suitable experiment on a 3-phase load connected in star or delta to measure the three phase power and power factor using 2 wattmeter method.

OBJECTIVES
5. To study the working of wattmeter
6. To accurately measure the 3 phase power
7. To accurately measure the power factor
8. To study the concept of star connected load and delta connected load
APPARATUS REQUIRED:
S.NO NAME OF THE APPRATUS RANGE TYPE QTY12345
Ammeter VoltmeterWattmeter Connecting Wires3 phase inductive load
CIRCUIT DIAGRAM:
THEORY:

FORMULA USED:
3. Total power, P = W1+W2 (W)4. = Tan-1 3 [(W1-W2) /(W1+W2)]3. P.F = Cos
PROCEDURE:
3. Connection are made as per the circuit diagram, keeping the inductive load in the initial position.
4. Supply switch is closed and reading of ammeter and wattmeter are noted .If one of the wattmeter reads negative, then its potential coils (C and V) are interchanged and
reading is taken as negative.3. The above procedure is repeated for different values of inductive coil. Care should be taken that current should not exceed 10A during the experiment.
TABULAR COLUMN:
S.NO I W1 W2 POWER, P P.F Cos
(Amps) (Watts) (Watts) (Watts)
CALCULATION:
RESULT:
EXPT. NO. 7 INSTRUMENTATION AMPLIFIER.
AIM: To study the working of instrumentation amplifier.

OBJECTIVE:
3. To study the characteristic of operational amplifier.
4. To study the use of operational amplifier as instrumentation amplifier.
APPARATUS REQUIRED:
S.NO NAME OF THE APPRATUS RANGE TYPE QTY1234
Instrumentation Amplifier KitDual RPS Multi meterConnecting Wires
PIN DIAGRAM:PIN DIAGRAM OF IC741
CIRCUIT DIAGRAM:
R1 = R2 = R
THEORY:

FORMULAE USED:2. Vo= (V2 – V1) (1 + 2R / Rg)
PROCEDURE:
4. Connect a dual RPS to the input terminals V1 and V2 of either channel 1 or channel 2 of instrumentation amplifier module.
5. Adjust the RPS for different voltages for V1 and V2 (not more than 10 V).6. Measure the output voltage using a multi meter for every set of V1 and V2.
TABULAR COLUMN:
V1 (v) V2 (v) Vout (v)
RESULT:EXPT. NO. 8 STUDY OF DISPLACEMENT TRANSDUCER - LVDT
AIM
To study the operation of LVDT- Linear Variable Differential Transformer

OBJECTIVE:
3. To study the basic principle of LVDT.
4. Study of signal conditioning circuit.
3. Study of LVDT as transducer.
APPARATUS REQUIRED:
S.NO NAME OF THE APPRATUS RANGE TYPE QTY1234
LVDT kitMultimeterConnecting Wires
THEORY:
CIRCUIT DIAGRAM:
Fig.1
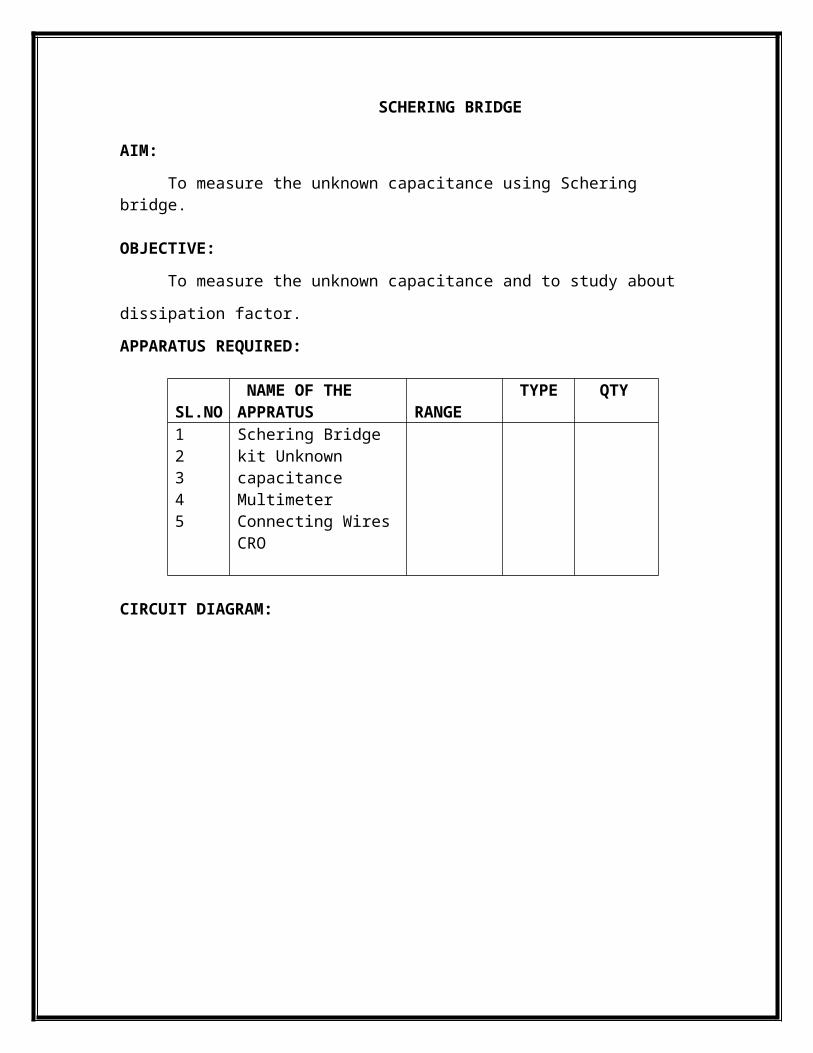
Fig.2
PATCHING DIAGRAM:

PROCEDURE:9. The trainer is switched and power supply is checked for +12V and -12Vwith the
help of multi meter.10. The trainer is switched off and connections are made as per the patching diagram.11. The LVDT is connected in the kit through connector provided in the circuit.12. The displacement of LVDT is kept at one end by using screw guage.13. The trainer is switched on and the output DC voltage is measured using
multimeter by connecting it across DC output + and – respectively.14. The displacement is varied with the help of screw gauge and the corresponding
output voltages are noted down.15. The screw gauge is adjusted for maximum displacement and then stopped.16.A graph between displacement and output voltage is drawn.
TABULAR COLUMN:
S.NO DISPLACEMENT ONMICRO-METER (mm)
MULTIMETER READING (Volts)
MODEL GRAPH:
RESULT:

EXPT. NO 9 STUDY OF PRESSURE TRANSDUCER
AIM
To study the operation of a pressure transducer – Strain gauge.
OBJECTIVES
3. To study the basic principle of Strain gauge.
4. Study of Strain gauge as transducer.
APPARATUS REQUIRED:S.NO NAME OF THE APPARATUS RANGE TYPE QUANTITY 12
Pressure measurement module Multimeter
THEORY:
FORMULAE USED:
% Error = [(Gauge pressure – displayed pressure) / displayed pressure] * 100
PROCEDURE:
6. Install the pressure cell setup and interface the 9 pin D connector with the pressure measurement module. Switch ON the module.
7. Calibrate the pressure measurement module by the following procedure. Open the air release valve and exhaust the tank inlet air and nullify the output voltage by using zero adjustment pot, then close the air release valve and apply 20 Psi pressure to the cylinder and adjust the display to 20 Psi by using gain adjustment POT.
8. After calibration open the air release valve and exhaust the tank inlet air.9. Close the air release valve and press the pump piston and note down the bridge
voltage in mV across T2 and T3, output voltage in V across T5 and GND and the displayed pressure in Psi in the indicator. Repeat the procedure for increasing values of pressure and tabulate the readings.(Pressure should not exceed 20 Psi)
10. Plot the error calibration curve.

CIRCUIT DIAGRAM:
TABULAR COLUMN:
S. No. Gauge Pressure (Psi)
Displayed Pressure (Psi)
Bridge Voltage (mV)
Output Voltage (V)
%Error
MODEL GRAPH:
RESULT:

EXPT. NO 10 A/D CONVERTER
AIM
To study the working of successive approximation type Analog to Digital converter.
OBJECTIVE
3. To study the conversion of analog i/p voltage to digital o/p voltage.
4. To study the operation and characteristics of operational amplifier.
APPARATUS REQUIRED:
S.NO NAME OF THE APPARATUS RANGE TYPE QUANTITY 1234
A/D Converter kitRPS MultimeterConnecting Wires
THEORY:
FORMULAE USED:
Input voltage, Vin = Vref [D7 2-1 + D6 2-2 + D5 2-3 + ………. + D0 2-8]Where,
Vref = Reference voltageD7, D6,D5,……D0 = 8 bit digital outputD7 - MSB of digital dataD0 – LSB of digital data
CIRCUIT DIAGRAM:

TABULAR COLUMN:
Reference Voltage –
SW1 =0 SW2 = 1 SW3=1
Analog input voltage Digital output
Theoretical Practical D7 D6 D5 D4 D3 D2 D1 D0
PROCEDURE:
7. The channel 3 is selected by using switches SW1, SW2, SW3 by keeping them in 011 position.
8. Vref is measured using multi meter across pin 6 and 1 by keeping the pot at maximum position.
9. The analog voltage to be converted is set by using the pot and the voltage set is measured by using multi meter.
10. The ALE switch SW5 is pressed once to send the data to SAR.

11. The SOC switch SW4 is pressed once to obtain the digital data for the given input voltage. The digital output obtained is noted.
12. The procedure is repeated from step 2 for various values of analog input voltage.
RESULT:
EXPT. NO. 11 D/A CONVERTER

AIM
To study the working of an 8 bit weighted resistor type Digital to Analog
converter.
OBJECTIVE
3. To study the conversion of binary voltage to analog o/p voltage
4. To study the operation and characteristics of operational amplifier
APPRATUS REQUIRED:
S.NO NAME OF THE APPRATUS RANGE TYPE QTY1234
D/A Converter kitRPS MultimeterConnecting Wires
THEORY:
FORMULAE USED:
Eo = Vref [(2 Xo – 255) / 256]Where Xo is the equivalent decimal value of the given digital output.
CIRCUIT DIAGRAM:

PROCEDURE:
6. The connections are made as per the circuit diagram.
7. Vref is measured across P2 terminal by keeping the pot knob in maximum position.
8. The binary input is applied by closing the appropriate switches.
9. The analog output across P2 terminal by using multi meter.
10. The procedure is repeated for various binary input values.
TABULAR COLUMN:
S.No. Digital Input Analog outputBinary Decimal equivalent Theoretical Practical
RESULT:
EXPT.NO. 12 STUDY OF TRANSIENTS

(c) RC TRANSIENTS:
AIM
To Observe and plot the transients waveform for a series RC circuit and compute
the time constant.
OBJECTIVE
3. To study the transient behaviour of the given system
4. To study the effects of transients
APPRATUS REQUIRED:
S.NO NAME OF THE APPRATUS RANGE TYPE QTY12345
Resistance CapacitanceSignal Generator CRO & ProbesBred board & Connecting Wires
NOTE
Choose the frequency (f) in signal generator such that f < (4τ -1 where τ =RC
CIRCUIT DIAGRAM:
PROCEDURE:
4. Connections are made as per the circuit diagram.

5. Signal generator is adjusted for an input of 10 Vpp square wave and designed
frequency and then applied to the circuit.
6. The voltage across resistor , VR = Ve- t/RC is observed in the CRO and the time
taken by the output to reach 36.8% of its final value (discharging time) is noted.
MODEL GRAPH:
RESULT:

(d) RL TRANSIENTS:
AIM:
To observe and plot the transient waveform for a series RL circuit and to compute
the time constant
OBJECTIVE
1. To study the transient behavior of the given system
2. To study the effects of transients
APPRATUS REQUIRED:
S.NO NAME OF THE APPRATUS RANGE TYPE QTY12345
Resistance Inductor Signal Generator CRO & ProbesBred board & Connecting Wires
NOTE
Choose the frequency (f) in signal generator such that f < (4 τ)-1 where τ =L/R
CIRCUIT DIAGRAM:
PROCEDURE:
4. Connections are made as per the circuit diagram.
5. Signal generator is adjusted for an input of 10 Vpp square wave and designed
frequency and then applied to the circuit.

6. The voltage across resistor , VR =V ( 1 - e- tR/L) is observed in the CRO and the
time taken by the output to reach 63.2% of its final value (charging time) is noted.
MODEL GRAPH:
RESULT:

EXPT. NO. 13 CALIBRATION OF CURRENT TRANSFORMER
AIM
To study the working of current transformer
OBJECTIVE
4. To study the current transformation concept
5. To study the efficiency of a given current transformer
6. To study the loss components in the circuit
APPRATUS REQUIRED:
S.NO NAME OF THE APPRATUS RANGE TYPE QTY1234
Current Transformer VoltmeterAmmeterResistive Load
THEORY:
FORMULAE USED:
% Ratio error =[( nominal ratio – actual ratio) / actual ratio] x 100
= [ (Kn - Kact) / Kact ]Where
Kact = magnitude of actual primary current / magnitude of actual secondary current Kn = rated primary current / rated secondary current
Inductive reactance in Ω, XL = 2πfLWhere L is inductance of CT secondary in H
Impedance in Ω, Z = √ R2 + XL2
Secondary burden due to load, VA = I2 Z
PRECAUTIONS:
3. SPST 1 and SPST 2 should be kept closed before switching ON the supply.4. SPST2 should be opened before applying the load.

CIRCUIT DIAGRAM:
PROCEDURE:6. Connections are made as per the circuit diagram.7. DPST is closed on the primary side and no load voltage and current are noted.8. SPST 2 is opened and then load is applied in steps. For each load applied, line
voltage, primary current, secondary current, and load values are noted down. Also resistance and inductance values of CT secondary are measured using LCR meter.
9. The % error and secondary burden due to lad are calculated. 10. A graph is drawn between primary current and secondary current is drawn.
TABULAR COLUMN:
S. No
Line voltage
V
Primary current
A
Secondary current
A
Load
W
R
Ω
L
H
Z
Ω
%Error
%
Secondary burden
due to loadVA
MODEL GRAPH:
RESULT:

EXPT. NO. 14 MEASUREMENT OF IRON LOSS (MAXWELL BRIDGE)
AIM
To measure the iron loss of a given ring specimen
OBJECTIVE
3. To study about hysterisis loss
4. To study about eddy current loss
APPRATUS REQUIRED:
S.NO NAME OF THE APPRATUS RANGE TYPE QTY1234
Measurement of iron loss trainerRing SpecimenMultimeterCRO
THEORY:
FORMULAE USED:
1. Unknown resistance, R1=R2R3 / R4 (Ω)2. Unknown Inductance, L1=R2R3C4 Henry 3. Iron loss = I1
2 x (R1 – Rw) Where,
Rw is the winding resistance of the ring specimen measured using multimeter.

CIRCUIT DIAGRAM:
PROCEDURE:
9. Patch the circuit as per the circuit diagram
10. The pot 2(R4) is kept in the maximum position and R3 is selected as 10 Ω
initially.
11. The trainer kit is switched ON
12. Adjust pot 1 (R2) and obtain the null position in the CRO.
13. At the bridge balance condition note down the current I1 using multi meter(in
mA range selection) connected in series with R3 .
14. Switch OFF the trainer kit and note down the value of R2 and winding resistance
of ring specimen using multi meter.
15. Steps 3 to 6 are repeated for other two settings of R3.
16. The entire procedure is repeated for other samples of ring specimens provided in
the kit.

TABULAR COLUMN: R4 = __________ (Ω)
S.No. Specimen
No.
R2 (Ω) R3(Ω) I1 (mA) RW(Ω) R1(Ω) L1(H) Iron loss
(W)
1. 1 10
2. 100
3. 1000
4. 2 10
5. 100
6. 1000
7. 3 10
8. 100
9. 1000
RESULT:

Faculty Name : Mrs. P.T. SUBASINI Designation: LECTURER
Department : E.E.E. Faculty Code : EE 41
Subject Name : M & I Laboratory Subject Code : 131353
Year : II Semester : III
Degree & Branch : B.E. – E.E.E. Batch : B1
MEASUREMENTS AND INSTRUMENTATION LABORATORY –131353
LIST OF EXPERIMENTS

S.NO TITLE PAGE NO
1MEASUREMENT OF RESISTANCE USING
WHEATSTONE BRIDGE2 MEASUREMENT OF RESISTANCE USING
KELVIN’S DOUBLE BRIDGE.3 MEASUREMENT OF CAPACITANCE USING
SCHERING BRIDGE.4 MEASUREMENT OF INDUCTANCE USING
MAXWELLS BRIDGE.5 CALIBRATION OF 1 ENERGYMETER.
6 MEASUREMENT OF 3 PHASE POWER AND POWER FACTOR
7 INSTRUMENTATION AMPLIFIER.
8 STUDY OF DISPLACEMENT TRANSDUCER - LVDT
9 STUDY OF PRESSURE TRANSDUCER
10 A/D CONVERTER
11 D/A CONVERTER
12 STUDY OF TRANSIENTS
13 CALIBRATION OF CURRENT TRANSFORMER
14 MEASUREMENT OF IRON LOSS (MAXWELL BRIDGE)
EXPT. NO. 1 MEASUREMENT OF RESISTANCE USING WHEATSTONE BRIDGE
AIM:
To measure the given medium resistance using Wheatstone bridge.
OBJECTIVE:
To study the working of bridge under balanced and unbalanced condition and to
study the sensitivity of bridge.
APPARATUS REQUIRED:
SL.NO
NAME OF THE APPRATUS
RANGE TYPE QTY
1234
Wheat stone Bridge kitUnknown resistanceMultimeterConnecting Wires.
CIRCUIT DIAGRAM:
THEORY:
FORMULAE USED: Unknown Resistance, Rx = (P/Q) S ()

Where P, Q = Ratio Arms. S = Variable resistance, Rx = Unknown resistance.
PROCEDURE:1. The resistance to be measured is connected between XX points in the bridge kit.2. The P/Q ratio (multiplier) is initially kept at position ‘1’ and the deflection of the galvanometer is observed by pressing both the battery and the galvanometer keys.3. The S arm (X 1000) is adjusted and two positions are identified for which the deflection of the galvanometer is on either side of the null point and kept at the lowest value of S. Then the x100, x10, x1 knobs of S are adjusted to get null deflection. If necessary the sensitivity knob may be adjusted to get appreciable deflection. [If not possible P/Q ratio is kept at any other suitable value ie, any one of ratios provided.]4. The value of unknown resistance is read. (S value)5. Steps 3 and 4 are repeated for some other P/Q ratio. The mean value is taken.6. The experiment is repeated with other samples provided.
NOTE: The above experiment may be used for measuring resistance of the samples less than 1 to greater than 10k with lesser sensitivity.
TABULAR COLUMN:
S.NO SAMPLE P/Q RATIO(MULTIPLIER)
S VALUE ()
UNKNOWNRESISTANCE RX ()
CALCULATION:
RESULT:
EXPT. NO. 2 MEASUREMENT OF RESISTANCE USING KELVIN’S DOUBLE BRIDGE
AIM:
To measure the given low resistance using Kelvin’s double bridge method.
OBJECTIVE:
To study the working of bridge under balanced and unbalanced condition and to
study the sensitivity of bridge.
APPARATUS REQUIRED:
SL.NO
NAME OF THE APPRATUS
RANGE TYPE QTY
1234
Kelvin Double bridge kit Unknown resistanceMultimeterConnecting Wires
CIRCUIT DIAGRAM:
THEORY:

FORMULA USED: Rx = (P/Q) S ohms Where P, Q first set of ratio arms. p, q Second set of ratio arms. S Standard resistance, Rx unknown resistance.
PROCEDURE:
1. The resistance to be measured is connected such that the leads from +C and + P are connected to one end and those from –C and –P are connected to the other end in the kit.2. The P/Q ratio (multiplier) is initially kept at position ‘1’ and the deflection of the galvanometer is observed by pressing the galvanometer key.3. The ‘S’ arm (main dial) is adjusted and two positions are identified for which the deflection of the galvanometer is on either side of the null point. [If not some other P/Q ratio is to be tried].4. The lowest of the two position indicates the coarse value of the unknown resistance and the null point is obtained by adjusting the Vernier scale, with the galvanometer sensitivity knob at the maximum position.5. The value of unknown resistance is read. [‘S’ Value]6. Steps 3, 4, 5 are repeated for some other P/Q ratio for the unknown resistance. The mean value is taken.7. The above procedure is repeated with another sample.
TABULAR COLUMN:
S.NO
SAMPLE P/Q RATIO(Multiplier)
S VALUECOARSE() FINE ( )
UNKNOWN RESISTANCERx ()
.CALCULATION:
RESULT: EXPT. NO. 3 MEASUREMENT OF CAPACITANCE USING
SCHERING BRIDGE

AIM:
To measure the unknown capacitance using Schering bridge.
OBJECTIVE:
To measure the unknown capacitance and to study about dissipation factor.
APPARATUS REQUIRED:
SL.NO
NAME OF THE APPRATUS
RANGE TYPE QTY
12345
Schering Bridge kit Unknown capacitanceMultimeterConnecting WiresCRO
CIRCUIT DIAGRAM:
THEORY:

FORMULA USED:
1. Unknown capacitance, Cx = (R1/R2) C3,Where C3 is known capacitance in µF
R2 is Non-Inductive Variable Resistor 2. Dissipation factor, D = ω R1 C1 = ω Rx Cx
PROCEDURE:
19. The oscillator AB and the bridge AB terminals are connected.20. From the CD terminals of the bridge, the detector (loudspeaker) is connected
through an imbalance amplifier.21. Connections of the bridge arm are made as per the circuit diagram.22. The value of R2 is selected arbitrarily (say1K) and R1 is kept at maximum
position.23. The kit is switched on and R1 is decreased until the null point is observed as a dip
in the sound from the loudspeaker.24. The capacitor C1 can be varied for fine balance adjustment.25. When the balance condition is reached, the trainer kit is switched OFF and the
value R1 is measured using a multimeter.26. The value of unknown capacitance and dissipation factor is calculated.27. The experiment is repeated for various samples provided.
TABULAR COLUMN:
S.NO SAMPLE R2 () R1 () UNKNOWN CAPACITANCE Cx (µF)
CALCULATION:
RESULT:
EXPT. NO. 4 MEASUREMENT OF INDUCTANCE USING MAXWELLS BRIDGE

AIM:To find the unknown inductance and Q factor of a given coil.
OBJECTIVE:To find the unknown inductance of the given coil using bridge circuit and to study that Maxwell inductance- capacitance bridge is suitable for the measurement of low Q coils.
APPARATUS REQUIRED:
SL.NO
NAME OF THE APPRATUS
RANGE TYPE QTY
1
23456
Maxwell’s inductance Capacitance Bridge kit Unknown InductanceMultimeterConnecting WiresCROBridge oscillator 1 kHZ
CIRCUIT DIAGRAM:
THEORY:
FORMULAE USED:
1. Unknown resistance, R1=R2R3 / R4 (Ω)
R3L1
R1
R2R4
C4D

2. Unknown Inductance, L1=R2R3C4 Henry Thus we have two variables R4 and C4 which appears in one of the two balance equation and hence the two equations are independent, and balance is obtained by varying R4 and C4 alternately.
3. Quality factor, Q = ωL1 / R1 = ωC4R4
PROCEDURE:15. The inductance to be measured is connected between L1 terminal of the kit.16. The bridge oscillator is set for 10Vpp, 1 kHz and connected to the OSC terminal
of the kit.17. The detector CRO or headphone is connected to the headphone terminal of the kit.18. The R4 and C4 are adjusted from the highest range (among the 3 range knobs) to
obtain the null point in the detector. [ Null point – For increase in R4 and C4 values the point at which the amplitude reduces to a minimum and then increases is null point).
19. At the null point the values of R4 and C4 are noted.20. The value of unknown resistance, inductance and quality factor are calculated.21. The experiment is repeated with other samples provided.
TABULAR COLUMN:
S.NO SAMPLE R4(Ω) C4 (F) UNKNOWN INDUCTANCE(H)
CALCULATION:
RESULT:
EXPT. NO. 5 CALIBRATION OF SINGLE PHASE ENERGYMETER
AIM:
To calibrate the given single phase energy meter at unity and other power factors

OBJECTIVE:
7. To study the working of energy meter.
8. To accurately calibrate the meter at unity and other power factor.
9. To study the % of error for the given energy meter.
APPARATUS REQUIRED:
SL.NO
NAME OF THE APPRATUS
RANGE TYPE QTY
123456
Energy meterWattmeterAmmeter VoltmeterStop watchConnecting Wires
CIRCUIT DIAGRAM:
NAME PLATE DETAILS:
RATED CURRENT
RATED VOLTAGE
FREQUENCY
REVOLUTIONS/KWH

THEORY:
FORMULAE USED: Let x revolution / kwh be the rating.Now x revolution = 1 kwh
= 1* 3600*1000 watt-sec.Constant k of energymeter = 3600 * 103/ x watt-secFor each load, indicated power Wi is given as Wi = k/t watts
WhereK= energy meter constant (watt-sec)t = time for 1 revolution(sec)
% error = Wi – Wa / Wi * 100Where Wi is indicated power in watts
Wa is actual power shown by wattmeter in watts
% error can be zero +ve or –ve.
PROCEDURE:
1. Connections are given as shown in the circuit diagram.2. Supply is switched ON and load is increased in steps, each time noting the readings of ammeter and wattmeter. Also the actual time taken for 1 revolution of the disc is measured using stop watch.3. Step 2 is repeated till rated current of the energy meter is reached.4. % error is calculated and calibration curve is drawn.
TABULAR COLUMN:
S.NO LOAD CURRENT I (Amps)
WATTMETERREADING, Wa (W)
INDICATEDPOWER, Wi (W)
Time taken , t (secs)
% ERROR

CALCULATION:
MODEL GRAPH:
+Ve % Error 0 Wi
-Ve
NOTE:From the calibration curve it is possible to predict the error in recording the
energy. So the correction can be applied to the energy meter reading so that correct energy reading can be obtained and used.
RESULT:
EXPT. NO. 6 MEASUREMENT OF THREE PHASE POWER AND POWER FACTOR
AIM
To conduct a suitable experiment on a 3-phase load connected in star or delta to measure the three phase power and power factor using 2 wattmeter method.
OBJECTIVES
9. To study the working of wattmeter
10. To accurately measure the 3 phase power
11. To accurately measure the power factor
12. To study the concept of star connected load and delta connected load
APPARATUS REQUIRED:
S.NO NAME OF THE APPRATUS RANGE TYPE QTY12345
Ammeter VoltmeterWattmeter Connecting Wires3 phase inductive load
CIRCUIT DIAGRAM:
THEORY:

FORMULA USED:
5. Total power, P = W1+W2 (W)6. = Tan-1 3 [(W1-W2) /(W1+W2)]3. P.F = Cos
PROCEDURE:
5. Connection are made as per the circuit diagram, keeping the inductive load in the initial position.
6. Supply switch is closed and reading of ammeter and wattmeter are noted .If one of the wattmeter reads negative, then its potential coils (C and V) are interchanged and
reading is taken as negative.3. The above procedure is repeated for different values of inductive coil. Care should be taken that current should not exceed 10A during the experiment.
TABULAR COLUMN:
S.NO I W1 W2 POWER, P P.F Cos
(Amps) (Watts) (Watts) (Watts)
CALCULATION:
RESULT:
EXPT. NO. 7 INSTRUMENTATION AMPLIFIER.
AIM: To study the working of instrumentation amplifier.

OBJECTIVE:
5. To study the characteristic of operational amplifier.
6. To study the use of operational amplifier as instrumentation amplifier.
APPARATUS REQUIRED:
S.NO NAME OF THE APPRATUS RANGE TYPE QTY1234
Instrumentation Amplifier KitDual RPS Multi meterConnecting Wires
PIN DIAGRAM:PIN DIAGRAM OF IC741
CIRCUIT DIAGRAM:
R1 = R2 = R
THEORY:
FORMULAE USED:3. Vo= (V2 – V1) (1 + 2R / Rg)
PROCEDURE:
7. Connect a dual RPS to the input terminals V1 and V2 of either channel 1 or channel 2 of instrumentation amplifier module.
8. Adjust the RPS for different voltages for V1 and V2 (not more than 10 V).9. Measure the output voltage using a multi meter for every set of V1 and V2.
TABULAR COLUMN:
V1 (v) V2 (v) Vout (v)
RESULT:EXPT. NO. 8 STUDY OF DISPLACEMENT TRANSDUCER - LVDT
AIM
To study the operation of LVDT- Linear Variable Differential Transformer

OBJECTIVE:
5. To study the basic principle of LVDT.
6. Study of signal conditioning circuit.
3. Study of LVDT as transducer.
APPARATUS REQUIRED:
S.NO NAME OF THE APPRATUS RANGE TYPE QTY1234
LVDT kitMultimeterConnecting Wires
THEORY:
CIRCUIT DIAGRAM:
Fig.1

Fig.2
PATCHING DIAGRAM:

PROCEDURE:17. The trainer is switched and power supply is checked for +12V and -12Vwith the
help of multi meter.18. The trainer is switched off and connections are made as per the patching diagram.19. The LVDT is connected in the kit through connector provided in the circuit.20. The displacement of LVDT is kept at one end by using screw guage.21. The trainer is switched on and the output DC voltage is measured using
multimeter by connecting it across DC output + and – respectively.22. The displacement is varied with the help of screw gauge and the corresponding
output voltages are noted down.23. The screw gauge is adjusted for maximum displacement and then stopped.24.A graph between displacement and output voltage is drawn.
TABULAR COLUMN:
S.NO DISPLACEMENT ONMICRO-METER (mm)
MULTIMETER READING (Volts)
MODEL GRAPH:
RESULT:

EXPT. NO 9 STUDY OF PRESSURE TRANSDUCER
AIM
To study the operation of a pressure transducer – Strain gauge.
OBJECTIVES
5. To study the basic principle of Strain gauge.
6. Study of Strain gauge as transducer.
APPARATUS REQUIRED:S.NO NAME OF THE APPARATUS RANGE TYPE QUANTITY 12
Pressure measurement module Multimeter
THEORY:
FORMULAE USED:
% Error = [(Gauge pressure – displayed pressure) / displayed pressure] * 100
PROCEDURE:
11. Install the pressure cell setup and interface the 9 pin D connector with the pressure measurement module. Switch ON the module.
12. Calibrate the pressure measurement module by the following procedure. Open the air release valve and exhaust the tank inlet air and nullify the output voltage by using zero adjustment pot, then close the air release valve and apply 20 Psi pressure to the cylinder and adjust the display to 20 Psi by using gain adjustment POT.
13. After calibration open the air release valve and exhaust the tank inlet air.14. Close the air release valve and press the pump piston and note down the bridge
voltage in mV across T2 and T3, output voltage in V across T5 and GND and the displayed pressure in Psi in the indicator. Repeat the procedure for increasing values of pressure and tabulate the readings.(Pressure should not exceed 20 Psi)
15. Plot the error calibration curve.
CIRCUIT DIAGRAM:
TABULAR COLUMN:
S. No. Gauge Pressure (Psi)
Displayed Pressure (Psi)
Bridge Voltage (mV)
Output Voltage (V)
%Error
MODEL GRAPH:
RESULT:

EXPT. NO 10 A/D CONVERTER
AIM
To study the working of successive approximation type Analog to Digital converter.
OBJECTIVE
5. To study the conversion of analog i/p voltage to digital o/p voltage.
6. To study the operation and characteristics of operational amplifier.
APPARATUS REQUIRED:
S.NO NAME OF THE APPARATUS RANGE TYPE QUANTITY 1234
A/D Converter kitRPS MultimeterConnecting Wires
THEORY:
FORMULAE USED:
Input voltage, Vin = Vref [D7 2-1 + D6 2-2 + D5 2-3 + ………. + D0 2-8]Where,
Vref = Reference voltageD7, D6,D5,……D0 = 8 bit digital outputD7 - MSB of digital dataD0 – LSB of digital data
CIRCUIT DIAGRAM:

TABULAR COLUMN:
Reference Voltage –
SW1 =0 SW2 = 1 SW3=1
Analog input voltage Digital output
Theoretical Practical D7 D6 D5 D4 D3 D2 D1 D0
PROCEDURE:
13. The channel 3 is selected by using switches SW1, SW2, SW3 by keeping them in 011 position.
14. Vref is measured using multi meter across pin 6 and 1 by keeping the pot at maximum position.
15. The analog voltage to be converted is set by using the pot and the voltage set is measured by using multi meter.
16. The ALE switch SW5 is pressed once to send the data to SAR.

17. The SOC switch SW4 is pressed once to obtain the digital data for the given input voltage. The digital output obtained is noted.
18. The procedure is repeated from step 2 for various values of analog input voltage.
RESULT:
EXPT. NO. 11 D/A CONVERTER

AIM
To study the working of an 8 bit weighted resistor type Digital to Analog
converter.
OBJECTIVE
5. To study the conversion of binary voltage to analog o/p voltage
6. To study the operation and characteristics of operational amplifier
APPRATUS REQUIRED:
S.NO NAME OF THE APPRATUS RANGE TYPE QTY1234
D/A Converter kitRPS MultimeterConnecting Wires
THEORY:
FORMULAE USED:
Eo = Vref [(2 Xo – 255) / 256]Where Xo is the equivalent decimal value of the given digital output.
CIRCUIT DIAGRAM:

PROCEDURE:
11. The connections are made as per the circuit diagram.
12. Vref is measured across P2 terminal by keeping the pot knob in maximum position.
13. The binary input is applied by closing the appropriate switches.
14. The analog output across P2 terminal by using multi meter.
15. The procedure is repeated for various binary input values.
TABULAR COLUMN:
S.No. Digital Input Analog outputBinary Decimal equivalent Theoretical Practical
RESULT:
EXPT.NO. 12 STUDY OF TRANSIENTS

(e) RC TRANSIENTS:
AIM
To Observe and plot the transients waveform for a series RC circuit and compute
the time constant.
OBJECTIVE
5. To study the transient behaviour of the given system
6. To study the effects of transients
APPRATUS REQUIRED:
S.NO NAME OF THE APPRATUS RANGE TYPE QTY12345
Resistance CapacitanceSignal Generator CRO & ProbesBred board & Connecting Wires
NOTE
Choose the frequency (f) in signal generator such that f < (4τ -1 where τ =RC
CIRCUIT DIAGRAM:
PROCEDURE:
7. Connections are made as per the circuit diagram.
8. Signal generator is adjusted for an input of 10 Vpp square wave and designed
frequency and then applied to the circuit.
9. The voltage across resistor , VR = Ve- t/RC is observed in the CRO and the time
taken by the output to reach 36.8% of its final value (discharging time) is noted.
MODEL GRAPH:
RESULT:

(f) RL TRANSIENTS:
AIM:
To observe and plot the transient waveform for a series RL circuit and to compute
the time constant
OBJECTIVE
1. To study the transient behavior of the given system
2. To study the effects of transients
APPRATUS REQUIRED:
S.NO NAME OF THE APPRATUS RANGE TYPE QTY12345
Resistance Inductor Signal Generator CRO & ProbesBred board & Connecting Wires
NOTE
Choose the frequency (f) in signal generator such that f < (4 τ)-1 where τ =L/R
CIRCUIT DIAGRAM:
PROCEDURE:
7. Connections are made as per the circuit diagram.
8. Signal generator is adjusted for an input of 10 Vpp square wave and designed
frequency and then applied to the circuit.

9. The voltage across resistor , VR =V ( 1 - e- tR/L) is observed in the CRO and the
time taken by the output to reach 63.2% of its final value (charging time) is noted.
MODEL GRAPH:
RESULT:

EXPT. NO. 13 CALIBRATION OF CURRENT TRANSFORMER
AIM
To study the working of current transformer
OBJECTIVE
7. To study the current transformation concept
8. To study the efficiency of a given current transformer
9. To study the loss components in the circuit
APPRATUS REQUIRED:
S.NO NAME OF THE APPRATUS RANGE TYPE QTY1234
Current Transformer VoltmeterAmmeterResistive Load
THEORY:
FORMULAE USED:
% Ratio error =[( nominal ratio – actual ratio) / actual ratio] x 100
= [ (Kn - Kact) / Kact ]Where
Kact = magnitude of actual primary current / magnitude of actual secondary current Kn = rated primary current / rated secondary current
Inductive reactance in Ω, XL = 2πfLWhere L is inductance of CT secondary in H
Impedance in Ω, Z = √ R2 + XL2
Secondary burden due to load, VA = I2 Z
PRECAUTIONS:
5. SPST 1 and SPST 2 should be kept closed before switching ON the supply.6. SPST2 should be opened before applying the load.

CIRCUIT DIAGRAM:
PROCEDURE:11. Connections are made as per the circuit diagram.12. DPST is closed on the primary side and no load voltage and current are noted.13. SPST 2 is opened and then load is applied in steps. For each load applied, line
voltage, primary current, secondary current, and load values are noted down. Also resistance and inductance values of CT secondary are measured using LCR meter.
14. The % error and secondary burden due to lad are calculated. 15. A graph is drawn between primary current and secondary current is drawn.
TABULAR COLUMN:
S. No
Line voltage
V
Primary current
A
Secondary current
A
Load
W
R
Ω
L
H
Z
Ω
%Error
%
Secondary burden
due to loadVA
MODEL GRAPH:
RESULT:
EXPT. NO. 14 MEASUREMENT OF IRON LOSS (MAXWELL BRIDGE)
AIM
To measure the iron loss of a given ring specimen
OBJECTIVE
5. To study about hysterisis loss
6. To study about eddy current loss
APPRATUS REQUIRED:
S.NO NAME OF THE APPRATUS RANGE TYPE QTY1234
Measurement of iron loss trainerRing SpecimenMultimeterCRO
THEORY:
FORMULAE USED:
1. Unknown resistance, R1=R2R3 / R4 (Ω)2. Unknown Inductance, L1=R2R3C4 Henry 3. Iron loss = I1
2 x (R1 – Rw) Where,
Rw is the winding resistance of the ring specimen measured using multimeter.

CIRCUIT DIAGRAM:
PROCEDURE:
17. Patch the circuit as per the circuit diagram
18. The pot 2(R4) is kept in the maximum position and R3 is selected as 10 Ω
initially.
19. The trainer kit is switched ON
20. Adjust pot 1 (R2) and obtain the null position in the CRO.
21. At the bridge balance condition note down the current I1 using multi meter(in
mA range selection) connected in series with R3 .
22. Switch OFF the trainer kit and note down the value of R2 and winding resistance
of ring specimen using multi meter.
23. Steps 3 to 6 are repeated for other two settings of R3.
24. The entire procedure is repeated for other samples of ring specimens provided in
the kit.

TABULAR COLUMN: R4 = __________ (Ω)
S.No. Specimen
No.
R2 (Ω) R3(Ω) I1 (mA) RW(Ω) R1(Ω) L1(H) Iron loss
(W)
1. 1 10
2. 100
3. 1000
4. 2 10
5. 100
6. 1000
7. 3 10
8. 100
9. 1000
RESULT:

Faculty Name : Mrs. R. N. Ponnalagu Designation : Assistant Professor
Department : E.E.E. Faculty Code : EE 06
Subject Name : M & I Laboratory Subject Code : 131353
Year : II Semester : III
Degree & Branch : B.E. – E.E.E. Batch : B2
MEASUREMENTS AND INSTRUMENTATION LABORATORY –131353

LIST OF EXPERIMENTS
S.NO TITLE PAGE NO
1MEASUREMENT OF RESISTANCE USING
WHEATSTONE BRIDGE2 MEASUREMENT OF RESISTANCE USING
KELVIN’S DOUBLE BRIDGE.3 MEASUREMENT OF CAPACITANCE USING
SCHERING BRIDGE.4 MEASUREMENT OF INDUCTANCE USING
MAXWELLS BRIDGE.5 CALIBRATION OF 1 ENERGYMETER.
6 MEASUREMENT OF 3 PHASE POWER AND POWER FACTOR
7 INSTRUMENTATION AMPLIFIER.
8 STUDY OF DISPLACEMENT TRANSDUCER - LVDT
9 STUDY OF PRESSURE TRANSDUCER
10 A/D CONVERTER
11 D/A CONVERTER
12 STUDY OF TRANSIENTS
13 CALIBRATION OF CURRENT TRANSFORMER
14 MEASUREMENT OF IRON LOSS (MAXWELL BRIDGE)

EXPT. NO. 1 MEASUREMENT OF RESISTANCE USING WHEATSTONE BRIDGE
AIM:
To measure the given medium resistance using Wheatstone bridge.
OBJECTIVE:
To study the working of bridge under balanced and unbalanced condition and to
study the sensitivity of bridge.
APPARATUS REQUIRED:
SL.NO
NAME OF THE APPRATUS
RANGE TYPE QTY
1234
Wheat stone Bridge kitUnknown resistanceMultimeterConnecting Wires.
CIRCUIT DIAGRAM:
THEORY:

FORMULAE USED: Unknown Resistance, Rx = (P/Q) S ()
Where P, Q = Ratio Arms. S = Variable resistance, Rx = Unknown resistance.
PROCEDURE:1. The resistance to be measured is connected between XX points in the bridge kit.2. The P/Q ratio (multiplier) is initially kept at position ‘1’ and the deflection of the galvanometer is observed by pressing both the battery and the galvanometer keys.3. The S arm (X 1000) is adjusted and two positions are identified for which the deflection of the galvanometer is on either side of the null point and kept at the lowest value of S. Then the x100, x10, x1 knobs of S are adjusted to get null deflection. If necessary the sensitivity knob may be adjusted to get appreciable deflection. [If not possible P/Q ratio is kept at any other suitable value ie, any one of ratios provided.]4. The value of unknown resistance is read. (S value)5. Steps 3 and 4 are repeated for some other P/Q ratio. The mean value is taken.6. The experiment is repeated with other samples provided.
NOTE: The above experiment may be used for measuring resistance of the samples less than 1 to greater than 10k with lesser sensitivity.
TABULAR COLUMN:
S.NO SAMPLE P/Q RATIO(MULTIPLIER)
S VALUE ()
UNKNOWNRESISTANCE RX ()
CALCULATION:
RESULT:

EXPT. NO. 2 MEASUREMENT OF RESISTANCE USING KELVIN’S DOUBLE BRIDGE
AIM:
To measure the given low resistance using Kelvin’s double bridge method.
OBJECTIVE:
To study the working of bridge under balanced and unbalanced condition and to
study the sensitivity of bridge.
APPARATUS REQUIRED:
SL.NO
NAME OF THE APPRATUS
RANGE TYPE QTY
1234
Kelvin Double bridge kit Unknown resistanceMultimeterConnecting Wires
CIRCUIT DIAGRAM:
THEORY:

FORMULA USED: Rx = (P/Q) S ohms Where P, Q first set of ratio arms. p, q Second set of ratio arms. S Standard resistance, Rx unknown resistance.
PROCEDURE:
1. The resistance to be measured is connected such that the leads from +C and + P are connected to one end and those from –C and –P are connected to the other end in the kit.2. The P/Q ratio (multiplier) is initially kept at position ‘1’ and the deflection of the galvanometer is observed by pressing the galvanometer key.3. The ‘S’ arm (main dial) is adjusted and two positions are identified for which the deflection of the galvanometer is on either side of the null point. [If not some other P/Q ratio is to be tried].4. The lowest of the two position indicates the coarse value of the unknown resistance and the null point is obtained by adjusting the Vernier scale, with the galvanometer sensitivity knob at the maximum position.5. The value of unknown resistance is read. [‘S’ Value]6. Steps 3, 4, 5 are repeated for some other P/Q ratio for the unknown resistance. The mean value is taken.7. The above procedure is repeated with another sample.
TABULAR COLUMN:
S.NO
SAMPLE P/Q RATIO(Multiplier)
S VALUECOARSE() FINE ( )
UNKNOWN RESISTANCERx ()
.CALCULATION:
RESULT:
EXPT. NO. 3 MEASUREMENT OF CAPACITANCE USING
SCHERING BRIDGE
AIM:
To measure the unknown capacitance using Schering bridge.
OBJECTIVE:
To measure the unknown capacitance and to study about dissipation factor.
APPARATUS REQUIRED:
SL.NO
NAME OF THE APPRATUS
RANGE TYPE QTY
12345
Schering Bridge kit Unknown capacitanceMultimeterConnecting WiresCRO
CIRCUIT DIAGRAM:
THEORY:
FORMULA USED:
1. Unknown capacitance, Cx = (R1/R2) C3,Where C3 is known capacitance in µF
R2 is Non-Inductive Variable Resistor 2. Dissipation factor, D = ω R1 C1 = ω Rx Cx
PROCEDURE:
28. The oscillator AB and the bridge AB terminals are connected.29. From the CD terminals of the bridge, the detector (loudspeaker) is connected
through an imbalance amplifier.30. Connections of the bridge arm are made as per the circuit diagram.31. The value of R2 is selected arbitrarily (say1K) and R1 is kept at maximum
position.32. The kit is switched on and R1 is decreased until the null point is observed as a dip
in the sound from the loudspeaker.33. The capacitor C1 can be varied for fine balance adjustment.34. When the balance condition is reached, the trainer kit is switched OFF and the
value R1 is measured using a multimeter.35. The value of unknown capacitance and dissipation factor is calculated.36. The experiment is repeated for various samples provided.
TABULAR COLUMN:
S.NO SAMPLE R2 () R1 () UNKNOWN CAPACITANCE Cx (µF)
CALCULATION:
RESULT:

EXPT. NO. 4 MEASUREMENT OF INDUCTANCE USING MAXWELLS BRIDGE
AIM:To find the unknown inductance and Q factor of a given coil.
OBJECTIVE:To find the unknown inductance of the given coil using bridge circuit and to study that Maxwell inductance- capacitance bridge is suitable for the measurement of low Q coils.
APPARATUS REQUIRED:
SL.NO
NAME OF THE APPRATUS
RANGE TYPE QTY
1
23456
Maxwell’s inductance Capacitance Bridge kit Unknown InductanceMultimeterConnecting WiresCROBridge oscillator 1 kHZ
CIRCUIT DIAGRAM:
THEORY:
R3L1
R1
R2R4
C4D

FORMULAE USED:
1. Unknown resistance, R1=R2R3 / R4 (Ω)2. Unknown Inductance, L1=R2R3C4 Henry
Thus we have two variables R4 and C4 which appears in one of the two balance equation and hence the two equations are independent, and balance is obtained by varying R4 and C4 alternately.
3. Quality factor, Q = ωL1 / R1 = ωC4R4
PROCEDURE:22. The inductance to be measured is connected between L1 terminal of the kit.23. The bridge oscillator is set for 10Vpp, 1 kHz and connected to the OSC terminal
of the kit.24. The detector CRO or headphone is connected to the headphone terminal of the kit.25. The R4 and C4 are adjusted from the highest range (among the 3 range knobs) to
obtain the null point in the detector. [ Null point – For increase in R4 and C4 values the point at which the amplitude reduces to a minimum and then increases is null point).
26. At the null point the values of R4 and C4 are noted.27. The value of unknown resistance, inductance and quality factor are calculated.28. The experiment is repeated with other samples provided.
TABULAR COLUMN:
S.NO SAMPLE R4(Ω) C4 (F) UNKNOWN INDUCTANCE(H)
CALCULATION:
RESULT:
EXPT. NO. 5 CALIBRATION OF SINGLE PHASE ENERGYMETER
AIM:
To calibrate the given single phase energy meter at unity and other power factors
OBJECTIVE:
10. To study the working of energy meter.
11. To accurately calibrate the meter at unity and other power factor.
12. To study the % of error for the given energy meter.
APPARATUS REQUIRED:
SL.NO
NAME OF THE APPRATUS
RANGE TYPE QTY
123456
Energy meterWattmeterAmmeter VoltmeterStop watchConnecting Wires
CIRCUIT DIAGRAM:
NAME PLATE DETAILS:
RATED CURRENT
RATED VOLTAGE
FREQUENCY
REVOLUTIONS/KWH

THEORY:
FORMULAE USED: Let x revolution / kwh be the rating.Now x revolution = 1 kwh
= 1* 3600*1000 watt-sec.Constant k of energymeter = 3600 * 103/ x watt-secFor each load, indicated power Wi is given as Wi = k/t watts
WhereK= energy meter constant (watt-sec)t = time for 1 revolution(sec)
% error = Wi – Wa / Wi * 100Where Wi is indicated power in watts
Wa is actual power shown by wattmeter in watts
% error can be zero +ve or –ve.
PROCEDURE:
1. Connections are given as shown in the circuit diagram.2. Supply is switched ON and load is increased in steps, each time noting the readings of ammeter and wattmeter. Also the actual time taken for 1 revolution of the disc is measured using stop watch.3. Step 2 is repeated till rated current of the energy meter is reached.4. % error is calculated and calibration curve is drawn.
TABULAR COLUMN:

S.NO LOAD CURRENT I (Amps)
WATTMETERREADING, Wa (W)
INDICATEDPOWER, Wi (W)
Time taken , t (secs)
% ERROR
CALCULATION:
MODEL GRAPH:
+Ve % Error 0 Wi
-Ve
NOTE:From the calibration curve it is possible to predict the error in recording the
energy. So the correction can be applied to the energy meter reading so that correct energy reading can be obtained and used.
RESULT:
EXPT. NO. 6 MEASUREMENT OF THREE PHASE POWER AND POWER FACTOR
AIM

To conduct a suitable experiment on a 3-phase load connected in star or delta to measure the three phase power and power factor using 2 wattmeter method.
OBJECTIVES
13. To study the working of wattmeter
14. To accurately measure the 3 phase power
15. To accurately measure the power factor
16. To study the concept of star connected load and delta connected load
APPARATUS REQUIRED:
S.NO NAME OF THE APPRATUS RANGE TYPE QTY12345
Ammeter VoltmeterWattmeter Connecting Wires3 phase inductive load
CIRCUIT DIAGRAM:
THEORY:

FORMULA USED:
7. Total power, P = W1+W2 (W)8. = Tan-1 3 [(W1-W2) /(W1+W2)]3. P.F = Cos
PROCEDURE:
7. Connection are made as per the circuit diagram, keeping the inductive load in the initial position.
8. Supply switch is closed and reading of ammeter and wattmeter are noted .If one of the wattmeter reads negative, then its potential coils (C and V) are interchanged and
reading is taken as negative.3. The above procedure is repeated for different values of inductive coil. Care should be taken that current should not exceed 10A during the experiment.
TABULAR COLUMN:
S.NO I W1 W2 POWER, P P.F Cos
(Amps) (Watts) (Watts) (Watts)
CALCULATION:
RESULT:
EXPT. NO. 7 INSTRUMENTATION AMPLIFIER.
AIM:

To study the working of instrumentation amplifier.
OBJECTIVE:
7. To study the characteristic of operational amplifier.
8. To study the use of operational amplifier as instrumentation amplifier.
APPARATUS REQUIRED:
S.NO NAME OF THE APPRATUS RANGE TYPE QTY1234
Instrumentation Amplifier KitDual RPS Multi meterConnecting Wires
PIN DIAGRAM:PIN DIAGRAM OF IC741
CIRCUIT DIAGRAM:
R1 = R2 = R
THEORY:

FORMULAE USED:4. Vo= (V2 – V1) (1 + 2R / Rg)
PROCEDURE:
10. Connect a dual RPS to the input terminals V1 and V2 of either channel 1 or channel 2 of instrumentation amplifier module.
11. Adjust the RPS for different voltages for V1 and V2 (not more than 10 V).12. Measure the output voltage using a multi meter for every set of V1 and V2.
TABULAR COLUMN:
V1 (v) V2 (v) Vout (v)
RESULT:EXPT. NO. 8 STUDY OF DISPLACEMENT TRANSDUCER - LVDT
AIM
To study the operation of LVDT- Linear Variable Differential Transformer
OBJECTIVE:
7. To study the basic principle of LVDT.
8. Study of signal conditioning circuit.
3. Study of LVDT as transducer.
APPARATUS REQUIRED:
S.NO NAME OF THE APPRATUS RANGE TYPE QTY1234
LVDT kitMultimeterConnecting Wires
THEORY:
CIRCUIT DIAGRAM:
Fig.1

Fig.2
PATCHING DIAGRAM:

PROCEDURE:25. The trainer is switched and power supply is checked for +12V and -12Vwith the
help of multi meter.26. The trainer is switched off and connections are made as per the patching diagram.27. The LVDT is connected in the kit through connector provided in the circuit.28. The displacement of LVDT is kept at one end by using screw guage.29. The trainer is switched on and the output DC voltage is measured using
multimeter by connecting it across DC output + and – respectively.30. The displacement is varied with the help of screw gauge and the corresponding
output voltages are noted down.31. The screw gauge is adjusted for maximum displacement and then stopped.32.A graph between displacement and output voltage is drawn.
TABULAR COLUMN:
S.NO DISPLACEMENT ONMICRO-METER (mm)
MULTIMETER READING (Volts)
MODEL GRAPH:
RESULT:

EXPT. NO 9 STUDY OF PRESSURE TRANSDUCER
AIM
To study the operation of a pressure transducer – Strain gauge.
OBJECTIVES
7. To study the basic principle of Strain gauge.
8. Study of Strain gauge as transducer.
APPARATUS REQUIRED:S.NO NAME OF THE APPARATUS RANGE TYPE QUANTITY 12
Pressure measurement module Multimeter
THEORY:
FORMULAE USED:
% Error = [(Gauge pressure – displayed pressure) / displayed pressure] * 100
PROCEDURE:
16. Install the pressure cell setup and interface the 9 pin D connector with the pressure measurement module. Switch ON the module.
17. Calibrate the pressure measurement module by the following procedure. Open the air release valve and exhaust the tank inlet air and nullify the output voltage by using zero adjustment pot, then close the air release valve and apply 20 Psi pressure to the cylinder and adjust the display to 20 Psi by using gain adjustment POT.
18. After calibration open the air release valve and exhaust the tank inlet air.19. Close the air release valve and press the pump piston and note down the bridge
voltage in mV across T2 and T3, output voltage in V across T5 and GND and the displayed pressure in Psi in the indicator. Repeat the procedure for increasing values of pressure and tabulate the readings.(Pressure should not exceed 20 Psi)
20. Plot the error calibration curve.
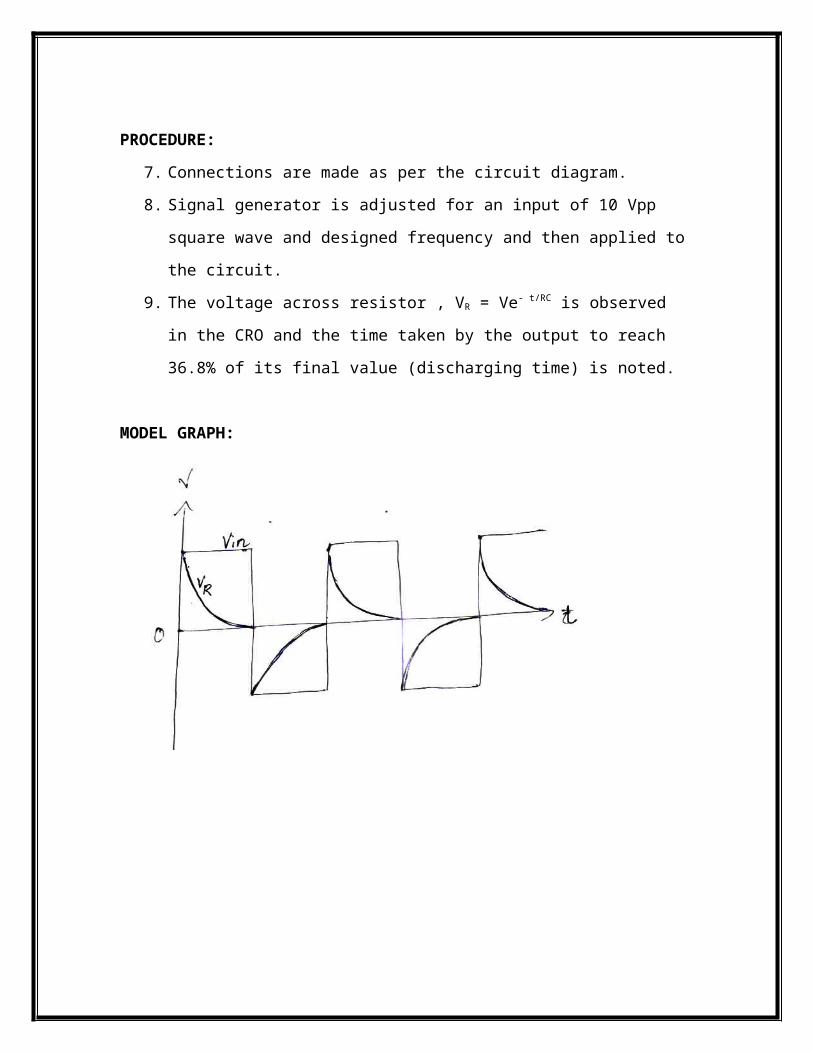
CIRCUIT DIAGRAM:
TABULAR COLUMN:
S. No. Gauge Pressure (Psi)
Displayed Pressure (Psi)
Bridge Voltage (mV)
Output Voltage (V)
%Error
MODEL GRAPH:
RESULT:

EXPT. NO 10 A/D CONVERTER
AIM
To study the working of successive approximation type Analog to Digital converter.
OBJECTIVE
7. To study the conversion of analog i/p voltage to digital o/p voltage.
8. To study the operation and characteristics of operational amplifier.
APPARATUS REQUIRED:
S.NO NAME OF THE APPARATUS RANGE TYPE QUANTITY 1234
A/D Converter kitRPS MultimeterConnecting Wires
THEORY:
FORMULAE USED:
Input voltage, Vin = Vref [D7 2-1 + D6 2-2 + D5 2-3 + ………. + D0 2-8]Where,
Vref = Reference voltageD7, D6,D5,……D0 = 8 bit digital outputD7 - MSB of digital dataD0 – LSB of digital data
CIRCUIT DIAGRAM:

TABULAR COLUMN:
Reference Voltage –
SW1 =0 SW2 = 1 SW3=1
Analog input voltage Digital output
Theoretical Practical D7 D6 D5 D4 D3 D2 D1 D0
PROCEDURE:
19. The channel 3 is selected by using switches SW1, SW2, SW3 by keeping them in 011 position.
20. Vref is measured using multi meter across pin 6 and 1 by keeping the pot at maximum position.
21. The analog voltage to be converted is set by using the pot and the voltage set is measured by using multi meter.
22. The ALE switch SW5 is pressed once to send the data to SAR.

23. The SOC switch SW4 is pressed once to obtain the digital data for the given input voltage. The digital output obtained is noted.
24. The procedure is repeated from step 2 for various values of analog input voltage.
RESULT:
EXPT. NO. 11 D/A CONVERTER

AIM
To study the working of an 8 bit weighted resistor type Digital to Analog
converter.
OBJECTIVE
7. To study the conversion of binary voltage to analog o/p voltage
8. To study the operation and characteristics of operational amplifier
APPRATUS REQUIRED:
S.NO NAME OF THE APPRATUS RANGE TYPE QTY1234
D/A Converter kitRPS MultimeterConnecting Wires
THEORY:
FORMULAE USED:
Eo = Vref [(2 Xo – 255) / 256]Where Xo is the equivalent decimal value of the given digital output.
CIRCUIT DIAGRAM:

PROCEDURE:
16. The connections are made as per the circuit diagram.
17. Vref is measured across P2 terminal by keeping the pot knob in maximum position.
18. The binary input is applied by closing the appropriate switches.
19. The analog output across P2 terminal by using multi meter.
20. The procedure is repeated for various binary input values.
TABULAR COLUMN:
S.No. Digital Input Analog outputBinary Decimal equivalent Theoretical Practical
RESULT:
EXPT.NO. 12 STUDY OF TRANSIENTS

(g) RC TRANSIENTS:
AIM
To Observe and plot the transients waveform for a series RC circuit and compute
the time constant.
OBJECTIVE
7. To study the transient behaviour of the given system
8. To study the effects of transients
APPRATUS REQUIRED:
S.NO NAME OF THE APPRATUS RANGE TYPE QTY12345
Resistance CapacitanceSignal Generator CRO & ProbesBred board & Connecting Wires
NOTE
Choose the frequency (f) in signal generator such that f < (4τ -1 where τ =RC
CIRCUIT DIAGRAM:
PROCEDURE:
10. Connections are made as per the circuit diagram.

11. Signal generator is adjusted for an input of 10 Vpp square wave and designed
frequency and then applied to the circuit.
12. The voltage across resistor , VR = Ve- t/RC is observed in the CRO and the time
taken by the output to reach 36.8% of its final value (discharging time) is noted.
MODEL GRAPH:
RESULT:

(h) RL TRANSIENTS:
AIM:
To observe and plot the transient waveform for a series RL circuit and to compute
the time constant
OBJECTIVE
1. To study the transient behavior of the given system
2. To study the effects of transients
APPRATUS REQUIRED:
S.NO NAME OF THE APPRATUS RANGE TYPE QTY12345
Resistance Inductor Signal Generator CRO & ProbesBred board & Connecting Wires
NOTE
Choose the frequency (f) in signal generator such that f < (4 τ)-1 where τ =L/R
CIRCUIT DIAGRAM:
PROCEDURE:
10. Connections are made as per the circuit diagram.
11. Signal generator is adjusted for an input of 10 Vpp square wave and designed
frequency and then applied to the circuit.

12. The voltage across resistor , VR =V ( 1 - e- tR/L) is observed in the CRO and the
time taken by the output to reach 63.2% of its final value (charging time) is noted.
MODEL GRAPH:
RESULT:

EXPT. NO. 13 CALIBRATION OF CURRENT TRANSFORMER
AIM
To study the working of current transformer
OBJECTIVE
10. To study the current transformation concept
11. To study the efficiency of a given current transformer
12. To study the loss components in the circuit
APPRATUS REQUIRED:
S.NO NAME OF THE APPRATUS RANGE TYPE QTY1234
Current Transformer VoltmeterAmmeterResistive Load
THEORY:
FORMULAE USED:
% Ratio error =[( nominal ratio – actual ratio) / actual ratio] x 100
= [ (Kn - Kact) / Kact ]Where
Kact = magnitude of actual primary current / magnitude of actual secondary current Kn = rated primary current / rated secondary current
Inductive reactance in Ω, XL = 2πfLWhere L is inductance of CT secondary in H
Impedance in Ω, Z = √ R2 + XL2
Secondary burden due to load, VA = I2 Z
PRECAUTIONS:
7. SPST 1 and SPST 2 should be kept closed before switching ON the supply.8. SPST2 should be opened before applying the load.

CIRCUIT DIAGRAM:
PROCEDURE:16. Connections are made as per the circuit diagram.17. DPST is closed on the primary side and no load voltage and current are noted.18. SPST 2 is opened and then load is applied in steps. For each load applied, line
voltage, primary current, secondary current, and load values are noted down. Also resistance and inductance values of CT secondary are measured using LCR meter.
19. The % error and secondary burden due to lad are calculated. 20. A graph is drawn between primary current and secondary current is drawn.
TABULAR COLUMN:
S. No
Line voltage
V
Primary current
A
Secondary current
A
Load
W
R
Ω
L
H
Z
Ω
%Error
%
Secondary burden
due to loadVA
MODEL GRAPH:
RESULT:
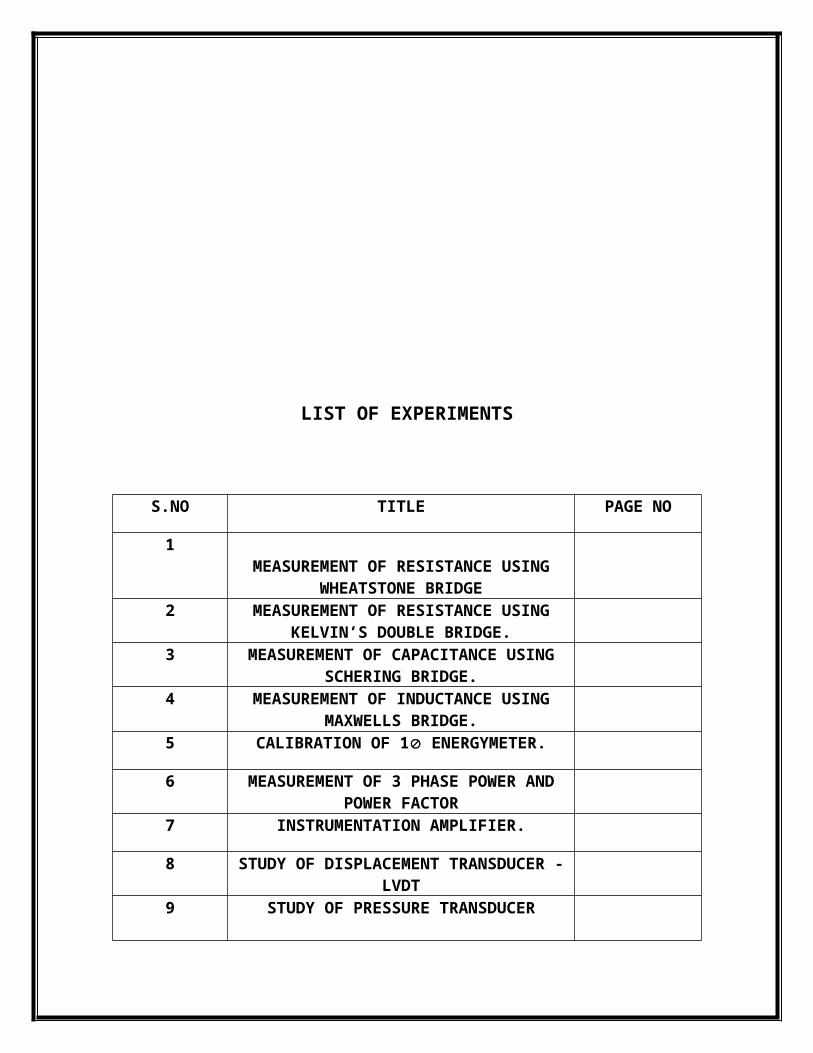
EXPT. NO. 14 MEASUREMENT OF IRON LOSS (MAXWELL BRIDGE)
AIM
To measure the iron loss of a given ring specimen
OBJECTIVE
7. To study about hysterisis loss
8. To study about eddy current loss
APPRATUS REQUIRED:
S.NO NAME OF THE APPRATUS RANGE TYPE QTY1234
Measurement of iron loss trainerRing SpecimenMultimeterCRO
THEORY:
FORMULAE USED:
1. Unknown resistance, R1=R2R3 / R4 (Ω)2. Unknown Inductance, L1=R2R3C4 Henry 3. Iron loss = I1
2 x (R1 – Rw) Where,
Rw is the winding resistance of the ring specimen measured using multimeter.

CIRCUIT DIAGRAM:
PROCEDURE:
25. Patch the circuit as per the circuit diagram
26. The pot 2(R4) is kept in the maximum position and R3 is selected as 10 Ω
initially.
27. The trainer kit is switched ON
28. Adjust pot 1 (R2) and obtain the null position in the CRO.
29. At the bridge balance condition note down the current I1 using multi meter(in
mA range selection) connected in series with R3 .
30. Switch OFF the trainer kit and note down the value of R2 and winding resistance
of ring specimen using multi meter.
31. Steps 3 to 6 are repeated for other two settings of R3.
32. The entire procedure is repeated for other samples of ring specimens provided in
the kit.
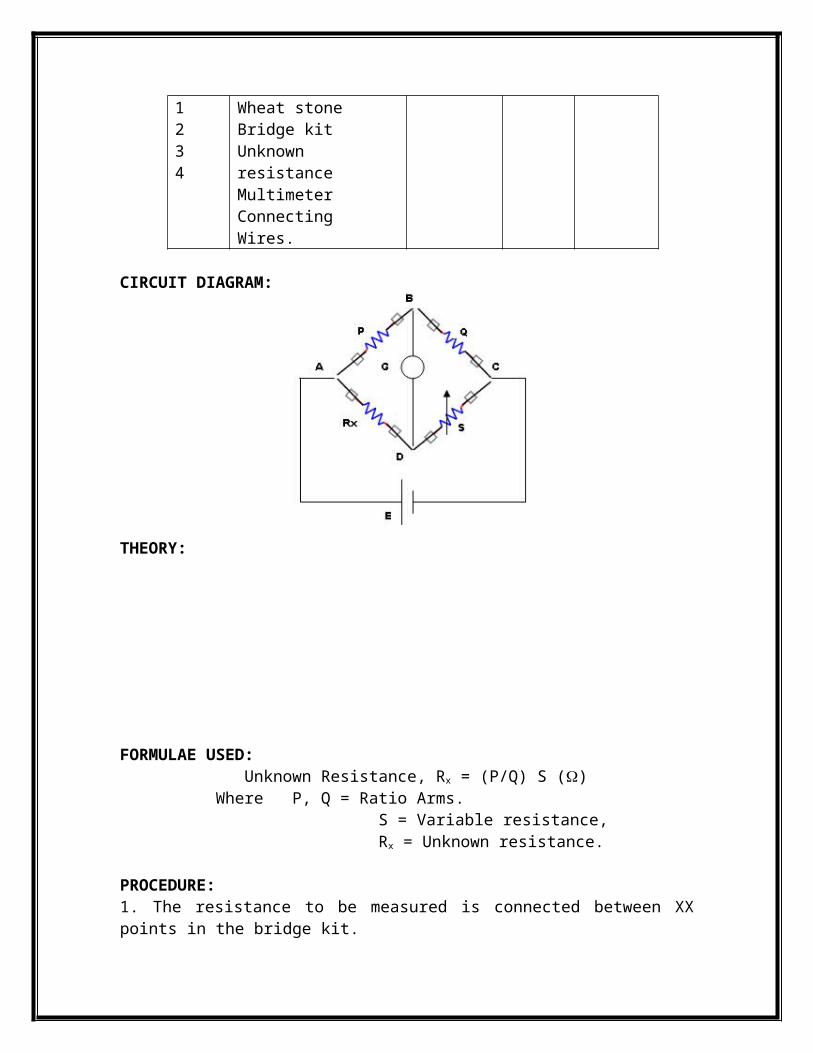
TABULAR COLUMN: R4 = __________ (Ω)
S.No. Specimen
No.
R2 (Ω) R3(Ω) I1 (mA) RW(Ω) R1(Ω) L1(H) Iron loss
(W)
1. 1 10
2. 100
3. 1000
4. 2 10
5. 100
6. 1000
7. 3 10
8. 100
9. 1000
RESULT:
Related Documents