Mean Observer Metamerism and the Selection of Display Primaries Mark D. Fairchild & David R. Wyble RIT Munsell Color Science Laboratory

Welcome message from author
This document is posted to help you gain knowledge. Please leave a comment to let me know what you think about it! Share it to your friends and learn new things together.
Transcript
Mean Observer Metamerism and the Selection ofDisplay Primaries
Mark D. Fairchild & David R. WybleRIT Munsell Color Science Laboratory

A Conclusion...
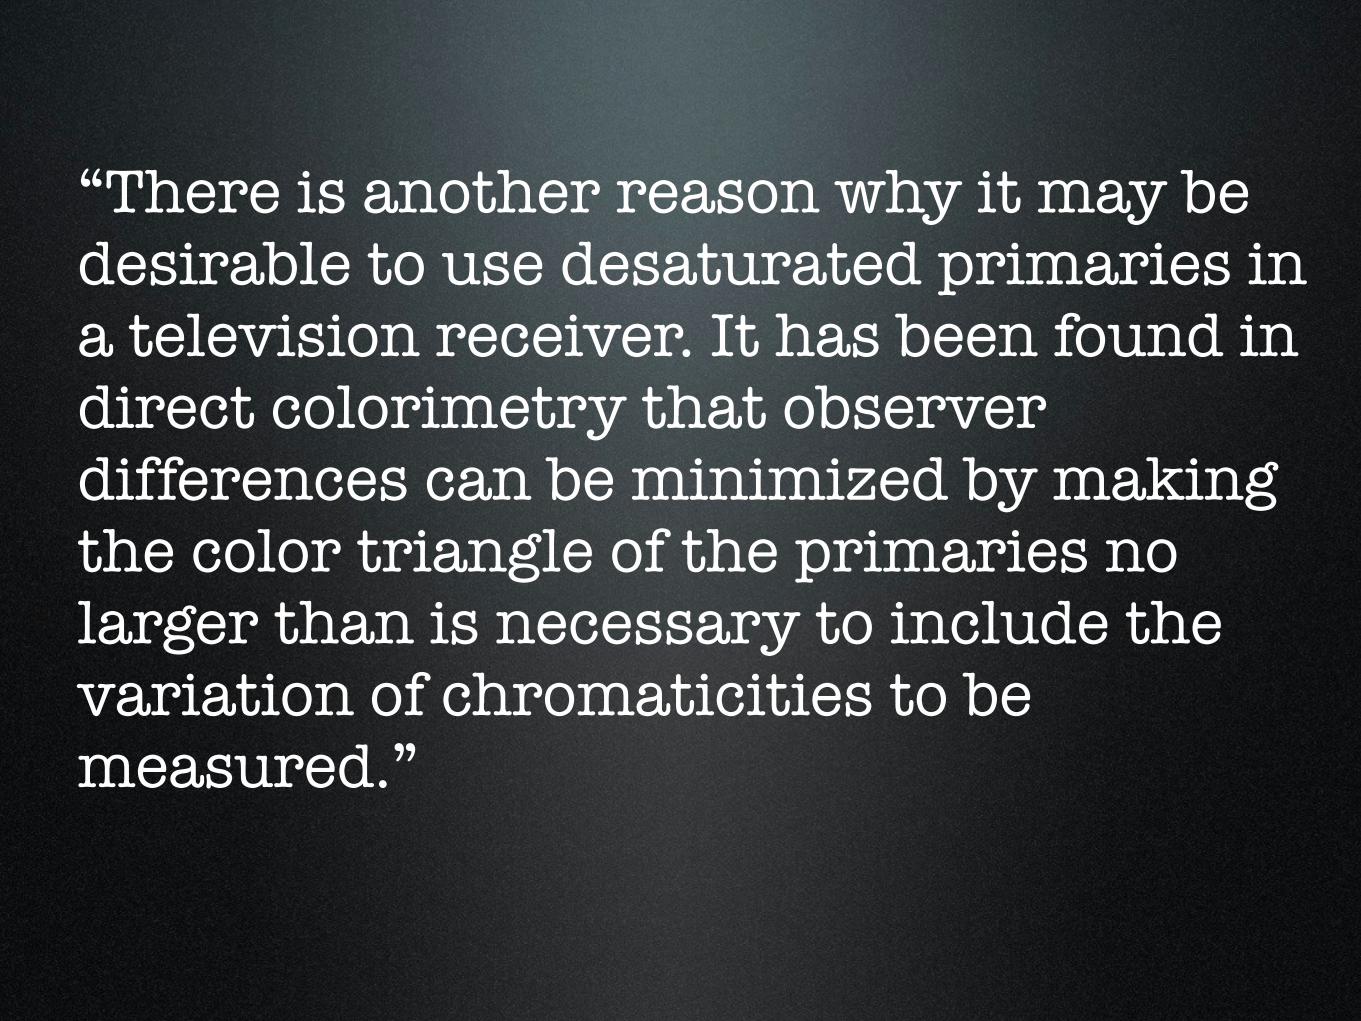
“There is another reason why it may be desirable to use desaturated primaries in a television receiver. It has been found in direct colorimetry that observer differences can be minimized by making the color triangle of the primaries no larger than is necessary to include the variation of chromaticities to be measured.”
Wintringham, 1954

Observer Metamerism
A metameric match for one observer is likely to mismatch for another.
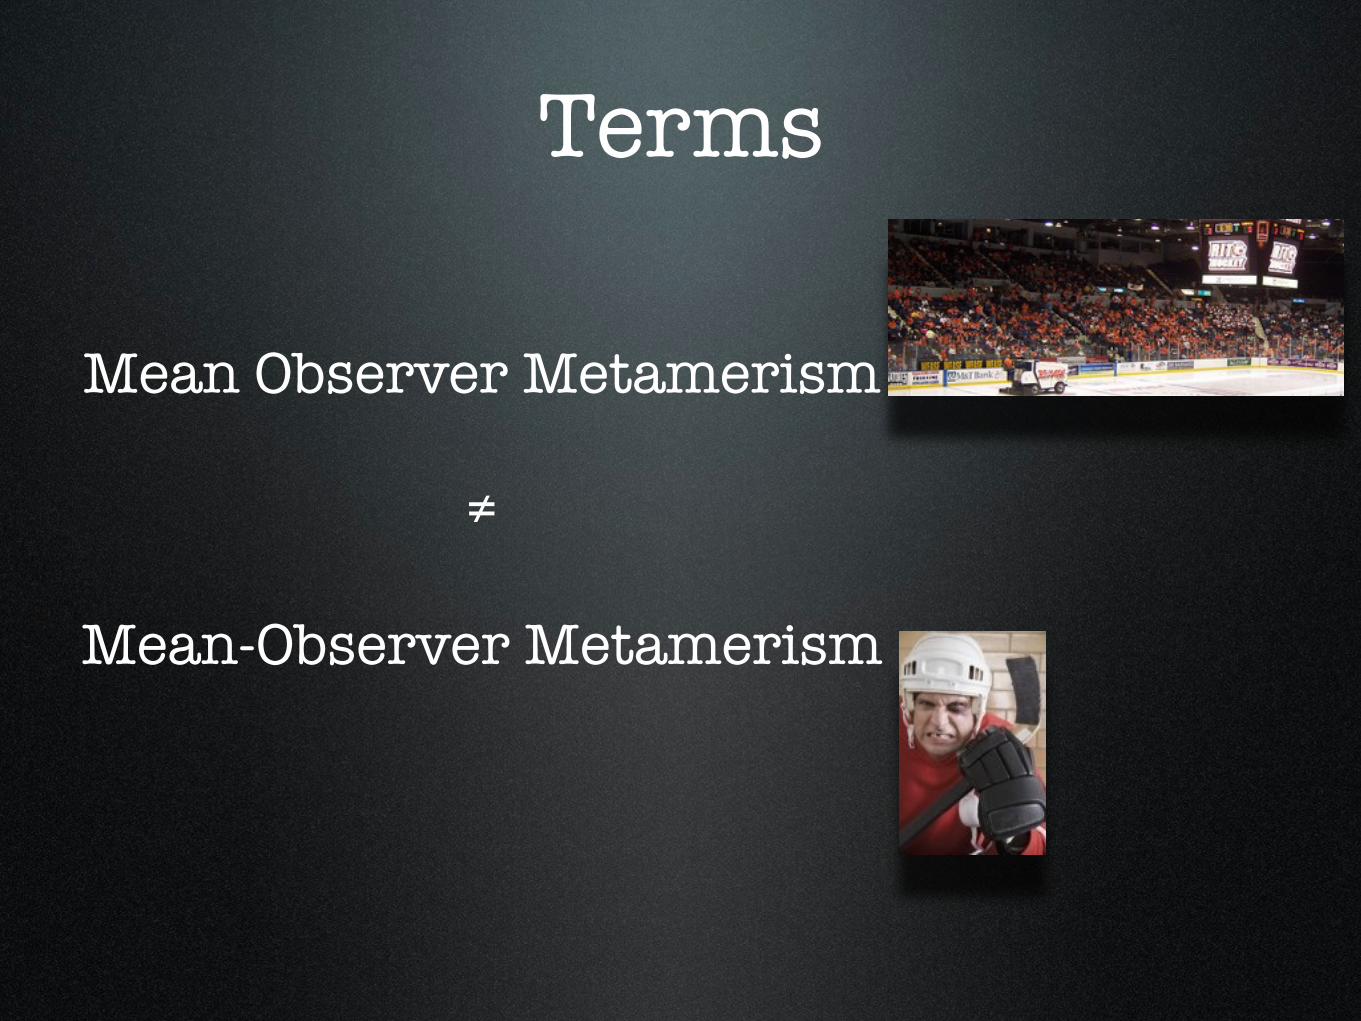
Terms
Mean Observer Metamerism
≠
Mean-Observer Metamerism
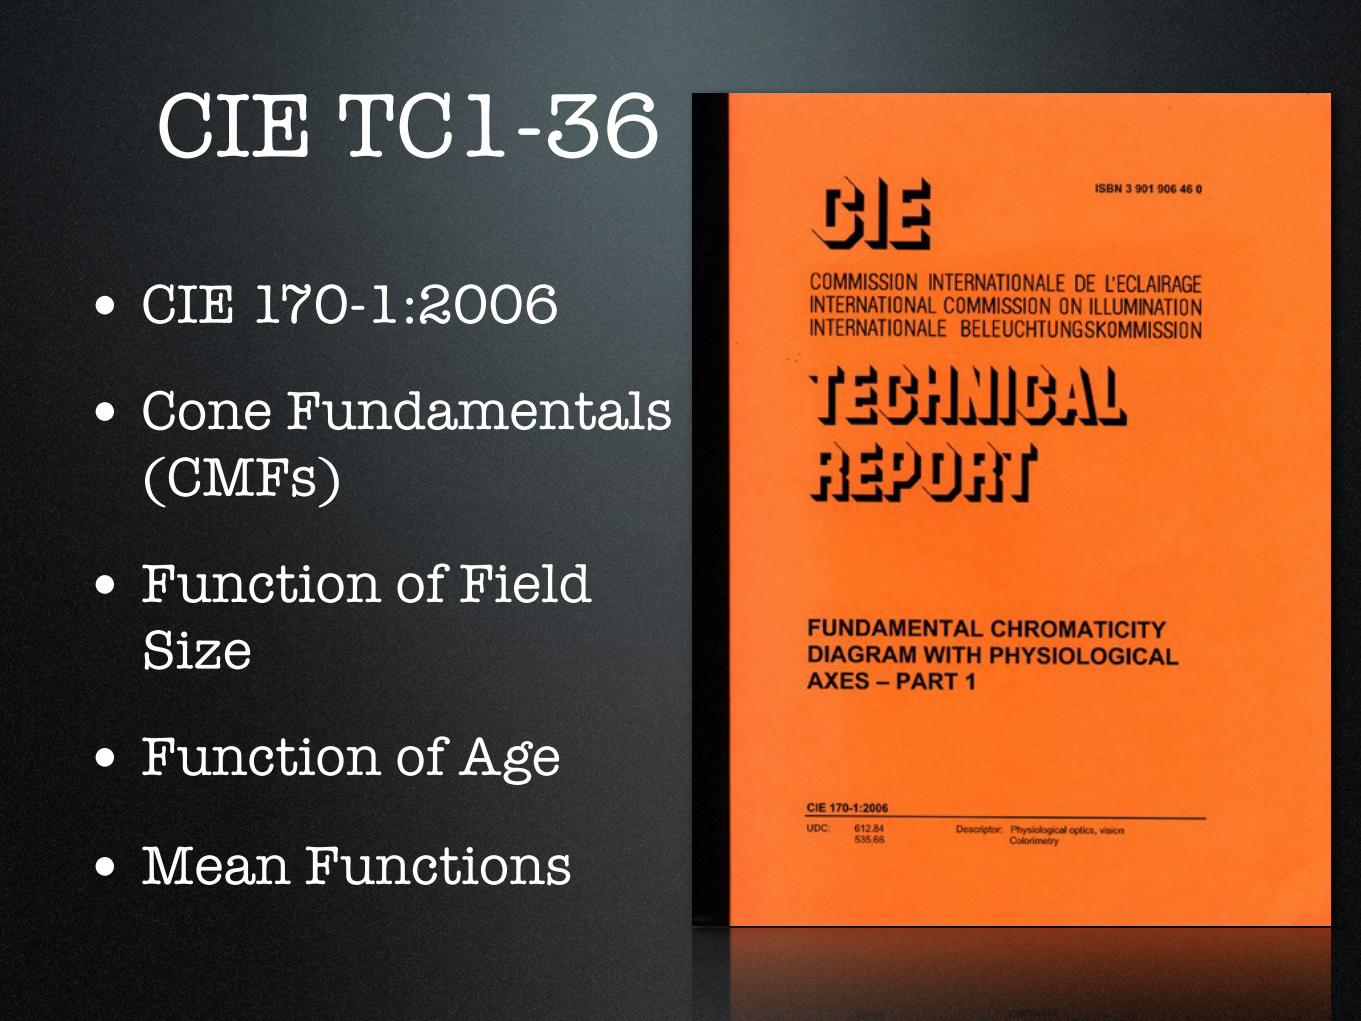
CIE TC1-36
• CIE 170-1:2006
• Cone Fundamentals (CMFs)
• Function of Field Size
• Function of Age
• Mean Functions

CIE 2006 Model
�
l (λ) = α i,l (λ) ⋅10−Dτ ,max,macula ⋅Dmacula ,relative (λ )−Dτ ,ocul (λ )[ ]
m (λ) = α i,m (λ) ⋅10−Dτ ,max,macula ⋅Dmacula ,relative (λ )−Dτ ,ocul (λ )[ ]
s (λ) = α i,s(λ) ⋅10−Dτ ,max,macula ⋅Dmacula ,relative (λ )−Dτ ,ocul (λ )[ ]
Ocular Media Density
f(age)
Cone Absorptivity
Spectra
f(field size)
Cone Fundamentals
Macular Density
f(field size)
Notation
• CIE2006(field size, age)
• e.g. CIE2006(2,32)
• 2-Degree Field, 32 Years Old
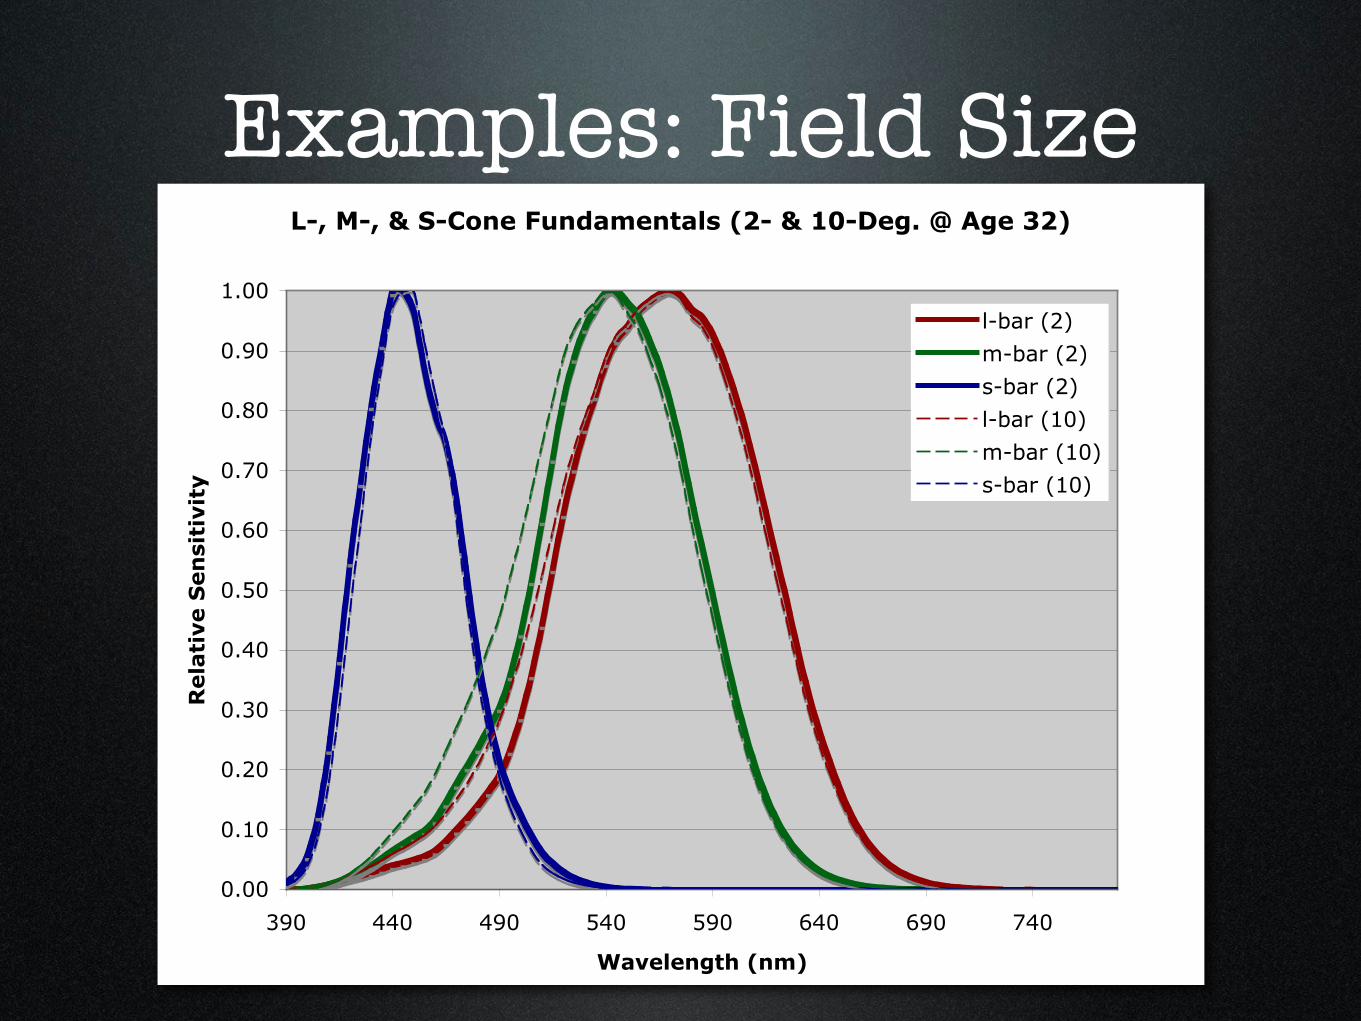
Examples: Field SizeL-, M-, & S-Cone Fundamentals (2- & 10-Deg. @ Age 32)
0.00
0.10
0.20
0.30
0.40
0.50
0.60
0.70
0.80
0.90
1.00
390 440 490 540 590 640 690 740
Wavelength (nm)
Rela
tive
Sen
siti
vity
l-bar (2)m-bar (2)s-bar (2)l-bar (10)m-bar (10)s-bar (10)
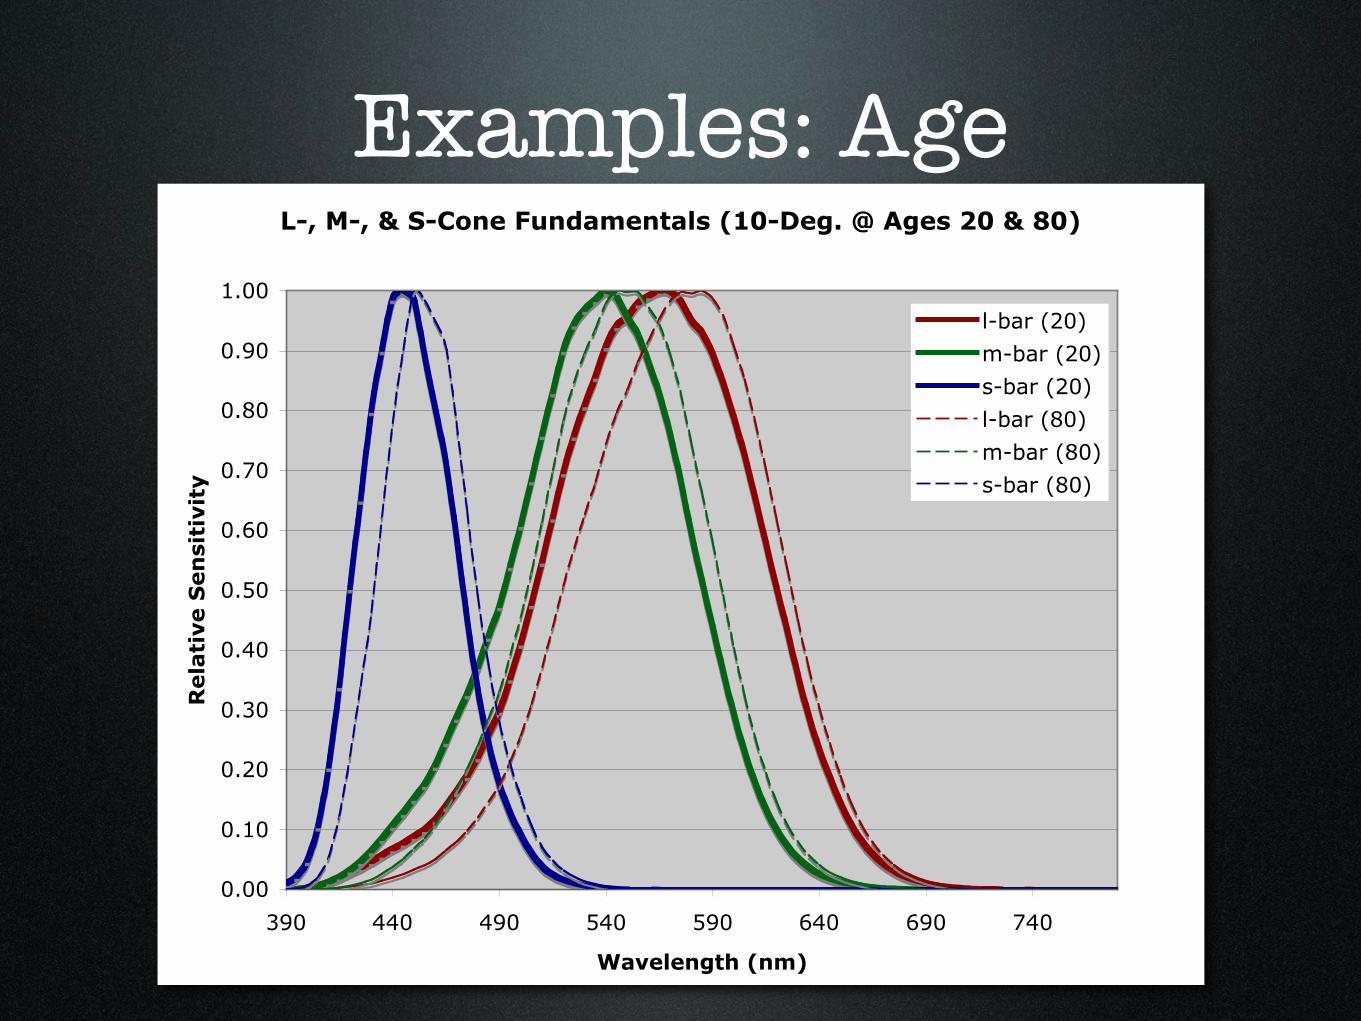
Examples: AgeL-, M-, & S-Cone Fundamentals (10-Deg. @ Ages 20 & 80)
0.00
0.10
0.20
0.30
0.40
0.50
0.60
0.70
0.80
0.90
1.00
390 440 490 540 590 640 690 740
Wavelength (nm)
Rela
tive
Sen
siti
vity
l-bar (20)m-bar (20)s-bar (20)l-bar (80)m-bar (80)s-bar (80)
CIE 2006 Code
Excel Spreadsheet & MATLAB Code
mcsl.rit.edu/online/cie.php
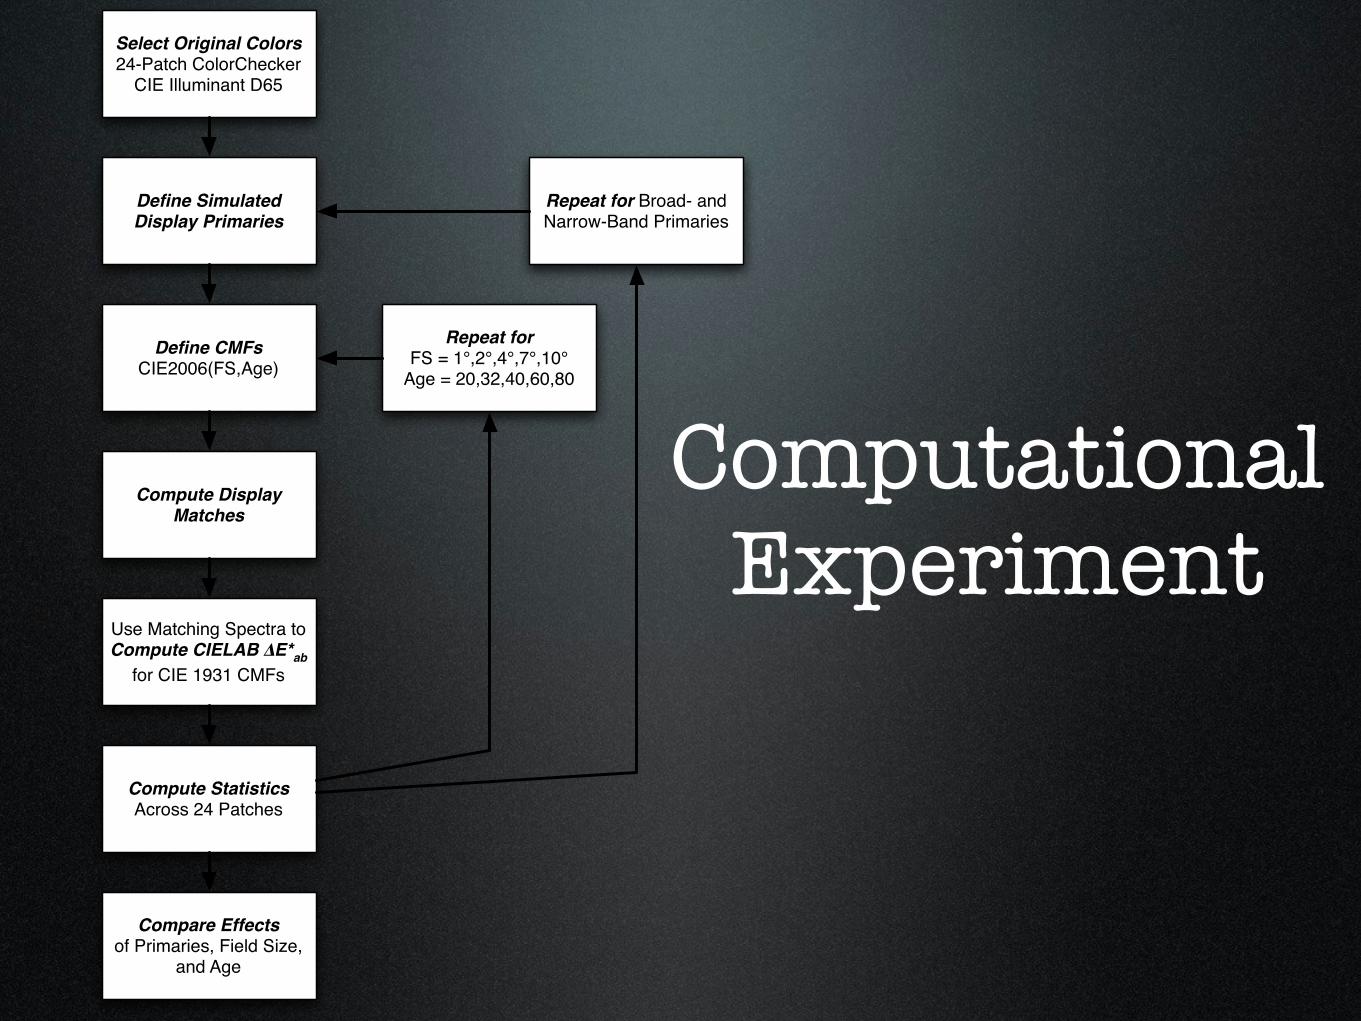
ComputationalExperiment
Select Original Colors24-Patch ColorChecker
CIE Illuminant D65
Use Matching Spectra to Compute CIELAB !E*ab
for CIE 1931 CMFs
Compute Display Matches
Compare Effectsof Primaries, Field Size,
and Age
Repeat forFS = 1°,2°,4°,7°,10°
Age = 20,32,40,60,80
Define CMFsCIE2006(FS,Age)
Define Simulated Display Primaries
Compute StatisticsAcross 24 Patches
Repeat for Broad- and Narrow-Band Primaries
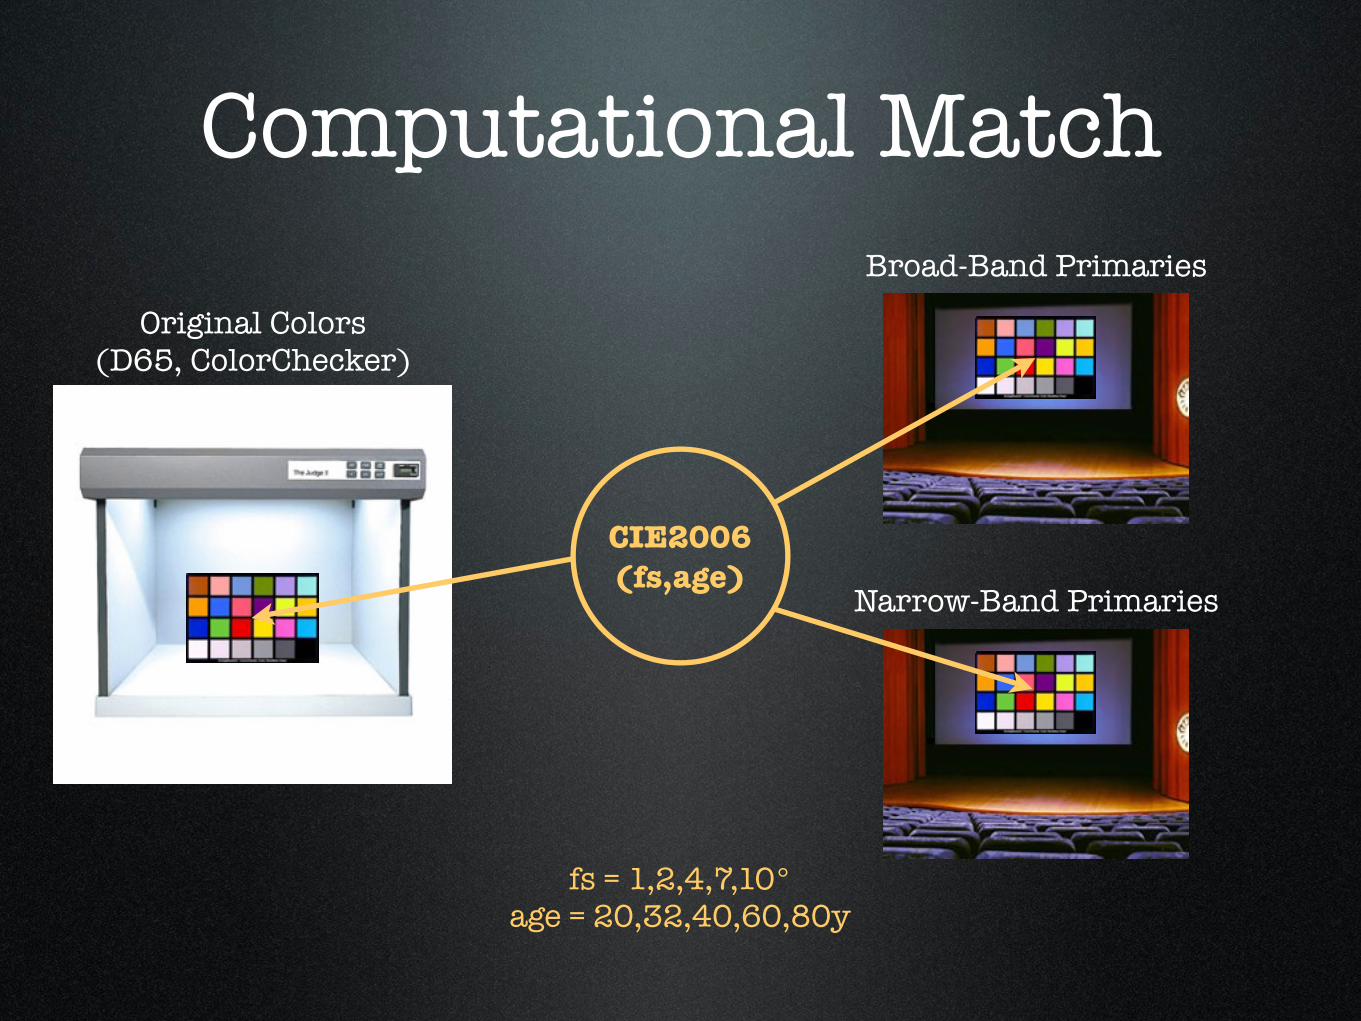
Computational Match
CIE2006(fs,age)
fs = 1,2,4,7,10°age = 20,32,40,60,80y
Original Colors(D65, ColorChecker)
Broad-Band Primaries
Narrow-Band Primaries
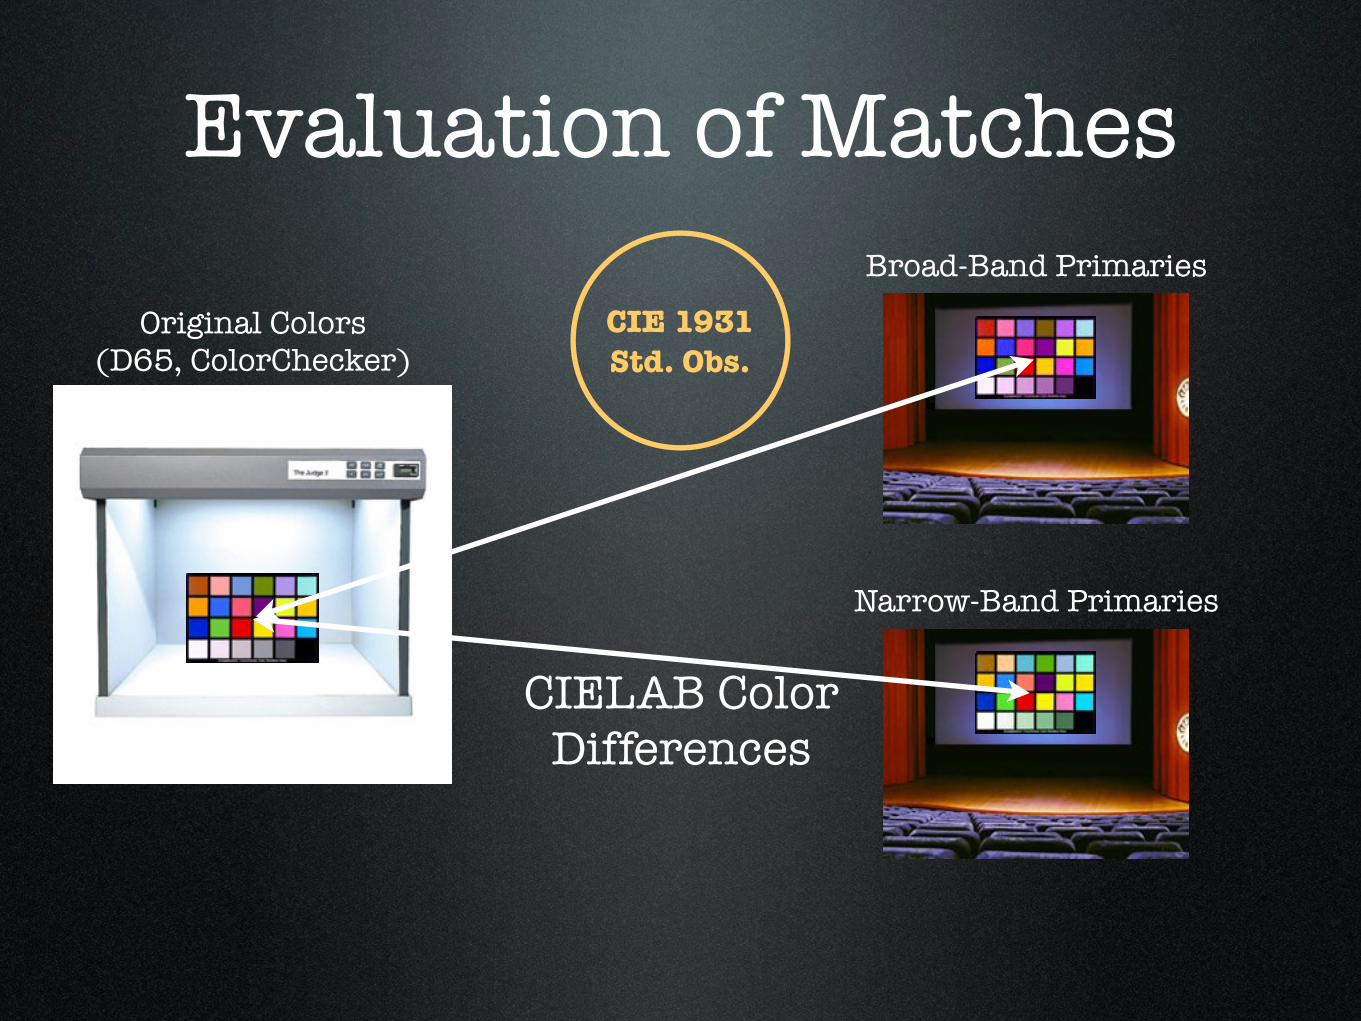
Original Colors(D65, ColorChecker)
Evaluation of Matches
CIE 1931Std. Obs.
Broad-Band Primaries
Narrow-Band Primaries
CIELAB Color Differences
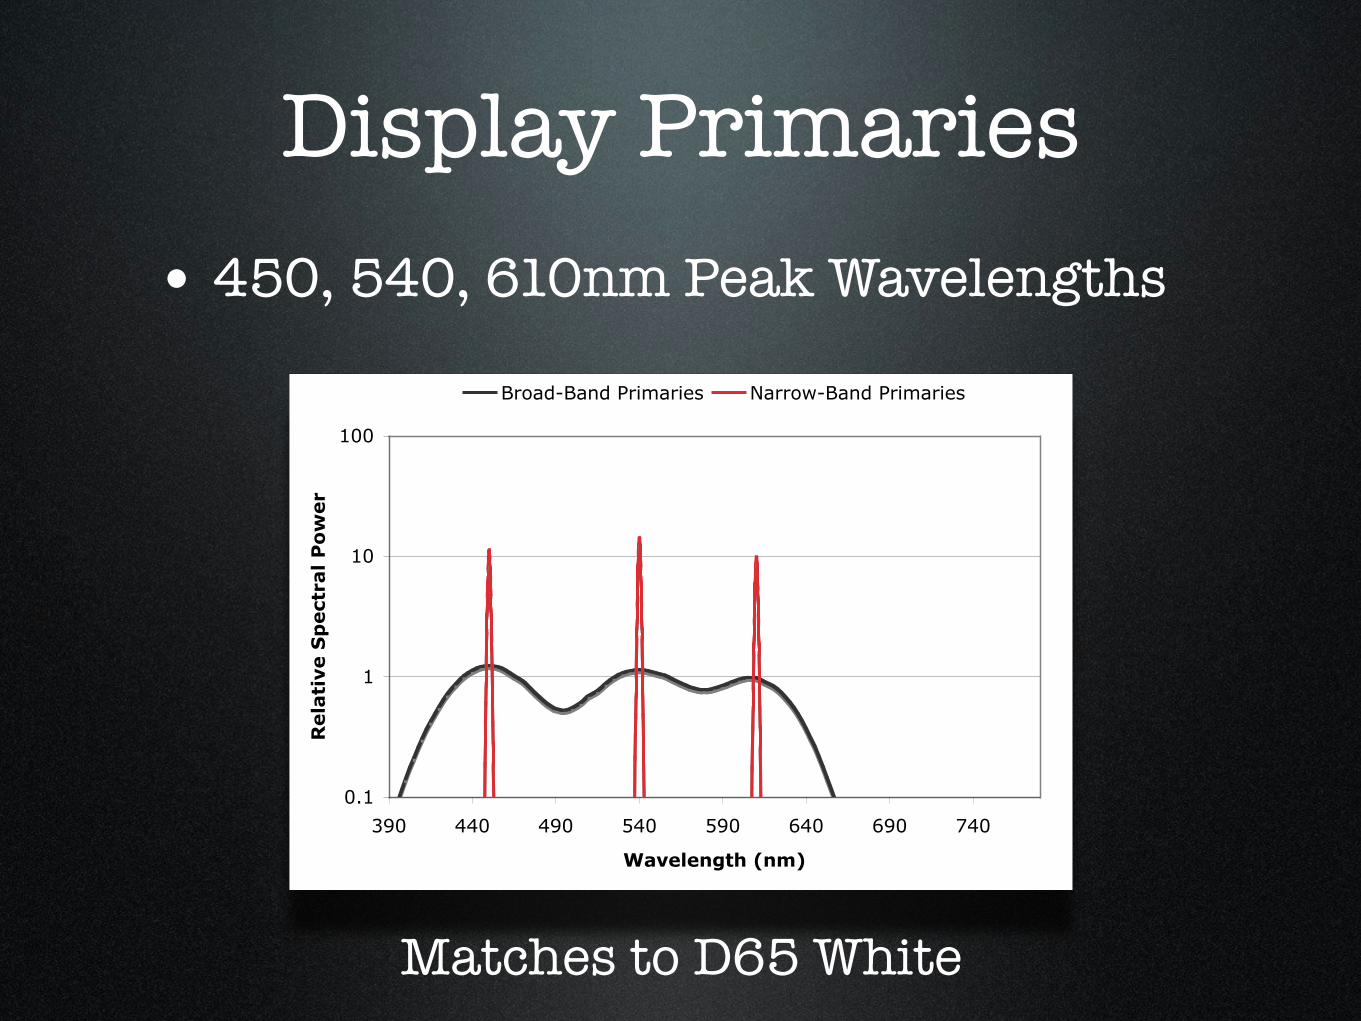
Display Primaries• 450, 540, 610nm Peak Wavelengths
0.1
1
10
100
390 440 490 540 590 640 690 740
Wavelength (nm)
Rela
tive
Sp
ect
ral P
ow
er
Broad-Band Primaries Narrow-Band Primaries
Matches to D65 White
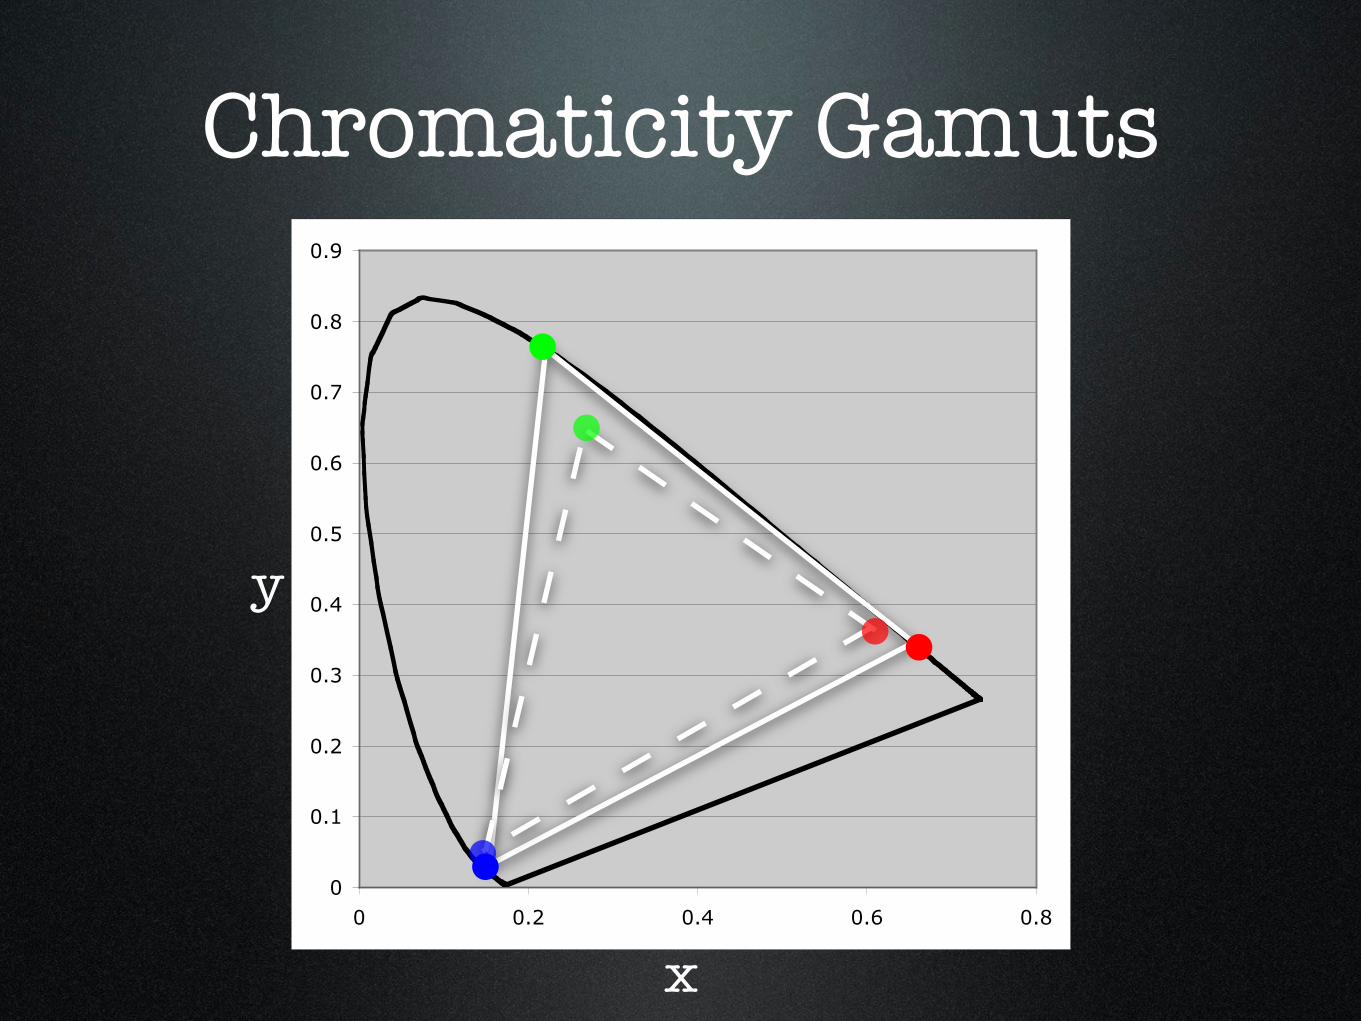
Chromaticity Gamuts
0
0.1
0.2
0.3
0.4
0.5
0.6
0.7
0.8
0.9
0 0.2 0.4 0.6 0.8
x
y
Results
• Color Differences (CIELAB, 1931)
• Chart (D65) vs. Simulated Display Match
• Averaged Over 24 Patches
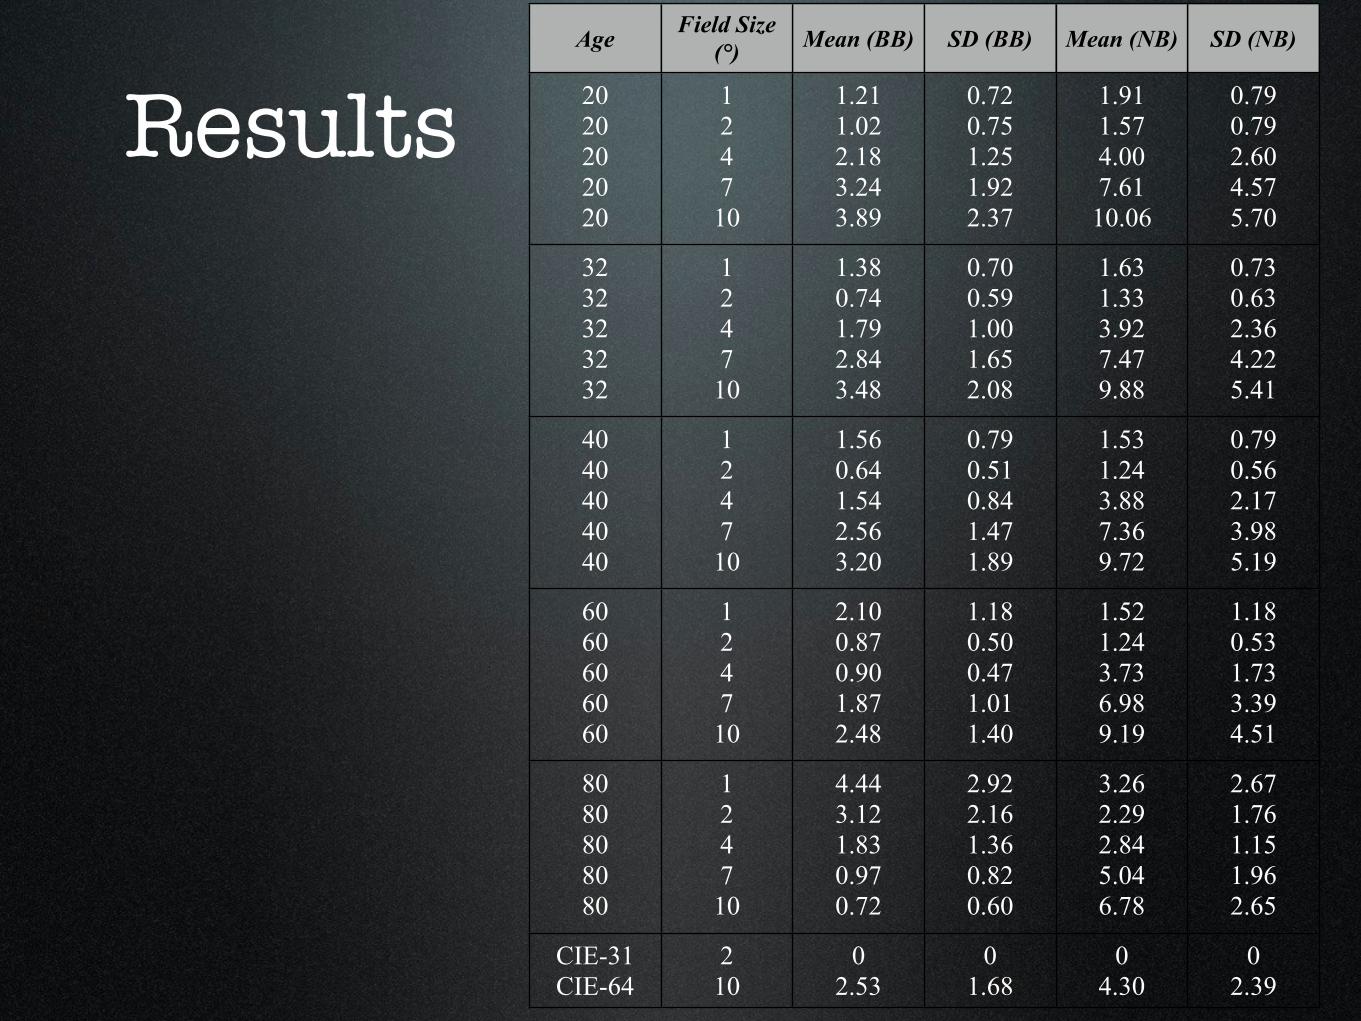
ResultsAge Field Size
(°) Mean (BB) SD (BB) Mean (NB) SD (NB)
2020202020
124710
1.211.022.183.243.89
0.720.751.251.922.37
1.911.574.007.6110.06
0.790.792.604.575.70
3232323232
124710
1.380.741.792.843.48
0.700.591.001.652.08
1.631.333.927.479.88
0.730.632.364.225.41
4040404040
124710
1.560.641.542.563.20
0.790.510.841.471.89
1.531.243.887.369.72
0.790.562.173.985.19
6060606060
124710
2.100.870.901.872.48
1.180.500.471.011.40
1.521.243.736.989.19
1.180.531.733.394.51
8080808080
124710
4.443.121.830.970.72
2.922.161.360.820.60
3.262.292.845.046.78
2.671.761.151.962.65
CIE-31CIE-64
210
02.53
01.68
04.30
02.39
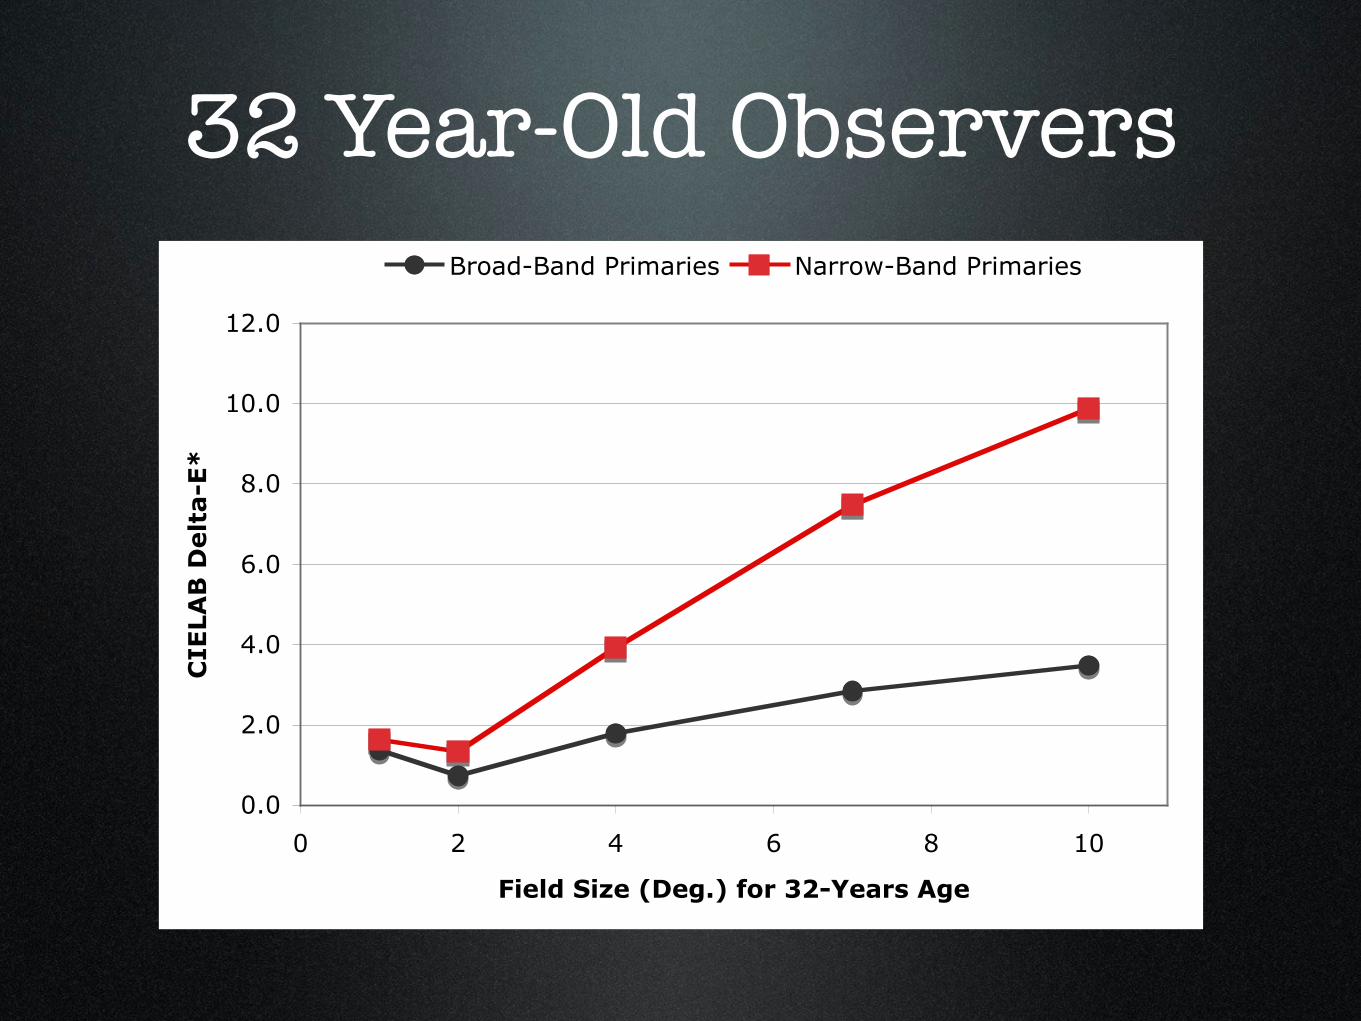
32 Year-Old Observers
0.0
2.0
4.0
6.0
8.0
10.0
12.0
0 2 4 6 8 10
Field Size (Deg.) for 32-Years Age
CIE
LAB
Delt
a-E
*
Broad-Band Primaries Narrow-Band Primaries
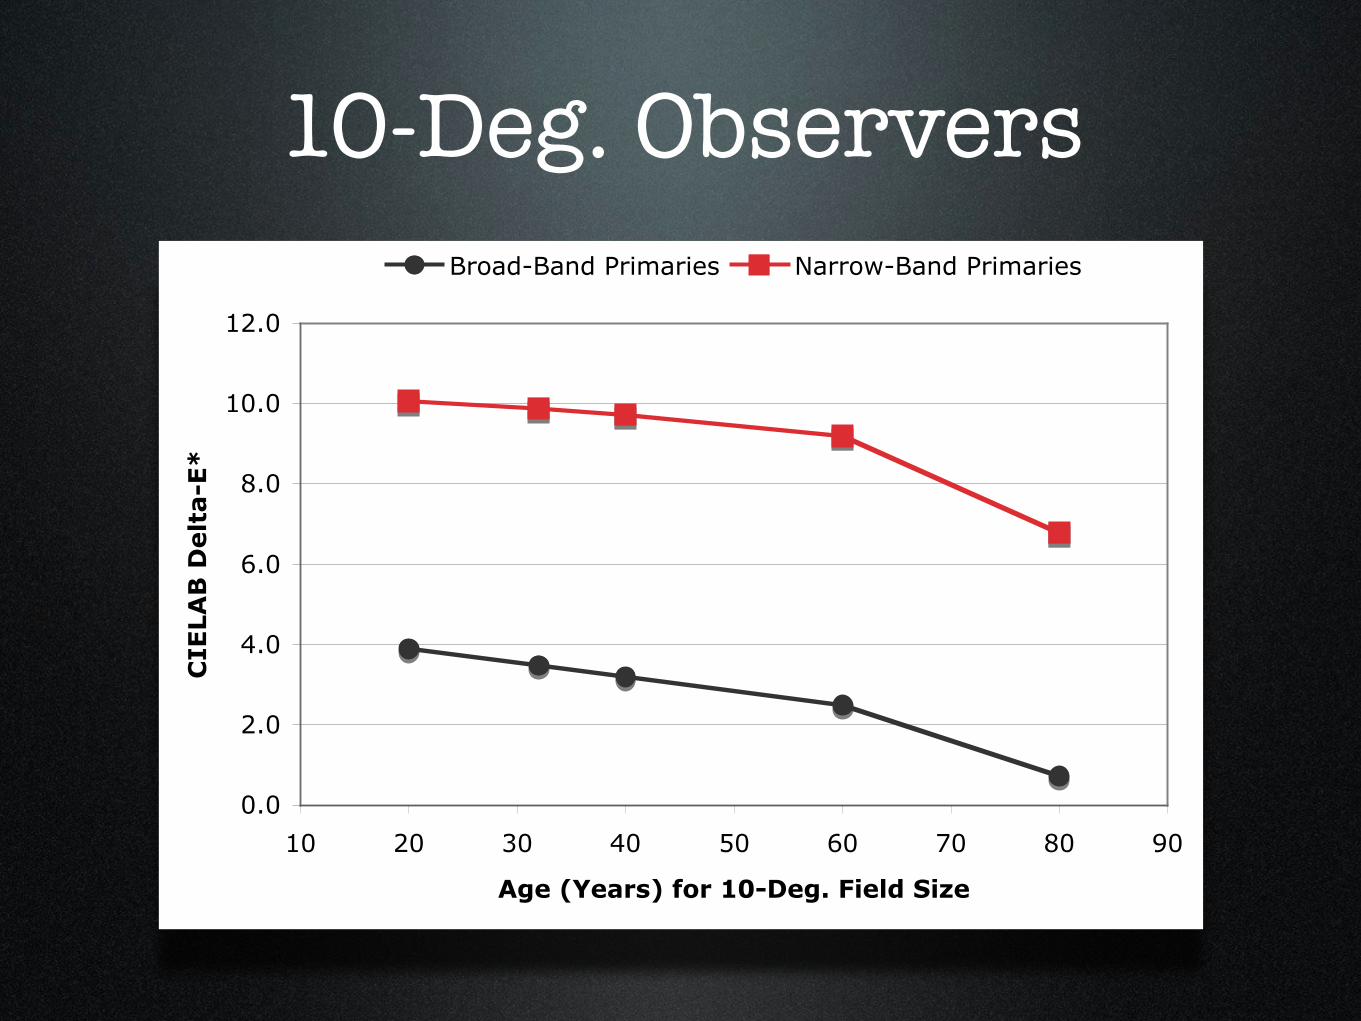
10-Deg. Observers
0.0
2.0
4.0
6.0
8.0
10.0
12.0
10 20 30 40 50 60 70 80 90
Age (Years) for 10-Deg. Field Size
CIE
LAB
Delt
a-E
*
Broad-Band Primaries Narrow-Band Primaries
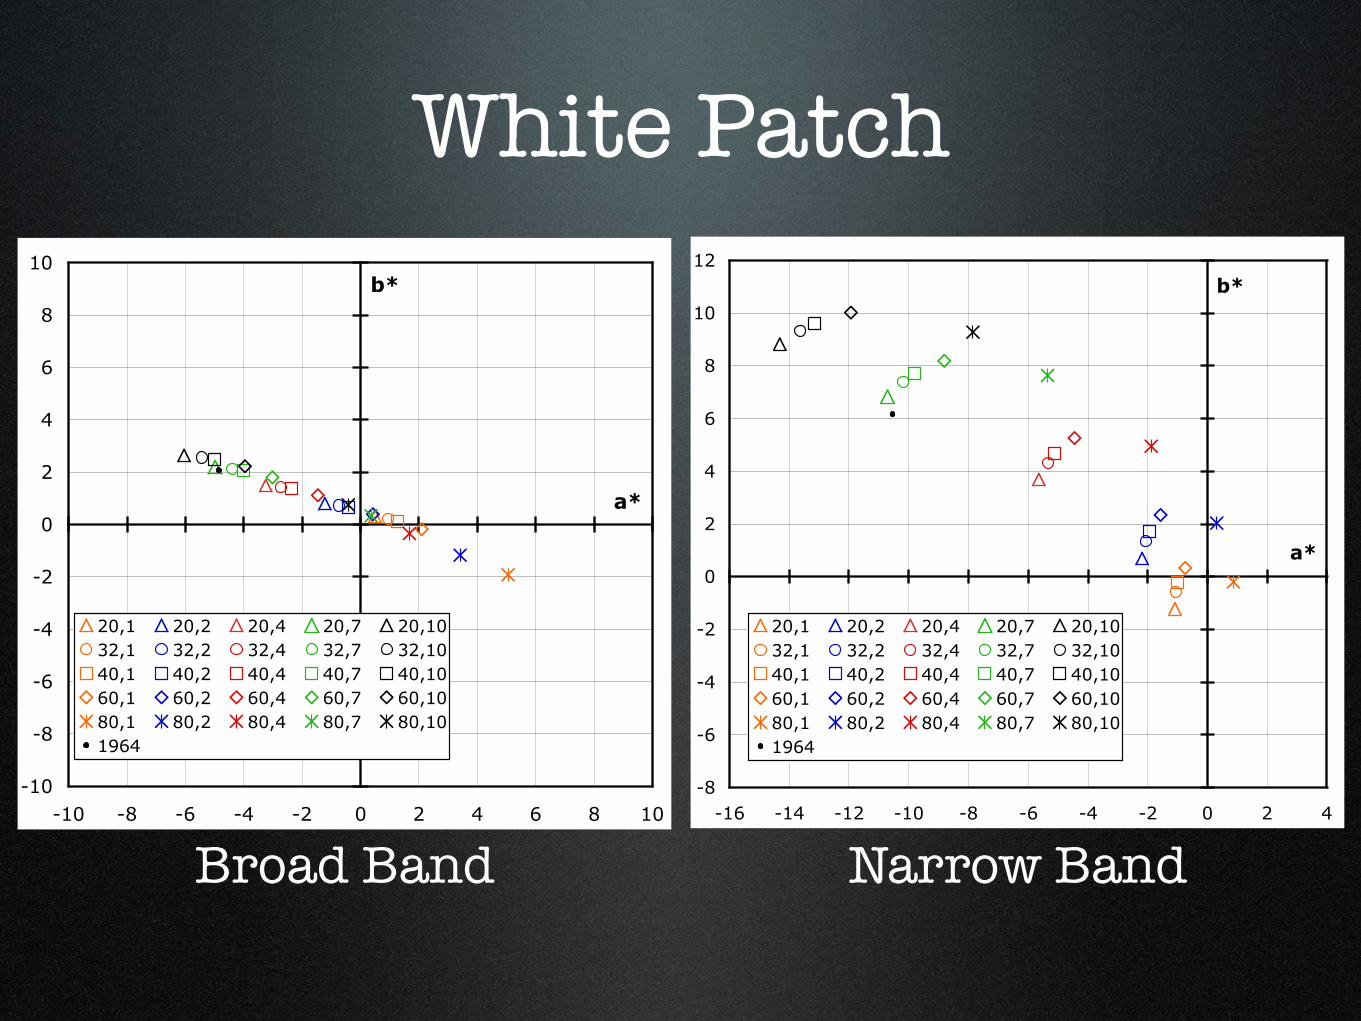
White Patch
-10
-8
-6
-4
-2
0
2
4
6
8
10
-10 -8 -6 -4 -2 0 2 4 6 8 10
a*
b*
20,1 20,2 20,4 20,7 20,1032,1 32,2 32,4 32,7 32,1040,1 40,2 40,4 40,7 40,1060,1 60,2 60,4 60,7 60,1080,1 80,2 80,4 80,7 80,101964
-8
-6
-4
-2
0
2
4
6
8
10
12
-16 -14 -12 -10 -8 -6 -4 -2 0 2 4
a*
b*
20,1 20,2 20,4 20,7 20,1032,1 32,2 32,4 32,7 32,1040,1 40,2 40,4 40,7 40,1060,1 60,2 60,4 60,7 60,1080,1 80,2 80,4 80,7 80,101964
Broad Band Narrow Band
Visualization
• Take Matching RGBs and Display on a Single sRGB Display
• Center: Broad-Band “Original”
• Surround: 4 Computed Narrow-Band Matches
• Illustrates Changes in Device RGB Needed to Compensate for Observer Variability
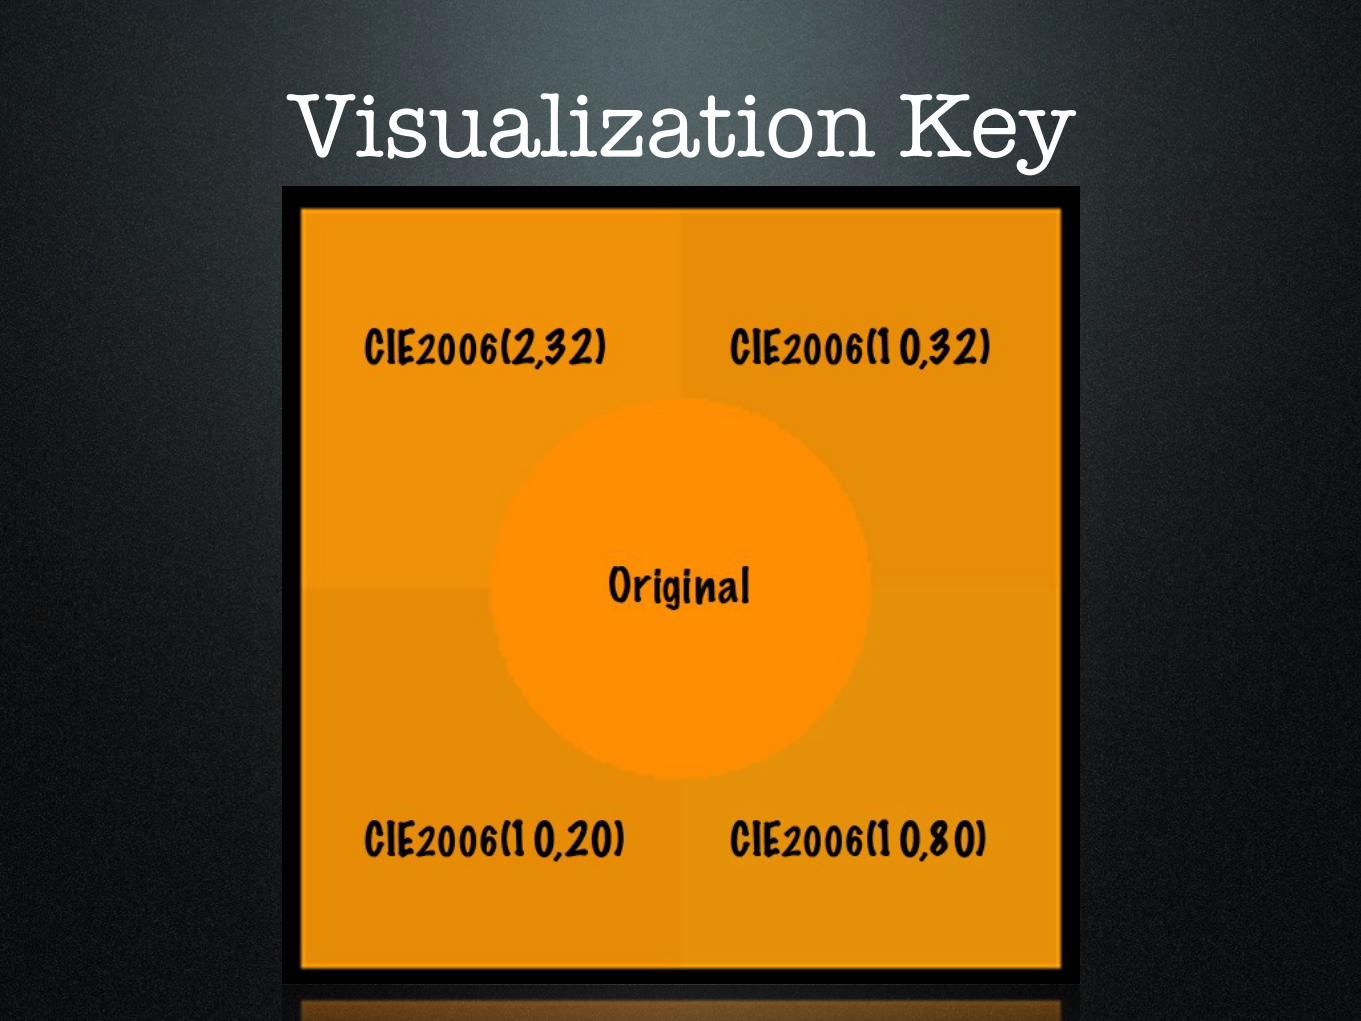
Visualization Key
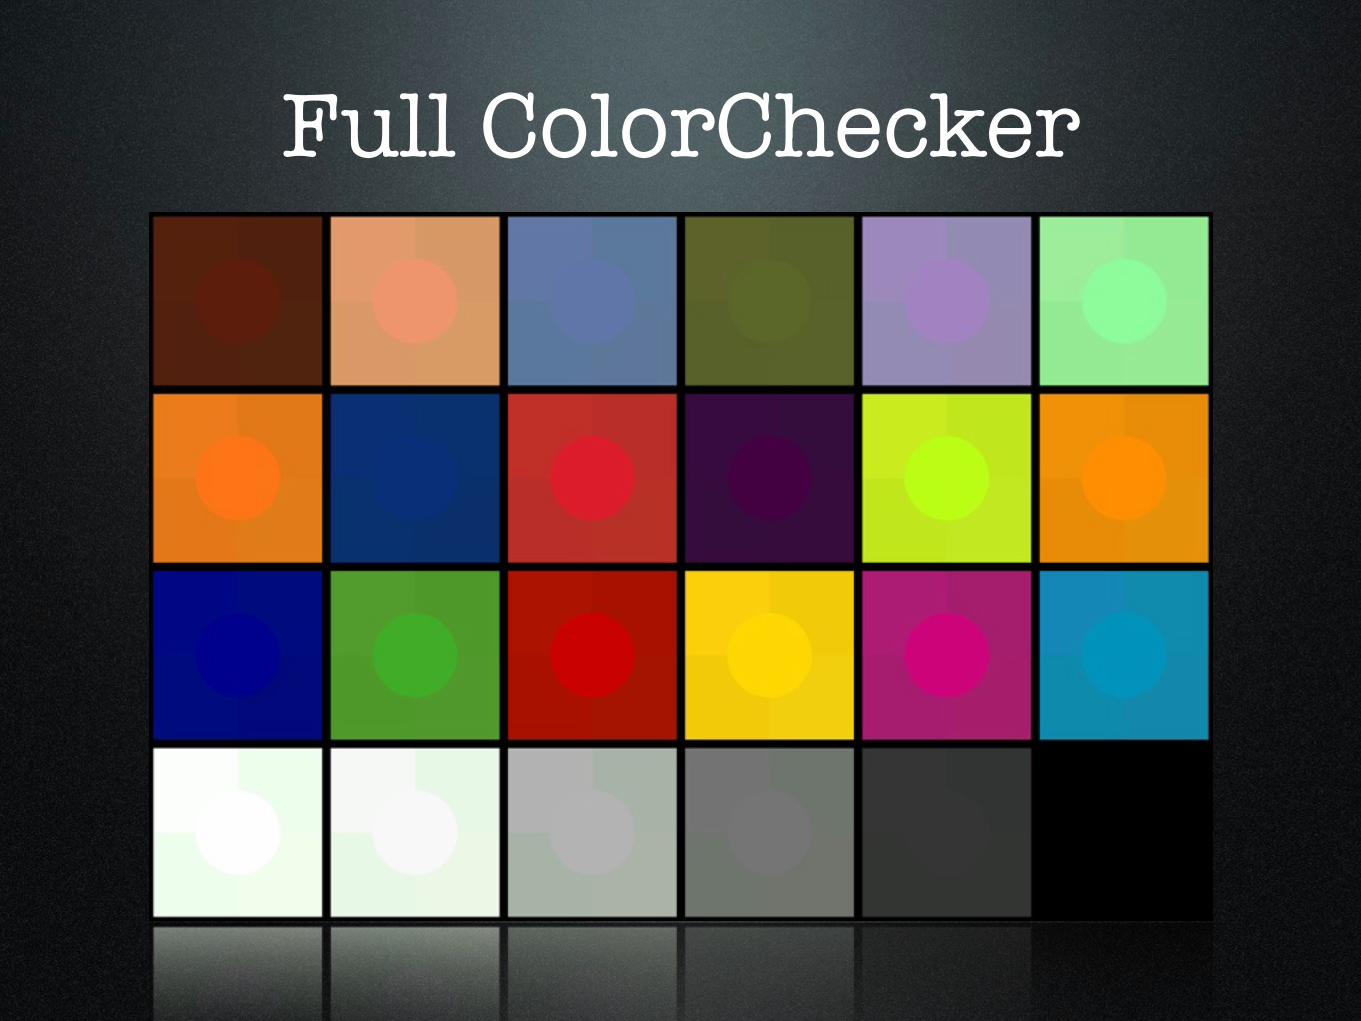
Full ColorChecker
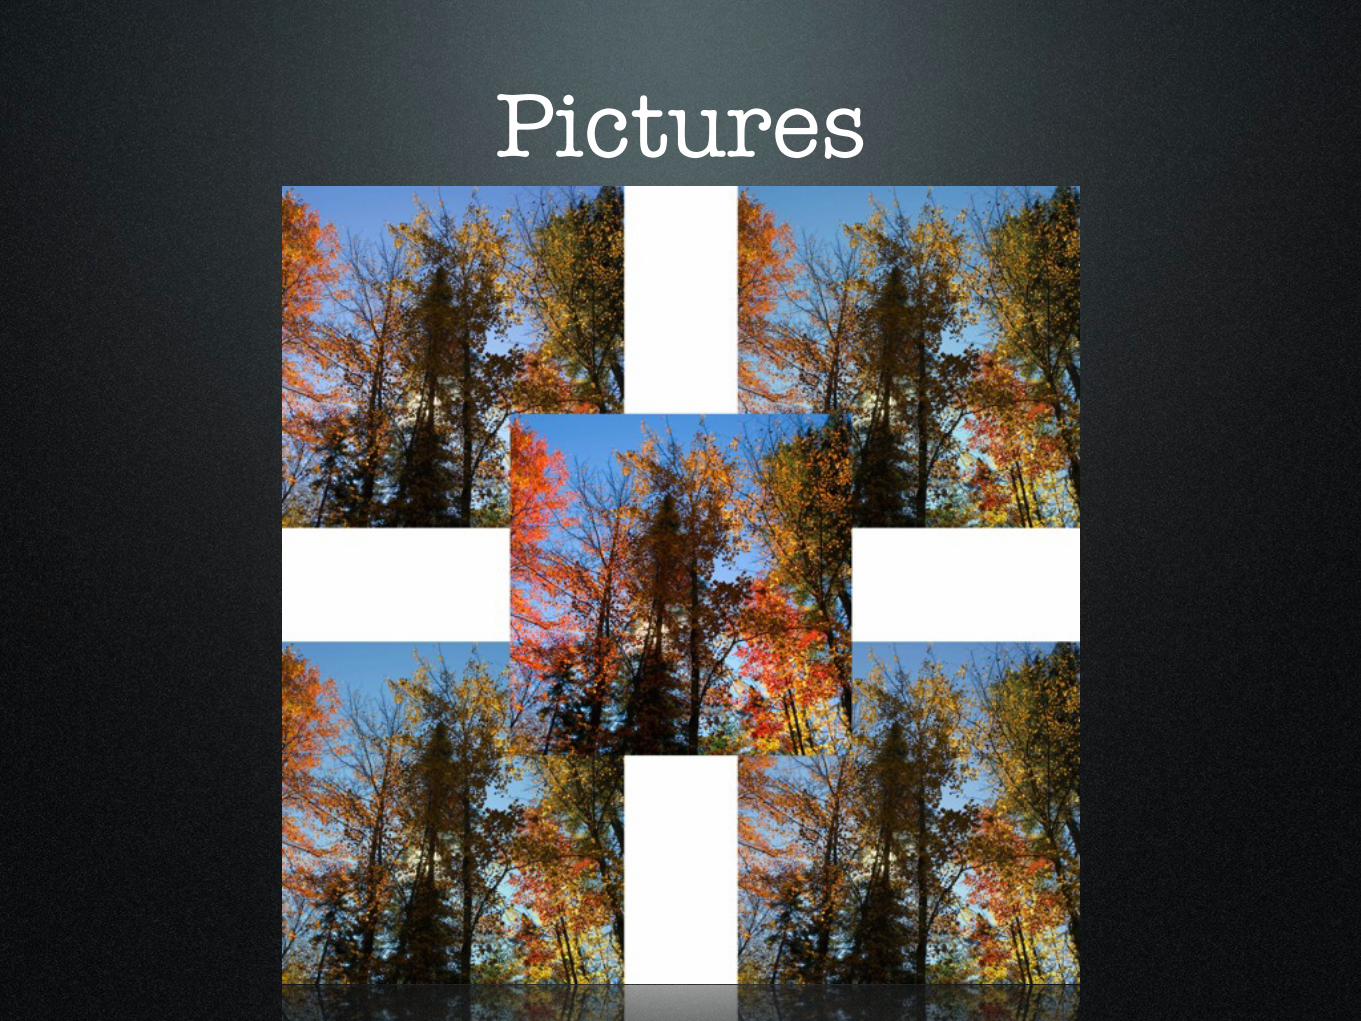
Pictures
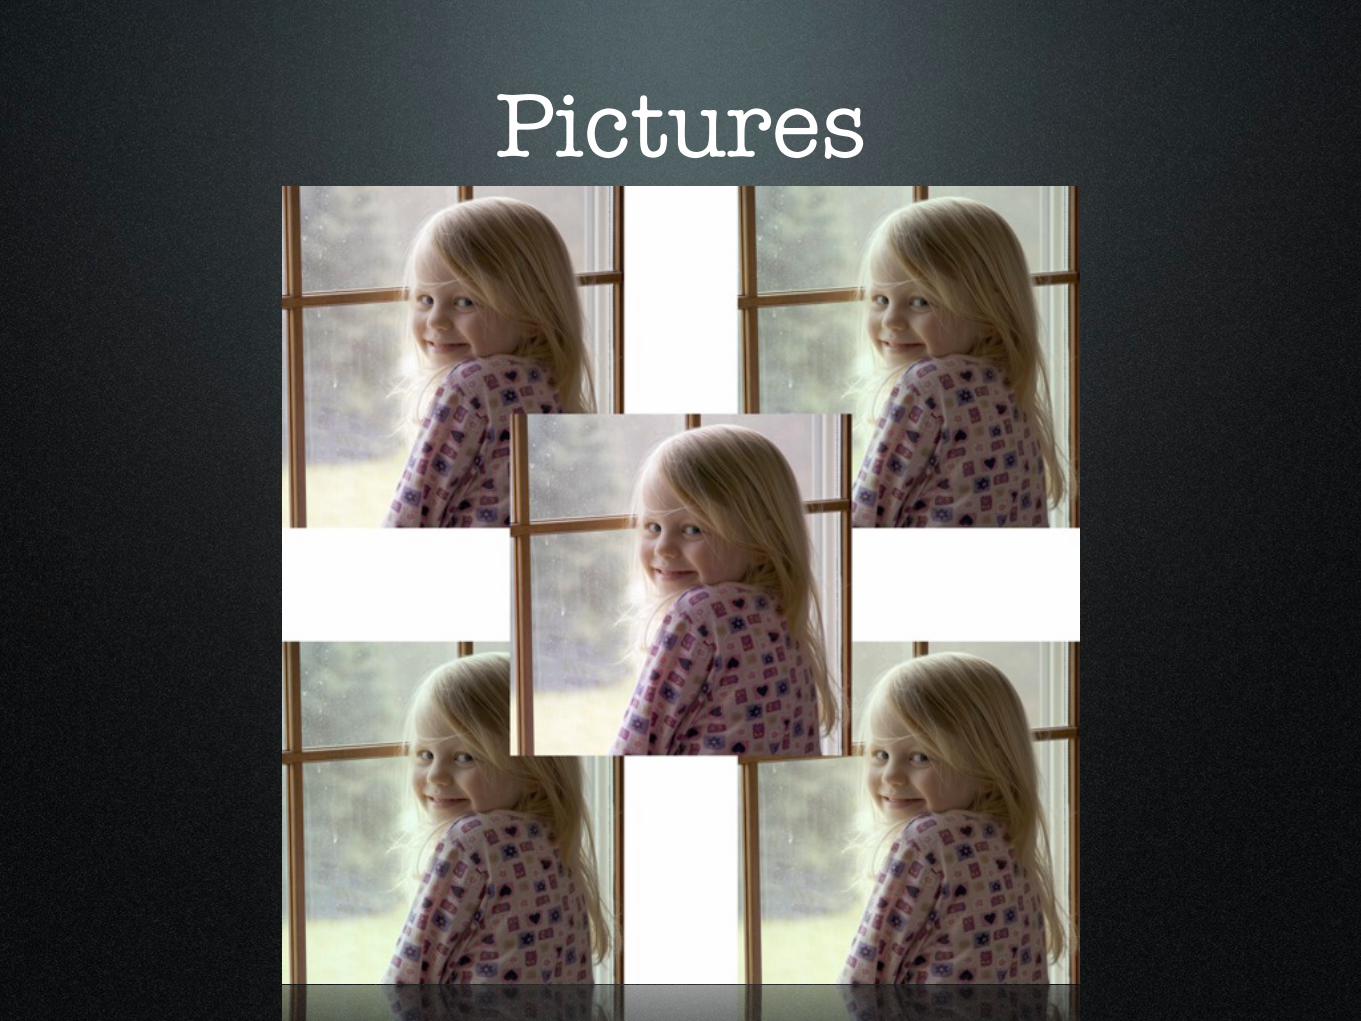
Pictures
Conclusions
• Narrow-Band Primaries
• More Observer Variability
• Mean Observer Metamerism is Significant
• Individual Observer Metamerism is Even Greater
• Consider the CIE 170-1:2006 CMFs
Also ...
High-luminance desaturated primaries
appear more colorful than
dimmer monochromatic primaries...
Thank Youmcsl.rit.edu
Related Documents