Slide 1 Mean, Median, Mode & Range A S – 10.4.3 __________________________________________________________________________________ __________________________________________________________________________________ __________________________________________________________________________________ __________________________________________________________________________________ __________________________________________________________________________________ __________________________________________________________________________________ __________________________________________________________________________________ __________________________________________________________________________________ __________________________________________________________________________________ __________________________________________________________________________________ ________________________________________

Welcome message from author
This document is posted to help you gain knowledge. Please leave a comment to let me know what you think about it! Share it to your friends and learn new things together.
Transcript

Slide 1
Mean, Median,
Mode & Range
A S – 10.4.3
__________________________________________________________________________________
__________________________________________________________________________________
__________________________________________________________________________________
__________________________________________________________________________________
__________________________________________________________________________________
__________________________________________________________________________________
__________________________________________________________________________________
__________________________________________________________________________________
__________________________________________________________________________________
__________________________________________________________________________________
________________________________________

Slide 2
Where’s The Centre ?
The Mean, Median and Mode are measures of central tendency.
The three measures describe the approximate centre in a set of data.
Each statistic helps us to interpret data and draw conclusions.
__________________________________________________________________________________
__________________________________________________________________________________
__________________________________________________________________________________
__________________________________________________________________________________
__________________________________________________________________________________
__________________________________________________________________________________
__________________________________________________________________________________
__________________________________________________________________________________
__________________________________________________________________________________
__________________________________________________________________________________
________________________________________

Slide 3
Mean = the average of a set of data
Mean
To calculate : Find the sum of the set of data and divide it by number of data e.g.
Find the mean of 5; 3; 4; 6; 7; 5
Add the numbers
3+4+5+6+7+5= 30
Divide by the number of data
30 ÷ 6 = 5
sum number
__________________________________________________________________________________
__________________________________________________________________________________
__________________________________________________________________________________
__________________________________________________________________________________
__________________________________________________________________________________
__________________________________________________________________________________
__________________________________________________________________________________
__________________________________________________________________________________
__________________________________________________________________________________
__________________________________________________________________________________
________________________________________

Slide 4
Find The Mean For …
1. 12; 15; 11; 11; 7; 13
2. 26; 33; 41; 52
3. The rainfall for one week in January, in mm, was: 10; 5; 15; 0; 0; 30; 25.
Mean =
__________________________________________________________________________________
__________________________________________________________________________________
__________________________________________________________________________________
__________________________________________________________________________________
__________________________________________________________________________________
__________________________________________________________________________________
__________________________________________________________________________________
__________________________________________________________________________________
__________________________________________________________________________________
__________________________________________________________________________________
________________________________________

Slide 5
The frequency table shows the score out
of 5 by a class in a maths test. Calculate
the mean.
Test score 0 1 2 3 4 5
Frequency 1 2 3 2 3 5
Freq x score 0 2 6 6 12 25
total
16
51
Total: pupils
Mean = 51 16 = 2,88 (2 d.p.)
Total: marks
__________________________________________________________________________________
__________________________________________________________________________________
__________________________________________________________________________________
__________________________________________________________________________________
__________________________________________________________________________________
__________________________________________________________________________________
__________________________________________________________________________________
__________________________________________________________________________________
__________________________________________________________________________________
__________________________________________________________________________________
________________________________________

Slide 6
Median = the middle number of a set of
data arranged in increasing or
decreasing order e.g.
Median
Find the median of 29; 8; 4; 11; 19
Arrange in ascending order
4; 8; 11; 19; 29
middle
Median = 11
__________________________________________________________________________________
__________________________________________________________________________________
__________________________________________________________________________________
__________________________________________________________________________________
__________________________________________________________________________________
__________________________________________________________________________________
__________________________________________________________________________________
__________________________________________________________________________________
__________________________________________________________________________________
__________________________________________________________________________________
________________________________________

Slide 7
e.g. 12; 15; 11; 11; 7; 13 (6 numbers)
If there is an even number of data within the set, find the average of the middle two numbers.
Rearrange: 7; 11; 11; 12; 13; 15
middle
So (11+12) 2 = 11,5
Median = 11,5
TAKE NOTE
__________________________________________________________________________________
__________________________________________________________________________________
__________________________________________________________________________________
__________________________________________________________________________________
__________________________________________________________________________________
__________________________________________________________________________________
__________________________________________________________________________________
__________________________________________________________________________________
__________________________________________________________________________________
__________________________________________________________________________________
________________________________________

Slide 8
Find The Median For …
2. 1; 0; 2; 4; 1; 2; 1; 1; 2; 5; 5; 4
Order: 0; 1; 1; 1; 1; 2; 2; 2; 4; 4; 5; 5
1. 26; 31; 33; 41; 52
Median =
__________________________________________________________________________________
__________________________________________________________________________________
__________________________________________________________________________________
__________________________________________________________________________________
__________________________________________________________________________________
__________________________________________________________________________________
__________________________________________________________________________________
__________________________________________________________________________________
__________________________________________________________________________________
__________________________________________________________________________________
________________________________________

Slide 9
One dice was rolled 60 timesand the results recorded in a table. Calculate the median.
score 1 2 3 4 5 6
frequency 12 11 8 12 7 10
Note: middle after dice rolled 30 times
From left: 12+11+8 = 31 rollsFrom right: 10+7+12 =29 rollsMiddle has a score of 3
Median = 3
__________________________________________________________________________________
__________________________________________________________________________________
__________________________________________________________________________________
__________________________________________________________________________________
__________________________________________________________________________________
__________________________________________________________________________________
__________________________________________________________________________________
__________________________________________________________________________________
__________________________________________________________________________________
__________________________________________________________________________________
________________________________________

Slide 10
Mode = the number / event that occurs
most frequently in a set of data e.g.
Mode
Find the mode: 1; 3; 7; 1; 10; 12; 5
Arrange in ascending order.
1; 1; 3; 5; 7; 10; 12
The mode is 1.
__________________________________________________________________________________
__________________________________________________________________________________
__________________________________________________________________________________
__________________________________________________________________________________
__________________________________________________________________________________
__________________________________________________________________________________
__________________________________________________________________________________
__________________________________________________________________________________
__________________________________________________________________________________
__________________________________________________________________________________
________________________________________

Slide 11
TAKE NOTE
Sometimes there is no mode in a set of data.
Sometimes a set of data will have more than one mode.
e.g 3; 8; 7; 6; 12; 11; 2; 1
2; 4; 5; 5; 6; 7; 7; 8; 9; 10
Mode = 5 and 7
Each value is different.
__________________________________________________________________________________
__________________________________________________________________________________
__________________________________________________________________________________
__________________________________________________________________________________
__________________________________________________________________________________
__________________________________________________________________________________
__________________________________________________________________________________
__________________________________________________________________________________
__________________________________________________________________________________
__________________________________________________________________________________
________________________________________
Slide 12
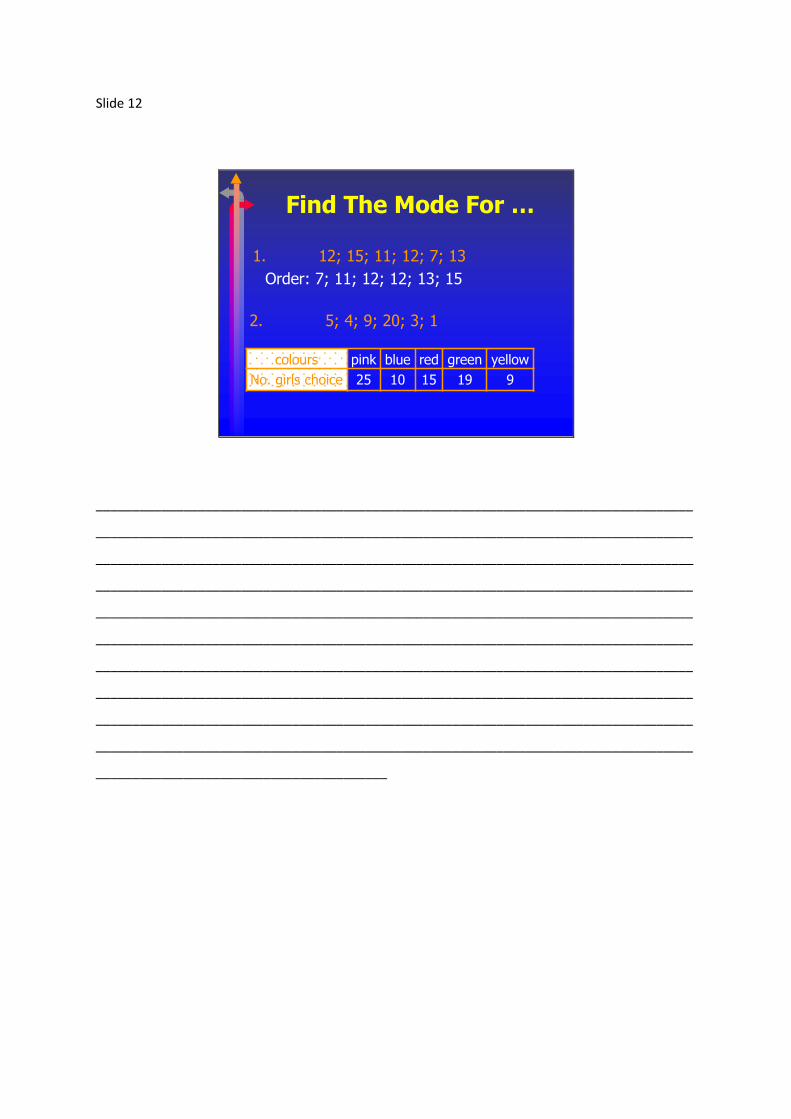
Find The Mode For …
Order: 7; 11; 12; 12; 13; 15
2. 5; 4; 9; 20; 3; 1
colours pink blue red green yellow
No. girls choice 25 10 15 19 9
1. 12; 15; 11; 12; 7; 13
__________________________________________________________________________________
__________________________________________________________________________________
__________________________________________________________________________________
__________________________________________________________________________________
__________________________________________________________________________________
__________________________________________________________________________________
__________________________________________________________________________________
__________________________________________________________________________________
__________________________________________________________________________________
__________________________________________________________________________________
________________________________________

Slide 13
Range = the difference (distance) between the smallest and largest numbers in a set of data e.g.
Range
Find the range of 12; 15; 11; 12; 7; 13
Order: 7; 11; 12; 12; 13; 15
smallest largest
Range = 15 – 7
Range = 8
__________________________________________________________________________________
__________________________________________________________________________________
__________________________________________________________________________________
__________________________________________________________________________________
__________________________________________________________________________________
__________________________________________________________________________________
__________________________________________________________________________________
__________________________________________________________________________________
__________________________________________________________________________________
__________________________________________________________________________________
________________________________________

Slide 14
Apply Your SkillsThe number of learners present
in your maths literacy class
over 3 weeks is:
28; 0; 25; 28; 23; 28; 27; 26; 27;
25; 28; 28; 28; 26; 25
1. Calculate the mean, median, mode and
range for this set of data.
2. Comment on the absenteeism in the class.
__________________________________________________________________________________
__________________________________________________________________________________
__________________________________________________________________________________
__________________________________________________________________________________
__________________________________________________________________________________
__________________________________________________________________________________
__________________________________________________________________________________
__________________________________________________________________________________
__________________________________________________________________________________
__________________________________________________________________________________
________________________________________


Slide 16
Your cell phone costs for the last 12 calls are:
R0,80; R1,20; R0,80; R2,25; R1,20; R0,80; R0,80; R5,25; R0,50; R3,50; R1;20; R3,00
1. What is the range of these costs?
2. Calculate the mean, median and mode.
Mean = Mode = Median =
__________________________________________________________________________________
__________________________________________________________________________________
__________________________________________________________________________________
__________________________________________________________________________________
__________________________________________________________________________________
__________________________________________________________________________________
__________________________________________________________________________________
__________________________________________________________________________________
__________________________________________________________________________________
__________________________________________________________________________________
________________________________________

Slide 17
Explain which indicator you think best represents your average cell phone call costs?
__________________________________________________________________________________
__________________________________________________________________________________
__________________________________________________________________________________
__________________________________________________________________________________
__________________________________________________________________________________
__________________________________________________________________________________
__________________________________________________________________________________
__________________________________________________________________________________
__________________________________________________________________________________
__________________________________________________________________________________
________________________________________
Related Documents


![Mean, Mode, Median[1]](https://static.cupdf.com/doc/110x72/54ba65874a7959a4578b45ff/mean-mode-median1.jpg)
![Mean, Mode, Median[1]](https://static.cupdf.com/doc/110x72/5462509daf7959fe1b8b57b8/mean-mode-median1-5584ae32b3357.jpg)