Mean mathematics performance, by school location, after accounting for socio-economic status Fig II.3.3 1 1 TALIS in Brief …representing more than 4 million teachers in 34 countries… Over 100 thousand randomly selected lower secondary teachers and their school leaders from over 6500 schools …took an internationally-agreed survey about the working conditions and learning environments in their schools… …responding to questions about their background, their teaching practices, support and development, their relationships with colleagues and students and the leadership in their schools

Welcome message from author
This document is posted to help you gain knowledge. Please leave a comment to let me know what you think about it! Share it to your friends and learn new things together.
Transcript

Mean mathematics performance, by school location, after accounting for socio-economic status
Fig II.3.311 TALIS in Brief
…representing more than 4 million teachers in 34 countries…
Over 100 thousand randomly selected lower secondary teach-ers and their school leaders from over 6500 schools
…took an internationally-agreed survey about the working condi-tions and learning environments in their schools…
…responding to questions about their background, their teaching practices, support and development, their relationships with col-leagues and students and the leadership in their schools

Mean mathematics performance, by school location, after accounting for socio-economic status
Fig II.3.322 Participating countries
*Note: TALIS only runs in a sub-national entity of the following countries: Belgium (Flemish Community), Canada (Alberta), United Arab Emirates (Abu Dhabi) and United Kingdom (England) . This map is for illustrative purposes and is without prejudice to the status of or sovereignty over any territory covered by this map.
TALIS 2008 & 2013
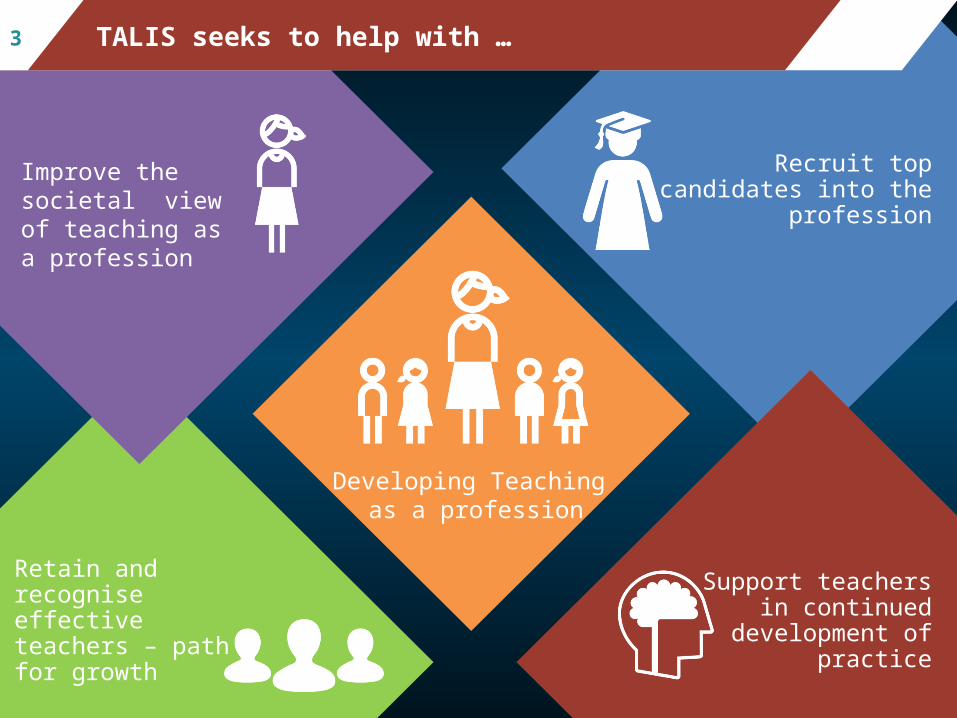
Developing Teaching as a profession
Recruit top candidates into the profession
Support teachers in continued
development of practice
Retain and recognise effective teachers – path for growth
Improve the societal view of teaching as a profession
Mean mathematics performance, by school location, after accounting for socio-economic status33 TALIS seeks to help with …

Mean mathematics performance, by school location, after accounting for socio-economic status
Fig II.3.344 Teachers' perceptions of the value of teaching
Percentage of lower secondary teachers who "agree" or "strongly agree" that teaching profession is a valued profession in society
Mala
ysi
a
Sin
gap
ore
Kore
a
Ab
u D
hab
i (U
AE)
Fin
lan
d
Mexic
o
Alb
ert
a (
Can
ad
a)
Fla
nd
ers
(B
elg
ium
)
Neth
erl
an
ds
Au
stra
lia
En
gla
nd
(U
K)
Rom
an
ia
Isra
el
Un
ited
Sta
tes
Ch
ile
Avera
ge
Norw
ay
Jap
an
Latv
ia
Serb
ia
Bu
lgari
a
Den
mark
Pola
nd
Icela
nd
Est
on
ia
Bra
zil
Italy
Cze
ch R
ep
ub
lic
Port
ug
al
Cro
ati
a
Sp
ain
Sw
ed
en
Fra
nce
Slo
vak R
ep
ub
lic
0
10
20
30
40
50
60
70
80
90
100
Perc
enta
ge o
f te
ach
ers
Above-average performers in PISA

Mean mathematics performance, by school location, after accounting for socio-economic status
Fig II.3.355Countries where teachers believe their profession is valued show higher levels of student achievement
Relationship between lower secondary teachers' views on the value of their profession in society and the country’s share of top mathematics performers in PISA 2012
0 10 20 30 40 50 60 70 800
5
10
15
20
25
30
35
40
45
Australia
Brazil
Bulgaria
Chile
Croatia
Czech Republic
Denmark
Estonia FinlandFrance
IcelandIsrael
Italy
Japan
Korea
Latvia
Mexico
Netherlands
Norway
Poland
Portugal
Romania
Serbia
Singapore
Slovak Republic
SpainSweden
Alberta (Canada)
England (UK)
Flanders (Belgium)
United States
Percentage of teachers who agree that teaching is valued in society
Sh
are
of
ma
the
ma
tics t
op
pe
rfo
rme
rs
R2 = 0.24 r= 0.49

Mean mathematics performance, by school location, after accounting for socio-economic status
Fig II.3.366 Most teachers value 21st century pedagogies…
Percentage of lower secondary teachers who "agree" or "strongly agree" that:
Students learn best by finding solutions to problems on their own
Thinking and reasoning processes are more important than specific curriculum content
Students should be allowed to think of solutions to practical problems themselves before the teacher shows them how they are solved
My role as a teacher is to facilitate students' own inquiry
0 10 20 30 40 50 60 70 80 90 100
United States Average

Students work on projects that require at least one week to complete
Students use ICT for projects or class work
Give different work to the students who have difficulties learning and/or to those who can advance faster
Students work in small groups to come up with a joint solution to a problem or task
Let students practice similar tasks until teacher knows that every student has understood the subject matter
Refer to a problem from everyday life or work to demonstrate why new knowledge is useful
Check students' exercise books or homework
Present a summary of recently learned content
0 20 40 60 80 100
United States Average
Mean mathematics performance, by school location, after accounting for socio-economic status
Fig II.3.377 …but teaching practices do not always reflect that
Percentage of lower secondary teachers who report using the following teaching practices "frequently" or "in all or nearly all lessons"

Dis
cuss
in
div
idu
al st
...
Sh
are
reso
urc
es
Team
con
fere
nce
s
Colla
bora
te f
or
com
m..
.
Team
teach
ing
Colla
bora
tive P
D
Join
t act
ivit
ies
Cla
ssro
om
ob
serv
ati
on
s
0
10
20
30
40
50
60
70
80
90
100Average
Perc
enta
ge o
f te
ach
ers
Professional collaboration
Percentage of lower secondary teachers who report doing the following activities at least once per month
Teacher co-operation8
Exchange and co-ordination

Mean mathematics performance, by school location, after accounting for socio-economic status
Fig II.3.399 Drivers of job satisfaction
The more frequently that
teachers report participating
in collaborative practices
with their colleagues,
the higher their level of
self-efficacy.
The same is true
for job satisfaction.
Mean mathematics performance, by school location, after accounting for socio-economic status
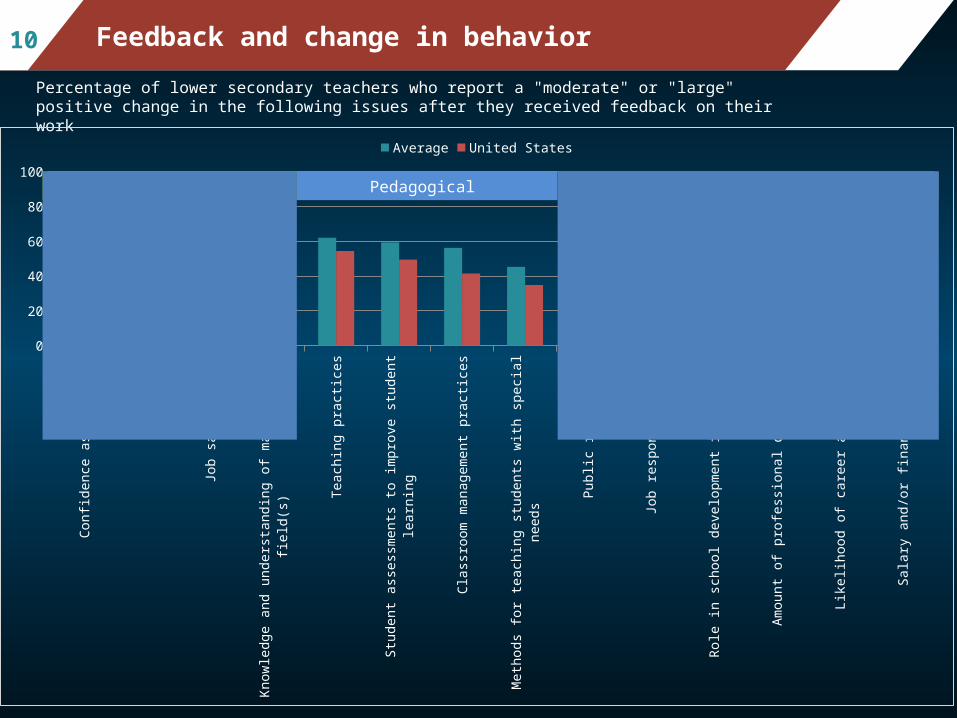
Fig II.3.31010 Feedback and change in behavior
Percentage of lower secondary teachers who report a "moderate" or "large" positive change in the following issues after they received feedback on their work
Con
fiden
ce a
s a
teac
her
Mot
ivat
ion
Job
satis
fact
ion
Kno
wle
dge
and
unde
rsta
ndin
g of
mai
n su
bjec
t fie
ld(s
)
Tea
chin
g pr
actic
es
Stu
dent
ass
essm
ents
to
impr
ove
stud
ent
lear
ning
Cla
ssro
om m
anag
emen
t pr
actic
es
Met
hods
for
tea
chin
g st
uden
ts w
ith s
peci
al n
eeds
Pub
lic r
ecog
nitio
n
Job
resp
onsi
bilit
ies
Rol
e in
sch
ool d
evel
opm
ent
initi
ativ
es
Am
ount
of
prof
essi
onal
dev
elop
men
t
Like
lihoo
d of
car
eer
adva
ncem
ent
Sal
ary
and/
or f
inan
cial
bon
us
0
10
20
30
40
50
60
70
80
90
100
Average United States
Personal Pedagogical Professional

Mean mathematics performance, by school location, after accounting for socio-economic status
Fig II.3.31111 Consequences of feedback
Percentage of lower secondary teachers who "agree" or "strongly agree" that:
If a teacher is consistently underperforming, he/she would be dismissed
The best performing teachers in this school receive the greatest recognition
Teacher appraisal and feedback have little impact upon the way teachers teach in the classroom
A mentor is appointed to help teachers improve his/her teaching
A development or training plan is established to improve their work as a teacher
0 20 40 60 80
United States Average

Mean mathematics performance, by school location, after accounting for socio-economic status
Fig II.3.31212
Percentage of lower secondary teachers who "agree" or "strongly agree" with the following statements
I would recommend my school as a good place to work
I enjoy working at this school
All in all, I am satisfied with my job
0 10 20 30 40 50 60 70 80 90 100
84
90
91
United States Average
Teachers' satisfaction with their working environment

Mean mathematics performance, by school location, after accounting for socio-economic status
Fig II.3.31313Behavioural issues equate to lower job satisfaction, class size doesn’t
Teachers' job satisfaction level following the number of students in the classroom in relation to the percentage of stu -dents with behavioural problems
15 o
r le
ss
16-2
0
21-2
5
26-3
0
31-3
5
36 o
r m
ore
10.0
10.5
11.0
11.5
12.0
12.5
13.0
Average United States
Class size (number of students)
Tea
cher
jo
b s
atis
fact
ion
(le
vel)
Non
e
1% t
o 10
%
11%
to
30%
31%
or
mor
e
10.0
10.5
11.0
11.5
12.0
12.5
13.0
Average United States
Students with behavioural problems
Tea
cher
jo
b s
atis
fact
ion
(le
vel)

TALIS is a partnership
between
Mean mathematics performance, by school location, after accounting for socio-economic status
Fig II.3.31414 TALIS in Brief
an international research consor-
tiumOECD
Governments in 34 countries
European Commission
Teachers’ unions
Find out more about TALIS at www.oecd.org/talis• All national and international publications• The complete micro-level database
Email: [email protected]: SchleicherEDU
and remember:Without data, you are just another person with an opinion
Related Documents