2012 YOUR NAME 7/10/2012 A Project Report on Ratio Analysis with reference to Genting Lanco Power Ltd.

Welcome message from author
This document is posted to help you gain knowledge. Please leave a comment to let me know what you think about it! Share it to your friends and learn new things together.
Transcript
2012
YOUR NAME 7/10/2012
A Project Report on Ratio Analysis with reference to Genting Lanco Power Ltd.

CERTIFICATE
This is to certify that Mr. J . YOUR NAME has
successfully completed the project work titled “ RATIO
ANALYSIS ” in partial fulfillment of requirement for the
award of POST GRADUATION DIPLOMA IN BUSINESS MANAGEMENT
prescribed by the COLLEGE NAME.
This project is the record of authentic work
carried out during the academic year (2006 – 2008).
2
DECLARATION
I YOUR NAME hereby declare that this
project is the record of authentic work carried out by me
during the academic year 2006 – 2008 and has not been
submitted to any other University or Institute towards the
award of any degree.
Signature of the student
3
ACKNOWLEDGEMENT
I am very much obliged and indebted to Mr.
LIM KIM BAK, General Manager of Genting Lanco Power
(India) Private Limited for his approval and
valuable suggestions to take up the project.
I also extend my gratitude to Mr. B. V.
Jayaram, Manager Finance, Commercial and
Administration for his approval and valuable
4

suggestions to take up the project in Genting Lanco
Power (India) Private Limited.
I express my deep sense of gratitude to
Mr.Ravi Seshagiri Rao Accounts Officer Finance,
Commercial and Administration for his valuable
suggestions, consistent help and personal interest
during my project work.
I am also thankful to Mr. B. Vimal kumar,
Accountant Trainee for his support and suggestions
during the project.
I am very pleased to express my deep sense
of gratitude to Mr. R. RAMACHANDRA NAIK Associate
professor for his consistent encouragement. I shall
forever cherish my association with her for
exuberant encouragement, perennial approachability,
absolute freedom of thought and action I have
enjoyed during the course of the project.
5

Chapter – 1
INTRODUCTION
6
I ntroduction
Financial Management is the specific area
of finance dealing with the financial decision
corporations make, and the tools and analysis used
to make the decisions. The discipline as a whole
may be divided between long-term and short-term
decisions and techniques. Both share the same goal
of enhancing firm value by ensuring that return on
capital exceeds cost of capital, without taking
excessive financial risks.
Capital investment decisions comprise the long-
term choices about which projects receive
investment, whether to finance that investment with
equity or debt, and when or whether to pay
dividends to shareholders. Short-term corporate
finance decisions are called working capital management
and deal with balance of current assets and current
liabilities by managing cash, inventories, and
short-term borrowings and lending (e.g., the credit
terms extended to customers).
7

Corporate finance is closely related to
managerial finance, which is slightly broader in
scope, describing the financial techniques
available to all forms of business enterprise,
corporate or not.
8

Role of Financial Managers:
The role of a financial manager can be
discussed under the following heads:
1.Nature of work
2.Working conditions
3.Employment
4.Training, Other qualifications and Advancement
5.Job outlook
6.Earnings
7.Related occupations
Let us discuss each of these in a detailed manner.
9
NEED OF THE STUDY
1.The study has great significance and provides
benefits to various parties whom directly or
indirectly interact with the company.
2.It is beneficial to management of the company
by providing crystal clear picture regarding
important aspects like liquidity, leverage,
activity and profitability.
3.The study is also beneficial to employees and
offers motivation by showing how actively they
are contributing for company’s growth.
4.The investors who are interested in investing
in the company’s shares will also get benefited
by going through the study and can easily take
a decision whether to invest or not to invest
in the company’s shares.
10
OBJECTIVES
The major objectives of the resent study
are to know about financial strengths and weakness
of LANCO through FINANCIAL RATIO ANALYSIS.
The main objectives of resent study aimed as:
To evaluate the performance of the company
by using ratios as a yardstick to measure the
efficiency of the company. To understand the
liquidity, profitability and efficiency positions
of the company during the study period. To evaluate
11

and analyze various facts of the financial
performance of the company. To make comparisons
between the ratios during different periods.
OBJECTIVES
1.To study the present financial system at
Genting Lanco.
2.To determine the Profitability, Liquidity
Ratios.
3.To analyze the capital structure of the company
with the help of Leverage ratio.
4.To offer appropriate suggestions for the better
performance of the organization
METHODOLOGY
The information is collected through
secondary sources during the project. That
12
information was utilized for calculating
performance evaluation and based on that,
interpretations were made.
Sources of secondary data:
1.Most of the calculations are made on the
financial statements of the company provided
statements.
2.Referring standard texts and referred books
collected some of the information regarding
theoretical aspects.
3.Method- to assess the performance of he company
method of observation of the work in finance
department in followed.
13
LIMITATIONS
1.The study provides an insight into the
financial, personnel, marketing and other
aspects of LANCO. Every study will be bound
with certain limitations.
2.The below mentioned are the constraints under
which the study is carried out.
3.One of the factors of the study was lack of
availability of ample information. Most of the
information has been kept confidential and as
such as not assed as art of policy of company.
Time is an important limitation. The whole
study was conducted in a period of 60 days, which
14

is not sufficient to carry out proper
interpretation and analysis.
15

Chapter – 2
16

POWER INDUSTRY
17
INDUSTRY PROFILE
ELECTRICITY is one of the vital
requirements in the over all development of the
economy and is therefore, appropriately called the
‘Wheel of Development’. In fact, the power sector
has played a dominant role in the socio-economic
development of the county. As a convenient
versatile and relatively cheap form of energy it
plays a crucial role in agriculture, transport,
industry and domestic sector. Hence power has all
along remained in the priority list of Indian
planners and plan outlays have reflected this
aspect. The outlays for power sector have been
around 19% of the total outlays for the public
sector in various plan periods.
There has been a spectacular increase in
the installed generating capacity of electricity in
the country. Starting with a capacity of about
1360MW at the time of independence,
Despite tremendous increase in the
availability of power since independence there is
18

acute power shortage gap between demand and supply.
The per capita consumption of power in the country
is very low as compared to the position in the
developed countries. Power is a key input for
economic growth has as direct relationship with the
national productivity as also the overall economy
of the country.
There has been diversification of the
sources of generation in terms of hydel, thermal
and nuclear sources. The share of hydel in the
total generating capacity had drastically come down
and that of thermal had shown noticeable increase.
Another significant change is the increasing share
of Central sectors in recent years.
The share of the thermal element in the
installed generating capacity, which is also
predominantly coal-based, shows a steady increase.
Thus, the relatively cheaper and a more desirable
change in terms of a higher share of hydel source,
which is renewable, have not materialized.
19
POWER SCENARIO
The power sector is at cross roads today.
There is a chronic power shortage in the country
mainly attributable to demand of power continuously
outstripping the supply.
HYDEL POWER
In the present global energy context,
there are certain aspects, which have acquired a
new significance. The development of hydropower has
to be given a major thrust in the current decade.
We still have large untapped hydro power potential,
but its development has slowed down on account of
lack of financial resources, interstate rivalry,
inefficiency of certain state electricity boards,
variations in the course of the monsoons etc. a
concerted effort is imperative to overcome the
hurdles and enlarge the share of the hydro power
generation in the country. This will help not only
in tapping a renewable resource of energy, but will
provide essentially needed peaking support to
thermal power generation with the pattern of demand
20
for electricity. Since the planners’ initial
enthusiasm about the large hydel projects has waned
somewhat, India will do well to take recourse to
the Chinese pattern of micro and mini hydel
projects wherever the terrain is suitable.
MINI HYDEL PLANTS:
There are a number of states in the
Country where mini hydel projects can be set up at
comparatively lower investments to supplement other
sources of energy. According to reliable estimates
the total potential of mini-hydel plants all over
the country is around 5000MW. This includes 2,000MW
in hilly areas at “high heads and low discharge”
points and 300MW at “low heads and low Discharge”
points. Particular drops and irrigation systems.
THERMAL POWER:
Thermal units have emerged as the largest
source of power in India. But unfortunately, the
progress of power generation in this sector has not
21
been marked by any new breakthrough. At present
stress continues to be laid on thermal power
station because of shorter construction time. Using
better project management techniques is shortening
the construction period for these plants. It has
been possible to improve overall efficiency of
thermal plant by using gas turbines in conjunction
with conventional steam turbines.
The union government has, in order to step
up central generation in the country, established
super thermal power Station in different regions.
The National Thermal power Corporation (NTPC) was
established in 1975 with the object of planning,
promoting and organizing integrated development of
thermal power in the country.
22

GEO POWER SYSTEM
Geo Power System is a natural air-
conditioning system for residential and commercial
premises, using geothermal energy available beneath
the ground surface at a depth of 5 meters. It is
intelligently designed to ventilate the interiors
to all corners and to effectively enhance the
internal conditions by removal of formaldehyde
which is harmful to ones health. This system
provides natural environment-like conditions to
oneself, increases house life and protects the
environment.
NUCLEAR ENERGY:
The planners, right from the beginning
understood the importance of nuclear energy in
meeting the country’s long-term energy needs.
Recognizing that nuclear technology would be
subject to a progressively restrictive technology
central regime and also that the long term
strategies for exploitation of the country’s vast
thorium resources are bound to be some what
23

different from those of most other countries
engaged in nuclear power development, tremendous
emphasis was placed on achieving self reliance in
technology development. This policy has yielded
rich dividends and today one can proudly use the
realization of indigenous capability in all aspects
of the nuclear fuel cycle.
OCEAN ENERGY:
The long standing proposal to tap non-
conventional source of ocean energy for power
generation is expected to get a fillip with a joint
team of the Tamilnadu electricity Board and the
Ocean Energy Cell of Indian Institute of
Technology, Madras commending the offer of the U.S.
based firm sea solar power (SSP) to set up 6 Ocean
Thermal Energy Conversion (OTEC) plants of 100 MW
capacities each along the Tamilnadu Coast for
serious consideration and recommending the setting
up of one plant to begin with at Kulasekarpatnam
area.
24

WIND ENERGY:
Wind energy is fast emerging as the most
cost-effective source of power as it combines the
abundance of a natural element with modern
technology. The growing interest in wind power
technology can be attributed not only to its cost
effectiveness but also to other attractive features
like modularity, short project gestation and the
non-polluting nature of the technology. In India,
the exercise to harness wing energy includes wind
pumps, wind battery chargers, stand alone wind
electric generators and grid connected wind farms.
The department of non-conventional energy sources
(DNES) in association with state agencies has been
responsible for creating and sustaining interest in
the field.
SOLAR ENERGY:
It is believed that with just 0.1 per cent
of the 75,000 trillion kHz of solar energy that
reaches the earth, planet’s energy requirement can
25
be satisfied. Electricity can be generated with the
help of solar energy through the solar thermal
route, as well as directly from sunlight with the
help of Solar PhotoVoltaic (SPV) technology. SPV
Systems are being used for lighting, water pumping,
and telecommunications and also for village size
power plants in rural areas. SPV systems are being
used to provide lighting under the National
Literacy mission, refrigeration for vaccine storage
and transport under the National immunization
programme, drinking water and power for
telecommunications. Indian railways have been using
this technology for signaling.
PROBLEMS:
The power sector in India is beset with a
number of problems. They relate to delays in the
formulation and implementation of various projects,
poor utilization of capacity, bottlenecks in the
supply of coal to thermal station, and its poor
quality, faulty distribution and transmission
arrangements and bad planning leading to an
26

injudicious hydel thermal mix. Ecological problems
are also vexing this sector.
Hurdles in environmental clearances tend
to slow down completion of power projects.
Compensatory afforestation and land acquisition
have proved to be major bottlenecks in the
clearance of power projects. The main problem faced
in the case of environmental clearances is the
shortage of land for compensatory afforestation.
While project authorities are prepared to invest
funds in afforestation land, the state governments
are not able to provide the required land. The
Government has proposed to set up a task force to
look into clearances for power projects and speed
up the clearances.
27

Chapter – 3
OVERVIEW OF
LANCO GROUP
28

PROFILE OF GENTING LANCO POWER (INDIA) PRIVATE
LIMITED
(OPERATIONS & MAINTENANCE COMPANY FOR LANCO
KONDAPALLI POWER PRIVATE LIMITED)
Genting Lanco Power (India) Private
Limited is a subsidiary of Genting group of
companies based at Kuala Lumpur, Malaysia. Genting
group has its presence in diversified fields like
Power, Plantations, Paper & Packaging,
Entertainment, Resorts & Hotels, Property
development, Cruise liners, e Commerce, Oil and
Gas.
Genting group is Malaysia’s leading
multinational corporation and one of Asia’s best-
managed companies with over 36,000 employees
globally. The group is renowned for its strong
management leadership, financial prudence and sound
investment discipline.
The combined market capitalization of the
group is about
29
US $9 billion. The operating revenue for the group
for the year 2007 is
US $1.53 billion.
Genting Lanco Power (India) Private
Limited has entered in to a 15 years Operations and
Maintenance Agreement with Lanco Kondapalli Power
Private Limited, who are the owners of the 368 MW
gas fired combined cycle power plant at kondapalli.
Genting Lanco Power (India) Private
Limited has its registered office at Lanco
Kondapalli Power Plant, Kondapalli IDA, and Krishna
District.
LANCO GROUP PROFILE
LANCO Group, headquartered in Hyderabad,
India is one of the leading business houses in
South India. It has an asset base of US $ 450
million and a turnover of more than US $ 300
million. With operational experience in power
plants based on Gas, Biomass and Wind and an
operating capacity of 509 MW, LANCO is heading for
30

a capacity of 2500 MW and an asset base of US $ 2.5
billion by the year 2010.
Lanco is a well-diversified group with
activities like power generation, engineering and
construction, manufacturing, Information technology
(IT), and property development. Lanco group is
striving to Empower, Enable and Enrich partner,
business associates and to be the chosen vehicle
for growth for stakeholders and source of
inspiration to the society. The group is recognized
as a leading player in the Indian economic scenario
with operation in USA and UK. LANCO also has
presence in Civil Construction, Property
Development, Manufacturing of Pig Iron & Ductile
Iron Spun Pipes and Information Technology. LANCO’s
overall growth is attributed to its technical,
Commercial and managerial skills, which is
appreciated by its International partners –
Commonwealth Development Corporation
(ACTIS/Globules) of the United Kingdom, Genting
Group of Malaysia and Doosan of Korea.
31

OBJECTIVES
1.To provide basic amenities for the rural
poor.
2.To save arts of historical relevance which
are on the verge of extinction.
3.To develop integrated programmes for the
differently abled.
4.To encourage fresh talent in the area of
sports.
5.To take up other humanitarian activities.
6.the substantial part of the power
requirement.
QUALITY POLICY
We are committed to continually improve
the quality of our performance through the
application of our Quality policy.
32

1.Utilizing Commercial, Engineering and Human
Resources, to Minimize Risks to Personnel,
Plant & Equipment and Maximize plant
Availability for Generation of Power.
2.Providing the best policies level of commercial
performance for the benefit of all Stake
Holders.
3.Implementing prudent utility practices and
providing Healthy and Excellent Working
Environment in all Disciplines of Engineering
and Business as documented in the Quality
System.
4.Treating all staff & families fairly and with
respect while encouraging personnel growth.
COMPANY HIGH LIGHTS
1.368.144 MW combined cycle power plant under build
– operate – own arrangement with the state
government.
2.The single largest investment in Andhra Pradesh,
by any Andhra Pradesh based group.
33

3.Power purchase agreement firmed with AP TRANSCO
for 15 years.
4.Eco – friendly, adhering to highest standards of
safety and conversion of natural resources.
5.The first project cleared by Central Electricity
Authority (CEA) under the international
competitive Bidding (ICB) route for power
projects in India.
6.The first of the ICB power projects in India to
achieve financial closure and complete
construction in shortest possible time.
7.One of the lowest evacuations costs to AP
TRANSCO.
8.The first private sector power project to receive
disbursement of finance from Power Finance
Corporation limited, India.
9.The shortest construction time in the private
sector
10. Location advantages include:
a)Proximity to National and state Highway
b)Just 1.5 km from fuel storage facility of
Hindustan Petroleum Corporation limited.
34

c)Close to the river Krishna and up stream
of the Prakasam Barrage ensuring perennial
water supply.
d)Adjacent to 220 kWh Substation of AP
TRANSCO.
35

Chapter – 4
36
RATIO ANALYSIS
37
RATIO ANALYSIS
FINANCIAL ANALYSIS
Financial analysis is the process of
identifying the financial strengths and weaknesses
of the firm and establishing relationship between
the items of the balance sheet and profit & loss
account.
Financial ratio analysis is the
calculation and comparison of ratios, which are
derived from the information in a company’s
financial statements. The level and historical
trends of these ratios can be used to make
inferences about a company’s financial condition,
its operations and attractiveness as an investment.
The information in the statements is used by
Trade creditors, to identify the firm’s ability
to meet their claims i.e. liquidity position of
the company.
38

Investors, to know about the present and future
profitability of the company and its financial
structure.
Management, in every aspect of the financial
analysis. It is the responsibility of the
management to maintain sound financial
condition in the company.
RATIO ANALYSIS
The term “Ratio” refers to the numerical
and quantitative relationship between two items or
variables. This relationship can be exposed as
Percentages
Fractions
Proportion of numbers
39

Ratio analysis is defined as the
systematic use of the ratio to interpret the
financial statements. So that the strengths and
weaknesses of a firm, as well as its historical
performance and current financial condition can be
determined. Ratio reflects a quantitative
relationship helps to form a quantitative judgment.
STEPS IN RATIO ANALYSIS
The first task of the financial analysis is to
select the information relevant to the decision
under consideration from the statements and
calculates appropriate ratios.
To compare the calculated ratios with the
ratios of the same firm relating to the pas6t
or with the industry ratios. It facilitates in
assessing success or failure of the firm.
Third step is to interpretation, drawing of
inferences and report writing conclusions are
40
drawn after comparison in the shape of report
or recommended courses of action.
BASIS OR STANDARDS OF COMPARISON
Ratios are relative figures reflecting the
relation between variables. They enable analyst to
draw conclusions regarding financial operations.
They use of ratios as a tool of financial analysis
involves the comparison with related facts. This is
the basis of ratio analysis. The basis of ratio
analysis is of four types.
Past ratios, calculated from past financial
statements of the firm.
Competitor’s ratio, of the some most
progressive and successful competitor firm at
the same point of time.
Industry ratio, the industry ratios to which
the firm belongs to
41
Projected ratios, ratios of the future
developed from the projected or pro forma
financial statements
NATURE OF RATIO ANALYSIS
Ratio analysis is a technique of analysis
and interpretation of financial statements. It is
the process of establishing and interpreting
various ratios for helping in making certain
decisions. It is only a means of understanding of
financial strengths and weaknesses of a firm. There
are a number of ratios which can be calculated from
the information given in the financial statements,
but the analyst has to select the appropriate data
and calculate only a few appropriate ratios. The
42
following are the four steps involved in the ratio
analysis.
Selection of relevant data from the financial
statements depending upon the objective of the
analysis.
Calculation of appropriate ratios from the
above data.
Comparison of the calculated ratios with the
ratios of the same firm in the past, or the
ratios developed from projected financial
statements or the ratios of some other firms or
the comparison with ratios of the industry to
which the firm belongs.
INTERPRETATION OF THE RATIOS
The interpretation of ratios is an
important factor. The inherent limitations of ratio
analysis should be kept in mind while interpreting
them. The impact of factors such as price level
changes, change in accounting policies, window
dressing etc., should also be kept in mind when
43
attempting to interpret ratios. The interpretation
of ratios can be made in the following ways.
Single absolute ratio
Group of ratios
Historical comparison
Projected ratios
Inter-firm comparison
GUIDELINES OR PRECAUTIONS FOR USE OF RATIOS
The calculation of ratios may not be a
difficult task but their use is not easy. Following
guidelines or factors may be kept in mind while
interpreting various ratios are
Accuracy of financial statements
Objective or purpose of analysis
Selection of ratios
Use of standards
44

Caliber of the analysis
IMPORTANCE OF RATIO ANALYSIS
Aid to measure general efficiency
Aid to measure financial solvency
Aid in forecasting and planning
Facilitate decision making
Aid in corrective action
Aid in intra-firm comparison
Act as a good communication
Evaluation of efficiency
Effective tool
LIMITATIONS OF RATIO ANALYSIS
Differences in definitions
45

Limitations of accounting records
Lack of proper standards
No allowances for price level changes
Changes in accounting procedures
Quantitative factors are ignored
Limited use of single ratio
Background is over looked
Limited use
Personal bias
CLASSIFICATIONS OF RATIOS
The use of ratio analysis is not confined
to financial manager only. There are different
parties interested in the ratio analysis for
knowing the financial position of a firm for
different purposes. Various accounting ratios can
be classified as follows:
1.Traditional Classification
2.Functional Classification
46
3.Significance ratios
1. Traditional Classification
It includes the following.
Balance sheet (or) position statement ratio:
They deal with the relationship between two
balance sheet items, e.g. the ratio of current
assets to current liabilities etc., both the
items must, however, pertain to the same
balance sheet.
Profit & loss account (or) revenue statement
ratios: These ratios deal with the relationship
between two profit & loss account items, e.g.
the ratio of gross profit to sales etc.,
Composite (or) inter statement ratios: These
ratios exhibit the relation between a profit &
loss account or income statement item and a
balance sheet items, e.g. stock turnover ratio,
or the ratio of total assets to sales.
2. Functional Classification
47

These include liquidity ratios, long term
solvency and leverage ratios, activity ratios and
profitability ratios.
3. Significance ratios
Some ratios are important than others and
the firm may classify them as primary and secondary
ratios. The primary ratio is one, which is of the
prime importance to a concern. The other ratios
that support the primary ratio are called secondary
ratios.
IN THE VIEW OF FUNCTIONAL CLASSIFICATION THE RATIOS
ARE
1. Liquidity ratio
2. Leverage ratio
3. Activity ratio
4. Profitability ratio
48

Chapter – 5
49

DATA ANALYSIS
50
LIQUIDITY RATIO
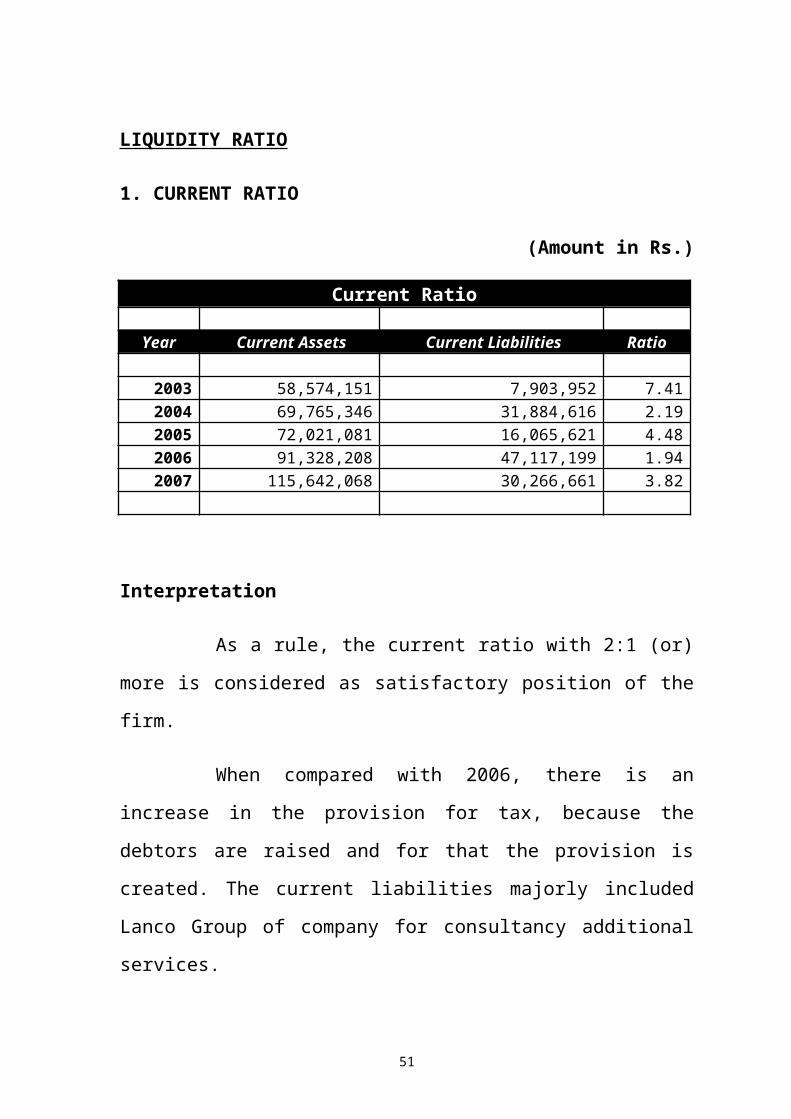
1. CURRENT RATIO
(Amount in Rs.)
Current Ratio
Year Current Assets Current Liabilities Ratio
2003 58,574,151 7,903,952 7.412004 69,765,346 31,884,616 2.192005 72,021,081 16,065,621 4.482006 91,328,208 47,117,199 1.942007 115,642,068 30,266,661 3.82
Interpretation
As a rule, the current ratio with 2:1 (or)
more is considered as satisfactory position of the
firm.
When compared with 2006, there is an
increase in the provision for tax, because the
debtors are raised and for that the provision is
created. The current liabilities majorly included
Lanco Group of company for consultancy additional
services.
51
The sundry debtors have increased due to
the increase to corporate taxes.
In the year 2006, the cash and bank
balance is reduced because that is used for payment
of dividends. In the year 2007, the loans and
advances include majorly the advances to employees
and deposits to government. The loans and advances
reduced because the employees set off their claims.
The other current assets include the interest
attained from the deposits. The deposits reduced
due to the declaration of dividends. So the other
current assets decreased.
The huge increase in sundry debtors
resulted an increase in the ratio, which is above
the benchmark level of 2:1 which shows the
comfortable position of the firm.
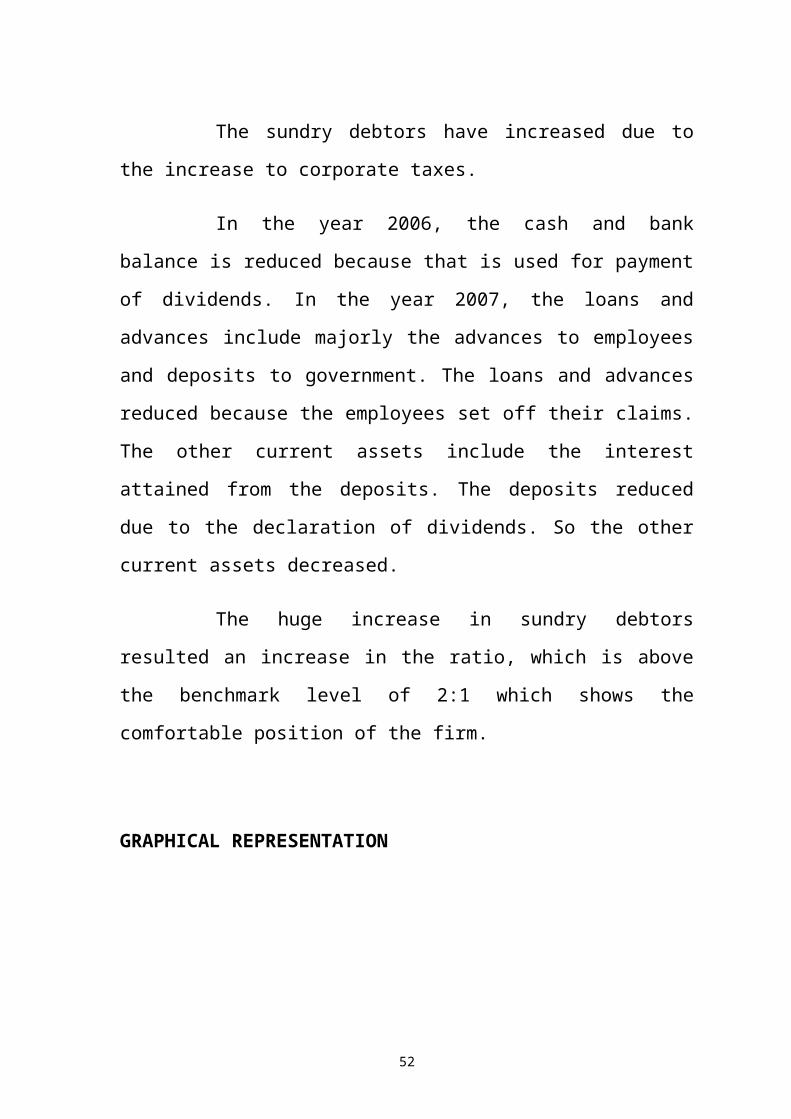
GRAPHICAL REPRESENTATION
52

2.
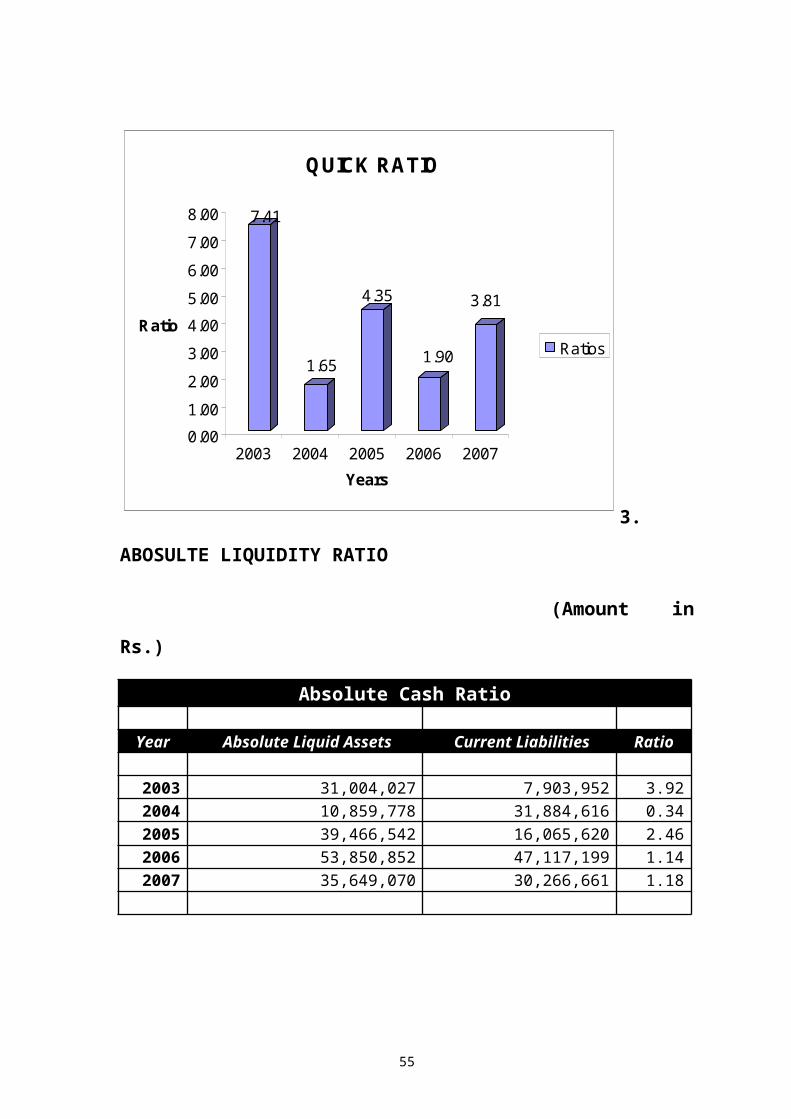
QUICK RATIO
(Amount in Rs.)
Quick Ratio
Year Quick Assets Current Liabilities Ratio
2003 58,574,151 7,903,952 7.412004 52,470,336 31,884,616 1.652005 69,883,268 16,065,620 4.352006 89,433,596 47,117,199 1.92007 115,431,868 30,266,661 3.81
7.41
2.19
4.48
1.94
3.82
0.001.002.003.004.005.006.007.008.00
Ratio
2003 2004 2005 2006 2007Years
CURRENT RATIO
Ratio
53
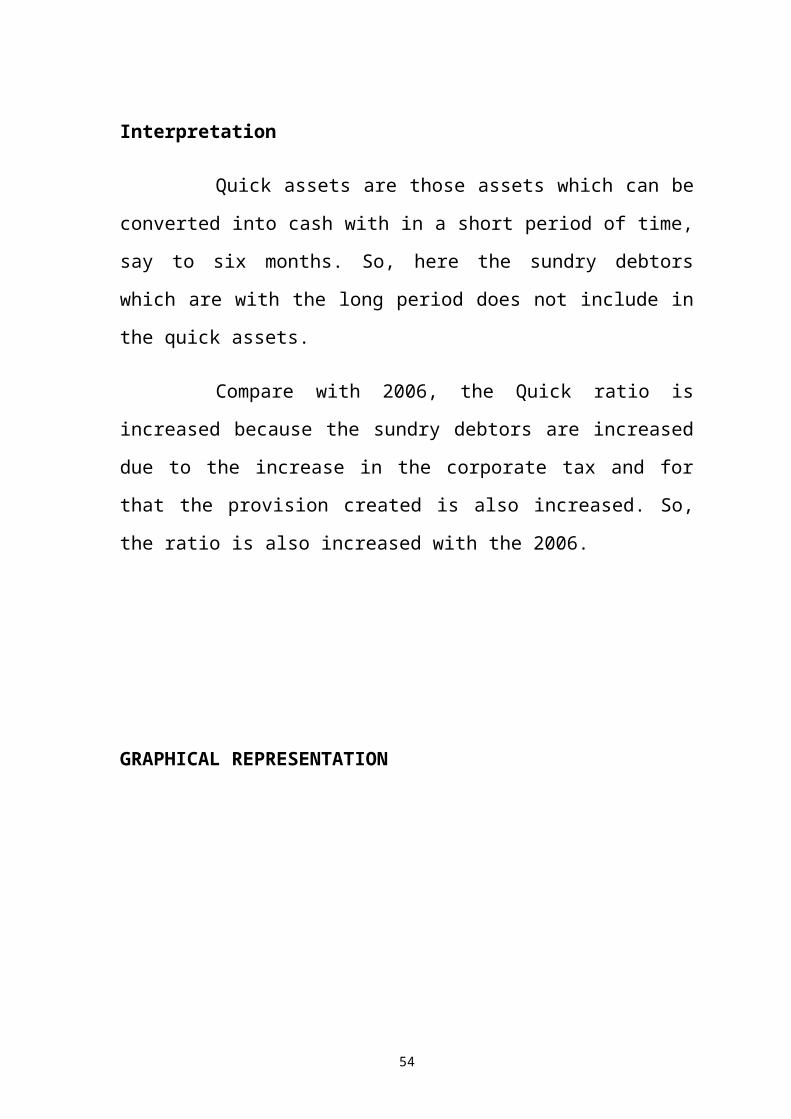
Interpretation
Quick assets are those assets which can be
converted into cash with in a short period of time,
say to six months. So, here the sundry debtors
which are with the long period does not include in
the quick assets.
Compare with 2006, the Quick ratio is
increased because the sundry debtors are increased
due to the increase in the corporate tax and for
that the provision created is also increased. So,
the ratio is also increased with the 2006.
GRAPHICAL REPRESENTATION
54
3.
ABOSULTE LIQUIDITY RATIO
(Amount in
Rs.)
Absolute Cash Ratio
Year Absolute Liquid Assets Current Liabilities Ratio 2003 31,004,027 7,903,952 3.922004 10,859,778 31,884,616 0.342005 39,466,542 16,065,620 2.462006 53,850,852 47,117,199 1.142007 35,649,070 30,266,661 1.18
7.41
1.65
4.35
1.90
3.81
0.001.002.003.004.005.006.007.008.00
Ratio
2003 2004 2005 2006 2007Years
QUICK RATIO
Ratios
55
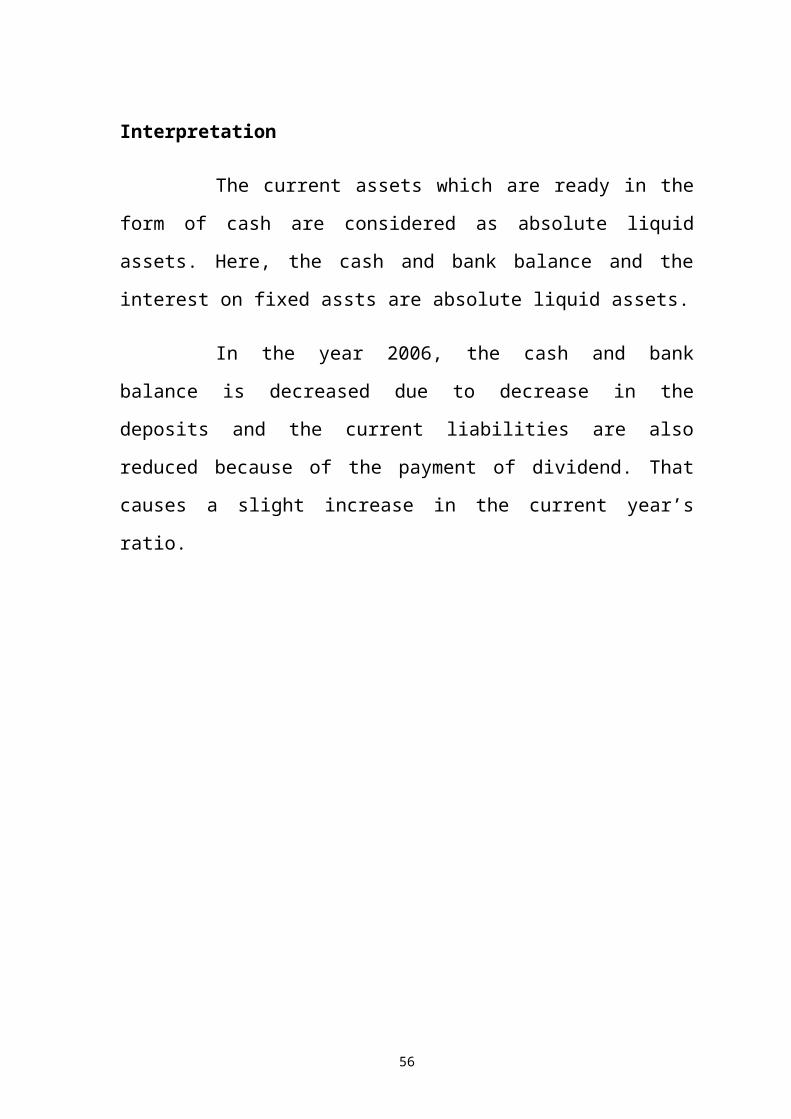
Interpretation
The current assets which are ready in the
form of cash are considered as absolute liquid
assets. Here, the cash and bank balance and the
interest on fixed assts are absolute liquid assets.
In the year 2006, the cash and bank
balance is decreased due to decrease in the
deposits and the current liabilities are also
reduced because of the payment of dividend. That
causes a slight increase in the current year’s
ratio.
56

GRAPHICAL REPRESENTATION
57
LEVER
AGE RATIOS
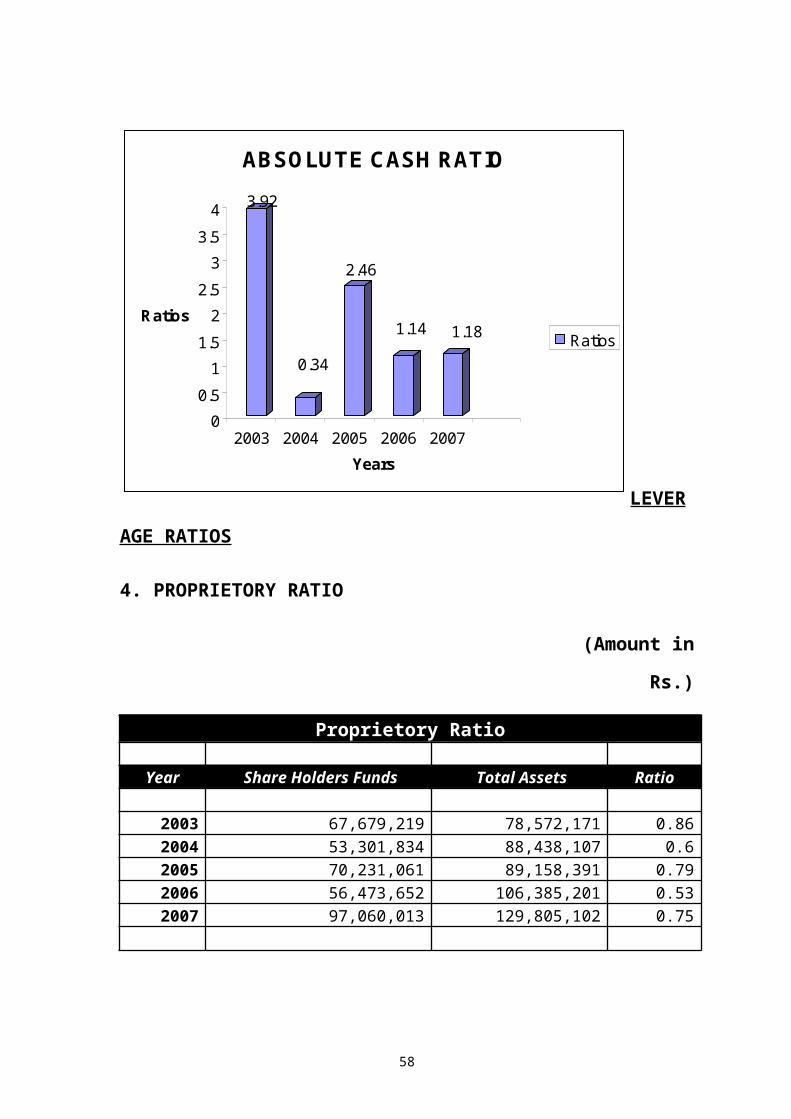
4. PROPRIETORY RATIO
(Amount in
Rs.)
Proprietory Ratio
Year Share Holders Funds Total Assets Ratio
2003 67,679,219 78,572,171 0.862004 53,301,834 88,438,107 0.62005 70,231,061 89,158,391 0.792006 56,473,652 106,385,201 0.532007 97,060,013 129,805,102 0.75
3.92
0.34
2.46
1.14 1.18
00.51
1.52
2.53
3.54
Ratios
2003 2004 2005 2006 2007Years
ABSOLUTE CASH RATIO
Ratios
58
Interpretation
The proprietary ratio establishes the
relationship between shareholders funds to total
assets. It determines the long-term solvency of the
firm. This ratio indicates the extent to which the
assets of the company can be lost without affecting
the interest of the company.
There is no increase in the capital from
the year2004. The share holder’s funds include
capital and reserves and surplus. The reserves and
surplus is increased due to the increase in balance
in profit and loss account, which is caused by the
increase of income from services.
Total assets, includes fixed and current
assets. The fixed assets are reduced because of the
depreciation and there are no major increments in
the fixed assets. The current assets are increased
compared with the year 2006. Total assets are also
increased than precious year, which resulted an
increase in the ratio than older.
59

GRAPHICAL REPRESENTATION
60
ACTIV
ITY RATIOS
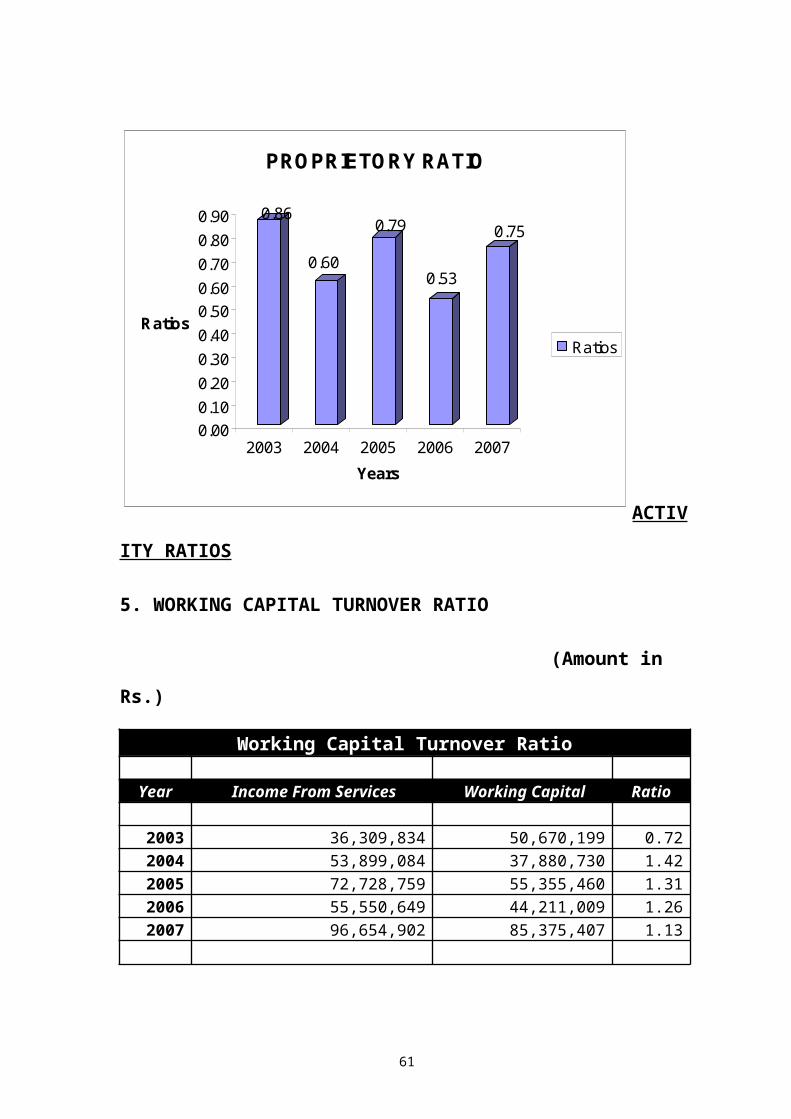
5. WORKING CAPITAL TURNOVER RATIO
(Amount in
Rs.)
Working Capital Turnover Ratio
Year Income From Services Working Capital Ratio
2003 36,309,834 50,670,199 0.722004 53,899,084 37,880,730 1.422005 72,728,759 55,355,460 1.312006 55,550,649 44,211,009 1.262007 96,654,902 85,375,407 1.13
0.86
0.60
0.79
0.53
0.75
0.000.100.200.300.400.500.600.700.800.90
Ratios
2003 2004 2005 2006 2007Years
PROPRIETORY RATIO
Ratios
61
Interpretation
Income from services is greatly increased
due to the extra invoice for Operations &
Maintenance fee and the working capital is also
increased greater due to the increase in from
services because the huge increase in current
assets.
The income from services is raised and
the current assets are also raised together
resulted in the decrease of the ratio of 2007
compared with 2006.
62

GRAPHICAL REPRESENTATION
63
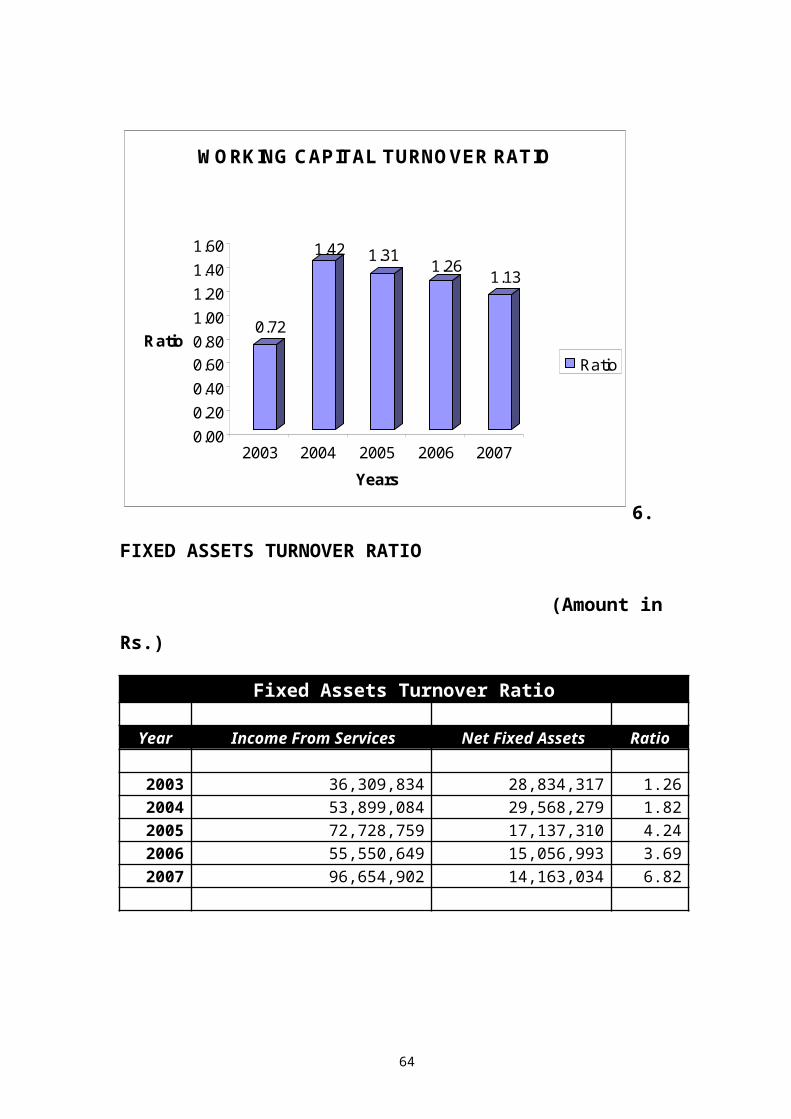
6.
FIXED ASSETS TURNOVER RATIO
(Amount in
Rs.)
Fixed Assets Turnover Ratio
Year Income From Services Net Fixed Assets Ratio
2003 36,309,834 28,834,317 1.262004 53,899,084 29,568,279 1.822005 72,728,759 17,137,310 4.242006 55,550,649 15,056,993 3.692007 96,654,902 14,163,034 6.82
0.72
1.42 1.31 1.26 1.13
0.000.200.400.600.801.001.201.401.60
Ratio
2003 2004 2005 2006 2007Years
W O RKING CAPITAL TURNO VER RATIO
Ratio
64
Interpretation
Fixed assets are used in the business for
producing the goods to be sold. This ratio shows
the firm’s ability in generating sales from all
financial resources committed to total assets. The
ratio indicates the account of one rupee investment
in fixed assets.
The income from services is greaterly
increased in the current year due to the increase
in the Operations & Maintenance fee due to the
increase in extra invoice and the net fixed assets
are reduced because of the increased charge of
depreciation. Finally, that effected a huge
increase in the ratio compared with the previous
year’s ratio.
65

GRAPHICAL REPRSENTATION
66
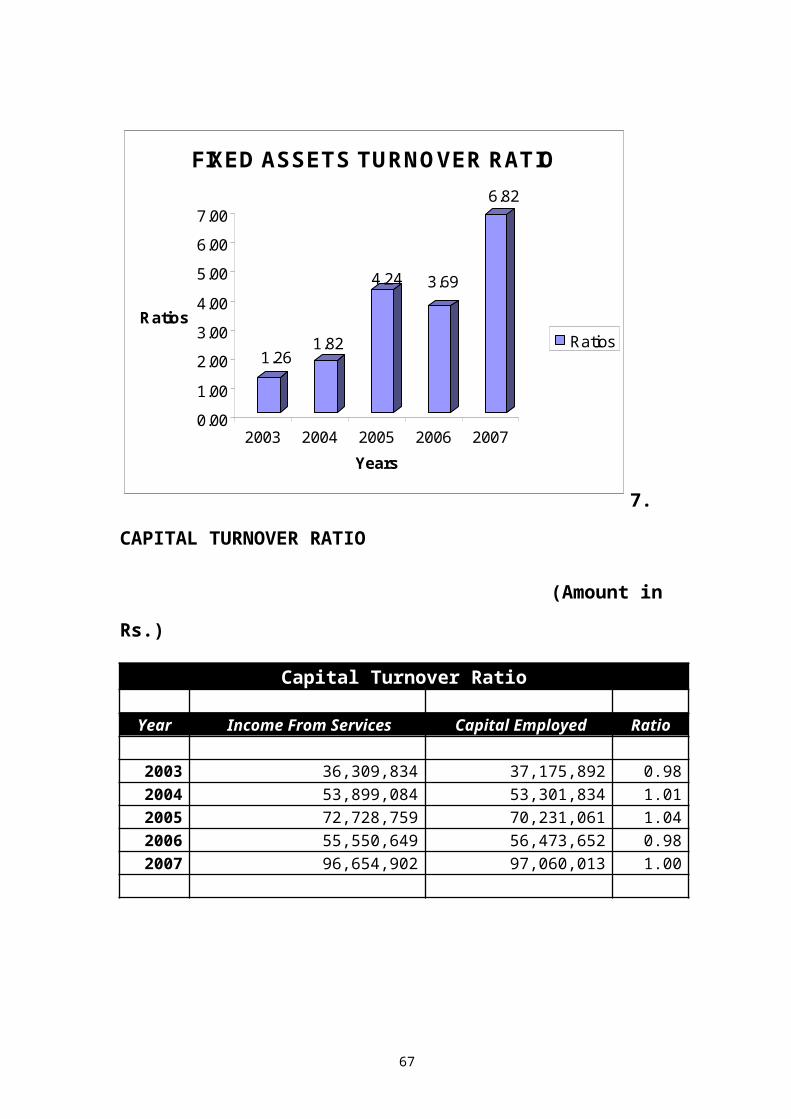
7.
CAPITAL TURNOVER RATIO
(Amount in
Rs.)
Capital Turnover Ratio
Year Income From Services Capital Employed Ratio 2003 36,309,834 37,175,892 0.982004 53,899,084 53,301,834 1.012005 72,728,759 70,231,061 1.042006 55,550,649 56,473,652 0.982007 96,654,902 97,060,013 1.00
1.261.82
4.24 3.69
6.82
0.001.002.003.004.005.006.007.00
Ratios
2003 2004 2005 2006 2007Years
FIXED ASSETS TURNOVER RATIO
Ratios
67
Interpretation
This is another ratio to judge the
efficiency and effectiveness of the company like
profitability ratio.
The income from services is greaterly
increased compared with the previous year and the
total capital employed includes capital and
reserves & surplus. Due to huge increase in the net
profit the capital employed is also increased along
with income from services. Both are effected in the
increment of the ratio of current year.
68

GRAPHICAL REPRESENTATION
69
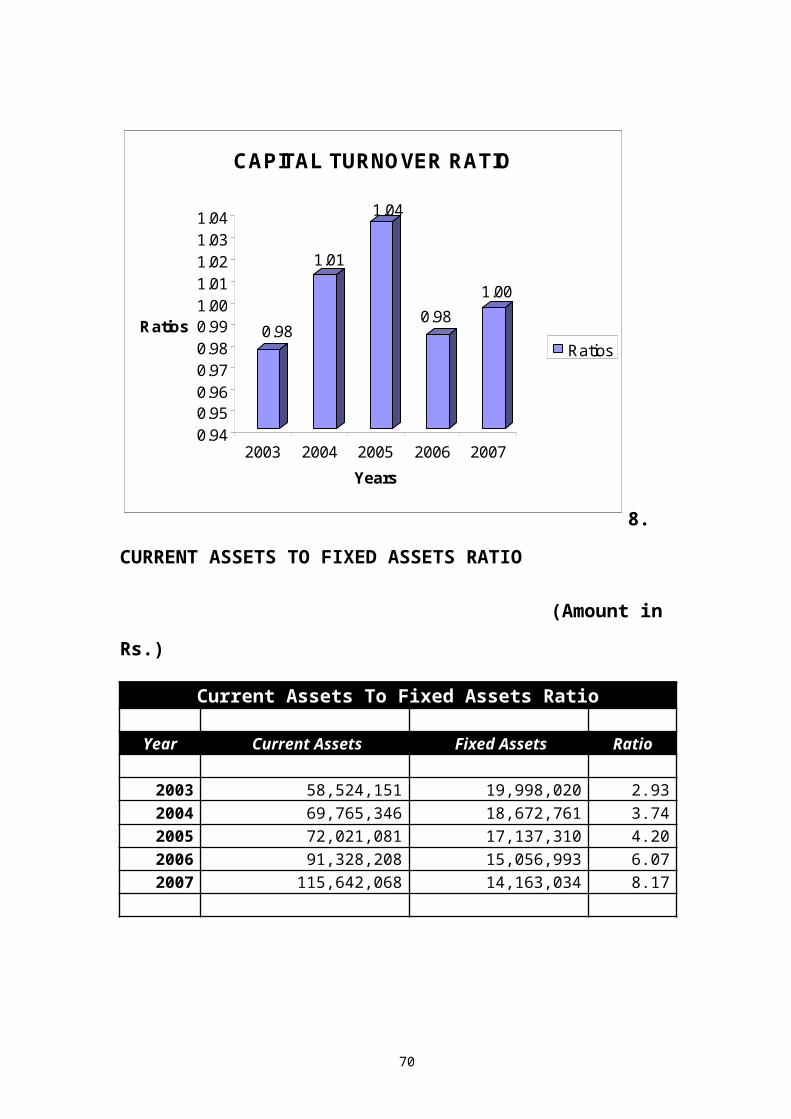
8.
CURRENT ASSETS TO FIXED ASSETS RATIO
(Amount in
Rs.)
Current Assets To Fixed Assets Ratio
Year Current Assets Fixed Assets Ratio
2003 58,524,151 19,998,020 2.932004 69,765,346 18,672,761 3.742005 72,021,081 17,137,310 4.202006 91,328,208 15,056,993 6.072007 115,642,068 14,163,034 8.17
0.98
1.01
1.04
0.981.00
0.940.950.960.970.980.991.001.011.021.031.04
Ratios
2003 2004 2005 2006 2007Years
CAPITAL TURNOVER RATIO
Ratios
70
Interpretation
Current assets are increased due to the
increase in the sundry debtors and the net fixed
assets of the firm are decreased due to the charge
of depreciation and there is no major increment in
the fixed assets.
The increment in current assets and the
decrease in fixed assets resulted an increase in
the ratio compared with the previous year
71

GRAPHICAL REPRESENTATION
72

PROFI
TABILITY RATIOS
GENERAL PROFITABILITY RATIOS
9. NET PROFIT RATIO
(Amount in Rs.)
Net Profit Ratio
Year Net Profit After Tax Income from Services Ratio 2003 21,123,474 36,039,834 0.592004 16,125,942 53,899,084 0.302005 16,929,227 72,728,759 0.232006 18,259,580 55,550,649 0.332007 40,586,359 96,654,902 0.42
2.93 3.74 4.20
6.07
8.17
0.001.002.003.004.005.006.007.008.009.00
Ratios
2003 2004 2005 2006 2007Years
CURRENT ASSETS TO FIXED ASSETS RATIO
Ratios
73
Interpretation
The net profit ratio is the overall
measure of the firm’s ability to turn each rupee of
income from services in net profit. If the net
margin is inadequate the firm will fail to achieve
return on shareholder’s funds. High net profit
ratio will help the firm service in the fall of
income from services, rise in cost of production or
declining demand.
The net profit is increased because the
income from services is increased. The increment
resulted a slight increase in 2007 ratio compared
with the year 2006.
74

GRAPHICAL REPRESENTATION
0.59
0.300.23
0.33
0.42
0.00
0.10
0.20
0.30
0.40
0.50
0.60
Ratios
2003 2004 2005 2006 2007Years
NET PROFIT RATIO
Ratios
75
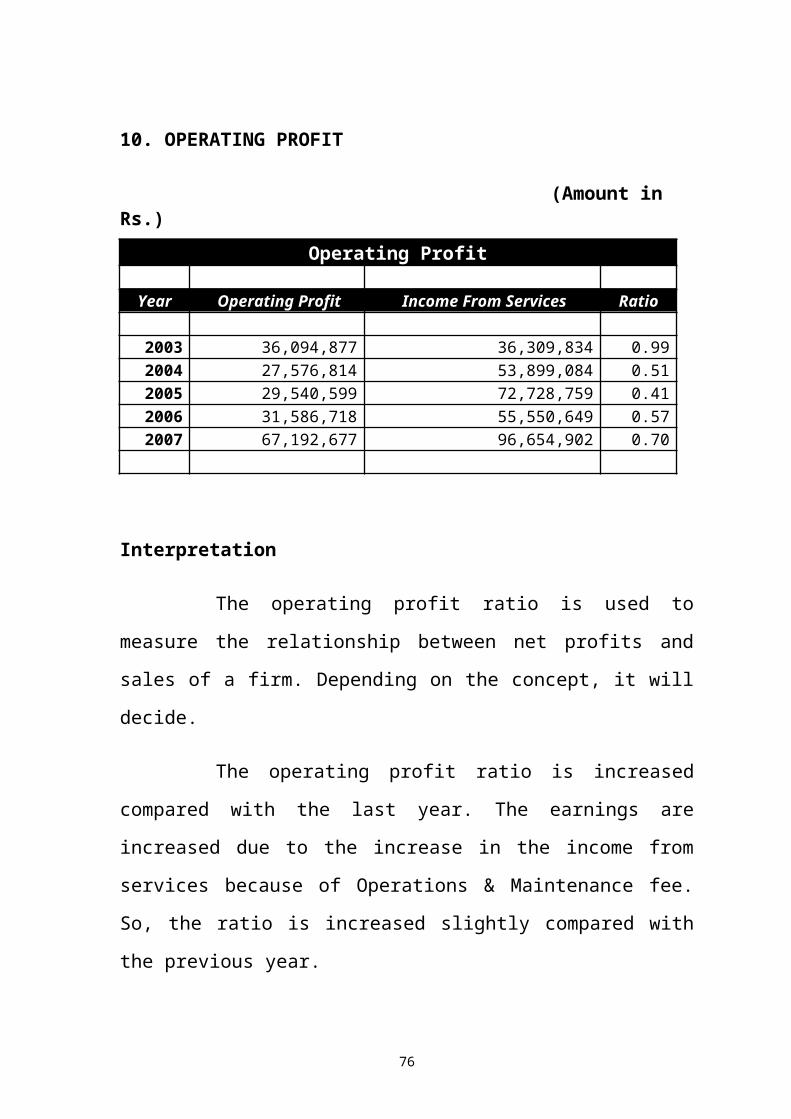
10. OPERATING PROFIT
(Amount in Rs.)
Operating Profit
Year Operating Profit Income From Services Ratio 2003 36,094,877 36,309,834 0.992004 27,576,814 53,899,084 0.512005 29,540,599 72,728,759 0.412006 31,586,718 55,550,649 0.572007 67,192,677 96,654,902 0.70
Interpretation
The operating profit ratio is used to
measure the relationship between net profits and
sales of a firm. Depending on the concept, it will
decide.
The operating profit ratio is increased
compared with the last year. The earnings are
increased due to the increase in the income from
services because of Operations & Maintenance fee.
So, the ratio is increased slightly compared with
the previous year.
76

GRAPHICAL REPRESENTATION
0.99
0.510.41
0.57
0.70
0.000.100.200.300.400.500.600.700.800.901.00
Ratios
2003 2004 2005 2006 2007Years
OPERATING PROFIT RATIO
Ratios
77

11. RETURN ON TOTAL ASSETS RATIO
(Amount in Rs.)Return on Total Assets Ratio
Year Net Profit After Tax Total Assets Ratio
2003 21,123,474 78,572,171 0.272004 16,125,942 88,438,107 0.182005 16,929,227 89,158,391 0.192006 18,259,580 106,385,201 0.172007 40,586,359 129,805,102 0.31
Interpretation
This is the ratio between net profit and
total assets. The ratio indicates the return on
total assets in the form of profits.
The net profit is increased in the current
year because of the increment in the income from
services due to the increase in Operations &
Maintenance fee. The fixed assets are reduced due
to the charge of depreciation and no major
increments in fixed assets but the current assets
are increased because of sundry debtors and that
78

effects an increase in the ratio compared with the
last year i.e. 2006.
79

GRAPHICAL REPRESENTATION
80

12.
RESERVES & SURPLUS TO CAPITAL RATIO
(Amount inRs.)
Reserves & Surplus To Capital Ratio Year Reserves & Surplus Capital Ratio
2003 65,599,299 2,079,920 31.542004 34,582,554 18,719,280 1.852005 51,511,781 18,719,280 2.752006 37,754,372 18,719,280 2.022007 78,340,733 18,719,280 4.19
0.27
0.18 0.190.17
0.31
0.00
0.05
0.100.15
0.20
0.250.30
0.35
Ratios
2003 2004 2005 2006 2007Years
RETURN ON TOTAL ASSETS
Ratios
81
Interpretation
The ratio is used to reveal the policy
pursued by the company a very high ratio indicates
a conservative dividend policy and vice-versa.
Higher the ratio better will be the position.
The reserves & surplus is decreased in the
year 2006, due to the payment of dividends and in
the year 2007 the profit is increased. But the
capital is remaining constant from the year 2004.
So the increase in the reserves & surplus caused a
greater increase in the current year’s ratio
compared with the older.
82

GRAPHICAL REPRESENTATION
83

OVERA
LL PROFITABILITY RATIOS
13. EARNINGS PER SHARE
(Amount in Rs.)
Earnings Per Share
Year Net Profit After Tax No of Equity Shares Ratio 2003 21,123,474 207,992 101.562004 16,125,942 1,871,928 8.612005 16,929,227 1,871,928 9.042006 18,259,580 1,871,928 9.752007 40,586,359 1,871,928 21.68
31.54
1.85 2.75 2.02 4.19
-5.0010.0015.0020.0025.0030.0035.00
Ratios
2003 2004 2005 2006 2007Years
RESERVES & SRUPLUS TO CAPITAL RATIO
Ratios
84

Interpretation
Earnings per share ratio are used to find
out the return that the shareholder’s earn from
their shares. After charging depreciation and after
payment of tax, the remaining amount will be
distributed by all the shareholders.
Net profit after tax is increased due to
the huge increase in the income from services. That
is the amount which is available to the
shareholders to take. There are 1,871,928 shares of
Rs.10/- each. The share capital is constant from
the year 2004. Due to the huge increase in net
profit the earnings per share is greaterly
increased in 2007.
85

GRAPHICAL REPRESENTATION
86

14.
PRICE EARNINGS (P/E) RATIO
(Amount in Rs.)
Price Earning (P/E) Ratio
Year Market Price Per Share Earnings Per Share Ratio 2003 32.54 101.56 0.322004 28.47 8.61 3.302005 37.52 9.04 4.152006 30.17 9.75 3.092007 51.85 21.68 2.39
101.56
8.61 9.04 9.7521.68
0.00
20.00
40.00
60.00
80.00
100.00
120.00
Ratios
2003 2004 2005 2006 2007Years
EARNINGS PER SHARE
Ratios
87

Interpretation
The ratio is calculated to make an
estimate of application in the value of share of a
company.
The market price per share is increased
due to the increase in the reserves & surplus. The
earnings per share are also increased greaterly
compared with the last year because of increase in
the net profit. So, the ratio is decreased compared
with the previous year.
88

GRAPHICAL REPRESENTATION
0.32
3.30
4.15
3.092.39
0.000.501.001.502.002.503.003.504.004.50
Ratios
2003 2004 2005 2006 2007Years
P/E RATIO
Ratios
89
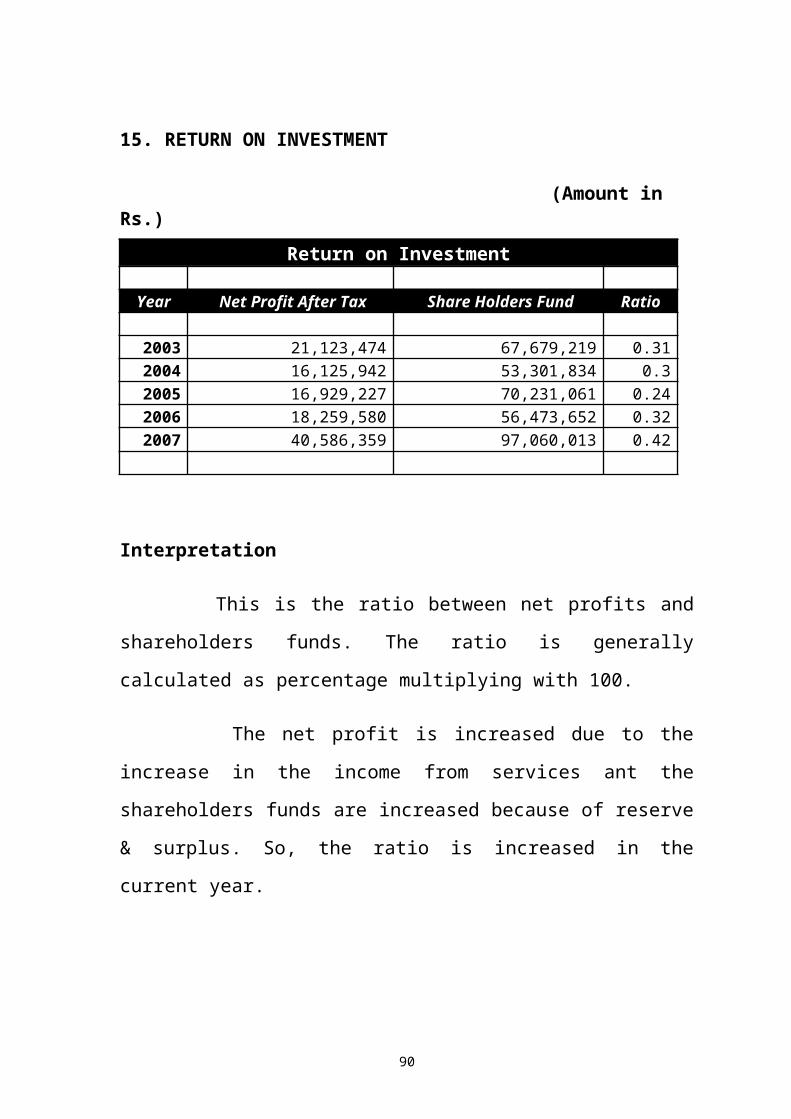
15. RETURN ON INVESTMENT
(Amount in Rs.)
Return on Investment
Year Net Profit After Tax Share Holders Fund Ratio 2003 21,123,474 67,679,219 0.312004 16,125,942 53,301,834 0.32005 16,929,227 70,231,061 0.242006 18,259,580 56,473,652 0.322007 40,586,359 97,060,013 0.42
Interpretation
This is the ratio between net profits and
shareholders funds. The ratio is generally
calculated as percentage multiplying with 100.
The net profit is increased due to the
increase in the income from services ant the
shareholders funds are increased because of reserve
& surplus. So, the ratio is increased in the
current year.
90

GRAPHICAL REPRESENTATION
91

Chapter – 7
0.31 0.300.24
0.32
0.42
0.000.050.100.150.200.250.300.350.400.45
Ratios
2003 2004 2005 2006 2007Years
RETURN ON INVESTMENT RATIO
RatioS
92
FINDINGS, SUMARRY & CONCLUSION
93

FINDINGS OF THE STUDY
1.The current ratio has shown in a fluctuating
trend as 7.41, 2.19, 4.48, 1.98, and 3.82
during 2003 of which indicates a continuous
increase in both current assets and current
liabilities.
2.The quick ratio is also in a fluctuating trend
through out the period 2003 – 07 resulting as
7.41, 1.65, 4.35, 1.9, and 3.81. The company’s
present liquidity position is satisfactory.
3.The absolute liquid ratio has been decreased
from 3.92 to 1.18, from 2003 – 07.
4.The proprietory ratio has shown a fluctuating
trend. The proprietory ratio is increased
compared with the last year. So, the long term
solvency of the firm is increased.
5.The working capital increased from 0.72 to 1.13
in the year 2003 – 07.
6.The fixed assets turnover ratio is in
increasing trend from the year 2003 – 07 (1.26,
94
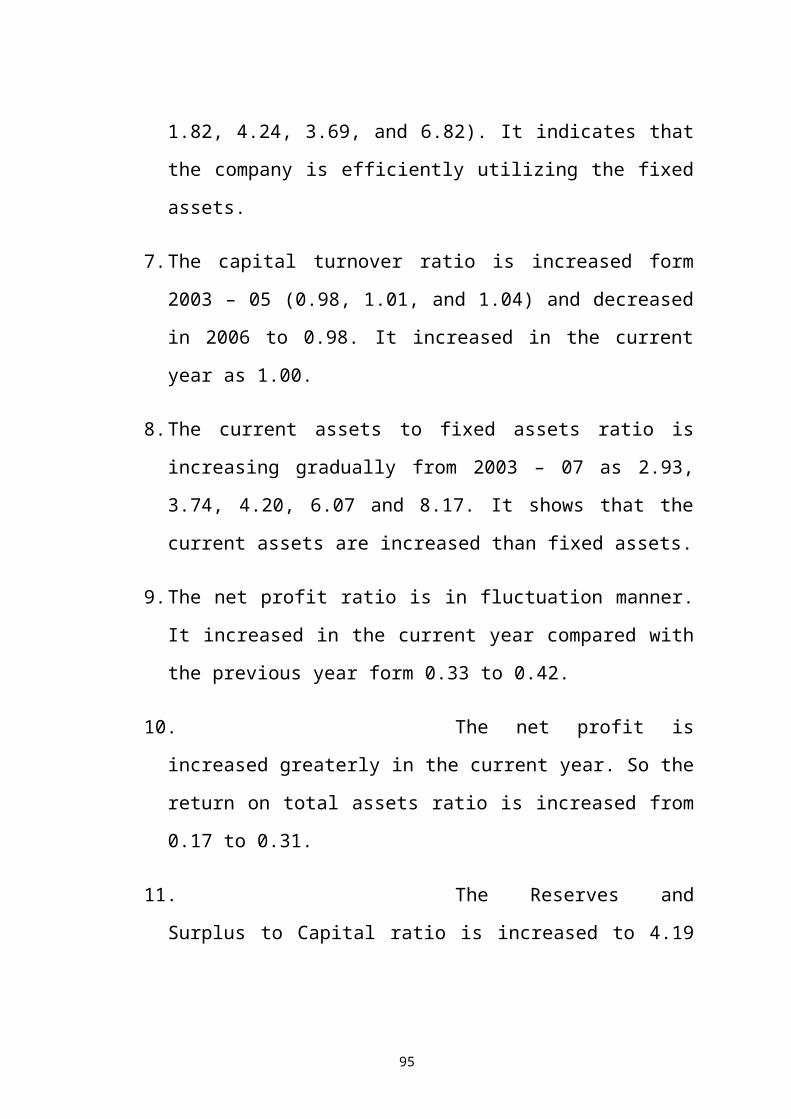
1.82, 4.24, 3.69, and 6.82). It indicates that
the company is efficiently utilizing the fixed
assets.
7.The capital turnover ratio is increased form
2003 – 05 (0.98, 1.01, and 1.04) and decreased
in 2006 to 0.98. It increased in the current
year as 1.00.
8.The current assets to fixed assets ratio is
increasing gradually from 2003 – 07 as 2.93,
3.74, 4.20, 6.07 and 8.17. It shows that the
current assets are increased than fixed assets.
9.The net profit ratio is in fluctuation manner.
It increased in the current year compared with
the previous year form 0.33 to 0.42.
10. The net profit is
increased greaterly in the current year. So the
return on total assets ratio is increased from
0.17 to 0.31.
11. The Reserves and
Surplus to Capital ratio is increased to 4.19
95

from 2.02. The capital is constant, but the
reserves and surplus is increased in the
current year.
12. The earnings per
share was very high in the year 2003 i.e.,
101.56. That is decreased in the following
years because number of equity shares are
increased and the net profit is decreased. In
the current year the net profit is increased
due to the increase in operating and
maintenance fee. So the earnings per share is
increased.
13. The operating profit
ratio is in fluctuating manner as 0.99, 0.51,
0.41, 0.57 and 0.69 from 2003 – 07
respectively.
14. Price Earnings ratio
is reduced when compared with the last year. It
is reduced from 3.09 to 2.39, because the
earnings per share is increased.
96

15. The return on
investment is increased from 0.32 to 0.42
compared with the previous year. Both the
profit and shareholders funds increase cause an
increase in the ratio.
97

SUMMARY
1)After the analysis of Financial Statements, the
company status is better, because the Net
working capital of the company is doubled from
the last year’s position.
2)The company profits are huge in the current
year; it is better to declare the dividend to
shareholders.
3)The company is utilising the fixed assets,
which majorly help to the growth of the
organisation. The company should maintain that
perfectly.
4)The company fixed deposits are raised from the
inception, it gives the other income i.e.,
Interest on fixed deposits.
CONCLUSION
The company’s overall position is at a
good position. Particularly the current year’s
98

position is well due to raise in the profit level
from the last year position. It is better for the
organization to diversify the funds to different
sectors in the present market scenario.
99

BIBLIOGRAPHY
REFFERED BOOKS
FINANCIAL MANAGEMENT - I. M. PANDEY
MANAGEMENT ACCOUNTANCY - PILLAI & BAGAVATI
MANAGEMENT ACCOUNTING – SHARMA & GUPTA
INTERNET SITE
www.ercap.org
www.wikipedia.com
www.nwda.gov.in
100
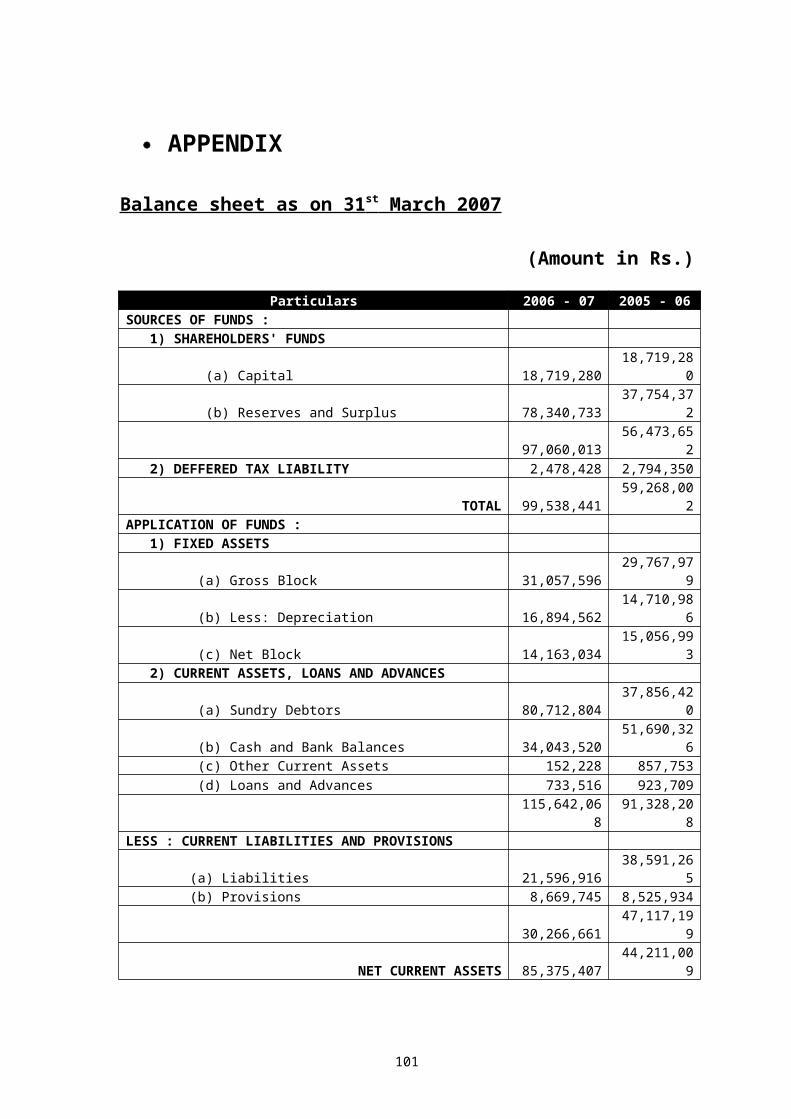
APPENDIX
Balance sheet as on 31 st March 2007
(Amount in Rs.)
Particulars 2006 - 07 2005 - 06SOURCES OF FUNDS : 1) SHAREHOLDERS' FUNDS
(a) Capital 18,719,28018,719,28
0
(b) Reserves and Surplus 78,340,73337,754,37
2
97,060,01356,473,65
2 2) DEFFERED TAX LIABILITY 2,478,428 2,794,350
TOTAL 99,538,44159,268,00
2APPLICATION OF FUNDS : 1) FIXED ASSETS
(a) Gross Block 31,057,59629,767,97
9
(b) Less: Depreciation 16,894,56214,710,98
6
(c) Net Block 14,163,03415,056,99
3 2) CURRENT ASSETS, LOANS AND ADVANCES
(a) Sundry Debtors 80,712,80437,856,42
0
(b) Cash and Bank Balances 34,043,52051,690,32
6 (c) Other Current Assets 152,228 857,753 (d) Loans and Advances 733,516 923,709
115,642,068
91,328,208
LESS : CURRENT LIABILITIES AND PROVISIONS
(a) Liabilities 21,596,91638,591,26
5 (b) Provisions 8,669,745 8,525,934
30,266,66147,117,19
9
NET CURRENT ASSETS 85,375,40744,211,00
9
101

TOTAL 99,538,44159,268,00
2
102

Profit and Loss Account for the period ended on 31 st
March 2007
(Amount in Rs.)
Particulars 2006 - 07 2005 – 06I.INCOME
Income from Services96,654,90
2 55,550,64
9 Other Income 2,398,220 2,285,896
TOTAL99,053,12
2 57,836,54
5 II.EXPENDITURE
Administrative and Other Expenses81,334,75
0 75,599,71
9
81,334,75
0 75,599,71
9 Less: Expenditure Reimbursable under Operations
and Maintenance Agreement49,474,30
5 49,349,89
2
TOTAL31,860,44
5 26,249,82
7
III. PROFIT BEFORE DEPRECIATION AND TAXATION67,192,67
7 31,586,71
8 Provision for Depreciation 2,183,576 2,279,917
IV. PROFIT BEFORE TAXATION65,009,10
1 29,306,80
1 Provision for Taxation
- Current24,292,00
0 10,680,44
0 - Deferred (315,922) (67,359) - Fringe Benefits 446,663 434,140
V. PROFIT AFTER TAXATION40,586,35
9 18,259,58
0
Surplus brought forward from Previous Year26,699,25
7 44,951,85
1
VI. PROFIT AVAIALABLE FOR APPROPRIATIONS67,285,61
7 63,211,43
1 Transfer to General Reserve - 4,495,185 Interim Dividend Rs.15 per equity Share (2005- NIL) -
28,078,920
Provision for Dividend Distribution Tax - 3,938,069 VII. BALANCE CARRIED TO BALANCE SHEET 67,285,61 26,699,25
103

7 7
Earnings Per Share - Basic & Diluted 22 10
104
Related Documents