1 Corporate Presentation PT GARUDA INDONESIA (PERSERO) Tbk. Maybank Insight Gathering 19th January 2016 Sentral Senayan 3, 28th Floor Jakarta

Welcome message from author
This document is posted to help you gain knowledge. Please leave a comment to let me know what you think about it! Share it to your friends and learn new things together.
Transcript

1
Corporate Presentation PT GARUDA INDONESIA (PERSERO) Tbk.
Maybank Insight Gathering19th January 2016
Sentral Senayan 3, 28th Floor Jakarta
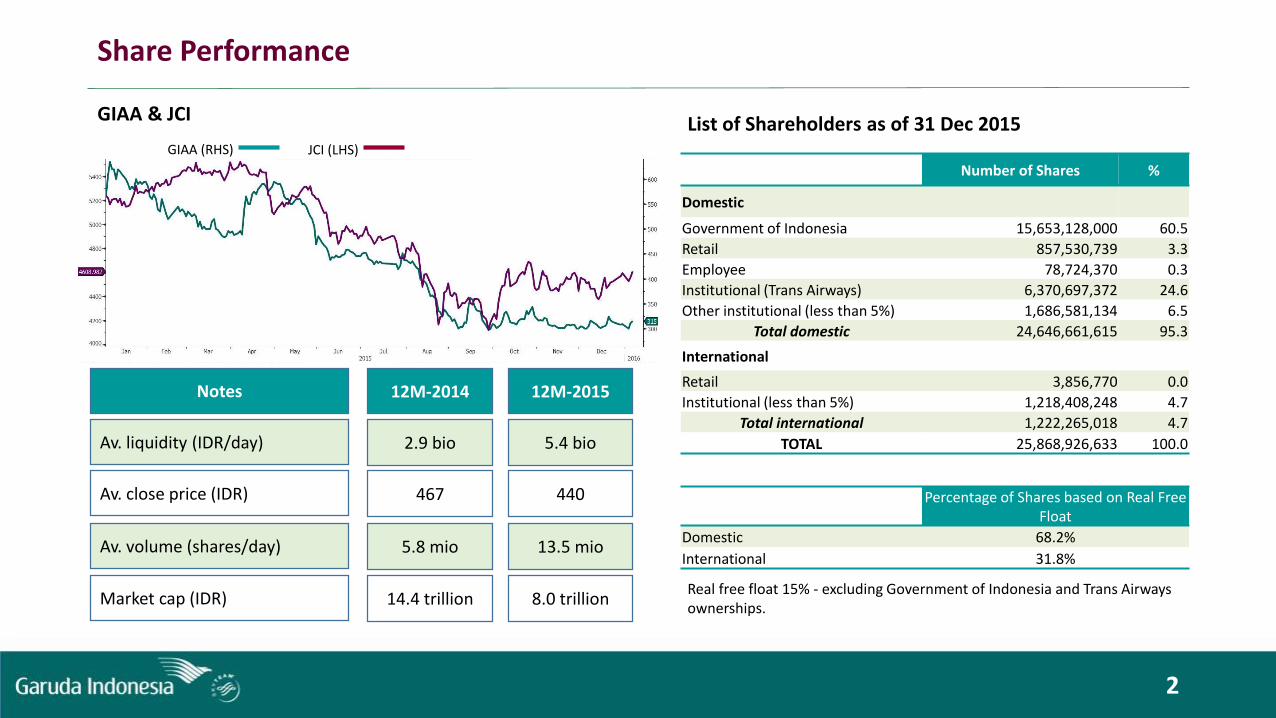
List of Shareholders as of 31 Dec 2015GIAA & JCI
Notes
Av. liquidity (IDR/day)
12M-2014
2.9 bio
12M-2015
5.4 bio
Av. close price (IDR) 467 440
Av. volume (shares/day) 5.8 mio 13.5 mio
Market cap (IDR) 14.4 trillion 8.0 trillionReal free float 15% - excluding Government of Indonesia and Trans Airways ownerships.
Share Performance
GIAA (RHS) JCI (LHS)
2
Number of Shares %
Domestic
Government of Indonesia 15,653,128,000 60.5
Retail 857,530,739 3.3
Employee 78,724,370 0.3
Institutional (Trans Airways) 6,370,697,372 24.6
Other institutional (less than 5%) 1,686,581,134 6.5
Total domestic 24,646,661,615 95.3
International
Retail 3,856,770 0.0
Institutional (less than 5%) 1,218,408,248 4.7
Total international 1,222,265,018 4.7
TOTAL 25,868,926,633 100.0
Percentage of Shares based on Real Free Float
Domestic 68.2%
International 31.8%

Sustained GDP growth in 2015 and 2016F
Global GDP Growth Forecast
3
Source: Bloomberg
Source: IRU BI Presentation
Air
Rail
Sea
23
150
13
FY 2004
111
278
13
+ 17.2%
+ 6.3%
+ 0.4%
Indonesia: Transportation profile (Passengers in million)
FY 2014 CAGR
Archipelago Country
Air
Rail
Highway
121
1.073
16.289
FY 2004
352
2.357
39.342
+ 12.5%
+ 8.2%
+ 9.2%
China:Transportation profile (Passengers in million)
FY 2014 CAGR
Sea 181 2.75 + 4.3%
Massive Land Country
Strong Economic Fundamental and Demand
7.0% 7.0% 6.9% 6.9% 6.9%6.5%
4.7% 4.7% 4.7% 4.8% 4.7%5.2%
2.9% 2.7%2.1% 2.2%
2.5% 2.5%1.3%
2.3%
3.3%
4.3%
5.3%
6.3%
7.3%
Q1 Q2 Q3 Q4 FY15 FY16
GDP Growth in 2016
CN ID US
5.4%
4.2%3.4% 3.3% 3.4% 3.1% 3.6% 3.8% 3.9% 4.0% 4.0%
3.1%
1.7%1.2% 1.1%
1.8% 2.0% 2.2% 2.2% 2.2% 2.0% 1.9%
7.5%
6.3%
5.2% 5.0%4.6%
4.0%4.5%
4.9% 5.1% 5.2% 5.3%
0.0%
1.0%
2.0%
3.0%
4.0%
5.0%
6.0%
7.0%
8.0%
2010 2011 2012 2013 2014 2015 2016F 2017F 2018F 2019F 2020F
Global growth Developed countries Developing countries

Population Air Traffic
34.2 (476%)
Numbers are in million 46.3 (156%)
Sources: Data Internal, Bloomberg, IMF, and www.worldbank.org, Full Year 2014
4
7.3
Hongkong
30.3
Malaysia
68.7
Thailand
40.7 (61%)
251.5
Indonesia
111.0 (44%)
30.6 (566%)
Singapore
5.5
Airline Business Penetration
Population
(Population, in Million persons)
2012 2013 2014 2015 2016F
Indonesia 244.5 248.0 251.5 255.1 258.7
Phillippines 95.8 97.5 99.4 101.4 103.5
Vietnam 88.8 89.7 90.6 91.6 92.5
Thailand 68.0 68.3 68.7 68.8 69.0
Myanmar 50.5 51.0 51.4 51.8 52.3
Malaysia 29.5 29.9 30.3 30.8 31.3
Cambodia 14.9 15.1 15.3 15.5 15.8
Singapore 5.3 5.4 5.5 5.5 5.6
Brunei Darussalam 0.4 0.4 0.4 0.4 0.4

5
Business Strategy - Short Time Strategy - Quick Wins 2015
Revenue generator
Optimizingcapital
structure
Cost
efficiency
Revenue generator• Restructuring flights by cutting unprofit routes
(Brisbane, Taipei, and Narita) • Developing new routes to China and Middle East
(especially expanding to Umrah market) through non scheduled and chartered services
• The 4th hangar to be completed in 2015• Improve seat load factor by managing RPK growth
higher compared to ASK growth.
Cost efficiency• Early termination of operating leases• Identified non-fuel cost savings of US$200m for 2015• Simplify fleet
Optimizing capital structure• US$500m bridge facility used to re-profile existing
commercial term loans• Proposed USD Sukuk to refinance bridge loan to extend
maturity profile

6
V I S I O N 2 0 2 0“ T O B E A S U S TA I N A B L E A I R L I N E C O M P A N Y T H R O U G H G R O W T H I N P R O F I T ”
M I S S I O N 2 0 1 6 - 2 0 2 0B E C O M E T H E L E A D I N G A I R L I N E C O M PA N Y W H I C H V A L U E S C U S T O M E R T I M E A N D E X P E R I E N C E
T H R O U G H H U M A N - T O - H U M A N C A R I N G S E R V I C E , C O S T L E A D E R S H I P I N O P E R AT I O N A N D S Y N E R G Y U N D E R O N E G R O U P
SKY BEYONDMAKE EVERY MOMENT COUNTSThe strategy emphasizes on appreciation of customer time.

7
Business Strategy: Long Term Strategy – Sky Beyond 2016 - 2020
Group
synergy
Cost
leadership
Caring
service
Established an IT based airline
Optimize network & alliances
Strengthen medium haul & expand
selected long haul routes
Develope high performance
people
Deliver new airline experience
Build GA Brand as world’s most caring
airline
Indonesian hospitality
Dominate domestic market through GA
and Citilink
Set up holding company
Assumptions - 2016
• USDIDR – 15K/USD
• Fuel Price – USc70/L (Into Plane Price)
• Inflation rate – 4.7%
• Interest rate – 5.5%
• GDP – 5.5%
8
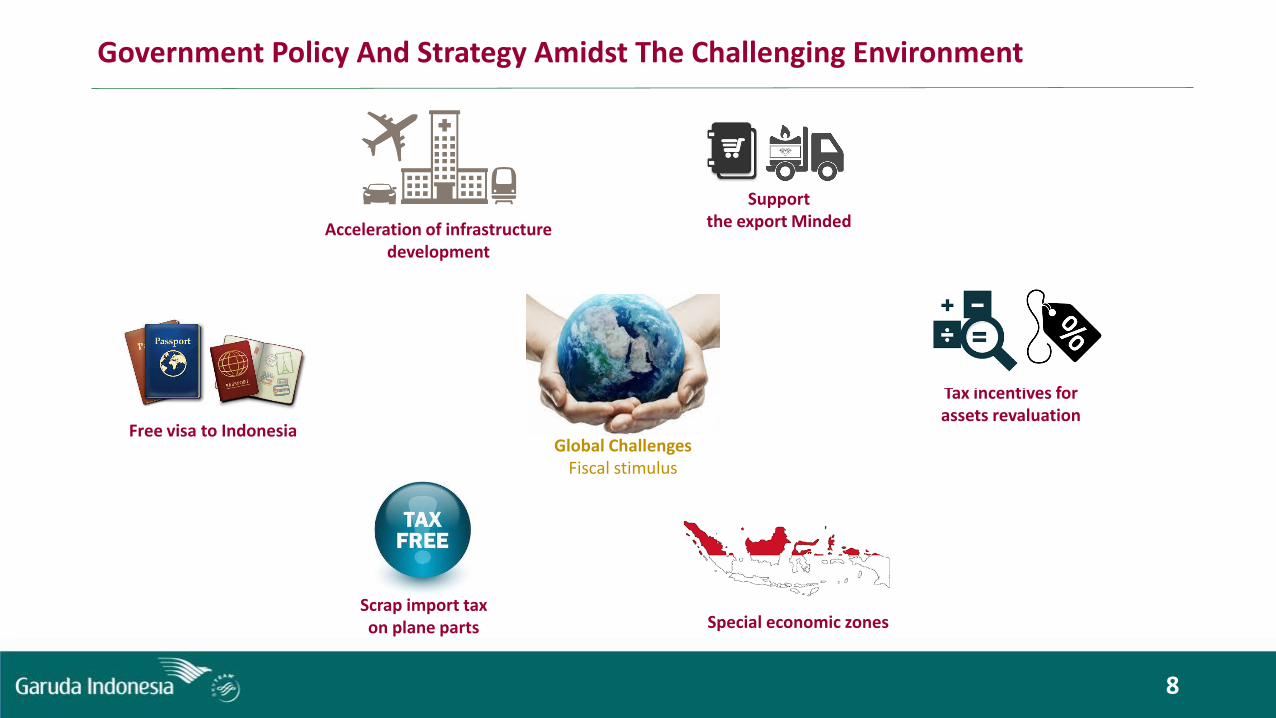
Government Policy And Strategy Amidst The Challenging Environment
Free visa to Indonesia
Tax incentives forassets revaluation
Acceleration of infrastructure development
Supportthe export Minded
Scrap import tax on plane parts
Global ChallengesFiscal stimulus
Special economic zones

9
Awards
• Service: 22 awards• Commercial: 13 awards• Business: 7 awards• Corporate: Transformation: 7 awards• Human Capital: 4 awards• People Management: 5 awards• GCG: 5 Awards• Financial: 2 awards
65 awards 2015:Domestic: 50 awards
International: 15 awards
• SKYTRAX Awards 2015 “The World’s Best Cabin Crew”• SKYTRAX Awards 2015 “World’s Best Airline” 8th Rank• Finance Asia Awards 2015 “Asia’s Best Companies 2015”• Schipol Aviation Awards “Passenger Airline of the Year Award 2014-Intercontinental”• Indonesia Human Capital Award 2015 “1st in Human Resources Technology”• Indonesia Good Corporate Governance Award 2015 “Score A (Excellent)”• Pacific Asia Travel Association (PATA) “Gold Awards 2015 for Inflight Magazine”
Picture’s source: www.google.com
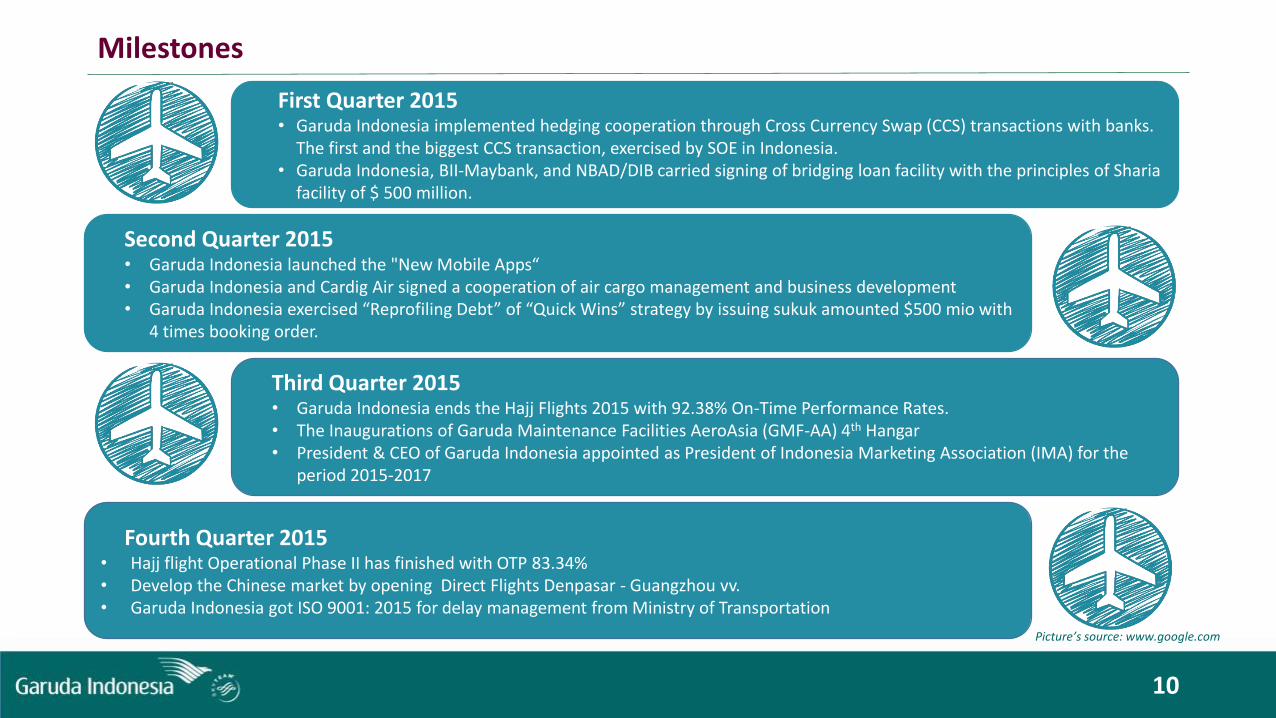
Milestones
10
First Quarter 2015• Garuda Indonesia implemented hedging cooperation through Cross Currency Swap (CCS) transactions with banks.
The first and the biggest CCS transaction, exercised by SOE in Indonesia.• Garuda Indonesia, BII-Maybank, and NBAD/DIB carried signing of bridging loan facility with the principles of Sharia
facility of $ 500 million.
Second Quarter 2015• Garuda Indonesia launched the "New Mobile Apps“• Garuda Indonesia and Cardig Air signed a cooperation of air cargo management and business development• Garuda Indonesia exercised “Reprofiling Debt” of “Quick Wins” strategy by issuing sukuk amounted $500 mio with
4 times booking order.
Third Quarter 2015• Garuda Indonesia ends the Hajj Flights 2015 with 92.38% On-Time Performance Rates.• The Inaugurations of Garuda Maintenance Facilities AeroAsia (GMF-AA) 4th Hangar • President & CEO of Garuda Indonesia appointed as President of Indonesia Marketing Association (IMA) for the
period 2015-2017
Picture’s source: www.google.com
Fourth Quarter 2015• Hajj flight Operational Phase II has finished with OTP 83.34%• Develop the Chinese market by opening Direct Flights Denpasar - Guangzhou vv.• Garuda Indonesia got ISO 9001: 2015 for delay management from Ministry of Transportation

11
Garuda Indonesia Group Market Share – YTD October 2015
2014 2015
14%16%
44%38%
42%46%
Others
GA Group
Lion Group
Garuda domestic market share group (including Citilink)These market share were calculated based on all Garuda Indonesia’s routesSource: Company Data
Domestic Market Share
2014 2015
73%77%
27%23%
Others
GA Main Brand
International Market Share
Garuda main brand international market shareThese market share were calculated based on all Garuda Indonesia’s routesSource: Company Data
Picture’s source: www.google.com
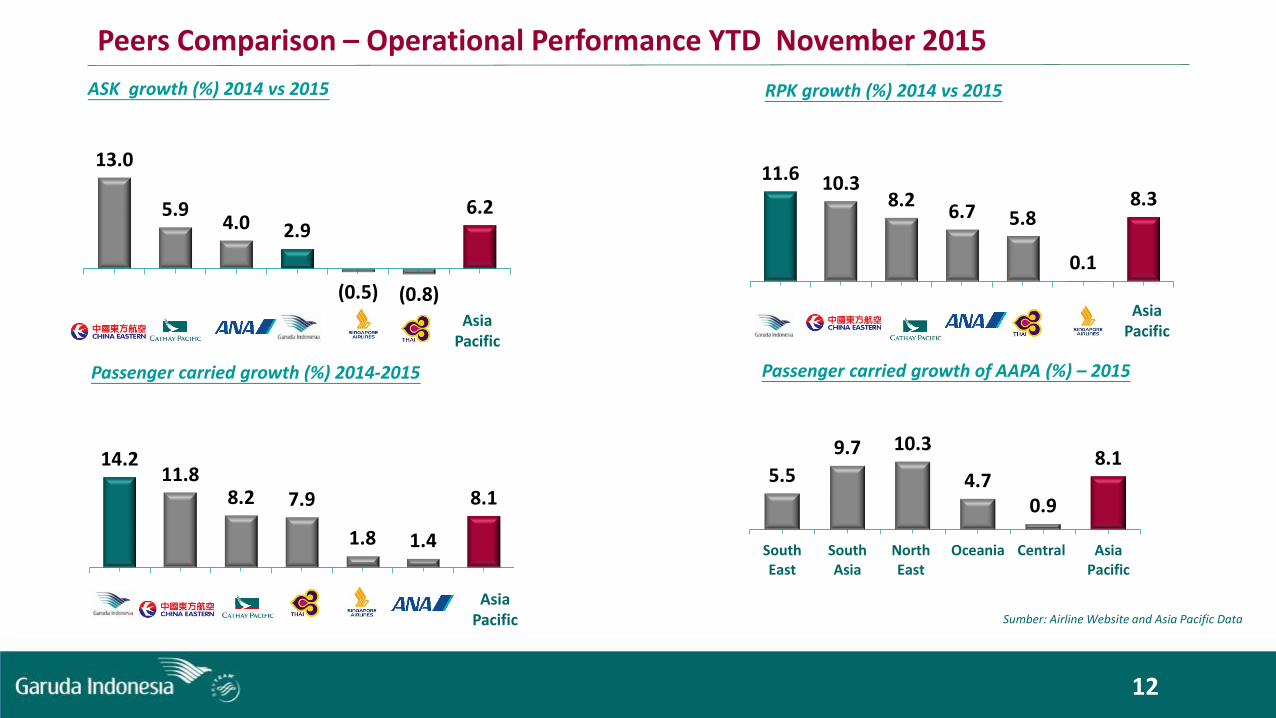
Passenger carried growth (%) 2014-2015
ASK growth (%) 2014 vs 2015 RPK growth (%) 2014 vs 2015
Asia Pacific
Passenger carried growth of AAPA (%) – 2015
Asia Pacific
Asia Pacific
12
Peers Comparison – Operational Performance YTD November 2015
Sumber: Airline Website and Asia Pacific Data
14.2 11.8
8.2 7.9
1.8 1.4
8.1
-
5.00
10.00
15.00
20.00
25.00
13.0
5.9 4.0 2.9
(0.5) (0.8)
6.2
(5.00)
-
5.00
10.00
15.00
20.00
25.00
11.6 10.3 8.2
6.7 5.8
0.1
8.3
-
5.00
10.00
15.00
20.00
25.00
5.5
9.7 10.3
4.7 0.9
8.1
-
5.0
10.0
15.0
20.0
25.0
SouthEast
SouthAsia
NorthEast
Oceania Central AsiaPacific
13
Operational Performance

Number of Fleets
5.85.0 4.5 4.3 4.5
2012 2013 2014 2015 2016E
Average Age (year)
14
Fleets per Dec 2014 169In
* B737-800NG 7
* CRJ - 1000 3
* ATR 72-600 3
* B777-300 ER 3
* A330-300 2* A320-200 4
Total 22
Out
* A330-200 2
* B737-800 1
* B737-500 1
Total 4Fleets per Nov 2015 187
14-Dec Dec15 Ops.lease Fin lease/
Dec16owned
Narrow body
• B737-500 4 - - - -• B737-800 NG 75 81 81 - 75• CRJ - 1000 15 18 12 6 18• ATR 72-600 8 11 11 - 15Total narrow body 102 110 104 6 108Wide Body
• B747-400 2 2 - 2 2
• B777-300 ER 6 9 9 - 10
• A330-200 11 9 9 - 7
• A330-300 11 13 7 6 17Total wide body 30 33 25 8 36Garuda main brand 132 143 129 14 144Citilink • B737-300 5 5 - 5 5• B737-500 - 3 - 3 3•A320-200 32 36 36 - 45Total Citilink 37 44 36 8 53Total fleets 169 187 165 22 197

15
Operational Performance Garuda Group
Operational
Efficiency
Passenger & Cargo
Financial
9M-2014 9M-2015 ∆ %
Aircraft Utilization (Hours) 9:53 9:11 -0:42
Frequencies 165,642 186,105 12.4
On Time Performance - OTP (%) 89.6 88.2 (1.4)
ASK ('000) 36,902,810 38,748,407 5.0
Average Fuel Price (USD/L) 0.9 0.5 (37.9)
Fuel Burn/Blockhours 3,699 3,590 (2.9)
Passenger Carried 20,893,654 24,551,594 17.5
RPK ('000) 26,086,291 29,951,212 14.8
Seat Load Factor (%) 70.7 77.3 6.6
Passenger Yield (USc) 8.6 7.5 (13.7)
Cargo/Mail Uplifted (Ton) 292,888 257,304 (12.1)
CASK (Usc) 7.6 6.4 (15.3)
CASK-excl Fuel (Usc) 4.5 4.5 0.0
• The passenger yield decreased 13.7% due to IDR depreciation ±12.1% and lower international fares amidst unstable economic.
Yield decreased
• The utilization was going down to be 9:11 hours due to route restructuring of Quick Wins program, especially in international market.
Utilization decreased
• OTP decrease due to Mount Raung eruption and fire incident in SHIA Terminal 2
• Cargo capacity decrease due to the increase of passenger carried as Garuda Cargo is ‘belly cargo’ on Garuda Group.
Others

Operational Performance Domestic & International
Domestic
International
16
9M-2014 9M-2015 ∆ %
Passenger Carried 12,666,172 14,508,965 14.5
Frequency 106,581 118,607 11.3
ASK ('000) 14,779,378 16,448,716 11.3
RPK ('000) 10,915,976 12,675,797 16.1
Seat Load Factor (%) 73.9 77.1 3.20
Passenger Yield (Usc) 10.1 8.6 (14.5)
CASK (Usc) 8.6 7.1 (17.1)
CASK-excl Fuel (Usc) 5.3 5.0 (4.4)
Passenger Carried 2,897,051 3,176,986 9.7
Frequency 21,549 20,835 (3.3)
ASK ('000) 16,963,144 15,742,812 (7.2)
RPK ('000) 11,101,472 11,953,539 7.7
Seat Load Factor (%) 65.4 75.9 10.49
Passenger Yield (Usc) 8.0 6.9 (13.6)
CASK (Usc) 7.3 6.3 (13.6)
CASK-excl Fuel (Usc) 4.4 4.5 3.0
Garuda Indonesia main brand has 58 domestic destinations
17 international destinations
Picture’s source: www.google.com

Operational Performance Main Brand & Citilink
Main Brand
Citilink
17
9M-2014 9M-2015 ∆ %
Passenger Carried 15,563,223 17,685,951 13.6
Frequency 128,130 139,442 8.8
ASK ('000) 31,742,521 32,191,527 1.4
RPK ('000) 22,017,448 24,629,336 11.9
Seat Load Factor (%) 69.4 76.5 7.15
Passenger Yield (Usc) 9.1 7.8 (13.7)
CASK (Usc) 7.9 6.7 (14.9)
CASK-excl Fuel (Usc) 4.8 4.8 (0.2)
Passenger Carried 5,330,431 6,865,643 28.8
Frequency 37,512 46,663 24.4
ASK ('000) 5,160,289 6,556,880 27.1
RPK ('000) 4,068,844 5,321,876 30.8
Seat Load Factor (%) 78.9 81.2 2.31
Passenger Yield (Usc) 6.5 5.8 (10.7)
CASK (Usc) 5.7 5.0 (13.4)
CASK-excl Fuel (Usc) 2.9 3.2 11.2

18
Financial Performance

Summary of Consolidated Income Statement
Garuda GroupTop Line (USD, Bio)
Operating Revenue
Operating Expenses
Income
EBITDAR Margin 14.4% 32.3%
Garuda GroupNet Income (USD, Mio)
19
In USD Mio 9M14 9M15 ∆ % YoY
EBITDAR 406.3 918.4 126.0
Total revenues 2,831.3 2,845.7 0.5
Fuel 1,175.7 806.5 (31.4)
Aircraft rental and charter 530.1 659.9 24.5
Others 1,374.8 1,251.3 (9.0)
Total expenses 3,080.6 2,717.6 (11.8)
EBIT (249.3) 128.1 151.4
EBT (298.3) 81.3 127.3
Net income (220.1) 51.4 123.4
0.9 0.9
1.0
Q1 Q2 Q3
12.4 16.9
22.1
Q1 Q2 Q3

Operating Revenue
2,831.3
2,845.7
(2.4%)
2.4%0.5%
9M14 9M15
Schedule airline
Non Schedule Airline
Others
Operating Revenue Operating Revenue
• Lower yield due to IDR depreciation and unstable economic condition in regional
• Losing revenue potency due to challenging conditions such as mount eruption, SHIA fire incident, and hazardous haze in Indonesia surroundings
Scheduled airline decrease
• Sustainable increase of charter revenue to China market and Umrah (Middle East).
• Additional revenue from Hajj season
Non schedule airline increase
• Others revenue increased due to green performance of subsidiaries.
Others increase
In USD mio% Change
*PoT : Percentage of total
20
Operating Revenue *PoT
Schedule airline 84.60%
Non schedule airline 6.20%
Others 9.20%

Operating Expenses
2,717.6
3,080.6
(12.0%)
4.7% (1.6%)(0.3%)
(2.6%)
9M14 9M15Operating Expenses Operating Expenses
Fuel Fligh Ops + Maintenance +
User charge
Tickets + Passenger
Service
G&AOthers
In USD mio% change
*PoT : Percentage of total
• Fuel expenses decreased 31.4% to be USD 806.5miocompared to same period last year of USD 1.2bio due to fuel price declining 37.9% compare last year.
• Total operating expenses decreased 11.8% to be USD 2.7 bio compared to the same period last year USD 3.1bio.
• Fuel efficiency YTD 9M15 USD 369.3mio as impact of fuel price declining and fuel efficiency program
• Non fuel efficiency YTD 9M15 USD ±115.3mio
Decreasing expenses
• The rental cost increased 24.5% to be USD 659.9mio compared to the same period last year of USD 530.1 mio in line with the additional fleets.
• The maintenance cost increased by 9.5% to be USD 210.2mio compared to the same period last yearUSD 192.0mio in line with the additional fleets.
Increasing expenses
21
Operating Expenses PoT*
Fuel 28.97%
Flight ops + Rental + Maintenance + User charge 47.96%
Ticketing + Passenger Service 15.62%
G & A 5.89%
Others 1.55%

Summary of Consolidated Balance Sheet
Asset
Liability
Equity
Lease Adj. Net Debt/EBITDAR 10.1x 7.5x
22
FY14 9M15 ∆ % YoY
Current assets 810.5 843.5 4.1
Non current assets 2,302.6 2,238.5 (2.8)
Total Assets 3,113.1 3,082.0 (1.0)
Current liabilities 1,219.4 1,103.7 (9.5)
Non current liabilities 1,014.2 1,107.2 9.2
Total liabilities 2,233.6 2,210.9 (1.0)
Total equities 879.5 871.1 (0.9)
Total liabilities & Equities 3,113.1 3,082.0 (1.0)

Summary of Consolidated Cash Flow
Operating
Cash receipts from customers USD 2.8bio
Cash payments to suppliers USD 2.4bio
Payments of interest and financial expenses USD 45.2mio
Investing
Payments PDP & Maintenance Reserve Fund: USD 303.4mio
Security Deposit payment: USD 11.1mio Refund of PDP and Maintenance Reserve
Fund: USD 216.2mio Receipts of security Deposit : USD 9.0mio
Financing
Proceed of long term loan, bank loan, & financial institution and sukuk USD 1,4bio
Payment of long term loan, bank loan & financial institution: USD 1.3bio
23
Min 5% of Cash Ratio
Picture’s source: www.google.com
9M14 9M15 ∆ % YoY
Beginning cash 480.4 434.3 (9.6)
Cash from operating activities (180.9) 56.0 130.9
Cash from investing activities (189.6) (104.1) (45.1)
Cash from financing activities 271.2 44.8 (83.5)
Net increase (decrease) in cash (99.3) (3.1) n.a.
Ending cash 396.6 409.5 3.2

Cash and Net Gearing
24
464.9 464.0 409.5 1,313.2 1,305.8 1,212.7 856.6 864.4 853.4
0.99
0.97
0.94
0.90
0.92
0.94
0.96
0.98
1.00
1.02
1.04
1.06
0.0
200.0
400.0
600.0
800.0
1,000.0
1,200.0
1,400.0
3M15 6M15 9M15
Cash Debt Equity Net Gearing
In USD Mio
31%
60%
9%
Debt Structure 9M2015
Short term loan Long term loan Lease
Max 2.5x of Debt to Equity Ratio
Min capital USD 800mio
Picture’s source: www.google.com

25
Main Brand Financial Performance YTD November 2015
in USD mio
Monthly 2015 Year to Date Growth
Jan-15Actual
Feb-15Actual
Mar-15Actual
Apr-15Actual
May-15Actual
Jun-15Actual
Jul-15Actual
Aug-15Actual
Sept-15Actual
Oct-15Actual
Nov-15Actual
YTD Nov-14Actual
YTD Nov-15Actual
∆ %YoY
Scheduled Airline 253.3 213.9 242.5 228.4 239.7 229.4 241.3 239.3 198.2 208.8 208.9 2,705.5 2,503.7 (7.5)
Non-Scheduled Airline 9.8 13.2 7.4 4.5 4.8 2.6 7.9 42.4 62.0 85.5 (4.1) 195.3 235.9 20.8
Others 6.8 6.6 8.4 7.5 6.9 8.1 6.4 6.7 5.8 6.6 6.7 63.1 76.6 21.3
Total Operating Revenue 269.8 233.8 258.3 240.3 251.4 240.0 255.7 288.4 266.0 301.0 211.4 2,963.9 2,816.1 (5.0)
Fuel Expense 83.5 67.8 74.7 73.0 78.1 74.4 79.6 80.0 72.0 78.1 55.2 1,258.7 816.4 (35.1)
Other Operating Expense 186.2 162.4 169.7 163.3 166.3 155.4 178.2 202.8 174.1 210.2 170.3 2,076.5 1,939.0 (6.6)
Total Operating Expense 269.7 230.3 244.4 236.3 244.4 229.8 257.8 282.8 246.1 288.4 225.5 3,335.2 2,755.5 (17.4)
Income / Loss from Operation 0.1 3.5 13.9 4.0 7.0 10.3 (2.1) 5.5 19.9 12.6 (14.1) (371.3) 60.7 116.3
Net Income (2.8) 2.0 12.2 1.3 4.3 10.7 2.7 6.7 14.5 4.8 0.8 (349.2) 57.2 116.4
EBITDAR 73.3 74.6 92.4 76.5 79.5 86.1 73.7 89.2 104.8 101.3 68.7 376.0 919.9 144.6
USDIDR 12,540 12,697 13,053 12,946 12,946 13,258 13,346 13,675 14,403 14,157 13,679 11,883 13,336 12.2

26
Operational Performance YTD November 2015
Jan15 Feb15 Mar15 April15 May15 June15 July15 Aug15 Sep15 Oct15 Nov15 YTD Nov14 YTD Nov15 ∆%
GA Group
Pax Carried 2,530,719 2,352,514 2,718,162 2,617,933 2,844,598 2,837,035 3,131,599 2,997,062 2,521,972 2,654,890 2,703,168 26,185,823 29,909,652 14.2
ASK (000) 4,579,484 3,969,185 4,379,174 4,382,420 4,525,879 4,246,134 4,490,507 4,311,873 3,863,669 3,967,296 3,931,849 45,350,834 46,647,470 2.9
RPK (000) 3,384,857 2,981,210 3,353,161 3,227,157 3,428,019 3,387,562 3,630,462 3,544,254 3,014,528 3,107,323 3,024,192 32,335,038 36,082,726 11.6
SLF (%) 73.9 75.1 76.6 73.6 75.7 79.8 80.9 82.2 78.0 78.3 76.9 71.3 77.4 6.1
Passanger Yield (Usc) 7.8 7.5 7.4 7.5 7.5 7.2 7.6 7.4 7.0 7.1 7.3 8.6 7.4 -14.0
CASK (Usc) 6.6 6.5 6.3 6.3 6.4 6.5 6.6 6.4 6.4 6.5 6.5 7.6 6.4 -15.8
CASK-excl Fuel (Usc) 4.6 4.7 4.3 4.4 4.4 4.4 4.4 4.5 4.7 4.7 4.8 4.6 4.5 -2.2
Fuel Price (USD/Liter) 0.57 0.51 0.55 0.55 0.56 0.58 0.59 0.51 0.47 0.49 0.48 0.85 0.53 -37.6
USDIDR 12,540 12,697 13,053 12,946 12,946 13,258 13,346 13,657 14,403 14,157 13,679 11,883 13,336 12.2
Domestic
Pax Carried 1,478,488 1,395,139 1,606,296 1,557,859 1,691,570 1,702,988 1,834,235 1,748,335 1,494,055 1,595,898 1,593,807 15,859,790 17,698,670 11.59
ASK (000) 1,814,370 1,652,182 1,867,850 1,855,800 1,916,993 1,812,428 1,913,557 1,915,803 1,699,649 1,769,055 1,780,271 18,440,677 19,998,041 8.45
RPK (000) 1,307,505 1,221,731 1,415,898 1,363,281 1,476,052 1,481,925 1,573,470 1,530,538 1,305,396 1,412,568 1,403,522 13,699,666 15,491,886 13.08
SLF (%) 72.1 74.0 75.8 73.5 77.0 81.8 82.2 79.9 76.8 79.9 78.8 74.29 77.5 3.2
International
Pax Carried 393,304 321,390 349,884 343,704 357,420 357,277 376,012 362,762 315,233 313,972 283,760 3,574,867 3,774,718 5.59
ASK (000) 2,120,078 1,705,563 1,785,559 1,834,306 1,835,190 1,685,657 1,705,301 1,600,580 1,470,577 1,437,313 1,289,719 20,406,769 18,469,843 -9.49
RPK (000) 1,579,310 1,275,576 1,339,302 1,302,737 1,330,834 1,294,929 1,340,011 1,325,174 1,165,664 1,116,598 964,549 13,487,581 14,034,687 4.06
SLF (%) 74.5 74.8 75.0 71.0 72.5 76.8 78.6 82.8 79.3 77.7 74.8 66.09 76.0 9.9
Citilink
Pax Carried 658,927 635,985 761,982 716,370 795,608 776,770 921,352 885,965 712,684 745,020 825,601 6,751,166 8,436,264 24.96
ASK (000) 645,035 611,439 725,764 692,314 773,696 748,049 871,649 795,489 693,443 760,929 861,859 6,503,388 8,179,667 25.78
RPK (000) 498,042 483,901 597,961 561,138 621,134 610,709 716,981 688,541 543,469 578,157 656,121 5,147,790 6,556,154 27.36
SLF (%) 77.2 79.1 82.4 81.1 80.3 81.6 82.3 86.6 78.4 76.0 76.1 79.2 80.2 1.0

27
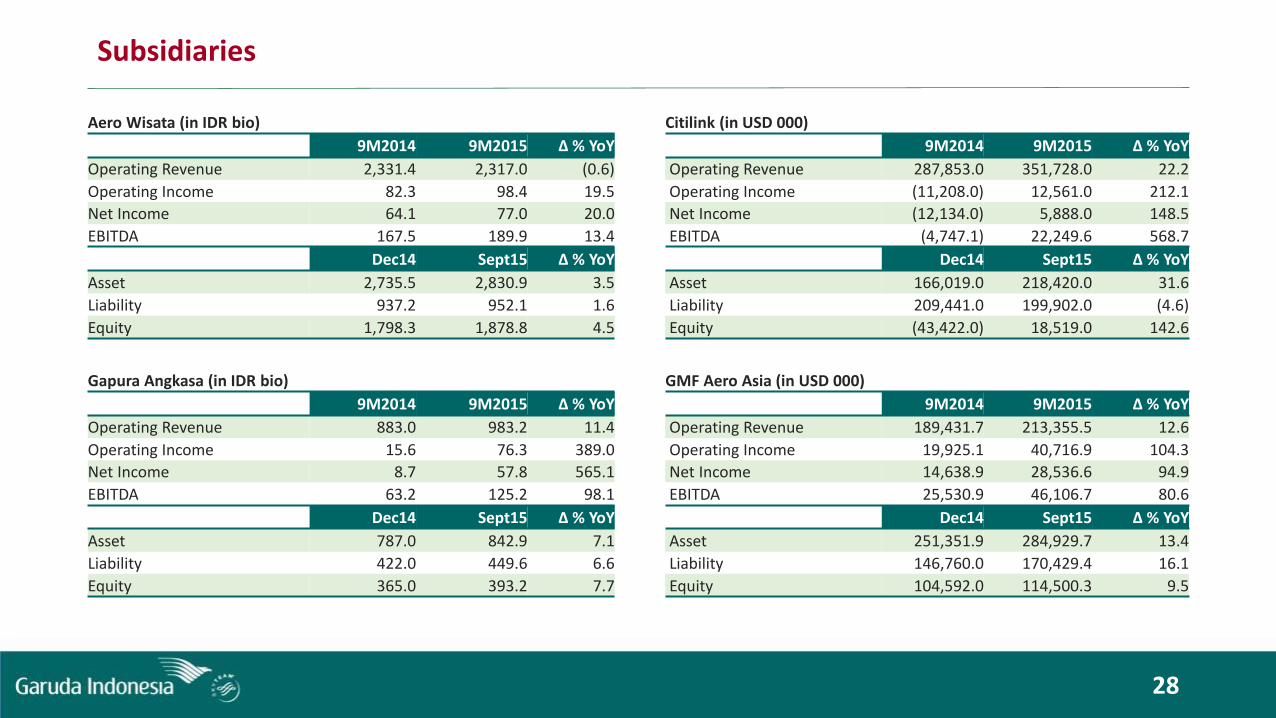
Subsidiaries
Subsidiaries
28
Aero Wisata (in IDR bio) Citilink (in USD 000)
9M2014 9M2015 ∆ % YoY 9M2014 9M2015 ∆ % YoY
Operating Revenue 2,331.4 2,317.0 (0.6) Operating Revenue 287,853.0 351,728.0 22.2
Operating Income 82.3 98.4 19.5 Operating Income (11,208.0) 12,561.0 212.1
Net Income 64.1 77.0 20.0 Net Income (12,134.0) 5,888.0 148.5
EBITDA 167.5 189.9 13.4 EBITDA (4,747.1) 22,249.6 568.7
Dec14 Sept15 ∆ % YoY Dec14 Sept15 ∆ % YoY
Asset 2,735.5 2,830.9 3.5 Asset 166,019.0 218,420.0 31.6
Liability 937.2 952.1 1.6 Liability 209,441.0 199,902.0 (4.6)
Equity 1,798.3 1,878.8 4.5 Equity (43,422.0) 18,519.0 142.6
Gapura Angkasa (in IDR bio) GMF Aero Asia (in USD 000)
9M2014 9M2015 ∆ % YoY 9M2014 9M2015 ∆ % YoY
Operating Revenue 883.0 983.2 11.4 Operating Revenue 189,431.7 213,355.5 12.6
Operating Income 15.6 76.3 389.0 Operating Income 19,925.1 40,716.9 104.3
Net Income 8.7 57.8 565.1 Net Income 14,638.9 28,536.6 94.9
EBITDA 63.2 125.2 98.1 EBITDA 25,530.9 46,106.7 80.6
Dec14 Sept15 ∆ % YoY Dec14 Sept15 ∆ % YoY
Asset 787.0 842.9 7.1 Asset 251,351.9 284,929.7 13.4
Liability 422.0 449.6 6.6 Liability 146,760.0 170,429.4 16.1
Equity 365.0 393.2 7.7 Equity 104,592.0 114,500.3 9.5
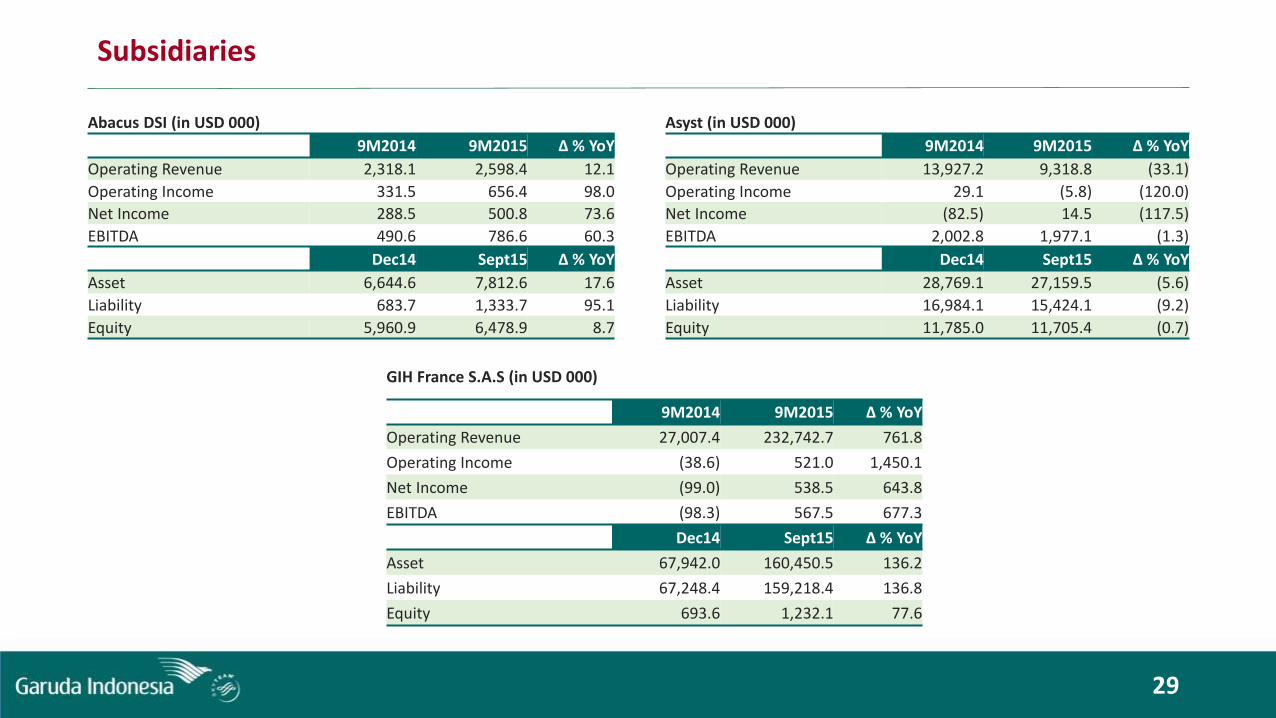
Subsidiaries
29
Abacus DSI (in USD 000) Asyst (in USD 000)
9M2014 9M2015 ∆ % YoY 9M2014 9M2015 ∆ % YoY
Operating Revenue 2,318.1 2,598.4 12.1 Operating Revenue 13,927.2 9,318.8 (33.1)
Operating Income 331.5 656.4 98.0 Operating Income 29.1 (5.8) (120.0)
Net Income 288.5 500.8 73.6 Net Income (82.5) 14.5 (117.5)
EBITDA 490.6 786.6 60.3 EBITDA 2,002.8 1,977.1 (1.3)
Dec14 Sept15 ∆ % YoY Dec14 Sept15 ∆ % YoY
Asset 6,644.6 7,812.6 17.6 Asset 28,769.1 27,159.5 (5.6)
Liability 683.7 1,333.7 95.1 Liability 16,984.1 15,424.1 (9.2)
Equity 5,960.9 6,478.9 8.7 Equity 11,785.0 11,705.4 (0.7)
GIH France S.A.S (in USD 000)
9M2014 9M2015 ∆ % YoY
Operating Revenue 27,007.4 232,742.7 761.8
Operating Income (38.6) 521.0 1,450.1
Net Income (99.0) 538.5 643.8
EBITDA (98.3) 567.5 677.3
Dec14 Sept15 ∆ % YoY
Asset 67,942.0 160,450.5 136.2
Liability 67,248.4 159,218.4 136.8
Equity 693.6 1,232.1 77.6

30
Notes
31
Notes

32
PT Garuda Indonesia (Persero) Tbk.Investor Relations Department
2nd Floor Management BuildingGaruda CitySoekarno-Hatta International AirportPhone: 62-21-2560 1201Email: [email protected]
Related Documents