Max India Annual Report 2010-11 Abridged
Oct 30, 2014
Welcome message from author
This document is posted to help you gain knowledge. Please leave a comment to let me know what you think about it! Share it to your friends and learn new things together.
Transcript
DESPITE ITS COMPANIES AND JOINT VENTURES BEING AT DIFFERENT STAGES OF DEVELOPMENT, MAX INDIA IS NOW ON A SUSTAINED GROWTH PATH, BOTH IN TERMS OF REVENUES AND PROFITS
IN T
HE
BUSI
NES
S O
F LI
FEM
ax In
dia
Lim
ited.
Ann
ual R
epor
t 20
10-1
1.
01
CONTENTS
In the Business of Life
0202Letter to Shareholders
1616Management Discussion andAnalysis
Corporate Governance
7676Shareholders’ Information
8787Financials
9393
2222
IN T
HE
BUSI
NES
S O
F LI
FEM
ax In
dia
Lim
ited.
Ann
ual R
epor
t 20
10-1
1.
02
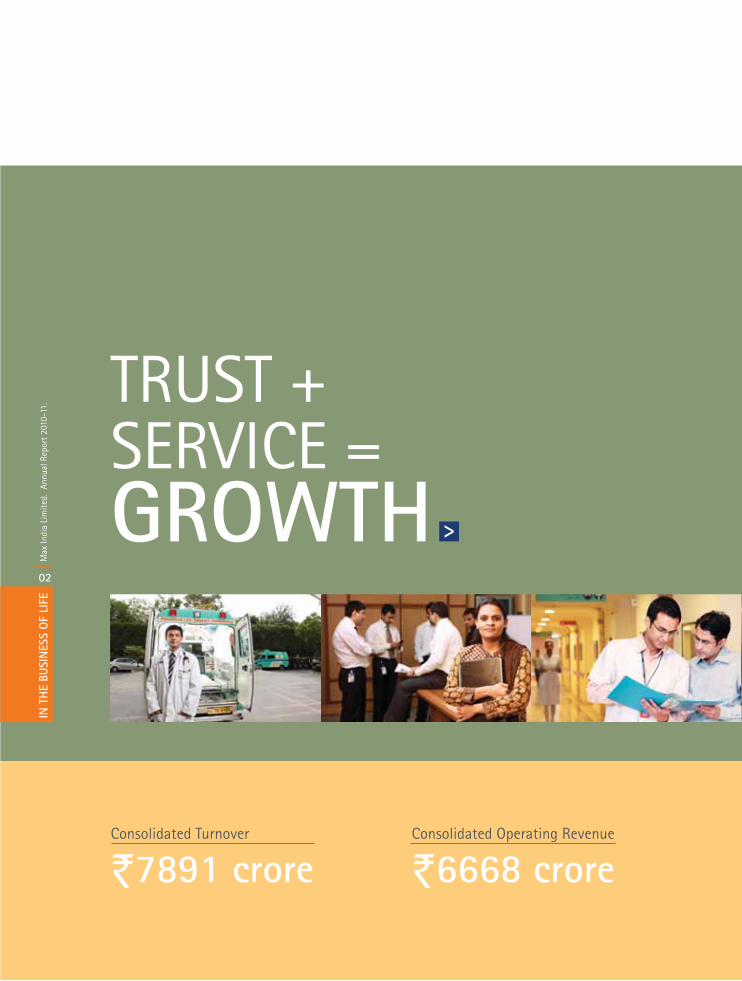
TRUST + SERVICE = GROWTH
Consolidated Turnover
`7891 croreConsolidated Operating Revenue
`6668 crore
IN T
HE
BUSI
NES
S O
F LI
FEM
ax In
dia
Lim
ited.
Ann
ual R
epor
t 20
10-1
1.
03
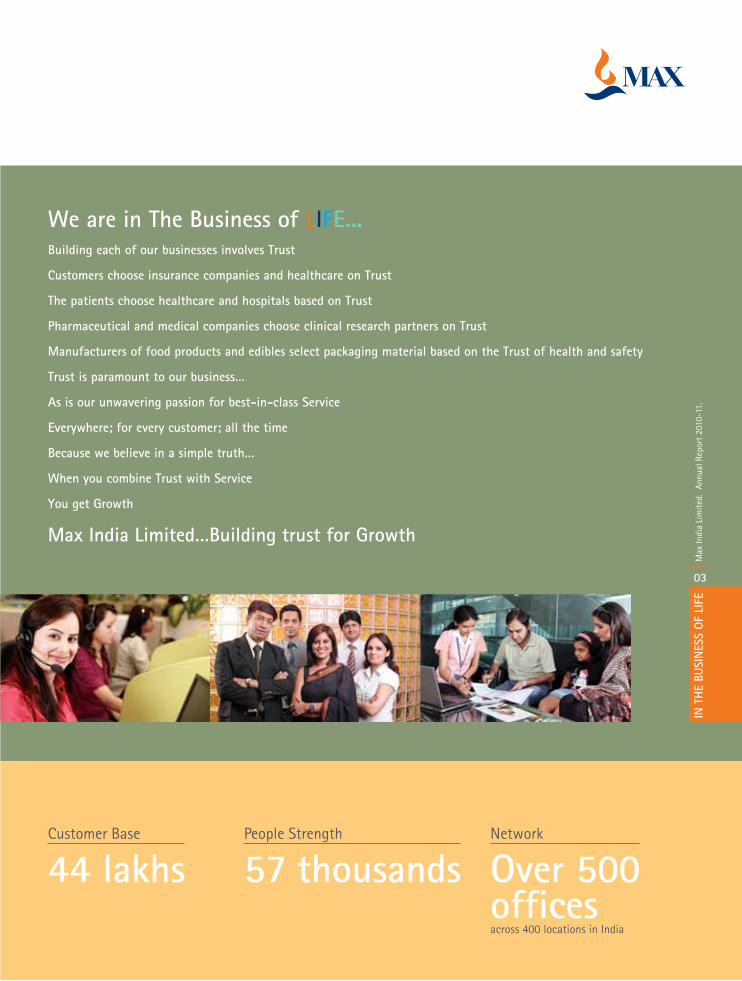
We are in The Business of LIFE...Building each of our businesses involves Trust
Customers choose insurance companies and healthcare on Trust
The patients choose healthcare and hospitals based on Trust
Pharmaceutical and medical companies choose clinical research partners on Trust
Manufacturers of food products and edibles select packaging material based on the Trust of health and safety
Trust is paramount to our business…
As is our unwavering passion for best-in-class Service
Everywhere; for every customer; all the time
Because we believe in a simple truth…
When you combine Trust with Service
You get Growth
Max India Limited…Building trust for Growth
Customer Base
44 lakhsPeople Strength
57 thousandsacross 400 locations in India
Network
Over 500 offices
IN T
HE
BUSI
NES
S O
F LI
FEM
ax In
dia
Lim
ited.
Ann
ual R
epor
t 20
10-1
1.
04 1985-2011
IN T
HE
BUSI
NES
S O
F LI
FEM
ax In
dia
Lim
ited.
Ann
ual R
epor
t 20
10-1
1.
05
WE’VE, INDEED, COME A LONG WAY. TRAVERSING NEW MILESTONES IN OURJOURNEY OF EXCELLENCE TO SCALE NEW LEVELS OF ACHIEVEMENT
ENVISIONING NEW FRONTIERS OF HOPE TO REACH NEW HEIGHTS OF SUCCESS. WE HAVE MADE IT OUR BUSINESS TO EXCEL IN ALL THAT WE DO
IN T
HE
BUSI
NES
S O
F LI
FEM
ax In
dia
Lim
ited.
Ann
ual R
epor
t 20
10-1
1.
06
living our valuesyears of
IN T
HE
BUSI
NES
S O
F LI
FE
MAX INDIA HAS A STRONG HISTORY OF ENTREPRENEURSHIP AND IS CREDITED WITH FORGING AND SUCCESSFULLY NURTURING STRONG AND FRUITFUL BUSINESS RELATIONSHIPS WITH LEADING GLOBAL COMPANIES OVER THE YEARS. NOT ONLY HAVE THESE PARTNERSHIPS STOOD THE TEST OF TIME, THEY HAVE CONSISTENTLY GROWN, DEVELOPED, AND ATTAINED OPTIMUM STATURE AND CREDIBILITY
1985 - 2000
Max
Indi
a Li
mite
d. A
nnua
l Rep
ort
2010
-11.
07
1985
1988
IN T
HE
BUSI
NES
S O
F LI
FEM
ax In
dia
Lim
ited.
Ann
ual R
epor
t 20
10-1
1.
8
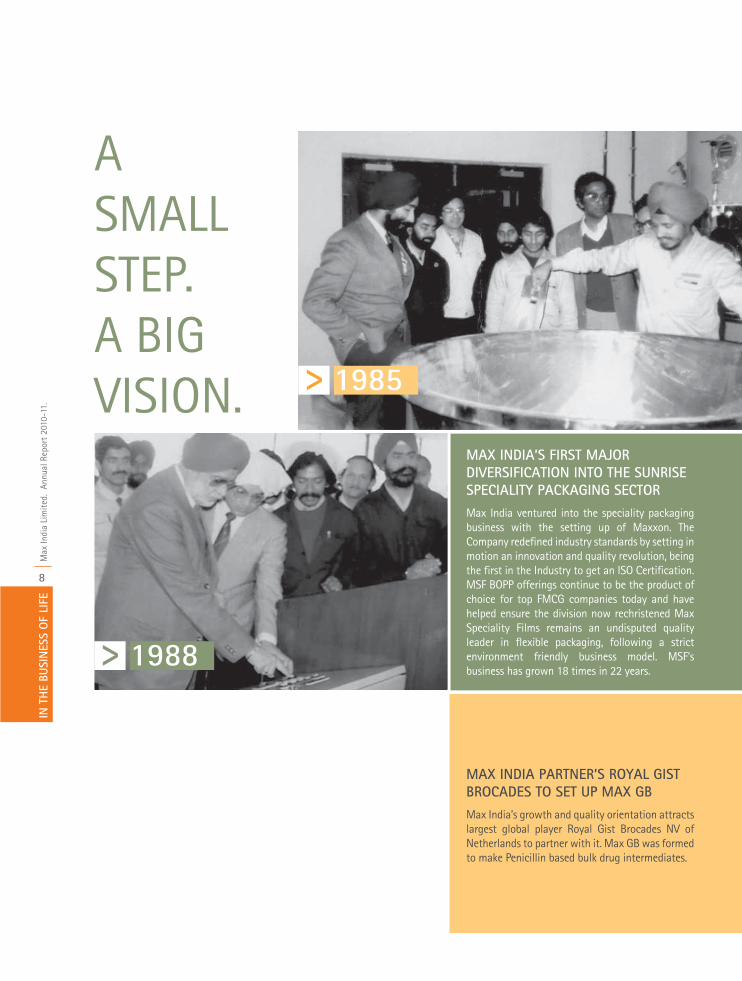
A SMALL STEP. A BIG VISION.
MAX INDIA PARTNER’S ROYAL GIST BROCADES TO SET UP MAX GBMax India’s growth and quality orientation attracts largest global player Royal Gist Brocades NV of Netherlands to partner with it. Max GB was formed to make Penicillin based bulk drug intermediates.
MAX INDIA’S FIRST MAJOR DIVERSIFICATION INTO THE SUNRISE SPECIALITY PACKAGING SECTOR Max India ventured into the speciality packaging business with the setting up of Maxxon. The Company redefined industry standards by setting in motion an innovation and quality revolution, being the first in the Industry to get an ISO Certification. MSF BOPP offerings continue to be the product of choice for top FMCG companies today and have helped ensure the division now rechristened Max Speciality Films remains an undisputed quality leader in flexible packaging, following a strict environment friendly business model. MSF’s business has grown 18 times in 22 years.
1985-
2000
1993
IN T
HE
BUSI
NES
S O
F LI
FEM
ax In
dia
Lim
ited.
Ann
ual R
epor
t 20
10-1
1.
9
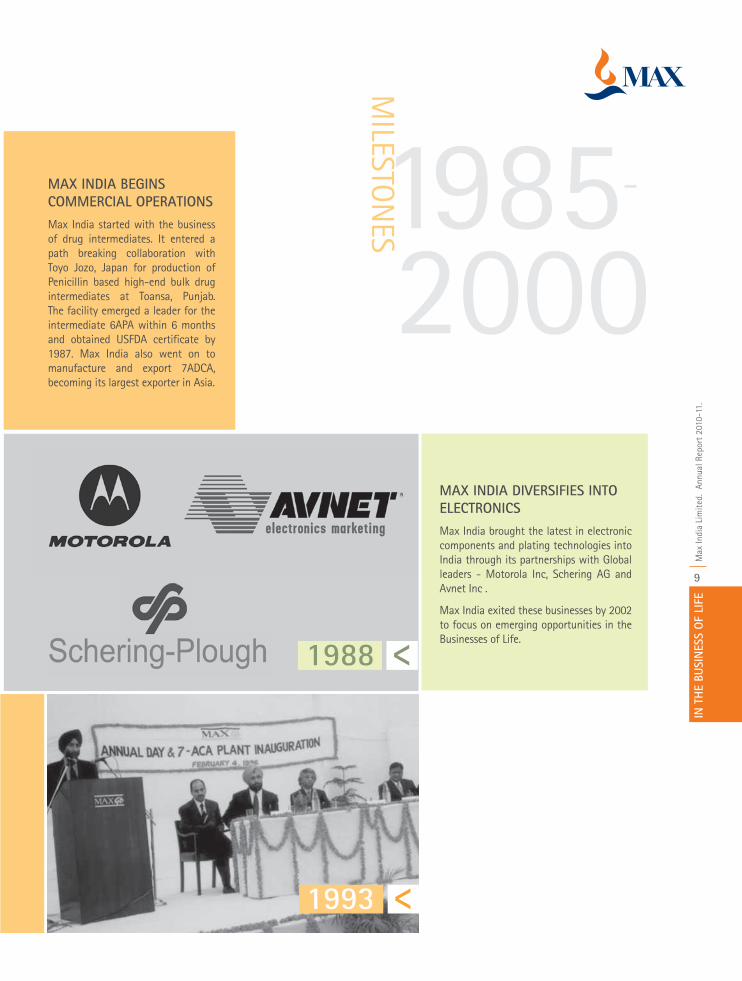
MAX INDIA BEGINS COMMERCIAL OPERATIONSMax India started with the business of drug intermediates. It entered a path breaking collaboration with Toyo Jozo, Japan for production of Penicillin based high-end bulk drug intermediates at Toansa, Punjab. The facility emerged a leader for the intermediate 6APA within 6 months and obtained USFDA certificate by 1987. Max India also went on to manufacture and export 7ADCA, becoming its largest exporter in Asia.
1988
MAX INDIA DIVERSIFIES INTO ELECTRONICS Max India brought the latest in electronic components and plating technologies into India through its partnerships with Global leaders - Motorola Inc, Schering AG and Avnet Inc .
Max India exited these businesses by 2002 to focus on emerging opportunities in the Businesses of Life.
1995
1985-
2000
1996
IN T
HE
BUSI
NES
S O
F LI
FEM
ax In
dia
Lim
ited.
Ann
ual R
epor
t 20
10-1
1.
10
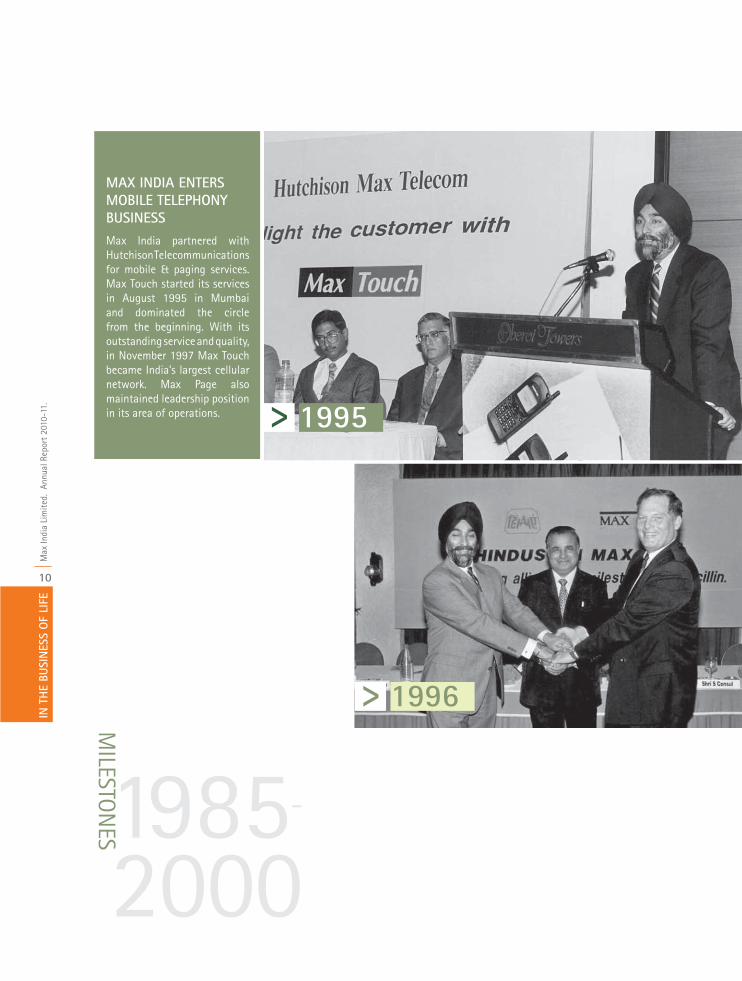
MAX INDIA ENTERS MOBILE TELEPHONY BUSINESSMax India partnered with Hutchison Telecommunications for mobile & paging services. Max Touch started its services in August 1995 in Mumbai and dominated the circle from the beginning. With its outstanding service and quality, in November 1997 Max Touch became India’s largest cellular network. Max Page also maintained leadership position in its area of operations.
1995
1996IN
TH
E BU
SIN
ESS
OF
LIFE
Max
Indi
a Li
mite
d. A
nnua
l Rep
ort
2010
-11.
11
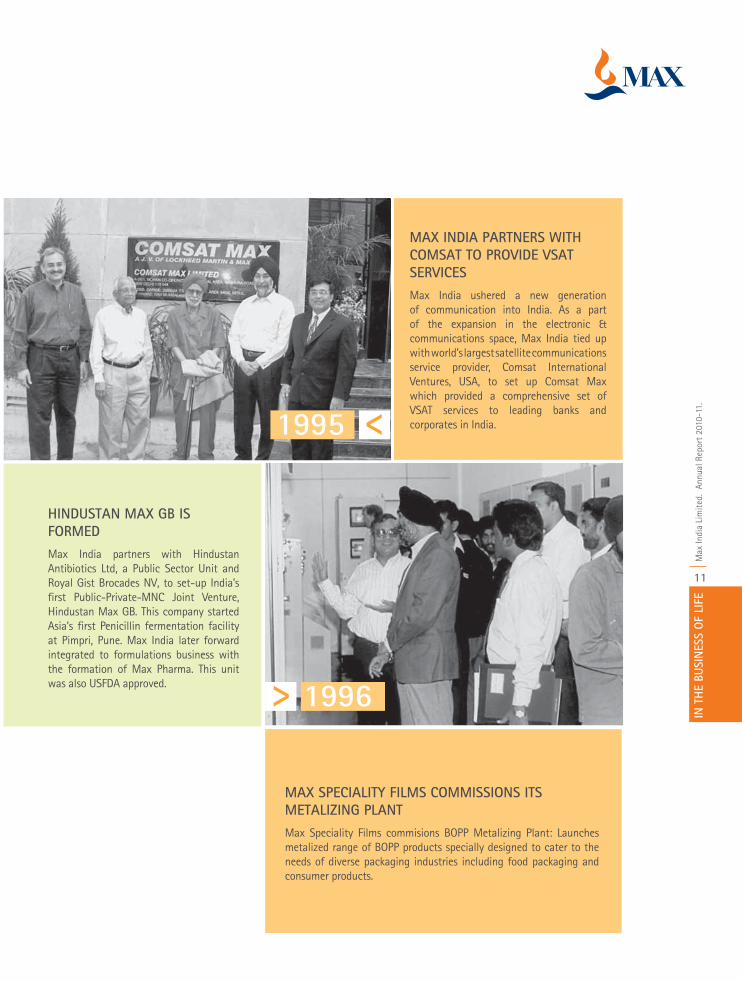
MAX INDIA PARTNERS WITH COMSAT TO PROVIDE VSAT SERVICESMax India ushered a new generation of communication into India. As a part of the expansion in the electronic & communications space, Max India tied up with world’s largest satellite communications service provider, Comsat International Ventures, USA, to set up Comsat Max which provided a comprehensive set of VSAT services to leading banks and corporates in India.
HINDUSTAN MAX GB IS FORMEDMax India partners with Hindustan Antibiotics Ltd, a Public Sector Unit and Royal Gist Brocades NV, to set-up India’s first Public-Private-MNC Joint Venture, Hindustan Max GB. This company started Asia’s first Penicillin fermentation facility at Pimpri, Pune. Max India later forward integrated to formulations business with the formation of Max Pharma. This unit was also USFDA approved.
MAX SPECIALITY FILMS COMMISSIONS ITS METALIZING PLANTMax Speciality Films commisions BOPP Metalizing Plant: Launches metalized range of BOPP products specially designed to cater to the needs of diverse packaging industries including food packaging and consumer products.
years of being in the business of life
IN T
HE
BUSI
NES
S O
F LI
FEM
ax In
dia
Lim
ited.
Ann
ual R
epor
t 20
10-1
1.
12
2001 - 2011
IN T
HE
BUSI
NES
S O
F LI
FEM
ax In
dia
Lim
ited.
Ann
ual R
epor
t 20
10-1
1.
13
IT WAS NOT AN EASY JOURNEY. BUT WE MADE IT. DRIVEN BY OUR VISION TO CREATE SERVICE EXCELLENCE IN ALL OUR BUSINESSES. INSPIRED BY OUR MISSION OF PARTNERING WITH THE BEST IN CLASS WORLD LEADERS. WE MADE IT OUR BUSINESS TO LIVE OUR VALUES, EVERY STEP OF THE WAY. FOCUS ON EXECUTION WAS THE KEY
IN T
HE
BUSI
NES
S O
F LI
FEM
ax In
dia
Lim
ited.
Ann
ual R
epor
t 20
10-1
1.
14
2001-
2011
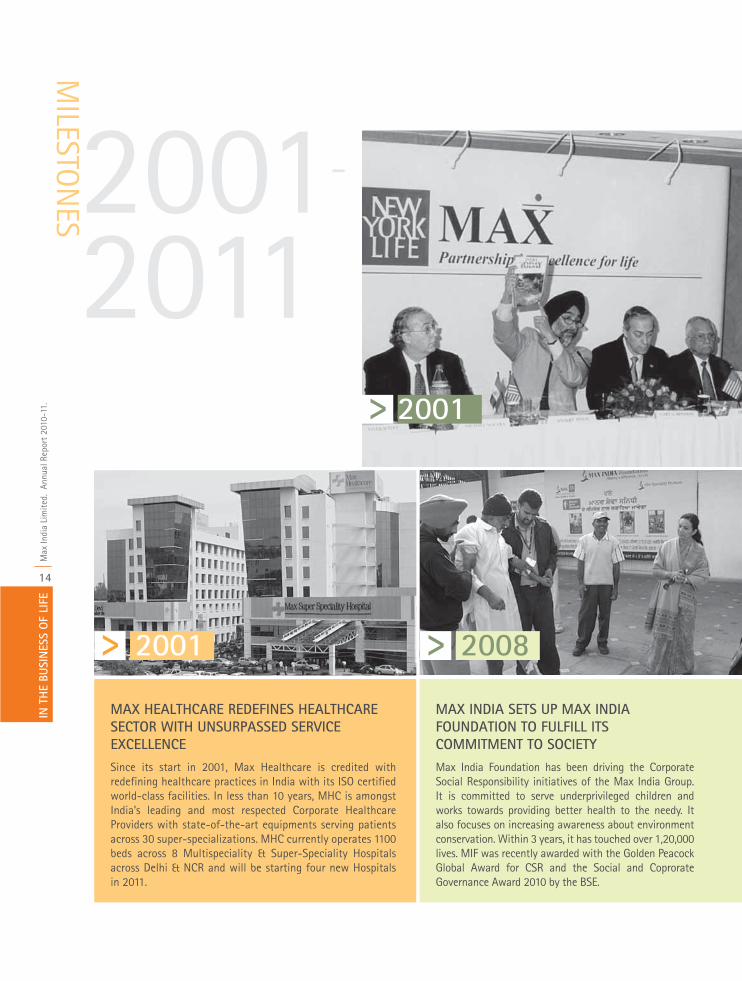
MAX HEALTHCARE REDEFINES HEALTHCARE SECTOR WITH UNSURPASSED SERVICE EXCELLENCESince its start in 2001, Max Healthcare is credited with redefining healthcare practices in India with its ISO certified world-class facilities. In less than 10 years, MHC is amongst India’s leading and most respected Corporate Healthcare Providers with state-of-the-art equipments serving patients across 30 super-specializations. MHC currently operates 1100 beds across 8 Multispeciality & Super-Speciality Hospitals across Delhi & NCR and will be starting four new Hospitals in 2011.
MAX INDIA SETS UP MAX INDIA FOUNDATION TO FULFILL ITS COMMITMENT TO SOCIETY Max India Foundation has been driving the Corporate Social Responsibility initiatives of the Max India Group. It is committed to serve underprivileged children and works towards providing better health to the needy. It also focuses on increasing awareness about environment conservation. Within 3 years, it has touched over 1,20,000 lives. MIF was recently awarded with the Golden Peacock Global Award for CSR and the Social and Coprorate Governance Award 2010 by the BSE.
2001
2001 2008
IN T
HE
BUSI
NES
S O
F LI
FEM
ax In
dia
Lim
ited.
Ann
ual R
epor
t 20
10-1
1.
15
2001
2010
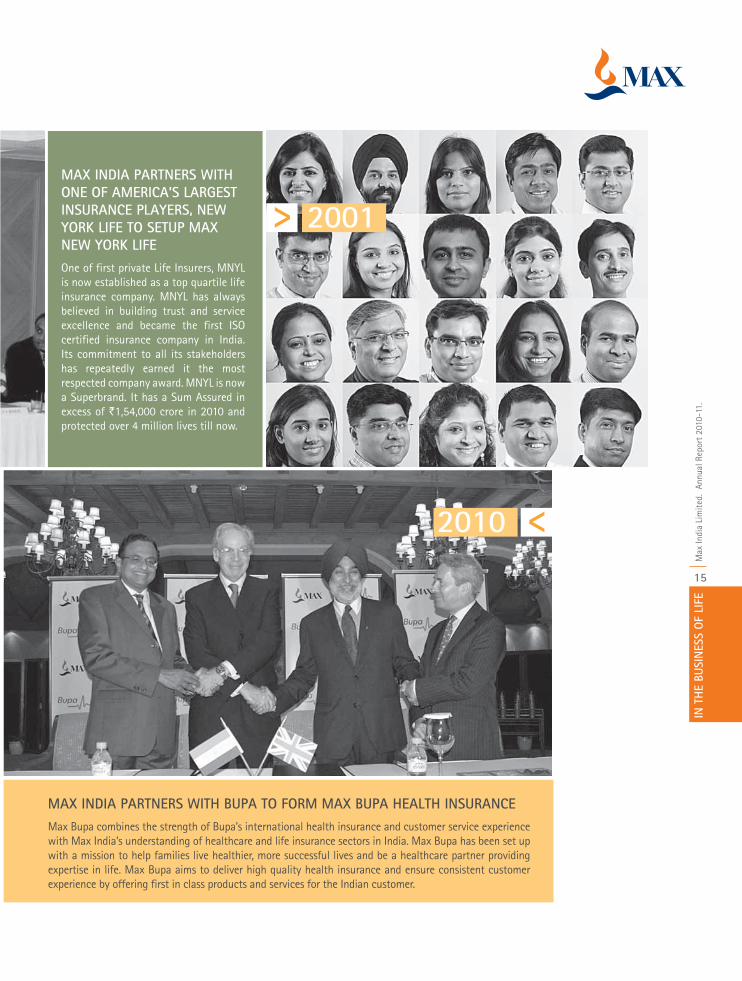
MAX INDIA PARTNERS WITH ONE OF AMERICA’S LARGEST INSURANCE PLAYERS, NEW YORK LIFE TO SETUP MAX NEW YORK LIFE One of first private Life Insurers, MNYL is now established as a top quartile life insurance company. MNYL has always believed in building trust and service excellence and became the first ISO certified insurance company in India. Its commitment to all its stakeholders has repeatedly earned it the most respected company award. MNYL is now a Superbrand. It has a Sum Assured in excess of `1,54,000 crore in 2010 and protected over 4 million lives till now.
MAX INDIA PARTNERS WITH BUPA TO FORM MAX BUPA HEALTH INSURANCE Max Bupa combines the strength of Bupa’s international health insurance and customer service experience with Max India’s understanding of healthcare and life insurance sectors in India. Max Bupa has been set up with a mission to help families live healthier, more successful lives and be a healthcare partner providing expertise in life. Max Bupa aims to deliver high quality health insurance and ensure consistent customer experience by offering first in class products and services for the Indian customer.
IN T
HE
BUSI
NES
S O
F LI
FEM
ax In
dia
Lim
ited.
Ann
ual R
epor
t 20
10-1
1.
16
Letter to Shareholders
THE BHAGVAD GITA HAS A GUIDING VERSE, WHICH TRANSLATES THUS: THE WORLD CONSISTS OF PAIRS OF OPPOSITES LIKE PROFIT AND LOSS, HEAT AND COLD, JOY AND SORROW AND HONOUR AND DISHONOUR. IT IS UNPREDICTABLE. IT IS CONSTANTLY CHANGING AND IS IMPERMANENT. ENDURE THESE FLUCTUATIONS. ONE WHO IS NOT TROUBLED BY THEM, IS BALANCED IN JOY AND SORROW, AND IS STEADY, IS FIT FOR EXCELLENCE. LOOKING BACK AT 2010-11, I MUST ADMIT THERE WERE CHALLENGES. THIS MADE US LOOK BEYOND. WE REMAINED UNPERTURBED, STRIVED HARD FOR ‘EXCELLENCE’, AND SUCCEEDED.
On 1 September 2010, the Insurance Regulatory and Development Authority (IRDA) mandated significant, industry re-defining regulatory changes. It was like being hit by a dozen tornadoes and typhoons at the same time. The chapter on Management Discussion and Analysis explains the sea changes that the IRDA has brought about in the life insurance industry. Max New York Life (MNYL) had to anticipate and react very quickly to these changes. Which it did admirably - and often beyond the call of duty. It swiftly rallied forces, re-configured its businesses and priorities and moved on to profitable growth. I dare say that it was one of the very few private sector life insurance players that
2010-11 BROUGHT TO LIFE SOME VERY “INTERESTING TIMES” WITH GOOD NEWS AND DIFFICULTIES, VICTORIES AND CONFLICTS, UNEXPECTED EVENTS BOTH GOOD AND BAD, JOYS AND HEARTBURNS — A STATE WHERE THESIS AND ANTI-THESIS COMBINED IN MYRIAD DIFFERENT WAYS AND COLOURS
could weather a regulatory storm that was as profound as it was far reaching.
Consider the facts. Notwithstanding being buffeted by that life-threatening storm, MNYL’s total revenue (first year premium plus renewals) grew by 20% to `5,813 crore; its market share among private players based on adjusted first year premium went up by 200 basis points to 7.5%; its cost ratio improved from 42% to 38%, due to stringent cost management initiatives; its assets under management grew by 37% to `13,836 crore; it maintained more than double the stipulated solvency margin; its profit after tax grew more than 12 times to `283 crore; and it generated shareholders’ profit of `194 crore in 2010-11 compared to a loss of `21 crore in 2009-10.
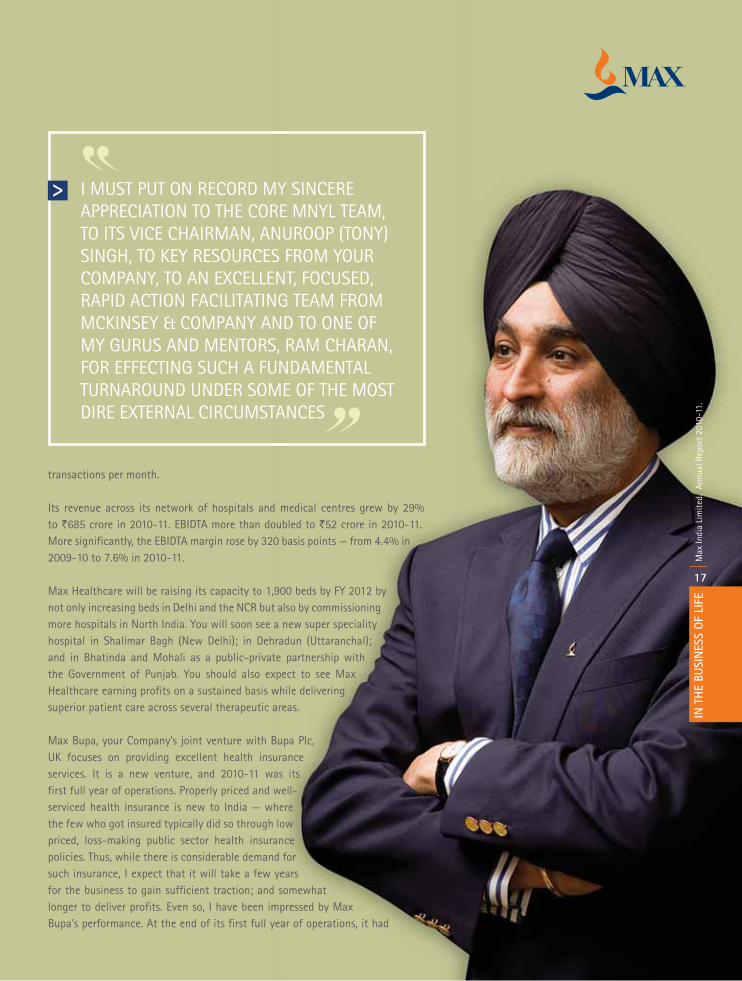
I must put on record my sincere appreciation to the core MNYL team, to its Vice Chairman, Anuroop (Tony) Singh, to key resources from your Company, to an excellent, focused, rapid action facilitating team from McKinsey & Company and to one of my gurus and mentors, Ram Charan, for effecting such a fundamental turnaround under some of the most dire external circumstances.
May we not have any more unsettling changes such as the one we witnessed in September 2010. And may MNYL now be poised for consistently focused, profitable, value enhancing growth — as the preliminary evidence suggests it is.
Compared to the changes that hit the insurance industry, the rest of your Company’s business looked like plain sailing.
Max Healthcare is on a profitable growth path. With the new blocks at Patparganj and Saket getting fully operational, the average number of operational hospital beds increased by 23% from 751 in 2009-10 to 926 in 2010-11. Today, a network of six top class hospitals and two speciality medical centres in Delhi and the National Capital Region (NCR) is serviced by around 1,250 doctors, 1,725 nurses and 1,840 para-medical and other staff. The registered patient base now runs at over 11.4 lakh patients. There are over 2.5 lakh patient
IN T
HE
BUSI
NES
S O
F LI
FEM
ax In
dia
Lim
ited.
Ann
ual R
epor
t 20
10-1
1.
17
transactions per month.
Its revenue across its network of hospitals and medical centres grew by 29% to `685 crore in 2010-11. EBIDTA more than doubled to `52 crore in 2010-11. More significantly, the EBIDTA margin rose by 320 basis points — from 4.4% in 2009-10 to 7.6% in 2010-11.
Max Healthcare will be raising its capacity to 1,900 beds by FY 2012 by not only increasing beds in Delhi and the NCR but also by commissioning more hospitals in North India. You will soon see a new super speciality hospital in Shalimar Bagh (New Delhi); in Dehradun (Uttaranchal); and in Bhatinda and Mohali as a public-private partnership with the Government of Punjab. You should also expect to see Max Healthcare earning profits on a sustained basis while delivering superior patient care across several therapeutic areas.
Max Bupa, your Company’s joint venture with Bupa Plc, UK focuses on providing excellent health insurance services. It is a new venture, and 2010-11 was its first full year of operations. Properly priced and well-serviced health insurance is new to India — where the few who got insured typically did so through low priced, loss-making public sector health insurance policies. Thus, while there is considerable demand for such insurance, I expect that it will take a few years for the business to gain sufficient traction; and somewhat longer to deliver profits. Even so, I have been impressed by Max Bupa’s performance. At the end of its first full year of operations, it had
I MUST PUT ON RECORD MY SINCERE APPRECIATION TO THE CORE MNYL TEAM, TO ITS VICE CHAIRMAN, ANUROOP (TONY) SINGH, TO KEY RESOURCES FROM YOUR COMPANY, TO AN EXCELLENT, FOCUSED, RAPID ACTION FACILITATING TEAM FROM MCKINSEY & COMPANY AND TO ONE OF MY GURUS AND MENTORS, RAM CHARAN, FOR EFFECTING SUCH A FUNDAMENTAL TURNAROUND UNDER SOME OF THE MOST DIRE EXTERNAL CIRCUMSTANCES

IN T
HE
BUSI
NES
S O
F LI
FEM
ax In
dia
Lim
ited.
Ann
ual R
epor
t 20
10-1
1.
18
covered a total of 46,000 lives during 2010-11; it earned a gross written premium of over `25 crore; and built multi-channel provider networks and associations with hospitals. I hope that the business continues growing smartly with an eye on quality growth, high service benchmarks and profits.
Max Neeman, your Company’s calibrated foray into clinical research for global pharmaceutical companies is bearing fruit. Though a small relative to MNYL and Max Healthcare and in a very early stage of development, Max Neeman has a client base of 77 global pharmaceutical
entities — having increased it by 20 in 2010-11. I expect growth from this dual-shored operation.
Max Speciality Films (MSF), your Company’s Bi-axially Oriented Polypropylene (BOPP) film and metallising facility in Punjab has continued doing well. MSF’s sales turnover was `456 crore in 2010-11 against `363 crore in 2009-10. Net revenues increased by 25% from `333 crore in 2009-10 to `417 crore in 2010-11. Despite a 22% increase in overall industry capacity, MSF’s operating margin (EBIDTA to net sales) was maintained at 11.7% in
2010-11, which is very creditable in this industry EBIDTA increased by 23% to `53 crore in 2010-11 and PBT increased by 77% to `36 crore.
In the aggregate, therefore, your Company has grown in the midst of a rapidly changing environment. Consolidated operating revenue increased by 20% to `6,668 crore in 2010-11. It has also turned around: consolidated profit before tax was `32 crore in 2010-11 versus a loss of `86 crore in 2009-10. On a consolidated basis, net profit was `9 crore in 2010-11 compared to a net loss of `72 crore in 2009-10. And the treasury corpus was `540 crore as on 31 March 2011.
From the above, it is truly visible that Max India Group is on a sustainable and profitable growth trajectory. Over the last two years, the initiative of putting in place an effective Board governed style of working has strengthened the result orientation of our key businesses, including emphasis on outcome based performance and risk management. However, we continue to live in challenging and complex times, with increasing competition, pressure on profitability, and our commitment to excellence is the key to future success and profitable growth. To strengthen the leadership of your Company, I recently took a decision to step down from the day to day role in my capacity as Managing Director of your Company. Rahul Khosla was appointed by your Board as the future Managing Director of your company on June 8th and will formally be instated as Managing Director on August 18, 2011. Rahul brings with him value based
MAX HEALTHCARE IS ON A PROFITABLE GROWTH PATH. 2011-12 WILL SEE IT DOUBLE ITS CAPACITY AND EXPAND ITS GEOGRAPHIC FOOTPRINT, WITH STATE-OF-THE ART HOSPITALS COMING UP ACROSS NORTH INDIA
IN T
HE
BUSI
NES
S O
F LI
FEM
ax In
dia
Lim
ited.
Ann
ual R
epor
t 20
10-1
1.
19
leadership, high energy and rich experience having held key positions in American Express Bank, Bank of America, ANZ Grindlays Bank, Standard Chartered and lastly Visa in Singapore. Please join me in welcoming and wishing Rahul the very best for his success in his role as Managing Director of your company. I will continue to serve as Executive Chairman of your company as well as Chairman of its subsidiaries, Max New York Life Insurance, Max Healthcare and Max Bupa. I wish to sincerely thanks my partners, New York Life Insurance, U.S.A., Bupa, UK; all the Directors who painstakingly work, heading various Sub-Committees of Boards, my Vice Chairman Anuroop (Tony) Singh and the leadership teams of your company and the overall Max India Group. I look forward to an exciting year ahead and hope that we are able to continue navigating the impermanency, in our quest for excellence and profitable growth.
Analjit SinghChairman
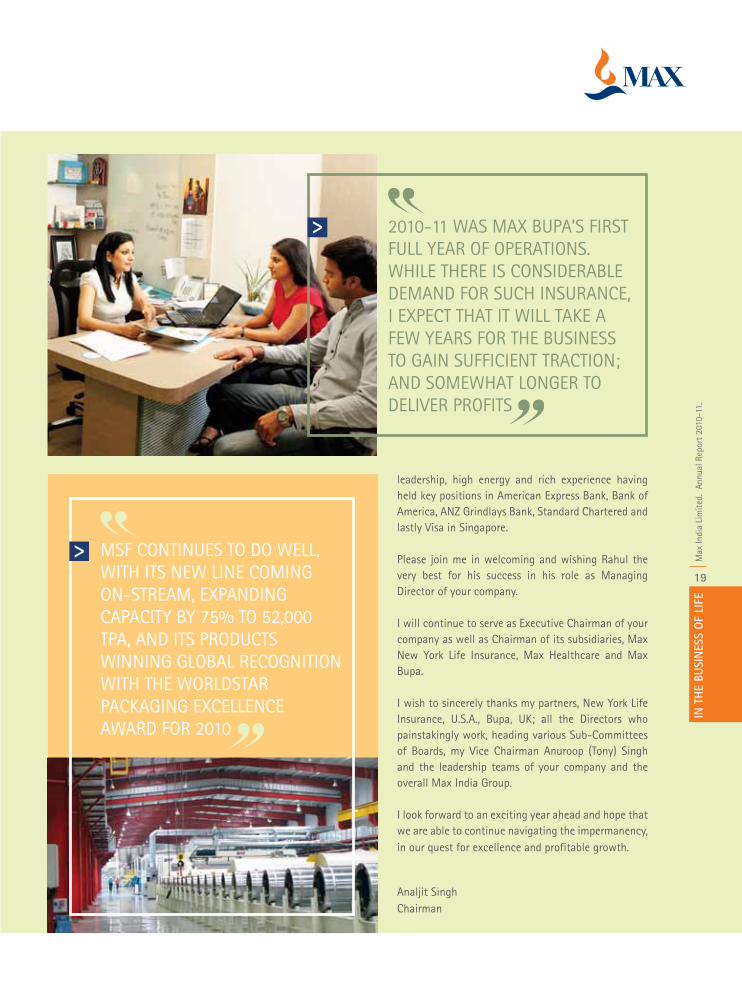
2010-11 WAS MAX BUPA’S FIRST FULL YEAR OF OPERATIONS. WHILE THERE IS CONSIDERABLE DEMAND FOR SUCH INSURANCE, I EXPECT THAT IT WILL TAKE A FEW YEARS FOR THE BUSINESS TO GAIN SUFFICIENT TRACTION; AND SOMEWHAT LONGER TO DELIVER PROFITS
MSF CONTINUES TO DO WELL, WITH ITS NEW LINE COMING ON-STREAM, EXPANDING CAPACITY BY 75% TO 52,000 TPA, AND ITS PRODUCTS WINNING GLOBAL RECOGNITION WITH THE WORLDSTAR PACKAGING EXCELLENCE AWARD FOR 2010
IN T
HE
BUSI
NES
S O
F LI
FEM
ax In
dia
Lim
ited.
Ann
ual R
epor
t 20
10-1
1.
20
DR. OMKAR GOSWAMI
MR. RAJESH KHANNA
MR. VISHAL BAKSHI MR. AMAN MEHTA MR. K. NARASIMHA MURTHY DR. S. S. BAIJAL
DR. SUBASH BIJLANI
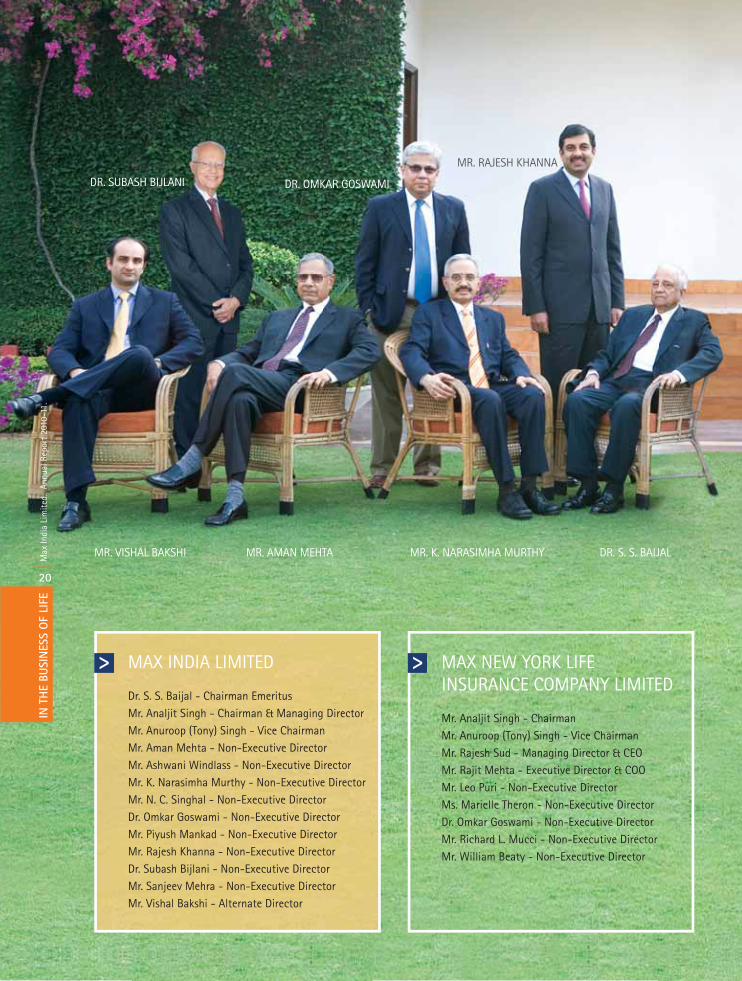
MAX INDIA LIMITED
Dr. S. S. Baijal - Chairman EmeritusMr. Analjit Singh - Chairman & Managing DirectorMr. Anuroop (Tony) Singh - Vice ChairmanMr. Aman Mehta - Non-Executive DirectorMr. Ashwani Windlass - Non-Executive DirectorMr. K. Narasimha Murthy - Non-Executive DirectorMr. N. C. Singhal - Non-Executive DirectorDr. Omkar Goswami - Non-Executive DirectorMr. Piyush Mankad - Non-Executive DirectorMr. Rajesh Khanna - Non-Executive DirectorDr. Subash Bijlani - Non-Executive DirectorMr. Sanjeev Mehra - Non-Executive DirectorMr. Vishal Bakshi - Alternate Director
MAX NEW YORK LIFE INSURANCE COMPANY LIMITED
Mr. Analjit Singh - ChairmanMr. Anuroop (Tony) Singh - Vice ChairmanMr. Rajesh Sud - Managing Director & CEOMr. Rajit Mehta - Executive Director & COOMr. Leo Puri - Non-Executive DirectorMs. Marielle Theron - Non-Executive DirectorDr. Omkar Goswami - Non-Executive DirectorMr. Richard L. Mucci - Non-Executive DirectorMr. William Beaty - Non-Executive Director
IN T
HE
BUSI
NES
S O
F LI
FEM
ax In
dia
Lim
ited.
Ann
ual R
epor
t 20
10-1
1.
21
MR. ANUROOP (TONY) SINGH
MR. SANJEEV MEHRA
MR. PIYUSH MANKAD
MR. ANALJIT SINGH MR. ASHWANI WINDLASS MR. N. C. SINGHAL
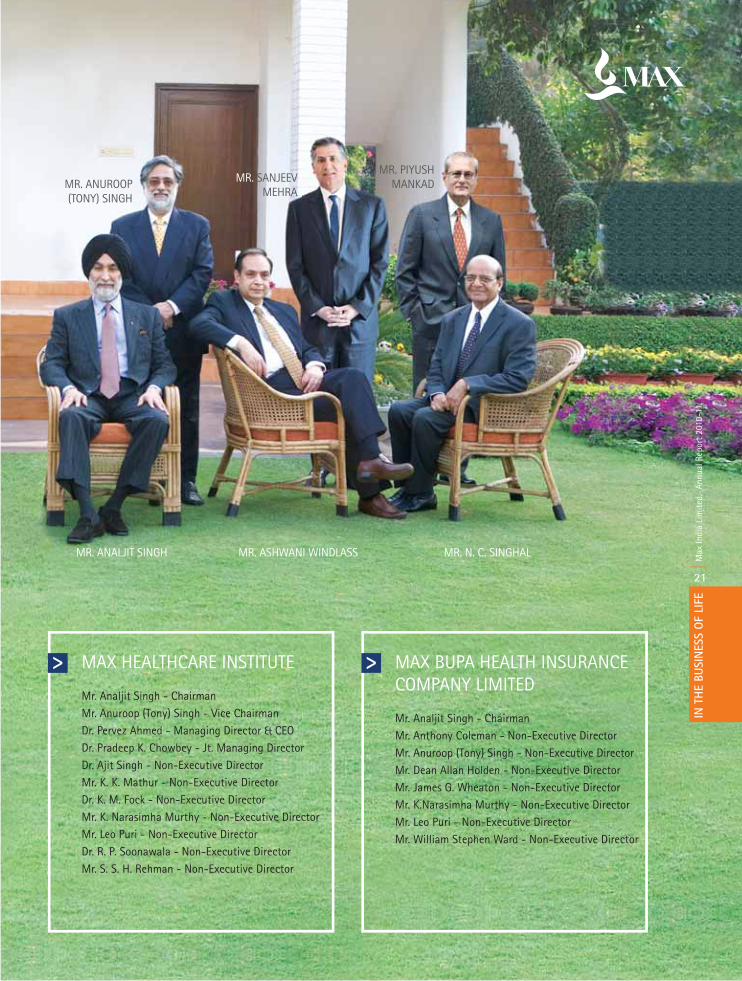
MAX HEALTHCARE INSTITUTE
Mr. Analjit Singh - ChairmanMr. Anuroop (Tony) Singh - Vice ChairmanDr. Pervez Ahmed - Managing Director & CEODr. Pradeep K. Chowbey - Jt. Managing DirectorDr. Ajit Singh - Non-Executive DirectorMr. K. K. Mathur - Non-Executive DirectorDr. K. M. Fock - Non-Executive DirectorMr. K. Narasimha Murthy - Non-Executive DirectorMr. Leo Puri - Non-Executive DirectorDr. R. P. Soonawala - Non-Executive DirectorMr. S. S. H. Rehman - Non-Executive Director
MAX BUPA HEALTH INSURANCE COMPANY LIMITED
Mr. Analjit Singh - ChairmanMr. Anthony Coleman - Non-Executive DirectorMr. Anuroop (Tony) Singh - Non-Executive DirectorMr. Dean Allan Holden - Non-Executive DirectorMr. James G. Wheaton - Non-Executive DirectorMr. K.Narasimha Murthy - Non-Executive DirectorMr. Leo Puri - Non-Executive DirectorMr. William Stephen Ward - Non-Executive Director
IN T
HE
BUSI
NES
S O
F LI
FEM
ax In
dia
Lim
ited.
Ann
ual R
epor
t 20
10-1
1.
22
DRIVEN BY THE SPIRIT OF ENTERPRISE, THE COMPANY’S VISION IS TO BE ONE OF INDIA’S MOST ADMIRED COMPANIES FOR SERVICE EXCELLENCE
Management Discussion & Analysis
IN T
HE
BUSI
NES
S O
F LI
FEM
ax In
dia
Lim
ited.
Ann
ual R
epor
t 20
10-1
1.
23
IN T
HE
BUSI
NES
S O
F LI
FEM
ax In
dia
Lim
ited.
Ann
ual R
epor
t 20
10-1
1.
24
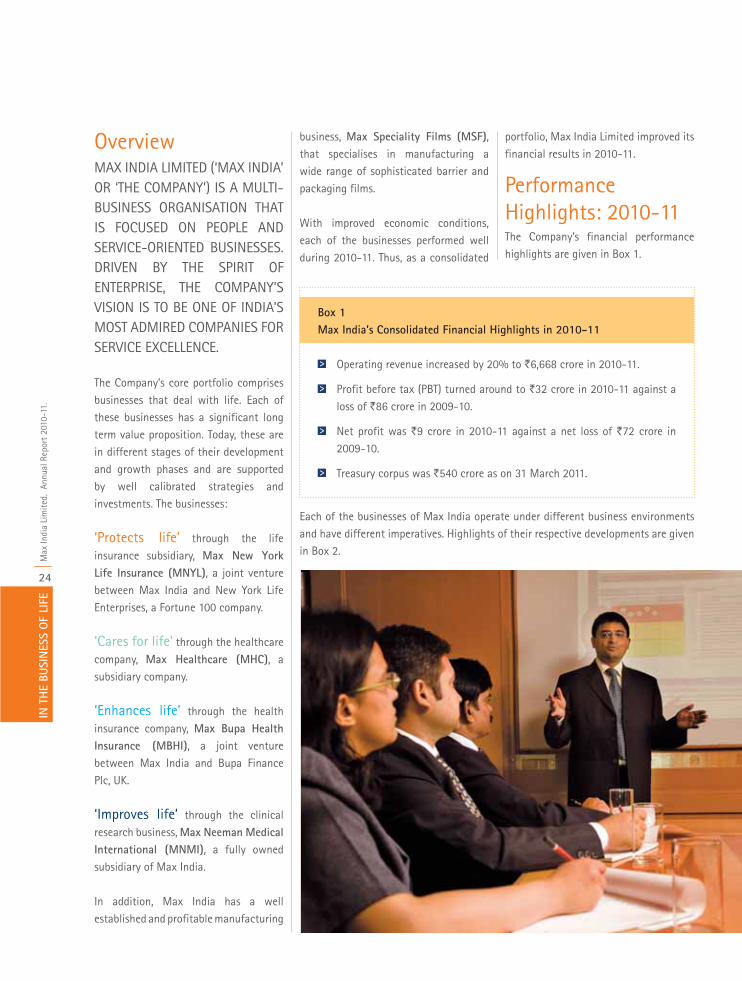
OverviewMAX INDIA LIMITED (‘MAX INDIA’ OR ‘THE COMPANY’) IS A MULTI-BUSINESS ORGANISATION THAT IS FOCUSED ON PEOPLE AND SERVICE-ORIENTED BUSINESSES. DRIVEN BY THE SPIRIT OF ENTERPRISE, THE COMPANY’S VISION IS TO BE ONE OF INDIA’S MOST ADMIRED COMPANIES FOR SERVICE EXCELLENCE.
The Company’s core portfolio comprises businesses that deal with life. Each of these businesses has a significant long term value proposition. Today, these are in different stages of their development and growth phases and are supported by well calibrated strategies and investments. The businesses:
‘Protects life’ through the life insurance subsidiary, Max New York Life Insurance (MNYL), a joint venture between Max India and New York Life Enterprises, a Fortune 100 company.
‘Cares for life’ through the healthcare company, Max Healthcare (MHC), a subsidiary company.
‘Enhances life’ through the health insurance company, Max Bupa Health Insurance (MBHI), a joint venture between Max India and Bupa Finance Plc, UK.
‘Improves life’ through the clinical research business, Max Neeman Medical International (MNMI), a fully owned subsidiary of Max India.
In addition, Max India has a well established and profitable manufacturing
business, Max Speciality Films (MSF), that specialises in manufacturing a wide range of sophisticated barrier and packaging films.
With improved economic conditions, each of the businesses performed well during 2010-11. Thus, as a consolidated
Each of the businesses of Max India operate under different business environments and have different imperatives. Highlights of their respective developments are given in Box 2.
portfolio, Max India Limited improved its financial results in 2010-11. Performance Highlights: 2010-11The Company’s financial performance highlights are given in Box 1.
Box 1Max India’s Consolidated Financial Highlights in 2010-11
Operating revenue increased by 20% to `6,668 crore in 2010-11.
Profit before tax (PBT) turned around to `32 crore in 2010-11 against a loss of `86 crore in 2009-10.
Net profit was `9 crore in 2010-11 against a net loss of `72 crore in 2009-10.
Treasury corpus was `540 crore as on 31 March 2011.
IN T
HE
BUSI
NES
S O
F LI
FEM
ax In
dia
Lim
ited.
Ann
ual R
epor
t 20
10-1
1.
25
2010-11 WAS A TRANSFORMATIVE YEAR FOR MAX INDIA WITH AGGREGATE OPERATING REVENUE RISING 20% TO `6,668 CRORE IN 2010-11 AND OPERATIONS TURNING AROUND TO ACHIEVE PROFIT BEFORE TAX OF `32 CRORE VERSUS A LOSS OF `86 CRORE IN 2009-10
Box 2Key Developments in the Different Businesses, 2010-11
The subsequent sections give detailed review for each of the individual businesses in Max India’s portfolio.
Life Insurance
Embedded value grew by 18% to `3,216 crore in 2010-11.
Value of new business was `235 crore in 2010-11, translating into a margin of 19.5%.
The market share increased from 5.5% in 2009-10 to 7.5% in 2010-11.
It generated shareholders’ profit of `194 crore in 2010-11 against a loss of `21 crore in 2009-10.
Additionally, it generated an undistributed surplus of `89 crore during 2010-11 in the policyholders’ account against `45 crore in 2009-10.
Healthcare (Network of Hospitals)
EBITDA for `52 crore in 2010-11; up 121% over the previous year.
EBITDA margin improves from 4.4% in 2009-10 to 7.6% in 2010-11.
Max Super Speciality Hospital, Saket, was awarded with Excellence in Healthcare Delivery and Max Super Speciality Hospital, Patparganj, for Environmental Conservation by FICCI.
Speciality Products
Expanded capacity to 52,000 tpa with a new line of 22,000 tpa coming on-stream.
Net profit grew by 77% to `36 crore in 2010-11.
Won the Worldstar Packaging Excellence Award 2010.
Health Insurance
Created its footprint in the industry with gross written premium of `25 crore from 46,000 lives covered in 2010-11.
Diversified product portfolio – IMEP, SME, Micro Insurance and Retail (rural and urban) products.
Set benchmark in the industry with highest agent and telesales channel productivity.
Corporate Social Responsibility
Max India Foundation, the CSR arm of Max India, was awarded with prestigious Golden Peacock Global Award for CSR 2010.
IN T
HE
BUSI
NES
S O
F LI
FEM
ax In
dia
Lim
ited.
Ann
ual R
epor
t 20
10-1
1.
26
Max New York Life Insurance Company Ltd.
IN T
HE
BUSI
NES
S O
F LI
FEM
ax In
dia
Lim
ited.
Ann
ual R
epor
t 20
10-1
1.
27
IN T
HE
BUSI
NES
S O
F LI
FEM
ax In
dia
Lim
ited.
Ann
ual R
epor
t 20
10-1
1.
28
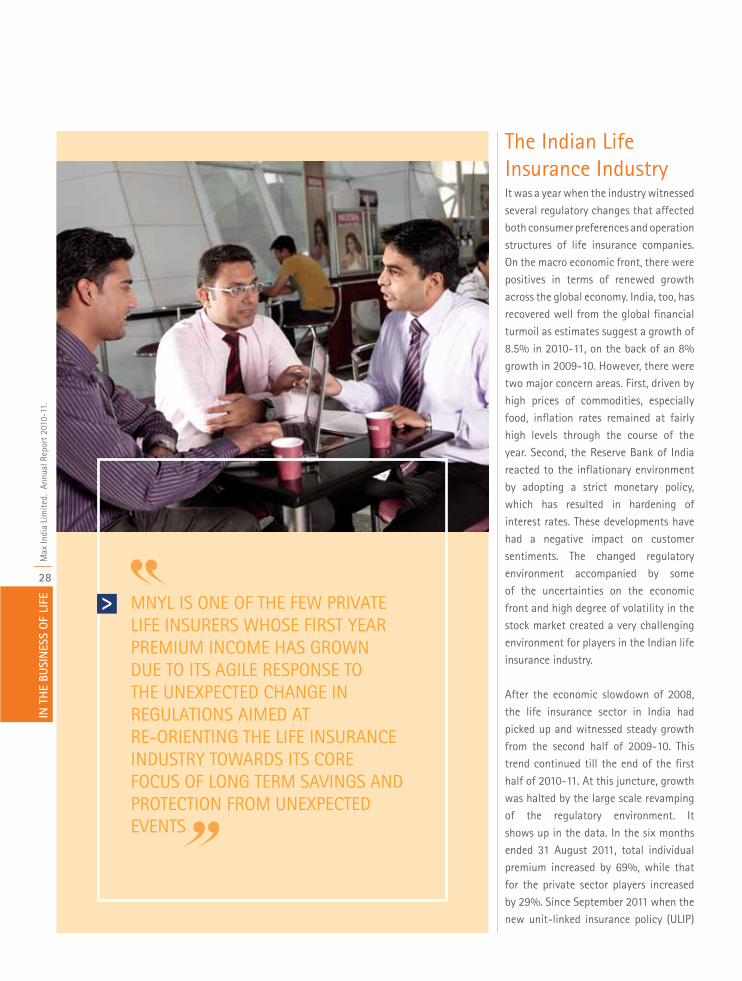
The Indian Life Insurance IndustryIt was a year when the industry witnessed several regulatory changes that affected both consumer preferences and operation structures of life insurance companies. On the macro economic front, there were positives in terms of renewed growth across the global economy. India, too, has recovered well from the global financial turmoil as estimates suggest a growth of 8.5% in 2010-11, on the back of an 8% growth in 2009-10. However, there were two major concern areas. First, driven by high prices of commodities, especially food, inflation rates remained at fairly high levels through the course of the year. Second, the Reserve Bank of India reacted to the inflationary environment by adopting a strict monetary policy, which has resulted in hardening of interest rates. These developments have had a negative impact on customer sentiments. The changed regulatory environment accompanied by some of the uncertainties on the economic front and high degree of volatility in the stock market created a very challenging environment for players in the Indian life insurance industry.
After the economic slowdown of 2008, the life insurance sector in India had picked up and witnessed steady growth from the second half of 2009-10. This trend continued till the end of the first half of 2010-11. At this juncture, growth was halted by the large scale revamping of the regulatory environment. It shows up in the data. In the six months ended 31 August 2011, total individual premium increased by 69%, while that for the private sector players increased by 29%. Since September 2011 when the new unit-linked insurance policy (ULIP)
MNYL IS ONE OF THE FEW PRIVATE LIFE INSURERS WHOSE FIRST YEAR PREMIUM INCOME HAS GROWN DUE TO ITS AGILE RESPONSE TO THE UNEXPECTED CHANGE IN REGULATIONS AIMED AT RE-ORIENTING THE LIFE INSURANCE INDUSTRY TOWARDS ITS CORE FOCUS OF LONG TERM SAVINGS AND PROTECTION FROM UNEXPECTED EVENTS
IN T
HE
BUSI
NES
S O
F LI
FEM
ax In
dia
Lim
ited.
Ann
ual R
epor
t 20
10-1
1.
29
guidelines came into force, there has been de-growth in the industry. Thus, for 2010-11 as a whole, total individual premium growth reduced to 1%, with the private sector witnessing a 4% reduction.
The regulatory changes were aimed to re-orient the life insurance industry towards its core focus of long term savings and protection from unexpected events. The changes had a major impact on most of the ULIP schemes that were driving growth, and most life insurance companies in India were unprepared to deal with the new regulations.
In the first decade of private participation in the Indian life insurance industry, growth was driven primarily by two factors: (i) expansion of the distribution network; and (ii) a wide range of products, especially ULIPs. In
fact, ULIPs quickly became very popular in a milieu where buoyant stock markets continuously raised expectations of higher than average returns.
The regulatory changes in 2010-11 have taken the industry to its next phase of development — where players have to provide greater customer benefit, curb mis-selling, and offer longer term orientation and benefits to policy holders. Naturally, these changes have brought about the need to relook and recalibrate business models.
An immediate outcome has been the change in focus in distribution from aggressive expansion to consolidation and improvement in network efficiencies. The biggest difference, however, has been the change in consumer perception and awareness of investment risks associated with insurance products.
The result has been a consequential growth in demand for traditional endowment plans. In addition, ULIP regulations have made it almost mandatory for life insurers to sharply focus on cost efficiency and persistency to ensure profitability. In this business environment, with a sudden break in high first year premium growth, as it should be, there is now a growing appreciation of the value of servicing existing customers and generating renewal premiums. Thus, life insurance companies are re-orienting their focus towards selling life insurance for its core value of long-term savings and protection, instead of only selling mutual funds with a bit of protection thrown in.
At present, most Indian life insurance companies are coming to terms with the regulatory and environmental changes.
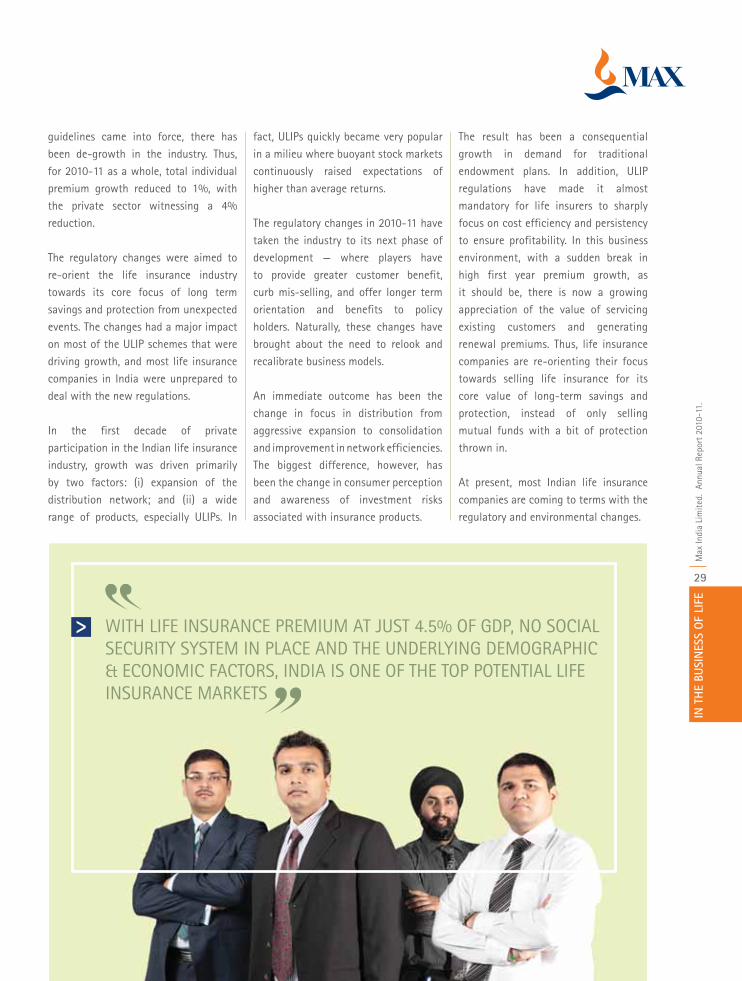
WITH LIFE INSURANCE PREMIUM AT JUST 4.5% OF GDP, NO SOCIAL SECURITY SYSTEM IN PLACE AND THE UNDERLYING DEMOGRAPHIC & ECONOMIC FACTORS, INDIA IS ONE OF THE TOP POTENTIAL LIFE INSURANCE MARKETS
IN T
HE
BUSI
NES
S O
F LI
FEM
ax In
dia
Lim
ited.
Ann
ual R
epor
t 20
10-1
1.
30
However, there is no doubt that in the long run the sector has major growth opportunities. Life insurance premium in India is still just 4.5% of the GDP; and this low figure assumes greater significance given that the country does not have a social security system in place. Moreover, the underlying demographic and economic factors that make India one of the top potential life insurance markets continue to display favourable trends. There continues to be a secular growth in the middle class; so too the growth in income levels across socio-economic classifications. The pool of household savings keeps growing. And India is expected to enjoy demographic dividend for more than a decade. A more affluent and larger working age population will have a greater need for long-term financial planning to manage savings to meet their growing life stage needs.
The Regulatory Environment and MNYLAs stated the Insurance Regulatory and Development Authority (IRDA) proposed several regulatory changes during the year. Many of these were also effectively implemented. MNYL had to evaluate the implications of these changes and take strategic decisions.
The most significant of these was the ULIP Regulation, which came into force from 1 September 2010. Designed with the intent to position ULIPs as a long-term savings and protection product, the regulations will result in greater focus on good product persistency as well as reduction in costs of these products. Overall, it will foster a more balanced product mix in the industry. MNYL has
responded proactively to this regulation and is one of the few private life insurers whose first year premium income has grown in the second half of 2010-11.
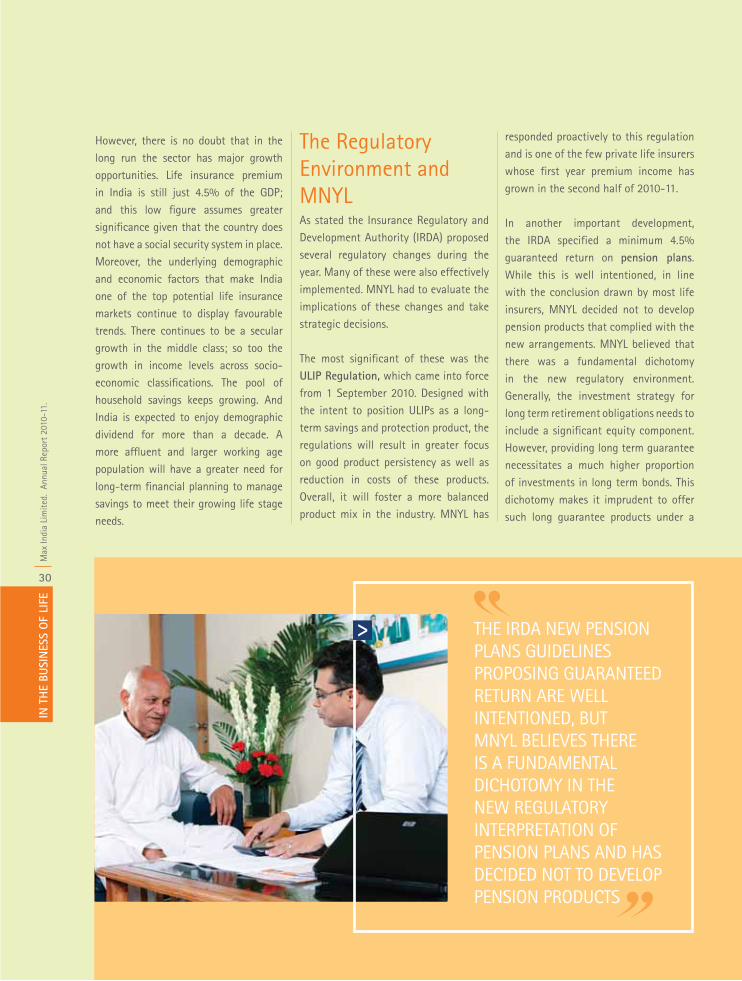
In another important development, the IRDA specified a minimum 4.5% guaranteed return on pension plans. While this is well intentioned, in line with the conclusion drawn by most life insurers, MNYL decided not to develop pension products that complied with the new arrangements. MNYL believed that there was a fundamental dichotomy in the new regulatory environment. Generally, the investment strategy for long term retirement obligations needs to include a significant equity component. However, providing long term guarantee necessitates a much higher proportion of investments in long term bonds. This dichotomy makes it imprudent to offer such long guarantee products under a
THE IRDA NEW PENSION PLANS GUIDELINES PROPOSING GUARANTEED RETURN ARE WELL INTENTIONED, BUT MNYL BELIEVES THERE IS A FUNDAMENTAL DICHOTOMY IN THE NEW REGULATORY INTERPRETATION OF PENSION PLANS AND HAS DECIDED NOT TO DEVELOP PENSION PRODUCTS
IN T
HE
BUSI
NES
S O
F LI
FEM
ax In
dia
Lim
ited.
Ann
ual R
epor
t 20
10-1
1.
31
unit linked contract. The Company will
re-evaluate this product profile if and
when the IRDA revises its guidelines.
The IRDA has also withdrawn the
existing Universal Life Product approvals
and issued guidelines for a new product
form known as Variable Insurance Plans (VIP). Given the constraints on product
design and expenses under these new
guidelines, MNYL has initially decided
not to launch new products of this type.
On the operations front, IRDA issued
Outsourcing Guidelines that provide
direction on the activities a life insurer
is allowed to outsource. These divide
insurance activities into core and non-
core, with the basic rule that core
activities cannot be outsourced. These
guidelines will result in improved
accountability, transparency, risk
assessment and risk management. This
development has little impact on MNYL’s
operations as the Company had never
outsourced its core activities.
New Referral Guidelines were issued
that prevents banks from becoming
referral partners. These guidelines had
only marginal impact on MNYL, as it was
able to convert most of the important
and large relationships into corporate
agents.
Max New York Life Insurance – Performance Highlights 2010-11In this environment, MNYL continued to
deliver good results. The highlights are:
Total revenue (first year premium +
renewal premium) increased by 20%
to `5,813 crore; renewal premium recorded a growth of 25% to `3,751 crore; first year premium recorded a growth of 11% to `2,062 crore.
Individual adjusted first year premium (adjusted for single pay), which MNYL believes is the true barometer of new business performance of a life insurance company, was `1,724 crore, recording a growth of 9%.
MNYL’s market share among the private players, based on adjusted first year premium, went up by around 200 bps to 7.5%.
Sum assured recorded a growth of 26% to `1,54,687 crore.
At 81%, MNYL’s conservation ratio remained one of the best in the industry.
Cost ratio improved from 42% to 38% due to the impact of cost management initiatives taken during the year.
Profit after tax went up more than 12 times to `283 crore.
Assets under management recorded a growth of 37% to `13,836 crore.
MNYL maintained more than double the stipulated solvency margin at 365%.
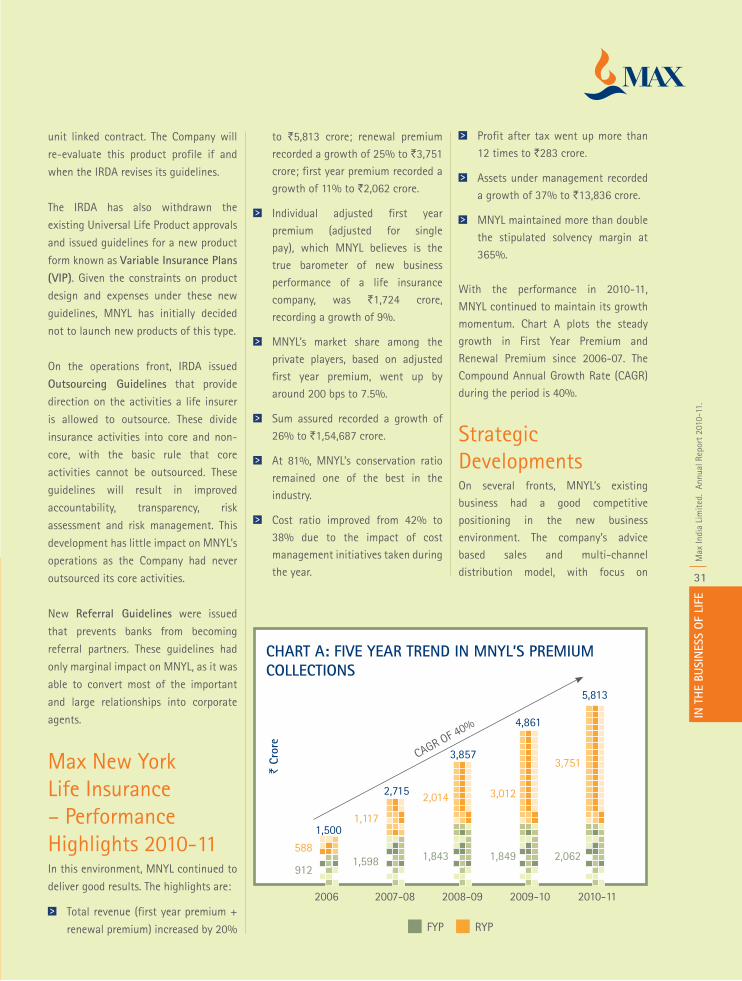
With the performance in 2010-11, MNYL continued to maintain its growth momentum. Chart A plots the steady growth in First Year Premium and Renewal Premium since 2006-07. The Compound Annual Growth Rate (CAGR) during the period is 40%.
Strategic DevelopmentsOn several fronts, MNYL’s existing business had a good competitive positioning in the new business environment. The company’s advice based sales and multi-channel distribution model, with focus on
CHART A: FIVE YEAR TREND IN MNYL’S PREMIUM COLLECTIONS
2006 2007-08 2008-09 2009-10 2010-11
FYP RYP
588
912
1,117
2,014 3,012
3,751
1,598 1,843 1,849 2,062
1,500
2,715
3,857CAGR OF 40% 4,861
5,813
` Cr
ore
IN T
HE
BUSI
NES
S O
F LI
FEM
ax In
dia
Lim
ited.
Ann
ual R
epor
t 20
10-1
1.
32
quality of agency and commitment to
training is well suited to take on the
new challenges. This is supported by
a strong brand proposition, focus on
customer centricity, an ethical culture
of meritocracy, and the financial
strength of its parent organizations.
With the fundamental business blocks
in place, MNYL had to transform its
strategic imperatives. The focus of
the new roadmap is to leverage its
differentiators and create a more
responsive and productive organization,
with the commitment to build India’s
most admired Life Insurance Company.
The new strategy is built through an in-
depth understanding of inter-linkages
between four core areas:
i) Market attractiveness
ii) Industry and regulatory
environment
iii) Internal capabilities and strengths
iv) Consumer preferences
In line with the regulatory environment,
MNYL will focus on insurance products
that serve the long-term savings and
protection needs of its customers.
Considerable effort has been put in
to understanding and segregating
the different customer segments. The
emphasis is to focus on promoting
life insurance with a strong element
of advice based sales. This will be
supported through a high quality agency
distribution network supplemented by
bancassurance and other third party
partnerships.
Given these imperatives, MNYL has
identified six priority areas where it
will focus on over the next few years
to ensure sustainable and profitable
growth. These are:
Building agency distribution with
high standards in productivity and
quality of advice.
Building a multi-channel distribution
architecture.
Designing products based on
customer insights.
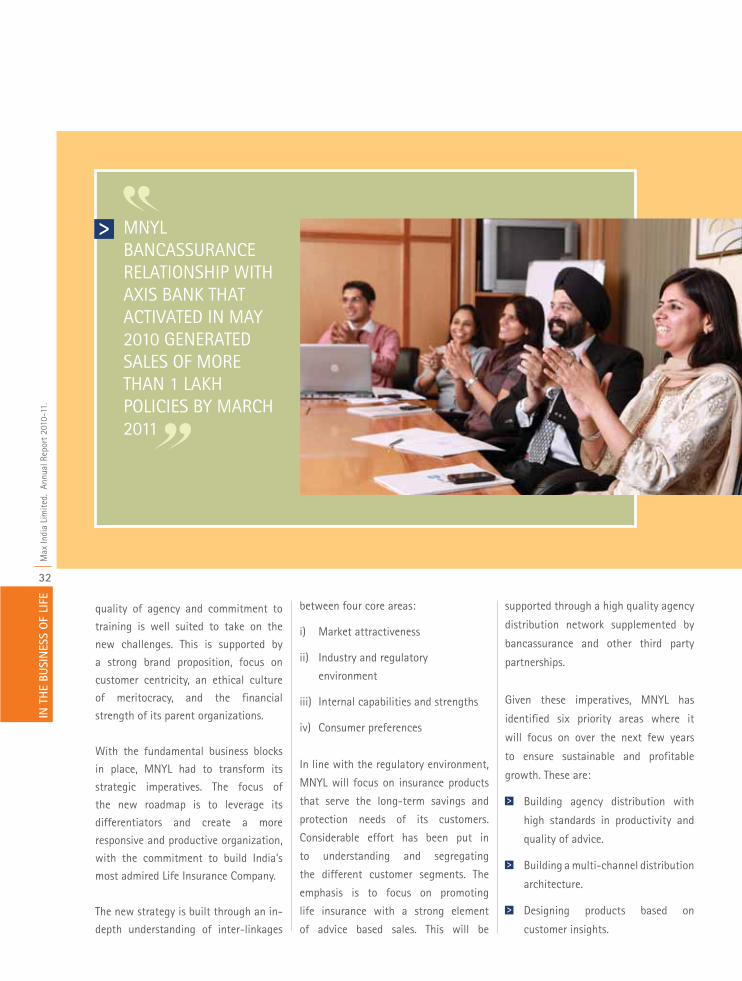
MNYL BANCASSURANCE RELATIONSHIP WITH AXIS BANK THAT ACTIVATED IN MAY 2010 GENERATED SALES OF MORE THAN 1 LAKH POLICIES BY MARCH 2011
IN T
HE
BUSI
NES
S O
F LI
FEM
ax In
dia
Lim
ited.
Ann
ual R
epor
t 20
10-1
1.
33
Improving persistency.
Reducing costs.
Shaping Regulatory Agenda.
These priorities will be supported by enhanced business intelligence and governance. The entire transformation exercise will require sharp execution and a comprehensive change management plan that includes mindset shifts, leadership cohesion and an enhanced engagement with all stakeholders. A transformation office has also been created, which would ensure the continuity of these initiatives through a rigorous review mechanism and consequence management process.
DistributionMNYL has always believed that a multi-channel distribution model is best suited
to enhance customer reach. During 2010-11, the company took an important step towards evolving a more comprehensive multi-channel distribution network with the corporate agency agreement with Axis Bank – the third largest private sector bank in the country. This channel became active in May 2010 and provided MNYL with a strong national bancassurance relationship. With around 1,400 branches across more than 600 locations, it was expected that the relationship with Axis Bank will provide MNYL access to a relatively large number of new customers. The expectations have come true. By March 2011, the company had sold more than 1 lakh policies through this new relationship.
As stated earlier, MNYL believes that advice-based sales are best suited for life insurance. Consequently, agency distribution has been at the core of
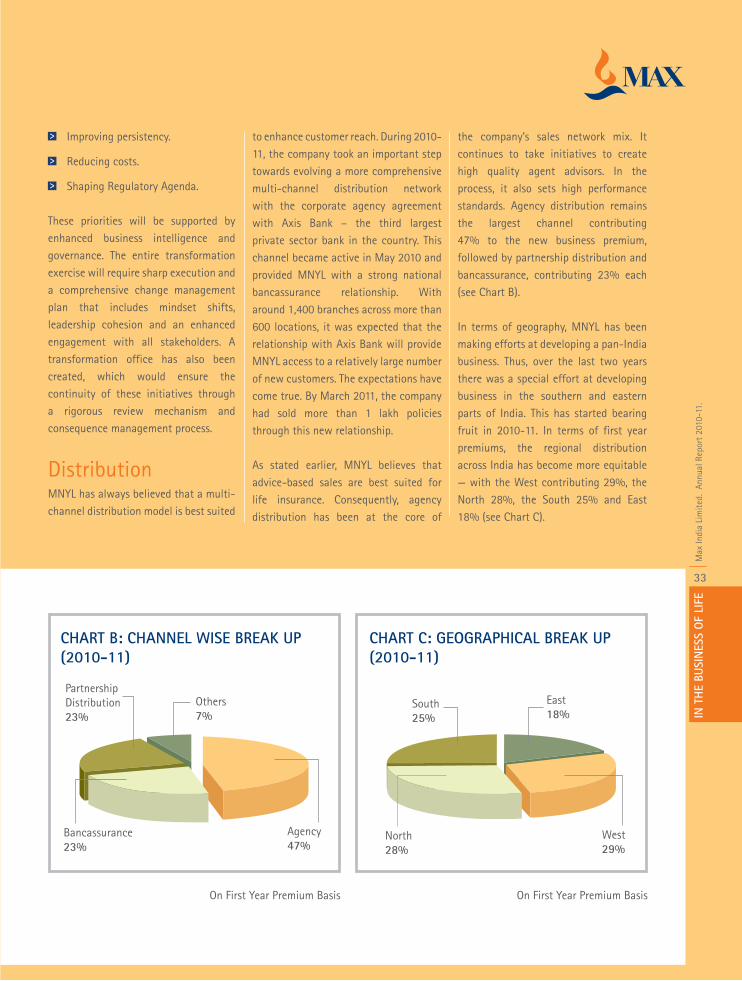
the company’s sales network mix. It continues to take initiatives to create high quality agent advisors. In the process, it also sets high performance standards. Agency distribution remains the largest channel contributing 47% to the new business premium, followed by partnership distribution and bancassurance, contributing 23% each (see Chart B).
In terms of geography, MNYL has been making efforts at developing a pan-India business. Thus, over the last two years there was a special effort at developing business in the southern and eastern parts of India. This has started bearing fruit in 2010-11. In terms of first year premiums, the regional distribution across India has become more equitable — with the West contributing 29%, the North 28%, the South 25% and East 18% (see Chart C).
CHART B: CHANNEL WISE BREAK UP (2010-11)
CHART C: GEOGRAPHICAL BREAK UP (2010-11)
On First Year Premium BasisOn First Year Premium Basis
Others 7%
East18%
South25%
North28%
West29%
Agency47%
Bancassurance23%
Partnership Distribution23%
IN T
HE
BUSI
NES
S O
F LI
FEM
ax In
dia
Lim
ited.
Ann
ual R
epor
t 20
10-1
1.
34
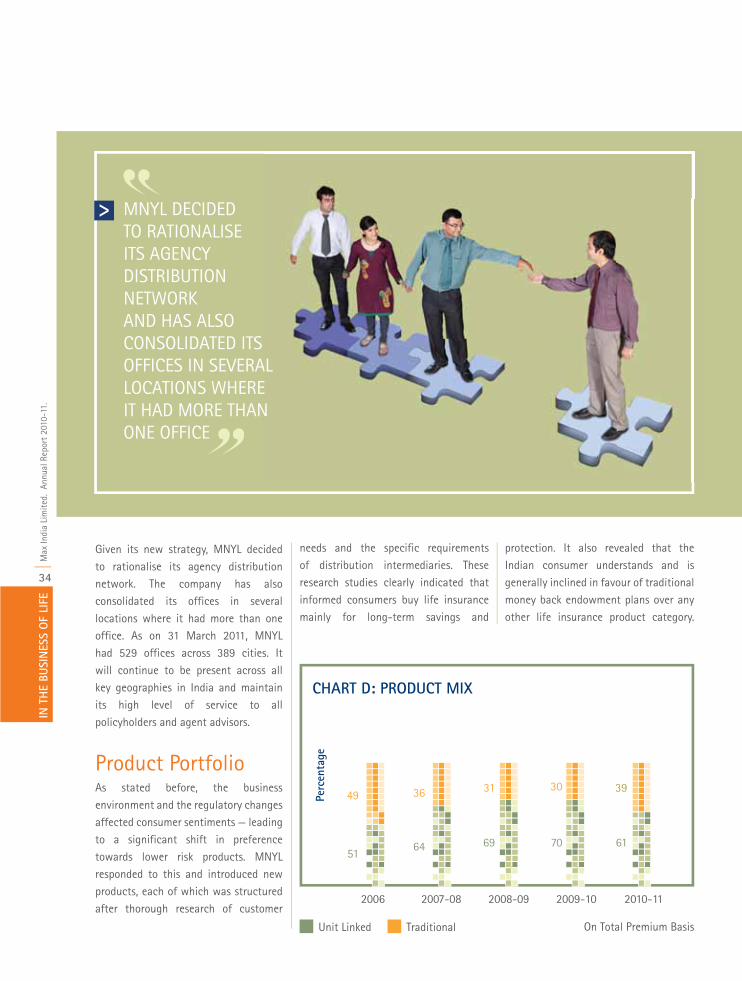
protection. It also revealed that the Indian consumer understands and is generally inclined in favour of traditional money back endowment plans over any other life insurance product category.
Given its new strategy, MNYL decided to rationalise its agency distribution network. The company has also consolidated its offices in several locations where it had more than one office. As on 31 March 2011, MNYL had 529 offices across 389 cities. It will continue to be present across all key geographies in India and maintain its high level of service to all policyholders and agent advisors.
Product PortfolioAs stated before, the business environment and the regulatory changes affected consumer sentiments — leading to a significant shift in preference towards lower risk products. MNYL responded to this and introduced new products, each of which was structured after thorough research of customer
needs and the specific requirements of distribution intermediaries. These research studies clearly indicated that informed consumers buy life insurance mainly for long-term savings and
MNYL DECIDED TO RATIONALISE ITS AGENCY DISTRIBUTION NETWORK AND HAS ALSO CONSOLIDATED ITS OFFICES IN SEVERAL LOCATIONS WHERE IT HAD MORE THAN ONE OFFICE
AL E N
On Total Premium BasisUnit Linked Traditional
CHART D: PRODUCT MIX
49
51
2006 2007-08 2008-09 2009-10 2010-11
36 31 30 39
64 69 70 61
Perc
enta
ge
IN T
HE
BUSI
NES
S O
F LI
FEM
ax In
dia
Lim
ited.
Ann
ual R
epor
t 20
10-1
1.
35
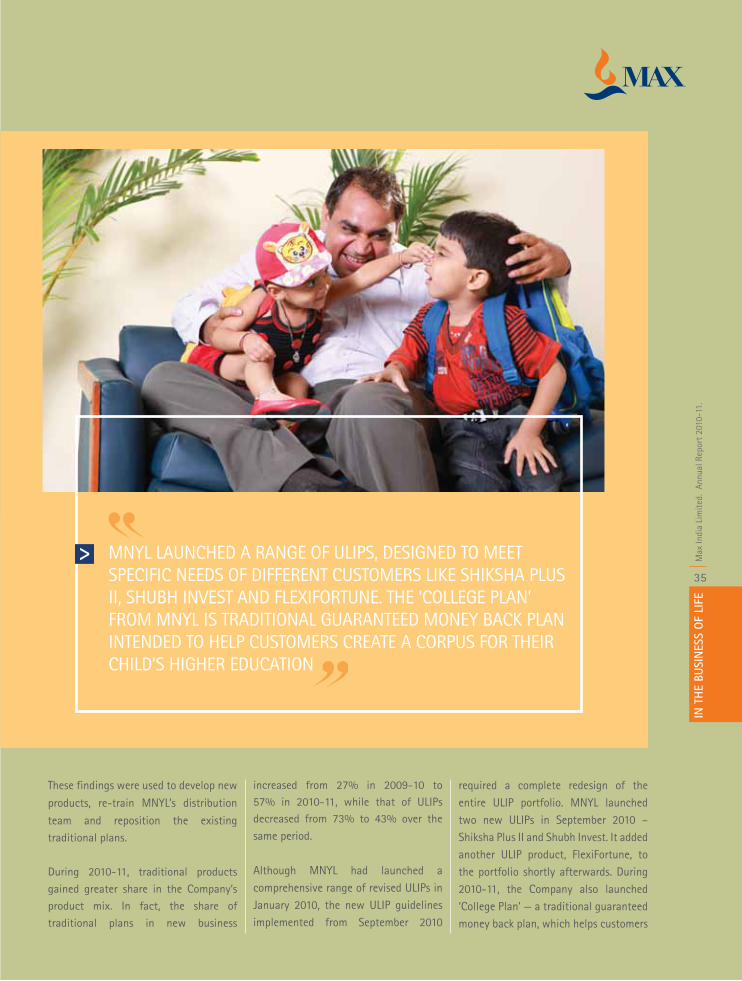
MNYL LAUNCHED A RANGE OF ULIPS, DESIGNED TO MEET SPECIFIC NEEDS OF DIFFERENT CUSTOMERS LIKE SHIKSHA PLUS II, SHUBH INVEST AND FLEXIFORTUNE. THE ‘COLLEGE PLAN’ FROM MNYL IS TRADITIONAL GUARANTEED MONEY BACK PLAN INTENDED TO HELP CUSTOMERS CREATE A CORPUS FOR THEIR CHILD’S HIGHER EDUCATION
These findings were used to develop new
products, re-train MNYL’s distribution
team and reposition the existing traditional plans.
During 2010-11, traditional products
gained greater share in the Company’s
product mix. In fact, the share of
traditional plans in new business
increased from 27% in 2009-10 to 57% in 2010-11, while that of ULIPs decreased from 73% to 43% over the
same period.
Although MNYL had launched a comprehensive range of revised ULIPs in January 2010, the new ULIP guidelines implemented from September 2010
required a complete redesign of the entire ULIP portfolio. MNYL launched two new ULIPs in September 2010 – Shiksha Plus II and Shubh Invest. It added another ULIP product, FlexiFortune, to the portfolio shortly afterwards. During 2010-11, the Company also launched ‘College Plan’ — a traditional guaranteed money back plan, which helps customers
IN T
HE
BUSI
NES
S O
F LI
FEM
ax In
dia
Lim
ited.
Ann
ual R
epor
t 20
10-1
1.
36
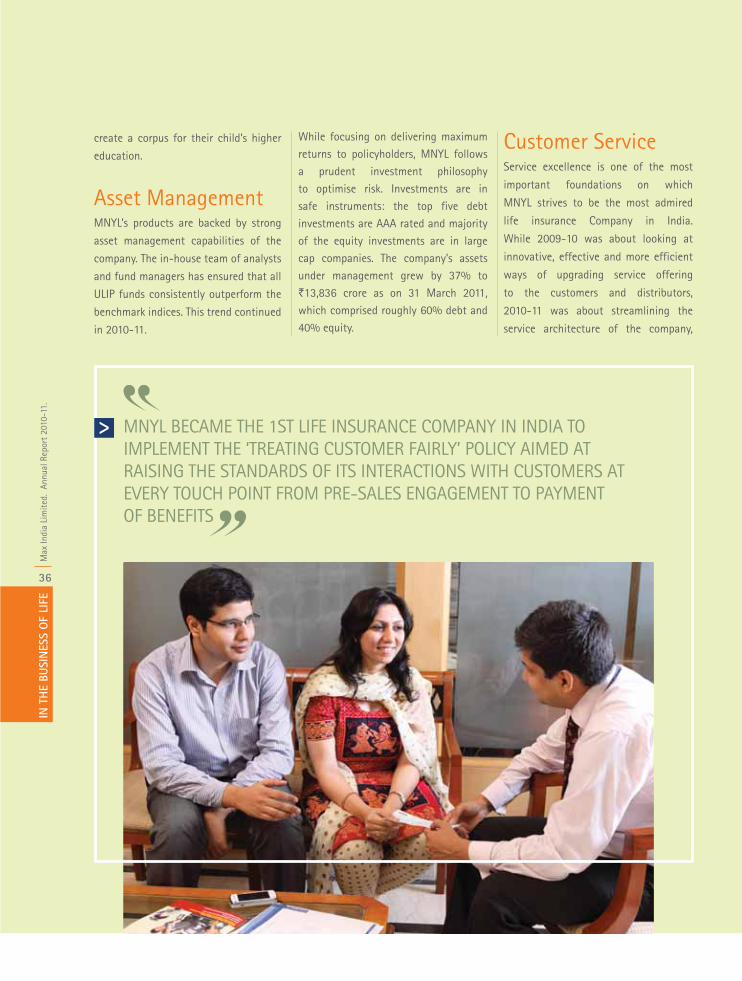
MNYL BECAME THE 1ST LIFE INSURANCE COMPANY IN INDIA TO IMPLEMENT THE ‘TREATING CUSTOMER FAIRLY’ POLICY AIMED AT RAISING THE STANDARDS OF ITS INTERACTIONS WITH CUSTOMERS AT EVERY TOUCH POINT FROM PRE-SALES ENGAGEMENT TO PAYMENT OF BENEFITS
Customer ServiceService excellence is one of the most
important foundations on which
MNYL strives to be the most admired
life insurance Company in India.
While 2009-10 was about looking at
innovative, effective and more efficient
ways of upgrading service offering
to the customers and distributors,
2010-11 was about streamlining the
service architecture of the company,
create a corpus for their child’s higher
education.
Asset ManagementMNYL’s products are backed by strong
asset management capabilities of the
company. The in-house team of analysts
and fund managers has ensured that all
ULIP funds consistently outperform the
benchmark indices. This trend continued
in 2010-11.
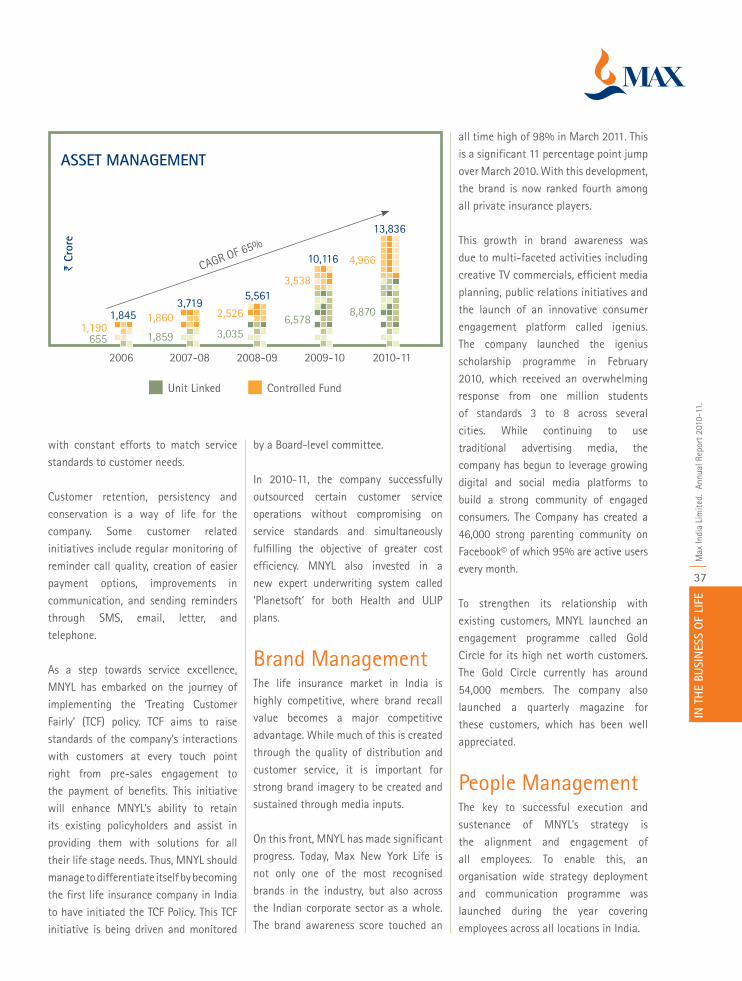
While focusing on delivering maximum returns to policyholders, MNYL follows a prudent investment philosophy to optimise risk. Investments are in safe instruments: the top five debt investments are AAA rated and majority of the equity investments are in large cap companies. The company’s assets under management grew by 37% to `13,836 crore as on 31 March 2011, which comprised roughly 60% debt and 40% equity.
IN T
HE
BUSI
NES
S O
F LI
FEM
ax In
dia
Lim
ited.
Ann
ual R
epor
t 20
10-1
1.
37
all time high of 98% in March 2011. This is a significant 11 percentage point jump over March 2010. With this development, the brand is now ranked fourth among all private insurance players.
This growth in brand awareness was due to multi-faceted activities including creative TV commercials, efficient media planning, public relations initiatives and the launch of an innovative consumer engagement platform called igenius. The company launched the igenius scholarship programme in February 2010, which received an overwhelming response from one million students of standards 3 to 8 across several cities. While continuing to use traditional advertising media, the company has begun to leverage growing digital and social media platforms to build a strong community of engaged consumers. The Company has created a 46,000 strong parenting community on Facebook© of which 95% are active users every month.
To strengthen its relationship with existing customers, MNYL launched an engagement programme called Gold Circle for its high net worth customers. The Gold Circle currently has around 54,000 members. The company also launched a quarterly magazine for these customers, which has been well appreciated.
People ManagementThe key to successful execution and sustenance of MNYL’s strategy is the alignment and engagement of all employees. To enable this, an organisation wide strategy deployment and communication programme was launched during the year covering employees across all locations in India.
with constant efforts to match service standards to customer needs.
Customer retention, persistency and conservation is a way of life for the company. Some customer related initiatives include regular monitoring of reminder call quality, creation of easier payment options, improvements in communication, and sending reminders through SMS, email, letter, and telephone.
As a step towards service excellence, MNYL has embarked on the journey of implementing the ‘Treating Customer Fairly’ (TCF) policy. TCF aims to raise standards of the company’s interactions with customers at every touch point right from pre-sales engagement to the payment of benefits. This initiative will enhance MNYL’s ability to retain its existing policyholders and assist in providing them with solutions for all their life stage needs. Thus, MNYL should manage to differentiate itself by becoming the first life insurance company in India to have initiated the TCF Policy. This TCF initiative is being driven and monitored
by a Board-level committee.
In 2010-11, the company successfully outsourced certain customer service operations without compromising on service standards and simultaneously fulfilling the objective of greater cost efficiency. MNYL also invested in a new expert underwriting system called ‘Planetsoft’ for both Health and ULIP plans.
Brand ManagementThe life insurance market in India is highly competitive, where brand recall value becomes a major competitive advantage. While much of this is created through the quality of distribution and customer service, it is important for strong brand imagery to be created and sustained through media inputs.
On this front, MNYL has made significant progress. Today, Max New York Life is not only one of the most recognised brands in the industry, but also across the Indian corporate sector as a whole. The brand awareness score touched an
ASSET MANAGEMENT
1,190655
2006 2007-08 2008-09 2009-10 2010-11
1,860 2,526
3,538
4,966
1,859 3,0356,578
8,8701,845
CAGR OF 65%
Unit Linked Controlled Fund
` Cr
ore
3,7195,561
10,116
13,836
IN T
HE
BUSI
NES
S O
F LI
FEM
ax In
dia
Lim
ited.
Ann
ual R
epor
t 20
10-1
1.
38
Besides helping employees understand the new strategic imperatives, the programme reinforced the need to remain customer centric, cost efficient and productive. Initiatives such as CEO Webcasts and functional meets have also helped in re-aligning employees to the new requirements of the industry.
MNYL realizes that it is its people and their talent that will be the differentiator and provide the critical competitive edge. Thus, it continues to invest in its human capital. Flagship leadership development initiatives, deep focus on quality recruitment and employee retention form part of this tale of maintaining competitive edge.
Quality and Business ExcellenceMNYL strongly believes in quality initiatives. Over the last three years, the company has been pursuing its Business Excellence journey. It is the first and only Indian life insurance company to have been awarded the CII-EXIM Bank Commendation Certificate for ‘Strong Commitment to Excel’ for three consecutive years from 2008 to 2010.
The company has institutionalised process excellence across its operations and sales offices - which are certified through an independent external agency, the Bureau Veritas Certification. It was the first life insurance company in India to be certified as ISO 9001:2000 and among the first three to achieve ISO 9001:2008 certification.
MNYL also secured prestigious awards for its continuous improvement programme
MNYL’S BRAND DEVELOPMENT EFFORTS FOCUSED ON ENHANCING CUSTOMER ENGAGEMENT WITH INITIATIVES LIKE THE IGENIUS SCHOLARSHIP PROGRAMME WHERE AN OVERWHELMING ONE MILLION STUDENTS PARTICIPATED AND ALSO THROUGH MNYL’S SOCIAL MEDIA ACTIVITIES THAT HAVE 46,000 STRONG PARENTING COMMUNITY ON FACEBOOK© OF WHICH 95% ARE ACTIVE USERS EVERY MONTH
IN T
HE
BUSI
NES
S O
F LI
FEM
ax In
dia
Lim
ited.
Ann
ual R
epor
t 20
10-1
1.
39
including QCI DL Shaw recommendation
certificate for a project on ‘Reducing
Business Leakage for Emerging Markets’
and the CII National Six Sigma Runners-
Up prize for project on improving 37th
month ULIP persistency in agency
channel.
Internal Audit and Risk Management FrameworkMNYL has institutionalised systems of
internal control which are commensurate
with its size, and the nature of its
operations. These have been designed
to provide assurance for recording
and providing reliable financial and
operational information, complying with
applicable statutes, safeguarding assets
from unauthorised use or losses, executing
transactions with proper authorisation
and ensuring compliance with corporate
policies.
The company has a well-defined
delegation of authority matrix with
defined authority limits for approving
various expenditure and new risks being
exposed to. Processes for formulating
and reviewing annual and long-term
business plans are well defined. It has
an internal audit department. To ensure
independence, internal audit department
has a reporting line to the Chairperson
of the Board Audit Committee. There is
a well-defined risk based internal audit
plan, which is reviewed each year in
consultation with the statutory auditors
and the Audit Committee. Internal audit
processes are designed to review the
adequacy of internal controls and cover
all significant areas of the company’s
operations. The Audit Committee reviews
all audit reports; follows up on the
implementation of recommendations;
meets the company’s statutory auditors
to ascertain their views on the adequacy
of internal controls; and ensures that
the Board of Directors is fully informed
of major observations.
MNYL also has an independent Agency
Standards team that carries out quality
checks to ensure that prescribed sales
processes are followed and that the
customer’s decision has been made after
proper understanding of product features
and how these meet the customer’s
needs.
The company continues to develop its
Enterprise Risk Management system.
The enterprise is scanned across a
number of risk categories falling under
financial, operational risk and business
risks. These are assessed by considering
their probable likelihood and potential
impact - and the outcomes are rated
from ‘Very High’ to ‘Very Low’. The ratings
determine the intensity of management
response. Risk management activities
are supervised by a Management Risk
Committee chaired by the CEO and
the Board’s Product, Actuarial and Risk
Committee whose mandate includes
that of the Risk Management Committee
as prescribed by the IRDA.
Outlook2011-12 will continue to be a year of
transition and adaptation to the new
environment for the Indian life insurance
industry. With a need to provide long-
term savings and protection, life
insurers in India will have to focus on
providing consumers with a much more
balanced product portfolio. The quality,
commitment and ethics of the agent
advisor will be tested as product changes;
and disclosure requirements will ensure a
higher seller and customer engagement
at the time of the sale. Some select
customer segments may also use the
internet for simple products such as term
plans and traditional endowment plans.
Distribution trends may also undergo
changes. With regulatory changes, the
focus will increase on multi-channel
distribution. Growth in life insurance is
expected from increased distributors’
productivity rather than expansion of
distribution footprint. Two focus areas
for driving profitability in the business
will be reducing expenses and improving
persistency.
In this milieu, MNYL will focus on
efficient implementation of its strategy.
The company will offer a comprehensive
suite of traditional and ULIP products
with a minimum tenure of 10 years and
a protection multiple of 20 times and
more.
Going forward, MNYL has identified five
key areas of improvement:
Long-term savings and protection
focus.
Quality agency model.
Robust multi-channel distribution
architecture.
Higher persistency through superior
customer engagement.
Cost management through optimum
utilization of resources.
IN T
HE
BUSI
NES
S O
F LI
FEM
ax In
dia
Lim
ited.
Ann
ual R
epor
t 20
10-1
1.
40
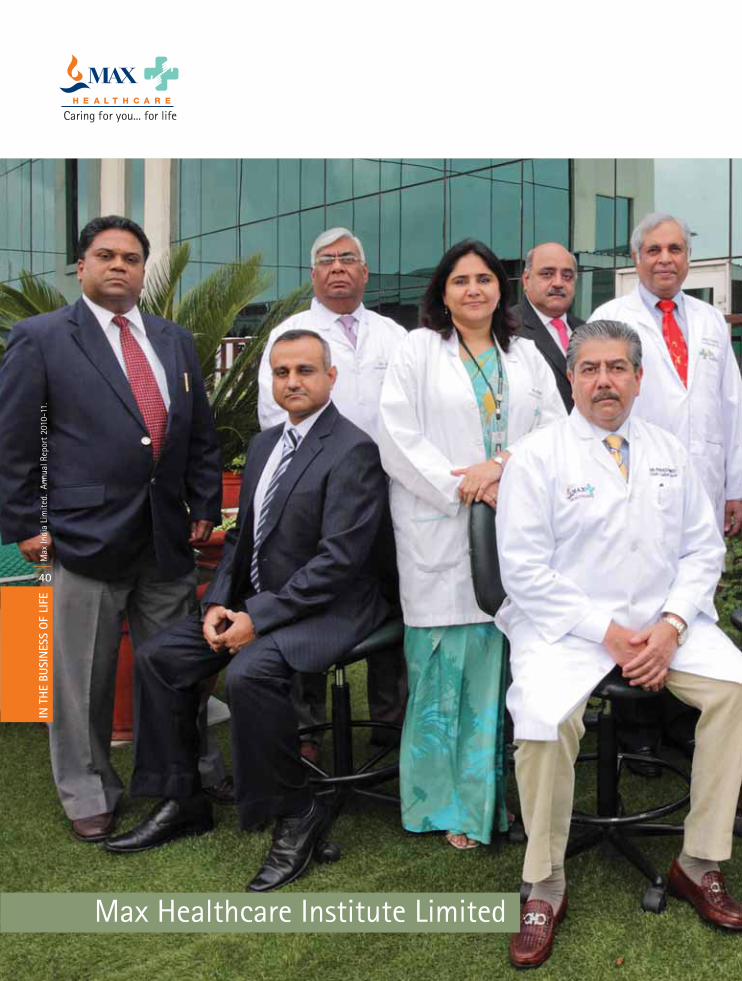
Max Healthcare Institute Limited

IN T
HE
BUSI
NES
S O
F LI
FEM
ax In
dia
Lim
ited.
Ann
ual R
epor
t 20
10-1
1.
41
IN T
HE
BUSI
NES
S O
F LI
FEM
ax In
dia
Lim
ited.
Ann
ual R
epor
t 20
10-1
1.
42
Indian Healthcare IndustryThe Indian healthcare industry is expected to touch US$ 280 billion by 2020, according to Industry reports. Healthcare has emerged as one of the fastest growing & largest service sectors in India with an expected GDP spend of 8 per cent by 2012 from 5.5 per cent in 2009. Healthcare sector is pegged next to only the IT sector now. As per a study by an industry body and Ernst & Young, India would require
another 1.75 million beds by 2025.
The public sector however is likely to
contribute only around 15-20 per cent of
the required US$ 86 billion investment.
Every year, around 115 crore new
cases of various ailments are reported,
with nearly 3 crore cases requiring
hospitalization. This disease burden is
estimated to reduce the expectancy of
healthy life at birth by 10 years. It is
estimated that the reported number of
ailments will rise by 30% to touch 150
crore cases by 2015. This increase will
be driven by rising population growth,
an increase in reported ailments due
to better affordability, easier access to
healthcare facilities owing to increasing
urbanization, and a shift in the disease
mix towards Non Communicable
Diseases (NCDs).
The 1st WHO report on NCDs released
in April 2011 puts NCDs on top of the
list of killer diseases and is projected
to claim 52 million lives by 2030. The
region projected to have highest number
of deaths in 2020 (10.4 million) is South-
East Asia. This alarming projection makes
it imperative to focus on promoting
healthy lifestyles and standards of
ECONOMIC DEVELOPMENT AND DEMOGRAPHIC DYNAMICS ARE EXPECTED TO MAKE INDIAN HEALTHCARE A US$ 280 BILLION INDUSTRY BY 2020 THAT TRANSLATES INTO A REQUIREMENT OF AN ADDITIONAL 1.75 MILLION BEDS, ENTAILING AN INVESTMENT OF US$86 BILLION BY 2025, WITH PRIVATE SECTOR EXPECTED TO PROVIDE FOR THE OVER 80% OF INVESTMENTS REQUIRED
IN T
HE
BUSI
NES
S O
F LI
FEM
ax In
dia
Lim
ited.
Ann
ual R
epor
t 20
10-1
1.
43
wellness. This is an opportunity for the
private sector to develop the wellness
business and industry bodies to work
toward nurturing this effort.
Planning of the Indian healthcare system
has been top down, making it largely
unresponsive to healthcare needs at
the local level. This has resulted in an
inadequate health infrastructure, which
is inequitably distributed. The growth
of the healthcare infrastructure in the
last decade has not kept pace with the
increase in the population and the rise
in reported ailments. During this period,
the population increased by 15% and the
number of individuals reporting ailments
per thousand population has grown by
66%. While the total number of beds has
gone up by 5.1%, bed density (number
of beds per thousand population) has
declined by 7%. This may be due to
lack of capacity building in semi urban
and rural areas. Access to healthcare
is hindered by inequitable distribution
— across states and between rural and
urban India.
Around 70% of India’s healthcare
expenditure is financed out-of-
pocket with only 12% of the Indian
population being covered by health-
related insurance schemes. This limits
the capacity of Indians to spend on
healthcare, particularly in the lower and
middle income groups, which comprise
around 95% of the population. Since
expenditure is mainly out of individuals’
pockets, the incremental spend on
healthcare is largely determined by
incremental changes in income levels.
Health insurance penetration in India
is low on the whole. Major health-
related insurance schemes (ESIS, CGHS,
group insurance, government schemes
healthcare delivery through public private partnership models. Today, 90% of private healthcare is in the unorganised sector in India. This trend is expected to change with organised players growing in size.
Key trends that are providing an impetus to Max Healthcare’s growth are as follows :
Rising health insurance penetration, which is making health services relatively more affordable.
for the poor, community insurance and voluntary insurance) together cover only 12% of the Indian population. Although private health insurance has grown at the rate of 40% per annum, low awareness, high premiums, and an inadequate and inefficient backend infrastructure has kept health insurance out of the reach of a large part of the population. This potential market needs to be tapped innovatively.
There will be further opportunities in
MHC CONTINUED TO PROGRESS ALONG ITS LONG TERM GROWTH ROADMAP. MHC HAS STRESSED ON RETAINING AND GROWING PATIENT TRAFFIC BY PROVIDING COMPREHENSIVE AND SEAMLESS ‘START TO FINISH’ HEALTHCARE SERVICES
Box 3MHC’s Financial Highlights (2010-11)
Revenue across network of hospitals increased by 29% to `685 crore.
Average revenue per occupied bed day increased by 6% to `21,558.
EBIDTA margin rose from 4.4% in 2009-10 to 7.6% in 2010-11.
EBIDTA more than doubled to `52 crore in 2010-11.

IN T
HE
BUSI
NES
S O
F LI
FEM
ax In
dia
Lim
ited.
Ann
ual R
epor
t 20
10-1
1.
44
fluctuations in profitability are expected in this industry.
Operations The highlights of MHC’s operations are given in Box 4.
MHC occupies a position of pride amongst the leading players in the Indian healthcare sector, with a mission to make international class medical services, accessible and affordable to customers across the country, with a special focus in the Northern region of the country. MHC is close on the heels of the leader in medical value travel with its annual international patients traffic crossing the 20,000 mark.
There are two key factors that enable MHC to continuously grow its customer base. First, there is emphasis on providing comprehensive and seamless ‘start to finish’ healthcare services that include consultations and diagnostics, testing, treatment and post-surgical care. There is considerable emphasis on investing in state-of-the-art healthcare infrastructure and equipment. Some of the cutting edge equipment used at MHC include BrainSUITETM (Asia’s first and India’s most advanced neurosurgical operating theatre), Novalis Tx with RapidArc technology, LINACs, DSA Lab, DynaCT Cath Lab, 3T MRI, PET-CT & 64-Slice CT Angio.
Secondly, there is a determined quality conscious and patient centric approach. In line with this, MHC has consistently improved its operational and clinical efficiency, got accreditations from NABH and NABL and extended services to cover the entire care spectrum ranging from primary, secondary, tertiary to super-tertiary & quaternary care.
Cost differential in India coupled with the care quotient as compared to developed economies offers significant scope for medical value travel related boom.
Healthcare expenditure as a percentage of the GDP has been increasing, with growth being driven by the rise in private expenditure. In fact, the percentage of private healthcare expenditure in total healthcare expenditure in India is the highest among BRIC nations. In India, the percentage of private healthcare expenditure in total healthcare expenditure is 81%, while it is 56%, 61% and 38% for Brazil, China and Russia, respectively.
The younger urban Indian population is seeing a growth in lifestyle related health issues and that requires a renewed focus.
Performance Highlights MHC continued on the growth roadmap, as it significantly expanded its infrastructure and acquired manpower, in process of expanding capabilities that would help capture the emerging opportunities. The financial highlights of MHC’s network of hospitals are given in box 3.
Average Revenue per Occupied Bed day increased by 6% to `21,588. EBIDTA margin has grown to 7.6% vs. 4.4% in 2009-10. EBIDTA rose to more than double at `52 crore in 2010-11. MHC has stressed on retaining and growing patient traffic by providing comprehensive and seamless ‘start to finish’ healthcare services that include consultations and diagnostics, testing,
treatment and post-surgical care. This is reflected in the growth in revenues. However, operating profit margins and profits reduced in 2009-10. This needs further explanation.
Much of the costs in this business such as personnel, operating overheads and administrative expenses are fixed in nature. So, whenever there is an expansion, there is an initial phase when there is a cost revenue mismatch. As the new facilities start operating in full swing, profitability picks up. In 2009-10, MHC ramped up its operations and recruited people to operate 350 additional beds. This expansion has added to fixed costs without commensurate additional revenues. In the growth phase, such
Box 4MHC’s Operational Highlights (2010-11)
Average operational beds have increased by 23% from 751 in 2009-10 to 926 in 2010-11 on account of new blocks of Patparganj and Saket getting fully operational. Average occupancy across all healthcare facilities has therefore fallen to 68% vs. 73% in 2009-10.
Average length of stay for 2010-11 is 3.56 day’s.
A motivated team of around 1,250 Doctors, 1,725 Nurses and 1,840 para-medical staff across the network of hospitals.
Registered patient base of 11,42,000 patients with over 2,50,000 average patient transactions a month.
IN T
HE
BUSI
NES
S O
F LI
FEM
ax In
dia
Lim
ited.
Ann
ual R
epor
t 20
10-1
1.
45
services. It is also equipped with a state-
of-the-art emergency response and
management system. This 300+ beds hospital houses the following Centres of Excellence:
Max Heart & Vascular Institute: This covers all areas of non-invasive
and interventional cardiology, cardio-
thoracic, vascular surgery and support
services, and includes consultations
and diagnostics, testing, surgeries
and post-surgical care.
It provides best-in-class
cardiovascular care and is committed
to pursue independent as well as
collaborative research in all aspects
The MHC model of healthcare excellence
is founded on:
Focused management and
leadership.
Best-in-class systems and protocols
that deliver quality patient care.
Continuous improvement through
training and development.
Superior infection control and
patient safety measures.
Stringent audits.
Regular monitoring of customer
feedback.
Innovative Marketing Initiatives.
Range of ServicesMHC through its network of international class Facilities provides a range of services across the healthcare spectrum.
Max Super Speciality Hospital, Saket (A unit of Devki Devi Foundation): combines cutting edge technology with internationally acclaimed professional expertise to deliver a range of comprehensive and advanced care services in the disciplines of Cardiac care, Cancer care, Minimal Access, Metabolic & Bariatric Surgeries.
The clinical services are supported with the most advanced in-house diagnostic
MHC’S MISSION IS TO PROVIDE ACCESSIBLE AND AFFORDABLE INTERNATIONAL-CLASS MEDICAL SERVICES TO CUSTOMERS WITH A SPECIAL FOCUS IN NORTHERN REGION OF THE COUNTRY. IT ALSO HAS A STRONG APPEAL WITH INTERNATIONAL PATIENTS — WITH THIS TRAFFIC CROSSING THE 20,000 MARK IN 2010-11
IN T
HE
BUSI
NES
S O
F LI
FEM
ax In
dia
Lim
ited.
Ann
ual R
epor
t 20
10-1
1.
46
with an accumulated experience of over 50,000 laparoscopic and bariatric surgeries spanning over two decades. This team has been at the forefront to develop and expand the frontiers of Minimal Access Surgery in the country and beyond.
Max Cancer Centre: A consolidated review of your case from experts
of cardiology, cardiothoracic and vascular surgery. The hospital incorporates modular operation theatres, cardiac cath labs, apex coronary care center, cath recovery centre, Nuclear Medicine, and a high dependency unit.
Max Institute of Minimal Access, Metabolic & Bariatric Surgery:
Under the leadership of Dr. Pradeep Chowbey it endeavours to provide the best healthcare, holistic recovery and rehabilitation services with emphasis on utilization of minimally invasive techniques (Key-Hole Surgery) that help in faster recovery, lesser post-operative pain and minimal post-surgical complications. The centre brings together a team of specialists
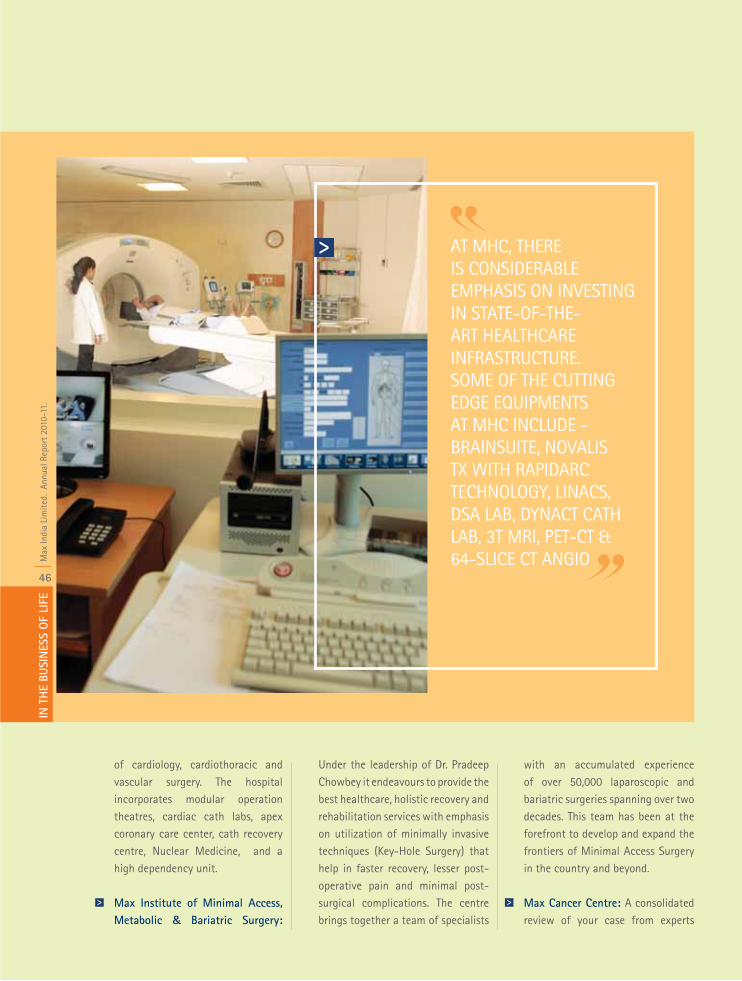
AT MHC, THERE IS CONSIDERABLE EMPHASIS ON INVESTING IN STATE-OF-THE-ART HEALTHCARE INFRASTRUCTURE. SOME OF THE CUTTING EDGE EQUIPMENTS AT MHC INCLUDE - BRAINSUITE, NOVALIS TX WITH RAPIDARC TECHNOLOGY, LINACS, DSA LAB, DYNACT CATH LAB, 3T MRI, PET-CT & 64-SLICE CT ANGIO
IN T
HE
BUSI
NES
S O
F LI
FEM
ax In
dia
Lim
ited.
Ann
ual R
epor
t 20
10-1
1.
47
ortho-trauma, spinal surgery and paediatric orthopaedics.
Max Institute of Neurosciences boasts of high-end technology including BrainSUITETM (Asia’s first and India’s most advanced neurosurgical operating theatre), Flat Panel DSA lab. It also has India’s first DSA Lab for treatment of stroke, aneurysm and spinal injuries where an interventional neurologist can see live images of the brain while performing the procedure. BrainSUITETM is the first integrated high field intra-operative MRI, which neurosurgeons can use to operate upon complicated brain tumours with utmost precision.
Max Institute of Paediatrics has
in Surgical Oncology, Radiation Oncology, Medical Oncology and the concerned speciality. This way, hidden costs and multiple inter-departmental visits are curtailed. Latest international cancer treatment protocols are followed. Superior Cancer treatment technology - Max Healthcare is the first facility in Northern India to acquire Novalis Tx for IMRT/ IGRT, Radiosurgery, SRS/SRT. The centre is also equipped with facilities for Brachytherapy. Complete Cancer Care: Right from cancer screening, early detection, multi-disciplinary treatment to rehabilitation forms the unique service offering .
Max Super Speciality Hospital, Saket: is designed to provide highest levels of
professional expertise and international class care in all major medical disciplines and support specialities. The hospital provides tertiary care services with centres of excellence in Aesthetic and Reconstructive surgery, Internal Medicine, Neurosciences, Orthopaedics and Joint Replacement, Obstetrics and Gynaecology, Paediatrics amongst other support services.
This Hospital houses the following centres of excellence :
Max Institute of Orthopaedics & Joint Replacement offers comprehensive and latest treatment for joint replacement (using computer navigation) and ortho disciplines viz., sports medicine, management of arthritis and trauma,
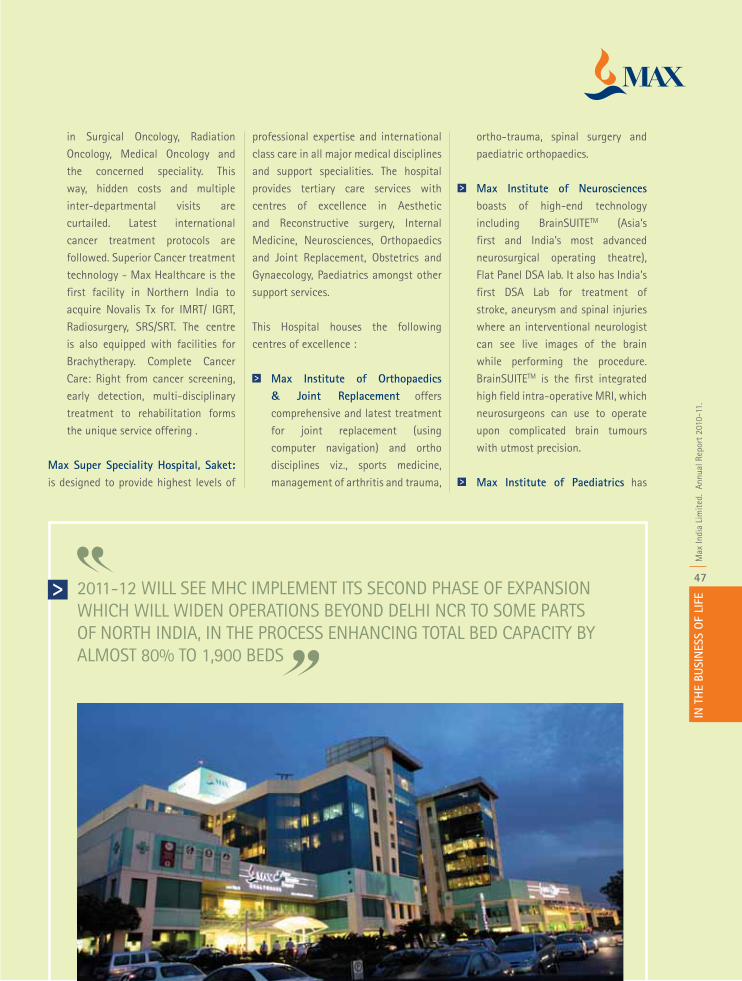
2011-12 WILL SEE MHC IMPLEMENT ITS SECOND PHASE OF EXPANSION WHICH WILL WIDEN OPERATIONS BEYOND DELHI NCR TO SOME PARTS OF NORTH INDIA, IN THE PROCESS ENHANCING TOTAL BED CAPACITY BY ALMOST 80% TO 1,900 BEDS
IN T
HE
BUSI
NES
S O
F LI
FEM
ax In
dia
Lim
ited.
Ann
ual R
epor
t 20
10-1
1.
48
advanced physiotherapy and avant-garde Dermatology & IVF services.
Max Speciality Center, Panchsheel Park: Max Super Speciality Clinic (eye care & dental care) offers clinical services to out patients. It specialises in Dentistry, Ophthalmology including Eye surgery.
Max Hospital, Noida offers speciality treatment for a wide range of ailments including chronic care programmes in diabetes, asthma, arthritis and hypertension.
Max Hospital, Gurgaon is a multi-speciality hospital with Intensive care services, Endoscopy unit, Modular OTs, LDR, Home Care programme and advanced radiology and pathology diagnostics.
With the first phase of roll-out already completed, MHC is implementing its second phase of expansion. This involves widening the operations beyond Delhi/NCR to other parts of northern India in addition to further expanding the existing network in the NCR.MHC is slated to increase its capacity from around 1100 beds today across a network of 6 hospitals and two speciality medical centres to 1,900 beds by FY 2012 by commissioning 2 hospitals under PPP with Govt of Punjab, a 300 bed facility in North Delhi and 180 bed Facility in Dehradun.
Here are some facts:
The new wing of Max Super Speciality Hospital, Patparganj with 125 additional beds is slated to be operational in the 2nd half of FY 2012.
Max Cancer Care in the first year of its operation occupied the second
a team of highly experienced
paediatricians and paediatric super-specialists. It has fully equipped neo-natal ICUs with round-the-clock neonatologists providing multi-speciality care to premature babies. The state-of-the-art paediatric ICUs (PICU) can treat critically ill children suffering from life threatening conditions.
Max Institute of Obstetrics and Gynaecology provides advanced maternity and reproductive healthcare service, even to patients in high risk groups. Other services range from menopausal care to mother and child healthcare to infertility treatment.
Max Institute of Aesthetic and Reconstructive Surgery is a centre of excellence for advanced microsurgery and craniofacial surgery. It is also a pioneer in aesthetic surgery of the face and body. The Institute has introduced all the latest techniques in plastic surgery like vacuum assisted wound healing, absorbable facial fracture plating, facial assembly-disassembly for brain base tumours, and feather lift in aesthetic surgery.
Max Institute of Internal Medicine offers core medical services, which includes indoor patient care, outdoor patient care and preventive health checks. Max Home Care programme under the aegis of this institute extends healthcare services to patients beyond the confines of the hospital and enables patients and caregivers to maintain continuity of care.
Max Super Speciality Hospital, Patparganj (A unit of Balaji Medical
& Diagnostic Research Centre) is an international – class tertiary healthcare facility. It is equipped with high end, infrastructure, systems and processes. The facility and equipment at present offers medical and surgical services in all major disciplines with super specialisations in the disciplines of Cardiac Care, Cancer Care, Neurosciences, Orthopaedics & Joint Replacements; Urology and Kidney transplants.
Max Super Speciality Hospital at Patparganj, has been certified with ‘Gold’ rating by Indian Green Building Council under LEED rating system for Green Buildings. It is a resource-efficient and environment-friendly building equipped with eco-friendly, energy and water efficient equipments and non-toxic and recycled materials. It is the first of its kind LEED - Gold certified Green Hospital in North India.
The 275 bedded hospital now has one super-speciality Cardiac OT, one dedicated Neuro and Ortho OT, two Transplant OTs and three modular operation theatres, one cardiac cath lab with DYNA CT which is first in Delhi, fully equipped with coronary care unit, Neuro ICU, Transplant ICU, Medical ICU High Dependency Unit, Surgical ICU and Paediatric ICU, Neonatal ICU and Nursery sections.
Max Hospital, Pitampura provides excellent healthcare over a range of services. Well-equipped OTs, dialysis services and provision for advanced laparoscopic surgery are some of the services available.
Max Medcentre, Panchsheel Park: Max Medcentre, offers clinical services to out patients, providing in-house diagnostic services. It offers a range of preventive healthcare programs,

IN T
HE
BUSI
NES
S O
F LI
FEM
ax In
dia
Lim
ited.
Ann
ual R
epor
t 20
10-1
1.
49
position in Delhi & NCR in terms of
both revenue & volumes.
Max Institute of minimal Access,
Metabolic & Bariatric Surgery
received international accreditation
for being a Centre of Excellence
in Endohernia as well as Bariatric
surgery.
300 bedded Max Super Speciality
Hospital, Shalimar Bagh to become
operational in Q3 of FY 2012.
180 bedded Max Super Speciality
Hospital, Dehradun will become
operational by Q4, 2011-12.
Allotted land by Government of
Punjab (GoP) under Public Private
Partnership (PPP), 200 beds each
Super Speciality Hospitals at
Bathinda and Mohali to be launched
in October 2011. These 200 bedded
each multi-super speciality hospitals
shall have Cancer & Cardiac
and Cardaic & Trauma as tower
specialisations at Bathinda & Mohali
respectively.
Training, Education and Research MHC has achieved distinction in training,
education and clinical research.
On education, Max Healthcare has
established several Post Graduate/Under
Graduate education programmes. Some
of these are:
Post Graduate Programs (Diplomate
National Board) in Cardiology,
Cardiac Surgery, Cardiac Anesthesia,
Interventional Cardiology, Neurology,
Minimal Access Surgery (MAS),
Internal Medicine, Radiology and
Pathology & Anesthesia.
Post Graduate Diploma in Clinical
Cardiology (IGNOU).
Masters in Emergency Medicine
MHC HAS ACHIEVED DISTINCTION IN TRAINING, EDUCATION AND CLINICAL RESEARCH AND HAS ESTABLISHED SEVERAL POST GRADUATE AND UNDER GRADUATE EDUCATION PROGRAMMES
in Collaboration with George
Washington University, USA.
Post Graduate Diploma in Critical
Care Medicine under aegis of Indian
Society of Critical Care Medicine,
Fellowship in Critical Care.
Max Healthcare is an American Heart
Association (AHA) recognized centre
for Advanced Cardiac Life Support
Training, Basic Cardiac Life Support
Training, Paediatric Life Support,
First aid and Airway Management.
Under an MOU with Hamdard
University, New Delhi, B.Sc. in
Emergency Trauma Care and
Technology.
Residency Exchange Program with
Baylor College of Medicine, USA.
Several short courses/Fellowships
to expose physicians in periphery
to super-speciality areas like
neuroradiology, spine surgery,
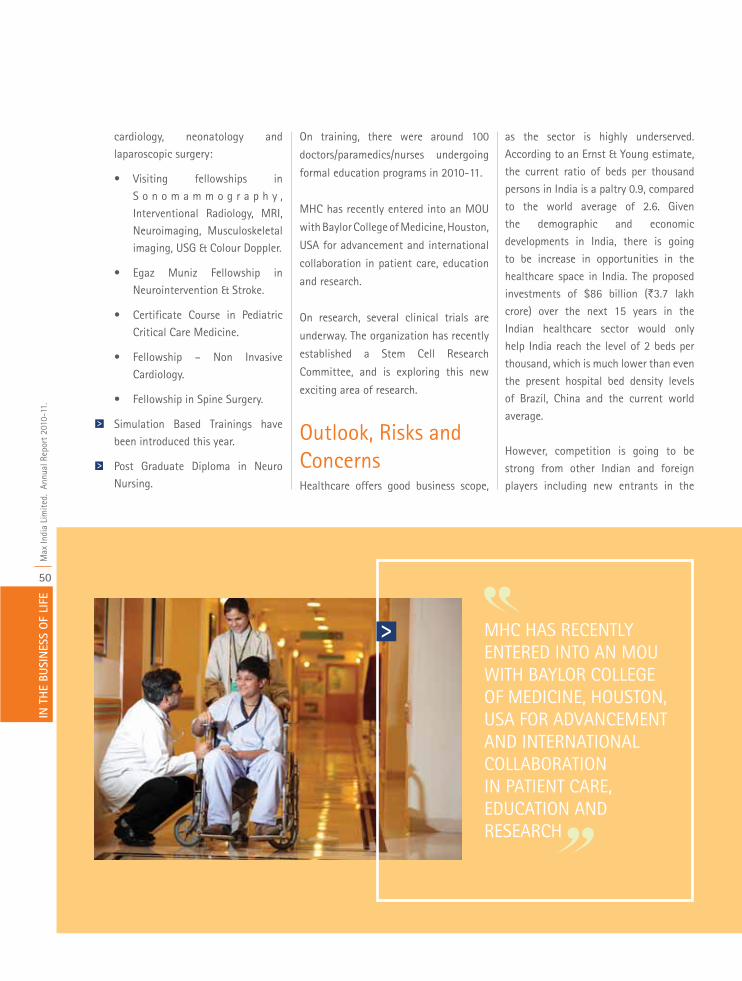
MHC HAS RECENTLY ENTERED INTO AN MOU WITH BAYLOR COLLEGE OF MEDICINE, HOUSTON, USA FOR ADVANCEMENT AND INTERNATIONAL COLLABORATION IN PATIENT CARE, EDUCATION AND RESEARCH
IN T
HE
BUSI
NES
S O
F LI
FEM
ax In
dia
Lim
ited.
Ann
ual R
epor
t 20
10-1
1.
50
as the sector is highly underserved.
According to an Ernst & Young estimate,
the current ratio of beds per thousand
persons in India is a paltry 0.9, compared
to the world average of 2.6. Given
the demographic and economic
developments in India, there is going
to be increase in opportunities in the
healthcare space in India. The proposed
investments of $86 billion (`3.7 lakh
crore) over the next 15 years in the
Indian healthcare sector would only
help India reach the level of 2 beds per
thousand, which is much lower than even
the present hospital bed density levels
of Brazil, China and the current world
average.
However, competition is going to be
strong from other Indian and foreign
players including new entrants in the
cardiology, neonatology and laparoscopic surgery:
• Visiting fellowships in S o n o m a m m o g r a p h y , Interventional Radiology, MRI, Neuroimaging, Musculoskeletal imaging, USG & Colour Doppler.
• Egaz Muniz Fellowship in Neurointervention & Stroke.
• Certificate Course in Pediatric Critical Care Medicine.
• Fellowship – Non Invasive Cardiology.
• Fellowship in Spine Surgery.
Simulation Based Trainings have been introduced this year.
Post Graduate Diploma in Neuro Nursing.
On training, there were around 100
doctors/paramedics/nurses undergoing
formal education programs in 2010-11.
MHC has recently entered into an MOU
with Baylor College of Medicine, Houston,
USA for advancement and international
collaboration in patient care, education
and research.
On research, several clinical trials are
underway. The organization has recently
established a Stem Cell Research
Committee, and is exploring this new
exciting area of research.
Outlook, Risks and Concerns Healthcare offers good business scope,
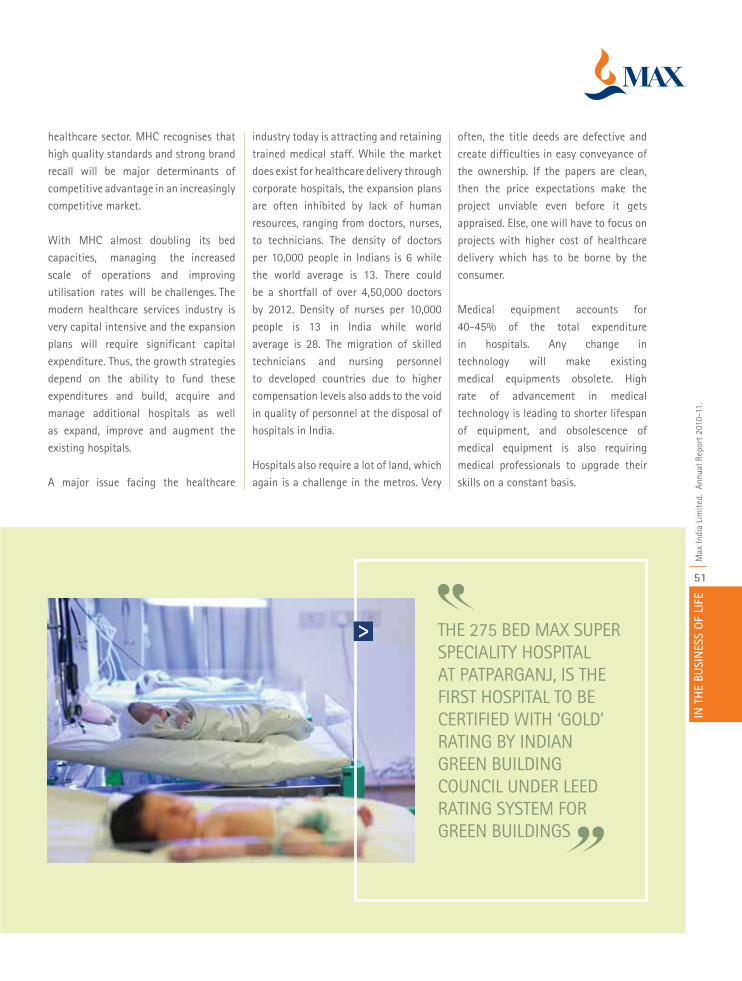
THE 275 BED MAX SUPER SPECIALITY HOSPITAL AT PATPARGANJ, IS THE FIRST HOSPITAL TO BE CERTIFIED WITH ‘GOLD’ RATING BY INDIAN GREEN BUILDING COUNCIL UNDER LEED RATING SYSTEM FOR GREEN BUILDINGS
IN T
HE
BUSI
NES
S O
F LI
FEM
ax In
dia
Lim
ited.
Ann
ual R
epor
t 20
10-1
1.
51
often, the title deeds are defective and create difficulties in easy conveyance of the ownership. If the papers are clean, then the price expectations make the project unviable even before it gets appraised. Else, one will have to focus on projects with higher cost of healthcare delivery which has to be borne by the consumer.
Medical equipment accounts for 40-45% of the total expenditure in hospitals. Any change in technology will make existing medical equipments obsolete. High rate of advancement in medical technology is leading to shorter lifespan of equipment, and obsolescence of medical equipment is also requiring medical professionals to upgrade their skills on a constant basis.
healthcare sector. MHC recognises that high quality standards and strong brand recall will be major determinants of competitive advantage in an increasingly competitive market.
With MHC almost doubling its bed capacities, managing the increased scale of operations and improving utilisation rates will be challenges. The modern healthcare services industry is very capital intensive and the expansion plans will require significant capital expenditure. Thus, the growth strategies depend on the ability to fund these expenditures and build, acquire and manage additional hospitals as well as expand, improve and augment the existing hospitals.
A major issue facing the healthcare
industry today is attracting and retaining trained medical staff. While the market does exist for healthcare delivery through corporate hospitals, the expansion plans are often inhibited by lack of human resources, ranging from doctors, nurses, to technicians. The density of doctors per 10,000 people in Indians is 6 while the world average is 13. There could be a shortfall of over 4,50,000 doctors by 2012. Density of nurses per 10,000 people is 13 in India while world average is 28. The migration of skilled technicians and nursing personnel to developed countries due to higher compensation levels also adds to the void in quality of personnel at the disposal of hospitals in India.
Hospitals also require a lot of land, which again is a challenge in the metros. Very
IN T
HE
BUSI
NES
S O
F LI
FEM
ax In
dia
Lim
ited.
Ann
ual R
epor
t 20
10-1
1.
52
Max Bupa Health Insurance Company Ltd.
IN T
HE
BUSI
NES
S O
F LI
FEM
ax In
dia
Lim
ited.
Ann
ual R
epor
t 20
10-1
1.
53
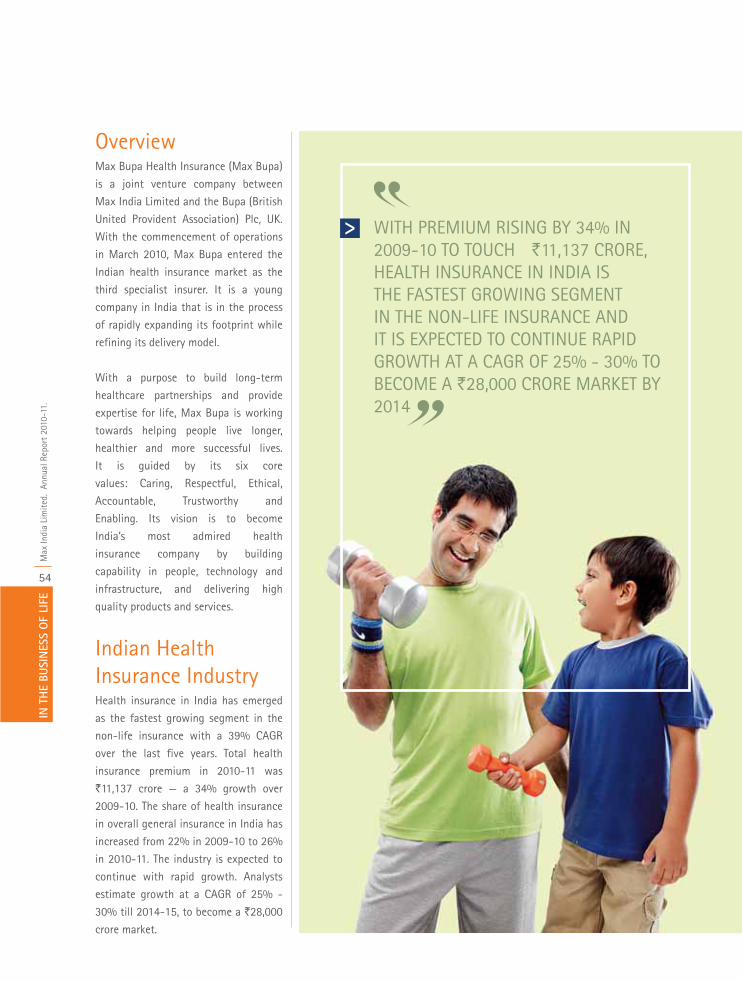
IN T
HE
BUSI
NES
S O
F LI
FEM
ax In
dia
Lim
ited.
Ann
ual R
epor
t 20
10-1
1.
54
OverviewMax Bupa Health Insurance (Max Bupa)
is a joint venture company between
Max India Limited and the Bupa (British
United Provident Association) Plc, UK.
With the commencement of operations
in March 2010, Max Bupa entered the
Indian health insurance market as the
third specialist insurer. It is a young
company in India that is in the process
of rapidly expanding its footprint while
refining its delivery model.
With a purpose to build long-term
healthcare partnerships and provide
expertise for life, Max Bupa is working
towards helping people live longer,
healthier and more successful lives.
It is guided by its six core
values: Caring, Respectful, Ethical,
Accountable, Trustworthy and
Enabling. Its vision is to become
India’s most admired health
insurance company by building
capability in people, technology and
infrastructure, and delivering high
quality products and services.
Indian Health Insurance Industry Health insurance in India has emerged
as the fastest growing segment in the
non-life insurance with a 39% CAGR
over the last five years. Total health
insurance premium in 2010-11 was
`11,137 crore — a 34% growth over
2009-10. The share of health insurance
in overall general insurance in India has
increased from 22% in 2009-10 to 26%
in 2010-11. The industry is expected to
continue with rapid growth. Analysts
estimate growth at a CAGR of 25% -
30% till 2014-15, to become a `28,000
crore market.
WITH PREMIUM RISING BY 34% IN 2009-10 TO TOUCH R`11,137 CRORE, HEALTH INSURANCE IN INDIA IS THE FASTEST GROWING SEGMENT IN THE NON-LIFE INSURANCE AND IT IS EXPECTED TO CONTINUE RAPID GROWTH AT A CAGR OF 25% - 30% TO BECOME A `28,000 CRORE MARKET BY 2014
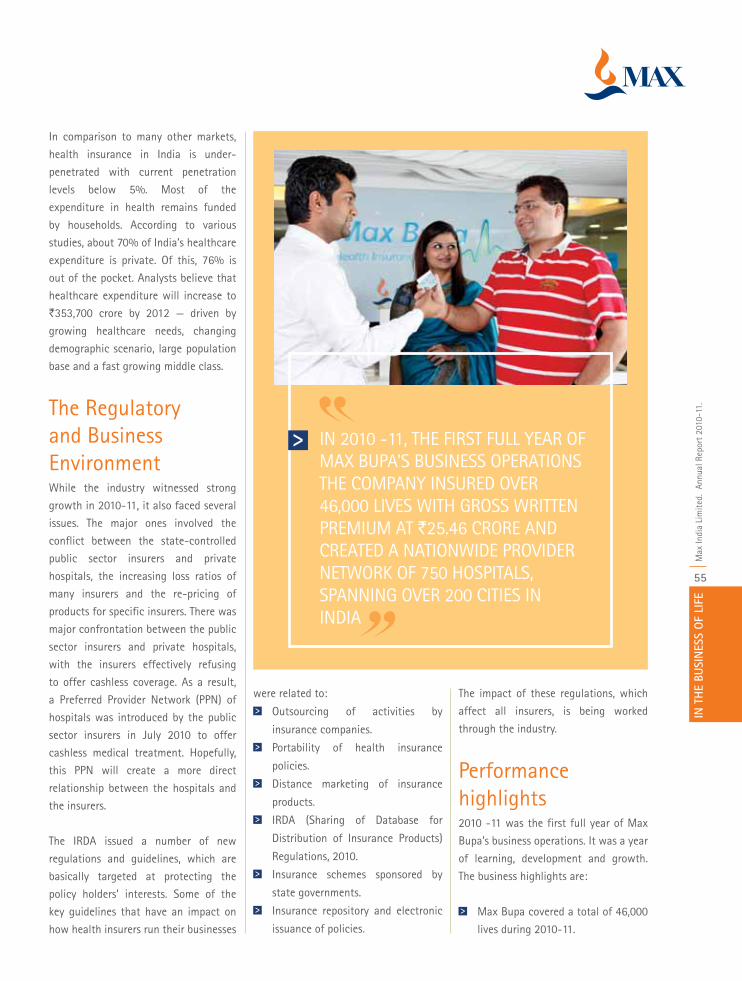
IN T
HE
BUSI
NES
S O
F LI
FEM
ax In
dia
Lim
ited.
Ann
ual R
epor
t 20
10-1
1.
55
In comparison to many other markets,
health insurance in India is under-
penetrated with current penetration
levels below 5%. Most of the
expenditure in health remains funded
by households. According to various
studies, about 70% of India’s healthcare
expenditure is private. Of this, 76% is
out of the pocket. Analysts believe that
healthcare expenditure will increase to
`353,700 crore by 2012 — driven by
growing healthcare needs, changing
demographic scenario, large population
base and a fast growing middle class.
The Regulatory and Business Environment While the industry witnessed strong
growth in 2010-11, it also faced several
issues. The major ones involved the
conflict between the state-controlled
public sector insurers and private
hospitals, the increasing loss ratios of
many insurers and the re-pricing of
products for specific insurers. There was
major confrontation between the public
sector insurers and private hospitals,
with the insurers effectively refusing
to offer cashless coverage. As a result,
a Preferred Provider Network (PPN) of
hospitals was introduced by the public
sector insurers in July 2010 to offer
cashless medical treatment. Hopefully,
this PPN will create a more direct
relationship between the hospitals and
the insurers.
The IRDA issued a number of new
regulations and guidelines, which are
basically targeted at protecting the
policy holders’ interests. Some of the
key guidelines that have an impact on
how health insurers run their businesses
were related to:
Outsourcing of activities by
insurance companies.
Portability of health insurance
policies.
Distance marketing of insurance
products.
IRDA (Sharing of Database for
Distribution of Insurance Products)
Regulations, 2010.
Insurance schemes sponsored by
state governments.
Insurance repository and electronic
issuance of policies.
The impact of these regulations, which
affect all insurers, is being worked
through the industry.
Performance highlights 2010 -11 was the first full year of Max
Bupa’s business operations. It was a year
of learning, development and growth.
The business highlights are:
Max Bupa covered a total of 46,000
lives during 2010-11.
IN 2010 -11, THE FIRST FULL YEAR OF MAX BUPA’S BUSINESS OPERATIONS THE COMPANY INSURED OVER 46,000 LIVES WITH GROSS WRITTEN PREMIUM AT `25.46 CRORE AND CREATED A NATIONWIDE PROVIDER NETWORK OF 750 HOSPITALS, SPANNING OVER 200 CITIES IN INDIA

IN T
HE
BUSI
NES
S O
F LI
FEM
ax In
dia
Lim
ited.
Ann
ual R
epor
t 20
10-1
1.
56
Gross written premium (GWP) was
over `25 crore.
The provider network grew to
750, spanning over 200 cities in
India.
Heartbeat Family First received the
‘Best Product Innovation Award
for 2011’ from the India Insurance
Review.
Strategy and Development Max Bupa has a growth strategy to
penetrate the Indian market profitably. It
can be divided into the following areas:
Distribution network: Max Bupa is
developing a multi-channel distribution
network to ensure that customers can
reach it through their preferred channel.
The network includes 10 offices across
India, agents across the country, third
party distribution partners, in-house
field sales operatives, an in-house tele-
sales team and an online sales channel.
Marketing and brand initiatives: Operations started in March 2010. A
formal brand launch was done on 29
MAX BUPA LAUNCHED THE HEARTBEAT FAMILY FIRST IN 2010-11, A FIRST OF ITS KIND PRODUCT DESIGNED ESPECIALLY FOR THE EXTENDED INDIAN JOINT FAMILY AND IT WAS LATER AWARDED THE ‘BEST PRODUCT INNOVATION AWARD FOR 2011’ FROM THE INDIA INSURANCE REVIEW

IN T
HE
BUSI
NES
S O
F LI
FEM
ax In
dia
Lim
ited.
Ann
ual R
epor
t 20
10-1
1.
57
April 2010. It included a series of media
and customer events across India,
focused around ‘Your Health First’ —
and building awareness about the close
relationship between people’s health
and the need for health insurance.
Subsequent branding emphasised the
need to buy health insurance.
People: A key priority for Max Bupa is
people — and this includes attracting
and retaining the right people for the
MAX BUPA HAS DEVELOPED A MULTI CHANNEL DISTRIBUTION NETWORK TO ENSURE THAT ITS CUSTOMERS CAN REACH IT THROUGH THEIR PREFERRED CHANNEL
future growth of the company. The team
has grown from 400 at the beginning of
the year to 700 by the end of 2010-11.
There were a number of new initiatives
on hiring and talent management. There
were on-the-job training and market
readiness tests, performance appraisals
and goal setting for all employees, job
evaluation exercises, skill development
training, management and leadership
development programmes, employee
satisfaction survey, introduction of an
employee portal and human resources
information systems.
Operations Max Bupa’s customer sales and service
operations are enabled by in-house
systems and processes. This involves a
complete chain of activities including
selling, servicing, underwriting, enrolling,
issuing, billing and renewing, claiming
and reporting. The service delivery
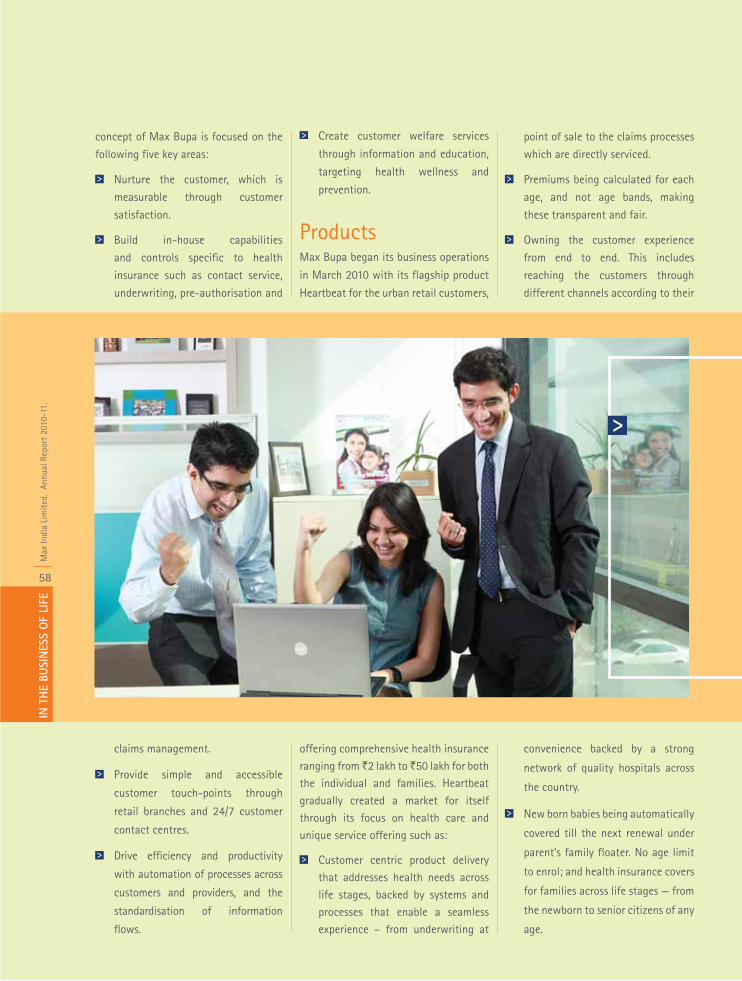
IN T
HE
BUSI
NES
S O
F LI
FEM
ax In
dia
Lim
ited.
Ann
ual R
epor
t 20
10-1
1.
58
concept of Max Bupa is focused on the
following five key areas:
Nurture the customer, which is
measurable through customer
satisfaction.
Build in-house capabilities
and controls specific to health
insurance such as contact service,
underwriting, pre-authorisation and
Create customer welfare services
through information and education,
targeting health wellness and
prevention.
Products Max Bupa began its business operations
in March 2010 with its flagship product
Heartbeat for the urban retail customers,
point of sale to the claims processes
which are directly serviced.
Premiums being calculated for each
age, and not age bands, making
these transparent and fair.
Owning the customer experience
from end to end. This includes
reaching the customers through
different channels according to their
claims management.
Provide simple and accessible
customer touch-points through
retail branches and 24/7 customer
contact centres.
Drive efficiency and productivity
with automation of processes across
customers and providers, and the
standardisation of information
flows.
offering comprehensive health insurance ranging from ̀ 2 lakh to ̀ 50 lakh for both the individual and families. Heartbeat gradually created a market for itself through its focus on health care and unique service offering such as:
Customer centric product delivery that addresses health needs across life stages, backed by systems and processes that enable a seamless experience – from underwriting at
convenience backed by a strong
network of quality hospitals across
the country.
New born babies being automatically
covered till the next renewal under
parent’s family floater. No age limit
to enrol; and health insurance covers
for families across life stages — from
the newborn to senior citizens of any
age.
IN T
HE
BUSI
NES
S O
F LI
FEM
ax In
dia
Lim
ited.
Ann
ual R
epor
t 20
10-1
1.
59
Vaccination and health checkups
and renewal benefits like assured
renewability of policy for your
lifetime.
Through 2010-11, Max Bupa has
extended its product portfolio. Today, its
main product offerings are:
1. The Heartbeat product suite
towards the end of the Year 2010-
11.
3. The Swasthya Pratham product
(launched in January 2011) for
rural and socially weaker
households.
4. International medical emergency
policy (launched in December 2010)
for frequent Indian travellers.
Risks, Concerns and Internal ControlsMax Bupa has in place internal controls
which are commensurate with its
size, and the nature of its operations.
These have been designed to provide
reasonable assurance with regard to
recording and providing reliable financial
and operational information, complying
with applicable statutes, safeguarding
assets from unauthorised use or losses,
executing transactions with proper
authorisations and ensuring compliance
of corporate policies.
Max Bupa has a well defined delegation
of power with authority limits for
approving revenue as well as expenditure.
Processes for formulating and reviewing
annual and long terms business plans
have been laid down. It has an internal
audit department. There is a well
defined internal audit plan which will be
reviewed each year in consultation with
the statutory auditors and the Audit
Committee of the company’s Board of
Directors. Internal audit processes are
designed to review the adequacy of
internal control checks in the system
and cover all significant areas of the
company’s operations.
OutlookIn 2011-12, the industry is expected to
grow at a steady pace in line with what
was seen in 2010-11.
Max Bupa is looking at accelerating its
growth. To achieve this, it plans to focus
on continued sales growth and quality
of service to all customers and stake
holders.
MAX BUPA HAS GROWN FROM 400 TO 700 EMPLOYEES IN 2010-11. ATTRACTING QUALITY TALENT AND RETAINING THE RIGHT PEOPLE ARE KEY PRIORITIES AT MAX BUPA, AS IT ENTERS INTO THE NEXT PHASE OF ACCELERATED GROWTH
(launched March 2010) which targets the retail market of individuals and families. Being the flagship and only product for most part of the year, Heartbeat has been the major contributor to revenues in this year.
2. The Employee First product suite (launched in January 2011), which targets SME and group business. This product was launched
During 2010-11, a new variant to the
Heartbeat product was added in the
form of Family First. This is the
only product in the market to cater
to the Indian joint family, by offering
cover to the extended families
(13 relationships) in one policy.
Based on market experience and
analysis, a robust product pipeline
has been prepared to expand Max
Bupa’s reach.
IN T
HE
BUSI
NES
S O
F LI
FEM
ax In
dia
Lim
ited.
Ann
ual R
epor
t 20
10-1
1.
60
Max Neeman Medical International Limited
IN T
HE
BUSI
NES
S O
F LI
FEM
ax In
dia
Lim
ited.
Ann
ual R
epor
t 20
10-1
1.
61
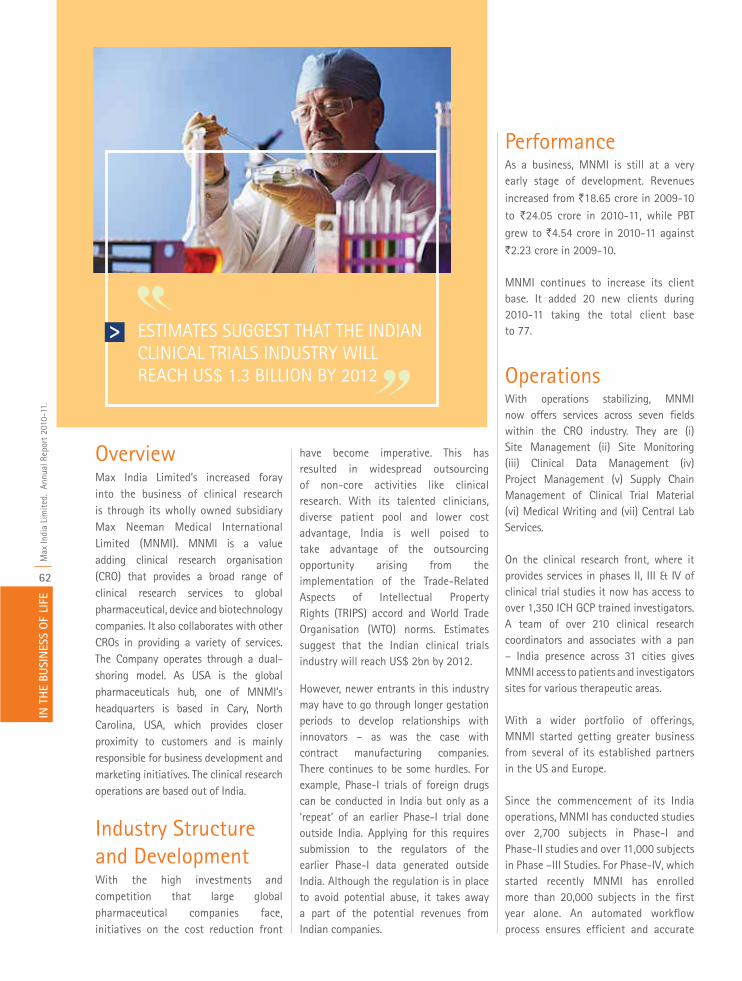
IN T
HE
BUSI
NES
S O
F LI
FEM
ax In
dia
Lim
ited.
Ann
ual R
epor
t 20
10-1
1.
62
Overview Max India Limited’s increased foray into the business of clinical research is through its wholly owned subsidiary Max Neeman Medical International Limited (MNMI). MNMI is a value adding clinical research organisation (CRO) that provides a broad range of clinical research services to global pharmaceutical, device and biotechnology companies. It also collaborates with other CROs in providing a variety of services. The Company operates through a dual-shoring model. As USA is the global pharmaceuticals hub, one of MNMI’s headquarters is based in Cary, North Carolina, USA, which provides closer proximity to customers and is mainly responsible for business development and marketing initiatives. The clinical research operations are based out of India.
Industry Structure and Development With the high investments and competition that large global pharmaceutical companies face, initiatives on the cost reduction front
have become imperative. This has resulted in widespread outsourcing of non-core activities like clinical research. With its talented clinicians, diverse patient pool and lower cost advantage, India is well poised to take advantage of the outsourcing opportunity arising from the implementation of the Trade-Related Aspects of Intellectual Property Rights (TRIPS) accord and World Trade Organisation (WTO) norms. Estimates suggest that the Indian clinical trials industry will reach US$ 2bn by 2012.
However, newer entrants in this industry may have to go through longer gestation periods to develop relationships with innovators – as was the case with contract manufacturing companies. There continues to be some hurdles. For example, Phase-I trials of foreign drugs can be conducted in India but only as a ‘repeat’ of an earlier Phase-I trial done outside India. Applying for this requires submission to the regulators of the earlier Phase-I data generated outside India. Although the regulation is in place to avoid potential abuse, it takes away a part of the potential revenues from Indian companies.
Performance As a business, MNMI is still at a very early stage of development. Revenues increased from `18.65 crore in 2009-10 to `24.05 crore in 2010-11, while PBT grew to `4.54 crore in 2010-11 against `2.23 crore in 2009-10.
MNMI continues to increase its client base. It added 20 new clients during 2010-11 taking the total client base to 77.
Operations With operations stabilizing, MNMI now offers services across seven fields within the CRO industry. They are (i) Site Management (ii) Site Monitoring (iii) Clinical Data Management (iv) Project Management (v) Supply Chain Management of Clinical Trial Material (vi) Medical Writing and (vii) Central Lab Services.
On the clinical research front, where it provides services in phases II, III & IV of clinical trial studies it now has access to over 1,350 ICH GCP trained investigators. A team of over 210 clinical research coordinators and associates with a pan – India presence across 31 cities gives MNMI access to patients and investigators sites for various therapeutic areas.
With a wider portfolio of offerings, MNMI started getting greater business from several of its established partners in the US and Europe.
Since the commencement of its India operations, MNMI has conducted studies over 2,700 subjects in Phase-I and Phase-II studies and over 11,000 subjects in Phase –III Studies. For Phase-IV, which started recently MNMI has enrolled more than 20,000 subjects in the first year alone. An automated workflow process ensures efficient and accurate
ESTIMATES SUGGEST THAT THE INDIAN CLINICAL TRIALS INDUSTRY WILL REACH US$ 1.3 BILLION BY 2012
IN T
HE
BUSI
NES
S O
F LI
FEM
ax In
dia
Lim
ited.
Ann
ual R
epor
t 20
10-1
1.
63
MAX NEEMAN HAS SUCCESSFULLY MET THE NEEDS OF ITS DEMANDING GLOBAL CUSTOMERS SUCH AS MERCK, ABBOTT GLAXOSMITHKLINE, BRISTOL MYERS SQUIBB, SANOFI-AVENTIS, JOHNSON & JOHNSON, NOVARTIS, PFIZER, ASTRAZENECA AND ACHIEVED A PATIENT RETENTION RATE OF 98%, AGAINST THE INDUSTRY AVERAGE OF 65% TO 70%
data management. With its high quality operating standards, MNMI successfully provided services to 32 clients over 64 new studies during 2010-11.
MNMI’s patient retention rate – a critical business driver in clinical trials – is 92% against an industry average of 65% to 70%. It caters to several prestigious customers that include large pharmaceutical companies such as Abbott, Merck, GlaxoSmithKline, Bristol Myers Squibb, Sanofi-Aventis, Johnson & Johnson, Novartis, Pfizer, AstraZeneca, Genzyme, Pharmacosmos, Biogen Idec, Genzyme, NovoNordisk, and Wyeth as well as other medium size companies such as Achillion, GlobeImmune, AP Pharma, ORA, KV Pharmaceuticals, Inspiration, Biotronik, West Ward, Orion, Octapharma, Ocular Theraputics, SOV Therpeutics, Check Cap, Angel Med, Theracos, Trutek, Sun Pharma, Advaxis, Onyvax, Cardiogenesis, Akorn, Eyegate, Quintiles, Bio Cryst, Heart force, Viro Pharma, Nural Strem, Victhom, Premiere Research, Sintesi Research, Boston Scientific, Semler Research, Mardil, Medtronik, Surpass Medical, Vision Care, Amgen, Acrovan, Mediwound, Ethicon, Cure Tech, Corventis Medical, Capnia, and Onconova.
Most employees of MNMI have professional degrees in medicine or pharmacology. All employees have been trained for a minimum of 50 hours in 2010-11 to improve skill sets. High retention rate has been maintained by providing a harmonious and favourable work environment. The employee count increased from 270 at the end of 2009-10 to over 320 at the end of 2010-11.
MNMI follows a robust system of quality control and all its operational activities are governed by strict adherence to ICH-GCP guidelines. It is the first CRO in India whose five sites have been audited successfully by USFDA. MNMI has been certified for ISO 9001:2008 for site management, monitoring and data management. All its activities and operations are governed by robust standard operating procedures (SOPs). MNMI has also been certified organization-wide for ISO 27001:2005 (Information Security Management System).
Outlook, Risks and Concerns The CRO industry is highly dependent
on R&D expenditures of pharmaceutical and biotech companies. These expenditure vary in any given year. Operating results are also subject to volatility due to external constraints such as the commencement, completion, cancellation or delay of contracts. Progress of ongoing projects, cost overruns and competitive industry conditions are also sources of risks. The ability to develop and market new services on a timely basis with changes in the service mix for various clients always remains a challenge. Equally, this provides an opportunity to increase client retention with the delivery of superior service skills and offerings.
In this business, there are potential product and conduct liability risks. There is also competition from in-house research departments of pharmaceutical companies, universities and teaching hospitals, as well as other CROs.
Despite these risks, MNMI is confident of future growth. It has the requisite skill sets and infrastructure. It is developing deep relationships with many marquee clients. It has best-in-class processes and controls. Therefore, it expects to grow revenues and profits in the near future.
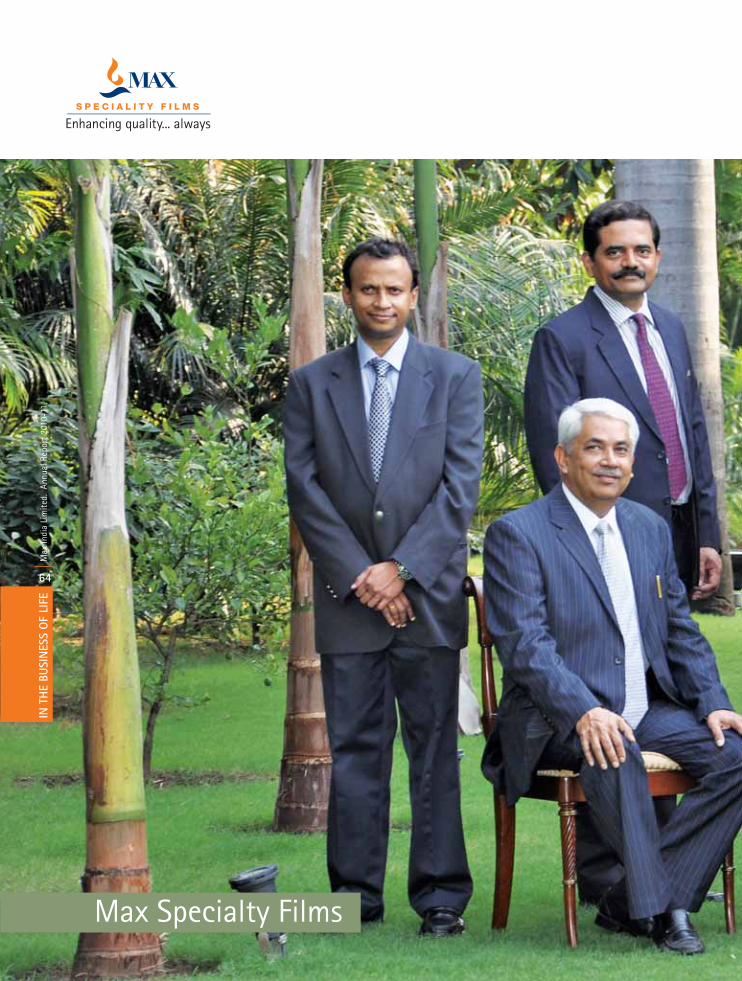
IN T
HE
BUSI
NES
S O
F LI
FEM
ax In
dia
Lim
ited.
Ann
ual R
epor
t 20
10-1
1.
64
IN T
HE
BUSI
NES
S O
F LI
FEM
ax In
dia
Lim
ited.
Ann
ual R
epor
t 20
10-1
1.
64
Max Specialty Films
IN T
HE
BUSI
NES
S O
F LI
FEM
ax In
dia
Lim
ited.
Ann
ual R
epor
t 20
10-1
1.
65
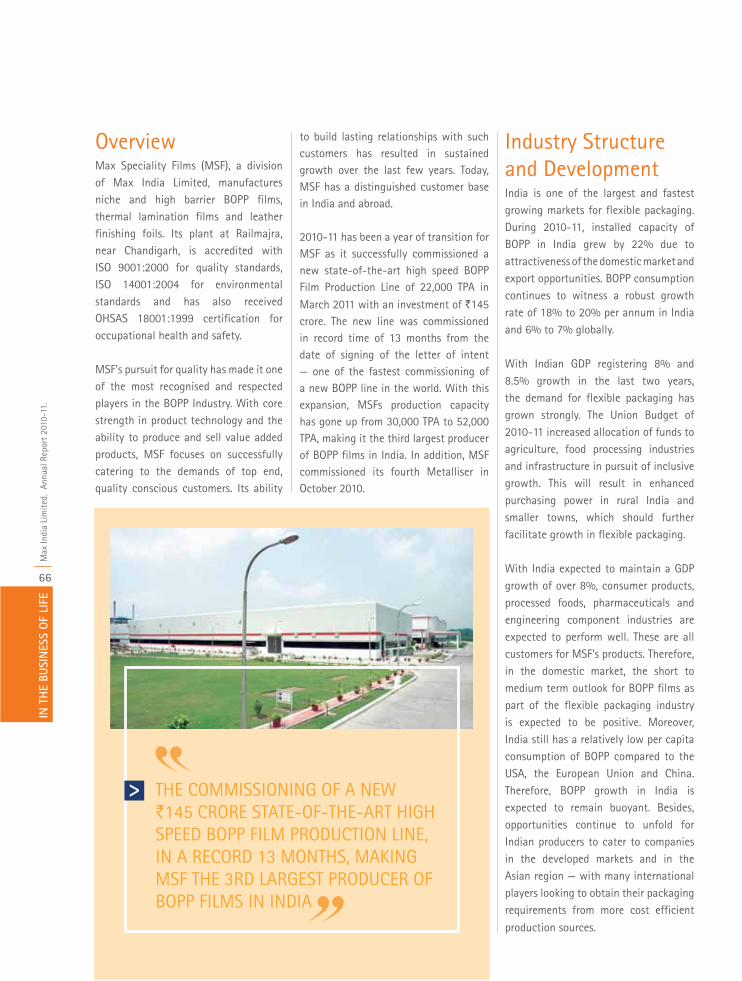
IN T
HE
BUSI
NES
S O
F LI
FEM
ax In
dia
Lim
ited.
Ann
ual R
epor
t 20
10-1
1.
66
Overview Max Speciality Films (MSF), a division of Max India Limited, manufactures niche and high barrier BOPP films, thermal lamination films and leather finishing foils. Its plant at Railmajra, near Chandigarh, is accredited with ISO 9001:2000 for quality standards, ISO 14001:2004 for environmental standards and has also received OHSAS 18001:1999 certification for occupational health and safety.
MSF’s pursuit for quality has made it one of the most recognised and respected players in the BOPP Industry. With core strength in product technology and the ability to produce and sell value added products, MSF focuses on successfully catering to the demands of top end, quality conscious customers. Its ability
to build lasting relationships with such customers has resulted in sustained growth over the last few years. Today, MSF has a distinguished customer base in India and abroad.
2010-11 has been a year of transition for MSF as it successfully commissioned a new state-of-the-art high speed BOPP Film Production Line of 22,000 TPA in March 2011 with an investment of `145 crore. The new line was commissioned in record time of 13 months from the date of signing of the letter of intent — one of the fastest commissioning of a new BOPP line in the world. With this expansion, MSFs production capacity has gone up from 30,000 TPA to 52,000 TPA, making it the third largest producer of BOPP films in India. In addition, MSF commissioned its fourth Metalliser in October 2010.
Industry Structure and Development India is one of the largest and fastest growing markets for flexible packaging. During 2010-11, installed capacity of BOPP in India grew by 22% due to attractiveness of the domestic market and export opportunities. BOPP consumption continues to witness a robust growth rate of 18% to 20% per annum in India and 6% to 7% globally.
With Indian GDP registering 8% and 8.5% growth in the last two years, the demand for flexible packaging has grown strongly. The Union Budget of 2010-11 increased allocation of funds to agriculture, food processing industries and infrastructure in pursuit of inclusive growth. This will result in enhanced purchasing power in rural India and smaller towns, which should further facilitate growth in flexible packaging.
With India expected to maintain a GDP growth of over 8%, consumer products, processed foods, pharmaceuticals and engineering component industries are expected to perform well. These are all customers for MSF’s products. Therefore, in the domestic market, the short to medium term outlook for BOPP films as part of the flexible packaging industry is expected to be positive. Moreover, India still has a relatively low per capita consumption of BOPP compared to the USA, the European Union and China. Therefore, BOPP growth in India is expected to remain buoyant. Besides, opportunities continue to unfold for Indian producers to cater to companies in the developed markets and in the Asian region — with many international players looking to obtain their packaging requirements from more cost efficient
production sources.
THE COMMISSIONING OF A NEW `145 CRORE STATE-OF-THE-ART HIGH SPEED BOPP FILM PRODUCTION LINE, IN A RECORD 13 MONTHS, MAKING MSF THE 3RD LARGEST PRODUCER OF BOPP FILMS IN INDIA
IN T
HE
BUSI
NES
S O
F LI
FEM
ax In
dia
Lim
ited.
Ann
ual R
epor
t 20
10-1
1.
67
Internal Control System and Adequacy MSF has adequate internal control systems in place and well established management systems and procedures. Periodic audit of these by accrediting agencies, gives a comfort about their adequacy and adherence. Internal audit and management reviews are conducted regularly and the reports are submitted to the Audit Committee of the Board of Max India.
Outlook, Risks and ConcernsWith the Indian economy expected to continue growing at over 8% for a reasonable period of time in the future, the momentum for growth in applications in packaging is expected to continue. This will be a driver of demand for BOPP films. However, there is prospect of significant new capacity coming online in 2011-12. This might tilt the demand and supply equation. With the industry operating below full capacity there may be temporary pressures on pricing and margins. In terms of input costs, volatile and growing trend in crude oil prices and resultant fluctuations in polypropylene prices is an area of concern. Up to now, MSF has been successful in passing all raw material cost increases to the market. Apart from fuel inflation, food inflation is also a worrying factor that might destabilise consumer demand.
MSF, with its diversified product range and quality, brand loyalty, customer service, niche positioning and operational efficiencies can mitigate these risks to a large extent. Overall, it maintains a positive outlook in the medium and long term.
Performance Highlights MSF’s sales turnover was `456 crore in 2010-11 against `363 crore in 2009-10. Net revenues increased by 25% from `333 crore in 2009-10 to `417 crore in 2010-11. Despite a 22% increase in overall industry capacity, MSF’s operating margin (EBIDTA to net sales) was maintained at 12.7% in 2010-11. EBIDTA increased by 23% to `53 crore in 2010-11. PBT increased by 77% to `36 crore.
Other key achievements during 2010-11 include:
MSF maintained high production efficiencies and all its BOPP production and metallisation lines achieved 100% capacity utilisation.
It achieved volume growth of 103% in thermal film sales.
Exports registered growth of 108%.
It won the prestigious ‘IndiaStar’ awards for six products for innovative design and development in packaging from Indian Institute of Packaging.
Won the ‘World Star’ award from
the World Packaging Organisation for a new product.
Human ResourcesHuman resource is the most valuable asset at MSF and the Company continues to attract and retain the best available talent. MSF has a culture oriented towards empowerment and ongoing training and development, and continues to provide a professional work environment. It ensures customised training and development programmes for all levels of its employees. Innovation and good performance are always recognised and rewarded. The Company has also initiated skill-up gradation and education programmes for its workmen.
The total number of employees as on 31 March 2011 was 455.
Relationship with workmen continued to be cordial and MSF staff continues to get awards from Government organizations for safety and productivity. The Company is also in the process of implementing Max Performance Excellence Framework which will help develop a formalized structure for training, employee empowerment and improvement in work processes and customer satisfaction.
MSF’S PURSUIT FOR QUALITY HAS MADE IT ONE OF THE MOST RECOGNISED AND RESPECTED PLAYERS IN THE BOPP INDUSTRY. MSF WAS AWARDED THE ‘WORLD STAR’ AWARD FROM THE WORLD PACKAGING ORGANISATION AND THE ‘INDIASTAR’ AWARDS FOR SIX PRODUCTS FROM INDIAN INSTITUTE OF PACKAGING
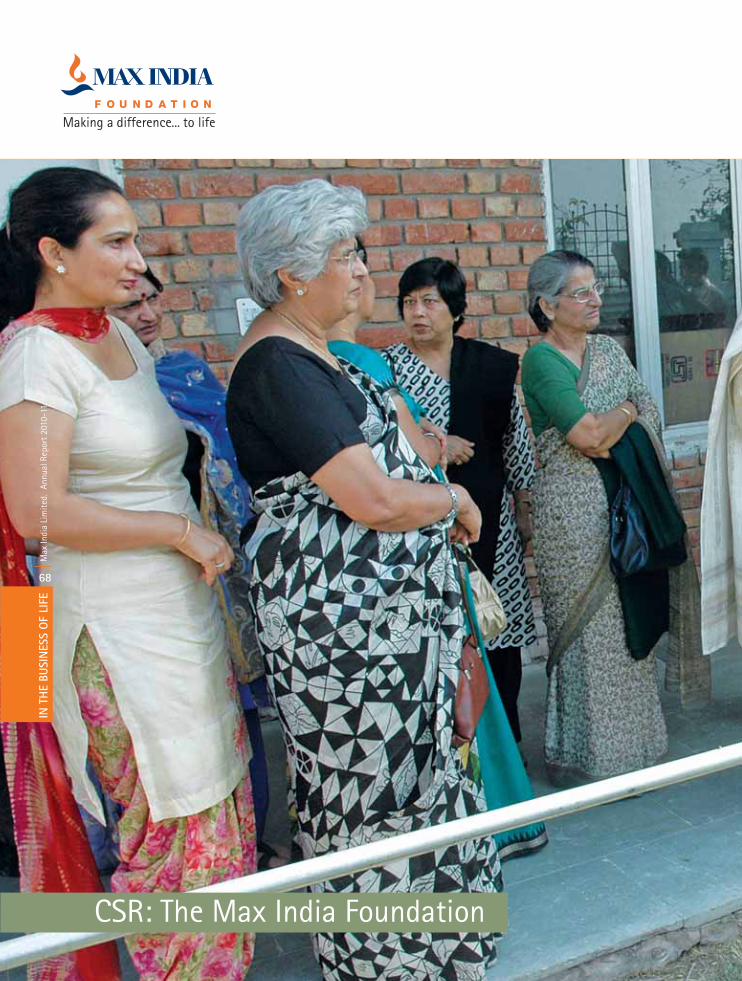
IN T
HE
BUSI
NES
S O
F LI
FEM
ax In
dia
Lim
ited.
Ann
ual R
epor
t 20
10-1
1.
68
IN T
HE
BUSI
NES
S O
F LI
FEM
ax In
dia
Lim
ited.
Ann
ual R
epor
t 20
10-1
1.
68
CSR: The Max India Foundation
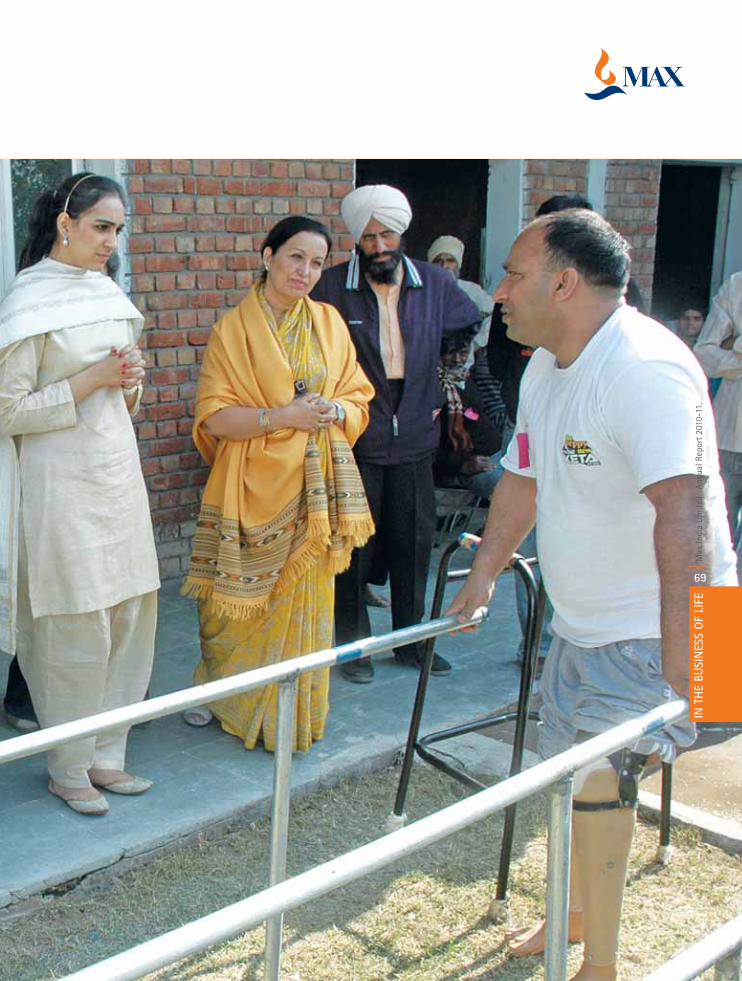
IN T
HE
BUSI
NES
S O
F LI
FEM
ax In
dia
Lim
ited.
Ann
ual R
epor
t 20
10-1
1.
69

8,113 CHILDREN BENEFITED THROUGH 101 CAMPS IN 39 LOCATIONS ACROSS THE COUNTRY IN 2010-11
IN T
HE
BUSI
NES
S O
F LI
FEM
ax In
dia
Lim
ited.
Ann
ual R
epor
t 20
10-1
1.
70The social initiatives for Max New York Life, Max Healthcare and Max Speciality Films and other group companies are planned and executed through the Max India Foundation (MIF).
The CSR mission of MIF is focused on providing quality healthcare to the underprivileged, especially children, facilitating awareness of health related issues, and promoting and fostering an eco-friendly healthy environment. This is done by engaging Max India Group employees and partnering with reputed NGOs in project execution. In addition to the social objectives, these initiatives help the employees fulfill their desire for social development and welfare, and in the process helps in achieving a strong spirit of bonding between employees across the entire Max group.
2010-11 was a significant milestone for Max India Foundation. MIF gained recognition across the board for the impact it has made. The foundation was awarded the Golden Peacock Global Award for CSR, The Bombay Stock Exchange (BSE) award for the Best Corporate Social Responsibility Practices and Indys International ‘Best in Corporate Social Responsibility’ award. Within a span of three years, therefore, MIF has created a niche for itself amongst the CSR wings of leading organisations.
Given below are some of the major initiatives undertaken in association with its partner NGOs in 2010-2011.
Surgeries for the underprivileged: 220 surgeries were facilitated by MIF in 2010-11. These include paediatric cardiac surgeries, treatment for
cancer, neurosurgeries, complex reconstructive surgeries and others. This initiative has given hope to the underprivileged who, due to financial constraints, could never think of undergoing complete treatment and leading a normal life.
Pan-India immunisation programme: MIF through Max New York Life Insurance conducts immunisation to protect children from life threatening diseases. They are given the entire spectrum of preventive shots. In 2010-11, 8,113 children benefited through 101 camps in 39 locations across the country.
Health Centres
CanSupport’s East Delhi Field Centre: The MIF sponsored
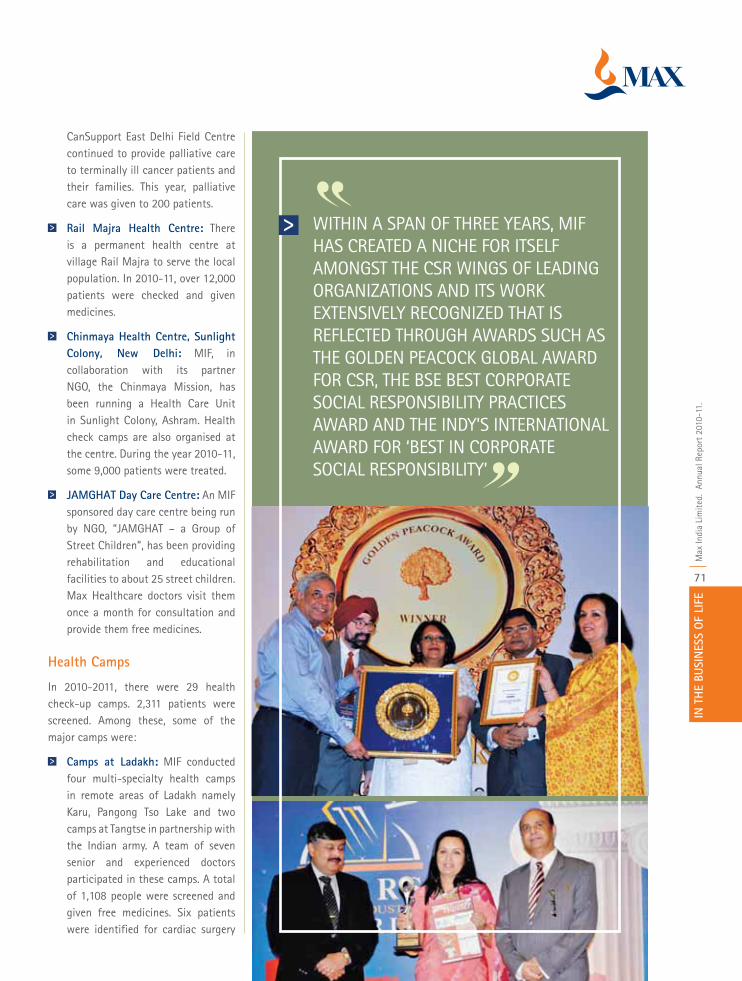
IN T
HE
BUSI
NES
S O
F LI
FEM
ax In
dia
Lim
ited.
Ann
ual R
epor
t 20
10-1
1.
71
CanSupport East Delhi Field Centre continued to provide palliative care to terminally ill cancer patients and their families. This year, palliative care was given to 200 patients.
Rail Majra Health Centre: There is a permanent health centre at village Rail Majra to serve the local population. In 2010-11, over 12,000 patients were checked and given medicines.
Chinmaya Health Centre, Sunlight Colony, New Delhi: MIF, in collaboration with its partner NGO, the Chinmaya Mission, has been running a Health Care Unit in Sunlight Colony, Ashram. Health check camps are also organised at the centre. During the year 2010-11, some 9,000 patients were treated.
JAMGHAT Day Care Centre: An MIF sponsored day care centre being run by NGO, “JAMGHAT – a Group of Street Children”, has been providing rehabilitation and educational facilities to about 25 street children. Max Healthcare doctors visit them once a month for consultation and provide them free medicines.
Health Camps
In 2010-2011, there were 29 health check-up camps. 2,311 patients were screened. Among these, some of the major camps were:
Camps at Ladakh: MIF conducted four multi-specialty health camps in remote areas of Ladakh namely Karu, Pangong Tso Lake and two camps at Tangtse in partnership with the Indian army. A team of seven senior and experienced doctors participated in these camps. A total of 1,108 people were screened and given free medicines. Six patients were identified for cardiac surgery
WITHIN A SPAN OF THREE YEARS, MIF HAS CREATED A NICHE FOR ITSELF AMONGST THE CSR WINGS OF LEADING ORGANIZATIONS AND ITS WORK EXTENSIVELY RECOGNIZED THAT IS REFLECTED THROUGH AWARDS SUCH AS THE GOLDEN PEACOCK GLOBAL AWARD FOR CSR, THE BSE BEST CORPORATE SOCIAL RESPONSIBILITY PRACTICES AWARD AND THE INDY’S INTERNATIONAL AWARD FOR ‘BEST IN CORPORATE SOCIAL RESPONSIBILITY’
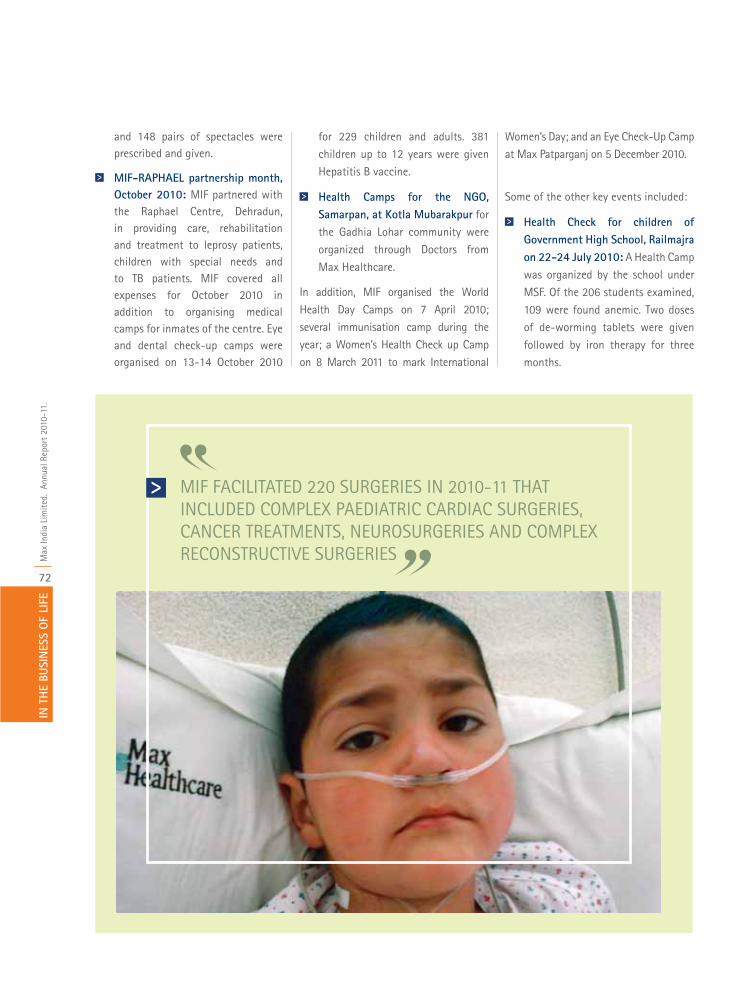
IN T
HE
BUSI
NES
S O
F LI
FEM
ax In
dia
Lim
ited.
Ann
ual R
epor
t 20
10-1
1.
72
and 148 pairs of spectacles were prescribed and given.
MIF-RAPHAEL partnership month, October 2010: MIF partnered with the Raphael Centre, Dehradun, in providing care, rehabilitation and treatment to leprosy patients, children with special needs and to TB patients. MIF covered all expenses for October 2010 in addition to organising medical camps for inmates of the centre. Eye and dental check-up camps were organised on 13-14 October 2010
for 229 children and adults. 381
children up to 12 years were given
Hepatitis B vaccine.
Health Camps for the NGO, Samarpan, at Kotla Mubarakpur for
the Gadhia Lohar community were
organized through Doctors from
Max Healthcare.
In addition, MIF organised the World
Health Day Camps on 7 April 2010;
several immunisation camp during the
year; a Women’s Health Check up Camp
on 8 March 2011 to mark International
Women’s Day; and an Eye Check-Up Camp
at Max Patparganj on 5 December 2010.
Some of the other key events included:
Health Check for children of Government High School, Railmajra on 22-24 July 2010: A Health Camp
was organized by the school under
MSF. Of the 206 students examined,
109 were found anemic. Two doses
of de-worming tablets were given
followed by iron therapy for three
months.
MIF FACILITATED 220 SURGERIES IN 2010-11 THAT INCLUDED COMPLEX PAEDIATRIC CARDIAC SURGERIES, CANCER TREATMENTS, NEUROSURGERIES AND COMPLEX RECONSTRUCTIVE SURGERIES
IN T
HE
BUSI
NES
S O
F LI
FEM
ax In
dia
Lim
ited.
Ann
ual R
epor
t 20
10-1
1.
73
Health Check up Camp with Udayan Ghar: In November 2010, MIF facilitated a comprehensive health check up for 149 children for the NGO Udayan Ghar at various Max Hospitals in Noida, Patparganj, Gurgaon and Panchshila Park.
Eye Check up Camps: During the year, four such camps were organised through which 20 patients were operated for cataract and 48 were given spectacles.
Multi-speciality Health Check at Shastri Market, Moti Bagh: MIF, in collaboration with an NGO called Credence, mobilised the community and 200 patients, who were checked by MHC specialists. Free medicines were also given.
Health Awareness
Leprosy: On the world Leprosy Day, 29 January 2011, MIF contributed to spread awareness about Leprosy, in association with Sasakawa India Leprosy Foundation, to approximately 12,000 people.
Psycho-social and emotional concerns of terminally ill cancer patients: Dr. Samir Parikh, Head of the Department of Psychiatry, Max Hospital spoke on the topic at the 10th Annual Foundation Course in Palliative Care on 21 January 2011 at the India International Centre.
Environment Awareness
MIF has undertaken several steps towards creating awareness on promoting an eco friendly environment. Apart from providing a monthly environment tip, it promoted reduction and recycling of waste paper by using e-communication for MIF updates. It also promoted MIF jute bags to minimise the use of
polythene. Some of the new initiatives undertaken in 2010-11 included:
Clean Delhi Clean Yamuna: MIF and Max Healthcare sponsored and participated in the Art of Living “Clean Delhi NCR Drive” from 6 to 11 September 2010 to spruce up the National Capital ahead of the Commonwealth Games. Students, activists, members of RWAs and local residents all joined en masse to conduct the cleaning and awareness drive.
On the 10th Anniversary of Max New York Life Insurance in October 2010, MIF initiated a Green Plantation Initiative under the metro rail track at Gurgaon.
On Children’s Day in November 2010, MIF organised a painting competition for children of Paediatric wards at Max Hospitals in Delhi and the best paintings were chosen for the MIF 2011 calendar.
Max India Foundation adopted an ‘Artiger’, a project involving artists and companies to raise funds for the Ranthambore Foundation to help Save the Tiger. On 10 January 2011, a life-size figure of the Royal Bengal Tiger painted by Shreyas Karle was installed at Max Super Speciality Hospital, East Wing, Saket to create awareness of the importance of ecological balance.
MIF sponsored ‘Knights of Change’ workshop by Advit Foundation on 18 January 2011 at the Rajiv Gandhi Renewable Energy Park, Gurgaon, in which school children were given an understanding of the carbon footprint and an energy efficient lifestyle.
Team MIF participated in the Eco-Fest Mela called ‘Panchtattva’
organised by middle school students of St. Columba’s on 23 October 2010. MIF Environment Tips were displayed and an Environment Awareness Quiz Competition was organised for the students.
Red Earth with the support of MIF organised plantation of 100 trees at Lado Sarai, New Delhi. Children of Blue Bells School participated in the campaign.
The Climate Project India: MIF has sponsored the Teacher’s Training Initiative for creating awareness on Climate Change in the schools of Delhi.
MIF sponsored a Coffee Table Book by wildlife photographer Baiju Patil as a mark of the group’s commitment to a green, environment friendly world. The book has impressive documentation of wildlife in some of the richest forest reserves of our country.
Social Awareness Films
To mark World Anti-Tobacco Day on 31 May 2010, a short film entitled ‘Six Seconds’ was produced by MIF to make people aware of the ills of smoking. The film was telecast by CNN-IBN and Bloomberg UTV channels, OOH India and DSM LCD screens in Max Hospitals and in more than 150 different locations.
MIF produced a five minute film ‘With a Little Help’ to create awareness of the lives of cancer patients. It was uploaded on MIF’s website, YouTube, Facebook and OOH digital screens.
MIF is the official Global sponsor of the film ’1 a Minute’ — a docu-drama featuring breast cancer survivor celebrities. The film was
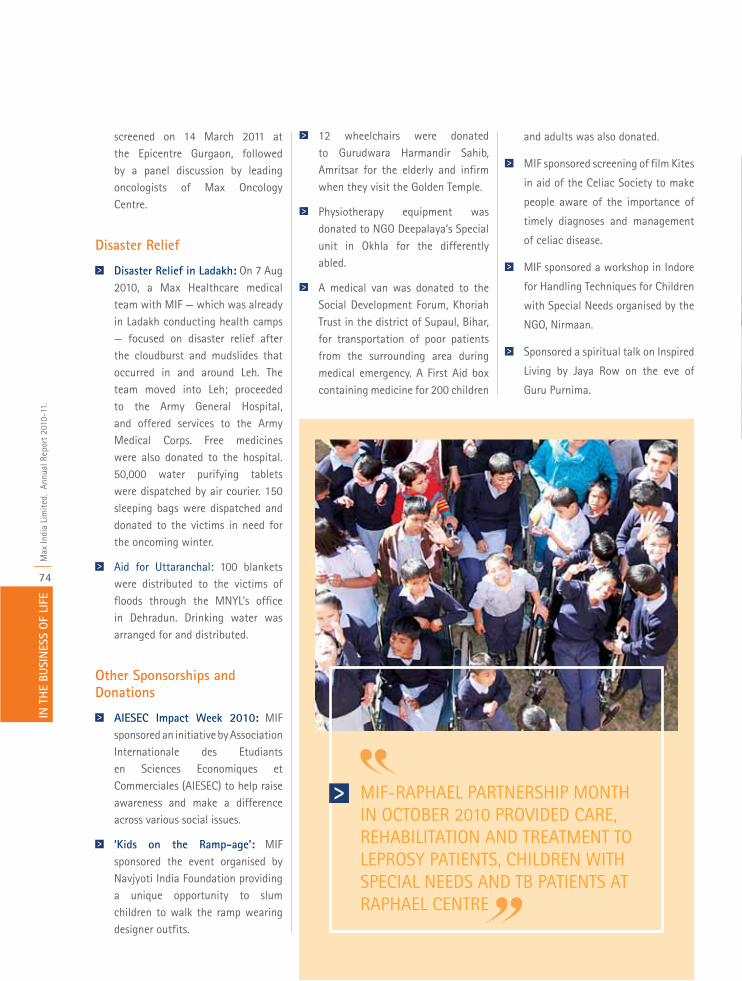
IN T
HE
BUSI
NES
S O
F LI
FEM
ax In
dia
Lim
ited.
Ann
ual R
epor
t 20
10-1
1.
74
screened on 14 March 2011 at the Epicentre Gurgaon, followed by a panel discussion by leading oncologists of Max Oncology Centre.
Disaster Relief
Disaster Relief in Ladakh: On 7 Aug 2010, a Max Healthcare medical team with MIF — which was already in Ladakh conducting health camps — focused on disaster relief after the cloudburst and mudslides that occurred in and around Leh. The team moved into Leh; proceeded to the Army General Hospital, and offered services to the Army Medical Corps. Free medicines were also donated to the hospital. 50,000 water purifying tablets were dispatched by air courier. 150 sleeping bags were dispatched and donated to the victims in need for the oncoming winter.
Aid for Uttaranchal: 100 blankets were distributed to the victims of floods through the MNYL’s office in Dehradun. Drinking water was arranged for and distributed.
Other Sponsorships and Donations
AIESEC Impact Week 2010: MIF sponsored an initiative by Association Internationale des Etudiants en Sciences Economiques et Commerciales (AIESEC) to help raise awareness and make a difference across various social issues.
‘Kids on the Ramp-age’: MIF sponsored the event organised by Navjyoti India Foundation providing a unique opportunity to slum children to walk the ramp wearing designer outfits.
12 wheelchairs were donated to Gurudwara Harmandir Sahib, Amritsar for the elderly and infirm when they visit the Golden Temple.
Physiotherapy equipment was donated to NGO Deepalaya’s Special unit in Okhla for the differently abled.
A medical van was donated to the Social Development Forum, Khoriah Trust in the district of Supaul, Bihar, for transportation of poor patients from the surrounding area during medical emergency. A First Aid box containing medicine for 200 children
MIF-RAPHAEL PARTNERSHIP MONTH IN OCTOBER 2010 PROVIDED CARE, REHABILITATION AND TREATMENT TO LEPROSY PATIENTS, CHILDREN WITH SPECIAL NEEDS AND TB PATIENTS AT RAPHAEL CENTRE
and adults was also donated.
MIF sponsored screening of film Kites
in aid of the Celiac Society to make
people aware of the importance of
timely diagnoses and management
of celiac disease.
MIF sponsored a workshop in Indore
for Handling Techniques for Children
with Special Needs organised by the
NGO, Nirmaan.
Sponsored a spiritual talk on Inspired
Living by Jaya Row on the eve of
Guru Purnima.
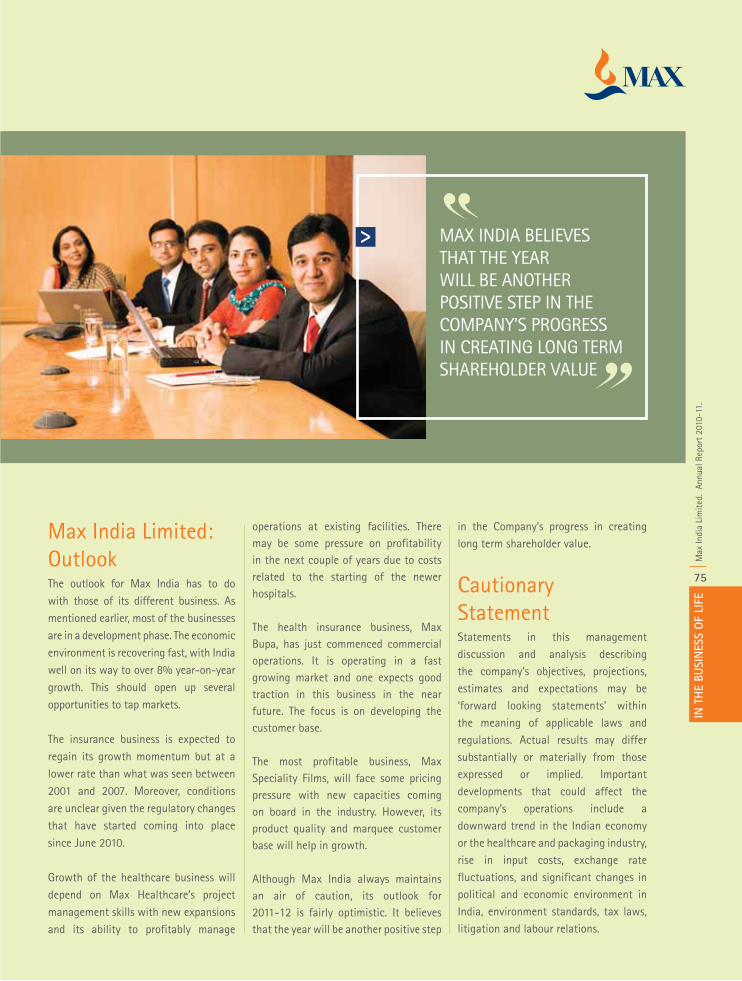
IN T
HE
BUSI
NES
S O
F LI
FEM
ax In
dia
Lim
ited.
Ann
ual R
epor
t 20
10-1
1.
75
Max India Limited: Outlook The outlook for Max India has to do with those of its different business. As mentioned earlier, most of the businesses are in a development phase. The economic environment is recovering fast, with India well on its way to over 8% year-on-year growth. This should open up several opportunities to tap markets.
The insurance business is expected to regain its growth momentum but at a lower rate than what was seen between 2001 and 2007. Moreover, conditions are unclear given the regulatory changes that have started coming into place since June 2010.
Growth of the healthcare business will depend on Max Healthcare’s project management skills with new expansions and its ability to profitably manage
operations at existing facilities. There may be some pressure on profitability in the next couple of years due to costs related to the starting of the newer hospitals.
The health insurance business, Max Bupa, has just commenced commercial operations. It is operating in a fast growing market and one expects good traction in this business in the near future. The focus is on developing the customer base.
The most profitable business, Max Speciality Films, will face some pricing pressure with new capacities coming on board in the industry. However, its product quality and marquee customer base will help in growth.
Although Max India always maintains an air of caution, its outlook for 2011-12 is fairly optimistic. It believes that the year will be another positive step
in the Company’s progress in creating long term shareholder value.
Cautionary Statement Statements in this management discussion and analysis describing the company’s objectives, projections, estimates and expectations may be ‘forward looking statements’ within the meaning of applicable laws and regulations. Actual results may differ substantially or materially from those expressed or implied. Important developments that could affect the company’s operations include a downward trend in the Indian economy or the healthcare and packaging industry, rise in input costs, exchange rate fluctuations, and significant changes in political and economic environment in India, environment standards, tax laws, litigation and labour relations.
MAX INDIA BELIEVES THAT THE YEAR WILL BE ANOTHER POSITIVE STEP IN THE COMPANY’S PROGRESS IN CREATING LONG TERM SHAREHOLDER VALUE
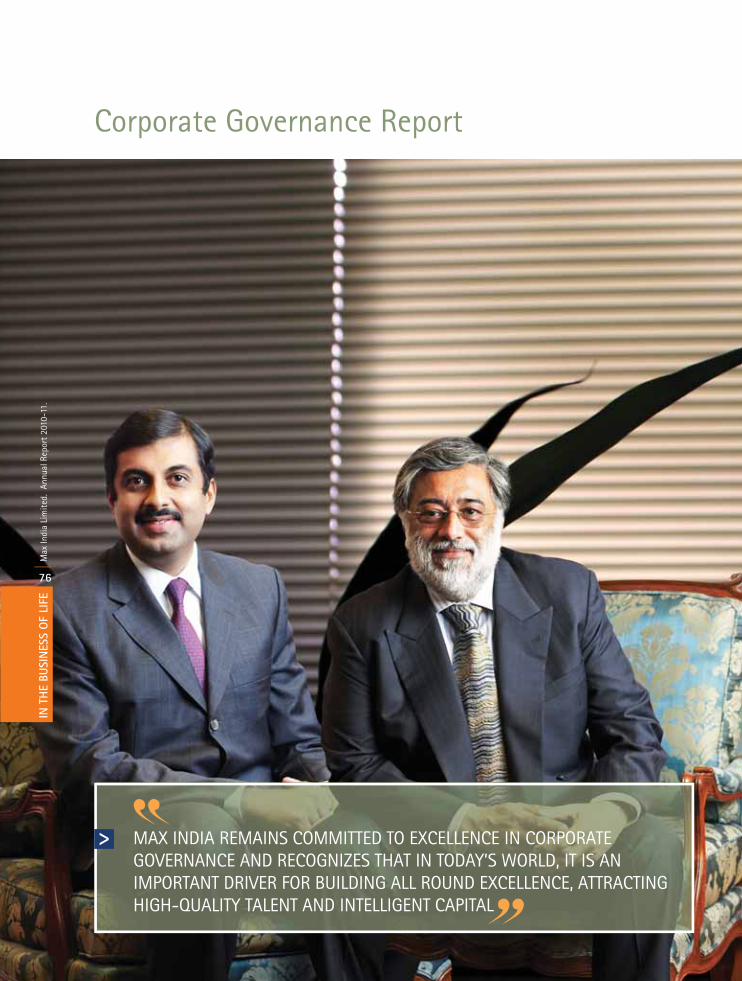
IN T
HE
BUSI
NES
S O
F LI
FEM
ax In
dia
Lim
ited.
Ann
ual R
epor
t 20
10-1
1.
76
MAX INDIA REMAINS COMMITTED TO EXCELLENCE IN CORPORATE GOVERNANCE AND RECOGNIZES THAT IN TODAY’S WORLD, IT IS AN IMPORTANT DRIVER FOR BUILDING ALL ROUND EXCELLENCE, ATTRACTING HIGH-QUALITY TALENT AND INTELLIGENT CAPITAL
Corporate Governance Report
IN T
HE
BUSI
NES
S O
F LI
FEM
ax In
dia
Lim
ited.
Ann
ual R
epor
t 20
10-1
1.
77
IN T
HE
BUSI
NES
S O
F LI
FEM
ax In
dia
Lim
ited.
Ann
ual R
epor
t 20
10-1
1.
78
Philosophy of Corporate GovernanceMax India remains committed to excellence in Corporate Governance and recognizes that in today’s world, it is an important driver for building all round excellence, attracting high-quality talent and intelligent capital.
Your company and its subsidiaries have made significant progress in this area since the last 3 years. We continue to have competent and highly active Boards; an enhanced interface between Management, Committees and the Boards in all operating entities.
There is a highly structured, efficient and result oriented Governance process with a clear system of Board functioning. A clear role has been defined for the Promoter family and its interests are represented in the Board through a nominee to ensure that the Promoter does not have to face conflict of interest while facilitating the Board Governance process. To further support good Governance, role clarity and increased focus, the Board has decided to appoint a Managing Director for Max India. The new MD, Rahul Khosla, a seasoned management professional will take charge from 18th August 2011 and will strengthen the leadership and managerial competence at Max India. The principles of Board Governance that
Max India follows are:
Multi-level governance - The Board functions through specialized committees, formed on the basis of business needs, e.g. Actuarial Committee for the life insurance business. Each committee has well defined charters and forms the first level of governance. The Board takes decision which these committees are not empowered to take.
A check and balance based structure – The Board has instituted a maker-checker principle as the risks and complexities in today’s business environment are significant. The executives are the decision makers, the sub-committees and Board is the checker. However, the result and accountability rest with the management.
Inspect what you expect – By inviting outside experts, conducting mystery shopping and such measures.
Strong belief in measures of success – We decide what success means to us. All companies have a dashboard, which is not only a financial measure, but is geared to long term success.
Decisions based on facts not opinion – We also invite renowned experts and consultants periodically to provide insights and external perspective in critical business areas. We benchmark by sending teams to other similar industries. Lots of
numerical data comes to the board, to read, get prepared.
The efforts of the last three years have shown clear and tangible results. A case in point has been during the difficult phase in 2010, where, resulting from unexpected regulatory changes in the Life Insurance sector, one of Max India’s subsidiaries MNYL was able to leverage the strengths of its Board, to not only tide over challenging business scenario but emerge stronger. Max India’s commitment to Corporate Governance has thus allowed it to lead by example and set benchmarks for Governance models.
Board CompositionYour Board of Directors currently comprises of eleven members with an Executive Director and ten Non-Executive Directors of which seven are independent. Mr. Analjit Singh, Chairman & Managing Director of the Company is a Promoter Director. No Director is a member in more than ten committees, or the Chairman of more than five committees, across all public companies in which he is a Director.
The composition of Directors and the attendance at the Board meeting during the year 2010-11 and at the last annual general meeting, including the details of their directorships and committee memberships as of March 31, 2011 are given below:
Director Board meetings attended
Attendance at last AGM
Directorships* Memberships/Chairmanships of
Board Committees**
Mr. Analjit Singh[Promoter Director]
6 � 14 Nil
Mr. Anuroop Singh[Non-Executive Director]
3 -- 04 Nil
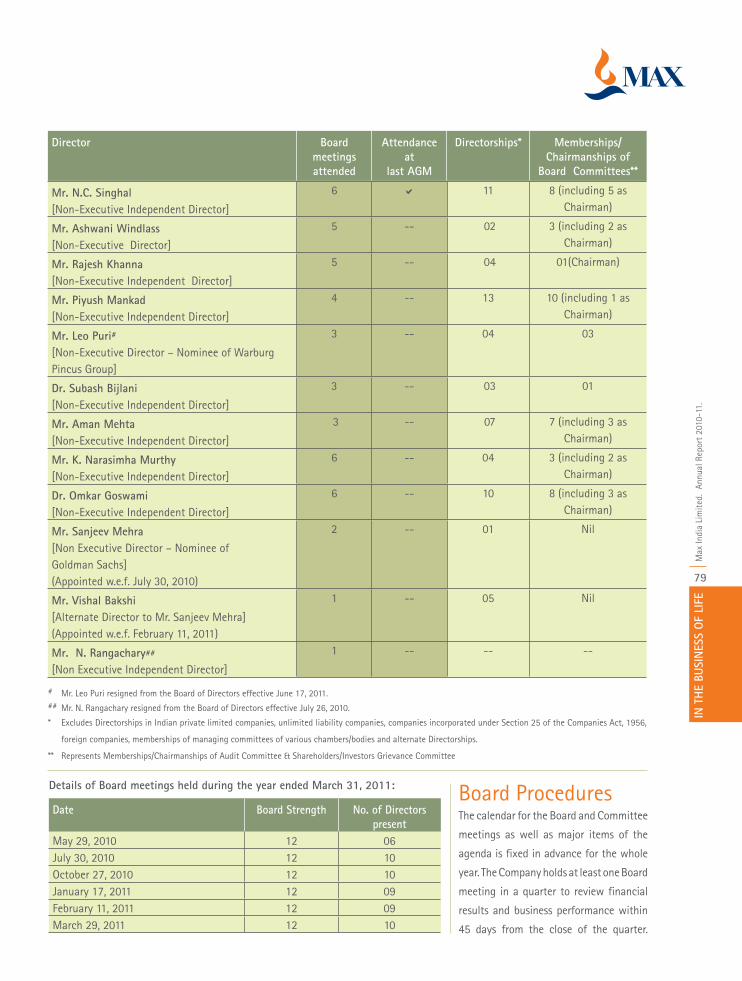
IN T
HE
BUSI
NES
S O
F LI
FEM
ax In
dia
Lim
ited.
Ann
ual R
epor
t 20
10-1
1.
79
Mr. N.C. Singhal[Non-Executive Independent Director]
6 � 11 8 (including 5 as Chairman)
Mr. Ashwani Windlass[Non-Executive Director]
5 -- 02 3 (including 2 as Chairman)
Mr. Rajesh Khanna[Non-Executive Independent Director]
5 -- 04 01(Chairman)
Mr. Piyush Mankad [Non-Executive Independent Director]
4 -- 13 10 (including 1 as Chairman)
Mr. Leo Puri#
[Non-Executive Director – Nominee of Warburg Pincus Group]
3 -- 04 03
Dr. Subash Bijlani[Non-Executive Independent Director]
3 -- 03 01
Mr. Aman Mehta [Non-Executive Independent Director]
3 -- 07 7 (including 3 as Chairman)
Mr. K. Narasimha Murthy[Non-Executive Independent Director]
6 -- 04 3 (including 2 as Chairman)
Dr. Omkar Goswami[Non-Executive Independent Director]
6 -- 10 8 (including 3 as Chairman)
Mr. Sanjeev Mehra[Non Executive Director – Nominee of Goldman Sachs](Appointed w.e.f. July 30, 2010)
2 -- 01 Nil
Mr. Vishal Bakshi[Alternate Director to Mr. Sanjeev Mehra] (Appointed w.e.f. February 11, 2011)
1 -- 05 Nil
Mr. N. Rangachary##
[Non Executive Independent Director]
1 -- -- --
# Mr. Leo Puri resigned from the Board of Directors effective June 17, 2011.## Mr. N. Rangachary resigned from the Board of Directors effective July 26, 2010.
* Excludes Directorships in Indian private limited companies, unlimited liability companies, companies incorporated under Section 25 of the Companies Act, 1956,
foreign companies, memberships of managing committees of various chambers/bodies and alternate Directorships.
** Represents Memberships/Chairmanships of Audit Committee & Shareholders/Investors Grievance Committee
Details of Board meetings held during the year ended March 31, 2011:
Date Board Strength No. of Directors present
May 29, 2010 12 06July 30, 2010 12 10October 27, 2010 12 10January 17, 2011 12 09February 11, 2011 12 09March 29, 2011 12 10
Board ProceduresThe calendar for the Board and Committee
meetings as well as major items of the
agenda is fixed in advance for the whole
year. The Company holds at least one Board
meeting in a quarter to review financial
results and business performance within
45 days from the close of the quarter.
Director Board meetings attended
Attendance at
last AGM
Directorships* Memberships/Chairmanships of
Board Committees**
IN T
HE
BUSI
NES
S O
F LI
FEM
ax In
dia
Lim
ited.
Ann
ual R
epor
t 20
10-1
1.
80
The gap between two board meetings does not exceed four calendar months. Apart from aforesaid four meetings, for urgent requirements, additional board meetings are also convened. Matters of exigency are approved by the Directors by resolutions passed by circulation as permissible under the provisions of the Companies Act, 1956.
Meetings of all Committees of Board are held prior to the Board meeting. To ensure updation to the Board, the Chairman of the respective Committee briefs the Board about the proceedings of the Committee meetings.
All Agenda items are accompanied by comprehensive notes on the related subject and in certain areas such as business plans/business reviews and financial results, detailed presentations are made to the Board members. Additionally, the Directors recommend inclusion of any matter for discussion.
To enable the Board to discharge its responsibilities effectively, members of the Board are briefed at every Board meeting, on the overall performance of the Company and it’s subsidiaries/joint ventures. The Board has complete access to all the relevant information within the Company and all its employees. Senior Management is invited to attend the Board meetings to provide detailed insight into the items being discussed.
Code of ConductIn compliance with Clause 49 of the Listing Agreement with Stock Exchanges, the Company had adopted a Code of Conduct for the Directors and Employees of the Company, a copy of which is available on the Company’s website viz., www.maxindia.com. All the members of the Board of Directors
and senior management personnel had affirmed compliance with the Code for the financial year ended March 31, 2011 and declaration to this effect signed by the Chairman & Managing Director is forming part of this report.
Pursuant to the requirements of the SEBI (Prohibition of Insider Trading) Regulations, 1992 as amended, the Company has adopted an Insider Trading Policy for prevention of insider trading, which is applicable to all the Directors and designated employees.
Committees of The BoardAudit CommitteeThe Audit Committee of the Company currently comprises of Mr. N.C. Singhal (Chairman), Mr. Ashwani Windlass and Mr. K. Narasimha Murthy. All members of the Committee, except Mr. Ashwani Windlass are Independent Directors. Mr. N. Rangachary and Mr. Leo Puri ceased to be members of this Committee effective July 26, 2010 and June 17, 2011, respectively, in view of their resignation from the Board. The Company Secretary of the Company acts as the Secretary of this Committee. This Committee inter alia, recommends appointment of statutory auditors; reviews Company’s financial reporting processes and systems; reviews financial and risk management policies; Company’s financial statements, including annual and quarterly financial results; and financial accounting practices & policies. The scope of the audit committee has been defined by the Board of Directors in accordance with Clause 49 of the Listing Agreement and Section 292A of the Act. The Internal Auditors and representatives of Statutory Auditors are invited to the meetings of the Committee, as required. Mr. N.C. Singhal, the Chairman of the Audit Committee, was present at the last Annual General Meeting.
Meetings & attendance during the year ended March 31, 2011:
Director Number of meetings held
Number of meetings attended
Mr. N. C. Singhal 09 09Mr. Ashwani Windlass 09 08Mr. K. Narasimha Murthy
09 08
Mr. Leo Puri 09 05Mr. N. Rangachary * 03 02
* Mr. N. Rangachary resigned from the Board of Directors effective July 26, 2010.
Remuneration CommitteeAs of March 31, 2011, this Committee comprised of Mr. Rajesh Khanna (Chairman), Mr. N.C. Singhal, Mr. Ashwani Windlass, Mr. Piyush Mankad and Mr. Leo Puri, out of which, Mr. Rajesh Khanna, Mr. N.C. Singhal and Mr. Piyush Mankad are Independent Directors. Mr. Leo Puri ceased to be a member of this Committee effective June 17, 2011 in view of resignation from the Board. This Committee evaluates compensations and benefits for Executive Directors and Senior Executives
IN T
HE
BUSI
NES
S O
F LI
FEM
ax In
dia
Lim
ited.
Ann
ual R
epor
t 20
10-1
1.
81
Shareholders/Investors Grievance CommitteeThe Committee comprises of Mr. Ashwani Windlass (Chairman), Mr. Piyush Mankad and Mr. N. C. Singhal. Key responsibilities of this Committee are formulation of procedures in line with the statutory guidelines to ensure speedy disposal of various requests received from shareholders from time to time, redressal of shareholders and investor complaints/grievances. The Committee also approves the transfer and transmission of securities; issuance of duplicate certificates, etc.
Meetings & attendance during the year ended March 31, 2011:
Director Number of meetings
held
Number of meetings attended
Mr. Ashwani Windlass
04 03
Mr. Piyush Mankad
04 04
Mr. N.C. Singhal
04 04
Besides, Mr. V. Krishnan, Company Secretary & Compliance Officer has been authorized to effect transfer of shares upto 1000 per folio. The Company has normally attended to the Shareholders/Investors complaints within a period of 7 working days except in cases which were under legal proceedings/disputes. During the financial year ended March 31, 2011, 38 complaints/queries were received by the Company, which were general in nature viz., issues relating to non-receipt of dividend, annual reports, shares, etc., which were resolved to the satisfaction of the respective shareholders.
at one level below the Board, recruitment of key managerial personnel and finalise their compensation, induction of Executive and Non Executive Directors and fix the method, criteria and quantum of compensation to be paid to the Non Executive Directors and administers the ESOP Scheme of the Company including allotment of equity shares arising from exercise of stock options. The remuneration policy of the Company is aimed at attracting and retaining the best talent to leverage performance in a significant manner. The strategy takes into account, the remuneration trends, talent market and competitive requirements.
Meetings & attendance during the year ended March 31, 2011:Director Number of meetings
heldNumber of meetings
attendedMr. Rajesh Khanna 03 03
Mr. N.C. Singhal 03 03
Mr. Ashwani Windlass 03 02
Mr. Leo Puri 03 01
Mr. Piyush Mankad 03 03
Remuneration paid to Directors during 2010-2011The Company has not paid any remuneration to its Non-Executive Directors, except for the Sitting Fee for attending meetings of the Board/Committees. Details of the remuneration charged to profit and loss account in respect of Mr. Analjit Singh, Chairman & Managing Director of the Company for the year ended March 31, 2011 are as under:
Description Amount in `Salary 49,939,240
Benefits (Perquisites) 7,227,057
Performance Incentive 39,770,936
Retirals 3,240,000
Service contract --
Notice period 3 months
Stock options, if any (in numbers) --
Remuneration for the current year also includes an amount of `45,914,750 relating to earlier year for which the company has received Central Government approval during the current year and hence the same has been charged to Profit & Loss account in the current year.
Details of equity shares of `2/- each held by Directors of the Company as on March 31, 2011 are: (a) Mr. Analjit Singh - 58,76,789 shares, (b) Mr. N.C. Singhal – 25,000 Shares (c) Mr. Ashwani Windlass – 1,28,800 shares, (d) Mr. Piyush Mankad - 5,000 shares, (e) Dr. Subash Bijlani – 5,000 shares and (f) Mr. Aman Mehta – 5,000 shares.
IN T
HE
BUSI
NES
S O
F LI
FEM
ax In
dia
Lim
ited.
Ann
ual R
epor
t 20
10-1
1.
82
Date TimeSeptember 16, 2008 10:00 AM
September 23, 2009 10:30 AM
September 15, 2010 10:30 AM
The following special resolutions were passed by the shareholders in the previous three AGMs:
Date of AGM Subject matter of the resolutionSeptember 16, 2008 Approval for making investment upto an amount of `100 Crores in the equity share capital of
a joint venture company for Health Insurance business in collaboration with Bupa Finance Plc., UK.
September 23, 2009 Approval for payment of managerial remuneration to Mr. Analjit Singh, Chairman & Managing Director of the Company for the balance period of his tenure as the Chairman & Managing Director i.e., April 1, 2009 to October 29, 2010.
Approval for making further investment of upto `1000 crore in Max New York Life Insurance Company Limited, a subsidiary of the Company.
Approval for making investment upto an amount of `100 crore in Max Bupa Health Insurance Company Limited, being 74% of the contribution towards its equity share capital.
Approval for providing Corporate Guarantees/Securities upto an amount not exceeding `500 crore on behalf of Max Healthcare Institute Limited, a subsidiary of the Company through postal ballot.
Approval for making further investment in or providing loans to Max Healthcare Institute Limited, upto an amount not exceeding `150 crore through postal ballot.
Investment & Finance CommitteeAs of March 31, 2011, this Committee comprised of Mr. Ashwani Windlass (Chairman), Mr. N.C. Singhal, Mr. Leo Puri, Dr. Omkar Goswami, Mr. K. Narasimha Murthy, Dr. Subash Bijlani and Mr. Sanjeev Mehra. Mr. Leo Puri ceased to be a member of this Committee effective June 17, 2011 in view of resignation from the Board. The responsibilities of this Committee are to review financial performance of businesses carried on by the Company and its subsidiaries, review and recommend revenue and capital budgets of the Company and its subsidiaries, review and recommend various fund raising options and financial resources allocation to Company’s divisions and subsidiaries and to review proposals on business restructuring, mergers, consolidations
acquisitions, investments, establishment of joint ventures and divestments of any businesses, etc. This Committee also has the mandate concerning banking operations matters. During the year under review, Mr. Sanjeev Mehra was co-opted as a member of this Committee and Mr. Vishal Bakshi as his Alternate. This Committee met eight times during the year ended March 31, 2011.
Disclosures(a) Related party transactionsThe Company has not entered into any transaction of a material nature with the promoters, Directors or the management, their subsidiaries or relatives, etc., that may have any potential conflict with the interest of the Company.
Statements/disclosures of all related party transactions are placed before the Audit Committee on a quarterly basis in terms of Clause 49 (IV)(A) and other
applicable laws.
(b) Compliance by the CompanyThe Company has complied with the requirements of the stock exchanges, SEBI and other statutory authorities on all matters relating to capital markets during the last three years. No penalties or strictures have been imposed on the Company by the stock exchanges, SEBI, or any other statutory authorities on any matter relating to capital markets during the last three years.
General body meetingsThe Annual General Meetings (AGMs) of the Company is held at the Registered Office of the Company at Bhai Mohan Singh Nagar, Railmajra, Tehsil Balachaur, District Nawanshahr, Punjab - 144533. The last three AGMs were held as under:
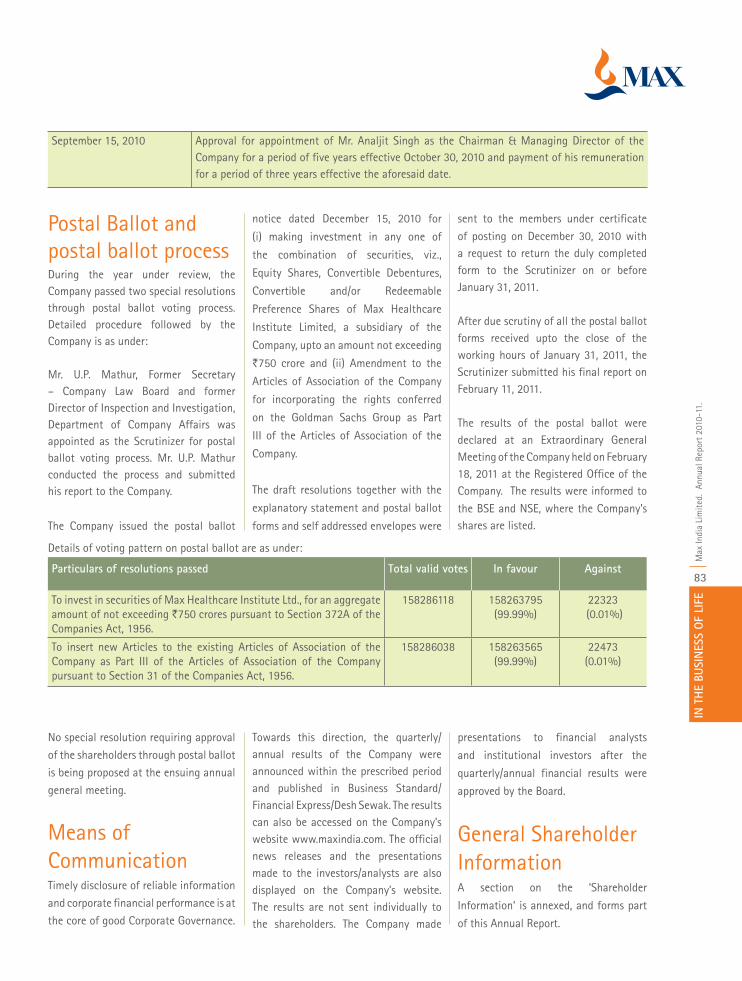
IN T
HE
BUSI
NES
S O
F LI
FEM
ax In
dia
Lim
ited.
Ann
ual R
epor
t 20
10-1
1.
83
September 15, 2010 Approval for appointment of Mr. Analjit Singh as the Chairman & Managing Director of the Company for a period of five years effective October 30, 2010 and payment of his remuneration for a period of three years effective the aforesaid date.
Postal Ballot and postal ballot processDuring the year under review, the Company passed two special resolutions through postal ballot voting process. Detailed procedure followed by the Company is as under:
Mr. U.P. Mathur, Former Secretary – Company Law Board and former Director of Inspection and Investigation, Department of Company Affairs was appointed as the Scrutinizer for postal ballot voting process. Mr. U.P. Mathur conducted the process and submitted his report to the Company.
The Company issued the postal ballot
No special resolution requiring approval
of the shareholders through postal ballot
is being proposed at the ensuing annual
general meeting.
Means of CommunicationTimely disclosure of reliable information
and corporate financial performance is at
the core of good Corporate Governance.
notice dated December 15, 2010 for
(i) making investment in any one of
the combination of securities, viz.,
Equity Shares, Convertible Debentures,
Convertible and/or Redeemable
Preference Shares of Max Healthcare
Institute Limited, a subsidiary of the
Company, upto an amount not exceeding
`750 crore and (ii) Amendment to the
Articles of Association of the Company
for incorporating the rights conferred
on the Goldman Sachs Group as Part
III of the Articles of Association of the
Company.
The draft resolutions together with the
explanatory statement and postal ballot
forms and self addressed envelopes were
Towards this direction, the quarterly/annual results of the Company were announced within the prescribed period and published in Business Standard/Financial Express/Desh Sewak. The results can also be accessed on the Company’s website www.maxindia.com. The official news releases and the presentations made to the investors/analysts are also displayed on the Company’s website. The results are not sent individually to the shareholders. The Company made
sent to the members under certificate
of posting on December 30, 2010 with a request to return the duly completed form to the Scrutinizer on or before January 31, 2011.
After due scrutiny of all the postal ballot forms received upto the close of the working hours of January 31, 2011, the Scrutinizer submitted his final report on February 11, 2011.
The results of the postal ballot were declared at an Extraordinary General Meeting of the Company held on February 18, 2011 at the Registered Office of the Company. The results were informed to
the BSE and NSE, where the Company’s shares are listed.
presentations to financial analysts
and institutional investors after the
quarterly/annual financial results were
approved by the Board.
General Shareholder InformationA section on the ‘Shareholder
Information’ is annexed, and forms part
of this Annual Report.
Details of voting pattern on postal ballot are as under:
Particulars of resolutions passed Total valid votes In favour Against
To invest in securities of Max Healthcare Institute Ltd., for an aggregate amount of not exceeding `750 crores pursuant to Section 372A of the Companies Act, 1956.
158286118 158263795 (99.99%)
22323 (0.01%)
To insert new Articles to the existing Articles of Association of the Company as Part III of the Articles of Association of the Company pursuant to Section 31 of the Companies Act, 1956.
158286038 158263565 (99.99%)
22473(0.01%)
IN T
HE
BUSI
NES
S O
F LI
FEM
ax In
dia
Lim
ited.
Ann
ual R
epor
t 20
10-1
1.
84
Management Discussion & AnalysisA section on the ‘Management Discussion & Analysis’ is annexed and forms part of this Annual Report.
Compliance Certificate on Corporate GovernanceM/s S. Mani & Associates, Company Secretaires have certified that the Company has complied with the conditions of Corporate Governance as stipulated in Clause 49 of the Listing Agreement with Stock Exchanges and the same is annexed to the Report.
Non-mandatory requirementsDetails of non-mandatory requirements of clause 49 to the extent to which the Company has adopted are given below:
The Company has set up a Remuneration Committee, with an independent director as its Chairman, to determine on their behalf and on behalf of the shareholders with agreed terms of reference, the Company’s policy on specific remuneration packages for Executive Directors including pension rights and any compensation payment. There is no audit qualification in respect of financial statements of the Company. All Board members are experts in their respective fields. They are well aware of the business model as well as the risk profile of the Company. Remaining non-mandatory requirements of clause 49 are expected to be addressed in due course.
Declaration by the C&MD on code of conduct as required by clause 49 I (D) (ii)This is to declare that the Company has received affirmations of compliance with the provisions of Company’s Code of Conduct for the financial year ended March 31, 2011 from all Directors and Senior Management personnel of the Company.
For Max India Limited
Analjit SinghNew Delhi Chairman & August 17, 2011 Managing Director
IN T
HE
BUSI
NES
S O
F LI
FEM
ax In
dia
Lim
ited.
Ann
ual R
epor
t 20
10-1
1.
85
August 17, 2011
The Board of Directors Max India Limited Bhai Mohan Singh Nagar, Railmajra,Tehsil Balachaur,Dist. NawanshahrPunjab – 144 533
We, Analjit Singh, Chairman & Managing Director and Sujatha Ratnam, Chief Financial Controller of Max India Limited certify to the Board in terms of the requirement of Clause 49(V) of the listing agreement, that we have reviewed the financial statement and the cash flow statement of the Company for the financial year ended March 31, 2011.
1. To the best of our knowledge, we certify that:
(a) these statements do not contain any materially untrue statement or omit any material fact or contain statements that are misleading;
(b) these statements together present a true and fair view of the Company’s affairs and are in compliance with existing accounting standards, applicable laws and regulations; and
(c) there are no transactions entered into by the Company during the year which are fraudulent, illegal or violative of the Company’s Code of Conduct.
2. For the purposes of financial reporting, we accept the responsibility for establishing and maintaining internal controls and that we have evaluated the effectiveness of the internal control systems of the Company pertaining to financial reporting and we have disclosed to the Auditors and the Audit Committee, deficiencies in the design or operation of internal controls (if any), and further state that the internal control systems are adequate, commensurate with the size of business.
3. We do further certify that there has been:
(a) no significant changes in internal controls during the year; (b) no significant changes in accounting policies during the year; and (c) no instances of fraud, of which we are aware during the period.
Analjit Singh Sujatha Ratnam Chairman & Managing Director Chief Financial Controller
Certification by Chairman & Managing Director and Chief Financial Controller
IN T
HE
BUSI
NES
S O
F LI
FEM
ax In
dia
Lim
ited.
Ann
ual R
epor
t 20
10-1
1.
85
IN T
HE
BUSI
NES
S O
F LI
FEM
ax In
dia
Lim
ited.
Ann
ual R
epor
t 20
10-1
1.
86
To the Members of Max India Limited,
We have examined the compliance of conditions of Corporate Governance by Max India Limited for the year ended March 31, 2011 as stipulated in Clause 49 of the Listing Agreements of the said Company with stock exchanges in India.
The compliance of conditions of Corporate Governance is the responsibility of the Company’s management. Our examination was carried out in accordance with the Guidance Note on Certification of Corporate Governance (as stipulated in Clause 49 of the Listing Agreement) issued by the Institute of Company Secretaries of India and was limited to procedures and implementation thereof, adopted by the Company for ensuring the compliance of the conditions of Corporate Governance. It is neither an audit nor an expression of opinion on the financial statements of the Company.
In our opinion and to the best of our information and according to the explanations/representations given to us/made by the management of the Company, we certify that the Company has complied with the conditions of Corporate Governance as stipulated in the above mentioned Clause 49 of the Listing Agreements.
We state that such compliance is neither an assurance as to the future viability of the Company nor the efficiency or effectiveness with which the management has conducted the affairs of the Company.
For S. Mani & Associates Company Secretaries
Mani Srinivasan FCS 3799New Delhi CP 2848August 17, 2011 Company Secretary in Practice
Certificate Regarding Compliance of Conditions of Corporate Governance

IN T
HE
BUSI
NES
S O
F LI
FEM
ax In
dia
Lim
ited.
Ann
ual R
epor
t 20
10-1
1.
87
Shareholders’ Information
Registered Office and Plant LocationBhai Mohan Singh Nagar, Railmajra, Tehsil Balachaur, District Nawanshahr, Punjab- 144533.
Investor HelplineMax House, 1, Dr. Jha Marg, Okhla, Phase III, New Delhi - 110 020.Tel: 011-42598000Fax: 011-26324126E-mail: [email protected]
Share Transfer AgentMas Services Limited, T-34, 2nd Floor, Okhla Industrial Area, Phase - II New Delhi - 110 020.Tel: 011-26387281 / 82 / 83Fax: 011-26387384E-mail: [email protected]
Annual General MeetingDate and Time: Tuesday, September 27, 2011 at 11.00 amVenue: Registered Office of the Company
Book Closure Tuesday, September 20, 2011 to Tuesday, September 27, 2011 (both days inclusive)
Financial Calendar, 2011 - 20121. First quarter results - By August 14, 2011
2. Second quarter & half yearly results - By November 15, 2011
3. Third quarter results - By February 15, 2012
4. Annual results - By end of May 2012
Listing on Stock ExchangesThe Equity Shares of the Company are listed on the Bombay Stock Exchange Limited (‘BSE’) and the National Stock Exchange of India Limited (‘NSE’). The Company confirms that it has paid annual listing fees due to BSE and NSE for the year 2011-12.
Connectivity with Depositories The Company’s shares are in dematerialized mode through National Securities Depository Limited (NSDL) and Central Depository Services (India) Limited (CDSL).
Stock Code Bombay Stock Exchange Limited - 500271National Stock Exchange of India Limited - MAXDemat ISIN No. for NSDL and CDSL - INE180A01020
Reuters BloombergBombay Stock Exchange MAXI.BO MAX:IN
National Stock Exchange MAXI.NS NMAX:IN
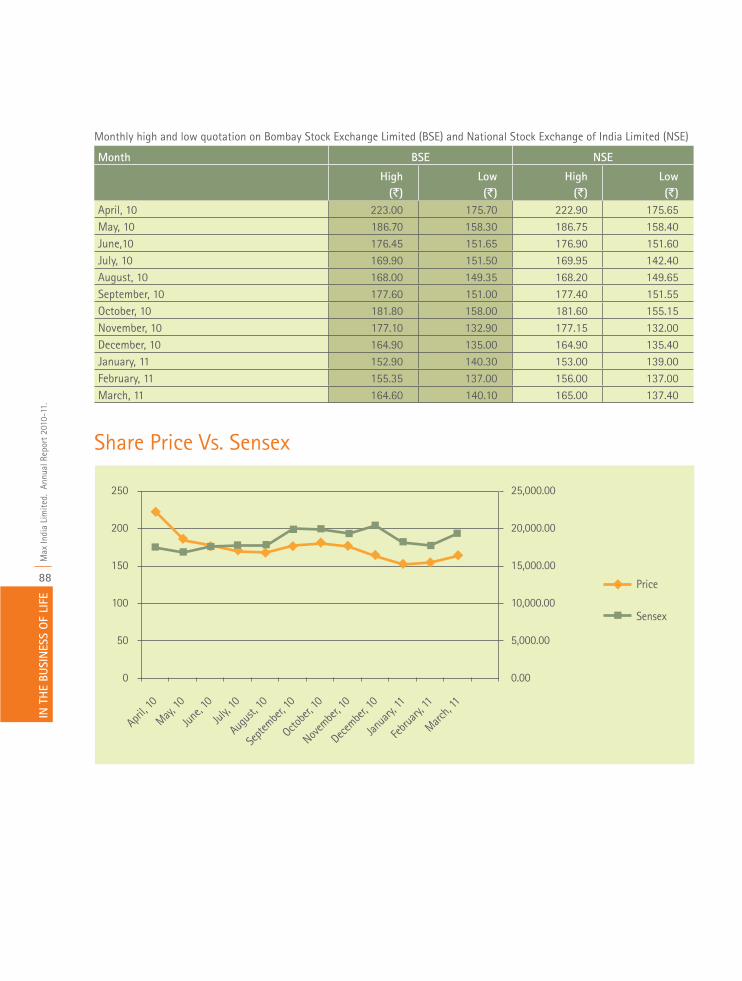
IN T
HE
BUSI
NES
S O
F LI
FEM
ax In
dia
Lim
ited.
Ann
ual R
epor
t 20
10-1
1.
88
Monthly high and low quotation on Bombay Stock Exchange Limited (BSE) and National Stock Exchange of India Limited (NSE)
Month BSE NSE
High (`)
Low(`)
High (`)
Low(`)
April, 10 223.00 175.70 222.90 175.65May, 10 186.70 158.30 186.75 158.40June,10 176.45 151.65 176.90 151.60July, 10 169.90 151.50 169.95 142.40August, 10 168.00 149.35 168.20 149.65September, 10 177.60 151.00 177.40 151.55October, 10 181.80 158.00 181.60 155.15November, 10 177.10 132.90 177.15 132.00December, 10 164.90 135.00 164.90 135.40January, 11 152.90 140.30 153.00 139.00February, 11 155.35 137.00 156.00 137.00March, 11 164.60 140.10 165.00 137.40
250
200
150
100
50
0
25,000.00
20,000.00
15,000.00
10,000.00
5,000.00
0.00
April, 1
0
May, 10
June,
10
July, 1
0
Augus
t, 10
Septe
mber, 1
0
Octobe
r, 10
Novem
ber, 1
0
Decem
ber, 1
0
Janua
ry, 11
Febru
ary, 11
March,
11
Price
Sensex
Share Price Vs. Sensex
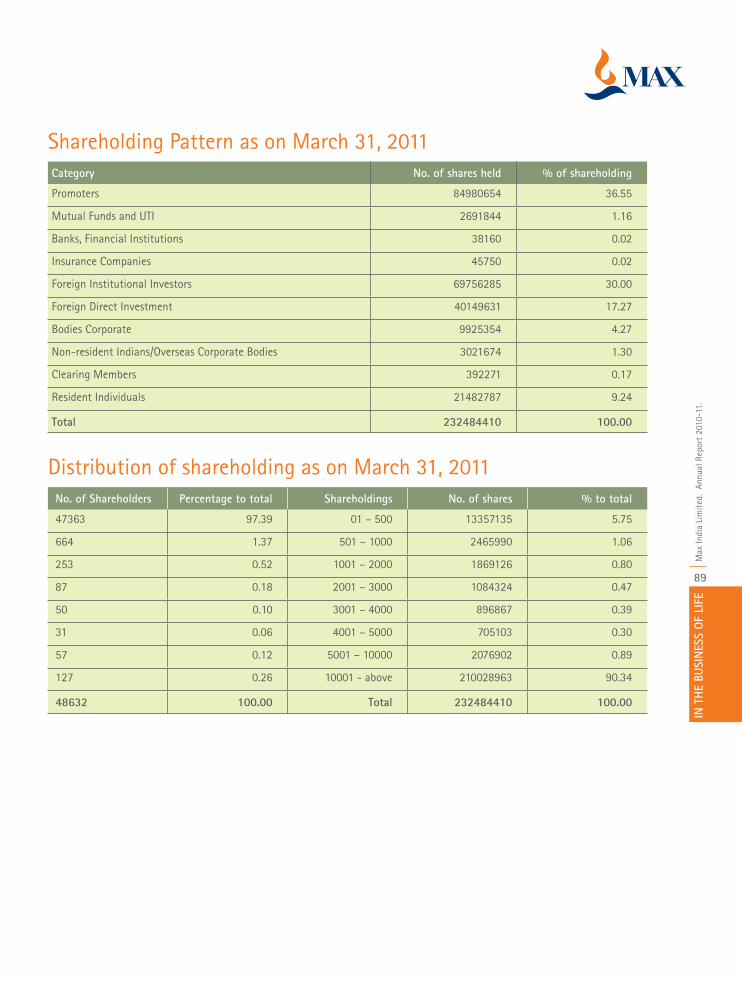
IN T
HE
BUSI
NES
S O
F LI
FEM
ax In
dia
Lim
ited.
Ann
ual R
epor
t 20
10-1
1.
89
Shareholding Pattern as on March 31, 2011Category No. of shares held % of shareholding
Promoters 84980654 36.55
Mutual Funds and UTI 2691844 1.16
Banks, Financial Institutions 38160 0.02
Insurance Companies 45750 0.02
Foreign Institutional Investors 69756285 30.00
Foreign Direct Investment 40149631 17.27
Bodies Corporate 9925354 4.27
Non-resident Indians/Overseas Corporate Bodies 3021674 1.30
Clearing Members 392271 0.17
Resident Individuals 21482787 9.24
Total 232484410 100.00
Distribution of shareholding as on March 31, 2011No. of Shareholders Percentage to total Shareholdings No. of shares % to total
47363 97.39 01 – 500 13357135 5.75
664 1.37 501 – 1000 2465990 1.06
253 0.52 1001 – 2000 1869126 0.80
87 0.18 2001 – 3000 1084324 0.47
50 0.10 3001 – 4000 896867 0.39
31 0.06 4001 – 5000 705103 0.30
57 0.12 5001 – 10000 2076902 0.89
127 0.26 10001 - above 210028963 90.34
48632 100.00 Total 232484410 100.00
Dematerialisation status as on March 31, 2011(i) Shareholding in dematerialised mode 98.67%(ii) Shareholding in physical mode 1.33%
Secretarial Audit ReportAs stipulated by the Securities and Exchange Board of India, a qualified practicing Company Secretary carries out the Secretarial Audit, on a quarterly basis, to reconcile the total admitted capital with National Securities Depository Limited (NSDL) and Central Depository Services (India) Limited (CDSL) with the total listed and paid-up capital. The audit, inter alia, confirms that the total listed and paid up capital of the Company is in agreement with the aggregate of the total number of shares in dematerialized form and total number of shares in physical form.
For shareholders holding shares in dematerialised modeShareholders holding shares in dematerialised mode are requested to intimate all changes with respect to bank details, mandate, nomination, power of attorney, change of address, change of name etc. to their depository participant (DP). These changes will be reflected in the Company’s records on the down loading of information from Depositories, which will help the Company provide better service to its shareholders.
Share Transfer SystemIn respect of shares upto 1000 per folio, transfers are effected
on a weekly basis. For others, the transfers are effected within limits prescribed by law. The average turnaround time for processing registration of transfers is 15 days from the date of receipt of requests. The processing activities with respect to requests received for dematerialisation are completed within 7 -10 days.
Unclaimed/unpaid dividend Under Section 205C of the Companies Act, 1956, the amount of dividend remaining unclaimed for a period of seven years from the date of payment have been transferred to the Investor Education and Protection Fund.
Communication of Financial ResultsThe unaudited quarterly financial results and the audited annual accounts are normally published in Business Standard/ Financial Express/Desh Sewak. The financial results, press releases and presentations etc. are regularly displayed on the Company’s website- www.maxindia.com
Please visit us at www.maxindia.com for financial and other information about your Company.
For Max India Limited
New Delhi Analjit SinghAugust 17, 2011 Chairman & Managing Director
IN T
HE
BUSI
NES
S O
F LI
FEM
ax In
dia
Lim
ited.
Ann
ual R
epor
t 20
10-1
1.
90
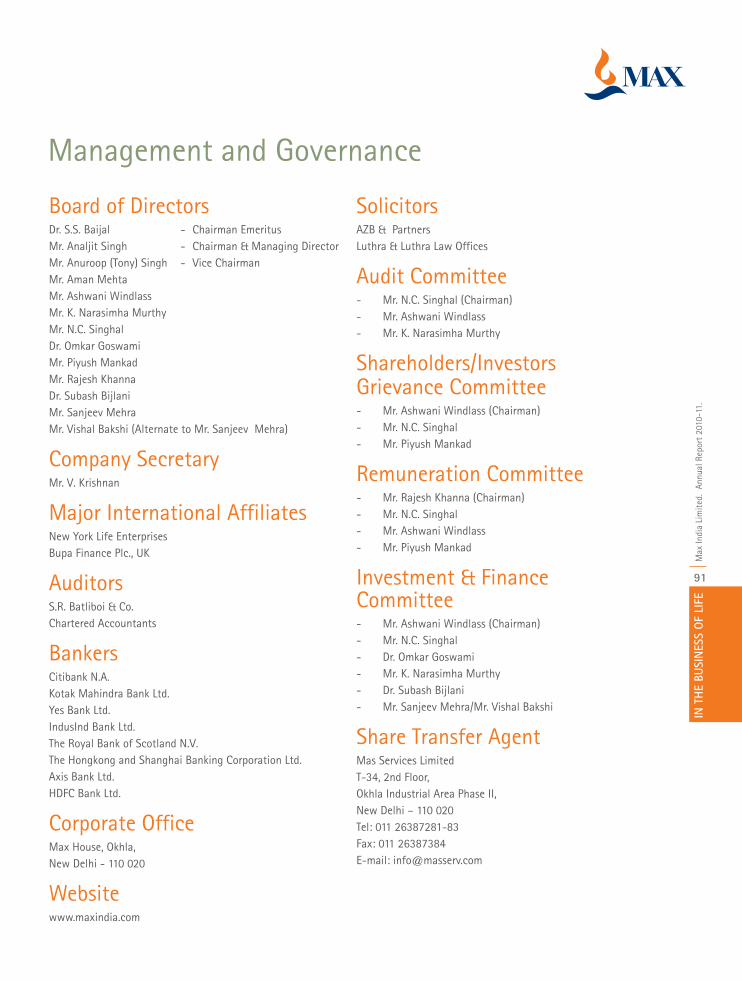
IN T
HE
BUSI
NES
S O
F LI
FEM
ax In
dia
Lim
ited.
Ann
ual R
epor
t 20
10-1
1.
91
Management and Governance
Board of Directors Dr. S.S. Baijal - Chairman EmeritusMr. Analjit Singh - Chairman & Managing DirectorMr. Anuroop (Tony) Singh - Vice Chairman Mr. Aman MehtaMr. Ashwani WindlassMr. K. Narasimha MurthyMr. N.C. SinghalDr. Omkar GoswamiMr. Piyush MankadMr. Rajesh KhannaDr. Subash BijlaniMr. Sanjeev MehraMr. Vishal Bakshi (Alternate to Mr. Sanjeev Mehra)
Company Secretary Mr. V. Krishnan
Major International AffiliatesNew York Life EnterprisesBupa Finance Plc., UK
AuditorsS.R. Batliboi & Co.Chartered Accountants
Bankers Citibank N.A.Kotak Mahindra Bank Ltd.Yes Bank Ltd.IndusInd Bank Ltd.The Royal Bank of Scotland N.V.The Hongkong and Shanghai Banking Corporation Ltd.Axis Bank Ltd. HDFC Bank Ltd.
Corporate OfficeMax House, Okhla, New Delhi - 110 020
Websitewww.maxindia.com
SolicitorsAZB & PartnersLuthra & Luthra Law Offices
Audit Committee- Mr. N.C. Singhal (Chairman)- Mr. Ashwani Windlass - Mr. K. Narasimha Murthy
Shareholders/Investors Grievance Committee- Mr. Ashwani Windlass (Chairman)- Mr. N.C. Singhal- Mr. Piyush Mankad
Remuneration Committee- Mr. Rajesh Khanna (Chairman)- Mr. N.C. Singhal - Mr. Ashwani Windlass- Mr. Piyush Mankad
Investment & Finance Committee- Mr. Ashwani Windlass (Chairman)- Mr. N.C. Singhal- Dr. Omkar Goswami- Mr. K. Narasimha Murthy- Dr. Subash Bijlani- Mr. Sanjeev Mehra/Mr. Vishal Bakshi
Share Transfer AgentMas Services LimitedT-34, 2nd Floor, Okhla Industrial Area Phase II,New Delhi – 110 020Tel: 011 26387281-83 Fax: 011 26387384E-mail: [email protected]
IN T
HE
BUSI
NES
S O
F LI
FEM
ax In
dia
Lim
ited.
Ann
ual R
epor
t 20
10-1
1.
92

MAX INDIA LIMITED
Max
Indi
a Li
mit
ed.
Annu
al R
epor
t 201
0-11
.
95
IN T
HE B
USIN
ESS O
F LI
FE
Directors’ ReportYour Directors have pleasure in presenting the twenty-third AnnualReport of your Company with the audited Statement of Accountsfor the financial year ended March 31, 2011.
Consolidated Results
The highlights of the consolidated financial results of yourCompany and its subsidiaries are as under:
(RS. CRORE)Year ended Year ended
March 31, 2011 March 31, 2010
Income
Net Sales 527.6 423.9Service Income 6140.7 5150.3Income from investment activities 1184.9 2075.3Other Income 38.0 11.6
7891.2 7661.1
Expenses
Manufacturing, Trading & Direct Expenses 5754.9 5857.7Personnel Expenses 882.1 769.1Administration & Other Expenses 817.5 874.7Financial Expenses 112.9 59.1Depreciation & Amortisation 203.0 141.1Funds for Future Appropriations 89.1 45.3
7859.5 7747.0Profit /(Loss) Before Tax 31.7 (85.9)Tax Expense 9.9 3.4Profit / (Loss) After Tax 21.8 (89.3)Minority Interest (13.1) 17.7Profit/(Loss) after tax, (after adjusting
Minority Interest) 8.7 (71.6)
The year 2010-11 proved to be another year of high performancefor your Company and its subsidiaries. During financial year2010-11, the consolidated Group revenue was Rs 7,891.2 crore,representing a growth of 3% over the previous year, while theoperating revenue stood at Rs. 6,668.3 crore, an increase of 20%over the previous year. The group turned profitable on aconsolidated basis, posting net profit after tax (adjusting forminority interest) at Rs. 8.7 Crore in 2010-11, against a net loss ofRs 71.6 crore in the previous year. The turnaround was primarilyon account of MNYL profitability, owing to higher renewal incomeand stringent cost management initiatives. A brief update on thebusiness achievements of your Company’s key operatingsubsidiaries is as below:
(i) Max New York Life Insurance Company Limited
Financial Year 2010-11 was a year of continuing growth forMax New York Life Insurance Company Limited (MNYL). Duringthe year under review, total revenue (first year premium +
renewal premium) increased by 20% to Rs.5,813 crore;renewal premium recorded a growth of 25% to Rs.3,751crore; first year premium recorded a growth of 11% toRs.2,062 crore. Individual adjusted first year premium(adjusted for single pay), which MNYL believes is the truebarometer of new business performance of a life insurancecompany, was Rs.1,724 crore, recording a growth of 9%.MNYL’s market share among the private players based onadjusted first year premium went up by 200 bps to 7.5%.Sum assured recorded a growth of 26% to Rs.1,54,687crore. At 81%, MNYL’s conservation ratio remained oneof the best in the industry. Cost ratio improved from 42%to 38% due to the impact of cost management initiativestaken during the year. Profit after tax went up by morethan 12 times to Rs.283 crore. Assets under managementrecorded a growth of 37% to Rs.13,836 crore. MNYLmaintained more than double the stipulated solvencymargin at 365%.
During the year under review, MNYL launched a range ofULIPs, designed to meet specific needs of differentcustomers like Shiksha Plus II, Shubh Invest andFlexifortune. MNYL also launched ‘College Plan’ - atraditional guaranteed money back plan, which helpscustomers create a corpus for their child’s highereducation.
During 2010-11, MNYL took an important step towardsevolving a more comprehensive multi-channel distributionnetwork with the corporate agency agreement with AxisBank – the third largest private sector bank in the country.This channel became active in May 2010 and providedMNYL with a strong national bancassurance relationship.With around 1,400 branches across more than 600locations, it was expected that the relationship with AxisBank will provide MNYL access to a relatively large numberof new customers. This expectation has been achieved. ByMarch 2011, MNYL had sold more than 1 lakh policiesthrough this new relationship. It is the first and only Indianlife insurance company to have been awarded the CII-EXIM Bank Commendation Certificate for ‘StrongCommitment to Excel’ for three consecutive years from2008 to 2010.
In terms of first year premiums, the regional distributionacross India has become more equitable. West contributed29%, North 28%, South 25% and East 18%.
During 2010-11, traditional products gained greater sharein MNYL’s product mix. In fact, the share of traditionalplans in total revenue increased from 30% in 2009-10 to39% in 2010-11, while that of ULIPs decreased from 70%
Max
Indi
a Li
mit
ed.
Annu
al R
epor
t 201
0-11
.
96
IN T
HE B
USIN
ESS O
F LI
FE
MAX INDIA LIMITED
Directors’ Report
to 61% over the same period. MNYL’s assets undermanagement grew by 37% to Rs.13,836 crore as on 31March 2011, which comprised roughly 60% debt and40% equity.
During the period under review, MNYL has made significantprogress. Today, MNYL is not only one of the mostrecognised brands in the life insurance segment, but alsoacross the Indian corporate sector as a whole. The brandawareness score touched an all time high of 98% in March2011. This is a significant 11 percentage point jump overMarch 2010. With this development, the brand is nowranked fourth among all private insurance players.
(ii) Max Healthcare Institute Ltd:
Max Healthcare Institute Ltd. (MHC) providescomprehensive, integrated and international classhealthcare services with state-of-art infrastructuredesigned in accordance with international norms. MHCoperates six super-specialty and multi-specialty hospitalsand two specialty medical centres located in New Delhiand the surrounding NCR region offering services in over30 medical disciplines. MHC is implementing its secondphase of expansion which widens operations beyond Delhi/NCR to other parts of North India in addition to expandingthe existing network in the NCR.
During the fiscal 2010-11, MHC continued to progressalong its long term growth roadmap. It also significantlyexpanded its infrastructure and manpower, and expandedcapabilities to capture the growing opportunities in thehigh quality Indian healthcare space. Its new 200 bed MaxSuper Speciality Hospital, Shalimar Bagh, is stated tobecome operational in October 2011. The 100 bed MaxSuper Speciality Hospital, Dehradun will becomeoperational in Q4, 2011-12. In addition, MHC has beenallotted land by Government of Punjab under Public PrivatePartnership (PPP), to set up two 200 bed Super SpecialityHospitals at Bhatinda and Mohali, to be launched inOctober, 2011.
During the year under review, revenue across the networkof hospitals grew by 28% to Rs.685 crore in 2010-11,average revenue per occupied bed day increased by 6% toRs. 21,558. EBIDTA margin rose from 4.4% in 2009-10 to7.6% in 2010-11. Average operational beds increased by23% from 751 in 2009-10 to 926 in 2010-11, with thenew blocks of Patparganj and Saket getting fullyoperational. The incremental capacity across all MHC’shealthcare facilities reduced from 73% in 2009-10 to68% in 2010-11 in a relative sense, although total beds
occupied continues to show an upward trend. Averagelength of stay was 3.56 days in 2010-11.
As on March 31, 2011, MHC has approximately 1,250doctors, 1,725 nurses and 1,840 para-medical and otherstaff across the network of hospitals. There is a registeredpatient base of 11.42 lakh patients with an average ofapproximately over 250,000 patient transactions per month.
(iii)Max Bupa Health Insurance Company Limited:
Max Bupa Health Insurance Company Limited (MBHI) wasformed in September 2008. With a purpose to build long-term healthcare partnerships and provide expertise for life,MBHI is working towards helping people live longer,healthier and more successful lives.
During the fiscal 2010-11, total market for health insurancepremium in India was Rs.11,137 crore - a 34% growth over2009-10. The share of health insurance in overall generalinsurance in India has increased from 22% in 2009-10 to26% in 2010-11. The industry is expected to continue withrapid growth. Analysts estimate growth at a CAGR of 25% -30% till 2014-15, to become a Rs. 28,000 crore market. MBHIhas grown from 400 to 700 employees in 2010-11, as it entersinto the next phase of accelerated growth.
The period for the financial year 2010 -11, was the first fullyear of MBHI’s business operations. It was a year of learning,development and growth. MBHI completed 2010-11 with over46,000 lives under cover. Gross written premium (GWP) wasRs.25 crore. The provider network grew to 750, spanning over200 cities in India.
MBHI launched the Heartbeat Family First in 2010-11, a firstof its kind product designed especially for the extended IndianJoint Family and it was later awarded the ‘Best ProductInnovation Award for 2011’ from the India Insurance Review.
(iv)Max Neeman Medical International Limited:
Max Neeman Medical International Limited (MNMI) is a valueadded contract research organization (CRO) that provides abroad range of clinical research services to globalpharmaceutical, device and biotechnology companies. It alsocollaborates with other CROs in providing a variety of services.Estimates suggest that the Indian clinical trials industry willreach US$ 1.3bn by 2012.
During the period under review, MNMI had a team of over210 clinical research coordinators and associates with a pan– India presence across 22 cities which gives MNMI access topatents and investigators sites for various therapeutic areas.MNMI has conducted studies over 2,700 subjects in Phase-I
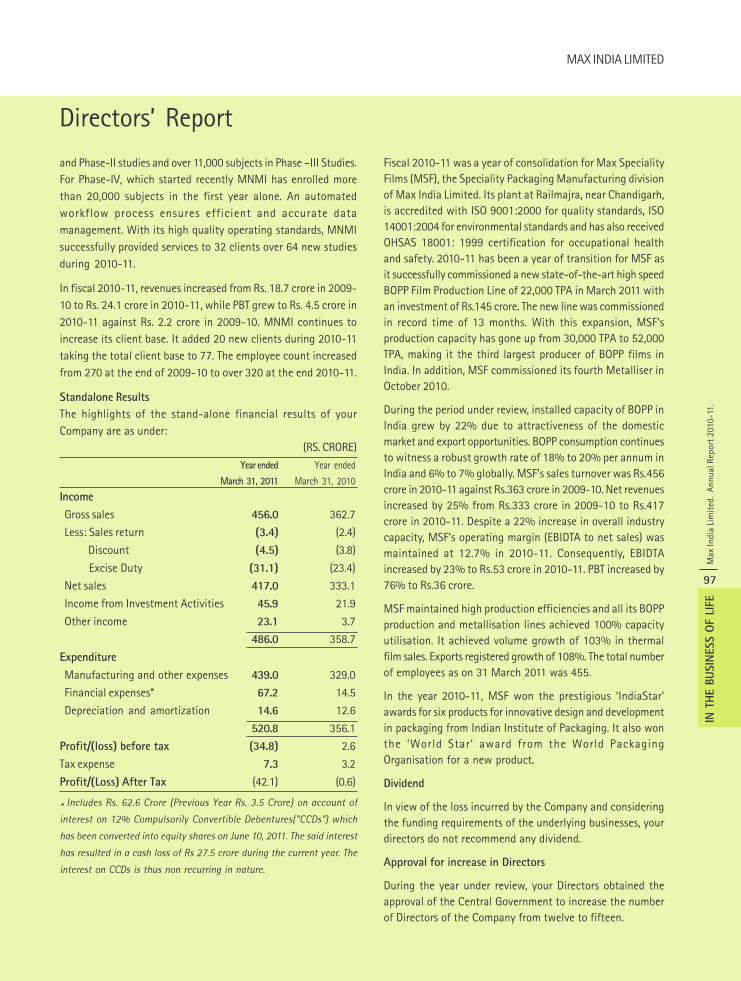
MAX INDIA LIMITED
Max
Indi
a Li
mit
ed.
Annu
al R
epor
t 201
0-11
.
97
IN T
HE B
USIN
ESS O
F LI
FE
Directors’ Report
and Phase-II studies and over 11,000 subjects in Phase –III Studies.For Phase-IV, which started recently MNMI has enrolled morethan 20,000 subjects in the first year alone. An automatedworkflow process ensures efficient and accurate datamanagement. With its high quality operating standards, MNMIsuccessfully provided services to 32 clients over 64 new studiesduring 2010-11.
In fiscal 2010-11, revenues increased from Rs. 18.7 crore in 2009-10 to Rs. 24.1 crore in 2010-11, while PBT grew to Rs. 4.5 crore in2010-11 against Rs. 2.2 crore in 2009-10. MNMI continues toincrease its client base. It added 20 new clients during 2010-11taking the total client base to 77. The employee count increasedfrom 270 at the end of 2009-10 to over 320 at the end 2010-11.
Standalone Results
The highlights of the stand-alone financial results of yourCompany are as under:
(RS. CRORE)
Year ended Year ended
March 31, 2011 March 31, 2010
Income
Gross sales 456.0 362.7
Less: Sales return (3.4) (2.4)
Discount (4.5) (3.8)
Excise Duty (31.1) (23.4)
Net sales 417.0 333.1
Income from Investment Activities 45.9 21.9
Other income 23.1 3.7
486.0 358.7
Expenditure
Manufacturing and other expenses 439.0 329.0
Financial expenses* 67.2 14.5
Depreciation and amortization 14.6 12.6
520.8 356.1
Profit/(loss) before tax (34.8) 2.6
Tax expense 7.3 3.2
Profit/(Loss) After Tax (42.1) (0.6)
* Includes Rs. 62.6 Crore (Previous Year Rs. 3.5 Crore) on account of
interest on 12% Compulsorily Convertible Debentures(“CCDs”) which
has been converted into equity shares on June 10, 2011. The said interest
has resulted in a cash loss of Rs 27.5 crore during the current year. The
interest on CCDs is thus non recurring in nature.
Fiscal 2010-11 was a year of consolidation for Max SpecialityFilms (MSF), the Speciality Packaging Manufacturing divisionof Max India Limited. Its plant at Railmajra, near Chandigarh,is accredited with ISO 9001:2000 for quality standards, ISO14001:2004 for environmental standards and has also receivedOHSAS 18001: 1999 certification for occupational healthand safety. 2010-11 has been a year of transition for MSF asit successfully commissioned a new state-of-the-art high speedBOPP Film Production Line of 22,000 TPA in March 2011 withan investment of Rs.145 crore. The new line was commissionedin record time of 13 months. With this expansion, MSF’sproduction capacity has gone up from 30,000 TPA to 52,000TPA, making it the third largest producer of BOPP films inIndia. In addition, MSF commissioned its fourth Metalliser inOctober 2010.
During the period under review, installed capacity of BOPP inIndia grew by 22% due to attractiveness of the domesticmarket and export opportunities. BOPP consumption continuesto witness a robust growth rate of 18% to 20% per annum inIndia and 6% to 7% globally. MSF’s sales turnover was Rs.456crore in 2010-11 against Rs.363 crore in 2009-10. Net revenuesincreased by 25% from Rs.333 crore in 2009-10 to Rs.417crore in 2010-11. Despite a 22% increase in overall industrycapacity, MSF’s operating margin (EBIDTA to net sales) wasmaintained at 12.7% in 2010-11. Consequently, EBIDTAincreased by 23% to Rs.53 crore in 2010-11. PBT increased by76% to Rs.36 crore.
MSF maintained high production efficiencies and all its BOPPproduction and metallisation lines achieved 100% capacityutilisation. It achieved volume growth of 103% in thermalfilm sales. Exports registered growth of 108%. The total numberof employees as on 31 March 2011 was 455.
In the year 2010-11, MSF won the prestigious ‘IndiaStar’awards for six products for innovative design and developmentin packaging from Indian Institute of Packaging. It also wonthe ‘World Star’ award from the World PackagingOrganisation for a new product.
Dividend
In view of the loss incurred by the Company and consideringthe funding requirements of the underlying businesses, yourdirectors do not recommend any dividend.
Approval for increase in Directors
During the year under review, your Directors obtained theapproval of the Central Government to increase the numberof Directors of the Company from twelve to fifteen.
Max
Indi
a Li
mit
ed.
Annu
al R
epor
t 201
0-11
.
98
IN T
HE B
USIN
ESS O
F LI
FE
MAX INDIA LIMITED
Directors’ Report
Directors
Your Directors are pleased to inform the following:
The Board of Directors in its endevour to address the growingneeds of the Max India Group, a complex business environmentas also the growth potential of our various businesses,appointed Mr. Rahul Khosla as the Managing Director of theCompany. He is expected to assume the office on August 18,2011. Mr. Analjit Singh would relinquish the position ofManaging Director effective August 18, 2011and shall continueas Executive Chairman of the Company effective that date.Requisite approval of the shareholders for the aforesaidappointment of Mr. Rahul Khosla as Managing Director andpayment of remuneration are being sought at the ensuingAnnual General Meeting.
Mr. Leo Puri, a Director nominated by Warburg Pincus groupresigned from the Directorship of the Company effective June17, 2011. Your Directors place on record, their appreciationfor the valuable contribution made by Mr. Leo Puri during hisassociation with the Company.
In accordance with the provisions of the Act and the Articlesof Association of the Company, Mr. Anuroop Singh, Mr. N.C.Singhal, Dr. Subash Bijlani, Mr. Aman Mehta and Mr. AshwaniWindlass retire by rotation at the ensuing Annual GeneralMeeting and are eligible for re-appointment. Mr. Vishal Bakshiwas appointed as an Alternate Director effective February 11,2011 to Mr. Sanjeev Mehra, nominee director of Xenok Limited,a wholly owned subsidiary of GS Capital Partners VI Fund, LP,controlled by Goldman Sachs Group.
Increase in paid up share capital of the Company
During the year under review, the paid up equity share capitalof the Company stood increased from Rs. 46.50 crore to Rs.46.48 crore arising from allotment of 109,677 equity sharesof Rs. 2/- each under the ‘Employee Stock Plan 2003’.
As of the date of this Report, the paid up equity share capitalof the Company stood further increased to Rs. 52.91 crorearising from following:
(i) Allotment of equity shares on conversion of CompulsorilyConvertible Debentures to Xenok Limited
The Company allotted 24,079,700 equity shares of Rs.2/-each at a premium of Rs. 214.75/- per equity share, onconversion of 6,019,925 Compulsorily ConvertibleDebentures of Rs. 867/- each (“CCDs”) to Xenok Limited, awholly owned subsidiary of GS Capital Partners VI Fund,L.P., on June 10, 2011. With the aforesaid allotment, thepaid up share capital of the Company stood increased toRs. 51,31,28,220/-, effective that date.
(ii) Conversion of Promoter Warrants
Dynavest India Private Limited (‘Dynavest’), a companyforming the Promoter Group exercised its right to convert2,000,000 Promoter Warrants of Rs. 867/- each into8,000,000 equity shares of Rs. 2/- each at a premium of Rs.214.75 per equity share by paying the full warrantconsideration of Rs. 173.4 crore. Your Board allotted8,000,000 equity shares of Rs. 2/- each on August 4, 2011 toDynavest. With the aforesaid allotment, the paid up sharecapital of the Company stood increased to Rs. 52,91,28,220/-,effective that date.
Business Investments
The Company made an additional investment of Rs. 53.39 croretowards equity contribution in MHC during year under review,taking the total equity contribution in MHC to Rs. 219.49 crore asof March 31, 2011. Further, the Company contributed an amountof Rs. 100 cores towards subscription to Compulsorily ConvertiblePreference Shares (CCPS) of MHC as of date.
Your Directors have already approved acquisition of 47,617,924equity shares of Rs. 10/- each of MHC constituting the entireshareholding of 16.37% held by the entities forming part ofWarburg Pincus group at an acquisition price of Rs. 29.40 pershare for a total consideration of Rs. 140 crore, subject to requisiteapprovals. The Company expects to conclude aforesaid transactionon or before December 15, 2011. With this acquisition, yourCompany’s equity shareholding in MHC would stand increased to91.84%.
During the year under review, your Company also made afurther investment of Rs.88.80 crore in MBHI. With this, the totalequity contribution by the Company in MBHI stood increased toRs.200.54 crore as of March 31, 2011.
Your Company also made a further investment of Rs. 5.92 crore inMNYL taking the total investment in MNYL to Rs.1466.51 croreas of March 31, 2011.
Management Discussion & Analysis
A review of the performance of businesses, including those ofyour Company’s joint ventures and subsidiaries, is provided in theManagement Discussion & Analysis.
Fixed Deposits
Your Company has not accepted/renewed any deposit up to thedate of this Report.
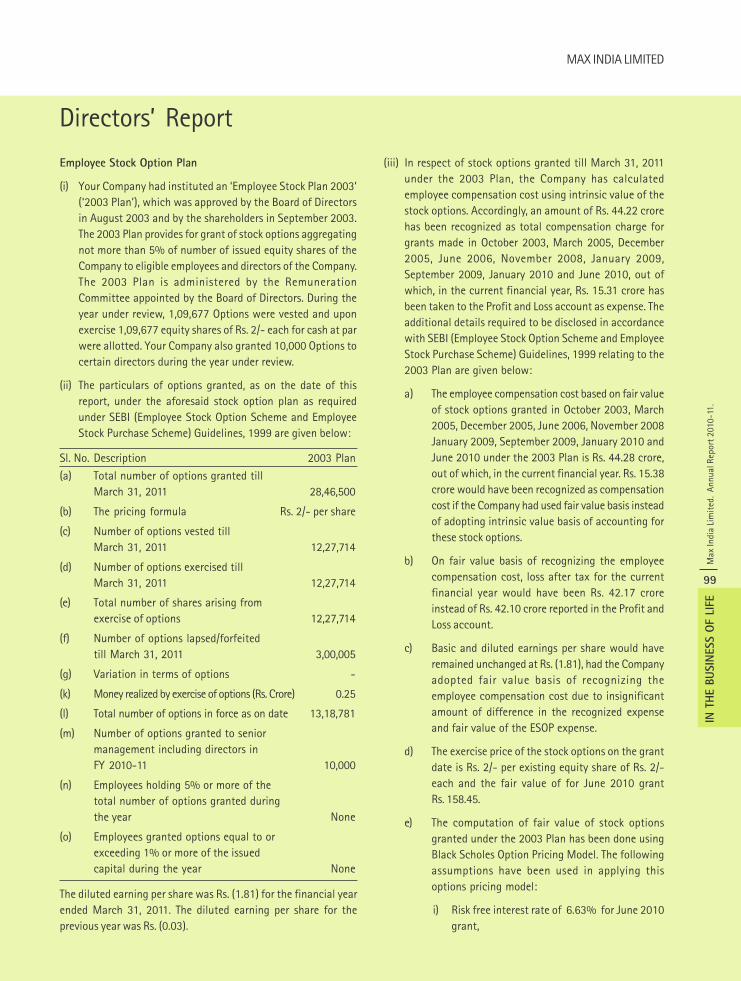
MAX INDIA LIMITED
Max
Indi
a Li
mit
ed.
Annu
al R
epor
t 201
0-11
.
99
IN T
HE B
USIN
ESS O
F LI
FE
Directors’ Report
Employee Stock Option Plan
(i) Your Company had instituted an ‘Employee Stock Plan 2003’(‘2003 Plan’), which was approved by the Board of Directorsin August 2003 and by the shareholders in September 2003.The 2003 Plan provides for grant of stock options aggregatingnot more than 5% of number of issued equity shares of theCompany to eligible employees and directors of the Company.The 2003 Plan is administered by the RemunerationCommittee appointed by the Board of Directors. During theyear under review, 1,09,677 Options were vested and uponexercise 1,09,677 equity shares of Rs. 2/- each for cash at parwere allotted. Your Company also granted 10,000 Options tocertain directors during the year under review.
(ii) The particulars of options granted, as on the date of thisreport, under the aforesaid stock option plan as requiredunder SEBI (Employee Stock Option Scheme and EmployeeStock Purchase Scheme) Guidelines, 1999 are given below:
Sl. No. Description 2003 Plan
(a) Total number of options granted tillMarch 31, 2011 28,46,500
(b) The pricing formula Rs. 2/- per share
(c) Number of options vested tillMarch 31, 2011 12,27,714
(d) Number of options exercised tillMarch 31, 2011 12,27,714
(e) Total number of shares arising fromexercise of options 12,27,714
(f) Number of options lapsed/forfeitedtill March 31, 2011 3,00,005
(g) Variation in terms of options -
(k) Money realized by exercise of options (Rs. Crore) 0.25
(l) Total number of options in force as on date 13,18,781
(m) Number of options granted to seniormanagement including directors inFY 2010-11 10,000
(n) Employees holding 5% or more of thetotal number of options granted duringthe year None
(o) Employees granted options equal to orexceeding 1% or more of the issuedcapital during the year None
The diluted earning per share was Rs. (1.81) for the financial yearended March 31, 2011. The diluted earning per share for theprevious year was Rs. (0.03).
(iii) In respect of stock options granted till March 31, 2011under the 2003 Plan, the Company has calculatedemployee compensation cost using intrinsic value of thestock options. Accordingly, an amount of Rs. 44.22 crorehas been recognized as total compensation charge forgrants made in October 2003, March 2005, December2005, June 2006, November 2008, January 2009,September 2009, January 2010 and June 2010, out ofwhich, in the current financial year, Rs. 15.31 crore hasbeen taken to the Profit and Loss account as expense. Theadditional details required to be disclosed in accordancewith SEBI (Employee Stock Option Scheme and EmployeeStock Purchase Scheme) Guidelines, 1999 relating to the2003 Plan are given below:
a) The employee compensation cost based on fair valueof stock options granted in October 2003, March2005, December 2005, June 2006, November 2008January 2009, September 2009, January 2010 andJune 2010 under the 2003 Plan is Rs. 44.28 crore,out of which, in the current financial year. Rs. 15.38crore would have been recognized as compensationcost if the Company had used fair value basis insteadof adopting intrinsic value basis of accounting forthese stock options.
b) On fair value basis of recognizing the employeecompensation cost, loss after tax for the currentfinancial year would have been Rs. 42.17 croreinstead of Rs. 42.10 crore reported in the Profit andLoss account.
c) Basic and diluted earnings per share would haveremained unchanged at Rs. (1.81), had the Companyadopted fair value basis of recognizing theemployee compensation cost due to insignificantamount of difference in the recognized expenseand fair value of the ESOP expense.
d) The exercise price of the stock options on the grantdate is Rs. 2/- per existing equity share of Rs. 2/-each and the fair value of for June 2010 grantRs. 158.45.
e) The computation of fair value of stock optionsgranted under the 2003 Plan has been done usingBlack Scholes Option Pricing Model. The followingassumptions have been used in applying thisoptions pricing model:
i) Risk free interest rate of 6.63% for June 2010grant,
Max
Indi
a Li
mit
ed.
Annu
al R
epor
t 201
0-11
.
100
IN T
HE B
USIN
ESS O
F LI
FE
MAX INDIA LIMITED
Directors’ Report
ii) Expected life of these stock options are: 3year option for September 2009 grant, 3 yearoption for January 2010 grant and 1 year optionfor June 2010 grant.
iii) Expected volatility of 34.82% for January 2010grant, 63.58% for September 2009 grant and34.82% for June 2010 grant, based on historicalvolatility of the Company’s share,
iv) No dividend expectation based on current year’sdividend recommendation, and
v) Price of Rs.181.30 for September 2009 grant,Rs. 221.10 for January 2010 and Rs. 160.05 forJune 2010 grant being the latest available closingprice of the Company’s share on the NationalStock Exchange prior to the date of grant.
Statutory Disclosures
Information in accordance with the provisions of Section217(1)(e) of the Act read with the Companies (Disclosures ofParticulars in the Report of Board of Directors) Rules, 1988are given in the prescribed format annexed to this Report asAnnexure –A. A statement giving particulars of employeesunder Section 217(2A) of the Act read with the Companies(Particulars of Employees) Rules, 1975 for the financial yearended March 31, 2011 is annexed to this Report as Annexure-
B. Statement pursuant to Section 212 of the Act relating tothe subsidiaries of your Company, is annexed to this Report.
Central Government vide its circular No. 5/12/2007-CL-IIIdated February 8, 2011 has granted a general exemption underSection 212(8) of the Act, to companies provided certainconditions are fulfilled. Based on the aforesaid circular, theBoard of Directors of the Company passed a resolution givingconsent for not attaching the Balance Sheet, Profit & LossAccount, Report of the Board of Directors and the Report ofthe Auditors of its subsidiaries. Your Company will makeavailable these documents/details upon request by anymember of the Company and its subsidiaries interested inobtaining the same. The annual accounts of the subsidiarycompanies will also be kept open for inspection by membersat the respective registered offices of the Company and itssubsidiary companies. However, pursuant to AccountingStandard 21 issued by the Institute of Chartered Accountantsof India, Consolidated Financial Statements are presented bythe Company as part of the annual report which includes thefinancial information of the subsidiaries.
Ministry of Corporate Affairs (MCA) had issued “CorporateGovernance Voluntary Guidelines” in December 2009. These
guidelines are recommendatory in nature. The Company willexamine the possibilities of adopting the guidelines in anappropriate manner.
Auditors
S.R. Batliboi & Co., Statutory Auditors of your Company, retiresand offers themselves for re-appointment. Your Company hasreceived from them, a certificate required under Section 224(1B)of the Act to the effect that their reappointment, if made, wouldbe in conformity with the limits specified in that Section.
The Auditors’ Report read alongwith notes to accounts is selfexplanatory and therefore does not call for any comments.
Group for interse transfer of shares
As required under Clause 3(e) of Securities and Exchange Boardof India (Substantial Acquisition of Shares and Takeovers)Regulations, 1997, persons constituting Group within the meaningas defined in the Monopolies and Restrictive Trade Practices Act,1969 for the purpose of Regulation 10 to 12 of aforesaid SEBIRegulations are as follows:
(a) Mr. Analjit Singh, (b) Mrs. Neelu Analjit Singh, (c) Ms. PiyaSingh (d) Mr. Veer Singh, (e) Ms. Tara Singh, (f) Ms. Nira Singh (g)Neeman Family Foundation, (h) Medicare Investments Limited, (i)Cheminvest Limited, (j) Liquid Investment and Trading Co Pvt Ltd.,(k) Maxopp Investments Limited, (l) Mohair Investment & TradingCo. (P) Ltd., (m) Boom Investments Private Limited, (n) PVTInvestment Limited, (o) Pen Investments Limited, (p) Pivet FinancesLimited, (q) Dynavest India Private Limited. (r) Maxpak InvestmentLimited (s) Trophy Holdings Private Limited and (t) MoavInvestment Limited.
Directors’ Responsibility Statement
The Board of Directors of the Company confirms that:
(i) In the preparation of annual accounts, the applicableaccounting standards have been followed, along with properexplanation relating to material departures.
(ii) The Directors have selected such accounting policies andapplied them consistently and made judgments andestimates that are reasonable and prudent, so as to give atrue and fair view of the state of affairs of the Company atthe end of the financial year and of the profit or loss of theCompany for that period.
(iii) The Directors have taken proper and sufficient care for themaintenance of adequate accounting records in accordancewith the provisions of the Act for safeguarding the assets ofthe Company and for preventing and detecting fraud andother irregularities.
MAX INDIA LIMITED
Max
Indi
a Li
mit
ed.
Annu
al R
epor
t 201
0-11
.
101
IN T
HE B
USIN
ESS O
F LI
FE
Directors’ Report
(iv) The Directors have prepared the annual accounts on a goingconcern basis.
Cautionary Statement
Statements in this Report, particularly those which relate toManagement Discussion and Analysis describing the Company’sobjectives, projections, estimates and expectations may constitute“forward looking statements” within the meaning of applicablelaws and regulations. Actual results might differ materially fromthose either expressed or implied in the statement depending onthe circumstances.
Acknowledgements
Your Directors would like to place on record their appreciationof the contribution made by its Management and its employeeswho through their competence and commitment have enabledthe Company to achieve impressive growth. Your Directorsacknowledge with thanks the co-operation and assistancereceived from various agencies of the Central and StateGovernments, Financial Institutions and Banks, Shareholders, JointVenture partners and all other business associates.
For and on behalf of the Board of Directors
New Delhi ANALJIT SINGH
August 17, 2011 Chairman & Managing Director
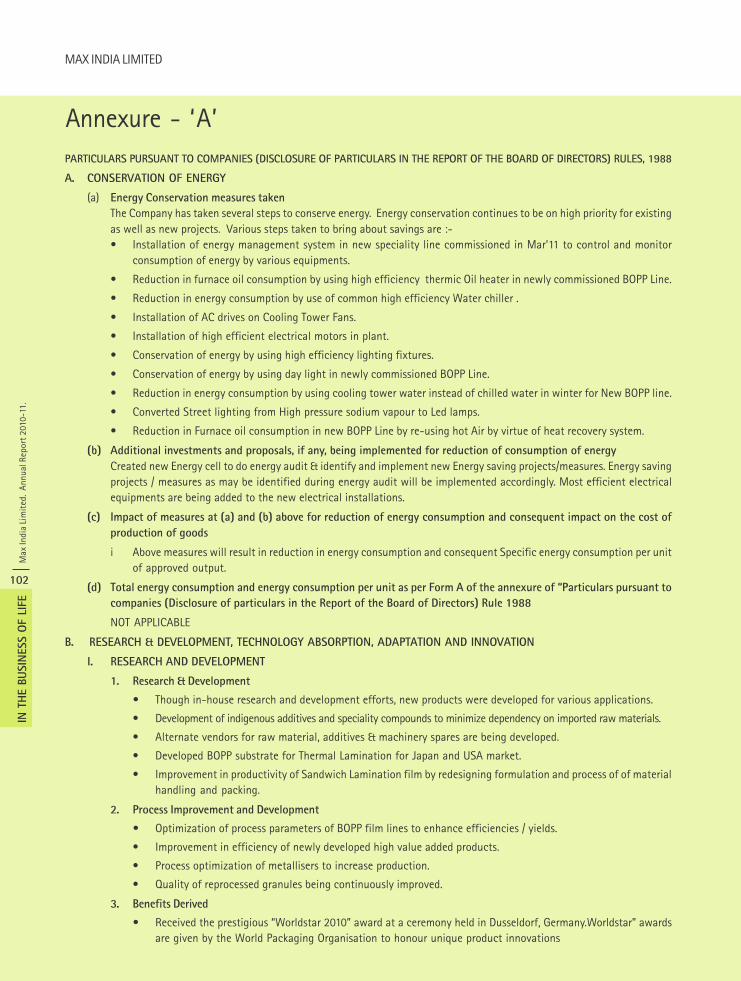
Max
Indi
a Li
mit
ed.
Annu
al R
epor
t 201
0-11
.
102
IN T
HE B
USIN
ESS O
F LI
FE
MAX INDIA LIMITED
Annexure - ‘A’PARTICULARS PURSUANT TO COMPANIES (DISCLOSURE OF PARTICULARS IN THE REPORT OF THE BOARD OF DIRECTORS) RULES, 1988
A. CONSERVATION OF ENERGY
(a) Energy Conservation measures taken
The Company has taken several steps to conserve energy. Energy conservation continues to be on high priority for existingas well as new projects. Various steps taken to bring about savings are :-• Installation of energy management system in new speciality line commissioned in Mar’11 to control and monitor
consumption of energy by various equipments.
• Reduction in furnace oil consumption by using high efficiency thermic Oil heater in newly commissioned BOPP Line.
• Reduction in energy consumption by use of common high efficiency Water chiller .
• Installation of AC drives on Cooling Tower Fans.
• Installation of high efficient electrical motors in plant.
• Conservation of energy by using high efficiency lighting fixtures.
• Conservation of energy by using day light in newly commissioned BOPP Line.
• Reduction in energy consumption by using cooling tower water instead of chilled water in winter for New BOPP line.
• Converted Street lighting from High pressure sodium vapour to Led lamps.
• Reduction in Furnace oil consumption in new BOPP Line by re-using hot Air by virtue of heat recovery system.
(b) Additional investments and proposals, if any, being implemented for reduction of consumption of energy
Created new Energy cell to do energy audit & identify and implement new Energy saving projects/measures. Energy savingprojects / measures as may be identified during energy audit will be implemented accordingly. Most efficient electricalequipments are being added to the new electrical installations.
(c) Impact of measures at (a) and (b) above for reduction of energy consumption and consequent impact on the cost of
production of goods
i Above measures will result in reduction in energy consumption and consequent Specific energy consumption per unitof approved output.
(d) Total energy consumption and energy consumption per unit as per Form A of the annexure of “Particulars pursuant to
companies (Disclosure of particulars in the Report of the Board of Directors) Rule 1988
NOT APPLICABLE
B. RESEARCH & DEVELOPMENT, TECHNOLOGY ABSORPTION, ADAPTATION AND INNOVATION
I. RESEARCH AND DEVELOPMENT
1. Research & Development
• Though in-house research and development efforts, new products were developed for various applications.
• Development of indigenous additives and speciality compounds to minimize dependency on imported raw materials.
• Alternate vendors for raw material, additives & machinery spares are being developed.
• Developed BOPP substrate for Thermal Lamination for Japan and USA market.
• Improvement in productivity of Sandwich Lamination film by redesigning formulation and process of of materialhandling and packing.
2. Process Improvement and Development
• Optimization of process parameters of BOPP film lines to enhance efficiencies / yields.
• Improvement in efficiency of newly developed high value added products.
• Process optimization of metallisers to increase production.
• Quality of reprocessed granules being continuously improved.
3. Benefits Derived
• Received the prestigious “Worldstar 2010” award at a ceremony held in Dusseldorf, Germany.Worldstar” awardsare given by the World Packaging Organisation to honour unique product innovations
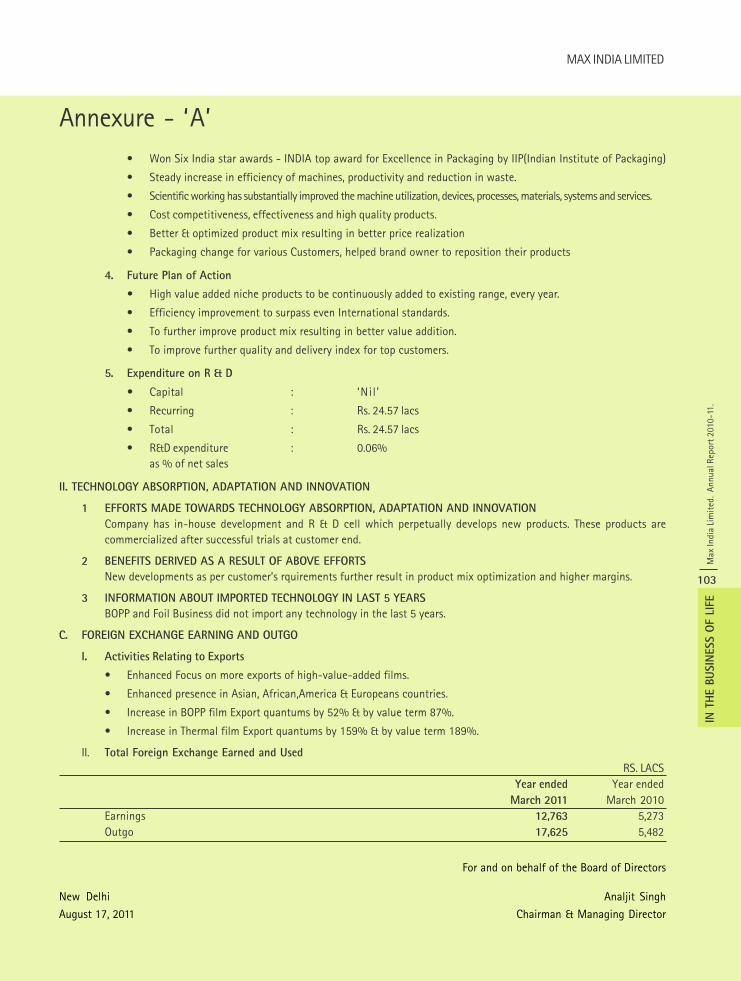
MAX INDIA LIMITED
Max
Indi
a Li
mit
ed.
Annu
al R
epor
t 201
0-11
.
103
IN T
HE B
USIN
ESS O
F LI
FE
Annexure - ‘A’• Won Six India star awards - INDIA top award for Excellence in Packaging by IIP(Indian Institute of Packaging)
• Steady increase in efficiency of machines, productivity and reduction in waste.
• Scientific working has substantially improved the machine utilization, devices, processes, materials, systems and services.
• Cost competitiveness, effectiveness and high quality products.
• Better & optimized product mix resulting in better price realization
• Packaging change for various Customers, helped brand owner to reposition their products
4. Future Plan of Action
• High value added niche products to be continuously added to existing range, every year.
• Efficiency improvement to surpass even International standards.
• To further improve product mix resulting in better value addition.
• To improve further quality and delivery index for top customers.
5. Expenditure on R & D
• Capital : ‘Nil ’
• Recurring : Rs. 24.57 lacs
• Total : Rs. 24.57 lacs
• R&D expenditure : 0.06%as % of net sales
II. TECHNOLOGY ABSORPTION, ADAPTATION AND INNOVATION
1 EFFORTS MADE TOWARDS TECHNOLOGY ABSORPTION, ADAPTATION AND INNOVATION
Company has in-house development and R & D cell which perpetually develops new products. These products arecommercialized after successful trials at customer end.
2 BENEFITS DERIVED AS A RESULT OF ABOVE EFFORTS
New developments as per customer’s rquirements further result in product mix optimization and higher margins.
3 INFORMATION ABOUT IMPORTED TECHNOLOGY IN LAST 5 YEARS
BOPP and Foil Business did not import any technology in the last 5 years.
C. FOREIGN EXCHANGE EARNING AND OUTGO
I. Activities Relating to Exports
• Enhanced Focus on more exports of high-value-added films.
• Enhanced presence in Asian, African,America & Europeans countries.
• Increase in BOPP film Export quantums by 52% & by value term 87%.
• Increase in Thermal film Export quantums by 159% & by value term 189%.
II. Total Foreign Exchange Earned and Used
RS. LACSYear ended Year ended
March 2011 March 2010Earnings 12,763 5,273Outgo 17,625 5,482
For and on behalf of the Board of Directors
New Delhi Analjit Singh
August 17, 2011 Chairman & Managing Director
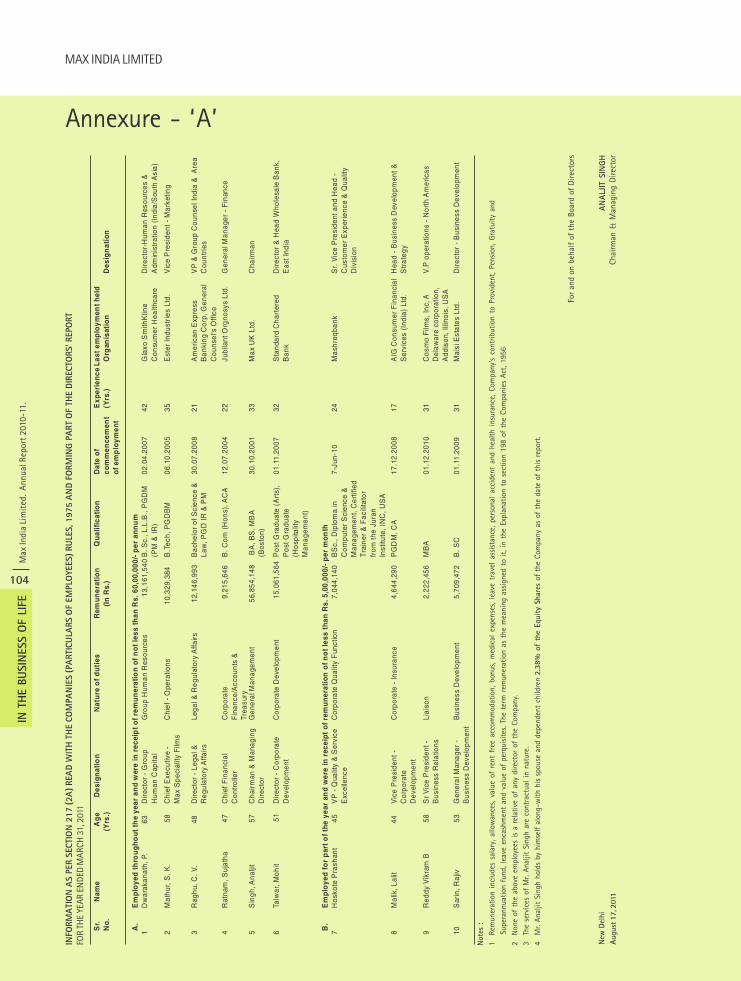
Max
Indi
a Li
mit
ed.
Annu
al R
epor
t 201
0-11
.
104
IN T
HE B
USIN
ESS O
F LI
FE
MAX INDIA LIMITED
Annexure - ‘A’
INFO
RM
ATI
ON
AS P
ER S
ECTI
ON
217 (
2A
) REA
D W
ITH
TH
E C
OM
PA
NIE
S (
PA
RTI
CU
LARS O
F EM
PLO
YEES)
RU
LES, 1975 A
ND
FO
RM
ING
PA
RT
OF
THE D
IRECTO
RS’ REPO
RT
FOR
THE
YEAR
EN
DED
MAR
CH 3
1, 2
011
Note
s :
1Re
mun
erat
ion
incl
udes
sal
ary,
allo
wan
ces,
valu
e of
ren
t fr
ee a
ccom
mod
atio
n, b
onus
, m
edic
al e
xpen
ses,
leav
e tr
avel
ass
ista
nce,
per
sona
l ac
cide
nt a
nd h
ealth
ins
uran
ce,
Com
pany
’s co
ntrib
utio
n to
Pro
vide
nt,
Pens
ion,
Gra
tuity
and
Supe
rann
uatio
n fu
nd, l
eave
enc
ashm
ent
and
valu
e of
per
quis
ites.
The
term
rem
uner
atio
n as
the
mea
ning
ass
igne
d to
it,
in t
he E
xpla
natio
n to
sec
tion
198
of t
he C
ompa
nies
Act
, 195
62
Non
e of
the
abo
ve e
mpl
oyee
s is
a r
elat
ive
of a
ny d
irect
or o
f th
e Co
mpa
ny.
3Th
e se
rvic
es o
f M
r. An
aljit
Sin
gh a
re c
ontr
actu
al i
n na
ture
.4
Mr.
Anal
jit S
ingh
hol
ds b
y hi
mse
lf al
ong-
with
his
spo
use
and
depe
nden
t ch
ildre
n 2.3
8%
of
the
Equit
y Share
s of
the
Com
pany
as
of t
he d
ate
of t
his
repo
rt.
New
Del
hi
August
17, 2
011
For
and
on b
ehal
f of
the
Boa
rd o
f Di
rect
ors
AN
ALJIT
SIN
GH
Chai
rman
& M
anag
ing
Dire
ctor
Sr.
N
ame
Ag
e
Des
ign
atio
n
Nat
ure
of
dut
ies
Rem
uner
atio
n
Qua
lific
atio
nD
ate
of
Exp
erie
nce
Las
t em
plo
ymen
t hel
dN
o.(Y
rs.)
(In
Rs.
)co
mm
ence
men
t(Y
rs.)
Org
anis
atio
nD
esig
nat
ion
o
f em
plo
ymen
t
A.
Em
plo
yed
th
roug
hout
the
year
an
d w
ere
in r
ecei
pt o
f rem
un
erat
ion
of n
ot l
ess
than
Rs.
60,
00,0
00/-
per
ann
um
1 D
war
akan
ath,
P.
63
Dire
ctor
- G
roup
H
uman
Cap
ital
Gro
up H
uman
Res
ourc
es
13,
161,
540
B. S
c., L
.L.B
., P
GD
M
(PM
& IR
)02
.04.
2007
42G
laxo
Sm
ithK
line
Con
sum
er H
ealth
care
Dire
ctor
-Hum
an R
esou
rces
&
Adm
inis
trat
ion
(Ind
ia/S
outh
Asi
a)
2 M
athu
r, S
. K.
58
Chi
ef E
xecu
tive
-
M
ax S
peci
ality
Film
sC
hief
- O
pera
tions
10,3
29,3
84
B
.Tec
h, P
GD
BM
06.1
0.20
0535
Est
er In
dust
ries
Ltd.
Vic
e P
resi
dent
- M
arke
ting
3 R
aghu
, C. V
. 48
D
irect
or -
Leg
al &
R
egul
ator
y A
ffairs
Lega
l & R
egul
ator
y A
ffairs
12,1
46,9
93
Bac
helo
r of
Sci
ence
&
Law
, PG
D IR
& P
M30
.07.
2008
21A
mer
ican
Exp
ress
B
anki
ng C
orp,
Gen
eral
C
ouns
el's
Offi
ce
VP
& G
roup
Cou
nsel
Indi
a &
Are
a C
ount
ries
4 R
atna
m, S
ujat
ha47
C
hief
Fin
anci
al
Con
trol
ler
Cor
pora
te
Fin
ance
/Acc
ount
s &
Tr
easu
ry
9,21
5,64
6
B. C
om (
Hon
s), A
CA
12.0
7.20
0422
Jubi
lant
Org
nosy
s Lt
d.G
ener
al M
anag
er -
Fin
ance
5 S
ingh
, Ana
ljit
57
Cha
irman
& M
anag
ing
Dire
ctor
Gen
eral
Man
agem
ent
56,8
54,1
48
BA
, BS
, MB
A
(Bos
ton)
30.1
0.20
0133
Max
UK
Ltd
.C
hairm
an
6 Ta
lwar
, Moh
it51
D
irect
or -
Cor
pora
te
Dev
elop
men
tC
orpo
rate
Dev
elop
men
t
15,0
61,5
64 P
ost G
radu
ate
(Art
s),
Pos
t Gra
duat
e (H
ospi
talit
y M
anag
emen
t)
01.1
1.20
0732
Sta
ndar
d C
hart
ered
B
ank
Dire
ctor
& H
ead
Who
lesa
le B
ank,
E
ast I
ndia
B.
Em
plo
yed
fo
r p
art o
f the
yea
r an
d w
ere
in r
ecei
pt o
f re
mu
ner
atio
n o
f no
t le
ss t
han
Rs.
5,0
0,00
0/- p
er m
onth
7 H
osko
te P
rash
ant
45
VP
- Q
ualit
y &
Ser
vice
E
xcel
lenc
eC
orpo
rate
Qua
lity
Fun
ctio
n7,
044,
140
B
Sc.
, Dip
lom
a in
C
ompu
ter
Sci
ence
&
Man
agem
ent,
Cer
tifie
d T
rain
er &
Fac
ilita
tor
from
the
Jura
n In
stitu
te, I
NC
, US
A
7-Ju
n-10
24M
ashr
eqba
nkS
r. V
ice
Pre
side
nt a
nd H
ead
- C
usto
mer
Exp
erie
nce
& Q
ualit
y D
ivis
ion
8 M
alik
, Lal
it44
V
ice
Pre
side
nt -
C
orpo
rate
D
evel
opm
ent
Cor
pora
te -
Insu
ranc
e
4,64
4,29
0 P
GD
M, C
A17
.12.
2008
17A
IG C
onsu
mer
Fin
anci
al
Ser
vice
s (I
ndia
) Lt
d.H
ead
- B
usin
ess
Dev
elop
men
t &
Str
ateg
y
9 R
eddy
Vik
ram
B58
S
r V
ice
Pre
side
nt -
B
usin
ess
Rel
atio
nsLi
aiso
n
2,22
2,45
6 M
BA
01.1
2.20
1031
Cos
mo
Film
s, In
c, A
D
elaw
are
corp
orat
ion,
A
ddis
on, I
llino
is, U
SA
V.P
ope
ratio
ns -
Nor
th A
mer
icas
10
Sar
in, R
ajiv
53
Gen
eral
Man
ager
-
Bus
ines
s D
evel
opm
ent
Bus
ines
s D
evel
opm
ent
5,70
9,47
2
B. S
C01
.11.
2009
31M
alsi
Est
ates
Ltd
.D
irect
or -
Bus
ines
s D
evel
opm
ent
MAX INDIA LIMITED
Max
Indi
a Li
mit
ed.
Annu
al R
epor
t 201
0-11
.
105
IN T
HE B
USIN
ESS O
F LI
FE
Auditors’ ReportTO THE MEMBERS OF MAX INDIA LIMITED
1. We have audited the attached Balance Sheet of MaxIndia Limited (‘the Company’) as at March 31, 2011 andalso the Profit and Loss Account and the Cash FlowStatement for the year ended on that date annexedthereto. These financial statements are the responsibilityof the Company’s management. Our responsibility is toexpress an opinion on these financial statements based onour audit.
2. We conducted our audit in accordance with auditingstandards generally accepted in India. Those Standardsrequire that we plan and perform the audit to obtainreasonable assurance about whether the financialstatements are free of material misstatement. An auditincludes examining, on a test basis, evidence supportingthe amounts and disclosures in the financial statements.An audit also includes assessing the accounting principlesused and significant estimates made by management, aswell as evaluating the overall financial statementpresentation. We believe that our audit provides areasonable basis for our opinion.
3. As required by the Companies (Auditor’s Report) Order,2003 (as amended) issued by the Central Government ofIndia in terms of sub-section (4A) of Section 227 of theCompanies Act, 1956, we enclose in the Annexure astatement on the matters specified in paragraphs 4 and 5of the said Order.
4. Further to our comments in the Annexure referred toabove, we report that:
i. We have obtained all the information and explanations,which to the best of our knowledge and belief werenecessary for the purposes of our audit;
ii. In our opinion, proper books of account as required bylaw have been kept by the Company so far as appearsfrom our examination of those books;
iii. The balance sheet, profit and loss account and cashflow statement dealt with by this report are inagreement with the books of account;
iv. In our opinion, the balance sheet, profit and lossaccount and cash flow statement dealt with by thisreport comply with the accounting standardsreferred to in sub-section (3C) of section 211 ofthe Companies Act, 1956.
v. On the basis of the written representations receivedfrom the directors, as on March 31, 2011, and taken onrecord by the Board of Directors, we report that none
of the directors is disqualified as on March 31, 2011 frombeing appointed as a director in terms of clause (g) ofsub-section (1) of section 274 of the Companies Act, 1956.
vi. In our opinion and to the best of our information andaccording to the explanations given to us, the said accountsgive the information required by the Companies Act, 1956,in the manner so required and give a true and fair view inconformity with the accounting principles generallyaccepted in India;
a) in the case of the Balance Sheet, of the state of affairsof the Company as at March 31, 2011;
b) in the case of the Profit and Loss Account, of the lossfor the year ended on that date; and
c) in the case of Cash Flow Statement, of the cash flowsfor the year ended on that date.
For S.R. BATLIBOI & CO.
Firm registration number: 301003EChartered Accountants
per MANOJ GUPTA
PartnerMembership No.: 83906
GurgaonMay 26, 2011
Max
Indi
a Li
mit
ed.
Annu
al R
epor
t 201
0-11
.
106
IN T
HE B
USIN
ESS O
F LI
FE
MAX INDIA LIMITED
Auditors’ Report
(i) (a) The Company has maintained proper records showingfull particulars, including quantitative details and situationof fixed assets.
(b) All fixed assets have not been physically verified by themanagement during the year but there is a regularprogramme of verification which, in our opinion, isreasonable having regard to the size of the Company andthe nature of its assets. No material discrepancies werenoticed on such verification.
(c) There was no disposal of a substantial part of fixedassets during the year.
(ii) (a) The inventory has been physically verified by themanagement during the year. In our opinion, the frequencyof verification is reasonable. Inventories lying with outsideparties have been confirmed by them as at the year end.
(b) The procedures of physical verification of inventoryfollowed by the management are reasonable and adequatein relation to the size of the Company and the nature ofits business.
(c) The Company is maintaining proper records of inventory andno material discrepancies were noticed on physical verification.
(iii) (a) According to the information and explanations given tous, the Company has not granted any loans, secured orunsecured to companies, firms or other parties coveredin the register maintained under section 301 of theCompanies Act, 1956. Accordingly, the provisions of clause4(iii) (a) to (d) of the Order are not applicable to theCompany and hence not commented upon.
(e) According to information and explanations given to us,the Company has not taken any loans, secured orunsecured, from companies, firms or other parties coveredin the register maintained under section 301 of theCompanies Act, 1956. Accordingly, the provisions of clause4(iii) (e) to (g) of the Order are not applicable to theCompany and hence not commented upon.
(iv) In our opinion and according to the information andexplanations given to us, there is an adequate internalcontrol system commensurate with the size of the Companyand the nature of its business, for the purchase of inventoryand fixed assets and for the sale of goods and services. Duringthe course of our audit, we have not observed any majorweakness or continuing failure to correct any major weaknessin the internal control system of the company in respect ofthese areas.
(v) (a) According to the information and explanationsprovided by the management, we are of the opinionthat the particulars of contracts or arrangementsreferred to in section 301 of the Companies Act,1956 that need to be entered into the registermaintained under section 301 have been so entered.
(b) In our opinion and according to the informationand explanations given to us, the transactions madein pursuance of such contracts or arrangementsexceeding value of Rupees five lakhs have beenentered into during the financial year at priceswhich are reasonable having regard to the prevailingmarket prices at the relevant time.
(vi) The Company has not accepted any deposits from thepublic.
(vii) In our opinion, the Company has an internal auditsystemcommensurate with the size and nature of itsbusiness.
(viii) To the best of our knowledge and as explained, theCentral Government has not prescribed maintenanceof cost records under clause (d) of sub-section (1) ofsection 209 of the Companies Act, 1956 for the productsof the Company.
(ix) (a) The Company is generally regular in depositingwith appropriate authorities undisputed statutorydues including provident fund, investor educationand protection fund, employees’ state insurance,income-tax, sales-tax, wealth-tax, service tax,customs duty, excise duty, cess and other materialstatutory dues applicable to it.
Further, since the Central Government has till datenot prescribed the manner and the amount of cesspayable under section 441 A of the CompaniesAct, 1956, we are not in a position to commentupon the regularity or otherwise of the companyin depositing the same.
(b) According to the information and explanationsgiven to us, no undisputed amounts payable inrespect of provident fund, investor education andprotection fund, income-tax, wealth-tax, servicetax, sales-tax, customs duty, excise duty, cess andother material statutory dues were outstanding,at the year end, for a period of more than six monthsfrom the date they became payable.
(c) According to the records of the Company, thereare no dues outstanding of income-tax, sales tax,wealth-tax, service tax, custom duty, excise duty
ANNEXURE REFERRED TO IN PARAGRAPH 3 OF OUR REPORT OF
EVEN DATE MAX INDIA LIMITED (‘THE COMPANY’)
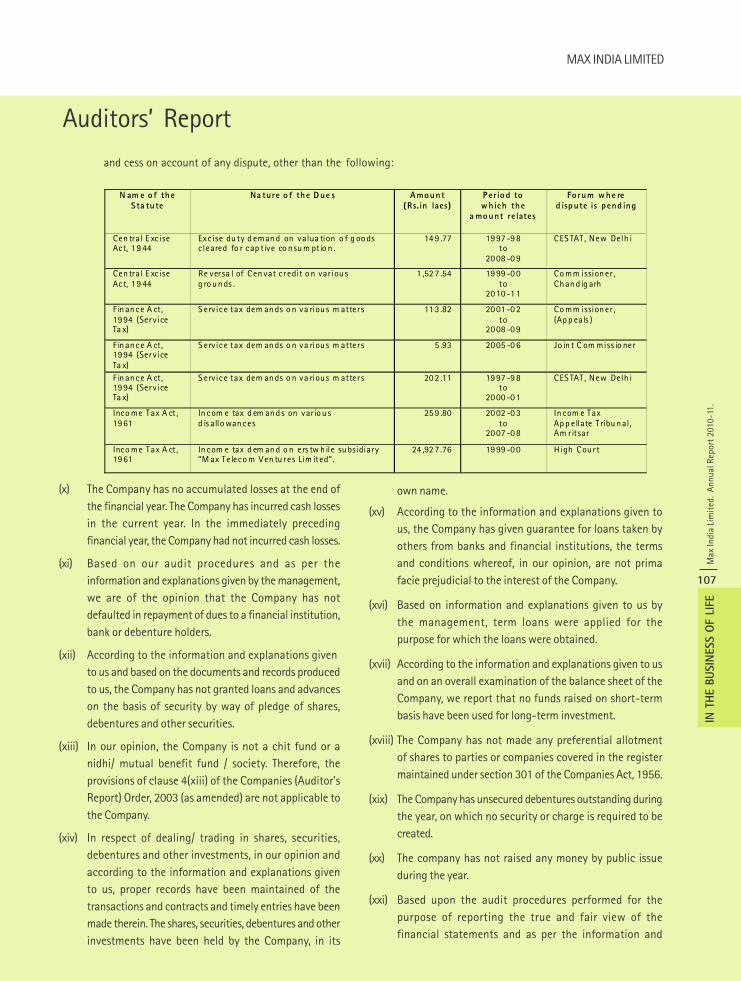
MAX INDIA LIMITED
Max
Indi
a Li
mit
ed.
Annu
al R
epor
t 201
0-11
.
107
IN T
HE B
USIN
ESS O
F LI
FE
and cess on account of any dispute, other than the following:
(x) The Company has no accumulated losses at the end ofthe financial year. The Company has incurred cash lossesin the current year. In the immediately precedingfinancial year, the Company had not incurred cash losses.
(xi) Based on our audit procedures and as per theinformation and explanations given by the management,we are of the opinion that the Company has notdefaulted in repayment of dues to a financial institution,bank or debenture holders.
(xii) According to the information and explanations givento us and based on the documents and records producedto us, the Company has not granted loans and advanceson the basis of security by way of pledge of shares,debentures and other securities.
(xiii) In our opinion, the Company is not a chit fund or anidhi/ mutual benefit fund / society. Therefore, theprovisions of clause 4(xiii) of the Companies (Auditor’sReport) Order, 2003 (as amended) are not applicable tothe Company.
(xiv) In respect of dealing/ trading in shares, securities,debentures and other investments, in our opinion andaccording to the information and explanations givento us, proper records have been maintained of thetransactions and contracts and timely entries have beenmade therein. The shares, securities, debentures and otherinvestments have been held by the Company, in its
own name.
(xv) According to the information and explanations given tous, the Company has given guarantee for loans taken byothers from banks and financial institutions, the termsand conditions whereof, in our opinion, are not primafacie prejudicial to the interest of the Company.
(xvi) Based on information and explanations given to us bythe management, term loans were applied for thepurpose for which the loans were obtained.
(xvii) According to the information and explanations given to usand on an overall examination of the balance sheet of theCompany, we report that no funds raised on short-termbasis have been used for long-term investment.
(xviii) The Company has not made any preferential allotmentof shares to parties or companies covered in the registermaintained under section 301 of the Companies Act, 1956.
(xix) The Company has unsecured debentures outstanding duringthe year, on which no security or charge is required to becreated.
(xx) The company has not raised any money by public issueduring the year.
(xxi) Based upon the audit procedures performed for thepurpose of reporting the true and fair view of thefinancial statements and as per the information and
N am e o f the S ta tu te
Na ture o f the D ue s Amount (Rs.in lacs)
P erio d to w h ich the
a mount relates
Fo rum w he re d isp ute is pend ing
Cen tral E xcise Act, 19 44
Exc ise du ty d eman d on valua tion o f g oo ds cleared fo r cap t ive co nsu m ptio n .
14 9 .77 1997 -9 8 to
2008 -0 9
CES TAT , New Delh i
Cen tral E xcise Act, 19 44
Re ver sa l of Cen vat credit o n var iou s g ro un ds .
1 ,52 7 .54 1999 -0 0 to
2010 -1 1
Co mm issioner , Chan d ig arh
F in ance A ct, 1994 (Serv ice Ta x)
S ervice tax dem an ds o n va riou s m atter s 11 3 .82 2001 -0 2 to
2008 -0 9
Co mm issioner , (Ap p eals )
F in ance A ct, 1994 (Serv ice Ta x)
S ervice tax dem an ds o n va riou s m atter s 5 .93 2005 -0 6
Jo in t C om miss io ner
F in ance A ct, 1994 (Serv ice Ta x)
S ervice tax dem an ds o n va riou s m atter s 20 2 .11 1997 -9 8 to
2000 -0 1
CES TAT , New Delh i
Inco me Tax A ct , 1961
In com e tax d em an d s on var io u s d is allo wances
25 9 .80 2002 -0 3 to
2007 -0 8
In com e Tax Ap p ellate T ribu nal, Am r itsar
Inco me Tax A ct , 1961
In com e tax d em an d o n ers tw h ile subsidiary “M ax Teleco m Ven tu res Lim ited”.
24 ,92 7 .76 1999 -0 0
H igh Cou r t
Auditors’ Report
Max
Indi
a Li
mit
ed.
Annu
al R
epor
t 201
0-11
.
108
IN T
HE B
USIN
ESS O
F LI
FE
MAX INDIA LIMITED
Auditors’ Report
explanations given by the management, we report thatno fraud on or by the Company has been noticed orreported during the year.
For S.R. BATLIBOI & CO.
Firm registration number: 301003EChartered Accountants
per MANOJ GUPTA
PartnerMembership No.: 83906
GurgaonMay 26, 2011
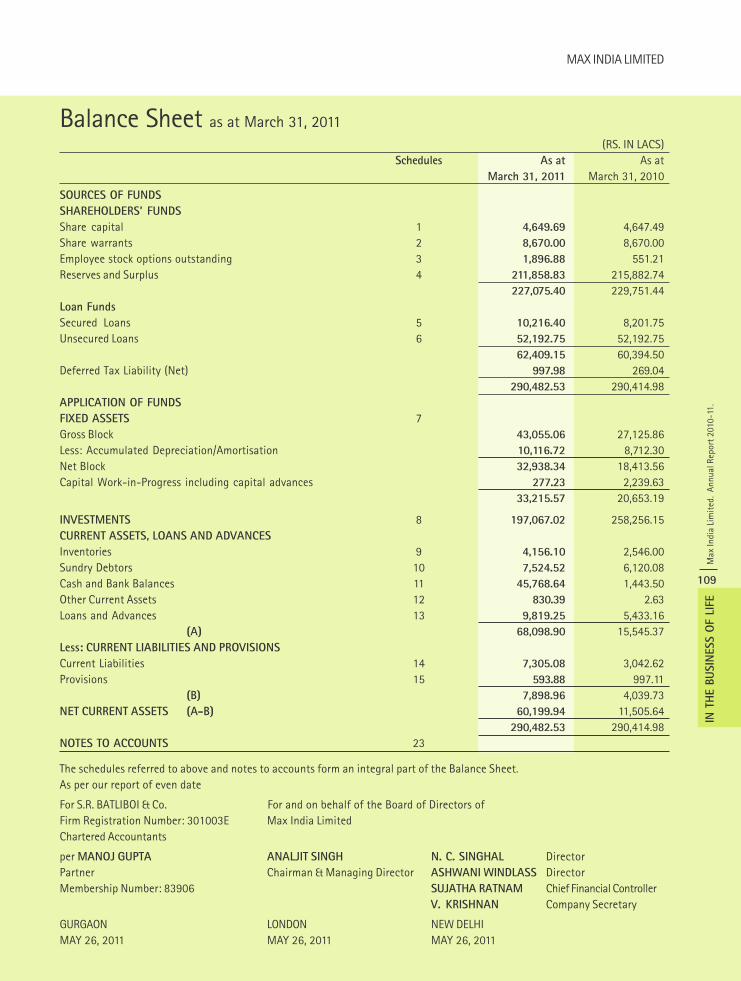
MAX INDIA LIMITED
Max
Indi
a Li
mit
ed.
Annu
al R
epor
t 201
0-11
.
109
IN T
HE B
USIN
ESS O
F LI
FE
Balance Sheet as at March 31, 2011(RS. IN LACS)
Schedules As at As atMarch 31, 2011 March 31, 2010
SOURCES OF FUNDS
SHAREHOLDERS’ FUNDS
Share capital 1 4,649.69 4,647.49Share warrants 2 8,670.00 8,670.00Employee stock options outstanding 3 1,896.88 551.21Reserves and Surplus 4 211,858.83 215,882.74
227,075.40 229,751.44Loan Funds
Secured Loans 5 10,216.40 8,201.75Unsecured Loans 6 52,192.75 52,192.75
62,409.15 60,394.50Deferred Tax Liability (Net) 997.98 269.04
290,482.53 290,414.98APPLICATION OF FUNDS
FIXED ASSETS 7Gross Block 43,055.06 27,125.86Less: Accumulated Depreciation/Amortisation 10,116.72 8,712.30Net Block 32,938.34 18,413.56Capital Work-in-Progress including capital advances 277.23 2,239.63
33,215.57 20,653.19
INVESTMENTS 8 197,067.02 258,256.15CURRENT ASSETS, LOANS AND ADVANCES
Inventories 9 4,156.10 2,546.00Sundry Debtors 10 7,524.52 6,120.08Cash and Bank Balances 11 45,768.64 1,443.50Other Current Assets 12 830.39 2.63Loans and Advances 13 9,819.25 5,433.16
(A) 68,098.90 15,545.37Less: CURRENT LIABILITIES AND PROVISIONS
Current Liabilities 14 7,305.08 3,042.62Provisions 15 593.88 997.11
(B) 7,898.96 4,039.73NET CURRENT ASSETS (A-B) 60,199.94 11,505.64
290,482.53 290,414.98NOTES TO ACCOUNTS 23
The schedules referred to above and notes to accounts form an integral part of the Balance Sheet.As per our report of even date
For S.R. BATLIBOI & Co. For and on behalf of the Board of Directors ofFirm Registration Number: 301003E Max India LimitedChartered Accountants
per MANOJ GUPTA ANALJIT SINGH N. C. SINGHAL DirectorPartner Chairman & Managing Director ASHWANI WINDLASS DirectorMembership Number: 83906 SUJATHA RATNAM Chief Financial Controller
V. KRISHNAN Company Secretary
GURGAON LONDON NEW DELHIMAY 26, 2011 MAY 26, 2011 MAY 26, 2011
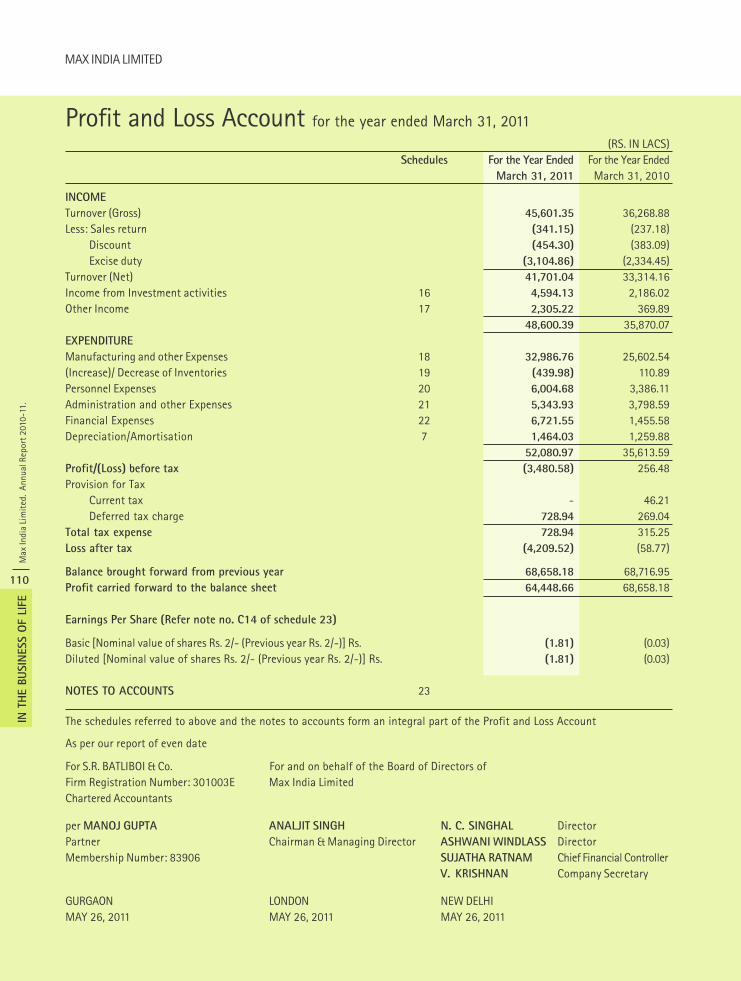
Max
Indi
a Li
mit
ed.
Annu
al R
epor
t 201
0-11
.
110
IN T
HE B
USIN
ESS O
F LI
FE
MAX INDIA LIMITED
Profit and Loss Account for the year ended March 31, 2011(RS. IN LACS)
Schedules For the Year Ended For the Year EndedMarch 31, 2011 March 31, 2010
INCOME
Turnover (Gross) 45,601.35 36,268.88Less: Sales return (341.15) (237.18)
Discount (454.30) (383.09)Excise duty (3,104.86) (2,334.45)
Turnover (Net) 41,701.04 33,314.16Income from Investment activities 16 4,594.13 2,186.02Other Income 17 2,305.22 369.89
48,600.39 35,870.07EXPENDITURE
Manufacturing and other Expenses 18 32,986.76 25,602.54(Increase)/ Decrease of Inventories 19 (439.98) 110.89Personnel Expenses 20 6,004.68 3,386.11Administration and other Expenses 21 5,343.93 3,798.59Financial Expenses 22 6,721.55 1,455.58Depreciation/Amortisation 7 1,464.03 1,259.88
52,080.97 35,613.59Profit/(Loss) before tax (3,480.58) 256.48Provision for Tax
Current tax - 46.21Deferred tax charge 728.94 269.04
Total tax expense 728.94 315.25Loss after tax (4,209.52) (58.77)
Balance brought forward from previous year 68,658.18 68,716.95Profit carried forward to the balance sheet 64,448.66 68,658.18
Earnings Per Share (Refer note no. C14 of schedule 23)
Basic [Nominal value of shares Rs. 2/- (Previous year Rs. 2/-)] Rs. (1.81) (0.03)Diluted [Nominal value of shares Rs. 2/- (Previous year Rs. 2/-)] Rs. (1.81) (0.03)
NOTES TO ACCOUNTS 23
The schedules referred to above and the notes to accounts form an integral part of the Profit and Loss Account
As per our report of even date
For S.R. BATLIBOI & Co. For and on behalf of the Board of Directors ofFirm Registration Number: 301003E Max India LimitedChartered Accountants
per MANOJ GUPTA ANALJIT SINGH N. C. SINGHAL DirectorPartner Chairman & Managing Director ASHWANI WINDLASS DirectorMembership Number: 83906 SUJATHA RATNAM Chief Financial Controller
V. KRISHNAN Company Secretary
GURGAON LONDON NEW DELHIMAY 26, 2011 MAY 26, 2011 MAY 26, 2011
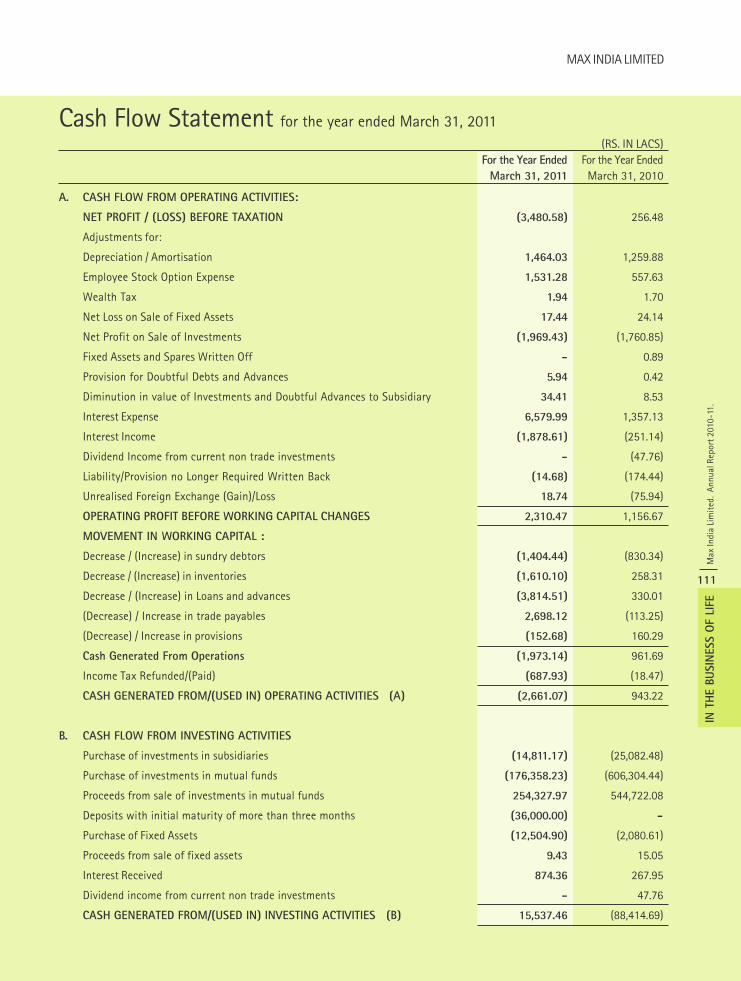
MAX INDIA LIMITED
Max
Indi
a Li
mit
ed.
Annu
al R
epor
t 201
0-11
.
111
IN T
HE B
USIN
ESS O
F LI
FE
Cash Flow Statement for the year ended March 31, 2011(RS. IN LACS)
For the Year Ended For the Year EndedMarch 31, 2011 March 31, 2010
A. CASH FLOW FROM OPERATING ACTIVITIES:
NET PROFIT / (LOSS) BEFORE TAXATION (3,480.58) 256.48
Adjustments for:
Depreciation / Amortisation 1,464.03 1,259.88
Employee Stock Option Expense 1,531.28 557.63
Wealth Tax 1.94 1.70
Net Loss on Sale of Fixed Assets 17.44 24.14
Net Profit on Sale of Investments (1,969.43) (1,760.85)
Fixed Assets and Spares Written Off - 0.89
Provision for Doubtful Debts and Advances 5.94 0.42
Diminution in value of Investments and Doubtful Advances to Subsidiary 34.41 8.53
Interest Expense 6,579.99 1,357.13
Interest Income (1,878.61) (251.14)
Dividend Income from current non trade investments - (47.76)
Liability/Provision no Longer Required Written Back (14.68) (174.44)
Unrealised Foreign Exchange (Gain)/Loss 18.74 (75.94)
OPERATING PROFIT BEFORE WORKING CAPITAL CHANGES 2,310.47 1,156.67
MOVEMENT IN WORKING CAPITAL :
Decrease / (Increase) in sundry debtors (1,404.44) (830.34)
Decrease / (Increase) in inventories (1,610.10) 258.31
Decrease / (Increase) in Loans and advances (3,814.51) 330.01
(Decrease) / Increase in trade payables 2,698.12 (113.25)
(Decrease) / Increase in provisions (152.68) 160.29
Cash Generated From Operations (1,973.14) 961.69
Income Tax Refunded/(Paid) (687.93) (18.47)
CASH GENERATED FROM/(USED IN) OPERATING ACTIVITIES (A) (2,661.07) 943.22
B. CASH FLOW FROM INVESTING ACTIVITIES
Purchase of investments in subsidiaries (14,811.17) (25,082.48)
Purchase of investments in mutual funds (176,358.23) (606,304.44)
Proceeds from sale of investments in mutual funds 254,327.97 544,722.08
Deposits with initial maturity of more than three months (36,000.00) -
Purchase of Fixed Assets (12,504.90) (2,080.61)
Proceeds from sale of fixed assets 9.43 15.05
Interest Received 874.36 267.95
Dividend income from current non trade investments - 47.76
CASH GENERATED FROM/(USED IN) INVESTING ACTIVITIES (B) 15,537.46 (88,414.69)
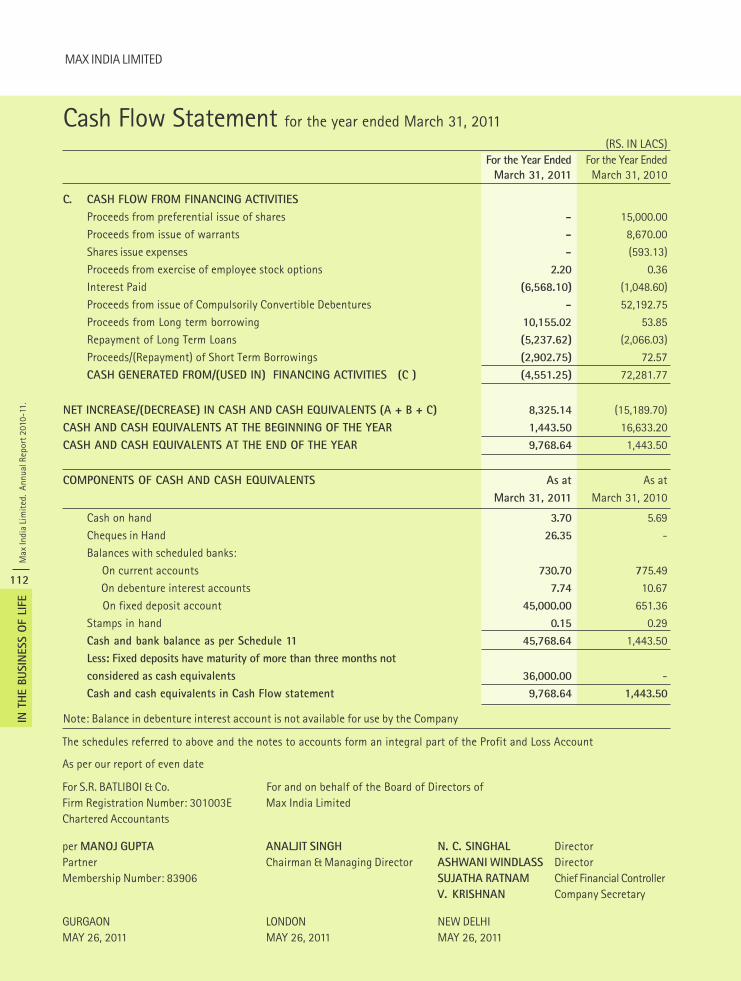
Max
Indi
a Li
mit
ed.
Annu
al R
epor
t 201
0-11
.
112
IN T
HE B
USIN
ESS O
F LI
FE
MAX INDIA LIMITED
Cash Flow Statement for the year ended March 31, 2011(RS. IN LACS)
For the Year Ended For the Year EndedMarch 31, 2011 March 31, 2010
C. CASH FLOW FROM FINANCING ACTIVITIES
Proceeds from preferential issue of shares - 15,000.00
Proceeds from issue of warrants - 8,670.00
Shares issue expenses - (593.13)
Proceeds from exercise of employee stock options 2.20 0.36
Interest Paid (6,568.10) (1,048.60)
Proceeds from issue of Compulsorily Convertible Debentures - 52,192.75
Proceeds from Long term borrowing 10,155.02 53.85
Repayment of Long Term Loans (5,237.62) (2,066.03)
Proceeds/(Repayment) of Short Term Borrowings (2,902.75) 72.57
CASH GENERATED FROM/(USED IN) FINANCING ACTIVITIES (C ) (4,551.25) 72,281.77
NET INCREASE/(DECREASE) IN CASH AND CASH EQUIVALENTS (A + B + C) 8,325.14 (15,189.70)
CASH AND CASH EQUIVALENTS AT THE BEGINNING OF THE YEAR 1,443.50 16,633.20
CASH AND CASH EQUIVALENTS AT THE END OF THE YEAR 9,768.64 1,443.50
COMPONENTS OF CASH AND CASH EQUIVALENTS As at As at
March 31, 2011 March 31, 2010
Cash on hand 3.70 5.69
Cheques in Hand 26.35 -
Balances with scheduled banks:
On current accounts 730.70 775.49
On debenture interest accounts 7.74 10.67
On fixed deposit account 45,000.00 651.36
Stamps in hand 0.15 0.29
Cash and bank balance as per Schedule 11 45,768.64 1,443.50
Less: Fixed deposits have maturity of more than three months not
considered as cash equivalents 36,000.00 -
Cash and cash equivalents in Cash Flow statement 9,768.64 1,443.50
Note: Balance in debenture interest account is not available for use by the Company
The schedules referred to above and the notes to accounts form an integral part of the Profit and Loss Account
As per our report of even date
For S.R. BATLIBOI & Co. For and on behalf of the Board of Directors ofFirm Registration Number: 301003E Max India LimitedChartered Accountants
per MANOJ GUPTA ANALJIT SINGH N. C. SINGHAL DirectorPartner Chairman & Managing Director ASHWANI WINDLASS DirectorMembership Number: 83906 SUJATHA RATNAM Chief Financial Controller
V. KRISHNAN Company Secretary
GURGAON LONDON NEW DELHIMAY 26, 2011 MAY 26, 2011 MAY 26, 2011
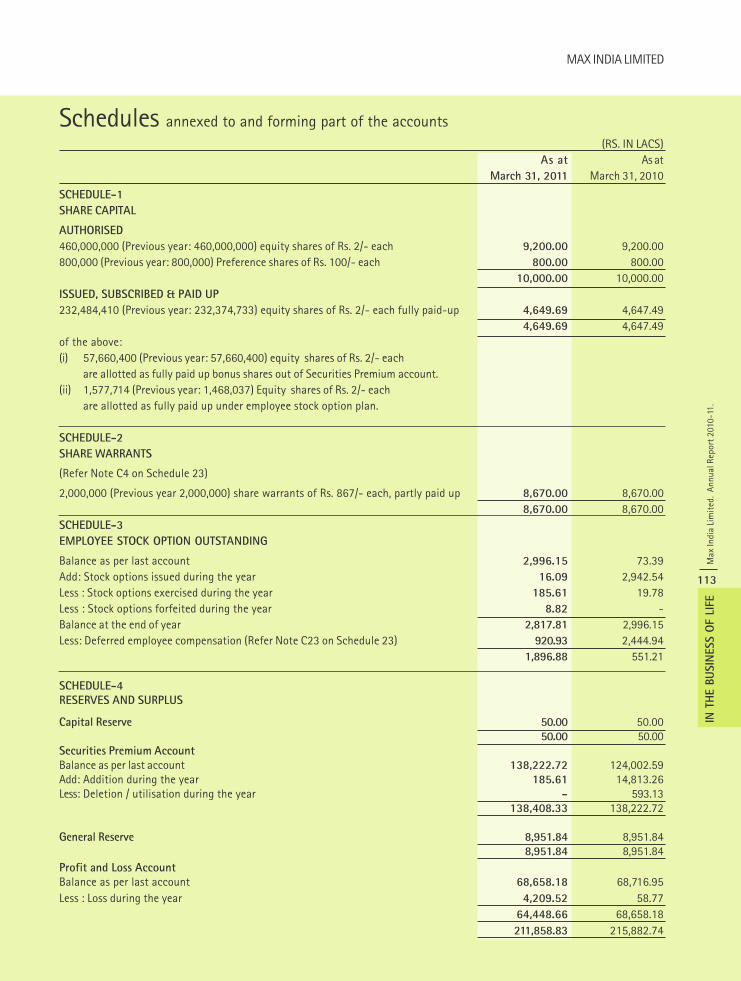
MAX INDIA LIMITED
Max
Indi
a Li
mit
ed.
Annu
al R
epor
t 201
0-11
.
113
IN T
HE B
USIN
ESS O
F LI
FE
Schedules annexed to and forming part of the accounts(RS. IN LACS)
As at As atMarch 31, 2011 March 31, 2010
SCHEDULE-1
SHARE CAPITAL
AUTHORISED
460,000,000 (Previous year: 460,000,000) equity shares of Rs. 2/- each 9,200.00 9,200.00800,000 (Previous year: 800,000) Preference shares of Rs. 100/- each 800.00 800.00
10,000.00 10,000.00ISSUED, SUBSCRIBED & PAID UP
232,484,410 (Previous year: 232,374,733) equity shares of Rs. 2/- each fully paid-up 4,649.69 4,647.49 4,649.69 4,647.49
of the above:(i) 57,660,400 (Previous year: 57,660,400) equity shares of Rs. 2/- each
are allotted as fully paid up bonus shares out of Securities Premium account.(ii) 1,577,714 (Previous year: 1,468,037) Equity shares of Rs. 2/- each
are allotted as fully paid up under employee stock option plan.
SCHEDULE-2
SHARE WARRANTS
(Refer Note C4 on Schedule 23)
2,000,000 (Previous year 2,000,000) share warrants of Rs. 867/- each, partly paid up 8,670.00 8,670.00 8,670.00 8,670.00
SCHEDULE-3
EMPLOYEE STOCK OPTION OUTSTANDING
Balance as per last account 2,996.15 73.39Add: Stock options issued during the year 16.09 2,942.54Less : Stock options exercised during the year 185.61 19.78Less : Stock options forfeited during the year 8.82 -Balance at the end of year 2,817.81 2,996.15Less: Deferred employee compensation (Refer Note C23 on Schedule 23) 920.93 2,444.94
1,896.88 551.21
SCHEDULE-4RESERVES AND SURPLUS
Capital Reserve 50.00 50.0050.00 50.00
Securities Premium AccountBalance as per last account 138,222.72 124,002.59Add: Addition during the year 185.61 14,813.26Less: Deletion / utilisation during the year - 593.13
138,408.33 138,222.72
General Reserve 8,951.84 8,951.848,951.84 8,951.84
Profit and Loss AccountBalance as per last account 68,658.18 68,716.95Less : Loss during the year 4,209.52 58.77
64,448.66 68,658.18211,858.83 215,882.74
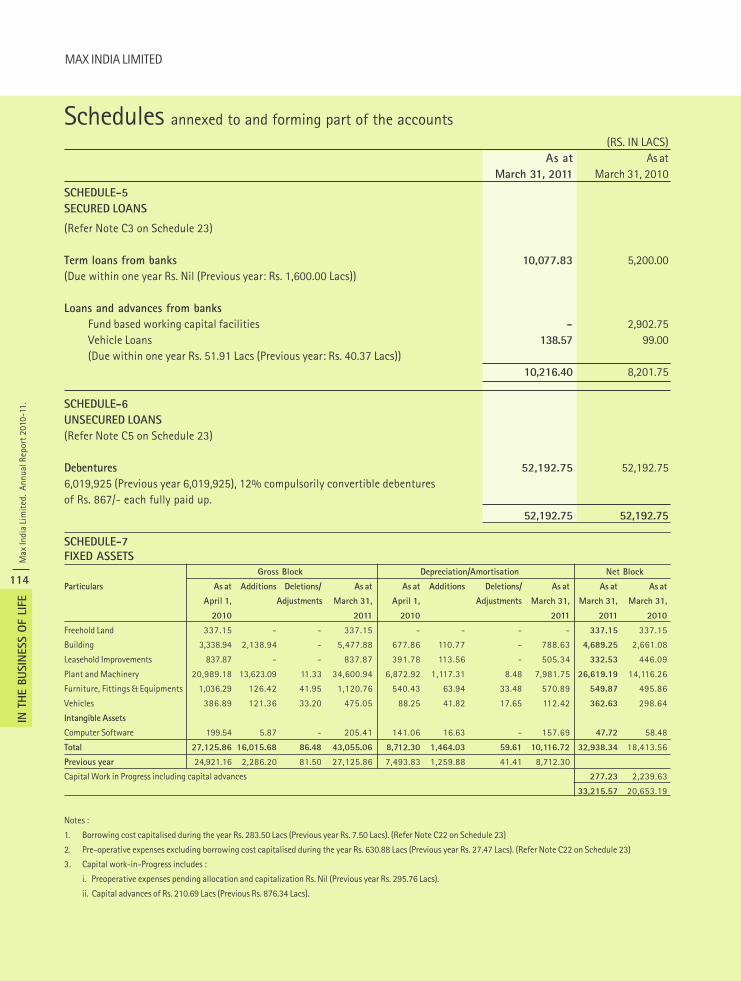
Max
Indi
a Li
mit
ed.
Annu
al R
epor
t 201
0-11
.
114
IN T
HE B
USIN
ESS O
F LI
FE
MAX INDIA LIMITED
Schedules annexed to and forming part of the accounts(RS. IN LACS)
As at As atMarch 31, 2011 March 31, 2010
SCHEDULE-5
SECURED LOANS
(Refer Note C3 on Schedule 23)
Term loans from banks 10,077.83 5,200.00(Due within one year Rs. Nil (Previous year: Rs. 1,600.00 Lacs))
Loans and advances from banks
Fund based working capital facilities - 2,902.75Vehicle Loans 138.57 99.00(Due within one year Rs. 51.91 Lacs (Previous year: Rs. 40.37 Lacs))
10,216.40 8,201.75
SCHEDULE-6
UNSECURED LOANS
(Refer Note C5 on Schedule 23)
Debentures 52,192.75 52,192.756,019,925 (Previous year 6,019,925), 12% compulsorily convertible debenturesof Rs. 867/- each fully paid up.
52,192.75 52,192.75
SCHEDULE-7
FIXED ASSETS
Gross Block Depreciation/Amortisation Net Block
Particulars As at Additions Deletions/ As at As at Additions Deletions/ As at As at As at
April 1, Adjustments March 31, April 1, Adjustments March 31, March 31, March 31,
2010 2011 2010 2011 2011 2010
Freehold Land 337.15 - - 337.15 - - - - 337.15 337.15
Building 3,338.94 2,138.94 - 5,477.88 677.86 110.77 - 788.63 4,689.25 2,661.08
Leasehold Improvements 837.87 - - 837.87 391.78 113.56 - 505.34 332.53 446.09
Plant and Machinery 20,989.18 13,623.09 11.33 34,600.94 6,872.92 1,117.31 8.48 7,981.75 26,619.19 14,116.26
Furniture, Fittings & Equipments 1,036.29 126.42 41.95 1,120.76 540.43 63.94 33.48 570.89 549.87 495.86
Vehicles 386.89 121.36 33.20 475.05 88.25 41.82 17.65 112.42 362.63 298.64
Intangible Assets
Computer Software 199.54 5.87 - 205.41 141.06 16.63 - 157.69 47.72 58.48
Total 27,125.86 16,015.68 86.48 43,055.06 8,712.30 1,464.03 59.61 10,116.72 32,938.34 18,413.56
Previous year 24,921.16 2,286.20 81.50 27,125.86 7,493.83 1,259.88 41.41 8,712.30
Capital Work in Progress including capital advances 277.23 2,239.63
33,215.57 20,653.19
Notes :
1. Borrowing cost capitalised during the year Rs. 283.50 Lacs (Previous year Rs. 7.50 Lacs). (Refer Note C22 on Schedule 23)
2. Pre-operative expenses excluding borrowing cost capitalised during the year Rs. 630.88 Lacs (Previous year Rs. 27.47 Lacs). (Refer Note C22 on Schedule 23)
3. Capital work-in-Progress includes :
i. Preoperative expenses pending allocation and capitalization Rs. Nil (Previous year Rs. 295.76 Lacs).
ii. Capital advances of Rs. 210.69 Lacs (Previous Rs. 876.34 Lacs).
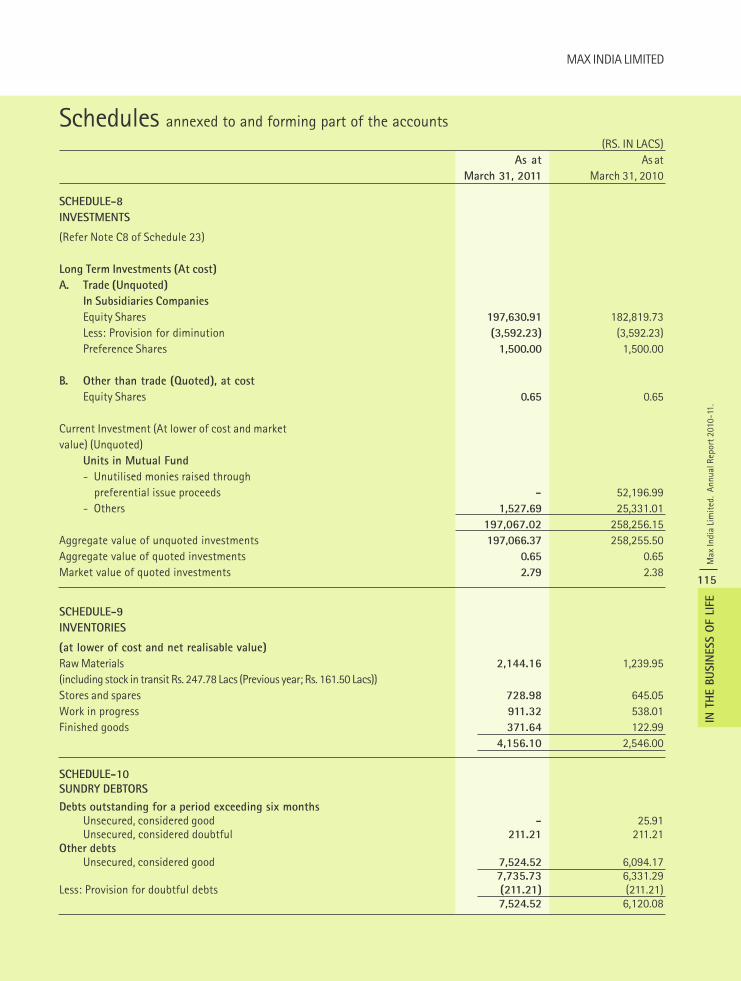
MAX INDIA LIMITED
Max
Indi
a Li
mit
ed.
Annu
al R
epor
t 201
0-11
.
115
IN T
HE B
USIN
ESS O
F LI
FE
Schedules annexed to and forming part of the accounts(RS. IN LACS)
As at As atMarch 31, 2011 March 31, 2010
SCHEDULE-8
INVESTMENTS
(Refer Note C8 of Schedule 23)
Long Term Investments (At cost)
A. Trade (Unquoted)
In Subsidiaries Companies
Equity Shares 197,630.91 182,819.73Less: Provision for diminution (3,592.23) (3,592.23)Preference Shares 1,500.00 1,500.00
B. Other than trade (Quoted), at cost
Equity Shares 0.65 0.65
Current Investment (At lower of cost and marketvalue) (Unquoted)
Units in Mutual Fund
- Unutilised monies raised through preferential issue proceeds - 52,196.99- Others 1,527.69 25,331.01
197,067.02 258,256.15Aggregate value of unquoted investments 197,066.37 258,255.50Aggregate value of quoted investments 0.65 0.65Market value of quoted investments 2.79 2.38
SCHEDULE-9
INVENTORIES
(at lower of cost and net realisable value)
Raw Materials 2,144.16 1,239.95(including stock in transit Rs. 247.78 Lacs (Previous year; Rs. 161.50 Lacs))Stores and spares 728.98 645.05Work in progress 911.32 538.01Finished goods 371.64 122.99
4,156.10 2,546.00
SCHEDULE-10
SUNDRY DEBTORS
Debts outstanding for a period exceeding six monthsUnsecured, considered good - 25.91Unsecured, considered doubtful 211.21 211.21
Other debtsUnsecured, considered good 7,524.52 6,094.17
7,735.73 6,331.29Less: Provision for doubtful debts (211.21) (211.21)
7,524.52 6,120.08
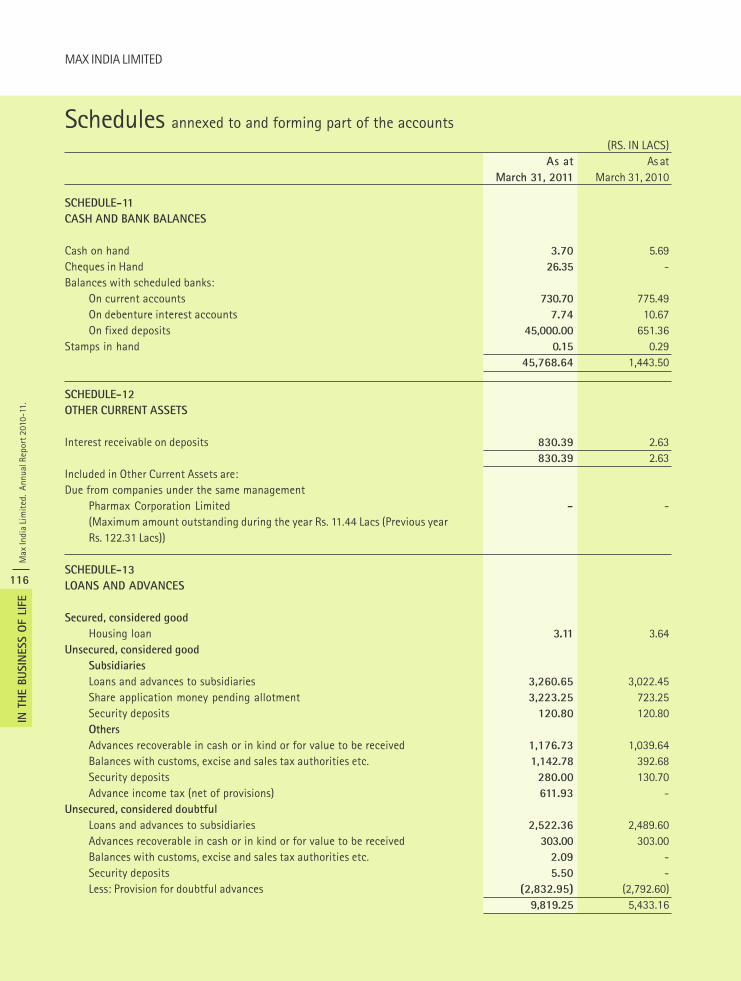
Max
Indi
a Li
mit
ed.
Annu
al R
epor
t 201
0-11
.
116
IN T
HE B
USIN
ESS O
F LI
FE
MAX INDIA LIMITED
Schedules annexed to and forming part of the accounts(RS. IN LACS)
As at As atMarch 31, 2011 March 31, 2010
SCHEDULE-11
CASH AND BANK BALANCES
Cash on hand 3.70 5.69Cheques in Hand 26.35 -Balances with scheduled banks:
On current accounts 730.70 775.49On debenture interest accounts 7.74 10.67On fixed deposits 45,000.00 651.36
Stamps in hand 0.15 0.29 45,768.64 1,443.50
SCHEDULE-12
OTHER CURRENT ASSETS
Interest receivable on deposits 830.39 2.63 830.39 2.63
Included in Other Current Assets are:Due from companies under the same management
Pharmax Corporation Limited - -(Maximum amount outstanding during the year Rs. 11.44 Lacs (Previous yearRs. 122.31 Lacs))
SCHEDULE-13
LOANS AND ADVANCES
Secured, considered good
Housing loan 3.11 3.64Unsecured, considered good
Subsidiaries
Loans and advances to subsidiaries 3,260.65 3,022.45Share application money pending allotment 3,223.25 723.25Security deposits 120.80 120.80Others
Advances recoverable in cash or in kind or for value to be received 1,176.73 1,039.64Balances with customs, excise and sales tax authorities etc. 1,142.78 392.68Security deposits 280.00 130.70Advance income tax (net of provisions) 611.93 -
Unsecured, considered doubtful
Loans and advances to subsidiaries 2,522.36 2,489.60Advances recoverable in cash or in kind or for value to be received 303.00 303.00Balances with customs, excise and sales tax authorities etc. 2.09 -Security deposits 5.50 -Less: Provision for doubtful advances (2,832.95) (2,792.60)
9,819.25 5,433.16
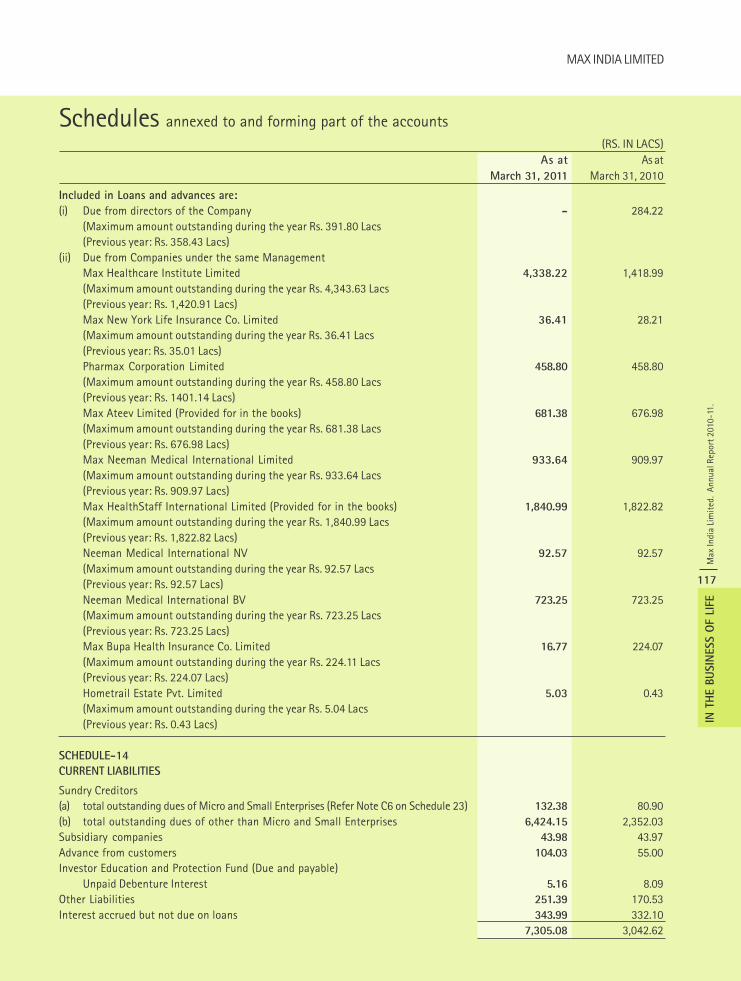
MAX INDIA LIMITED
Max
Indi
a Li
mit
ed.
Annu
al R
epor
t 201
0-11
.
117
IN T
HE B
USIN
ESS O
F LI
FE
Schedules annexed to and forming part of the accounts(RS. IN LACS)
As at As atMarch 31, 2011 March 31, 2010
Included in Loans and advances are:
(i) Due from directors of the Company - 284.22(Maximum amount outstanding during the year Rs. 391.80 Lacs(Previous year: Rs. 358.43 Lacs)
(ii) Due from Companies under the same ManagementMax Healthcare Institute Limited 4,338.22 1,418.99(Maximum amount outstanding during the year Rs. 4,343.63 Lacs(Previous year: Rs. 1,420.91 Lacs)Max New York Life Insurance Co. Limited 36.41 28.21(Maximum amount outstanding during the year Rs. 36.41 Lacs(Previous year: Rs. 35.01 Lacs)Pharmax Corporation Limited 458.80 458.80(Maximum amount outstanding during the year Rs. 458.80 Lacs(Previous year: Rs. 1401.14 Lacs)Max Ateev Limited (Provided for in the books) 681.38 676.98(Maximum amount outstanding during the year Rs. 681.38 Lacs(Previous year: Rs. 676.98 Lacs)Max Neeman Medical International Limited 933.64 909.97(Maximum amount outstanding during the year Rs. 933.64 Lacs(Previous year: Rs. 909.97 Lacs)Max HealthStaff International Limited (Provided for in the books) 1,840.99 1,822.82(Maximum amount outstanding during the year Rs. 1,840.99 Lacs(Previous year: Rs. 1,822.82 Lacs)Neeman Medical International NV 92.57 92.57(Maximum amount outstanding during the year Rs. 92.57 Lacs(Previous year: Rs. 92.57 Lacs)Neeman Medical International BV 723.25 723.25(Maximum amount outstanding during the year Rs. 723.25 Lacs(Previous year: Rs. 723.25 Lacs)Max Bupa Health Insurance Co. Limited 16.77 224.07(Maximum amount outstanding during the year Rs. 224.11 Lacs(Previous year: Rs. 224.07 Lacs)Hometrail Estate Pvt. Limited 5.03 0.43(Maximum amount outstanding during the year Rs. 5.04 Lacs(Previous year: Rs. 0.43 Lacs)
SCHEDULE-14
CURRENT LIABILITIES
Sundry Creditors(a) total outstanding dues of Micro and Small Enterprises (Refer Note C6 on Schedule 23) 132.38 80.90(b) total outstanding dues of other than Micro and Small Enterprises 6,424.15 2,352.03Subsidiary companies 43.98 43.97Advance from customers 104.03 55.00Investor Education and Protection Fund (Due and payable)
Unpaid Debenture Interest 5.16 8.09Other Liabilities 251.39 170.53Interest accrued but not due on loans 343.99 332.10
7,305.08 3,042.62
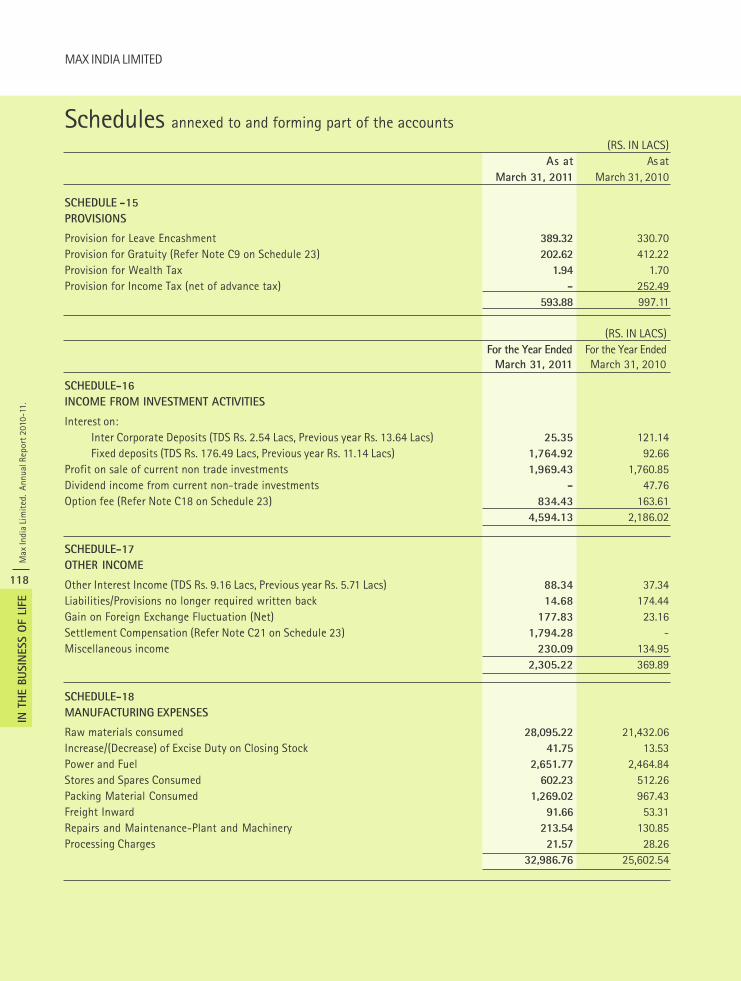
Max
Indi
a Li
mit
ed.
Annu
al R
epor
t 201
0-11
.
118
IN T
HE B
USIN
ESS O
F LI
FE
MAX INDIA LIMITED
Schedules annexed to and forming part of the accounts(RS. IN LACS)
As at As atMarch 31, 2011 March 31, 2010
SCHEDULE -15
PROVISIONS
Provision for Leave Encashment 389.32 330.70Provision for Gratuity (Refer Note C9 on Schedule 23) 202.62 412.22Provision for Wealth Tax 1.94 1.70Provision for Income Tax (net of advance tax) - 252.49
593.88 997.11
SCHEDULE-16
INCOME FROM INVESTMENT ACTIVITIES
Interest on: Inter Corporate Deposits (TDS Rs. 2.54 Lacs, Previous year Rs. 13.64 Lacs) 25.35 121.14 Fixed deposits (TDS Rs. 176.49 Lacs, Previous year Rs. 11.14 Lacs) 1,764.92 92.66
Profit on sale of current non trade investments 1,969.43 1,760.85Dividend income from current non-trade investments - 47.76Option fee (Refer Note C18 on Schedule 23) 834.43 163.61
4,594.13 2,186.02
SCHEDULE-17
OTHER INCOME
Other Interest Income (TDS Rs. 9.16 Lacs, Previous year Rs. 5.71 Lacs) 88.34 37.34Liabilities/Provisions no longer required written back 14.68 174.44Gain on Foreign Exchange Fluctuation (Net) 177.83 23.16Settlement Compensation (Refer Note C21 on Schedule 23) 1,794.28 -Miscellaneous income 230.09 134.95
2,305.22 369.89
SCHEDULE-18
MANUFACTURING EXPENSES
Raw materials consumed 28,095.22 21,432.06Increase/(Decrease) of Excise Duty on Closing Stock 41.75 13.53Power and Fuel 2,651.77 2,464.84Stores and Spares Consumed 602.23 512.26Packing Material Consumed 1,269.02 967.43Freight Inward 91.66 53.31Repairs and Maintenance-Plant and Machinery 213.54 130.85Processing Charges 21.57 28.26
32,986.76 25,602.54
(RS. IN LACS)For the Year Ended For the Year Ended
March 31, 2011 March 31, 2010
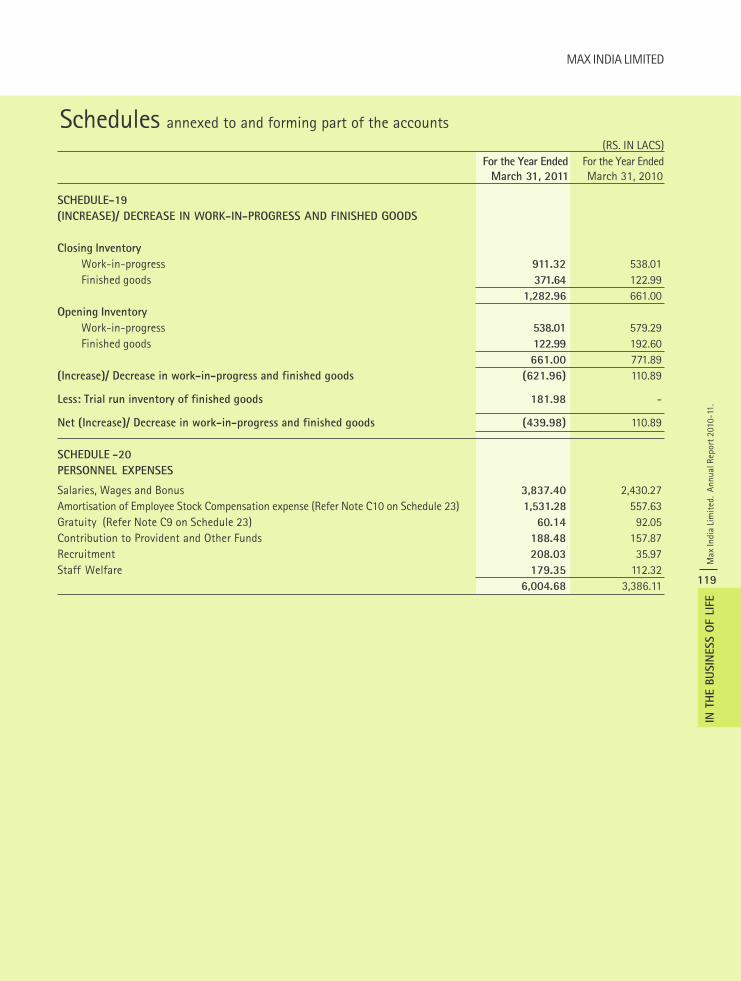
MAX INDIA LIMITED
Max
Indi
a Li
mit
ed.
Annu
al R
epor
t 201
0-11
.
119
IN T
HE B
USIN
ESS O
F LI
FE
SCHEDULE-19
(INCREASE)/ DECREASE IN WORK-IN-PROGRESS AND FINISHED GOODS
Closing Inventory
Work-in-progress 911.32 538.01Finished goods 371.64 122.99
1,282.96 661.00Opening Inventory
Work-in-progress 538.01 579.29Finished goods 122.99 192.60
661.00 771.89(Increase)/ Decrease in work-in-progress and finished goods (621.96) 110.89
Less: Trial run inventory of finished goods 181.98 -
Net (Increase)/ Decrease in work-in-progress and finished goods (439.98) 110.89
SCHEDULE -20
PERSONNEL EXPENSES
Salaries, Wages and Bonus 3,837.40 2,430.27Amortisation of Employee Stock Compensation expense (Refer Note C10 on Schedule 23) 1,531.28 557.63Gratuity (Refer Note C9 on Schedule 23) 60.14 92.05Contribution to Provident and Other Funds 188.48 157.87Recruitment 208.03 35.97Staff Welfare 179.35 112.32
6,004.68 3,386.11
Schedules annexed to and forming part of the accounts(RS. IN LACS)
For the Year Ended For the Year EndedMarch 31, 2011 March 31, 2010
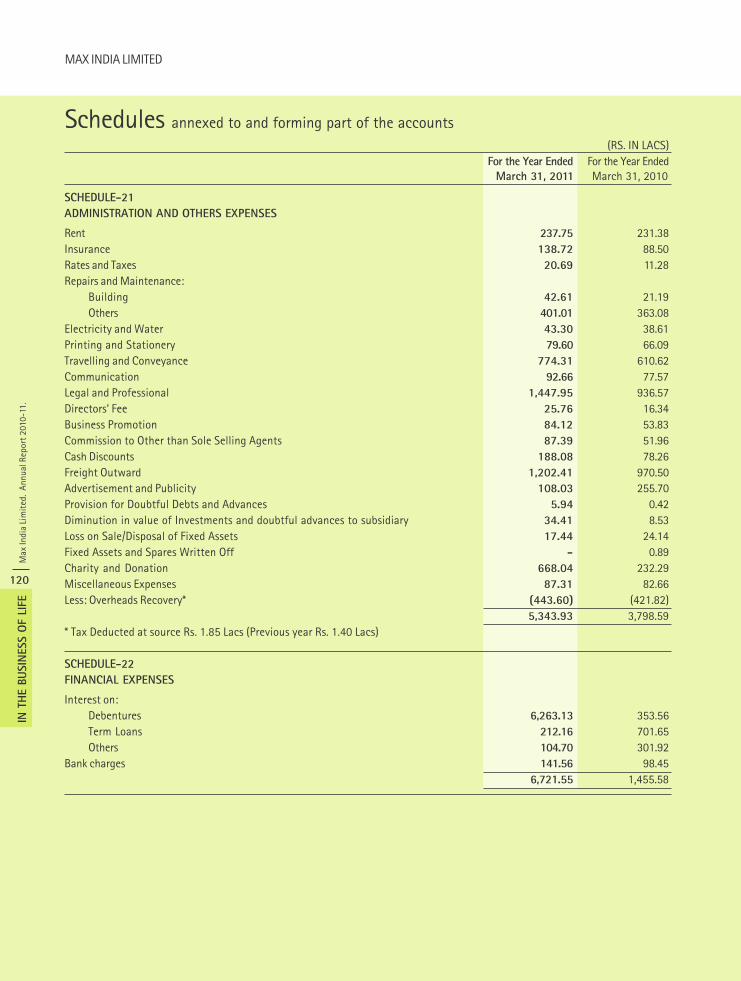
Max
Indi
a Li
mit
ed.
Annu
al R
epor
t 201
0-11
.
120
IN T
HE B
USIN
ESS O
F LI
FE
MAX INDIA LIMITED
Schedules annexed to and forming part of the accounts(RS. IN LACS)
For the Year Ended For the Year EndedMarch 31, 2011 March 31, 2010
SCHEDULE-21
ADMINISTRATION AND OTHERS EXPENSES
Rent 237.75 231.38Insurance 138.72 88.50Rates and Taxes 20.69 11.28Repairs and Maintenance:
Building 42.61 21.19Others 401.01 363.08
Electricity and Water 43.30 38.61Printing and Stationery 79.60 66.09Travelling and Conveyance 774.31 610.62Communication 92.66 77.57Legal and Professional 1,447.95 936.57Directors’ Fee 25.76 16.34Business Promotion 84.12 53.83Commission to Other than Sole Selling Agents 87.39 51.96Cash Discounts 188.08 78.26Freight Outward 1,202.41 970.50Advertisement and Publicity 108.03 255.70Provision for Doubtful Debts and Advances 5.94 0.42Diminution in value of Investments and doubtful advances to subsidiary 34.41 8.53Loss on Sale/Disposal of Fixed Assets 17.44 24.14Fixed Assets and Spares Written Off - 0.89Charity and Donation 668.04 232.29Miscellaneous Expenses 87.31 82.66Less: Overheads Recovery* (443.60) (421.82)
5,343.93 3,798.59* Tax Deducted at source Rs. 1.85 Lacs (Previous year Rs. 1.40 Lacs)
SCHEDULE-22
FINANCIAL EXPENSES
Interest on:Debentures 6,263.13 353.56Term Loans 212.16 701.65Others 104.70 301.92
Bank charges 141.56 98.456,721.55 1,455.58
MAX INDIA LIMITED
Max
Indi
a Li
mit
ed.
Annu
al R
epor
t 201
0-11
.
121
IN T
HE B
USIN
ESS O
F LI
FE
Schedules annexed to and forming part of the accounts
SCHEDULE 23: NOTES TO ACCOUNTS
A. NATURE OF OPERATIONS
Max India Limited is a Company registered under the Companies Act, 1956, listed on National Stock Exchange and BombayStock Exchange. Max India Limited is a leading manufacturer of speciality plastic film products for packaging industry.Further, the Company has invested in various subsidiaries in diversified businesses such as healthcare, life insurance, healthinsurance, clinical research, etc.
B. STATEMENT OF SIGNIFICANT ACCOUNTING POLICIES
(1) Basis of preparation
The financial statements have been prepared to comply in all material respects with the Accounting Standards notified byCompanies (Accounting Standards) Rules, 2006 (as amended) and the relevant provisions of the Companies Act, 1956. Thefinancial statements have been prepared under the historical cost convention on an accrual basis. The accounting policies havebeen consistently applied by the Company and are consistent with those used in the previous year.
(2) Use of Estimates
The preparation of financial statements in conformity with generally accepted accounting principles requires management tomake estimates and assumptions that affect the reported amount of assets and liabilities and disclosure of contingentliabilities at the date of the financial statements and the results of operations during the reporting period. Although theseestimates are based upon management’s best knowledge of current events and actions, actual results could differ from theseestimates.
(3) Fixed Assets
Fixed assets are stated at cost less accumulated depreciation and impairment losses, if any. Cost comprises the purchase priceand any attributable cost of bringing the asset to its working condition for its intended use. Borrowing costs relating toacquisition / construction of fixed assets which take substantial period of time to get ready for its intended use are alsoincluded to the extent they relate to the period till such assets are ready to be put to use.
(4) Depreciation
(i) Depreciation is provided using Straight Line Method on a pro rata basis as per the useful lives of the assets estimatedby the management, the rates prescribed in Schedule XIV to the Companies Act, 1956.
(ii) Leasehold improvements are depreciated over the shorter of the estimated useful life of the asset or the lease term.
(iii) Assets costing Rs. 5,000 or below are depreciated at the rate of 100%.
(iv) Software in the nature of Intangible assets are depreciated over a period of 6 years.
(5) Impairment
(i) The carrying amounts of assets are reviewed at each balance sheet date if there is any indication of impairment basedon internal/ external factors. An impairment loss is recognized wherever the carrying amount of an asset exceeds itsrecoverable amount. The recoverable amount is the greater of the asset’s net selling price and value in use. In assessingvalue in use, the estimated future cash flows are discounted to their present value using a pre-tax discount rate thatreflects current market assessments of the time value of money and risks specific to the asset.
(ii) After impairment, depreciation is provided on the revised carrying amount of the asset over its remaining useful life.
(6) Intangible Assets
Intangible assets are recognised if they are separately identifiable and the Company controls the future economic benefitsarising out of them. Research costs are expensed as incurred. Development expenditure incurred on software implementation
Max
Indi
a Li
mit
ed.
Annu
al R
epor
t 201
0-11
.
122
IN T
HE B
USIN
ESS O
F LI
FE
MAX INDIA LIMITED
is recognized as an intangible asset when its future recoverability can reasonably be regarded as assured and are separatelyidentifiable. Any expenditure so capitalised is amortized over the estimated useful lives of six years on straight line basis.
The carrying value of development costs is reviewed for impairment annually when the asset is not in use, and otherwise whenevents or changes in circumstances indicate that the carrying value may not be recoverable.
(7) Expenditure on new projects
Expenditure directly relating to construction phase is capitalized. Indirect expenditure incurred during construction period iscapitalized as part of the indirect construction cost to the extent it is related to construction or is incidental thereto. Otherindirect expenditure (including borrowing costs) incurred during the construction period which is not related to the constructionactivity nor is incidental thereto is charged to the Profit and Loss Account.
All direct capital expenditure on expansion is capitalized. As regards, indirect expenditure on expansion, only that portion iscapitalized which represents the marginal increase in such expenditure involved as a result of capital expansion. Both directand indirect expenditure are capitalized only if they increase the value of the asset beyond its original standard of performance.
(8) Leases
Leases where the lessor effectively retains substantially all the risks and benefits of ownership of the leased item are classifiedas operating leases. Operating lease payments are recognized as an expense in the Profit and Loss Account on a straight linebasis over the lease term.
(9) Investments
Investments that are readily realisable and intended to be held for not more than a year are classified as current investments.All other investments are classified as long-term investments. Current investments are carried at lower of cost and fair valuedetermined on an individual investment basis.
Long-term investments are carried at cost. However, provision for diminution in the value is made to recognise a decline otherthan temporary in the value of the investments.
(10) Inventories
Inventories are valued as follows:
Schedules annexed to and forming part of the accounts
Lower of cost and net realizable value. However, materials and other items held for use inthe production of inventories are not written down below cost if the finished products inwhich they will be incorporated are expected to be sold at or above cost. Cost is determinedon a weighted average basis.Lower of cost and net realizable value. Cost includes direct material and labour and aproportion of manufacturing overheads based on normal operating capacity. Cost offinished goods includes excise duty. Cost is determined on a weighted average basis.
Net Realisable value is the estimated selling price in the ordinary course of business, less estimated costs of completion andthe estimated costs necessary to make the sale.
(11) Borrowing Costs
Borrowing costs directly attributable to the acquisition, construction or production of an asset that necessarily takes asubstantial period of time to get ready for its intended use are capitalized as part of the cost of the respective asset. All otherborrowing costs are expensed in the period they occur.Borrowing cost consists of interest and other costs that an entity incurs in connection with the borrowing of funds.
(12) Revenue Recognition
Revenue is recognised to the extent it is probable that the economic benefits will flow to the Company and the revenue canbe reliably measured.
Raw material, packingmaterial, stores and spares
Work-in-progress andfinished goods
MAX INDIA LIMITED
Max
Indi
a Li
mit
ed.
Annu
al R
epor
t 201
0-11
.
123
IN T
HE B
USIN
ESS O
F LI
FE
Schedules annexed to and forming part of the accounts
(i) Sale of goods
Revenue is recognised when the significant risks and rewards of ownership of the goods have passed to the buyer. Exciseduty, sales tax and VAT deducted from turnover (gross) are the amount that is included in the amount of turnover (gross)and not the entire amount of liability arising during the year.
(ii) Income from investments
Revenue is recognised on an accrual basis in accordance with the terms of relevant contracts.
(iii) Interest Income
Revenue is recognised on a time proportion basis taking into account the amount outstanding and the rate applicable.
(iv) Dividend income
Revenue is recognised when the shareholders’ right to receive payment is established by the balance sheet date. Dividendfrom subsidiaries is recognised even if same are declared after the balance sheet date but pertains to period on or beforethe date of balance sheet as per the requirement of Schedule VI of the Companies Act, 1956.
(13) Foreign Currency Translation
(i) Initial recognition
Foreign currency transactions are recorded in the reporting currency, by applying to the foreign currency amount theexchange rate between the reporting currency and the foreign currency at the date of the transaction.
(ii) Conversion
Foreign currency monetary items are reported using the closing rate. Non-monetary items which are carried in terms ofhistorical cost denominated in a foreign currency are reported using the exchange rate at the date of the transaction;and non-monetary items which are carried at fair value or other similar valuation denominated in a foreign currencyare reported using the exchange rates that existed when the values were determined.
(iii) Exchange differences
Exchange differences arising on the settlement of monetary items, or on reporting such monetary items at ratesdifferent from those at which they were initially recorded during the year, or reported in previous financial statements,are recognized as income or as expenses in the year in which they arise.
(iv) Forward exchange contracts not intended for trading or speculation purposes
The premium or discounts arising at the inception of forward exchange contracts is amortised as expense or income overthe life of the contract. Exchange difference on such contracts is recognized in the statement of profit and loss in theyear in which the exchange rate changes. Any profit or loss arising on cancellation or renewal of forward exchangecontracts is recognized as income or expense for the year.
(14) Retirement and other employee benefits
(i) Provident fund
Retirement benefit in the form of Provident Fund is a defined benefit obligation. The Company and its employees arecontributing to a provident fund trust “Max India Limited Employees Provident Fund Trust” and the contributions arecharged to the Profit & Loss Account of the year when the contributions to the respective funds are due. Shortfall in thefund, if any, is adequately provided for by the Company.
Max
Indi
a Li
mit
ed.
Annu
al R
epor
t 201
0-11
.
124
IN T
HE B
USIN
ESS O
F LI
FE
MAX INDIA LIMITED
Schedules annexed to and forming part of the accounts
(ii) Superannuation fund
Superannuation Fund is a defined contribution scheme. Liability in respect of Superannuation Fund is accounted for as per theCompany’s Scheme and contributed by the Company to “Max India Limited Superannuation Fund” every year. The contributionto the fund is charged to the Profit and Loss Account of the year. The Company does not have any other obligation to the fundother than the contribution payable.
(iii) Gratuity
Gratuity liability is a defined benefit obligation and is provided for on the basis of an actuarial valuation on projectedunit credit method made at the end of each financial year. The Company has a recognised gratuity trust “Max IndiaLimited Employees Gratuity Fund” which in turn has taken a policy with LIC to cover the gratuity liability of theemployees. The difference between the actuarial valuation of the gratuity of employees at the year-end and the balanceof funds with LIC is provided for as liability in the books.
(iv) Compensated absences
Short term compensated absences are provided for based on estimates. Long term compensated absences are providedon actuarial valuation at the year end. The actuarial valuation is done as per projected unit credit method.
Actuarial gains/ losses are taken to Profit and Loss Account for the year.
(15) Income Taxes
Tax expense comprises of current and deferred tax. Current income tax is measured at the amount expected to be paid to thetax authorities in accordance with the Indian Income Tax Act, 1961. Deferred income tax reflects the impact of current yeartiming differences between taxable income and accounting income for the year and reversal of timing differences of earlieryears.
Deferred tax is measured based on the tax rates and the tax laws enacted or substantively enacted at the balance sheet date.Deferred tax assets and deferred tax liabilities are offset, if a legally enforceable right exists to set off current tax assets againstcurrent tax liabilities and the deferred tax assets and deferred tax liabilities relate to the taxes on income levied by samegoverning taxation laws. Deferred tax assets are recognised only to the extent that there is reasonable certainty that sufficientfuture taxable income will be available against which such deferred tax assets can be realised. In situation where the Companyhas unabsorbed depreciation or carry forward tax losses, deferred tax assets are recognised only if there is virtual certaintysupported by convincing evidence that such deferred tax assets can be realised against future taxable profits.
At each balance sheet date the Company reassesses deferred tax assets. It recognises unrecognised deferred tax assets to theextent that it has become reasonably certain or virtually certain, as the case may be that sufficient future taxable income willbe available against which such deferred tax assets can be realised.
The carrying amount of deferred tax assets are reviewed at each balance sheet date. The Company writes down the carryingamount of a deferred tax asset to the extent that it is no longer reasonably certain or virtually certain, as the case may be,that sufficient future taxable income will be available against which deferred tax asset can be realised. Any such write-downis reversed to the extent that it becomes reasonably certain or virtually certain, as the case may be, that sufficient futuretaxable income will be available.
(16) Government grants and Subsidies
Grants and subsidies from the government are recognised when there is reasonable assurance that the grant/ subsidy will bereceived and all attaching conditions will be complied.
When the grants and subsidy related to an expense item, it is recognised as income over the periods necessary to match themon a systematic basis to the cost, which it is intended to compensate.
MAX INDIA LIMITED
Max
Indi
a Li
mit
ed.
Annu
al R
epor
t 201
0-11
.
125
IN T
HE B
USIN
ESS O
F LI
FE
Where the grant or subsidy relates to an asset, its value is deducted from the gross value of the asset concerned in arrivingat the carrying amount of the related assets.Government grants of the nature of promoter’s contribution are credited to the capital reserve and treated as a part ofshareholders fund.
(17) Employee Stock Compensation Cost
Measurement and disclosure of the employee share-based payment plans is done in accordance with SEBI (Employee StockOption Scheme) Guidelines, 1999 and the Guidance Note on Accounting for Employee Share-based Payments, issued by theInstitute of Chartered Accountants of India. The Company measures compensation cost relating to employee stock optionsusing the intrinsic value method. Compensation expense is amortized over the vesting period of the option on a straight linebasis.
(18) Segment Reporting Policies
Identification of segments
The Company’s operating businesses are organized and managed separately according to the nature of products and servicesprovided, with each segment representing a strategic business unit that offers different products and serves different markets.The analysis of geographical segments is based on the location of customers.
Allocation of common costs
Common allocable costs are allocated to each segment in proportion to the relative revenue of each segment.
Unallocated items
All the common income, expenses, assets and liabilities, which are not possible to be allocated to different segments, aretreated as unallocated items.
Segment policies
The Company prepares its segment information in conformity with the accounting policies adopted for preparing andpresenting financial statements of the Company as a whole.
(19) Earnings per share
Basic earnings per share are calculated by dividing the net profit or loss for the period attributable to equity shareholders bythe weighted average number of the equity shares outstanding during the period.For the purpose of calculating diluted earnings per share, net profit or loss for the period attributable to equity shareholdersand the weighted average number of shares outstanding during the period are adjusted for the effect of all dilutive potentialequity shares.
(20) Provisions
A provision is recognized when the Company has a present obligation as a result of past event and it is probable that an outflowof resources will be required to settle the obligation, in respect of which a reliable estimate can be made. Provisions are notdiscounted to its present value and are determined based on best management estimate required to settle the obligation at thebalance sheet date. These are reviewed at each balance sheet date and adjusted to reflect the current best estimates.
(21) Cash and Cash equivalents
Cash and cash equivalents for the purpose of cash flow statement comprise cash at bank and in hand and short-terminvestments with an original maturity of three months or less.
Schedules annexed to and forming part of the accounts
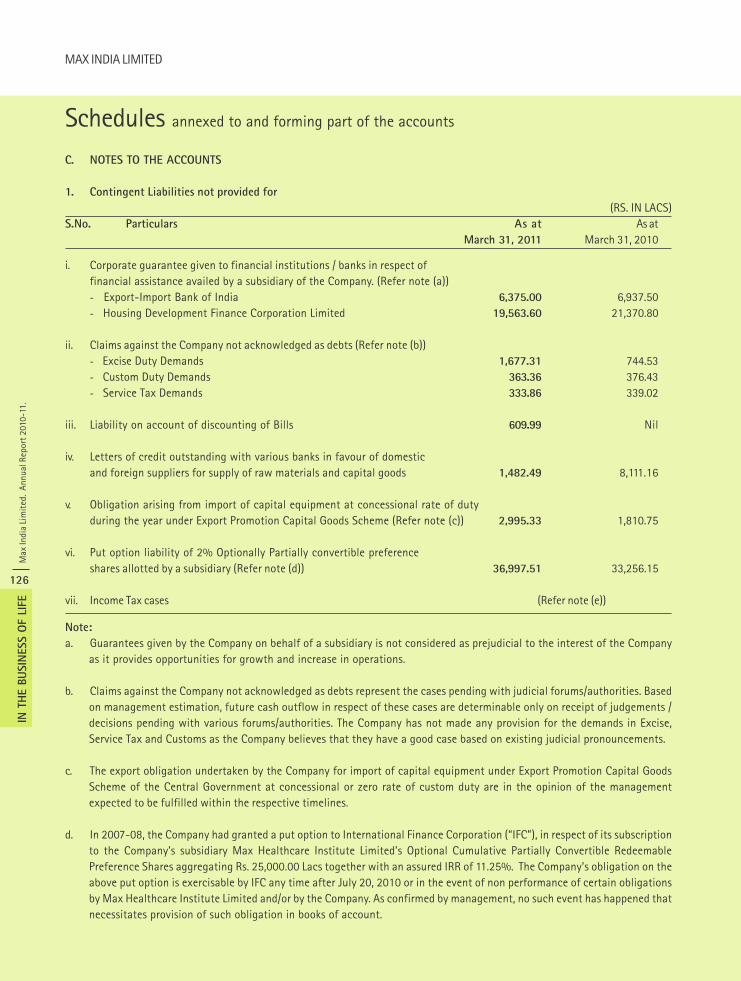
Max
Indi
a Li
mit
ed.
Annu
al R
epor
t 201
0-11
.
126
IN T
HE B
USIN
ESS O
F LI
FE
MAX INDIA LIMITED
Schedules annexed to and forming part of the accounts
C. NOTES TO THE ACCOUNTS
1. Contingent Liabilities not provided for
(RS. IN LACS)S.No. Particulars As at As at
March 31, 2011 March 31, 2010
i. Corporate guarantee given to financial institutions / banks in respect offinancial assistance availed by a subsidiary of the Company. (Refer note (a))- Export-Import Bank of India 6,375.00 6,937.50- Housing Development Finance Corporation Limited 19,563.60 21,370.80
ii. Claims against the Company not acknowledged as debts (Refer note (b))- Excise Duty Demands 1,677.31 744.53- Custom Duty Demands 363.36 376.43- Service Tax Demands 333.86 339.02
iii. Liability on account of discounting of Bills 609.99 Nil
iv. Letters of credit outstanding with various banks in favour of domesticand foreign suppliers for supply of raw materials and capital goods 1,482.49 8,111.16
v. Obligation arising from import of capital equipment at concessional rate of dutyduring the year under Export Promotion Capital Goods Scheme (Refer note (c)) 2,995.33 1,810.75
vi. Put option liability of 2% Optionally Partially convertible preferenceshares allotted by a subsidiary (Refer note (d)) 36,997.51 33,256.15
vii. Income Tax cases (Refer note (e))
Note:
a. Guarantees given by the Company on behalf of a subsidiary is not considered as prejudicial to the interest of the Companyas it provides opportunities for growth and increase in operations.
b. Claims against the Company not acknowledged as debts represent the cases pending with judicial forums/authorities. Basedon management estimation, future cash outflow in respect of these cases are determinable only on receipt of judgements /decisions pending with various forums/authorities. The Company has not made any provision for the demands in Excise,Service Tax and Customs as the Company believes that they have a good case based on existing judicial pronouncements.
c. The export obligation undertaken by the Company for import of capital equipment under Export Promotion Capital GoodsScheme of the Central Government at concessional or zero rate of custom duty are in the opinion of the managementexpected to be fulfilled within the respective timelines.
d. In 2007-08, the Company had granted a put option to International Finance Corporation (“IFC”), in respect of its subscriptionto the Company’s subsidiary Max Healthcare Institute Limited’s Optional Cumulative Partially Convertible RedeemablePreference Shares aggregating Rs. 25,000.00 Lacs together with an assured IRR of 11.25%. The Company’s obligation on theabove put option is exercisable by IFC any time after July 20, 2010 or in the event of non performance of certain obligationsby Max Healthcare Institute Limited and/or by the Company. As confirmed by management, no such event has happened thatnecessitates provision of such obligation in books of account.
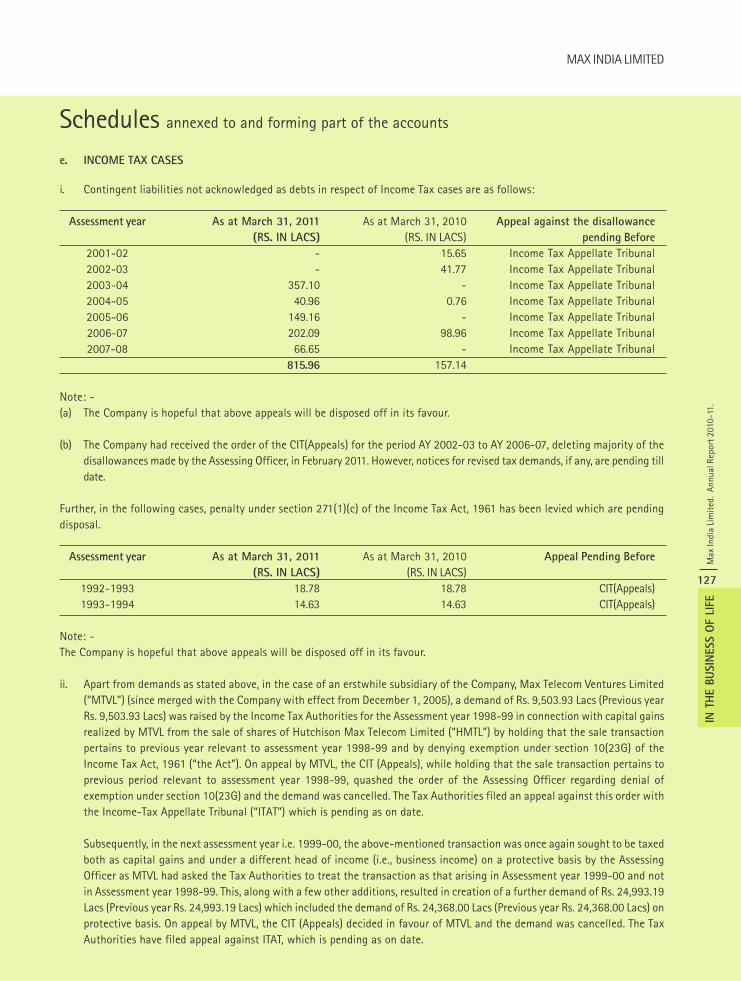
MAX INDIA LIMITED
Max
Indi
a Li
mit
ed.
Annu
al R
epor
t 201
0-11
.
127
IN T
HE B
USIN
ESS O
F LI
FE
Schedules annexed to and forming part of the accounts
e. INCOME TAX CASES
i. Contingent liabilities not acknowledged as debts in respect of Income Tax cases are as follows:
Assessment year As at March 31, 2011 As at March 31, 2010 Appeal against the disallowance
(RS. IN LACS) (RS. IN LACS) pending Before
2001-02 - 15.65 Income Tax Appellate Tribunal2002-03 - 41.77 Income Tax Appellate Tribunal2003-04 357.10 - Income Tax Appellate Tribunal2004-05 40.96 0.76 Income Tax Appellate Tribunal2005-06 149.16 - Income Tax Appellate Tribunal2006-07 202.09 98.96 Income Tax Appellate Tribunal2007-08 66.65 - Income Tax Appellate Tribunal
815.96 157.14
Note: -(a) The Company is hopeful that above appeals will be disposed off in its favour.
(b) The Company had received the order of the CIT(Appeals) for the period AY 2002-03 to AY 2006-07, deleting majority of thedisallowances made by the Assessing Officer, in February 2011. However, notices for revised tax demands, if any, are pending tilldate.
Further, in the following cases, penalty under section 271(1)(c) of the Income Tax Act, 1961 has been levied which are pendingdisposal.
Assessment year As at March 31, 2011 As at March 31, 2010 Appeal Pending Before
(RS. IN LACS) (RS. IN LACS)1992-1993 18.78 18.78 CIT(Appeals)1993-1994 14.63 14.63 CIT(Appeals)
Note: -The Company is hopeful that above appeals will be disposed off in its favour.
ii. Apart from demands as stated above, in the case of an erstwhile subsidiary of the Company, Max Telecom Ventures Limited(“MTVL”) (since merged with the Company with effect from December 1, 2005), a demand of Rs. 9,503.93 Lacs (Previous yearRs. 9,503.93 Lacs) was raised by the Income Tax Authorities for the Assessment year 1998-99 in connection with capital gainsrealized by MTVL from the sale of shares of Hutchison Max Telecom Limited (“HMTL”) by holding that the sale transactionpertains to previous year relevant to assessment year 1998-99 and by denying exemption under section 10(23G) of theIncome Tax Act, 1961 (“the Act”). On appeal by MTVL, the CIT (Appeals), while holding that the sale transaction pertains toprevious period relevant to assessment year 1998-99, quashed the order of the Assessing Officer regarding denial ofexemption under section 10(23G) and the demand was cancelled. The Tax Authorities filed an appeal against this order withthe Income-Tax Appellate Tribunal (“ITAT”) which is pending as on date.
Subsequently, in the next assessment year i.e. 1999-00, the above-mentioned transaction was once again sought to be taxedboth as capital gains and under a different head of income (i.e., business income) on a protective basis by the AssessingOfficer as MTVL had asked the Tax Authorities to treat the transaction as that arising in Assessment year 1999-00 and notin Assessment year 1998-99. This, along with a few other additions, resulted in creation of a further demand of Rs. 24,993.19Lacs (Previous year Rs. 24,993.19 Lacs) which included the demand of Rs. 24,368.00 Lacs (Previous year Rs. 24,368.00 Lacs) onprotective basis. On appeal by MTVL, the CIT (Appeals) decided in favour of MTVL and the demand was cancelled. The TaxAuthorities have filed appeal against ITAT, which is pending as on date.
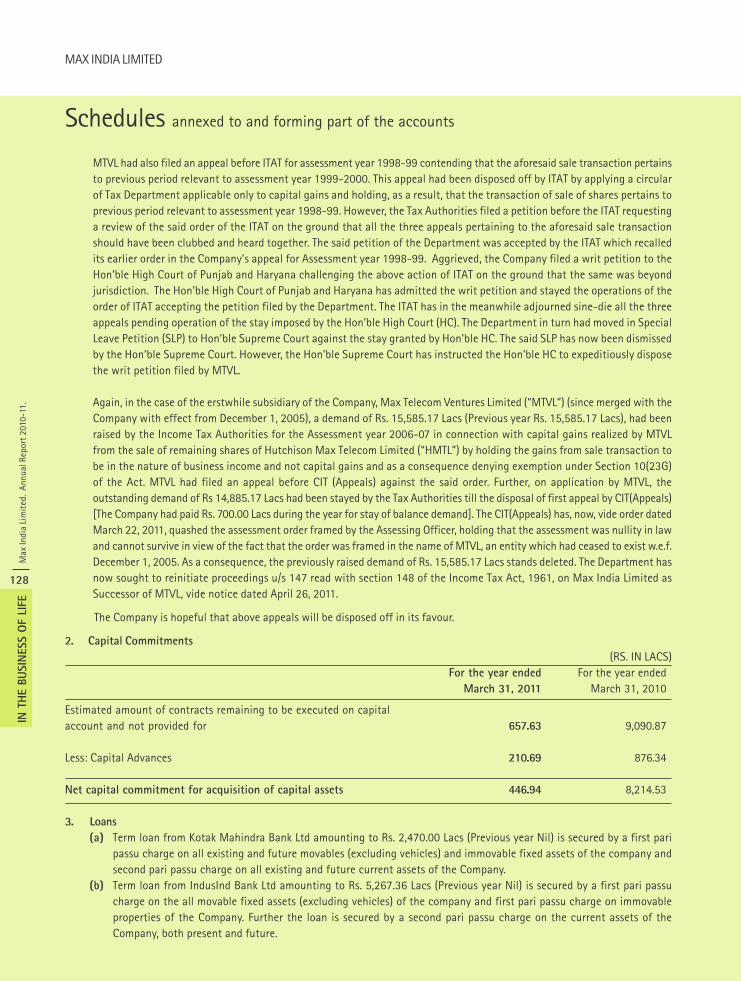
Max
Indi
a Li
mit
ed.
Annu
al R
epor
t 201
0-11
.
128
IN T
HE B
USIN
ESS O
F LI
FE
MAX INDIA LIMITED
Schedules annexed to and forming part of the accounts
MTVL had also filed an appeal before ITAT for assessment year 1998-99 contending that the aforesaid sale transaction pertainsto previous period relevant to assessment year 1999-2000. This appeal had been disposed off by ITAT by applying a circularof Tax Department applicable only to capital gains and holding, as a result, that the transaction of sale of shares pertains toprevious period relevant to assessment year 1998-99. However, the Tax Authorities filed a petition before the ITAT requestinga review of the said order of the ITAT on the ground that all the three appeals pertaining to the aforesaid sale transactionshould have been clubbed and heard together. The said petition of the Department was accepted by the ITAT which recalledits earlier order in the Company’s appeal for Assessment year 1998-99. Aggrieved, the Company filed a writ petition to theHon’ble High Court of Punjab and Haryana challenging the above action of ITAT on the ground that the same was beyondjurisdiction. The Hon’ble High Court of Punjab and Haryana has admitted the writ petition and stayed the operations of theorder of ITAT accepting the petition filed by the Department. The ITAT has in the meanwhile adjourned sine-die all the threeappeals pending operation of the stay imposed by the Hon’ble High Court (HC). The Department in turn had moved in SpecialLeave Petition (SLP) to Hon’ble Supreme Court against the stay granted by Hon’ble HC. The said SLP has now been dismissedby the Hon’ble Supreme Court. However, the Hon’ble Supreme Court has instructed the Hon’ble HC to expeditiously disposethe writ petition filed by MTVL.
Again, in the case of the erstwhile subsidiary of the Company, Max Telecom Ventures Limited (“MTVL”) (since merged with theCompany with effect from December 1, 2005), a demand of Rs. 15,585.17 Lacs (Previous year Rs. 15,585.17 Lacs), had beenraised by the Income Tax Authorities for the Assessment year 2006-07 in connection with capital gains realized by MTVLfrom the sale of remaining shares of Hutchison Max Telecom Limited (“HMTL”) by holding the gains from sale transaction tobe in the nature of business income and not capital gains and as a consequence denying exemption under Section 10(23G)of the Act. MTVL had filed an appeal before CIT (Appeals) against the said order. Further, on application by MTVL, theoutstanding demand of Rs 14,885.17 Lacs had been stayed by the Tax Authorities till the disposal of first appeal by CIT(Appeals)[The Company had paid Rs. 700.00 Lacs during the year for stay of balance demand]. The CIT(Appeals) has, now, vide order datedMarch 22, 2011, quashed the assessment order framed by the Assessing Officer, holding that the assessment was nullity in lawand cannot survive in view of the fact that the order was framed in the name of MTVL, an entity which had ceased to exist w.e.f.December 1, 2005. As a consequence, the previously raised demand of Rs. 15,585.17 Lacs stands deleted. The Department hasnow sought to reinitiate proceedings u/s 147 read with section 148 of the Income Tax Act, 1961, on Max India Limited asSuccessor of MTVL, vide notice dated April 26, 2011.
The Company is hopeful that above appeals will be disposed off in its favour.
2. Capital Commitments
(RS. IN LACS)For the year ended For the year ended
March 31, 2011 March 31, 2010
Estimated amount of contracts remaining to be executed on capitalaccount and not provided for 657.63 9,090.87
Less: Capital Advances 210.69 876.34
Net capital commitment for acquisition of capital assets 446.94 8,214.53
3. Loans
(a) Term loan from Kotak Mahindra Bank Ltd amounting to Rs. 2,470.00 Lacs (Previous year Nil) is secured by a first paripassu charge on all existing and future movables (excluding vehicles) and immovable fixed assets of the company andsecond pari passu charge on all existing and future current assets of the Company.
(b) Term loan from IndusInd Bank Ltd amounting to Rs. 5,267.36 Lacs (Previous year Nil) is secured by a first pari passucharge on the all movable fixed assets (excluding vehicles) of the company and first pari passu charge on immovableproperties of the Company. Further the loan is secured by a second pari passu charge on the current assets of theCompany, both present and future.
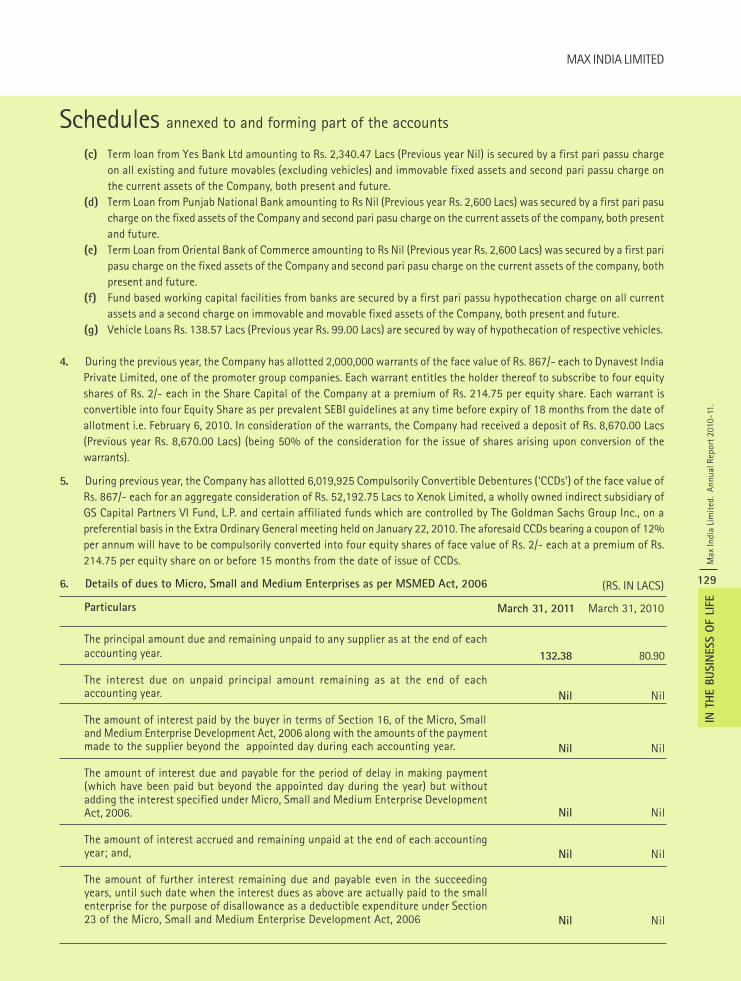
MAX INDIA LIMITED
Max
Indi
a Li
mit
ed.
Annu
al R
epor
t 201
0-11
.
129
IN T
HE B
USIN
ESS O
F LI
FE
Schedules annexed to and forming part of the accounts
(c) Term loan from Yes Bank Ltd amounting to Rs. 2,340.47 Lacs (Previous year Nil) is secured by a first pari passu chargeon all existing and future movables (excluding vehicles) and immovable fixed assets and second pari passu charge onthe current assets of the Company, both present and future.
(d) Term Loan from Punjab National Bank amounting to Rs Nil (Previous year Rs. 2,600 Lacs) was secured by a first pari pasucharge on the fixed assets of the Company and second pari pasu charge on the current assets of the company, both presentand future.
(e) Term Loan from Oriental Bank of Commerce amounting to Rs Nil (Previous year Rs. 2,600 Lacs) was secured by a first paripasu charge on the fixed assets of the Company and second pari pasu charge on the current assets of the company, bothpresent and future.
(f) Fund based working capital facilities from banks are secured by a first pari passu hypothecation charge on all currentassets and a second charge on immovable and movable fixed assets of the Company, both present and future.
(g) Vehicle Loans Rs. 138.57 Lacs (Previous year Rs. 99.00 Lacs) are secured by way of hypothecation of respective vehicles.
4. During the previous year, the Company has allotted 2,000,000 warrants of the face value of Rs. 867/- each to Dynavest IndiaPrivate Limited, one of the promoter group companies. Each warrant entitles the holder thereof to subscribe to four equityshares of Rs. 2/- each in the Share Capital of the Company at a premium of Rs. 214.75 per equity share. Each warrant isconvertible into four Equity Share as per prevalent SEBI guidelines at any time before expiry of 18 months from the date ofallotment i.e. February 6, 2010. In consideration of the warrants, the Company had received a deposit of Rs. 8,670.00 Lacs(Previous year Rs. 8,670.00 Lacs) (being 50% of the consideration for the issue of shares arising upon conversion of thewarrants).
5. During previous year, the Company has allotted 6,019,925 Compulsorily Convertible Debentures (‘CCDs’) of the face value ofRs. 867/- each for an aggregate consideration of Rs. 52,192.75 Lacs to Xenok Limited, a wholly owned indirect subsidiary ofGS Capital Partners VI Fund, L.P. and certain affiliated funds which are controlled by The Goldman Sachs Group Inc., on apreferential basis in the Extra Ordinary General meeting held on January 22, 2010. The aforesaid CCDs bearing a coupon of 12%per annum will have to be compulsorily converted into four equity shares of face value of Rs. 2/- each at a premium of Rs.214.75 per equity share on or before 15 months from the date of issue of CCDs.
6. Details of dues to Micro, Small and Medium Enterprises as per MSMED Act, 2006
Particulars
The principal amount due and remaining unpaid to any supplier as at the end of eachaccounting year.
The interest due on unpaid principal amount remaining as at the end of eachaccounting year.
The amount of interest paid by the buyer in terms of Section 16, of the Micro, Smalland Medium Enterprise Development Act, 2006 along with the amounts of the paymentmade to the supplier beyond the appointed day during each accounting year.
The amount of interest due and payable for the period of delay in making payment(which have been paid but beyond the appointed day during the year) but withoutadding the interest specified under Micro, Small and Medium Enterprise DevelopmentAct, 2006.
The amount of interest accrued and remaining unpaid at the end of each accountingyear; and,
The amount of further interest remaining due and payable even in the succeedingyears, until such date when the interest dues as above are actually paid to the smallenterprise for the purpose of disallowance as a deductible expenditure under Section23 of the Micro, Small and Medium Enterprise Development Act, 2006
March 31, 2011 March 31, 2010
132.38 80.90
Nil Nil
Nil Nil
Nil Nil
Nil Nil
Nil Nil
(RS. IN LACS)
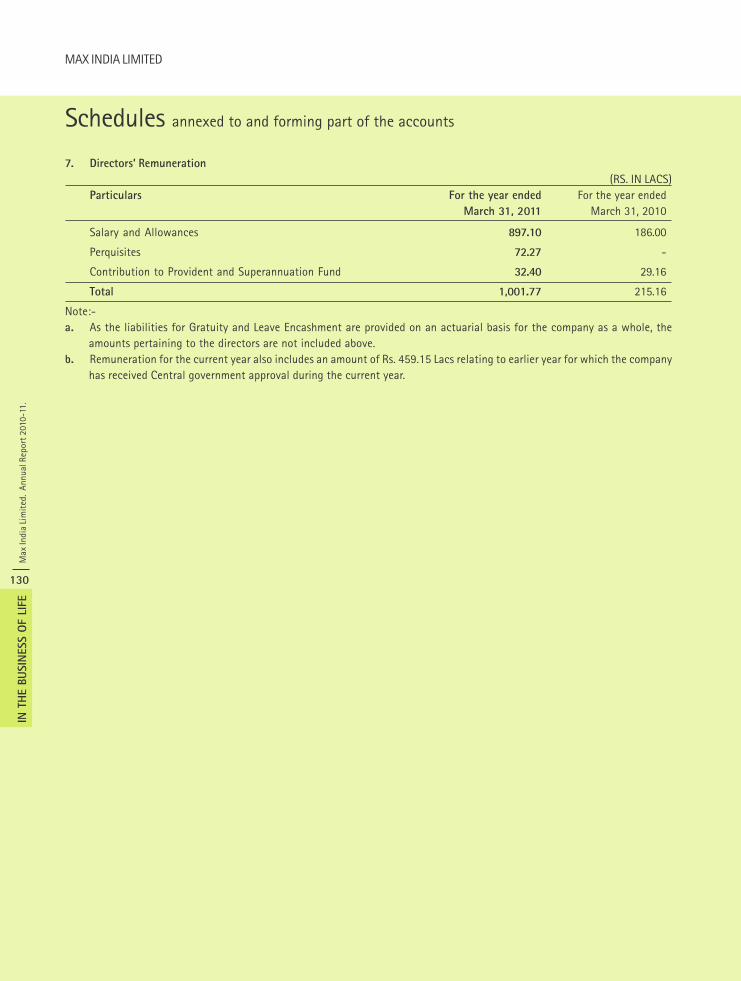
Max
Indi
a Li
mit
ed.
Annu
al R
epor
t 201
0-11
.
130
IN T
HE B
USIN
ESS O
F LI
FE
MAX INDIA LIMITED
Schedules annexed to and forming part of the accounts
7. Directors’ Remuneration
(RS. IN LACS)Particulars For the year ended For the year ended
March 31, 2011 March 31, 2010
Salary and Allowances 897.10 186.00
Perquisites 72.27 -
Contribution to Provident and Superannuation Fund 32.40 29.16
Total 1,001.77 215.16
Note:-a. As the liabilities for Gratuity and Leave Encashment are provided on an actuarial basis for the company as a whole, the
amounts pertaining to the directors are not included above.b. Remuneration for the current year also includes an amount of Rs. 459.15 Lacs relating to earlier year for which the company
has received Central government approval during the current year.
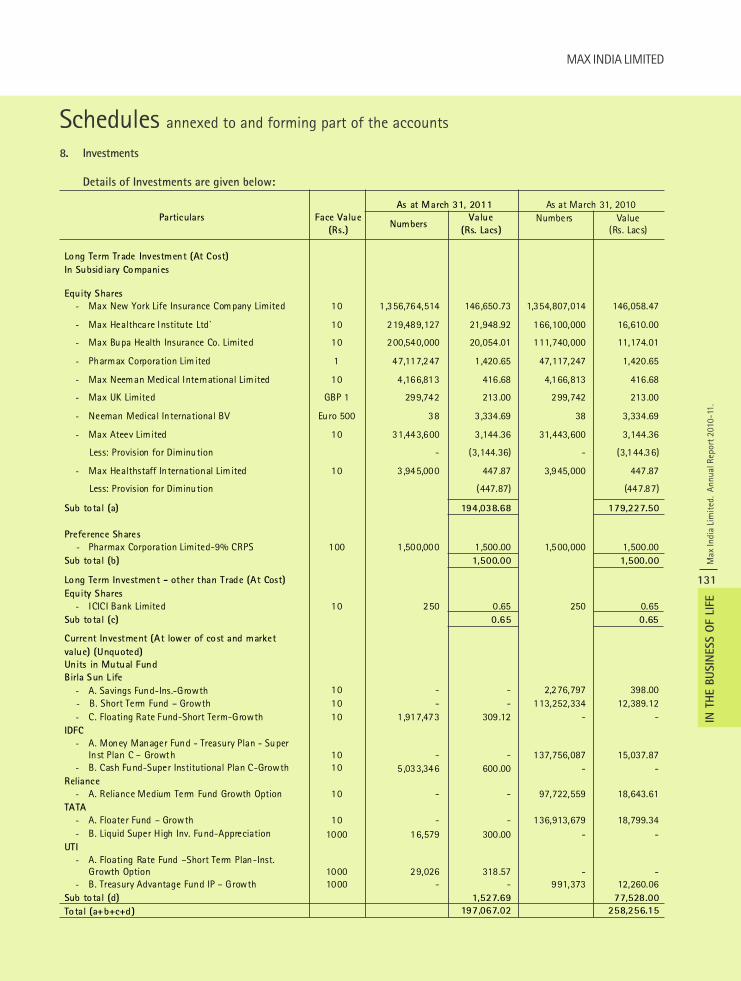
MAX INDIA LIMITED
Max
Indi
a Li
mit
ed.
Annu
al R
epor
t 201
0-11
.
131
IN T
HE B
USIN
ESS O
F LI
FE
Schedules annexed to and forming part of the accounts
8. Investments
Details of Investments are given below:
Particulars Face Value
(Rs.)
As at March 31, 2011 As at March 31, 2010
Numbers
Value
(Rs. Lacs)
Numbers
Value (Rs. Lacs)
Long Term Trade Investment (At Cost) In Subsidiary Companies
Equity Shares
- Max New York Life Insurance Company Limited 10 1 ,356,764,514 146,650.73 1,354,807,014 146,058.47
- Max Healthcare Institute Ltd ̀ 10 219,489,127 21,948.92 166,100,000 16,610.00
- Max Bupa Health Insurance Co. Limited 10 200,540,000 20,054.01 111,740,000 11,174.01
- Pharmax Corporation Limited 1 47,117,247 1 ,420.65 47,117,247 1,420.65
- Max Neeman Medical International Limited 10 4 ,166,813 416.68 4,166,813 416.68
- Max UK Limited GBP 1 299,742 213.00 299,742 213.00
- Neeman Medical International BV Euro 500 38 3 ,334.69 38 3,334.69
- Max Ateev Limited 10 31,443,600 3 ,144.36 31,443,600 3,144.36
Less: Provision for Diminution - (3,144.36) - (3,144.36)
- Max Healthstaff International Limited 10 3 ,945,000 447.87 3,945,000 447.87
Less: Provision for Diminution (447.87) (447.87)
Sub total (a) 194,038.68 179,227.50
Preference Shares
- Pharmax Corporation Limited-9% CRPS 100 1 ,500,000 1 ,500.00 1,500,000 1,500.00 Sub total (b) 1,500.00 1,500.00
Long Term Investment - other than Trade (At Cost) Equity Shares
- ICICI Bank Limited 10 250 0 .65 250 0.65 Sub total (c) 0.65 0.65
Current Investment (At lower of cost and market
value) (Unquoted)
Units in Mutual Fund
Birla Sun Life
- A. Savings Fund-Ins.-Growth 10 - - 2,276,797 398.00 - B. Short Term Fund – Growth 10 - - 113,252,334 12,389.12 - C. Floating Rate Fund-Short Term-Growth 10 1 ,917,473 309.12 - -
IDFC - A. Money Manager Fund - Treasury Plan - Super
Inst Plan C – Growth
10
-
-
137,756,087
15,037.87 - B. Cash Fund-Super Institutional Plan C-Growth 10 5 ,033,346 600.00 - -
Reliance - A. Reliance Medium Term Fund Growth Option 10 - - 97,722,559 18,643.61
TATA - A. Floater Fund – Growth 10 - - 136,913,679 18,799.34 - B. Liquid Super High Inv. Fund-Appreciation 1000 16,579 300.00 - -
UTI - A. Floating Rate Fund –Short Term Plan-Inst.
Growth Option 1000 29,026 318.57 - - - B. Treasury Advantage Fund IP – Growth 1000 - - 991,373 12,260.06
Sub total (d) 1,527.69 77,528.00
Total (a+b+c+d) 197,067.02 258,256.15
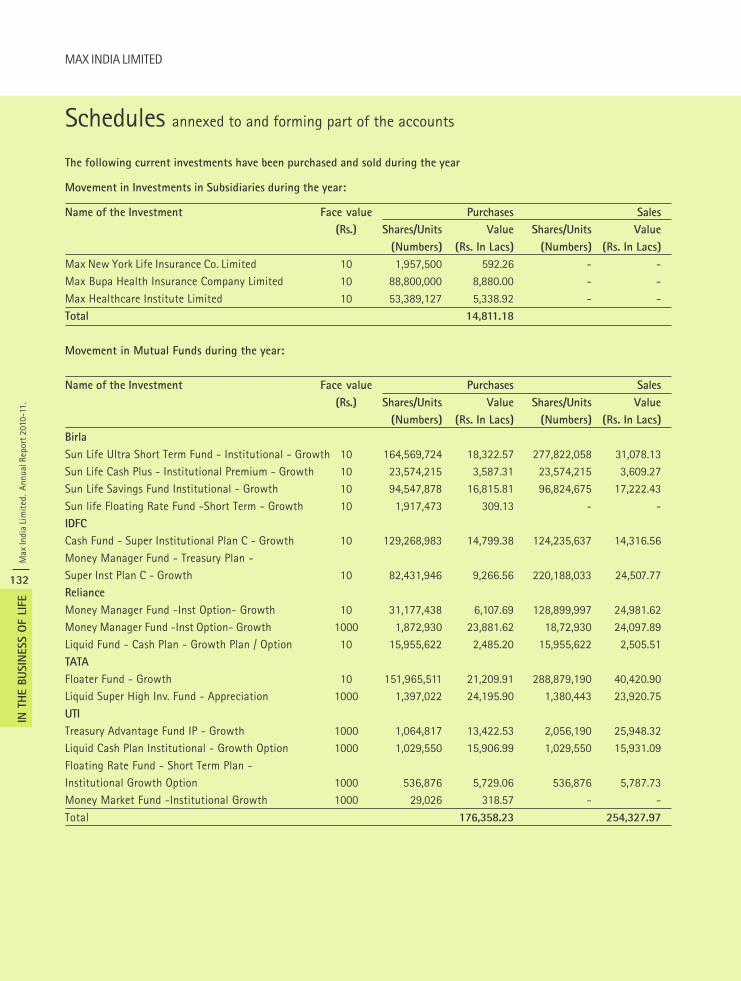
Max
Indi
a Li
mit
ed.
Annu
al R
epor
t 201
0-11
.
132
IN T
HE B
USIN
ESS O
F LI
FE
MAX INDIA LIMITED
The following current investments have been purchased and sold during the year
Movement in Investments in Subsidiaries during the year:
Name of the Investment Face value Purchases Sales
(Rs.) Shares/Units Value Shares/Units Value
(Numbers) (Rs. In Lacs) (Numbers) (Rs. In Lacs)
Max New York Life Insurance Co. Limited 10 1,957,500 592.26 - -Max Bupa Health Insurance Company Limited 10 88,800,000 8,880.00 - -Max Healthcare Institute Limited 10 53,389,127 5,338.92 - -Total 14,811.18
Movement in Mutual Funds during the year:
Name of the Investment Face value Purchases Sales
(Rs.) Shares/Units Value Shares/Units Value
(Numbers) (Rs. In Lacs) (Numbers) (Rs. In Lacs)
Birla
Sun Life Ultra Short Term Fund - Institutional - Growth 10 164,569,724 18,322.57 277,822,058 31,078.13Sun Life Cash Plus - Institutional Premium - Growth 10 23,574,215 3,587.31 23,574,215 3,609.27Sun Life Savings Fund Institutional - Growth 10 94,547,878 16,815.81 96,824,675 17,222.43Sun life Floating Rate Fund -Short Term - Growth 10 1,917,473 309.13 - -IDFC
Cash Fund - Super Institutional Plan C - Growth 10 129,268,983 14,799.38 124,235,637 14,316.56Money Manager Fund - Treasury Plan -Super Inst Plan C - Growth 10 82,431,946 9,266.56 220,188,033 24,507.77Reliance
Money Manager Fund -Inst Option- Growth 10 31,177,438 6,107.69 128,899,997 24,981.62Money Manager Fund -Inst Option- Growth 1000 1,872,930 23,881.62 18,72,930 24,097.89Liquid Fund - Cash Plan - Growth Plan / Option 10 15,955,622 2,485.20 15,955,622 2,505.51TATA
Floater Fund - Growth 10 151,965,511 21,209.91 288,879,190 40,420.90Liquid Super High Inv. Fund - Appreciation 1000 1,397,022 24,195.90 1,380,443 23,920.75UTI
Treasury Advantage Fund IP - Growth 1000 1,064,817 13,422.53 2,056,190 25,948.32Liquid Cash Plan Institutional - Growth Option 1000 1,029,550 15,906.99 1,029,550 15,931.09Floating Rate Fund - Short Term Plan -Institutional Growth Option 1000 536,876 5,729.06 536,876 5,787.73Money Market Fund -Institutional Growth 1000 29,026 318.57 - -Total 176,358.23 254,327.97
Schedules annexed to and forming part of the accounts
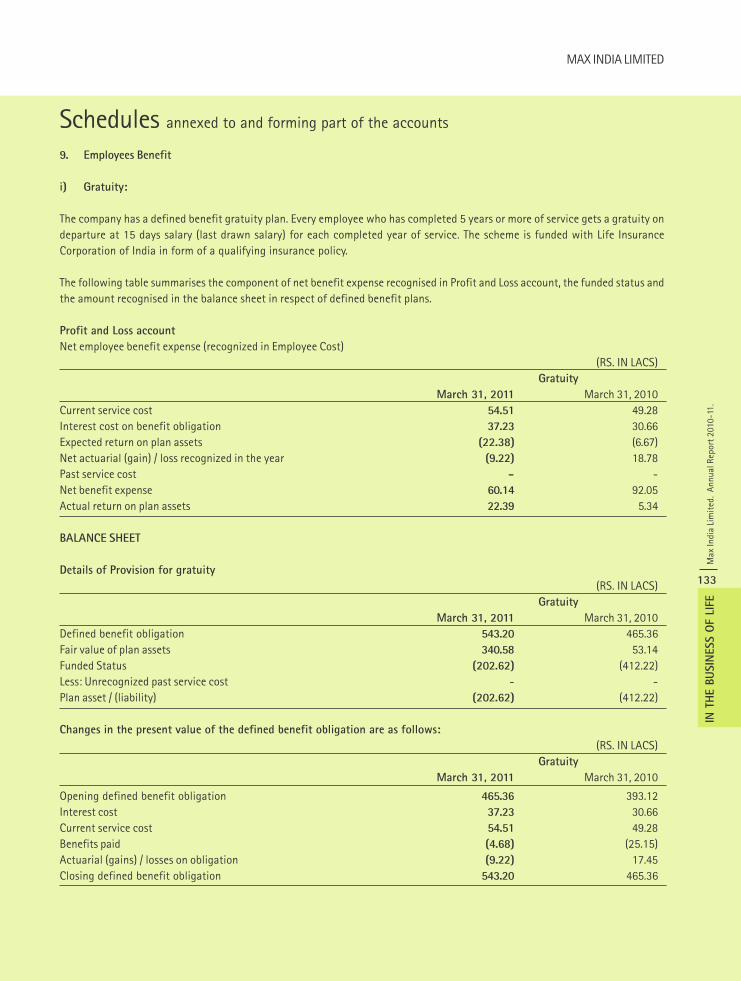
MAX INDIA LIMITED
Max
Indi
a Li
mit
ed.
Annu
al R
epor
t 201
0-11
.
133
IN T
HE B
USIN
ESS O
F LI
FE
Schedules annexed to and forming part of the accounts
9. Employees Benefit
i) Gratuity:
The company has a defined benefit gratuity plan. Every employee who has completed 5 years or more of service gets a gratuity ondeparture at 15 days salary (last drawn salary) for each completed year of service. The scheme is funded with Life InsuranceCorporation of India in form of a qualifying insurance policy.
The following table summarises the component of net benefit expense recognised in Profit and Loss account, the funded status andthe amount recognised in the balance sheet in respect of defined benefit plans.
Profit and Loss account
Net employee benefit expense (recognized in Employee Cost)(RS. IN LACS)
Gratuity
March 31, 2011 March 31, 2010Current service cost 54.51 49.28Interest cost on benefit obligation 37.23 30.66Expected return on plan assets (22.38) (6.67)Net actuarial (gain) / loss recognized in the year (9.22) 18.78Past service cost - -Net benefit expense 60.14 92.05Actual return on plan assets 22.39 5.34
BALANCE SHEET
Details of Provision for gratuity
(RS. IN LACS)Gratuity
March 31, 2011 March 31, 2010Defined benefit obligation 543.20 465.36Fair value of plan assets 340.58 53.14Funded Status (202.62) (412.22)Less: Unrecognized past service cost - -Plan asset / (liability) (202.62) (412.22)
Changes in the present value of the defined benefit obligation are as follows:
(RS. IN LACS)Gratuity
March 31, 2011 March 31, 2010
Opening defined benefit obligation 465.36 393.12Interest cost 37.23 30.66Current service cost 54.51 49.28Benefits paid (4.68) (25.15)Actuarial (gains) / losses on obligation (9.22) 17.45Closing defined benefit obligation 543.20 465.36
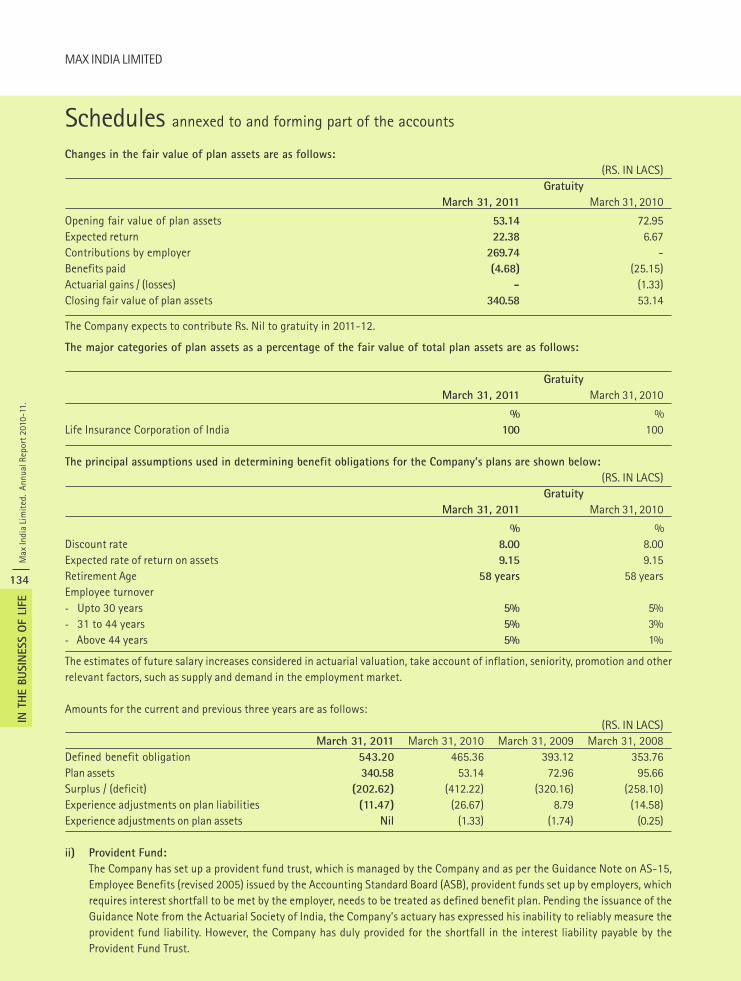
Max
Indi
a Li
mit
ed.
Annu
al R
epor
t 201
0-11
.
134
IN T
HE B
USIN
ESS O
F LI
FE
MAX INDIA LIMITED
Changes in the fair value of plan assets are as follows:
(RS. IN LACS)Gratuity
March 31, 2011 March 31, 2010
Opening fair value of plan assets 53.14 72.95Expected return 22.38 6.67Contributions by employer 269.74 -Benefits paid (4.68) (25.15)Actuarial gains / (losses) - (1.33)Closing fair value of plan assets 340.58 53.14
The Company expects to contribute Rs. Nil to gratuity in 2011-12.
The major categories of plan assets as a percentage of the fair value of total plan assets are as follows:
Gratuity
March 31, 2011 March 31, 2010
% %Life Insurance Corporation of India 100 100
The principal assumptions used in determining benefit obligations for the Company’s plans are shown below:
(RS. IN LACS)Gratuity
March 31, 2011 March 31, 2010
% %Discount rate 8.00 8.00Expected rate of return on assets 9.15 9.15Retirement Age 58 years 58 yearsEmployee turnover- Upto 30 years 5% 5%- 31 to 44 years 5% 3%- Above 44 years 5% 1%
The estimates of future salary increases considered in actuarial valuation, take account of inflation, seniority, promotion and otherrelevant factors, such as supply and demand in the employment market.
Amounts for the current and previous three years are as follows:(RS. IN LACS)
March 31, 2011 March 31, 2010 March 31, 2009 March 31, 2008Defined benefit obligation 543.20 465.36 393.12 353.76Plan assets 340.58 53.14 72.96 95.66Surplus / (deficit) (202.62) (412.22) (320.16) (258.10)Experience adjustments on plan liabilities (11.47) (26.67) 8.79 (14.58)Experience adjustments on plan assets Nil (1.33) (1.74) (0.25)
ii) Provident Fund:
The Company has set up a provident fund trust, which is managed by the Company and as per the Guidance Note on AS-15,Employee Benefits (revised 2005) issued by the Accounting Standard Board (ASB), provident funds set up by employers, whichrequires interest shortfall to be met by the employer, needs to be treated as defined benefit plan. Pending the issuance of theGuidance Note from the Actuarial Society of India, the Company’s actuary has expressed his inability to reliably measure theprovident fund liability. However, the Company has duly provided for the shortfall in the interest liability payable by theProvident Fund Trust.
Schedules annexed to and forming part of the accounts
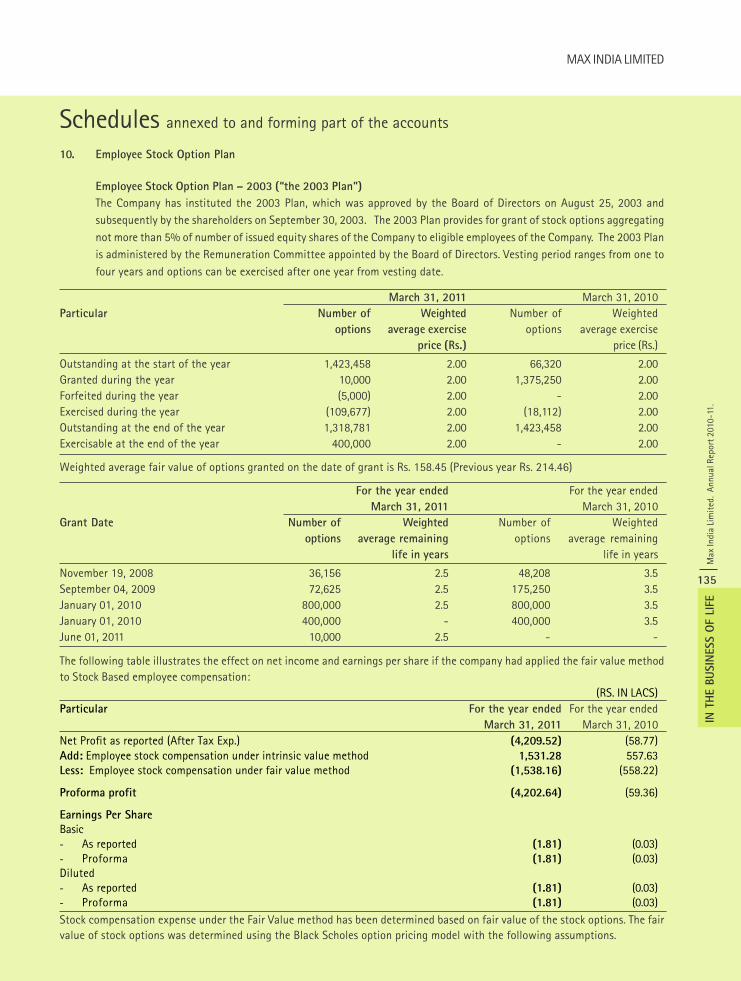
MAX INDIA LIMITED
Max
Indi
a Li
mit
ed.
Annu
al R
epor
t 201
0-11
.
135
IN T
HE B
USIN
ESS O
F LI
FE
Schedules annexed to and forming part of the accounts
10. Employee Stock Option Plan
Employee Stock Option Plan – 2003 (“the 2003 Plan”)
The Company has instituted the 2003 Plan, which was approved by the Board of Directors on August 25, 2003 andsubsequently by the shareholders on September 30, 2003. The 2003 Plan provides for grant of stock options aggregatingnot more than 5% of number of issued equity shares of the Company to eligible employees of the Company. The 2003 Planis administered by the Remuneration Committee appointed by the Board of Directors. Vesting period ranges from one tofour years and options can be exercised after one year from vesting date.
March 31, 2011 March 31, 2010Particular Number of Weighted Number of Weighted
options average exercise options average exerciseprice (Rs.) price (Rs.)
Outstanding at the start of the year 1,423,458 2.00 66,320 2.00Granted during the year 10,000 2.00 1,375,250 2.00Forfeited during the year (5,000) 2.00 - 2.00Exercised during the year (109,677) 2.00 (18,112) 2.00Outstanding at the end of the year 1,318,781 2.00 1,423,458 2.00Exercisable at the end of the year 400,000 2.00 - 2.00
Weighted average fair value of options granted on the date of grant is Rs. 158.45 (Previous year Rs. 214.46)
For the year ended For the year endedMarch 31, 2011 March 31, 2010
Grant Date Number of Weighted Number of Weightedoptions average remaining options average remaining
life in years life in years
November 19, 2008 36,156 2.5 48,208 3.5September 04, 2009 72,625 2.5 175,250 3.5January 01, 2010 800,000 2.5 800,000 3.5January 01, 2010 400,000 - 400,000 3.5June 01, 2011 10,000 2.5 - -
The following table illustrates the effect on net income and earnings per share if the company had applied the fair value methodto Stock Based employee compensation:
(RS. IN LACS)Particular For the year ended For the year ended
March 31, 2011 March 31, 2010Net Profit as reported (After Tax Exp.) (4,209.52) (58.77)Add: Employee stock compensation under intrinsic value method 1,531.28 557.63Less: Employee stock compensation under fair value method (1,538.16) (558.22)
Proforma profit (4,202.64) (59.36)
Earnings Per Share
Basic- As reported (1.81) (0.03)- Proforma (1.81) (0.03)Diluted- As reported (1.81) (0.03)- Proforma (1.81) (0.03)Stock compensation expense under the Fair Value method has been determined based on fair value of the stock options. The fairvalue of stock options was determined using the Black Scholes option pricing model with the following assumptions.
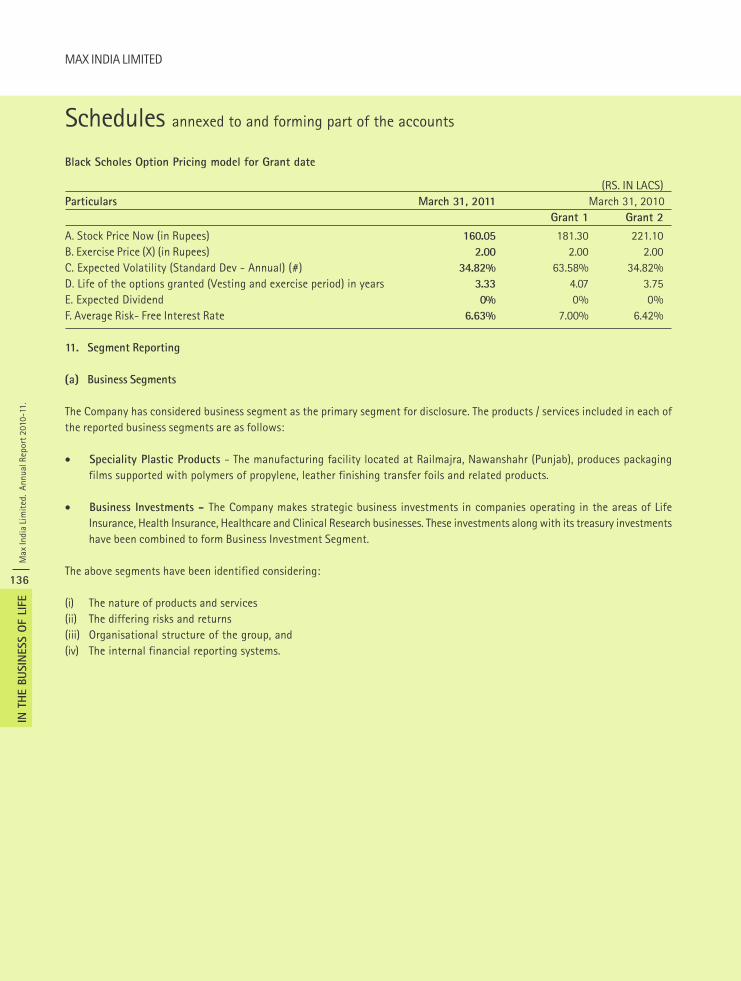
Max
Indi
a Li
mit
ed.
Annu
al R
epor
t 201
0-11
.
136
IN T
HE B
USIN
ESS O
F LI
FE
MAX INDIA LIMITED
Black Scholes Option Pricing model for Grant date
(RS. IN LACS)Particulars March 31, 2011 March 31, 2010
Grant 1 Grant 2
A. Stock Price Now (in Rupees) 160.05 181.30 221.10B. Exercise Price (X) (in Rupees) 2.00 2.00 2.00C. Expected Volatility (Standard Dev - Annual) (#) 34.82% 63.58% 34.82%D. Life of the options granted (Vesting and exercise period) in years 3.33 4.07 3.75E. Expected Dividend 0% 0% 0%F. Average Risk- Free Interest Rate 6.63% 7.00% 6.42%
11. Segment Reporting
(a) Business Segments
The Company has considered business segment as the primary segment for disclosure. The products / services included in each ofthe reported business segments are as follows:
• Speciality Plastic Products - The manufacturing facility located at Railmajra, Nawanshahr (Punjab), produces packagingfilms supported with polymers of propylene, leather finishing transfer foils and related products.
• Business Investments - The Company makes strategic business investments in companies operating in the areas of LifeInsurance, Health Insurance, Healthcare and Clinical Research businesses. These investments along with its treasury investmentshave been combined to form Business Investment Segment.
The above segments have been identified considering:
(i) The nature of products and services(ii) The differing risks and returns(iii) Organisational structure of the group, and(iv) The internal financial reporting systems.
Schedules annexed to and forming part of the accounts
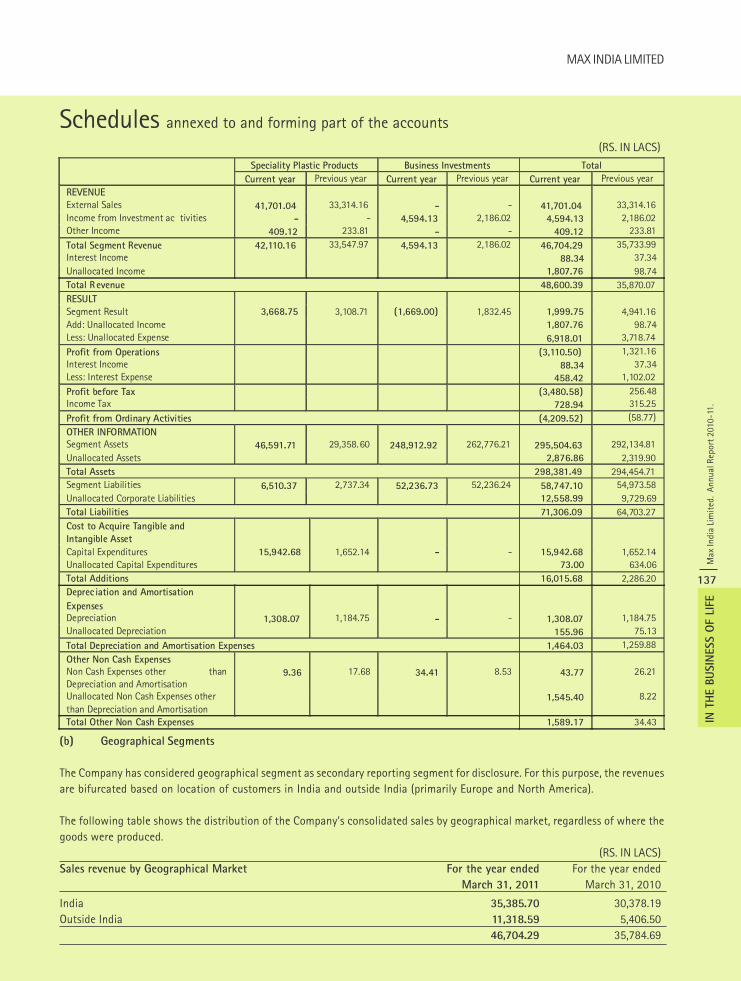
MAX INDIA LIMITED
Max
Indi
a Li
mit
ed.
Annu
al R
epor
t 201
0-11
.
137
IN T
HE B
USIN
ESS O
F LI
FE
(b) Geographical Segments
The Company has considered geographical segment as secondary reporting segment for disclosure. For this purpose, the revenuesare bifurcated based on location of customers in India and outside India (primarily Europe and North America).
The following table shows the distribution of the Company’s consolidated sales by geographical market, regardless of where thegoods were produced.
(RS. IN LACS)Sales revenue by Geographical Market For the year ended For the year ended
March 31, 2011 March 31, 2010
India 35,385.70 30,378.19Outside India 11,318.59 5,406.50
46,704.29 35,784.69
(RS. IN LACS)
Schedules annexed to and forming part of the accounts
Speciality Plastic Products Business Investments Total Current year Previous year Current year Previous year Current year Previous year
REVENUE External Sales 41,701.04 33,314.16 - - 41,701.04 33,314.16 Income from Investment ac tivities - - 4,594.13 2,186.02 4,594.13 2,186.02 Other Income 409.12 233.81 - - 409.12 233.81 Total Segment Revenue 42,110.16 33,547.97 4,594.13 2,186.02 46,704.29 35,733.99 Interest Income 88.34 37.34 Unallocated Income 1,807.76 98.74 Total R evenue 48,600.39 35,870.07 RESULT Segment Result 3,668.75 3,108.71 (1,669.00) 1,832.45 1,999.75 4,941.16 Add: Unallocated Income 1,807.76 98.74 Less: Unallocated Expense 6,918.01 3,718.74 Profit from Operations (3,110.50) 1,321.16 Interest Income 88.34 37.34 Less: Interest Expense 458.42 1,102.02 Profit before Tax (3,480.58) 256.48 Income Tax 728.94 315.25 Profit from Ordinary Activities (4,209.52) (58.77) OTHER INFORMATION Segment Assets 46,591.71 29,358.60 248,912.92 262,776.21 295,504.63 292,134.81 Unallocated Assets 2,876.86 2,319.90 Total Assets 298,381.49 294,454.71 Segment Liabilities 6,510.37 2,737.34 52,236.73 52,236.24 58,747.10 54,973.58 Unallocated Corporate Liabilities 12,558.99 9,729.69 Total Liabilities 71,306.09 64,703.27 Cost to Acquire Tangible and Intangible Asset
Capital Expenditures 15,942.68 1,652.14 - - 15,942.68 1,652.14 Unallocated Capital Expenditures 73.00 634.06 Total Additions 16,015.68 2,286.20 Deprec iation and Amortisation Expenses
Depreciation 1,308.07 1,184.75 - - 1,308.07 1,184.75 Unallocated Depreciation 155.96 75.13 Total Depreciation and Amortisation Expenses 1,464.03 1,259.88 Other Non Cash Expenses Non Cash Expenses other than Depreciation and Amortisation
9.36 17.68 34.41 8.53 43.77 26.21
Unallocated Non Cash Expenses other than Depreciation and Amortisation
1,545.40 8.22
Total Other Non Cash Expenses 1,589.17 34.43
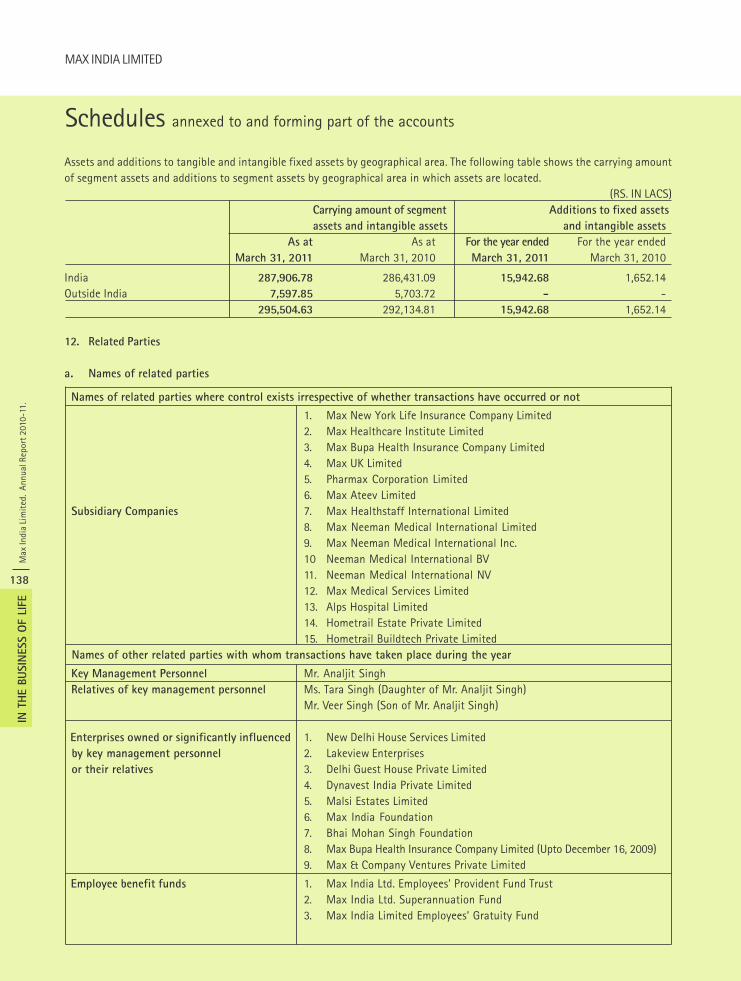
Max
Indi
a Li
mit
ed.
Annu
al R
epor
t 201
0-11
.
138
IN T
HE B
USIN
ESS O
F LI
FE
MAX INDIA LIMITED
Assets and additions to tangible and intangible fixed assets by geographical area. The following table shows the carrying amountof segment assets and additions to segment assets by geographical area in which assets are located.
(RS. IN LACS)Carrying amount of segment Additions to fixed assets
assets and intangible assets and intangible assets
As at As at For the year ended For the year endedMarch 31, 2011 March 31, 2010 March 31, 2011 March 31, 2010
India 287,906.78 286,431.09 15,942.68 1,652.14Outside India 7,597.85 5,703.72 - -
295,504.63 292,134.81 15,942.68 1,652.14
12. Related Parties
a. Names of related parties
Names of related parties where control exists irrespective of whether transactions have occurred or not
1. Max New York Life Insurance Company Limited2. Max Healthcare Institute Limited3. Max Bupa Health Insurance Company Limited4. Max UK Limited5. Pharmax Corporation Limited6. Max Ateev Limited
Subsidiary Companies 7. Max Healthstaff International Limited8. Max Neeman Medical International Limited9. Max Neeman Medical International Inc.10 Neeman Medical International BV11. Neeman Medical International NV12. Max Medical Services Limited13. Alps Hospital Limited14. Hometrail Estate Private Limited15. Hometrail Buildtech Private Limited
Names of other related parties with whom transactions have taken place during the year
Key Management Personnel Mr. Analjit Singh Relatives of key management personnel Ms. Tara Singh (Daughter of Mr. Analjit Singh)
Mr. Veer Singh (Son of Mr. Analjit Singh)
Enterprises owned or significantly influenced 1. New Delhi House Services Limited by key management personnel 2. Lakeview Enterprises or their relatives 3. Delhi Guest House Private Limited
4. Dynavest India Private Limited5. Malsi Estates Limited6. Max India Foundation7. Bhai Mohan Singh Foundation8. Max Bupa Health Insurance Company Limited (Upto December 16, 2009)9. Max & Company Ventures Private Limited
Employee benefit funds 1. Max India Ltd. Employees’ Provident Fund Trust2. Max India Ltd. Superannuation Fund3. Max India Limited Employees’ Gratuity Fund
Schedules annexed to and forming part of the accounts
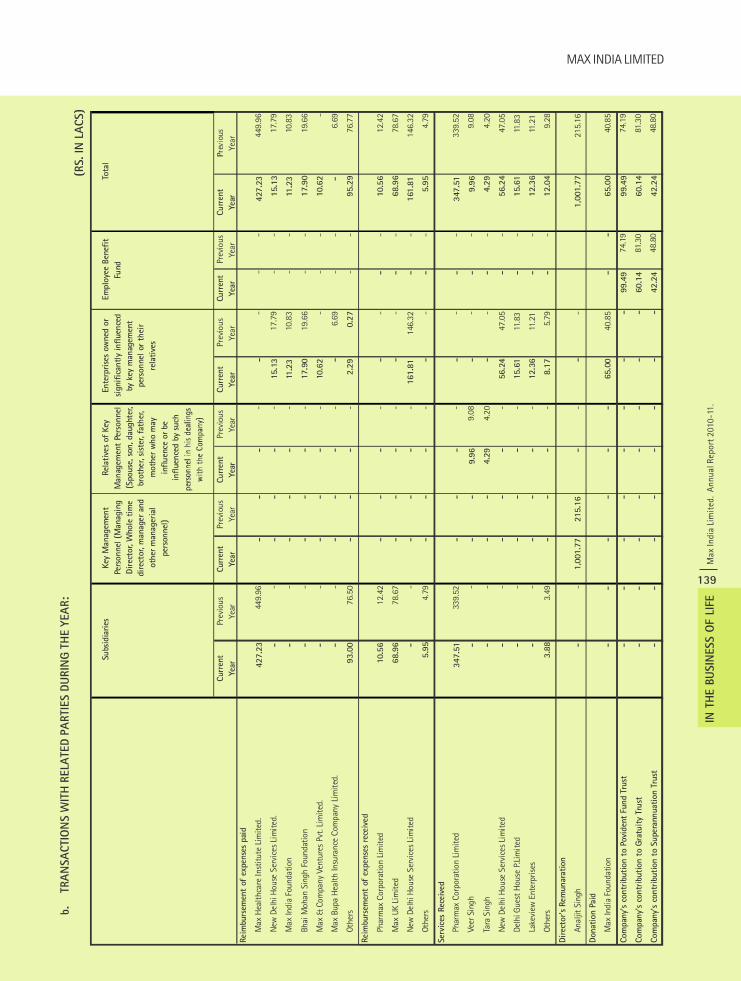
MAX INDIA LIMITED
Max
Indi
a Li
mit
ed.
Annu
al R
epor
t 201
0-11
.
139
IN T
HE B
USIN
ESS O
F LI
FE
b.
TRA
NSA
CTI
ON
S W
ITH
RELA
TED
PA
RTI
ES D
URIN
G T
HE Y
EA
R:
(RS. IN
LA
CS)
Curr
ent
Ye
arPr
evio
us
Year
Curr
ent
Year
Prev
ious
Year
Curr
ent
Year
Prev
ious
Ye
arCu
rren
t
Ye
arPr
evio
us
Year
Curr
ent
Year
Prev
ious
Ye
arCu
rren
t
Ye
arYe
arRe
imbu
rsem
ent
of e
xpen
ses
paid
Max
Hea
lthca
re In
stitu
te L
imite
d.
427
.23
449.
96
-
-
-
-
-
-
-
-
427
.23
44
9.96
New
Del
hi H
ouse
Ser
vice
s Li
mite
d.
-
-
-
-
-
-
1
5.13
17.7
9
-
-
15.1
3
17.
79
Max
Indi
a Fo
unda
tion
-
-
-
-
-
-
11.
23
1
0.83
-
-
11.2
3
10.
83
Bhai
Moh
an S
ingh
Fou
ndat
ion
-
-
-
-
-
-
17.
90
19
.66
-
-
17
.90
1
9.66
Max
& C
ompa
ny V
entu
res
Pvt.
Lim
ited.
-
-
-
-
-
-
10.
62
-
-
-
10.6
2
-
Max
Bup
a H
ealth
Insu
ranc
e Co
mpa
ny L
imite
d.
-
-
-
-
-
-
-
6.6
9
-
-
-
6.6
9
Othe
rs
93
.00
76.
50
-
-
-
-
2
.29
0
.27
-
-
95
.29
7
6.77
Reim
burs
emen
t of
exp
ense
s re
ceiv
ed
Phar
max
Cor
pora
tion
Lim
ited
10.5
6
1
2.42
-
-
-
-
-
-
-
-
10.5
6
12.
42
Max
UK
Lim
ited
68.9
6
7
8.67
-
-
-
-
-
-
-
-
68.9
6
78.
67
New
Del
hi H
ouse
Ser
vice
s Li
mite
d
-
-
-
-
-
-
161
.81
146
.32
-
-
161
.81
14
6.32
Othe
rs
5
.95
4
.79
-
-
-
-
-
-
-
-
5
.95
4.7
9
Serv
ices
Rec
eive
d
Phar
max
Cor
pora
tion
Lim
ited
3
47.5
1
33
9.52
-
-
-
-
-
-
-
-
3
47.5
1
339.
52
Veer
Sin
gh
-
-
-
-
9.
96
9.
08
-
-
-
-
9
.96
9.0
8
Tara
Sin
gh
-
-
-
-
4.
29
4.
20
-
-
-
-
4
.29
4.2
0
New
Del
hi H
ouse
Ser
vice
s Li
mite
d
-
-
-
-
-
-
5
6.24
47.0
5
-
-
56.2
4
47.
05
Delh
i Gue
st H
ouse
P.L
imite
d
-
-
-
-
-
-
1
5.61
11.
83
-
-
15
.61
1
1.83
Lake
view
Ent
erpr
ises
-
-
-
-
-
-
12.
36
11
.21
-
-
12
.36
1
1.21
Othe
rs
3
.88
3
.49
-
-
-
-
8
.17
5.79
-
-
12.0
4
9
.28
Dire
ctor
's Re
mun
arat
ion
Anal
jit S
ingh
-
-
1,0
01.7
7
215
.16
-
-
-
-
1
,001
.77
21
5.16
Dona
tion
Paid
Max
Indi
a Fo
unda
tion
-
-
-
-
-
-
6
5.00
40.8
5
-
-
65
.00
4
0.85
Com
pany
's co
ntrib
utio
n to
Pov
iden
t Fu
nd T
rust
-
-
-
-
-
-
-
-
99.
49
74.1
9
99
.49
7
4.19
Com
pany
's co
ntrib
utio
n to
Gra
tuity
Tru
st
-
-
-
-
-
-
-
-
6
0.14
81
.30
60.1
4
81.
30
Com
pany
's co
ntrib
utio
n to
Sup
eran
nuat
ion
Trus
t
-
-
-
-
-
-
-
-
4
2.24
48
.80
42.2
4
48.
80
Tota
lSu
bsid
iarie
sKe
y M
anag
emen
t Pe
rson
nel (
Man
agin
g D
irect
or, W
hole
tim
e di
rect
or, m
anag
er a
nd
othe
r man
ager
ial
pers
onne
l)
Rela
tives
of
Key
Man
agem
ent
Pers
onne
l (S
pous
e, s
on, d
augh
ter,
brot
her,
sist
er, f
athe
r, m
othe
r w
ho m
ay
influ
ence
or b
e in
fluen
ced
by s
uch
Ente
rpris
es o
wne
d or
si
gnifi
cant
ly in
fluen
ced
by
key
man
agem
ent
pers
onne
l or
thei
r re
lativ
es
Empl
oyee
Ben
efit
Fund
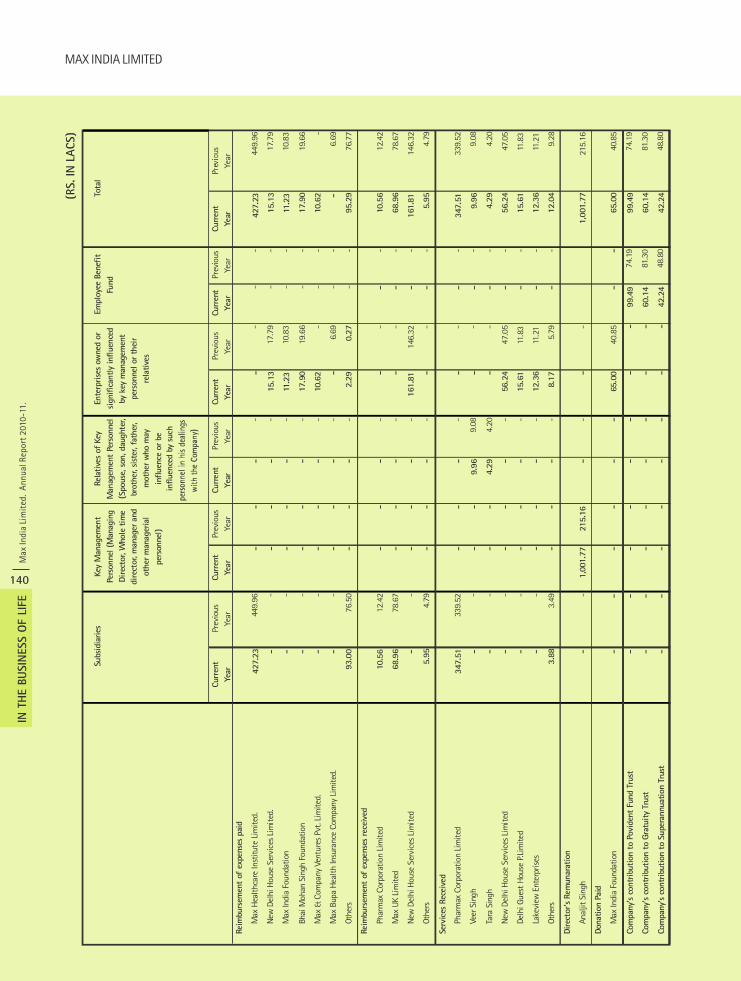
Max
Indi
a Li
mit
ed.
Annu
al R
epor
t 201
0-11
.
140
IN T
HE B
USIN
ESS O
F LI
FE
MAX INDIA LIMITED(R
S. IN
LA
CS)
Curr
ent
Ye
arPr
evio
us
Year
Curr
ent
Year
Prev
ious
Year
Curren
t
Ye
arPr
evio
us
Year
Curr
ent
Ye
arPr
evio
us
Year
Curr
ent
Year
Prev
ious
Ye
arCu
rren
t
Ye
arYe
arRe
imbu
rsem
ent
of e
xpen
ses
paid
Max
Hea
lthca
re In
stitu
te L
imite
d.
427
.23
449.
96
-
-
-
-
-
-
-
-
427
.23
44
9.96
New
Del
hi H
ouse
Ser
vice
s Li
mit
ed.
-
-
-
-
-
-
1
5.13
17.7
9
-
-
15.1
3
17.
79
Max
Indi
a Fo
unda
tion
-
-
-
-
-
-
1
1.23
10.
83
-
-
11
.23
1
0.83
Bhai
Moh
an S
ingh
Fou
ndat
ion
-
-
-
-
-
-
1
7.90
19.6
6
-
-
17.9
0
19.
66
Max
& C
ompa
ny V
entu
res
Pvt.
Lim
ited.
-
-
-
-
-
-
1
0.62
-
-
-
10
.62
-
Max
Bup
a H
ealth
Insu
ranc
e Co
mpa
ny L
imite
d.
-
-
-
-
-
-
-
6.
69
-
-
-
6.6
9
Othe
rs
93
.00
76.
50
-
-
-
-
2.2
9
0.2
7
-
-
95.2
9
76.
77
Reim
burs
emen
t of
exp
ense
s re
ceiv
ed
Phar
max
Cor
pora
tion
Lim
ited
10.5
6
1
2.42
-
-
-
-
-
-
-
-
10.5
6
12.
42
Max
UK
Lim
ited
68.9
6
7
8.67
-
-
-
-
-
-
-
-
68.9
6
78.
67
New
Del
hi H
ouse
Ser
vice
s Li
mit
ed
-
-
-
-
-
-
161.
81
146
.32
-
-
161
.81
14
6.32
Othe
rs
5
.95
4
.79
-
-
-
-
-
-
-
-
5.9
5
4
.79
Serv
ices
Rec
eive
d
Phar
max
Cor
pora
tion
Lim
ited
3
47.5
1
33
9.52
-
-
-
-
-
-
-
-
3
47.5
1
339.
52
Veer
Sin
gh
-
-
-
-
9.
96
9.
08
-
-
-
-
9.9
6
9
.08
Tara
Sin
gh
-
-
-
-
4.
29
4.
20
-
-
-
-
4.2
9
4
.20
New
Del
hi H
ouse
Ser
vice
s Li
mit
ed
-
-
-
-
-
-
56.
24
47
.05
-
-
56
.24
4
7.05
Delh
i Gue
st H
ouse
P.L
imite
d
-
-
-
-
-
-
15.
61
1
1.83
-
-
15.6
1
11.
83
Lake
view
Ent
erpr
ises
-
-
-
-
-
-
1
2.36
11.2
1
-
-
12.3
6
11.
21
Othe
rs
3
.88
3
.49
-
-
-
-
8.1
7
5.
79
-
-
12.0
4
9
.28
Dire
ctor
's Re
mun
arat
ion
Anal
jit S
ingh
-
-
1,0
01.7
7
215
.16
-
-
-
-
1
,001
.77
21
5.16
Dona
tion
Paid
Max
Indi
a Fo
unda
tion
-
-
-
-
-
-
6
5.00
40.
85
-
-
65.0
0
40.
85
Com
pany
's co
ntrib
utio
n to
Pov
iden
t Fu
nd T
rust
-
-
-
-
-
-
-
-
99.
49
74.1
9
99
.49
7
4.19
Com
pany
's co
ntrib
utio
n to
Gra
tuity
Tru
st
-
-
-
-
-
-
-
-
6
0.14
81
.30
60.1
4
81.
30
Com
pany
's co
ntrib
utio
n to
Sup
eran
nuat
ion
Trus
t
-
-
-
-
-
-
-
-
4
2.24
48
.80
42.2
4
48.
80
Tota
lSu
bsid
iarie
sKe
y M
anag
emen
t Pe
rson
nel (
Man
agin
g Di
rect
or, W
hole
tim
e di
rect
or, m
anag
er a
nd
othe
r man
ager
ial
pers
onne
l)
Rela
tives
of Ke
y M
anag
emen
t Pe
rson
nel
(Spo
use,
son
, dau
ghte
r, br
othe
r, sist
er, f
athe
r, m
othe
r who
may
in
fluen
ce o
r be
influ
ence
d by
suc
h
Ente
rpris
es o
wne
d or
si
gnifi
cant
ly in
fluen
ced
by
key
man
agem
ent
pers
onne
l or th
eir
rela
tives
Empl
oyee
Ben
efit
Fund
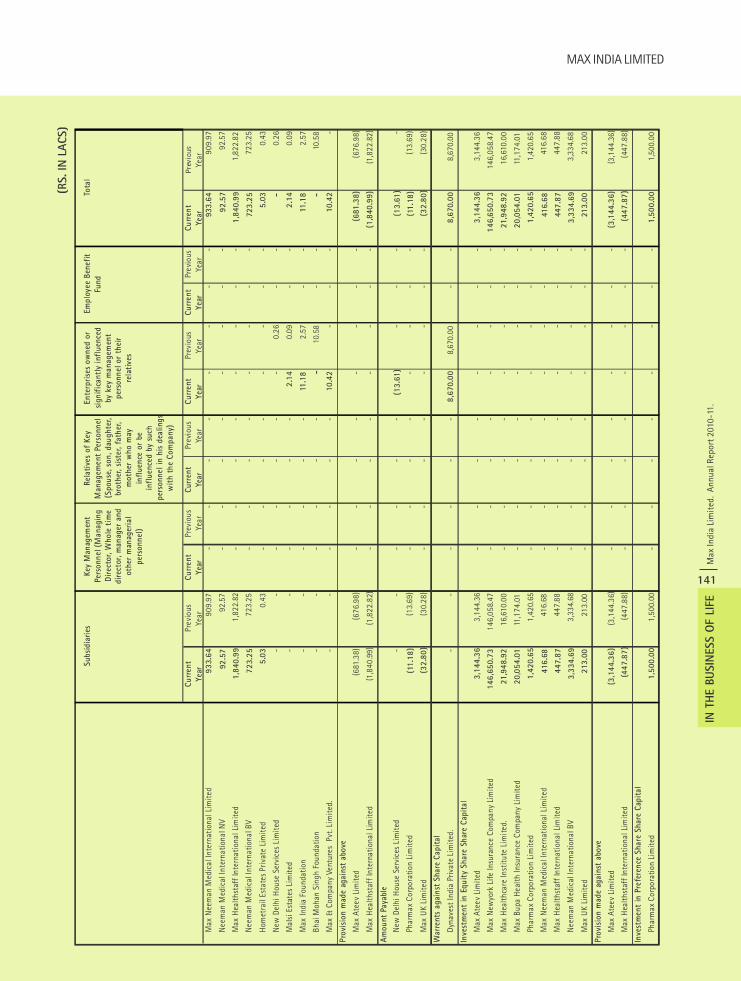
MAX INDIA LIMITED
Max
Indi
a Li
mit
ed.
Annu
al R
epor
t 201
0-11
.
141
IN T
HE B
USIN
ESS O
F LI
FE
(RS. IN
LA
CS)
Curr
ent
Ye
arPr
evio
us
Year
Curr
ent
Year
Prev
ious
Year
Curr
ent
Year
Prev
ious
Ye
arCu
rren
t
Ye
arPr
evio
us
Year
Curr
ent
Year
Prev
ious
Ye
arCu
rren
t
Ye
arYe
arM
ax N
eem
an M
edic
al In
tern
atio
nal L
imite
d
933
.64
909.
97
-
-
-
-
-
-
-
-
933
.64
90
9.97
Nee
man
Med
ical
Inte
rnat
iona
l NV
92.5
7
9
2.57
-
-
-
-
-
-
-
-
92.5
7
92.
57
Max
Hea
lthst
aff I
nter
natio
nal L
imite
d
1
,840
.99
1
,822
.82
-
-
-
-
-
-
-
-
1
,840
.99
1,82
2.82
Nee
man
Med
ical
Inte
rnat
iona
l BV
7
23.2
5
72
3.25
-
-
-
-
-
-
-
-
7
23.2
5
723.
25
Hom
etra
il Es
tate
s Pr
ivat
e Li
mite
d
5
.03
0
.43
-
-
-
-
-
-
-
-
5
.03
0.4
3
New
Del
hi H
ouse
Ser
vice
s Li
mite
d
-
-
-
-
-
-
-
0.26
-
-
-
0
.26
Mal
si E
stat
es L
imite
d
-
-
-
-
-
-
2.1
4
0.
09
-
-
2
.14
0.0
9
Max
Indi
a Fo
unda
tion
-
-
-
-
-
-
11.
18
2.57
-
-
11.1
8
2
.57
Bhai
Moh
an S
ingh
Fou
ndat
ion
-
-
-
-
-
-
-
1
0.58
-
-
-
10.
58
Max
& C
ompa
ny V
entu
res
Pvt
. Lim
ited.
-
-
-
-
-
-
10.
42
-
-
-
10.4
2
-
Prov
isio
n m
ade
agai
nst
abov
e
Max
Ate
ev L
imite
d
(68
1.38
)
(67
6.98
)
-
-
-
-
-
-
-
-
(6
81.3
8)
(
676.
98)
Max
Hea
lthst
aff I
nter
natio
nal L
imite
d
(1,8
40.9
9)
(1,8
22.8
2)
-
-
-
-
-
-
-
-
(1,8
40.9
9)
(1,
822.
82)
Amou
nt P
ayab
leN
ew D
elhi
Hou
se S
ervi
ces
Lim
ited
-
-
-
-
-
-
(13.
61)
-
-
-
(
13.6
1)
-
Phar
max
Cor
pora
tion
Lim
ited
(
11.1
8)
(1
3.69
)
-
-
-
-
-
-
-
-
(
11.1
8)
(13.
69)
Max
UK
Lim
ited
(
32.8
0)
(3
0.28
)
-
-
-
-
-
-
-
-
(
32.8
0)
(30.
28)
War
rent
s ag
ains
t Sh
are
Capi
tal
Dyna
vest
Indi
a Pr
ivat
e Li
mite
d.
-
-
-
-
-
-
8,6
70.0
0
8,6
70.0
0
-
-
8,6
70.0
0
8,
670.
00
Inve
stm
ent
in E
quity
Sha
re S
hare
Cap
ital
Max
Ate
ev L
imite
d
3
,144
.36
3
,144
.36
-
-
-
-
-
-
-
-
3
,144
.36
3,14
4.36
Max
New
york
Life
Insu
ranc
e Co
mpa
ny L
imite
d
146
,650
.73
146,
058.
47
-
-
-
-
-
-
-
-
146
,650
.73
146
,058
.47
Max
Hea
lthca
re In
stitu
te L
imite
d.
21
,948
.92
16,
610.
00
-
-
-
-
-
-
-
-
21
,948
.92
1
6,61
0.00
Max
Bup
a H
ealth
Insu
ranc
e Co
mpa
ny L
imite
d
20
,054
.01
11,
174.
01
-
-
-
-
-
-
-
-
20
,054
.01
1
1,17
4.01
Phar
max
Cor
pora
tion
Lim
ited
1,4
20.6
5
1,4
20.6
5
-
-
-
-
-
-
-
-
1,4
20.6
5
1,
420.
65
Max
Nee
man
Med
ical
Inte
rnat
iona
l Lim
ited
4
16.6
8
41
6.68
-
-
-
-
-
-
-
-
4
16.6
8
416.
68
Max
Hea
lthst
aff I
nter
natio
nal L
imite
d
447
.87
447.
88
-
-
-
-
-
-
-
-
447
.87
44
7.88
Nee
man
Med
ical
Inte
rnat
iona
l BV
3,3
34.6
9
3,3
34.6
8
-
-
-
-
-
-
-
-
3,3
34.6
9
3,
334.
68
Max
UK
Lim
ited
2
13.0
0
21
3.00
-
-
-
-
-
-
-
-
2
13.0
0
213.
00
Prov
isio
n m
ade
agai
nst
abov
e
Max
Ate
ev L
imite
d
(3
,144
.36)
(3
,144
.36)
-
-
-
-
-
-
-
-
(3
,144
.36)
(
3,14
4.36
)
Max
Hea
lthst
aff I
nter
natio
nal L
imite
d
(447
.87)
(
447.
88)
-
-
-
-
-
-
-
-
(447
.87)
(44
7.88
)
Inve
stm
ent
in P
refe
renc
e Sh
are
Shar
e Ca
pita
l
Phar
max
Cor
pora
tion
Lim
ited
1,5
00.0
0
1,5
00.0
0
-
-
-
-
-
-
-
-
1,5
00.0
0
1,
500.
00
Tota
lSu
bsid
iarie
sKe
y M
anag
emen
t Pe
rson
nel (
Man
agin
g Di
rect
or, W
hole
tim
e di
rect
or, m
anag
er a
nd
othe
r m
anag
eria
l pe
rson
nel)
Rela
tives
of
Key
Man
agem
ent
Pers
onne
l (S
pous
e, s
on, d
augh
ter,
brot
her,
siste
r, fa
ther
, m
othe
r w
ho m
ay
influ
ence
or
be
influ
ence
d by
suc
h pe
rson
nel i
n hi
s de
alin
gs
with
the
Com
pany
)
Ente
rpris
es o
wne
d or
si
gnifi
cant
ly in
flue
nced
by
key
man
agem
ent
pers
onne
l or
thei
r re
lativ
es
Empl
oyee
Ben
efit
Fund
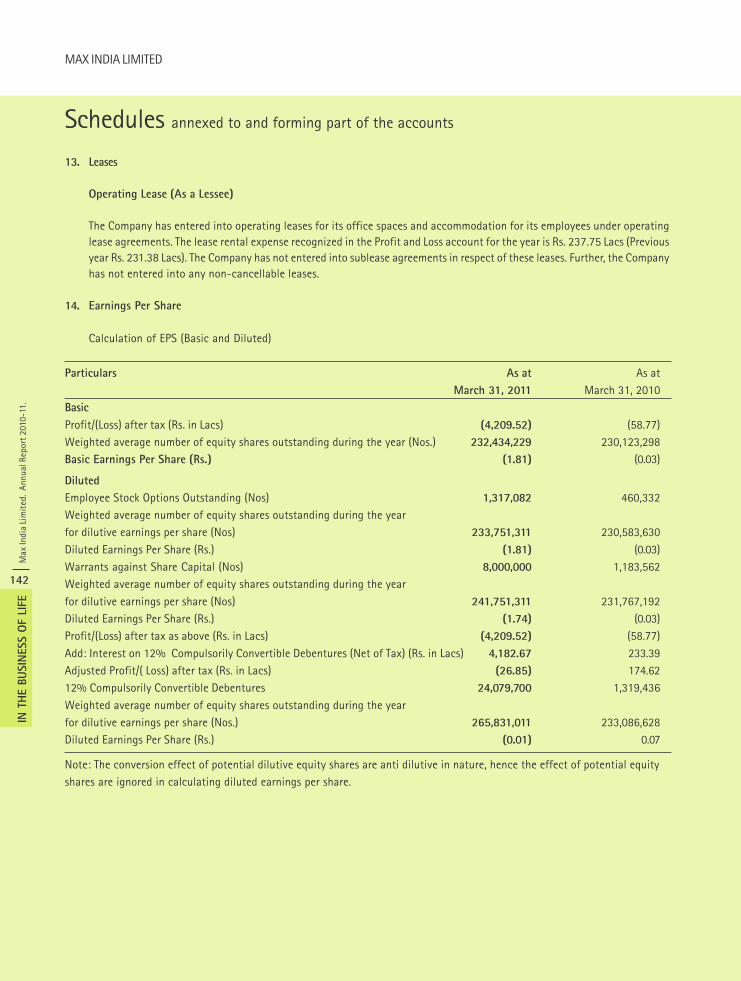
Max
Indi
a Li
mit
ed.
Annu
al R
epor
t 201
0-11
.
142
IN T
HE B
USIN
ESS O
F LI
FE
MAX INDIA LIMITED
Schedules annexed to and forming part of the accounts
13. Leases
Operating Lease (As a Lessee)
The Company has entered into operating leases for its office spaces and accommodation for its employees under operatinglease agreements. The lease rental expense recognized in the Profit and Loss account for the year is Rs. 237.75 Lacs (Previousyear Rs. 231.38 Lacs). The Company has not entered into sublease agreements in respect of these leases. Further, the Companyhas not entered into any non-cancellable leases.
14. Earnings Per Share
Calculation of EPS (Basic and Diluted)
Particulars As at As atMarch 31, 2011 March 31, 2010
Basic
Profit/(Loss) after tax (Rs. in Lacs) (4,209.52) (58.77)Weighted average number of equity shares outstanding during the year (Nos.) 232,434,229 230,123,298Basic Earnings Per Share (Rs.) (1.81) (0.03)
Diluted
Employee Stock Options Outstanding (Nos) 1,317,082 460,332Weighted average number of equity shares outstanding during the yearfor dilutive earnings per share (Nos) 233,751,311 230,583,630Diluted Earnings Per Share (Rs.) (1.81) (0.03)Warrants against Share Capital (Nos) 8,000,000 1,183,562Weighted average number of equity shares outstanding during the yearfor dilutive earnings per share (Nos) 241,751,311 231,767,192Diluted Earnings Per Share (Rs.) (1.74) (0.03)Profit/(Loss) after tax as above (Rs. in Lacs) (4,209.52) (58.77)Add: Interest on 12% Compulsorily Convertible Debentures (Net of Tax) (Rs. in Lacs) 4,182.67 233.39Adjusted Profit/( Loss) after tax (Rs. in Lacs) (26.85) 174.6212% Compulsorily Convertible Debentures 24,079,700 1,319,436Weighted average number of equity shares outstanding during the yearfor dilutive earnings per share (Nos.) 265,831,011 233,086,628Diluted Earnings Per Share (Rs.) (0.01) 0.07
Note: The conversion effect of potential dilutive equity shares are anti dilutive in nature, hence the effect of potential equityshares are ignored in calculating diluted earnings per share.
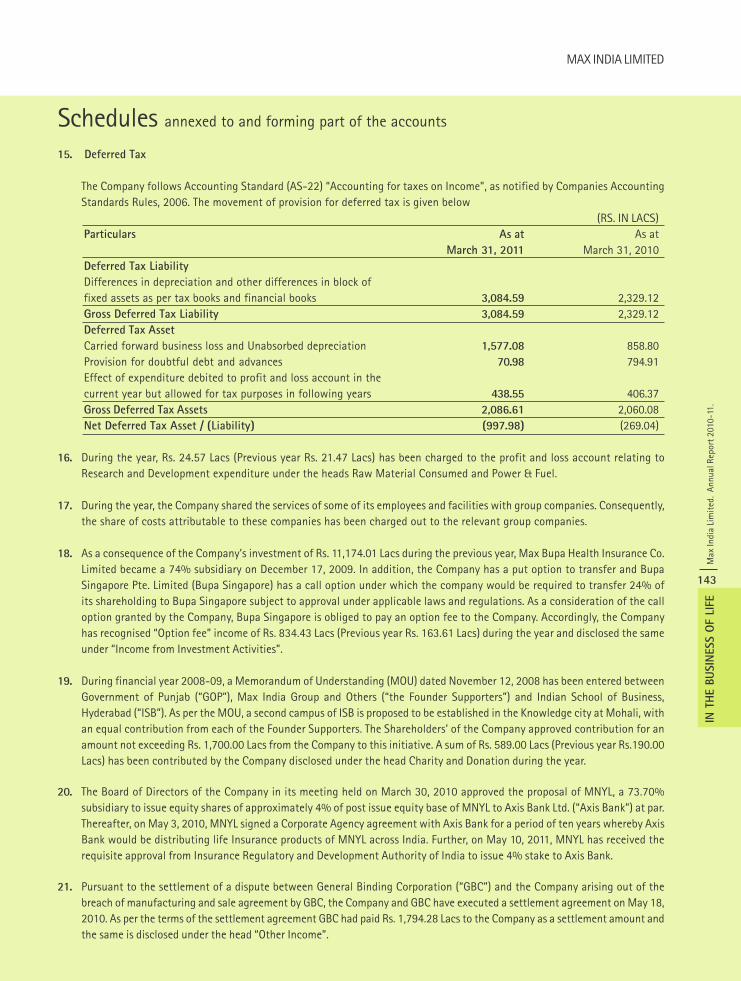
MAX INDIA LIMITED
Max
Indi
a Li
mit
ed.
Annu
al R
epor
t 201
0-11
.
143
IN T
HE B
USIN
ESS O
F LI
FE
15. Deferred Tax
The Company follows Accounting Standard (AS-22) “Accounting for taxes on Income”, as notified by Companies AccountingStandards Rules, 2006. The movement of provision for deferred tax is given below
(RS. IN LACS)Particulars As at As at
March 31, 2011 March 31, 2010Deferred Tax Liability
Differences in depreciation and other differences in block offixed assets as per tax books and financial books 3,084.59 2,329.12Gross Deferred Tax Liability 3,084.59 2,329.12Deferred Tax Asset
Carried forward business loss and Unabsorbed depreciation 1,577.08 858.80Provision for doubtful debt and advances 70.98 794.91Effect of expenditure debited to profit and loss account in thecurrent year but allowed for tax purposes in following years 438.55 406.37Gross Deferred Tax Assets 2,086.61 2,060.08Net Deferred Tax Asset / (Liability) (997.98) (269.04)
16. During the year, Rs. 24.57 Lacs (Previous year Rs. 21.47 Lacs) has been charged to the profit and loss account relating toResearch and Development expenditure under the heads Raw Material Consumed and Power & Fuel.
17. During the year, the Company shared the services of some of its employees and facilities with group companies. Consequently,the share of costs attributable to these companies has been charged out to the relevant group companies.
18. As a consequence of the Company’s investment of Rs. 11,174.01 Lacs during the previous year, Max Bupa Health Insurance Co.Limited became a 74% subsidiary on December 17, 2009. In addition, the Company has a put option to transfer and BupaSingapore Pte. Limited (Bupa Singapore) has a call option under which the company would be required to transfer 24% ofits shareholding to Bupa Singapore subject to approval under applicable laws and regulations. As a consideration of the calloption granted by the Company, Bupa Singapore is obliged to pay an option fee to the Company. Accordingly, the Companyhas recognised “Option fee” income of Rs. 834.43 Lacs (Previous year Rs. 163.61 Lacs) during the year and disclosed the sameunder “Income from Investment Activities”.
19. During financial year 2008-09, a Memorandum of Understanding (MOU) dated November 12, 2008 has been entered betweenGovernment of Punjab (“GOP”), Max India Group and Others (“the Founder Supporters”) and Indian School of Business,Hyderabad (“ISB”). As per the MOU, a second campus of ISB is proposed to be established in the Knowledge city at Mohali, withan equal contribution from each of the Founder Supporters. The Shareholders’ of the Company approved contribution for anamount not exceeding Rs. 1,700.00 Lacs from the Company to this initiative. A sum of Rs. 589.00 Lacs (Previous year Rs.190.00Lacs) has been contributed by the Company disclosed under the head Charity and Donation during the year.
20. The Board of Directors of the Company in its meeting held on March 30, 2010 approved the proposal of MNYL, a 73.70%subsidiary to issue equity shares of approximately 4% of post issue equity base of MNYL to Axis Bank Ltd. (“Axis Bank”) at par.Thereafter, on May 3, 2010, MNYL signed a Corporate Agency agreement with Axis Bank for a period of ten years whereby AxisBank would be distributing life Insurance products of MNYL across India. Further, on May 10, 2011, MNYL has received therequisite approval from Insurance Regulatory and Development Authority of India to issue 4% stake to Axis Bank.
21. Pursuant to the settlement of a dispute between General Binding Corporation (“GBC”) and the Company arising out of thebreach of manufacturing and sale agreement by GBC, the Company and GBC have executed a settlement agreement on May 18,2010. As per the terms of the settlement agreement GBC had paid Rs. 1,794.28 Lacs to the Company as a settlement amount andthe same is disclosed under the head “Other Income”.
Schedules annexed to and forming part of the accounts
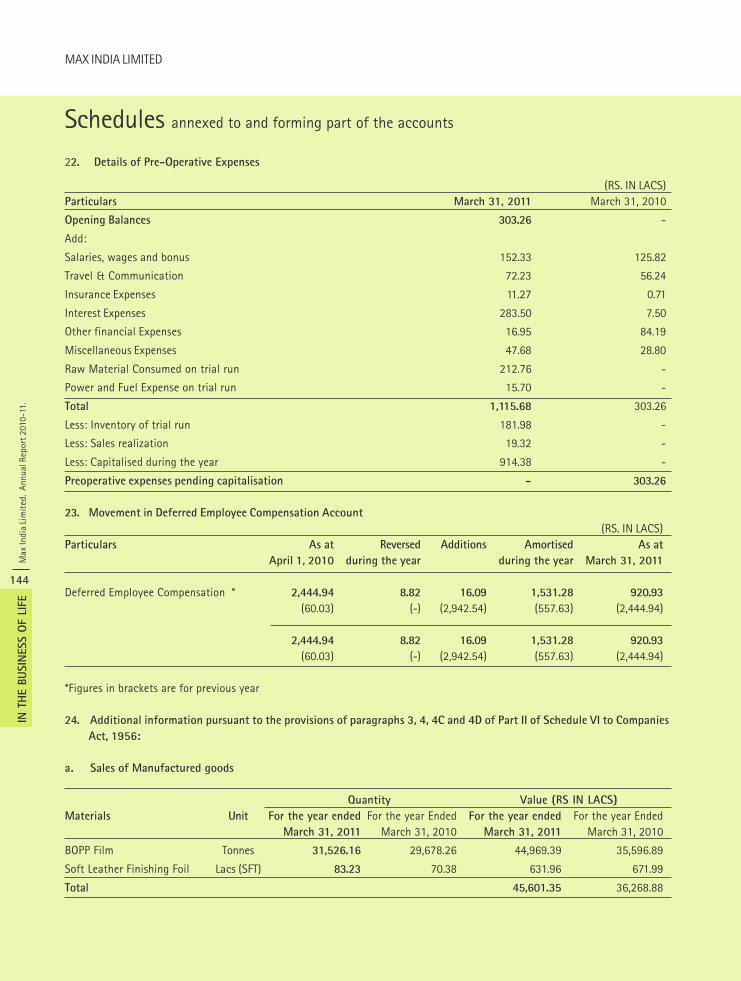
Max
Indi
a Li
mit
ed.
Annu
al R
epor
t 201
0-11
.
144
IN T
HE B
USIN
ESS O
F LI
FE
MAX INDIA LIMITED
Schedules annexed to and forming part of the accounts
22. Details of Pre-Operative Expenses
(RS. IN LACS)Particulars March 31, 2011 March 31, 2010
Opening Balances 303.26 -
Add:
Salaries, wages and bonus 152.33 125.82
Travel & Communication 72.23 56.24
Insurance Expenses 11.27 0.71
Interest Expenses 283.50 7.50
Other financial Expenses 16.95 84.19
Miscellaneous Expenses 47.68 28.80
Raw Material Consumed on trial run 212.76 -
Power and Fuel Expense on trial run 15.70 -
Total 1,115.68 303.26
Less: Inventory of trial run 181.98 -
Less: Sales realization 19.32 -
Less: Capitalised during the year 914.38 -
Preoperative expenses pending capitalisation - 303.26
23. Movement in Deferred Employee Compensation Account
(RS. IN LACS)Particulars As at Reversed Additions Amortised As at
April 1, 2010 during the year during the year March 31, 2011
Deferred Employee Compensation * 2,444.94 8.82 16.09 1,531.28 920.93
(60.03) (-) (2,942.54) (557.63) (2,444.94)
2,444.94 8.82 16.09 1,531.28 920.93
(60.03) (-) (2,942.54) (557.63) (2,444.94)
*Figures in brackets are for previous year
24. Additional information pursuant to the provisions of paragraphs 3, 4, 4C and 4D of Part II of Schedule VI to Companies
Act, 1956:
a. Sales of Manufactured goods
Quantity Value (RS IN LACS)
Materials Unit For the year ended For the year Ended For the year ended For the year EndedMarch 31, 2011 March 31, 2010 March 31, 2011 March 31, 2010
BOPP Film Tonnes 31,526.16 29,678.26 44,969.39 35,596.89
Soft Leather Finishing Foil Lacs (SFT) 83.23 70.38 631.96 671.99
Total 45,601.35 36,268.88
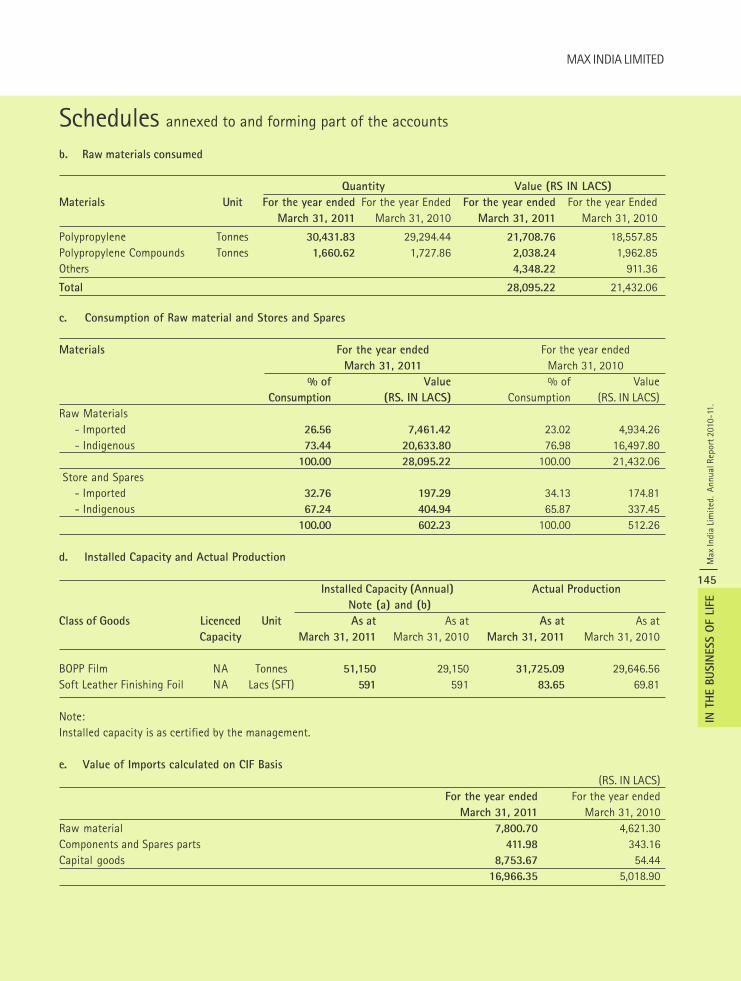
MAX INDIA LIMITED
Max
Indi
a Li
mit
ed.
Annu
al R
epor
t 201
0-11
.
145
IN T
HE B
USIN
ESS O
F LI
FE
b. Raw materials consumed
Quantity Value (RS IN LACS)
Materials Unit For the year ended For the year Ended For the year ended For the year EndedMarch 31, 2011 March 31, 2010 March 31, 2011 March 31, 2010
Polypropylene Tonnes 30,431.83 29,294.44 21,708.76 18,557.85Polypropylene Compounds Tonnes 1,660.62 1,727.86 2,038.24 1,962.85Others 4,348.22 911.36
Total 28,095.22 21,432.06
c. Consumption of Raw material and Stores and Spares
Materials For the year ended For the year endedMarch 31, 2011 March 31, 2010
% of Value % of ValueConsumption (RS. IN LACS) Consumption (RS. IN LACS)
Raw Materials - Imported 26.56 7,461.42 23.02 4,934.26 - Indigenous 73.44 20,633.80 76.98 16,497.80
100.00 28,095.22 100.00 21,432.06 Store and Spares - Imported 32.76 197.29 34.13 174.81 - Indigenous 67.24 404.94 65.87 337.45
100.00 602.23 100.00 512.26
d. Installed Capacity and Actual Production
Installed Capacity (Annual) Actual Production
Note (a) and (b)
Class of Goods Licenced Unit As at As at As at As atCapacity March 31, 2011 March 31, 2010 March 31, 2011 March 31, 2010
BOPP Film NA Tonnes 51,150 29,150 31,725.09 29,646.56Soft Leather Finishing Foil NA Lacs (SFT) 591 591 83.65 69.81
Note:Installed capacity is as certified by the management.
e. Value of Imports calculated on CIF Basis
(RS. IN LACS)For the year ended For the year ended
March 31, 2011 March 31, 2010Raw material 7,800.70 4,621.30Components and Spares parts 411.98 343.16Capital goods 8,753.67 54.44
16,966.35 5,018.90
Schedules annexed to and forming part of the accounts
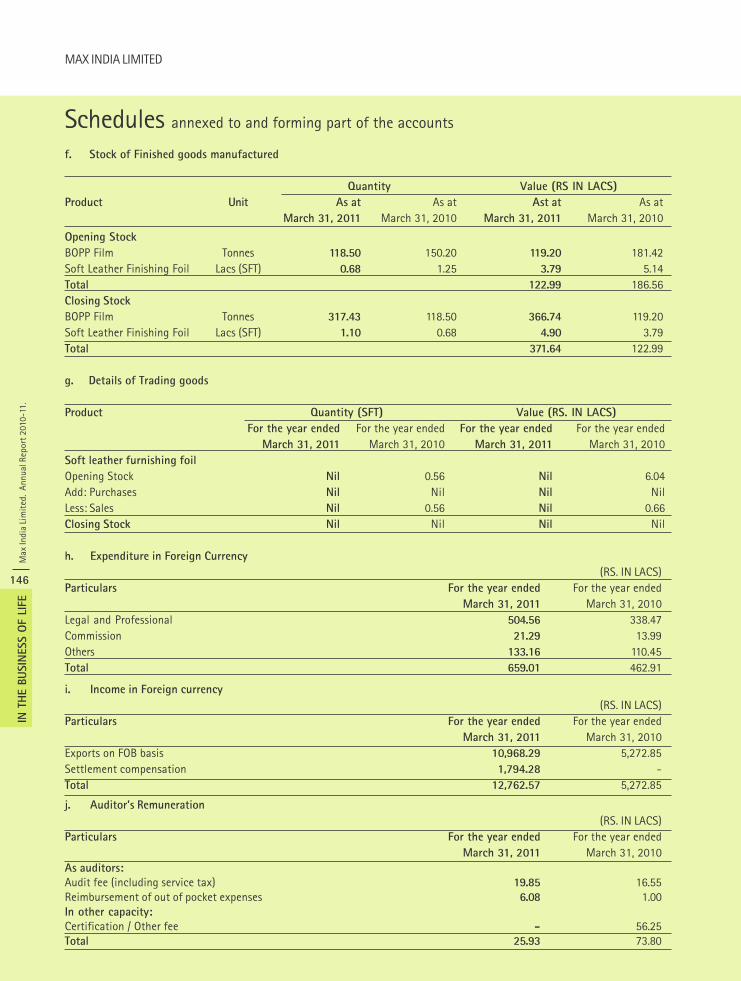
Max
Indi
a Li
mit
ed.
Annu
al R
epor
t 201
0-11
.
146
IN T
HE B
USIN
ESS O
F LI
FE
MAX INDIA LIMITED
Schedules annexed to and forming part of the accounts
f. Stock of Finished goods manufactured
Quantity Value (RS IN LACS)
Product Unit As at As at Ast at As atMarch 31, 2011 March 31, 2010 March 31, 2011 March 31, 2010
Opening Stock
BOPP Film Tonnes 118.50 150.20 119.20 181.42Soft Leather Finishing Foil Lacs (SFT) 0.68 1.25 3.79 5.14Total 122.99 186.56Closing Stock
BOPP Film Tonnes 317.43 118.50 366.74 119.20Soft Leather Finishing Foil Lacs (SFT) 1.10 0.68 4.90 3.79Total 371.64 122.99
g. Details of Trading goods
Product Quantity (SFT) Value (RS. IN LACS)
For the year ended For the year ended For the year ended For the year endedMarch 31, 2011 March 31, 2010 March 31, 2011 March 31, 2010
Soft leather furnishing foil
Opening Stock Nil 0.56 Nil 6.04Add: Purchases Nil Nil Nil NilLess: Sales Nil 0.56 Nil 0.66Closing Stock Nil Nil Nil Nil
h. Expenditure in Foreign Currency
(RS. IN LACS)Particulars For the year ended For the year ended
March 31, 2011 March 31, 2010Legal and Professional 504.56 338.47Commission 21.29 13.99Others 133.16 110.45Total 659.01 462.91
i. Income in Foreign currency
(RS. IN LACS)Particulars For the year ended For the year ended
March 31, 2011 March 31, 2010Exports on FOB basis 10,968.29 5,272.85Settlement compensation 1,794.28 -Total 12,762.57 5,272.85
j. Auditor’s Remuneration
(RS. IN LACS)Particulars For the year ended For the year ended
March 31, 2011 March 31, 2010As auditors:
Audit fee (including service tax) 19.85 16.55Reimbursement of out of pocket expenses 6.08 1.00In other capacity:
Certification / Other fee - 56.25Total 25.93 73.80
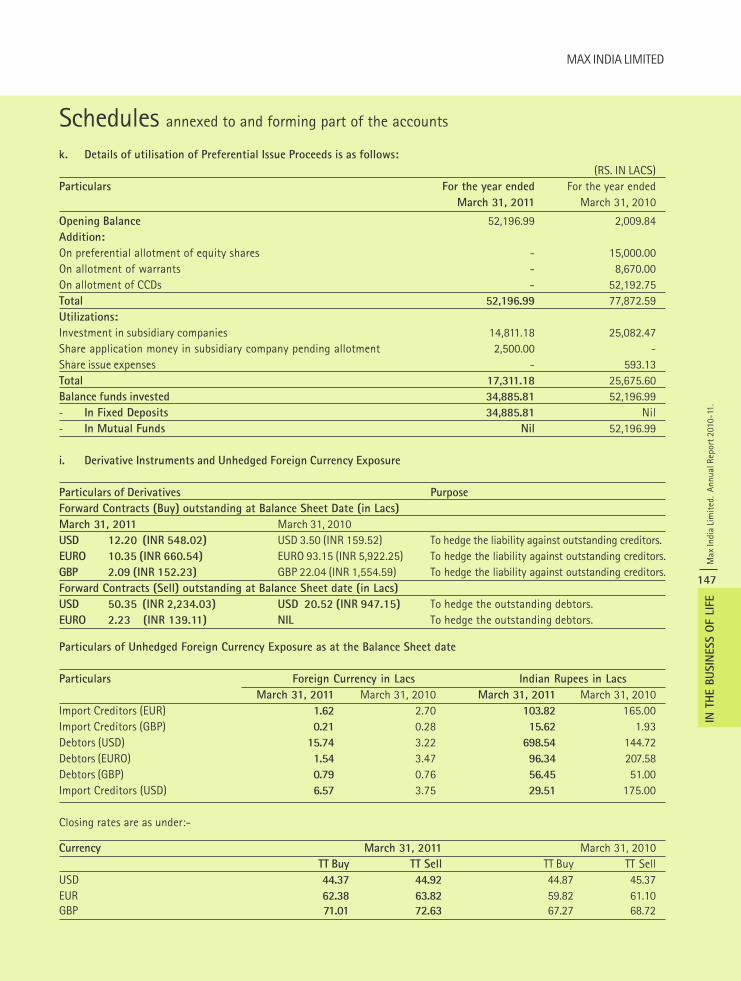
MAX INDIA LIMITED
Max
Indi
a Li
mit
ed.
Annu
al R
epor
t 201
0-11
.
147
IN T
HE B
USIN
ESS O
F LI
FE
Schedules annexed to and forming part of the accounts
k. Details of utilisation of Preferential Issue Proceeds is as follows:
(RS. IN LACS)Particulars For the year ended For the year ended
March 31, 2011 March 31, 2010
Opening Balance 52,196.99 2,009.84Addition:
On preferential allotment of equity shares - 15,000.00On allotment of warrants - 8,670.00On allotment of CCDs - 52,192.75Total 52,196.99 77,872.59Utilizations:
Investment in subsidiary companies 14,811.18 25,082.47Share application money in subsidiary company pending allotment 2,500.00 -Share issue expenses - 593.13Total 17,311.18 25,675.60Balance funds invested 34,885.81 52,196.99- In Fixed Deposits 34,885.81 Nil- In Mutual Funds Nil 52,196.99
i. Derivative Instruments and Unhedged Foreign Currency Exposure
Particulars of Derivatives Purpose
Forward Contracts (Buy) outstanding at Balance Sheet Date (in Lacs)
March 31, 2011 March 31, 2010USD 12.20 (INR 548.02) USD 3.50 (INR 159.52) To hedge the liability against outstanding creditors.EURO 10.35 (INR 660.54) EURO 93.15 (INR 5,922.25) To hedge the liability against outstanding creditors.GBP 2.09 (INR 152.23) GBP 22.04 (INR 1,554.59) To hedge the liability against outstanding creditors.Forward Contracts (Sell) outstanding at Balance Sheet date (in Lacs)
USD 50.35 (INR 2,234.03) USD 20.52 (INR 947.15) To hedge the outstanding debtors.EURO 2.23 (INR 139.11) NIL To hedge the outstanding debtors.
Particulars of Unhedged Foreign Currency Exposure as at the Balance Sheet date
Particulars Foreign Currency in Lacs Indian Rupees in Lacs
March 31, 2011 March 31, 2010 March 31, 2011 March 31, 2010Import Creditors (EUR) 1.62 2.70 103.82 165.00Import Creditors (GBP) 0.21 0.28 15.62 1.93Debtors (USD) 15.74 3.22 698.54 144.72Debtors (EURO) 1.54 3.47 96.34 207.58Debtors (GBP) 0.79 0.76 56.45 51.00Import Creditors (USD) 6.57 3.75 29.51 175.00
Closing rates are as under:-
Currency March 31, 2011 March 31, 2010TT Buy TT Sell TT Buy TT Sell
USD 44.37 44.92 44.87 45.37EUR 62.38 63.82 59.82 61.10GBP 71.01 72.63 67.27 68.72
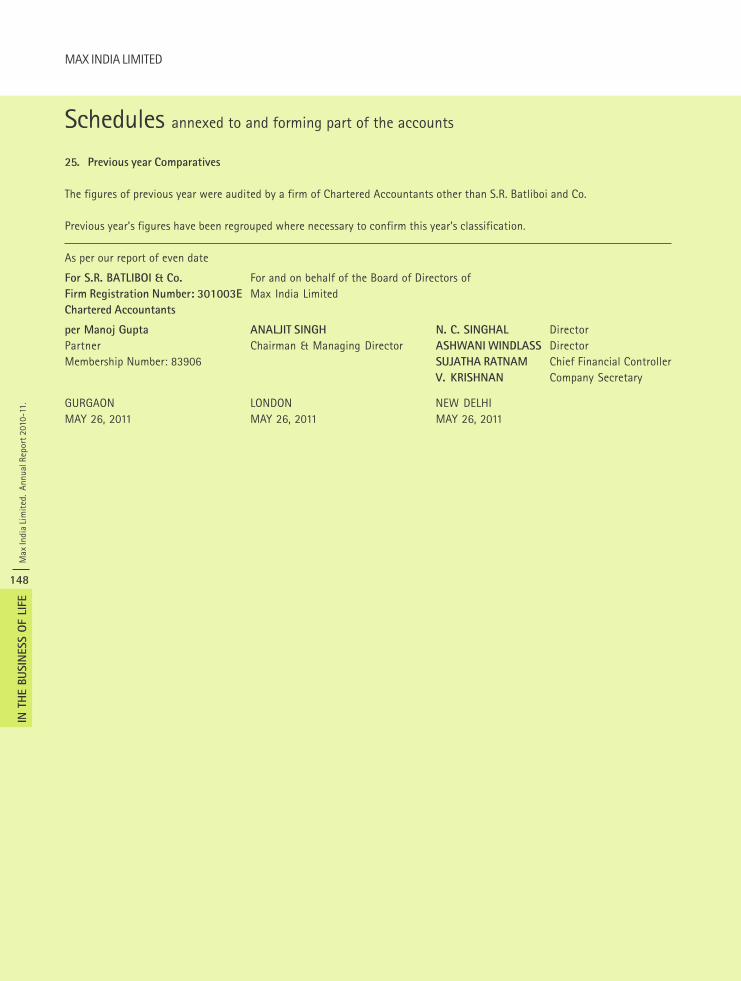
Max
Indi
a Li
mit
ed.
Annu
al R
epor
t 201
0-11
.
148
IN T
HE B
USIN
ESS O
F LI
FE
MAX INDIA LIMITED
Schedules annexed to and forming part of the accounts
25. Previous year Comparatives
The figures of previous year were audited by a firm of Chartered Accountants other than S.R. Batliboi and Co.
Previous year’s figures have been regrouped where necessary to confirm this year’s classification.
As per our report of even date
For S.R. BATLIBOI & Co. For and on behalf of the Board of Directors ofFirm Registration Number: 301003E Max India LimitedChartered Accountants
per Manoj Gupta ANALJIT SINGH N. C. SINGHAL DirectorPartner Chairman & Managing Director ASHWANI WINDLASS DirectorMembership Number: 83906 SUJATHA RATNAM Chief Financial Controller
V. KRISHNAN Company Secretary
GURGAON LONDON NEW DELHIMAY 26, 2011 MAY 26, 2011 MAY 26, 2011
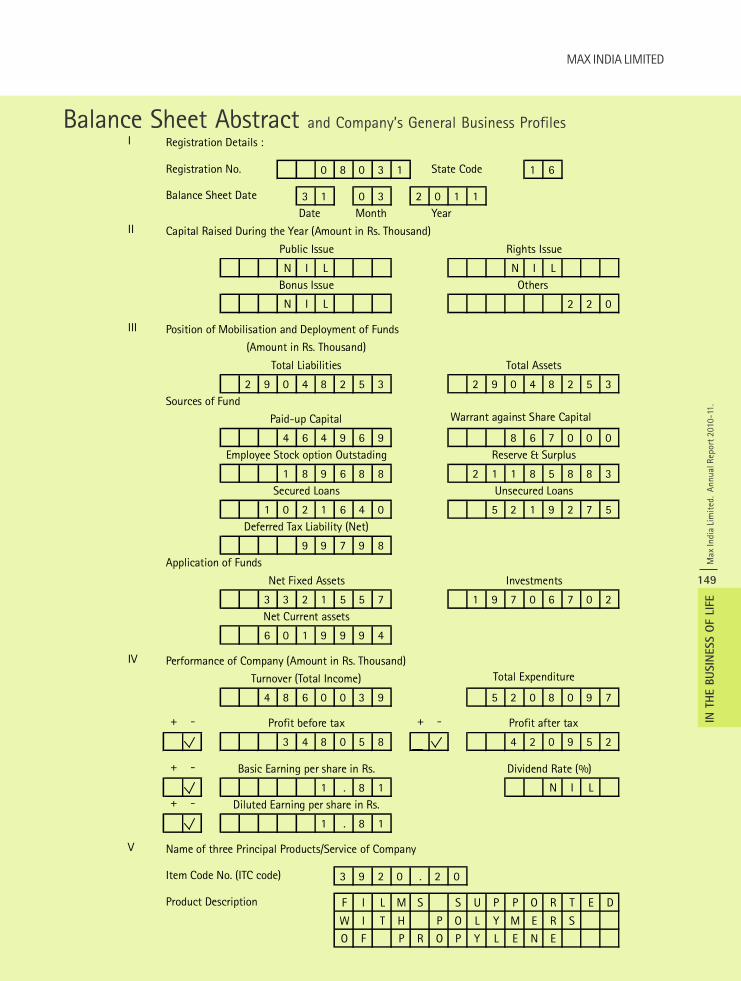
MAX INDIA LIMITED
Max
Indi
a Li
mit
ed.
Annu
al R
epor
t 201
0-11
.
149
IN T
HE B
USIN
ESS O
F LI
FE
Balance Sheet Abstract and Company’s General Business ProfilesI Registration Details :
Registration No. 0 8 0 3 1 State Code 1 6
Balance Sheet Date 3 1 0 3 2 0 1 1Date Month Year
II Capital Raised During the Year (Amount in Rs. Thousand)
Public Issue Rights Issue
N I L N I LBonus Issue Others
N I L 2 2 0
III Position of Mobilisation and Deployment of Funds
(Amount in Rs. Thousand)
Total Liabilities Total Assets
2 9 0 4 8 2 5 3 2 9 0 4 8 2 5 3Sources of Fund
Paid-up Capital Warrant against Share Capital
4 6 4 9 6 9 8 6 7 0 0 0Employee Stock option Outstading Reserve & Surplus
1 8 9 6 8 8 2 1 1 8 5 8 8 3Secured Loans Unsecured Loans
1 0 2 1 6 4 0 5 2 1 9 2 7 5Deferred Tax Liability (Net)
9 9 7 9 8 Application of Funds
Net Fixed Assets Investments
3 3 2 1 5 5 7 1 9 7 0 6 7 0 2Net Current assets
6 0 1 9 9 9 4
IV Performance of Company (Amount in Rs. Thousand)
Turnover (Total Income) Total Expenditure
4 8 6 0 0 3 9 5 2 0 8 0 9 7
+ - Profit before tax + - Profit after tax
3 4 8 0 5 8 4 2 0 9 5 2
+ - Basic Earning per share in Rs. Dividend Rate (%)
1 . 8 1 N I L+ - Diluted Earning per share in Rs.
1 . 8 1
V Name of three Principal Products/Service of Company
Item Code No. (ITC code) 3 9 2 0 . 2 0
Product Description F I L M S S U P P O R T E D
W I T H P O L Y M E R S
O F P R O P Y L E N E
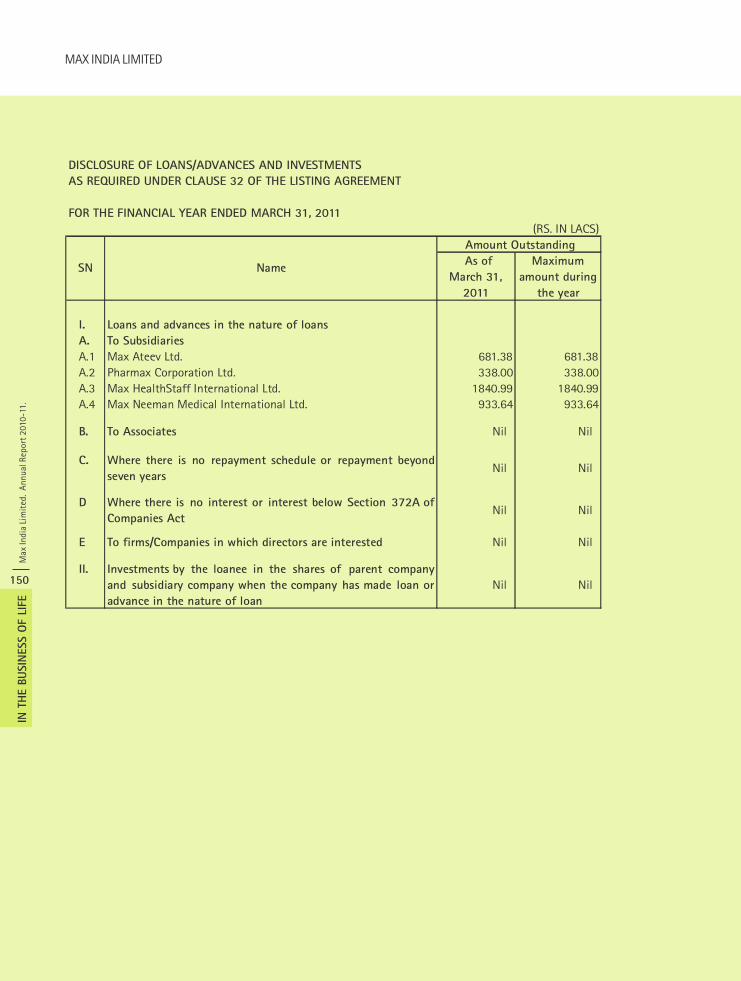
Max
Indi
a Li
mit
ed.
Annu
al R
epor
t 201
0-11
.
150
IN T
HE B
USIN
ESS O
F LI
FE
MAX INDIA LIMITED
DISCLOSURE OF LOANS/ADVANCES AND INVESTMENTS AS REQUIRED UNDER CLAUSE 32 OF THE LISTING AGREEMENT
FOR THE FINANCIAL YEAR ENDED MARCH 31, 2011(RS. IN LACS)
As of March 31,
2011
Maximum amount during
the year
I. Loans and advances in the nature of loansA. To SubsidiariesA.1 Max Ateev Ltd. 681.38 681.38A.2 Pharmax Corporation Ltd. 338.00 338.00A.3 Max HealthStaff International Ltd. 1840.99 1840.99A.4 Max Neeman Medical International Ltd. 933.64 933.64
B. To Associates Nil Nil
C. Where there is no repayment schedule or repayment beyondseven years
Nil Nil
D Where there is no interest or interest below Section 372A ofCompanies Act
Nil Nil
E To firms/Companies in which directors are interested Nil Nil
II. Investments by the loanee in the shares of parent companyand subsidiary company when the company has made loan oradvance in the nature of loan
Nil Nil
SN Name
Amount Outstanding
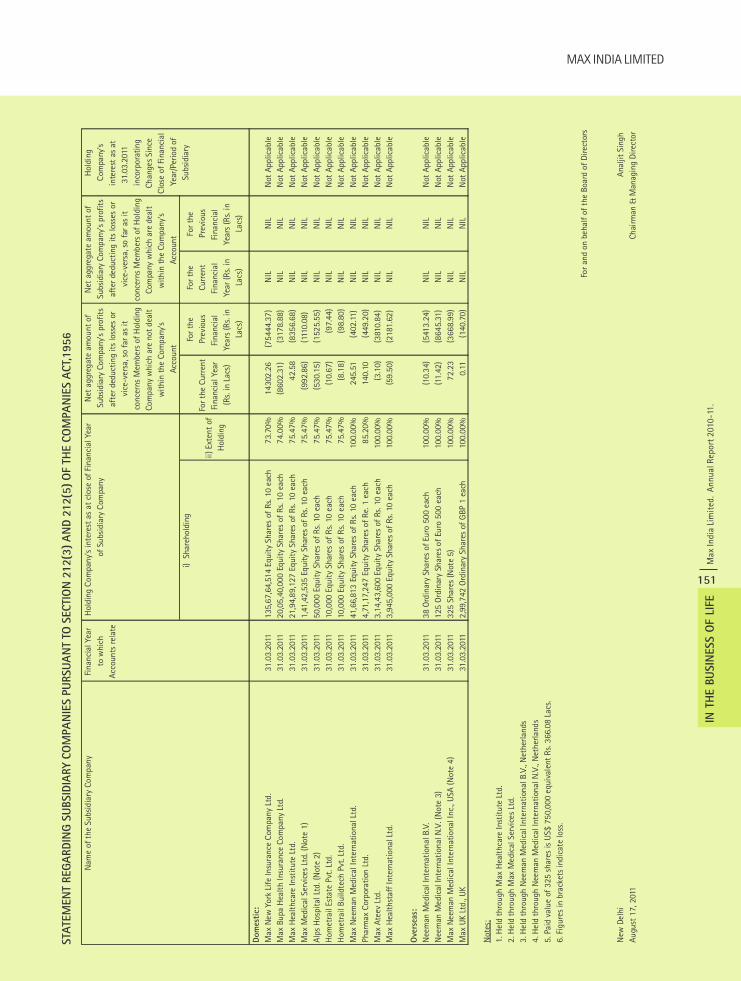
MAX INDIA LIMITED
Max
Indi
a Li
mit
ed.
Annu
al R
epor
t 201
0-11
.
151
IN T
HE B
USIN
ESS O
F LI
FE
STA
TEM
EN
T REG
ARD
ING
SU
BSID
IARY C
OM
PA
NIE
S P
URSU
AN
T TO
SECTI
ON
212(3
) A
ND
212(5
) O
F TH
E C
OM
PA
NIE
S A
CT,
1956
Nam
e of
the
Sub
sidi
ary
Com
pany
Fina
ncia
l Yea
r to
whi
ch
Acco
unts
rel
ate
Hol
ding
Co
mpa
ny's
in
tere
st a
s at
31
.03.
2011
in
corp
orat
ing
Chan
ges
Sinc
e Cl
ose
of F
inan
cial
Ye
ar/P
erio
d of
Su
bsid
iary
i)
Sha
reho
ldin
g
ii) E
xten
t of
Hol
ding
For t
he C
urre
nt
Fina
ncia
l Yea
r
(R
s. in
Lac
s)
For
the
Prev
ious
Fi
nanc
ial
Year
s (R
s. in
La
cs)
For
the
Curr
ent
Fina
ncia
l Ye
ar (R
s. in
La
cs)
For t
he
Prev
ious
Fi
nanc
ial
Year
s (R
s. in
La
cs)
Dom
esti
c:M
ax N
ew Y
ork
Life
Insu
ranc
e Co
mpa
ny L
td.
31.0
3.20
1113
5,67
,64,
514
Equi
ty S
hare
s of
Rs.
10 e
ach
73.7
0%14
302.
26(7
5444
.37)
N
ILN
ILN
ot A
pplic
able
Max
Bup
a H
ealt
h In
sura
nce
Com
pany
Ltd
.31
.03.
2011
20,0
5,40
,000
Equ
ity
Shar
es o
f Rs
. 10
each
74.0
0%(8
602.
31)
(317
8.88
) N
ILN
ILN
ot A
pplic
able
Max
Hea
lthc
are
Inst
itut
e Lt
d.
31.0
3.20
1121
,94,
89,1
27 E
quit
y Sh
ares
of
Rs. 1
0 ea
ch75
.47%
42.5
8(8
356.
68)
NIL
NIL
Not
App
licab
leM
ax M
edic
al S
ervi
ces
Ltd.
(Not
e 1)
31.0
3.20
111,
41,4
2,53
5 Eq
uity
Sha
res
of R
s. 1
0 ea
ch75
.47%
(992
.86)
(1
110.
08)
NIL
NIL
Not
App
licab
leAl
ps H
ospi
tal L
td. (
Not
e 2)
31.0
3.20
1150
,000
Equ
ity
Shar
es o
f Rs.
10
each
75.4
7%(5
30.1
5)
(152
5.55
) N
ILN
ILN
ot A
pplic
able
Hom
etra
il Es
tate
Pvt
. Ltd
.31
.03.
2011
10,0
00 E
quit
y Sh
ares
of
Rs. 1
0 ea
ch75
.47%
(10.
67)
(97.
44)
NIL
NIL
Not
App
licab
leH
omet
rail
Build
tech
Pvt
. Ltd
.31
.03.
2011
10,0
00 E
quit
y Sh
ares
of
Rs. 1
0 ea
ch75
.47%
(8.1
8)
(98.
80)
NIL
NIL
Not
App
licab
leM
ax N
eem
an M
edic
al In
tern
atio
nal L
td.
31.0
3.20
1141
,66,
813
Equi
ty S
hare
s of
Rs.
10 e
ach
100.
00%
245.
51(4
02.1
1)
NIL
NIL
Not
App
licab
lePh
arm
ax C
orpo
rati
on L
td.
31.0
3.20
114,
71,1
7,24
7 Eq
uity
Sha
res
of R
e. 1
eac
h85
.20%
140.
10(4
49.2
0)
NIL
NIL
Not
App
licab
leM
ax A
teev
Ltd
.31
.03.
2011
3,14
,43,
600
Equi
ty S
hare
s of
Rs.
10
each
100.
00%
(3.1
0)
(381
0.84
) N
ILN
ILN
ot A
pplic
able
Max
Hea
lths
taff
Inte
rnat
iona
l Ltd
.31
.03.
2011
3,94
5,00
0 Eq
uity
Sha
res
of R
s. 1
0 ea
ch10
0.00
%(5
9.50
) (2
181.
62)
NIL
NIL
Not
App
licab
le
Ove
rsea
s:N
eem
an M
edic
al In
tern
atio
nal B
.V.
31.0
3.20
1138
Ord
inar
y Sh
ares
of E
uro
500
each
100.
00%
(10.
34)
(541
3.24
) N
ILN
ILN
ot A
pplic
able
Nee
man
Med
ical
Inte
rnat
iona
l N.V
. (N
ote
3)31
.03.
2011
125
Ord
inar
y Sh
ares
of
Euro
500
eac
h10
0.00
%(1
1.42
) (8
645.
31)
NIL
NIL
Not
App
licab
leM
ax N
eem
an M
edic
al In
tern
atio
nal I
nc.,
USA
(Not
e 4)
31.0
3.20
1132
5 Sh
ares
(Not
e 5)
100.
00%
72.2
3(3
668.
99)
NIL
NIL
Not
App
licab
leM
ax U
K Lt
d., U
K31
.03.
2011
2,99
,742
Ord
inar
y Sh
ares
of
GBP
1 e
ach
100.
00%
0.11
(140
.70)
N
ILN
ILN
ot A
pplic
able
Not
es:
1. H
eld
thro
ugh
Max
Hea
lthc
are
Inst
itut
e Lt
d.
2. H
eld
thro
ugh
Max
Med
ical
Ser
vice
s Lt
d.
3. H
eld
thro
ugh
Nee
man
Med
ical
Inte
rnat
iona
l B.V
., N
ethe
rland
s4.
Hel
d th
roug
h N
eem
an M
edic
al In
tern
atio
nal N
.V.,
Net
herla
nds
5. P
aid
valu
e of
325
sha
res
is U
S$ 7
50,0
00 e
quiv
alen
t Rs
. 366
.08
Lacs
.6.
Fig
ures
in b
rack
ets
indi
cate
loss
.
For
and
on b
ehal
f of
the
Boa
rd o
f Di
rect
ors
New
Del
hiAn
aljit
Sin
ghAu
gust
17,
201
1Ch
airm
an &
Man
agin
g D
irect
or
Hol
ding
Com
pany
's in
tere
st a
s at
clo
se o
f Fi
nanc
ial Y
ear
of S
ubsi
diar
y Co
mpa
ny
Net
agg
rega
te a
mou
nt o
f Su
bsid
iary
Com
pany
's p
rofit
s af
ter
dedu
ctin
g it
s lo
sses
or
vice
-ver
sa, s
o fa
r as
it
conc
erns
Mem
bers
of H
oldi
ng
Com
pany
whi
ch a
re n
ot d
ealt
w
ithi
n th
e Co
mpa
ny's
Ac
coun
t
Net
agg
rega
te a
mou
nt o
f Su
bsid
iary
Com
pany
's pr
ofit
s af
ter
dedu
ctin
g its
loss
es o
r vi
ce-v
ersa
, so
far
as it
co
ncer
ns M
embe
rs o
f H
oldi
ng
Com
pany
whi
ch a
re d
ealt
w
ithin
the
Com
pany
's Ac
coun
t

Max
Indi
a Li
mit
ed.
Annu
al R
epor
t 201
0-11
.
152
IN T
HE B
USIN
ESS O
F LI
FE
MAX INDIA LIMITED
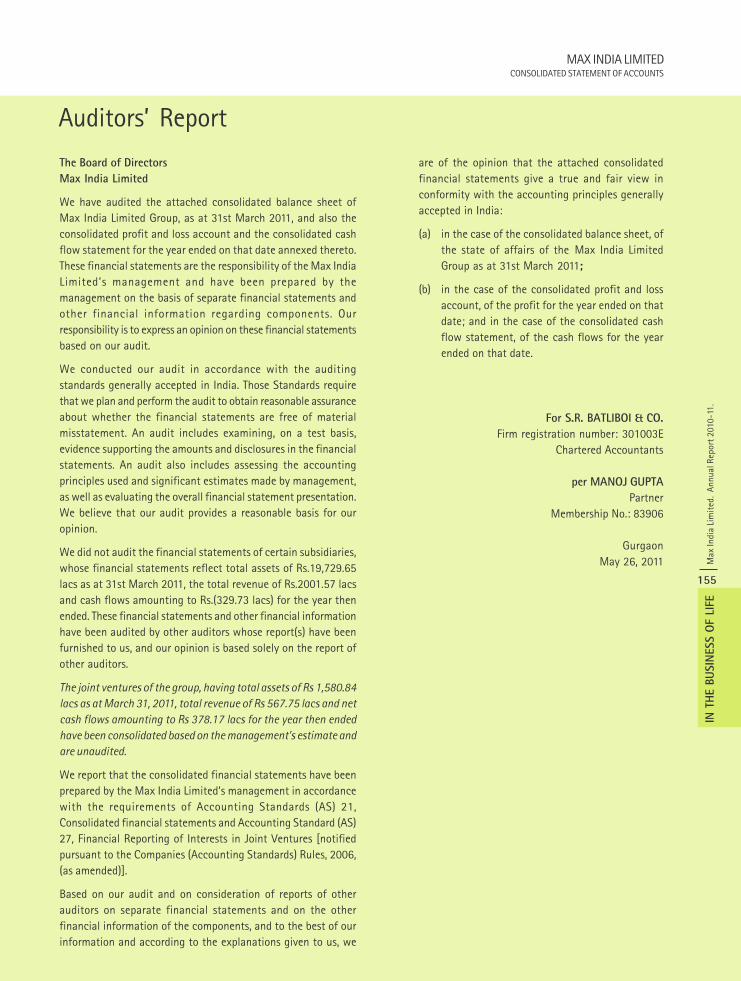
MAX INDIA LIMITEDCONSOLIDATED STATEMENT OF ACCOUNTS
Max
Indi
a Li
mit
ed.
Annu
al R
epor
t 201
0-11
.
155
IN T
HE B
USIN
ESS O
F LI
FE
Auditors’ Report
The Board of Directors
Max India Limited
We have audited the attached consolidated balance sheet ofMax India Limited Group, as at 31st March 2011, and also theconsolidated profit and loss account and the consolidated cashflow statement for the year ended on that date annexed thereto.These financial statements are the responsibility of the Max IndiaLimited’s management and have been prepared by themanagement on the basis of separate financial statements andother financial information regarding components. Ourresponsibility is to express an opinion on these financial statementsbased on our audit.
We conducted our audit in accordance with the auditingstandards generally accepted in India. Those Standards requirethat we plan and perform the audit to obtain reasonable assuranceabout whether the financial statements are free of materialmisstatement. An audit includes examining, on a test basis,evidence supporting the amounts and disclosures in the financialstatements. An audit also includes assessing the accountingprinciples used and significant estimates made by management,as well as evaluating the overall financial statement presentation.We believe that our audit provides a reasonable basis for ouropinion.
We did not audit the financial statements of certain subsidiaries,whose financial statements reflect total assets of Rs.19,729.65lacs as at 31st March 2011, the total revenue of Rs.2001.57 lacsand cash flows amounting to Rs.(329.73 lacs) for the year thenended. These financial statements and other financial informationhave been audited by other auditors whose report(s) have beenfurnished to us, and our opinion is based solely on the report ofother auditors.
The joint ventures of the group, having total assets of Rs 1,580.84
lacs as at March 31, 2011, total revenue of Rs 567.75 lacs and net
cash flows amounting to Rs 378.17 lacs for the year then ended
have been consolidated based on the management’s estimate and
are unaudited.
We report that the consolidated financial statements have beenprepared by the Max India Limited’s management in accordancewith the requirements of Accounting Standards (AS) 21,Consolidated financial statements and Accounting Standard (AS)27, Financial Reporting of Interests in Joint Ventures [notifiedpursuant to the Companies (Accounting Standards) Rules, 2006,(as amended)].
Based on our audit and on consideration of reports of otherauditors on separate financial statements and on the otherfinancial information of the components, and to the best of ourinformation and according to the explanations given to us, we
are of the opinion that the attached consolidatedfinancial statements give a true and fair view inconformity with the accounting principles generallyaccepted in India:
(a) in the case of the consolidated balance sheet, ofthe state of affairs of the Max India LimitedGroup as at 31st March 2011;
(b) in the case of the consolidated profit and lossaccount, of the profit for the year ended on thatdate; and in the case of the consolidated cashflow statement, of the cash flows for the yearended on that date.
For S.R. BATLIBOI & CO.
Firm registration number: 301003EChartered Accountants
per MANOJ GUPTA
PartnerMembership No.: 83906
GurgaonMay 26, 2011
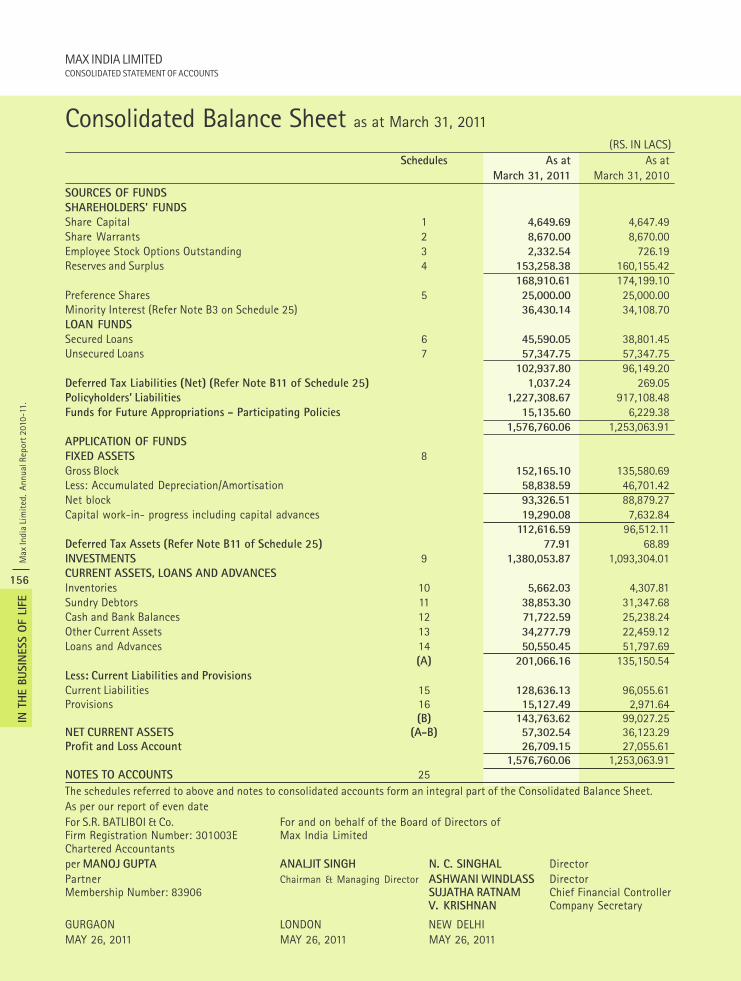
Max
Indi
a Li
mit
ed.
Annu
al R
epor
t 201
0-11
.
156
IN T
HE B
USIN
ESS O
F LI
FE
MAX INDIA LIMITEDCONSOLIDATED STATEMENT OF ACCOUNTS
Consolidated Balance Sheet as at March 31, 2011
Schedules As at As atMarch 31, 2011 March 31, 2010
SOURCES OF FUNDS
SHAREHOLDERS’ FUNDS
Share Capital 1 4,649.69 4,647.49Share Warrants 2 8,670.00 8,670.00Employee Stock Options Outstanding 3 2,332.54 726.19Reserves and Surplus 4 153,258.38 160,155.42
168,910.61 174,199.10Preference Shares 5 25,000.00 25,000.00Minority Interest (Refer Note B3 on Schedule 25) 36,430.14 34,108.70LOAN FUNDS
Secured Loans 6 45,590.05 38,801.45Unsecured Loans 7 57,347.75 57,347.75
102,937.80 96,149.20Deferred Tax Liabilities (Net) (Refer Note B11 of Schedule 25) 1,037.24 269.05Policyholders’ Liabilities 1,227,308.67 917,108.48Funds for Future Appropriations - Participating Policies 15,135.60 6,229.38
1,576,760.06 1,253,063.91APPLICATION OF FUNDS
FIXED ASSETS 8Gross Block 152,165.10 135,580.69Less: Accumulated Depreciation/Amortisation 58,838.59 46,701.42Net block 93,326.51 88,879.27Capital work-in- progress including capital advances 19,290.08 7,632.84
112,616.59 96,512.11Deferred Tax Assets (Refer Note B11 of Schedule 25) 77.91 68.89INVESTMENTS 9 1,380,053.87 1,093,304.01CURRENT ASSETS, LOANS AND ADVANCES
Inventories 10 5,662.03 4,307.81Sundry Debtors 11 38,853.30 31,347.68Cash and Bank Balances 12 71,722.59 25,238.24Other Current Assets 13 34,277.79 22,459.12Loans and Advances 14 50,550.45 51,797.69
(A) 201,066.16 135,150.54Less: Current Liabilities and Provisions
Current Liabilities 15 128,636.13 96,055.61Provisions 16 15,127.49 2,971.64
(B) 143,763.62 99,027.25NET CURRENT ASSETS (A-B) 57,302.54 36,123.29Profit and Loss Account 26,709.15 27,055.61
1,576,760.06 1,253,063.91NOTES TO ACCOUNTS 25The schedules referred to above and notes to consolidated accounts form an integral part of the Consolidated Balance Sheet.As per our report of even dateFor S.R. BATLIBOI & Co. For and on behalf of the Board of Directors ofFirm Registration Number: 301003E Max India LimitedChartered Accountantsper MANOJ GUPTA ANALJIT SINGH N. C. SINGHAL DirectorPartner Chairman & Managing Director ASHWANI WINDLASS DirectorMembership Number: 83906 SUJATHA RATNAM Chief Financial Controller
V. KRISHNAN Company Secretary
GURGAON LONDON NEW DELHIMAY 26, 2011 MAY 26, 2011 MAY 26, 2011
(RS. IN LACS)
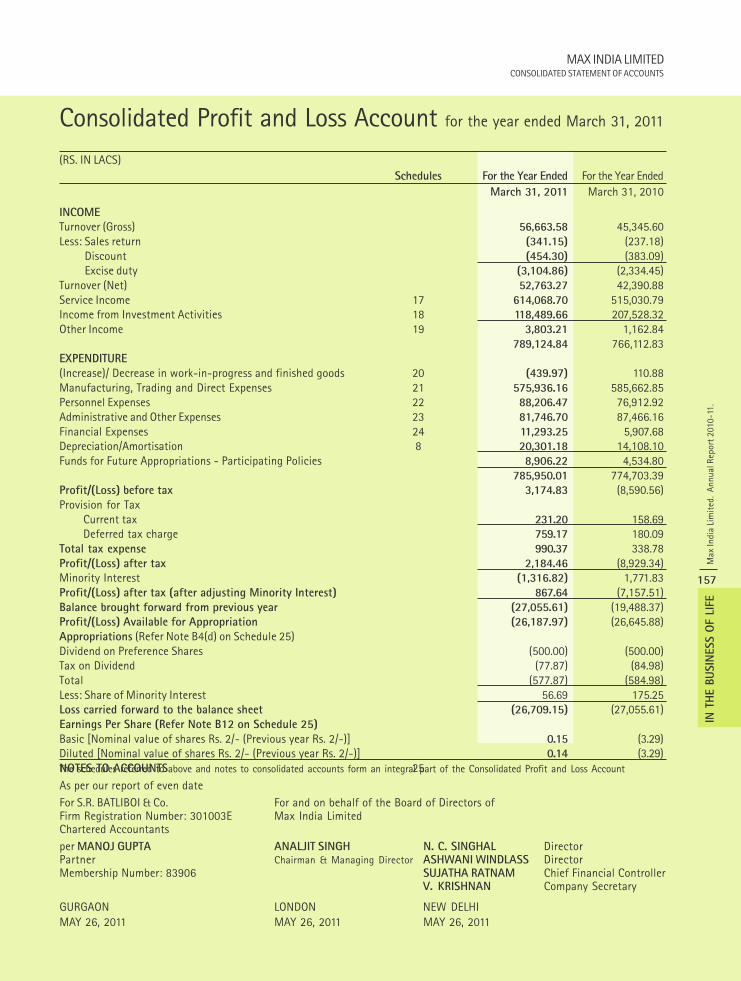
MAX INDIA LIMITEDCONSOLIDATED STATEMENT OF ACCOUNTS
Max
Indi
a Li
mit
ed.
Annu
al R
epor
t 201
0-11
.
157
IN T
HE B
USIN
ESS O
F LI
FE
Consolidated Profit and Loss Account for the year ended March 31, 2011
(RS. IN LACS)Schedules For the Year Ended For the Year Ended
March 31, 2011 March 31, 2010
INCOME
Turnover (Gross) 56,663.58 45,345.60Less: Sales return (341.15) (237.18)
Discount (454.30) (383.09)Excise duty (3,104.86) (2,334.45)
Turnover (Net) 52,763.27 42,390.88Service Income 17 614,068.70 515,030.79Income from Investment Activities 18 118,489.66 207,528.32Other Income 19 3,803.21 1,162.84
789,124.84 766,112.83EXPENDITURE
(Increase)/ Decrease in work-in-progress and finished goods 20 (439.97) 110.88Manufacturing, Trading and Direct Expenses 21 575,936.16 585,662.85Personnel Expenses 22 88,206.47 76,912.92Administrative and Other Expenses 23 81,746.70 87,466.16Financial Expenses 24 11,293.25 5,907.68Depreciation/Amortisation 8 20,301.18 14,108.10Funds for Future Appropriations - Participating Policies 8,906.22 4,534.80
785,950.01 774,703.39Profit/(Loss) before tax 3,174.83 (8,590.56)Provision for Tax
Current tax 231.20 158.69Deferred tax charge 759.17 180.09
Total tax expense 990.37 338.78Profit/(Loss) after tax 2,184.46 (8,929.34)Minority Interest (1,316.82) 1,771.83Profit/(Loss) after tax (after adjusting Minority Interest) 867.64 (7,157.51)Balance brought forward from previous year (27,055.61) (19,488.37)Profit/(Loss) Available for Appropriation (26,187.97) (26,645.88)Appropriations (Refer Note B4(d) on Schedule 25)Dividend on Preference Shares (500.00) (500.00)Tax on Dividend (77.87) (84.98)Total (577.87) (584.98)Less: Share of Minority Interest 56.69 175.25Loss carried forward to the balance sheet (26,709.15) (27,055.61)Earnings Per Share (Refer Note B12 on Schedule 25)
Basic [Nominal value of shares Rs. 2/- (Previous year Rs. 2/-)] 0.15 (3.29)Diluted [Nominal value of shares Rs. 2/- (Previous year Rs. 2/-)] 0.14 (3.29)NOTES TO ACCOUNTS 25The schedules referred to above and notes to consolidated accounts form an integral part of the Consolidated Profit and Loss Account
As per our report of even dateFor S.R. BATLIBOI & Co. For and on behalf of the Board of Directors ofFirm Registration Number: 301003E Max India LimitedChartered Accountantsper MANOJ GUPTA ANALJIT SINGH N. C. SINGHAL DirectorPartner Chairman & Managing Director ASHWANI WINDLASS DirectorMembership Number: 83906 SUJATHA RATNAM Chief Financial Controller
V. KRISHNAN Company Secretary
GURGAON LONDON NEW DELHIMAY 26, 2011 MAY 26, 2011 MAY 26, 2011
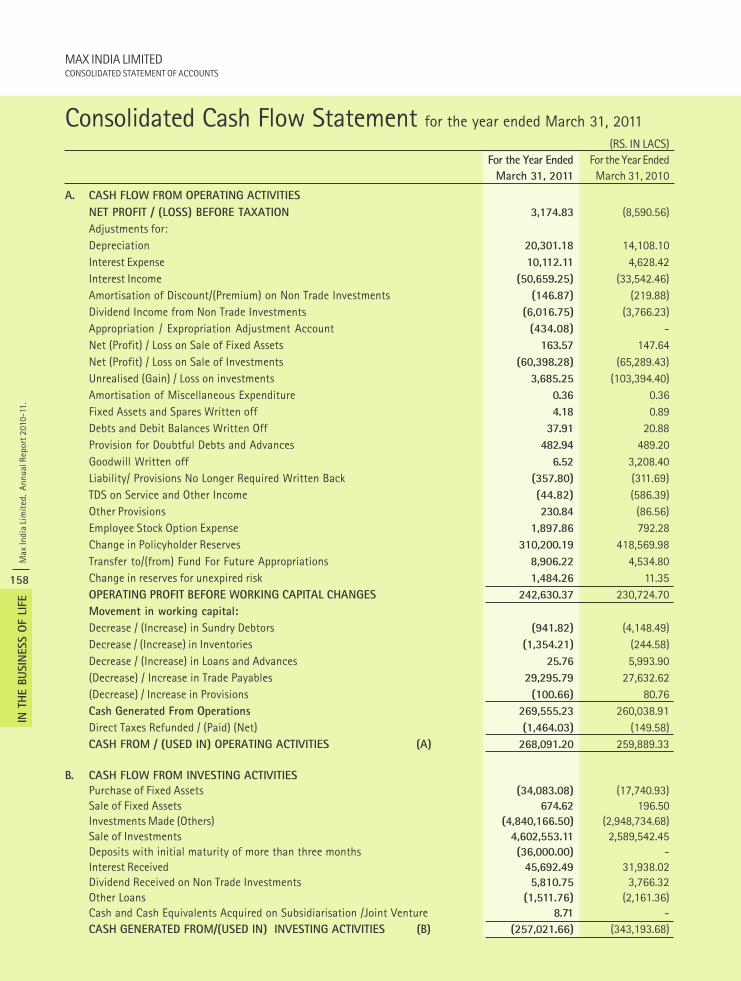
Max
Indi
a Li
mit
ed.
Annu
al R
epor
t 201
0-11
.
158
IN T
HE B
USIN
ESS O
F LI
FE
MAX INDIA LIMITEDCONSOLIDATED STATEMENT OF ACCOUNTS
Consolidated Cash Flow Statement for the year ended March 31, 2011(RS. IN LACS)
For the Year Ended For the Year EndedMarch 31, 2011 March 31, 2010
A. CASH FLOW FROM OPERATING ACTIVITIES
NET PROFIT / (LOSS) BEFORE TAXATION 3,174.83 (8,590.56)Adjustments for:Depreciation 20,301.18 14,108.10Interest Expense 10,112.11 4,628.42Interest Income (50,659.25) (33,542.46)Amortisation of Discount/(Premium) on Non Trade Investments (146.87) (219.88)Dividend Income from Non Trade Investments (6,016.75) (3,766.23)Appropriation / Expropriation Adjustment Account (434.08) -Net (Profit) / Loss on Sale of Fixed Assets 163.57 147.64Net (Profit) / Loss on Sale of Investments (60,398.28) (65,289.43)Unrealised (Gain) / Loss on investments 3,685.25 (103,394.40)Amortisation of Miscellaneous Expenditure 0.36 0.36Fixed Assets and Spares Written off 4.18 0.89Debts and Debit Balances Written Off 37.91 20.88Provision for Doubtful Debts and Advances 482.94 489.20Goodwill Written off 6.52 3,208.40Liability/ Provisions No Longer Required Written Back (357.80) (311.69)TDS on Service and Other Income (44.82) (586.39)Other Provisions 230.84 (86.56)Employee Stock Option Expense 1,897.86 792.28Change in Policyholder Reserves 310,200.19 418,569.98Transfer to/(from) Fund For Future Appropriations 8,906.22 4,534.80Change in reserves for unexpired risk 1,484.26 11.35OPERATING PROFIT BEFORE WORKING CAPITAL CHANGES 242,630.37 230,724.70Movement in working capital:
Decrease / (Increase) in Sundry Debtors (941.82) (4,148.49)Decrease / (Increase) in Inventories (1,354.21) (244.58)Decrease / (Increase) in Loans and Advances 25.76 5,993.90(Decrease) / Increase in Trade Payables 29,295.79 27,632.62(Decrease) / Increase in Provisions (100.66) 80.76Cash Generated From Operations 269,555.23 260,038.91Direct Taxes Refunded / (Paid) (Net) (1,464.03) (149.58)CASH FROM / (USED IN) OPERATING ACTIVITIES (A) 268,091.20 259,889.33
B. CASH FLOW FROM INVESTING ACTIVITIES
Purchase of Fixed Assets (34,083.08) (17,740.93)Sale of Fixed Assets 674.62 196.50Investments Made (Others) (4,840,166.50) (2,948,734.68)Sale of Investments 4,602,553.11 2,589,542.45Deposits with initial maturity of more than three months (36,000.00) -Interest Received 45,692.49 31,938.02Dividend Received on Non Trade Investments 5,810.75 3,766.32Other Loans (1,511.76) (2,161.36)Cash and Cash Equivalents Acquired on Subsidiarisation /Joint Venture 8.71 -CASH GENERATED FROM/(USED IN) INVESTING ACTIVITIES (B) (257,021.66) (343,193.68)
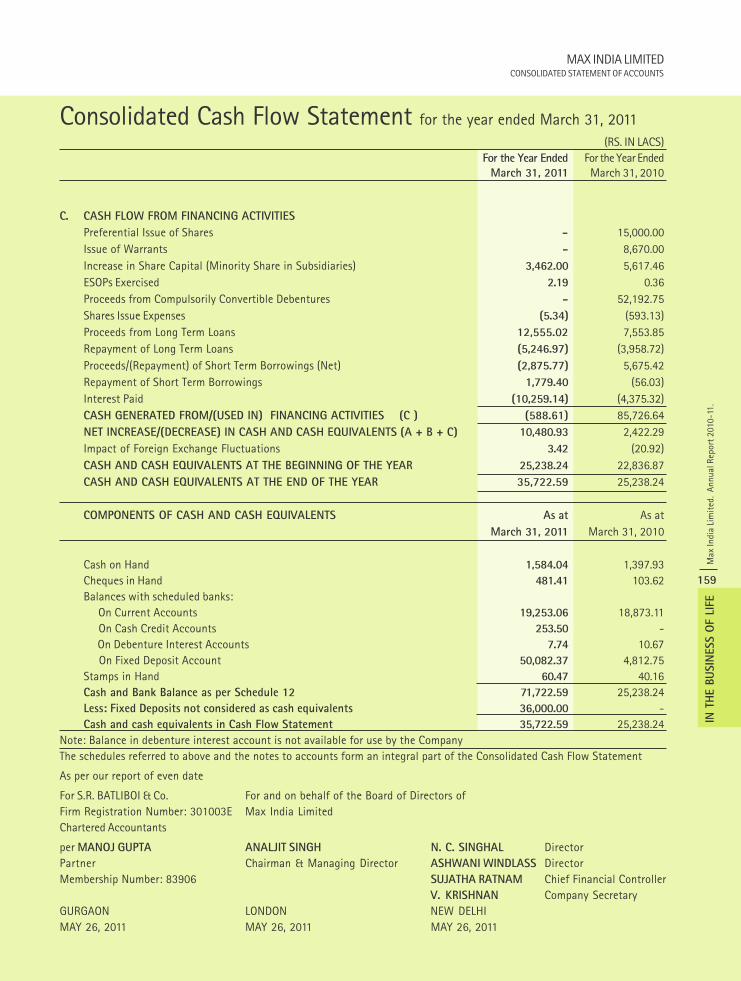
MAX INDIA LIMITEDCONSOLIDATED STATEMENT OF ACCOUNTS
Max
Indi
a Li
mit
ed.
Annu
al R
epor
t 201
0-11
.
159
IN T
HE B
USIN
ESS O
F LI
FE
C. CASH FLOW FROM FINANCING ACTIVITIES
Preferential Issue of Shares - 15,000.00Issue of Warrants - 8,670.00Increase in Share Capital (Minority Share in Subsidiaries) 3,462.00 5,617.46ESOPs Exercised 2.19 0.36Proceeds from Compulsorily Convertible Debentures - 52,192.75Shares Issue Expenses (5.34) (593.13)Proceeds from Long Term Loans 12,555.02 7,553.85Repayment of Long Term Loans (5,246.97) (3,958.72)Proceeds/(Repayment) of Short Term Borrowings (Net) (2,875.77) 5,675.42Repayment of Short Term Borrowings 1,779.40 (56.03)Interest Paid (10,259.14) (4,375.32)CASH GENERATED FROM/(USED IN) FINANCING ACTIVITIES (C ) (588.61) 85,726.64NET INCREASE/(DECREASE) IN CASH AND CASH EQUIVALENTS (A + B + C) 10,480.93 2,422.29Impact of Foreign Exchange Fluctuations 3.42 (20.92)CASH AND CASH EQUIVALENTS AT THE BEGINNING OF THE YEAR 25,238.24 22,836.87CASH AND CASH EQUIVALENTS AT THE END OF THE YEAR 35,722.59 25,238.24
COMPONENTS OF CASH AND CASH EQUIVALENTS As at As atMarch 31, 2011 March 31, 2010
Cash on Hand 1,584.04 1,397.93Cheques in Hand 481.41 103.62Balances with scheduled banks: On Current Accounts 19,253.06 18,873.11 On Cash Credit Accounts 253.50 - On Debenture Interest Accounts 7.74 10.67 On Fixed Deposit Account 50,082.37 4,812.75Stamps in Hand 60.47 40.16Cash and Bank Balance as per Schedule 12 71,722.59 25,238.24Less: Fixed Deposits not considered as cash equivalents 36,000.00 -Cash and cash equivalents in Cash Flow Statement 35,722.59 25,238.24
Note: Balance in debenture interest account is not available for use by the CompanyThe schedules referred to above and the notes to accounts form an integral part of the Consolidated Cash Flow Statement
As per our report of even date
For S.R. BATLIBOI & Co. For and on behalf of the Board of Directors ofFirm Registration Number: 301003E Max India LimitedChartered Accountants
per MANOJ GUPTA ANALJIT SINGH N. C. SINGHAL DirectorPartner Chairman & Managing Director ASHWANI WINDLASS DirectorMembership Number: 83906 SUJATHA RATNAM Chief Financial Controller
V. KRISHNAN Company SecretaryGURGAON LONDON NEW DELHIMAY 26, 2011 MAY 26, 2011 MAY 26, 2011
Consolidated Cash Flow Statement for the year ended March 31, 2011(RS. IN LACS)
For the Year Ended For the Year EndedMarch 31, 2011 March 31, 2010
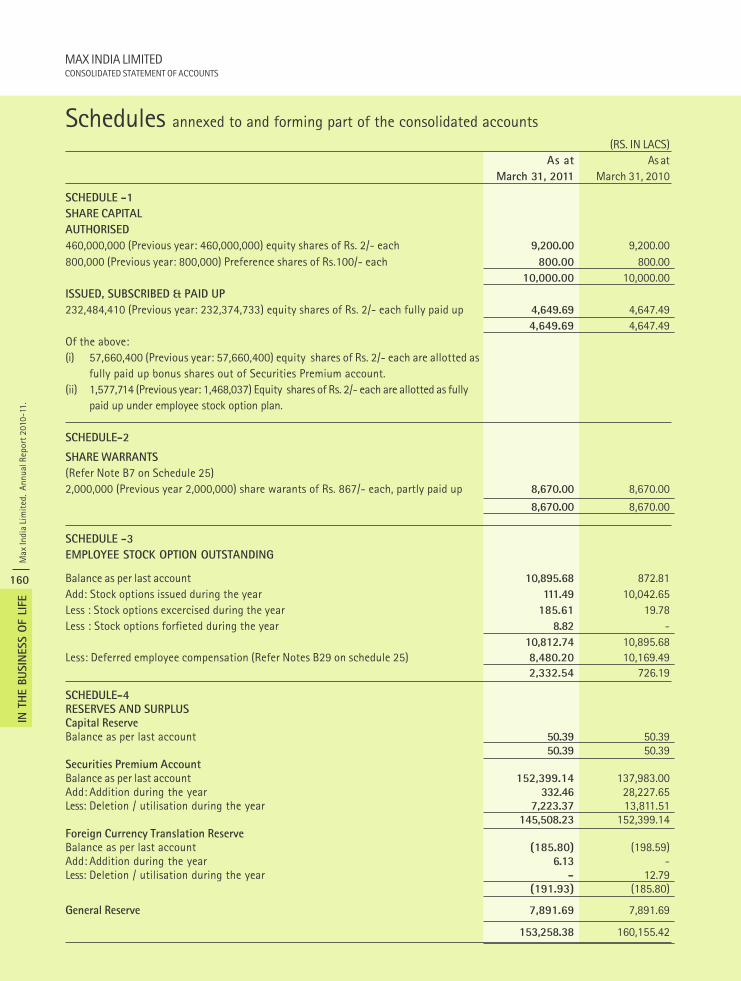
Max
Indi
a Li
mit
ed.
Annu
al R
epor
t 201
0-11
.
160
IN T
HE B
USIN
ESS O
F LI
FE
MAX INDIA LIMITEDCONSOLIDATED STATEMENT OF ACCOUNTS
Schedules annexed to and forming part of the consolidated accounts(RS. IN LACS)
As at As atMarch 31, 2011 March 31, 2010
SCHEDULE -1
SHARE CAPITAL
AUTHORISED
460,000,000 (Previous year: 460,000,000) equity shares of Rs. 2/- each 9,200.00 9,200.00800,000 (Previous year: 800,000) Preference shares of Rs.100/- each 800.00 800.00
10,000.00 10,000.00ISSUED, SUBSCRIBED & PAID UP
232,484,410 (Previous year: 232,374,733) equity shares of Rs. 2/- each fully paid up 4,649.69 4,647.49 4,649.69 4,647.49
Of the above:(i) 57,660,400 (Previous year: 57,660,400) equity shares of Rs. 2/- each are allotted as
fully paid up bonus shares out of Securities Premium account.(ii) 1,577,714 (Previous year: 1,468,037) Equity shares of Rs. 2/- each are allotted as fully
paid up under employee stock option plan.
SCHEDULE-2
SHARE WARRANTS
(Refer Note B7 on Schedule 25)2,000,000 (Previous year 2,000,000) share warants of Rs. 867/- each, partly paid up 8,670.00 8,670.00
8,670.00 8,670.00
SCHEDULE -3
EMPLOYEE STOCK OPTION OUTSTANDING
Balance as per last account 10,895.68 872.81Add: Stock options issued during the year 111.49 10,042.65Less : Stock options excercised during the year 185.61 19.78Less : Stock options forfieted during the year 8.82 -
10,812.74 10,895.68Less: Deferred employee compensation (Refer Notes B29 on schedule 25) 8,480.20 10,169.49
2,332.54 726.19
SCHEDULE-4RESERVES AND SURPLUSCapital ReserveBalance as per last account 50.39 50.39
50.39 50.39Securities Premium AccountBalance as per last account 152,399.14 137,983.00Add: Addition during the year 332.46 28,227.65Less: Deletion / utilisation during the year 7,223.37 13,811.51
145,508.23 152,399.14Foreign Currency Translation ReserveBalance as per last account (185.80) (198.59)Add: Addition during the year 6.13 -Less: Deletion / utilisation during the year - 12.79
(191.93) (185.80)
General Reserve 7,891.69 7,891.69
153,258.38 160,155.42
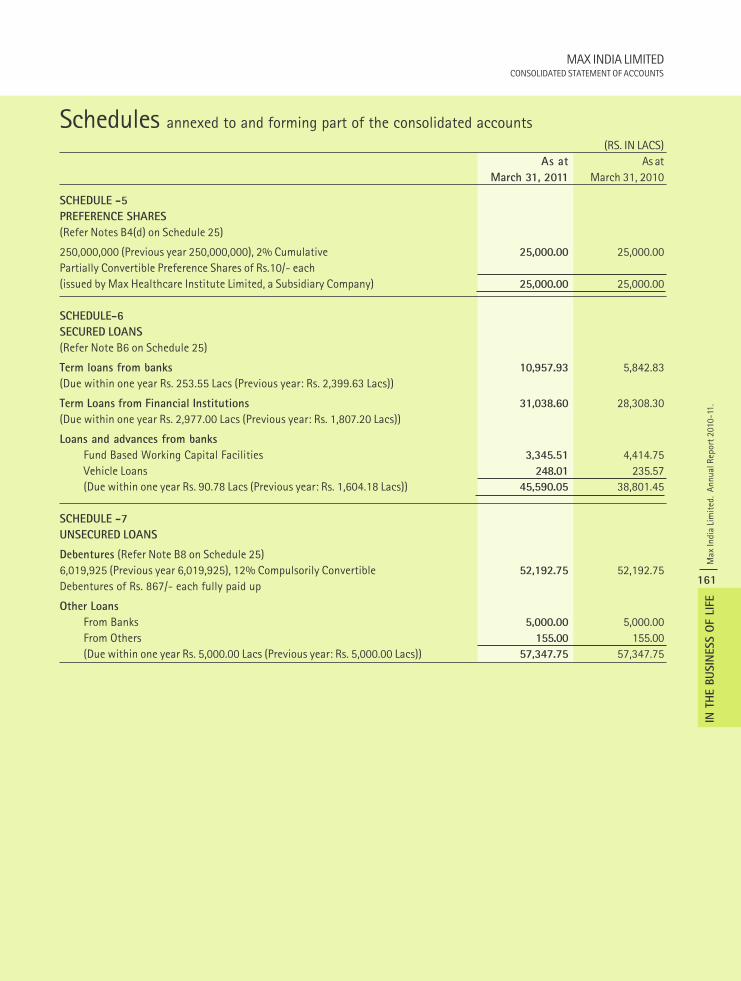
MAX INDIA LIMITEDCONSOLIDATED STATEMENT OF ACCOUNTS
Max
Indi
a Li
mit
ed.
Annu
al R
epor
t 201
0-11
.
161
IN T
HE B
USIN
ESS O
F LI
FE
Schedules annexed to and forming part of the consolidated accounts(RS. IN LACS)
As at As atMarch 31, 2011 March 31, 2010
SCHEDULE -5
PREFERENCE SHARES
(Refer Notes B4(d) on Schedule 25)
250,000,000 (Previous year 250,000,000), 2% Cumulative 25,000.00 25,000.00Partially Convertible Preference Shares of Rs.10/- each(issued by Max Healthcare Institute Limited, a Subsidiary Company) 25,000.00 25,000.00
SCHEDULE-6
SECURED LOANS
(Refer Note B6 on Schedule 25)
Term loans from banks 10,957.93 5,842.83(Due within one year Rs. 253.55 Lacs (Previous year: Rs. 2,399.63 Lacs))
Term Loans from Financial Institutions 31,038.60 28,308.30(Due within one year Rs. 2,977.00 Lacs (Previous year: Rs. 1,807.20 Lacs))
Loans and advances from banks
Fund Based Working Capital Facilities 3,345.51 4,414.75Vehicle Loans 248.01 235.57(Due within one year Rs. 90.78 Lacs (Previous year: Rs. 1,604.18 Lacs)) 45,590.05 38,801.45
SCHEDULE -7
UNSECURED LOANS
Debentures (Refer Note B8 on Schedule 25)6,019,925 (Previous year 6,019,925), 12% Compulsorily Convertible 52,192.75 52,192.75Debentures of Rs. 867/- each fully paid up
Other Loans
From Banks 5,000.00 5,000.00From Others 155.00 155.00(Due within one year Rs. 5,000.00 Lacs (Previous year: Rs. 5,000.00 Lacs)) 57,347.75 57,347.75
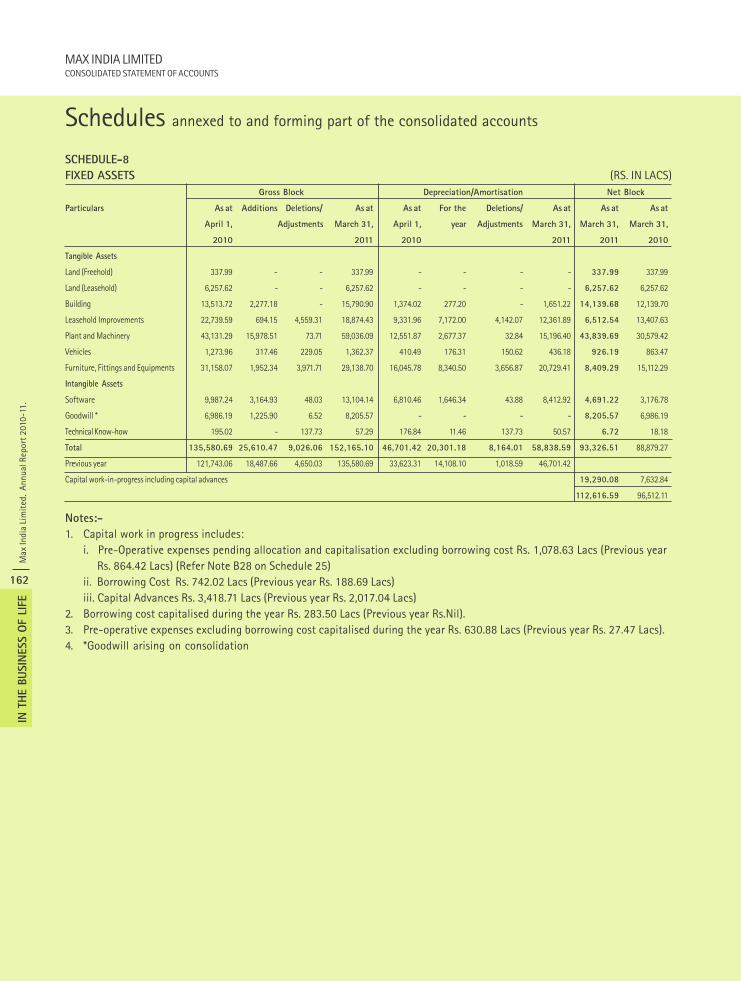
Max
Indi
a Li
mit
ed.
Annu
al R
epor
t 201
0-11
.
162
IN T
HE B
USIN
ESS O
F LI
FE
MAX INDIA LIMITEDCONSOLIDATED STATEMENT OF ACCOUNTS
Schedules annexed to and forming part of the consolidated accounts
SCHEDULE-8
FIXED ASSETS (RS. IN LACS) Gross Block Depreciation/Amortisation Net Block
Particulars As at Additions Deletions/ As at As at For the Deletions/ As at As at As at
April 1, Adjustments March 31, April 1, year Adjustments March 31, March 31, March 31,
2010 2011 2010 2011 2011 2010
Tangible Assets
Land (Freehold) 337.99 - - 337.99 - - - - 337.99 337.99
Land (Leasehold) 6,257.62 - - 6,257.62 - - - - 6,257.62 6,257.62
Building 13,513.72 2,277.18 - 15,790.90 1,374.02 277.20 - 1,651.22 14,139.68 12,139.70
Leasehold Improvements 22,739.59 694.15 4,559.31 18,874.43 9,331.96 7,172.00 4,142.07 12,361.89 6,512.54 13,407.63
Plant and Machinery 43,131.29 15,978.51 73.71 59,036.09 12,551.87 2,677.37 32.84 15,196.40 43,839.69 30,579.42
Vehicles 1,273.96 317.46 229.05 1,362.37 410.49 176.31 150.62 436.18 926.19 863.47
Furniture, Fittings and Equipments 31,158.07 1,952.34 3,971.71 29,138.70 16,045.78 8,340.50 3,656.87 20,729.41 8,409.29 15,112.29
Intangible Assets
Software 9,987.24 3,164.93 48.03 13,104.14 6,810.46 1,646.34 43.88 8,412.92 4,691.22 3,176.78
Goodwill * 6,986.19 1,225.90 6.52 8,205.57 - - - - 8,205.57 6,986.19
Technical Know-how 195.02 - 137.73 57.29 176.84 11.46 137.73 50.57 6.72 18.18
Total 135,580.69 25,610.47 9,026.06 152,165.10 46,701.42 20,301.18 8,164.01 58,838.59 93,326.51 88,879.27
Previous year 121,743.06 18,487.66 4,650.03 135,580.69 33,623.31 14,108.10 1,018.59 46,701.42
Capital work-in-progress including capital advances 19,290.08 7,632.84
112,616.59 96,512.11
Notes:-
1. Capital work in progress includes:i. Pre-Operative expenses pending allocation and capitalisation excluding borrowing cost Rs. 1,078.63 Lacs (Previous year Rs. 864.42 Lacs) (Refer Note B28 on Schedule 25)ii. Borrowing Cost Rs. 742.02 Lacs (Previous year Rs. 188.69 Lacs)iii. Capital Advances Rs. 3,418.71 Lacs (Previous year Rs. 2,017.04 Lacs)
2. Borrowing cost capitalised during the year Rs. 283.50 Lacs (Previous year Rs.Nil).3. Pre-operative expenses excluding borrowing cost capitalised during the year Rs. 630.88 Lacs (Previous year Rs. 27.47 Lacs).4. *Goodwill arising on consolidation
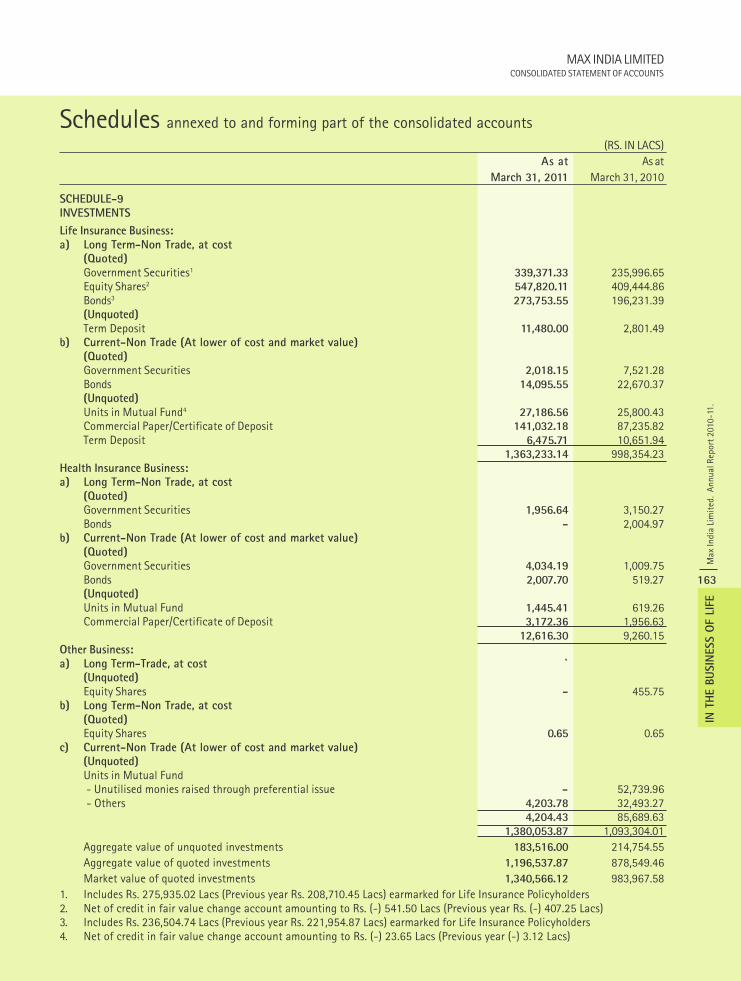
MAX INDIA LIMITEDCONSOLIDATED STATEMENT OF ACCOUNTS
Max
Indi
a Li
mit
ed.
Annu
al R
epor
t 201
0-11
.
163
IN T
HE B
USIN
ESS O
F LI
FE
Schedules annexed to and forming part of the consolidated accounts(RS. IN LACS)
As at As atMarch 31, 2011 March 31, 2010
SCHEDULE-9INVESTMENTS
Life Insurance Business:a) Long Term-Non Trade, at cost
(Quoted)Government Securities1 339,371.33 235,996.65Equity Shares2 547,820.11 409,444.86Bonds3 273,753.55 196,231.39(Unquoted)Term Deposit 11,480.00 2,801.49
b) Current-Non Trade (At lower of cost and market value)(Quoted)Government Securities 2,018.15 7,521.28Bonds 14,095.55 22,670.37(Unquoted)Units in Mutual Fund4 27,186.56 25,800.43Commercial Paper/Certificate of Deposit 141,032.18 87,235.82Term Deposit 6,475.71 10,651.94
1,363,233.14 998,354.23Health Insurance Business:a) Long Term-Non Trade, at cost
(Quoted)Government Securities 1,956.64 3,150.27Bonds - 2,004.97
b) Current-Non Trade (At lower of cost and market value)(Quoted)Government Securities 4,034.19 1,009.75Bonds 2,007.70 519.27(Unquoted)Units in Mutual Fund 1,445.41 619.26Commercial Paper/Certificate of Deposit 3,172.36 1,956.63
12,616.30 9,260.15Other Business:a) Long Term-Trade, at cost `
(Unquoted)Equity Shares - 455.75
b) Long Term-Non Trade, at cost(Quoted)Equity Shares 0.65 0.65
c) Current-Non Trade (At lower of cost and market value)(Unquoted)Units in Mutual Fund - Unutilised monies raised through preferential issue - 52,739.96 - Others 4,203.78 32,493.27
4,204.43 85,689.631,380,053.87 1,093,304.01
Aggregate value of unquoted investments 183,516.00 214,754.55Aggregate value of quoted investments 1,196,537.87 878,549.46Market value of quoted investments 1,340,566.12 983,967.58
1. Includes Rs. 275,935.02 Lacs (Previous year Rs. 208,710.45 Lacs) earmarked for Life Insurance Policyholders2. Net of credit in fair value change account amounting to Rs. (-) 541.50 Lacs (Previous year Rs. (-) 407.25 Lacs)3. Includes Rs. 236,504.74 Lacs (Previous year Rs. 221,954.87 Lacs) earmarked for Life Insurance Policyholders4. Net of credit in fair value change account amounting to Rs. (-) 23.65 Lacs (Previous year (-) 3.12 Lacs)
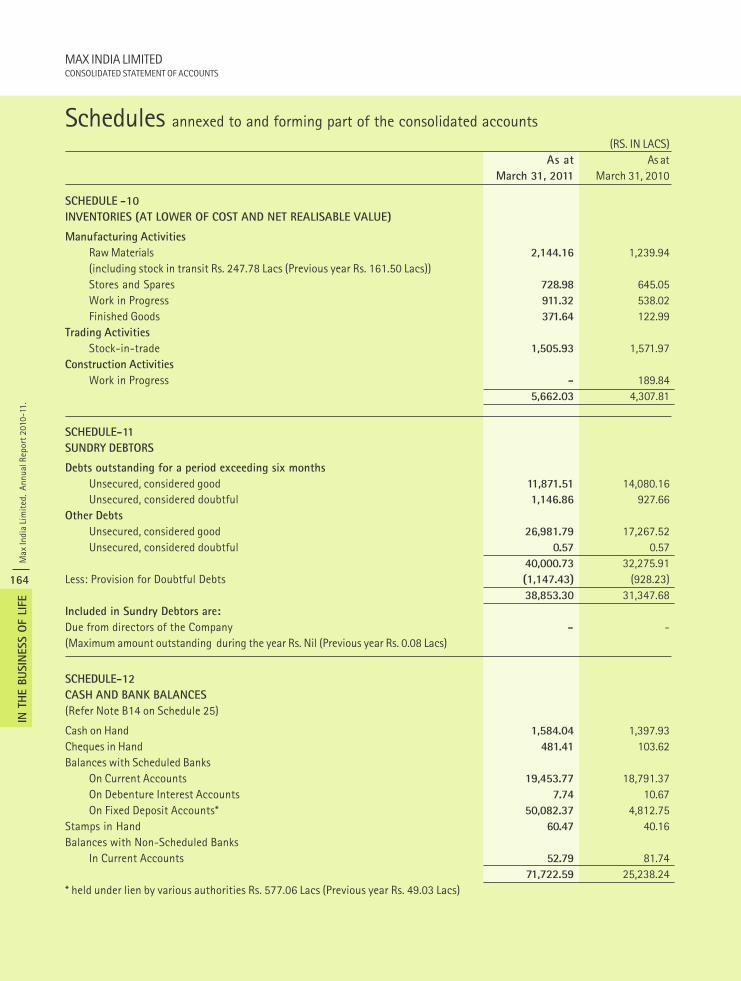
Max
Indi
a Li
mit
ed.
Annu
al R
epor
t 201
0-11
.
164
IN T
HE B
USIN
ESS O
F LI
FE
MAX INDIA LIMITEDCONSOLIDATED STATEMENT OF ACCOUNTS
Schedules annexed to and forming part of the consolidated accounts(RS. IN LACS)
As at As atMarch 31, 2011 March 31, 2010
SCHEDULE -10
INVENTORIES (AT LOWER OF COST AND NET REALISABLE VALUE)
Manufacturing Activities
Raw Materials 2,144.16 1,239.94(including stock in transit Rs. 247.78 Lacs (Previous year Rs. 161.50 Lacs))Stores and Spares 728.98 645.05Work in Progress 911.32 538.02Finished Goods 371.64 122.99
Trading Activities
Stock-in-trade 1,505.93 1,571.97Construction Activities
Work in Progress - 189.845,662.03 4,307.81
SCHEDULE-11
SUNDRY DEBTORS
Debts outstanding for a period exceeding six months
Unsecured, considered good 11,871.51 14,080.16Unsecured, considered doubtful 1,146.86 927.66
Other Debts
Unsecured, considered good 26,981.79 17,267.52Unsecured, considered doubtful 0.57 0.57
40,000.73 32,275.91Less: Provision for Doubtful Debts (1,147.43) (928.23)
38,853.30 31,347.68Included in Sundry Debtors are:
Due from directors of the Company - -(Maximum amount outstanding during the year Rs. Nil (Previous year Rs. 0.08 Lacs)
SCHEDULE-12
CASH AND BANK BALANCES
(Refer Note B14 on Schedule 25)
Cash on Hand 1,584.04 1,397.93Cheques in Hand 481.41 103.62Balances with Scheduled Banks
On Current Accounts 19,453.77 18,791.37On Debenture Interest Accounts 7.74 10.67On Fixed Deposit Accounts* 50,082.37 4,812.75
Stamps in Hand 60.47 40.16Balances with Non-Scheduled Banks
In Current Accounts 52.79 81.7471,722.59 25,238.24
* held under lien by various authorities Rs. 577.06 Lacs (Previous year Rs. 49.03 Lacs)
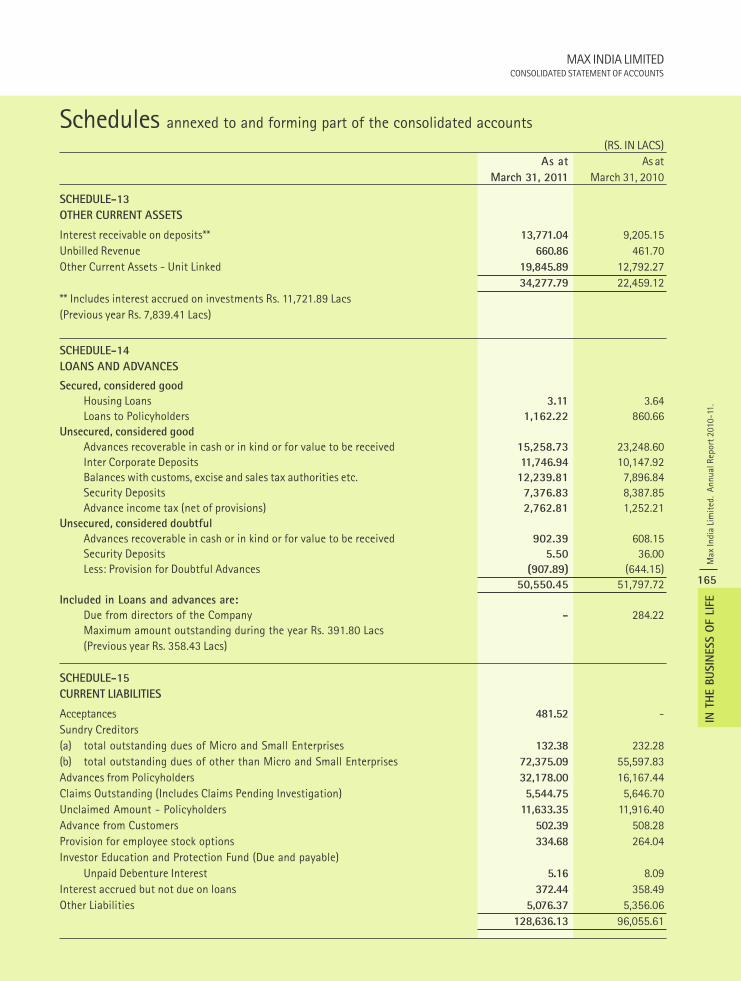
MAX INDIA LIMITEDCONSOLIDATED STATEMENT OF ACCOUNTS
Max
Indi
a Li
mit
ed.
Annu
al R
epor
t 201
0-11
.
165
IN T
HE B
USIN
ESS O
F LI
FE
SCHEDULE-13
OTHER CURRENT ASSETS
Interest receivable on deposits** 13,771.04 9,205.15Unbilled Revenue 660.86 461.70Other Current Assets - Unit Linked 19,845.89 12,792.27
34,277.79 22,459.12** Includes interest accrued on investments Rs. 11,721.89 Lacs(Previous year Rs. 7,839.41 Lacs)
SCHEDULE-14
LOANS AND ADVANCES
Secured, considered good
Housing Loans 3.11 3.64Loans to Policyholders 1,162.22 860.66
Unsecured, considered good
Advances recoverable in cash or in kind or for value to be received 15,258.73 23,248.60Inter Corporate Deposits 11,746.94 10,147.92Balances with customs, excise and sales tax authorities etc. 12,239.81 7,896.84Security Deposits 7,376.83 8,387.85Advance income tax (net of provisions) 2,762.81 1,252.21
Unsecured, considered doubtful
Advances recoverable in cash or in kind or for value to be received 902.39 608.15Security Deposits 5.50 36.00Less: Provision for Doubtful Advances (907.89) (644.15)
50,550.45 51,797.72Included in Loans and advances are:
Due from directors of the Company - 284.22Maximum amount outstanding during the year Rs. 391.80 Lacs(Previous year Rs. 358.43 Lacs)
SCHEDULE-15
CURRENT LIABILITIES
Acceptances 481.52 -Sundry Creditors(a) total outstanding dues of Micro and Small Enterprises 132.38 232.28(b) total outstanding dues of other than Micro and Small Enterprises 72,375.09 55,597.83Advances from Policyholders 32,178.00 16,167.44Claims Outstanding (Includes Claims Pending Investigation) 5,544.75 5,646.70Unclaimed Amount - Policyholders 11,633.35 11,916.40Advance from Customers 502.39 508.28Provision for employee stock options 334.68 264.04Investor Education and Protection Fund (Due and payable)
Unpaid Debenture Interest 5.16 8.09Interest accrued but not due on loans 372.44 358.49Other Liabilities 5,076.37 5,356.06
128,636.13 96,055.61
Schedules annexed to and forming part of the consolidated accounts(RS. IN LACS)
As at As atMarch 31, 2011 March 31, 2010
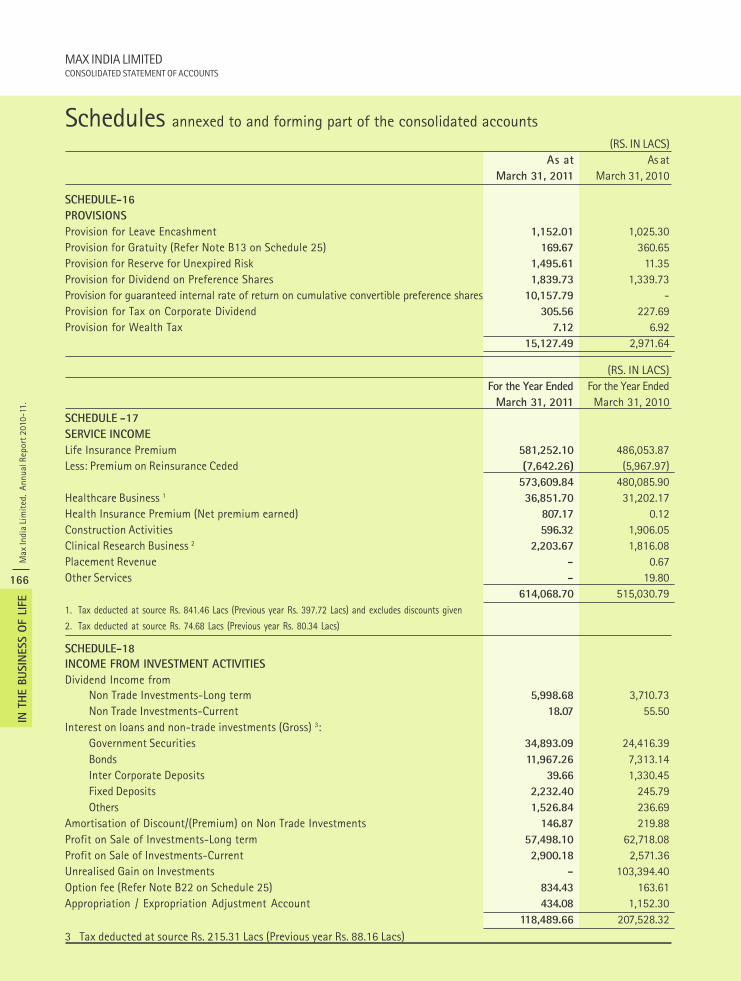
Max
Indi
a Li
mit
ed.
Annu
al R
epor
t 201
0-11
.
166
IN T
HE B
USIN
ESS O
F LI
FE
MAX INDIA LIMITEDCONSOLIDATED STATEMENT OF ACCOUNTS
SCHEDULE-16
PROVISIONS
Provision for Leave Encashment 1,152.01 1,025.30Provision for Gratuity (Refer Note B13 on Schedule 25) 169.67 360.65Provision for Reserve for Unexpired Risk 1,495.61 11.35Provision for Dividend on Preference Shares 1,839.73 1,339.73Provision for guaranteed internal rate of return on cumulative convertible preference shares 10,157.79 -Provision for Tax on Corporate Dividend 305.56 227.69Provision for Wealth Tax 7.12 6.92
15,127.49 2,971.64
(RS. IN LACS)For the Year Ended For the Year Ended
March 31, 2011 March 31, 2010SCHEDULE -17
SERVICE INCOME
Life Insurance Premium 581,252.10 486,053.87Less: Premium on Reinsurance Ceded (7,642.26) (5,967.97)
573,609.84 480,085.90Healthcare Business 1 36,851.70 31,202.17Health Insurance Premium (Net premium earned) 807.17 0.12Construction Activities 596.32 1,906.05Clinical Research Business 2 2,203.67 1,816.08Placement Revenue - 0.67Other Services - 19.80
614,068.70 515,030.791. Tax deducted at source Rs. 841.46 Lacs (Previous year Rs. 397.72 Lacs) and excludes discounts given
2. Tax deducted at source Rs. 74.68 Lacs (Previous year Rs. 80.34 Lacs)
SCHEDULE-18
INCOME FROM INVESTMENT ACTIVITIES
Dividend Income fromNon Trade Investments-Long term 5,998.68 3,710.73Non Trade Investments-Current 18.07 55.50
Interest on loans and non-trade investments (Gross) 3:Government Securities 34,893.09 24,416.39Bonds 11,967.26 7,313.14Inter Corporate Deposits 39.66 1,330.45Fixed Deposits 2,232.40 245.79Others 1,526.84 236.69
Amortisation of Discount/(Premium) on Non Trade Investments 146.87 219.88Profit on Sale of Investments-Long term 57,498.10 62,718.08Profit on Sale of Investments-Current 2,900.18 2,571.36Unrealised Gain on Investments - 103,394.40Option fee (Refer Note B22 on Schedule 25) 834.43 163.61Appropriation / Expropriation Adjustment Account 434.08 1,152.30
118,489.66 207,528.323 Tax deducted at source Rs. 215.31 Lacs (Previous year Rs. 88.16 Lacs)
Schedules annexed to and forming part of the consolidated accounts(RS. IN LACS)
As at As atMarch 31, 2011 March 31, 2010
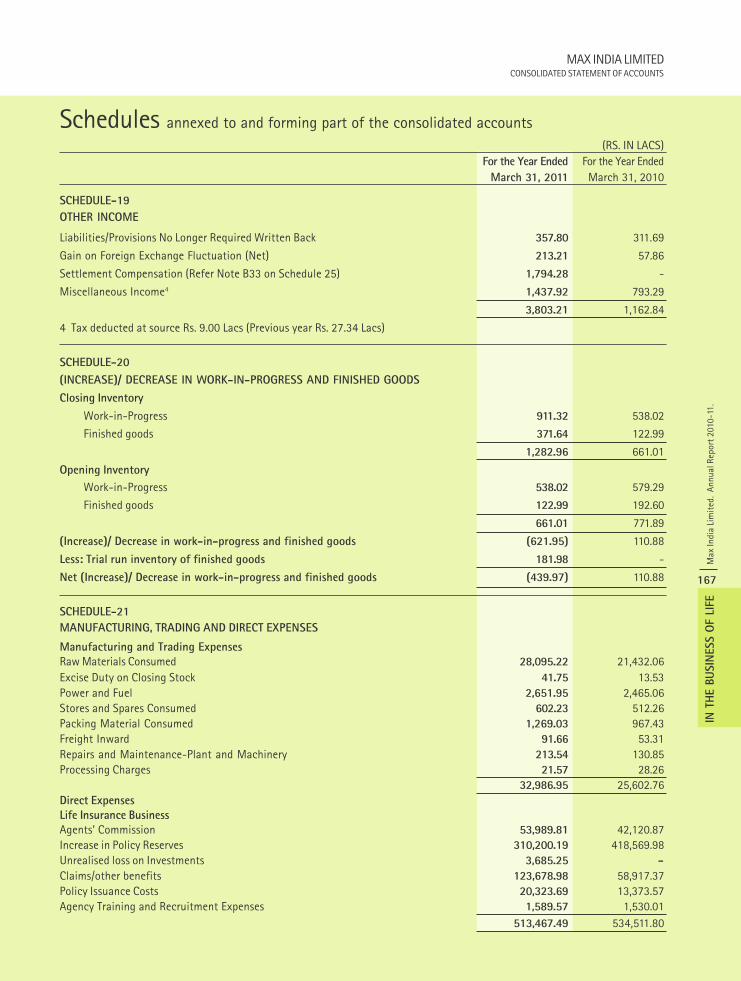
MAX INDIA LIMITEDCONSOLIDATED STATEMENT OF ACCOUNTS
Max
Indi
a Li
mit
ed.
Annu
al R
epor
t 201
0-11
.
167
IN T
HE B
USIN
ESS O
F LI
FE
SCHEDULE-19
OTHER INCOME
Liabilities/Provisions No Longer Required Written Back 357.80 311.69
Gain on Foreign Exchange Fluctuation (Net) 213.21 57.86
Settlement Compensation (Refer Note B33 on Schedule 25) 1,794.28 -
Miscellaneous Income4 1,437.92 793.29
3,803.21 1,162.84
4 Tax deducted at source Rs. 9.00 Lacs (Previous year Rs. 27.34 Lacs)
SCHEDULE-20
(INCREASE)/ DECREASE IN WORK-IN-PROGRESS AND FINISHED GOODS
Closing Inventory
Work-in-Progress 911.32 538.02
Finished goods 371.64 122.99
1,282.96 661.01
Opening Inventory
Work-in-Progress 538.02 579.29
Finished goods 122.99 192.60
661.01 771.89
(Increase)/ Decrease in work-in-progress and finished goods (621.95) 110.88
Less: Trial run inventory of finished goods 181.98 -
Net (Increase)/ Decrease in work-in-progress and finished goods (439.97) 110.88
SCHEDULE-21
MANUFACTURING, TRADING AND DIRECT EXPENSES
Manufacturing and Trading Expenses
Raw Materials Consumed 28,095.22 21,432.06Excise Duty on Closing Stock 41.75 13.53Power and Fuel 2,651.95 2,465.06Stores and Spares Consumed 602.23 512.26Packing Material Consumed 1,269.03 967.43Freight Inward 91.66 53.31Repairs and Maintenance-Plant and Machinery 213.54 130.85Processing Charges 21.57 28.26
32,986.95 25,602.76Direct Expenses
Life Insurance Business
Agents’ Commission 53,989.81 42,120.87Increase in Policy Reserves 310,200.19 418,569.98Unrealised loss on Investments 3,685.25 -
Claims/other benefits 123,678.98 58,917.37Policy Issuance Costs 20,323.69 13,373.57Agency Training and Recruitment Expenses 1,589.57 1,530.01
513,467.49 534,511.80
Schedules annexed to and forming part of the consolidated accounts(RS. IN LACS)
For the Year Ended For the Year EndedMarch 31, 2011 March 31, 2010
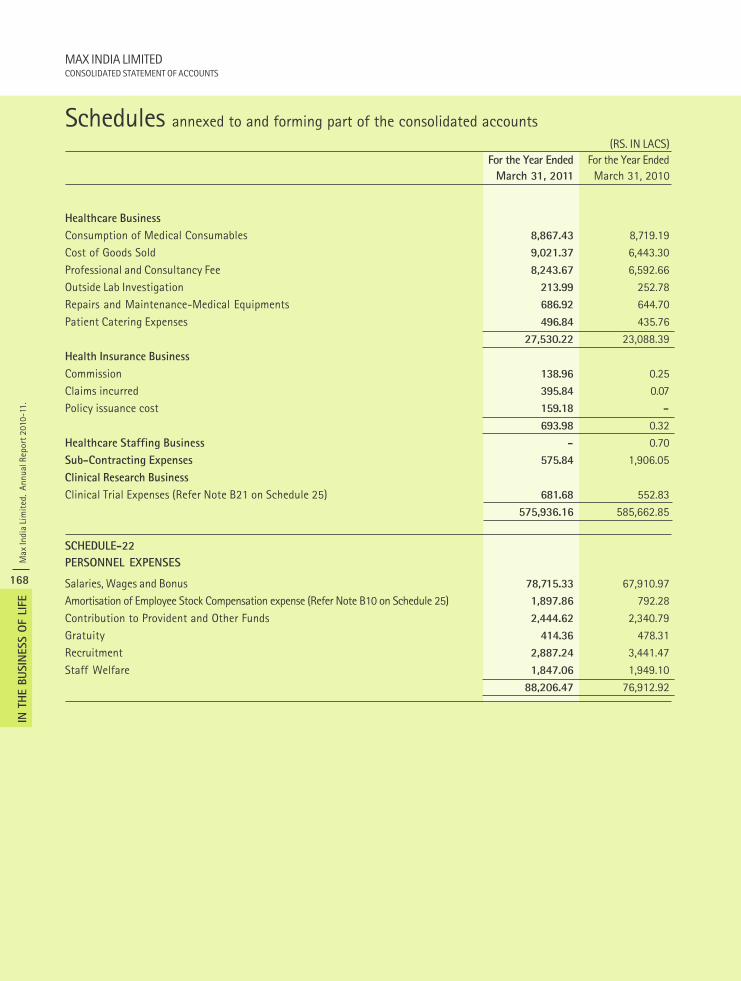
Max
Indi
a Li
mit
ed.
Annu
al R
epor
t 201
0-11
.
168
IN T
HE B
USIN
ESS O
F LI
FE
MAX INDIA LIMITEDCONSOLIDATED STATEMENT OF ACCOUNTS
Healthcare Business
Consumption of Medical Consumables 8,867.43 8,719.19Cost of Goods Sold 9,021.37 6,443.30Professional and Consultancy Fee 8,243.67 6,592.66Outside Lab Investigation 213.99 252.78Repairs and Maintenance-Medical Equipments 686.92 644.70Patient Catering Expenses 496.84 435.76
27,530.22 23,088.39Health Insurance Business
Commission 138.96 0.25Claims incurred 395.84 0.07Policy issuance cost 159.18 -
693.98 0.32Healthcare Staffing Business - 0.70Sub-Contracting Expenses 575.84 1,906.05Clinical Research Business
Clinical Trial Expenses (Refer Note B21 on Schedule 25) 681.68 552.83575,936.16 585,662.85
SCHEDULE-22
PERSONNEL EXPENSES
Salaries, Wages and Bonus 78,715.33 67,910.97Amortisation of Employee Stock Compensation expense (Refer Note B10 on Schedule 25) 1,897.86 792.28Contribution to Provident and Other Funds 2,444.62 2,340.79Gratuity 414.36 478.31Recruitment 2,887.24 3,441.47Staff Welfare 1,847.06 1,949.10
88,206.47 76,912.92
Schedules annexed to and forming part of the consolidated accounts(RS. IN LACS)
For the Year Ended For the Year EndedMarch 31, 2011 March 31, 2010
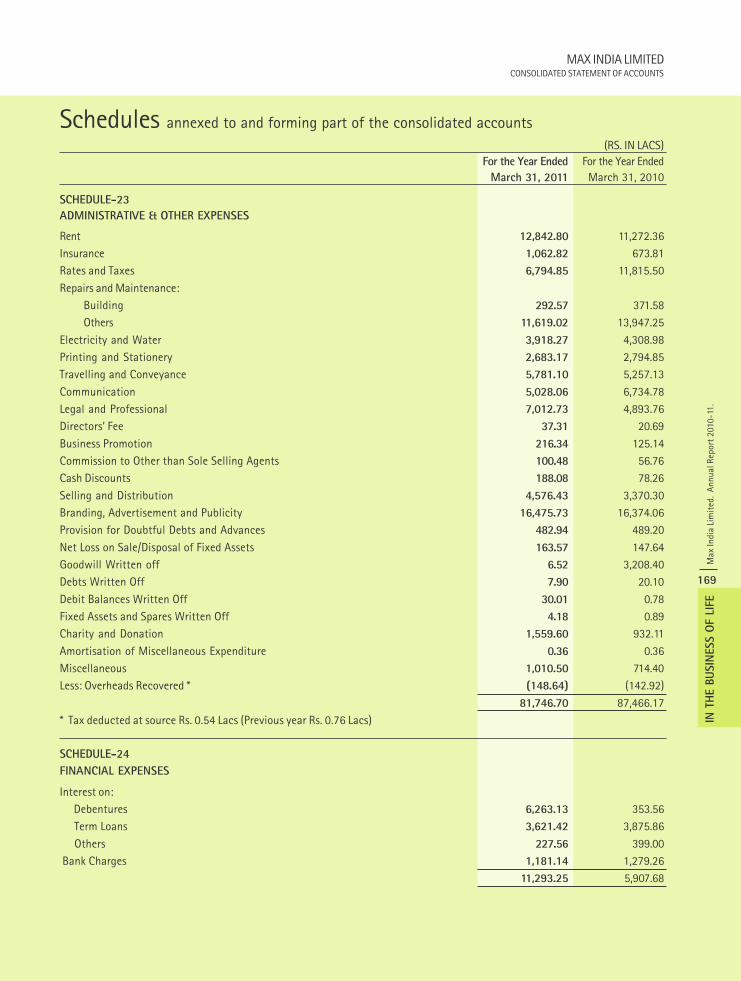
MAX INDIA LIMITEDCONSOLIDATED STATEMENT OF ACCOUNTS
Max
Indi
a Li
mit
ed.
Annu
al R
epor
t 201
0-11
.
169
IN T
HE B
USIN
ESS O
F LI
FE
SCHEDULE-23
ADMINISTRATIVE & OTHER EXPENSES
Rent 12,842.80 11,272.36Insurance 1,062.82 673.81Rates and Taxes 6,794.85 11,815.50Repairs and Maintenance:
Building 292.57 371.58Others 11,619.02 13,947.25
Electricity and Water 3,918.27 4,308.98Printing and Stationery 2,683.17 2,794.85Travelling and Conveyance 5,781.10 5,257.13Communication 5,028.06 6,734.78Legal and Professional 7,012.73 4,893.76Directors’ Fee 37.31 20.69Business Promotion 216.34 125.14Commission to Other than Sole Selling Agents 100.48 56.76Cash Discounts 188.08 78.26Selling and Distribution 4,576.43 3,370.30Branding, Advertisement and Publicity 16,475.73 16,374.06Provision for Doubtful Debts and Advances 482.94 489.20Net Loss on Sale/Disposal of Fixed Assets 163.57 147.64Goodwill Written off 6.52 3,208.40Debts Written Off 7.90 20.10Debit Balances Written Off 30.01 0.78Fixed Assets and Spares Written Off 4.18 0.89Charity and Donation 1,559.60 932.11Amortisation of Miscellaneous Expenditure 0.36 0.36Miscellaneous 1,010.50 714.40Less: Overheads Recovered * (148.64) (142.92)
81,746.70 87,466.17* Tax deducted at source Rs. 0.54 Lacs (Previous year Rs. 0.76 Lacs)
SCHEDULE-24
FINANCIAL EXPENSES
Interest on: Debentures 6,263.13 353.56 Term Loans 3,621.42 3,875.86 Others 227.56 399.00 Bank Charges 1,181.14 1,279.26
11,293.25 5,907.68
Schedules annexed to and forming part of the consolidated accounts(RS. IN LACS)
For the Year Ended For the Year EndedMarch 31, 2011 March 31, 2010
Max
Indi
a Li
mit
ed.
Annu
al R
epor
t 201
0-11
.
170
IN T
HE B
USIN
ESS O
F LI
FE
MAX INDIA LIMITEDCONSOLIDATED STATEMENT OF ACCOUNTS
SCHEDULE–25
NOTES TO ACCOUNTS
A. SIGNIFICANT ACCOUNTING POLICIES
(1) Accounting Convention
The consolidated financial statements are prepared to comply in material aspects, except as disclosed in the accountingpolicies given below with all the applicable accounting principles in India, the applicable accounting standards notified u/s211(3C) of the Companies Act, 1956 and the relevant provisions of the Companies Act, 1956 in so far as applicable to theconsolidated financial statements.
The financial statements of Max New York Life Insurance Company Limited and Max Bupa Health Insurance CompanyLimited, subsidiaries of the company, which are included in these Consolidated Financial Statements, are prepared inaccordance with the accounting principles prescribed by the Insurance Regulatory and Development Authority (Preparationof Financial Statement and Auditor’s Report of Insurance Companies) Regulations, 2002, the accounting standards issued bythe Institute of Chartered Accountants of India and the requirements of the Insurance Act 1938, Insurance Regulatory andDevelopment Authority Act, 1999, and the regulations framed thereunder and the Companies Act, 1956, to the extentapplicable and the practices prevailing within the insurance industry in India.
(2) Basis of Consolidation
The consolidated financial statements are prepared in accordance with the principles and procedures laid down by theaccounting standard on Consolidated Financial Statements issued by the ICAI.
The subsidiaries of Max India Ltd. (“Company”) have been defined as those entities in which the Company owns directly orindirectly more than one half of the voting power or otherwise has power to exercise control over the composition of theBoard of Directors of such entities. Max India Ltd. and its subsidiaries are herein after referred to as Group Companies or Group.
The financial statements of subsidiaries are consolidated from the date on which the control is transferred to a GroupCompany and are excluded from consolidation from the date such control ceases. The financial statements of all GroupCompanies have been combined on a line-by-line basis by adding together the book values of like items of assets, liabilities,income and expenses after eliminating all intra-group balances and transactions and resulting unrealized gains/losses. Theconsolidated financial statements are prepared applying uniform accounting policies in use by the Company.
(3) Revenue Recognition
(a) Life Insurance Business: Premium is recognized as income when due. Premium on lapsed policies is recognized as incomewhen such policies are reinstated. For linked business, premium income is recognized when the associated units arecreated. Top-up premiums are recognized as single premium. Fees on linked policies including fund managementcharges, policy administration charges, surrender charges, mortality charges, etc. are recovered from the linked fundand recognized in accordance with the terms and conditions of the policies.
Reinsurance premium ceded is accounted at the time of recognition of premium income in accordance with the treatyor in-principle arrangement with the re-insurers.
(b) Clinical Research Business: Revenue from services is recognized by reference to the stage of completion of clinical studyprojects subscribed with pharmaceutical companies.
Revenue from services is recognized with reference to the stage of completion of clinical data management serviceprojects subscribed with pharmaceutical companies.
Schedules annexed to and forming part of the consolidated accounts
MAX INDIA LIMITEDCONSOLIDATED STATEMENT OF ACCOUNTS
Max
Indi
a Li
mit
ed.
Annu
al R
epor
t 201
0-11
.
171
IN T
HE B
USIN
ESS O
F LI
FE
(c) Healthcare Business: Revenue from healthcare facilities is recognized on the performance of related service andincludes services for patients undergoing treatment and pending billing, which is shown as unbilled under other currentassets.
Revenue from trading sales is recognized on delivery of goods.
Income from other healthcare service providers and sponsorship and educational income are recognized on theperformance of related services as per the terms of contracts.
(d) Health Insurance Business: Premium income and cessation thereof are recognized over the contract period or period ofrisk whichever is appropriate, on a gross basis (net of service tax). Any subsequent revision of premium or cancellationof the policies is accounted for in the year in which they arise.
Commission income on reinsurance ceded is recognized in the year of cessation of reinsurance premium.
(e) Lease Rentals: In respect of lease rentals on operating leases, revenue is recognized proportionately over the period ofthe related agreements. Contingent lease rent is recognized based on the occurrence of the contingency.
(f) Export sales are accounted for on the basis of the date of bill of lading/airway bill. Other sales are accounted for at ex-factory prices on transfer of risks and rewards.
(g) Income from investments is credited to revenue in the year in which it accrues. Income is stated in full with the taxthereon being accounted for under advance tax.
(h) Dividend is recognized as and when the right to receive such payment is established.
(i) Revenue from construction and sale of hospital buildings is recognized on percentage of completion method asprescribed under AS-7 issued by the Institute of Chartered Accountants of India.
(4) Fixed Assets
(a) Fixed Assets are stated at their original cost including freight, duties (net of CENVAT), taxes and other incidentalexpenses relating to acquisition and installation.
(b) Expenses of revenue nature, which can be regarded as incidental and related to project set-up are transferred to “Pre-operative Expenses Pending Capitalization”. These expenses are allocated to fixed assets/deferred revenue in the year ofcommencement of the related project.
(c) Assets, which are revalued, are stated at the revalued amounts. The resultant increase in carrying amounts is creditedto the revaluation reserve. Depreciation relating to the revalued amounts is adjusted against the revaluation reserve.
(d) Assets acquired under the business transfer agreement are stated at amounts based on a valuation report.
(5) Borrowing Costs
Borrowing costs directly attributable to the acquisition, construction or production of an asset that necessarily takes asubstantial period of time to get ready for its intended use are capitalized as part of the cost of the respective asset. All otherborrowing costs are expensed in the period they occur. Borrowing cost consists of interest and other costs that an entityincurs in connection with the borrowing of funds.
Schedules annexed to and forming part of the consolidated accounts
Max
Indi
a Li
mit
ed.
Annu
al R
epor
t 201
0-11
.
172
IN T
HE B
USIN
ESS O
F LI
FE
MAX INDIA LIMITEDCONSOLIDATED STATEMENT OF ACCOUNTS
(6) Depreciation
(a) Depreciation is charged on straight-line method on a pro-rata basis at rates prescribed under Schedule XIV to theCompanies Act, 1956 or estimated by the management based on the economic useful life of the assets, which are notlower than the rates prescribed under Schedule XIV to the Companies Act, 1956. In life insurance business, depreciationis provided for the full month in the month of acquisition of the related asset and no depreciation is provided in themonth of sale/disposal of the asset.
(b) Leasehold improvements are depreciated over respective lease periods.
(c) Assets costing not more than Rs. 5,000 each individually are depreciated at 100%.
(d) Intangible assets are amortized over a period of two to six years based on management’s estimate of economic usefullife of the assets.
(7) Investments
(a) Investments are classified into current investments and long-term investments. The cost of investments include acquisitioncharges such as brokerage, fees and duties. Current investments are carried at lower of cost or fair value.
(b) Long-term investments are valued at cost. Provision for diminution is made to recognise a decline, other than temporary,in the carrying value of each investment.
(c) Insurance businesses:
Investments are made in accordance with the Insurance Act, 1938 and the Insurance Regulatory and DevelopmentAuthority (Investment) Regulations, 2000 and subsequent circulars/notifications issued by the IRDA from time to time.
Investments are recorded at cost on date of purchase, which includes brokerage and statutory levies, if any and excludesinterest paid, if any, on purchase. Diminution in the value of investment, other than temporary decline, is charged torevenue and profit and loss account as applicable.
i) Classification
Investments intended to be held for a period less than twelve months or maturing within twelve months from thebalance sheet date are classified as short term investments. All other investments are classified as long-term investments.
ii) Valuation - shareholders’ investments and non-linked policyholders’ investments
Debt securities, which include government securities, are considered as ‘held to maturity’ and measured at historicalcost. The premium/discount, if any, on purchase of debt securities including money market instruments is recognized andamortized in the revenue account and profit and loss account, as applicable, over the remaining period to maturity onthe basis of their intrinsic yield.
Listed equity shares, as at balance sheet date, are valued at fair value, being the last quoted closing price on the NationalStock Exchange (NSE) and in case the same is not available, then on the Stock Exchange, Mumbai (BSE). Unlisted Equityshares are valued at historical cost. A provision is made for diminution, if any, in the value of these shares to the extent thatsuch diminution is other than temporary. Investments in mutual fund units are valued at previous day’s net asset value ofthe respective funds.
iii) Valuation – Linked Investments
Government securities are valued at the prices obtained from CRISIL (Credit Rating Information Services of India Limited).Debt securities other than Government Securities are valued on the basis of Bond Valuer (CRISIL). Listed equity shares arevalued at fair value, being the last quoted closing price on NSE and in case the same is not available, then on the BSE.Mutual fund units are taken at the previous day’s net asset values.
Debt securities are valued at amortized cost (from cost/last valuation price till the beginning of the day to the redemptionvalue), spread uniformly over the remaining maturity period of the instrument.
Schedules annexed to and forming part of the consolidated accounts
MAX INDIA LIMITEDCONSOLIDATED STATEMENT OF ACCOUNTS
Max
Indi
a Li
mit
ed.
Annu
al R
epor
t 201
0-11
.
173
IN T
HE B
USIN
ESS O
F LI
FE
iv) Transfer of Investments
Investments in debt securities are transferred from shareholders to policyholders at net amortized cost. Investmentsother than debt securities are transferred from shareholders to policyholders at lower of book value or market value.Transfer of investments between unit linked funds is affected at market price as at previous day closing.
(8) Inventories
Inventories are valued as follows:
Net Realisable value is the estimated selling price in the ordinary course of business, less estimated costs of completion andthe estimated costs necessary to make the sale.
(9) Government grant and subsidies
Grants and subsidies from the government are recognised when there is reasonable assurance that the grant/ subsidy will bereceived and all attached conditions will be complied.
When the grants and subsidy relates to an expense item, it is recognised as income over the periods necessary to match themon a systematic basis to the cost, which grant/subsidy is intended to compensate.
When the grant or subsidy relates to an asset, its value is deducted from the gross value of the asset concerned in arrivingat the carrying amount of related assets.
Government grants of the nature of promoter’s contribution are credited to the capital reserve and treated as a part ofshareholders fund.
(10) Employee Stock Option Scheme
Max India Limited
Measurement and disclosure of the employee share-based payment plans is done in accordance with SEBI (Employee Stock OptionScheme) Guidelines, 1999 and the Guidance Note on Accounting for Employee Share-based Payments, issued by the Institute ofChartered Accountants of India. The Company measures compensation cost relating to employee stock options using the intrinsicvalue method. Compensation expense is amortized over the vesting period of the option on a straight line basis.
Max New York Life Insurance Company Limited
The value of options is equal to the aggregate of the intrinsic value of the options granted. Intrinsic value is the optiondiscount represented by excess of market price, which is determined by the independent valuer, over the exercise price. Theintrinsic value of the options is amortized on a straight line basis over the vesting period. As and when the options areexercised, the same are accounted for as paid up capital to the extent of the face value. Options that lapse are reversed bya credit to employee compensation expense equal to the amortized portion of the value of the lapsed options and a creditto deferred employee compensation expense equal to the unamortized option.
Max Healthcare Institute Limited (MHIL)
Measurement and disclosure of the employee share- based payment plans is done in accordance with the Guidance note onAccounting for Employee Share-based payments, issued by the Institute of Chartered Accountants of India. MHIL measurescompensation cost relating to employee stock option using the intrinsic value method. Compensation expense is amortizedover the vesting period of the option on a straight line basis.
Schedules annexed to and forming part of the consolidated accounts
Lower of cost and net realizable value. However, materials and other items held for usein the production of inventories are not written down below cost if the finished productsin which they will be incorporated are expected to be sold at or above cost. Cost isdetermined on a weighted average basis.
Lower of cost and net realizable value. Cost includes direct material and labour and aproportion of manufacturing overheads based on normal operating capacity. Cost offinished goods includes excise duty. Cost is determined on a weighted average basis.
Raw material, packing material,stores and spares
Work-in-progress and finishedgoods
Max
Indi
a Li
mit
ed.
Annu
al R
epor
t 201
0-11
.
174
IN T
HE B
USIN
ESS O
F LI
FE
MAX INDIA LIMITEDCONSOLIDATED STATEMENT OF ACCOUNTS
(11) Taxation
Direct Taxes
Tax expense comprises of current and deferred tax. Current income tax is measured at the amount expected to be paid to thetax authorities in accordance with the Indian Income Tax Act, 1961. Deferred income taxes reflects the impact of current yeartiming differences between taxable income and accounting income for the year and reversal of timing differences of earlieryears.
Deferred tax is measured based on the tax rates and the tax laws enacted or substantively enacted at the balance sheet date.Deferred tax assets and deferred tax liabilities are offset, if a legally enforceable right exists to set off current tax assetsagainst current tax liabilities and the deferred tax assets and deferred tax liabilities relate to the taxes on income levied bysame governing taxation laws. Deferred tax assets are recognised only to the extent that there is reasonable certainty thatsufficient future taxable income will be available against which such deferred tax assets can be realised. In situation wherethe Company has unabsorbed depreciation or carry forward tax losses, deferred tax assets are recognised only if there isvirtual certainty supported by convincing evidence that such deferred tax assets can be realised against future taxableprofits.
At each balance sheet date the Company re-assesses unrecognised deferred tax assets. It recognises unrecognised deferredtax assets to the extent that it has become reasonably certain or virtually certain, as the case may be that sufficient futuretaxable income will be available against which such deferred tax assets can be realised.
The carrying amount of deferred tax assets are reviewed at each balance sheet date. The Company writes down the carryingamount of a deferred tax asset to the extent that it is no longer reasonably certain or virtually certain, as the case may be,that sufficient future taxable income will be available against which deferred tax asset can be realized. Any such write downis reversed to the extent that it becomes reasonably certain or virtually certain, as the case may be, that sufficient futuretaxable income will be available.
Indirect Taxes
The company claims credit of service tax for input services, which is set off against tax on output services. Unutilized credit iscarried forward for future set off in subsequent periods. Relevant provision is created, if required, based on estimatedrealization of the unutilized credit.
(12) Employee Benefits
(a) Provident Fund
Retirement benefit in the form of Provident Fund is a defined benefit obligation as the Company and its employees arecontributing to a provident fund trust “Max India Limited Employees Provident Fund Trust” and the contributions arecharged to the Profit & Loss Account of the year when the contributions to the respective funds are due. Shortfall in thefund, if any, is adequately provided for by the Company.
(b) Superannuation fund
Superannuation Fund is a defined contribution scheme. Liability in respect of Superannuation Fund to the employees isaccounted for as per the Company’s Scheme and contributed to “Max India Limited Superannuation Fund” every year. Thecontributions to the funds are charged to the Profit and Loss Account of the year. The Company does not have any otherobligation to the fund other than the contribution payable.
(c) Gratuity
Gratuity liability is a defined benefit obligation and is provided for on the basis of an actuarial valuation on projectedunit credit method made at the end of each financial year. The Company has a recognised gratuity trust “Max IndiaLimited Employees Gratuity Fund” which in turn has taken a policy with LIC to cover the gratuity liability of theemployees. The difference between the actuarial valuation of the gratuity of employees at the year-end and the balanceof funds with LIC is provided for as liability in the books.
Schedules annexed to and forming part of the consolidated accounts
MAX INDIA LIMITEDCONSOLIDATED STATEMENT OF ACCOUNTS
Max
Indi
a Li
mit
ed.
Annu
al R
epor
t 201
0-11
.
175
IN T
HE B
USIN
ESS O
F LI
FE
(d) Compensated Absences
Short term compensated absences are provided for based on estimates. Long term compensated absences are providedon actuarial valuation at the year end. The actuarial valuation is done as per projected unit credit method.
Actuarial gains/ losses are immediately taken to Profit and Loss Account and are not deferred.
(e) Other Group Companies within India have various schemes of retirement benefits namely provident fund, superannuationand gratuity. Contributions made to these benefit plans are charged to revenue every year. Accruals for gratuity and leaveencashment are made on the basis of actuarial valuation done at the year end.
Group Companies situated outside India have employee benefit schemes as per their respective local laws.
(13) Foreign Exchange Transactions
(a) Monetary assets and liabilities related to foreign currency transactions remaining unsettled at the end of the year aretranslated at year end rates.
(b) The difference in translation of monetary assets and liabilities and realised gains and losses on foreign exchangetransactions are recognized in the profit and loss account.
(c) Exchange difference in respect of liabilities incurred to acquire fixed assets are recognized in the profit and lossaccount.
(d) In case of foreign exchange forward contracts where an underlying asset or liability exists at the balance sheet date, thedifference between the forward rate and the exchange rate at the inception of the contract is recognized as income orexpense over the life of the contract.
(e) For consolidation of accounts, in respect of Group Companies situated outside India, the assets and liabilities aretranslated at closing rate whereas the revenue and expenses are translated using the average rate during the year. Theresultant gain or loss arising out of such translation is recognized in a separate reserve “Foreign Currency TranslationReserve” as required under Accounting Standard-11 revised.
(14) Leases
Assets given under operating lease are shown in the balance sheet under fixed assets and are depreciated on a basisconsistent with the depreciation policy of the company. Lease income is recognized in the profit and loss account on accrualbasis.
Assets acquired on finance lease are recognized in the financial statements at the lower of the fair value and present valueof minimum lease payments at the inception of the lease term and disclosed as leased asset. The depreciation policy for suchassets is consistent with that for depreciable assets that are owned by the Group.
Operating lease expense is recognized in the profit and loss account on a straight-line basis over the lease term.
(15) Benefits for Life Insurance Policy Holders
Death and other claims are accounted for, when notified. Surrenders / Withdrawals under linked policies are accounted inthe respective schemes when the associated units are cancelled. Survival benefit claim and maturity benefits are accountedfor when due for payment. Claims payable include the direct costs of settlement. Reinsurance recoverable thereon, if any, isaccounted for in the same period as the related claim. Repudiated claims disputed before judicial authorities are providedfor based on management prudence considering the facts and evidences available in respect of such claims.
Schedules annexed to and forming part of the consolidated accounts
Max
Indi
a Li
mit
ed.
Annu
al R
epor
t 201
0-11
.
176
IN T
HE B
USIN
ESS O
F LI
FE
MAX INDIA LIMITEDCONSOLIDATED STATEMENT OF ACCOUNTS
(16) Policy Holders’ Acquisition Cost
Acquisition costs are expenses incurred to solicit and underwrite insurance contracts such as commission, medical fee etc.and are expensed in the year in which they are incurred.
(17) Liability for Life Insurance Policies in Force
The estimated liability for life policies in force is determined by the appointed actuary of Max New York Life InsuranceCompany Ltd. (“MNYL”), pursuant to his annual investigation of the life insurance business, using appropriate methods andassumptions that conform with regulations issued by Insurance Regulatory and Development Authority (Actuarial Reportand Abstract) Regulations, 2000 and Professional Guidance notes issued by the Actuarial Society of India (ASI). The liabilityis so calculated that together with future premium payments and investment income, all future claims (including bonusentitlements to policyholders) and expenses are met. Liabilities, if any, as determined by appointed actuary, in respect ofLinked policies which have lapsed are maintained till the expiry of the revival period. Liabilities under linked policies compriseof policies and non unit liability for meeting mortality and morbidity risk, which is based on actuarial valuation done byappointed actuary.
(18) Contributions to Policyholders’ Account (Technical Account)
Contribution to Policyholders’ Account (Technical Account) is made as decided by the board of directors of MNYL andapproved by the Shareholders.
(19) Premium Deficiency
Premium deficiency is recognized whenever the sum of expected amount of claims cost, related expenses and maintenancecosts exceeds related premium carried forward to the subsequent accounting period as reserve for unexpired risk.
(20) Claims Incurred but Not Reported (IBNR) and Claims Incurred but Not Enough Reported (IBNER)
IBNR represents that amount of claims that may have been incurred prior to the end of the current accounting year but havenot been reported or claimed. The IBNER provision also includes provision, if any, required for claims incurred but not enoughreported. IBNR and IBNER liabilities are provided based on actuarial principles and certified by the Appointed Actuary of theCompany. The methodology and assumptions on the basis of which the liability has been determined has also been certifiedby the Appointed Actuary to be appropriate, in accordance with guidelines and norms issued by the Institute of Actuaries ofIndia and in concurrence with the IRDA
(21) Reinsurance ceded
Reinsurance cost, in respect of proportional reinsurance ceded, is accrued at policy inception. Non-proportional reinsurancecost is recognized when incurred and due. Any subsequent revision to, refunds or cancellations of premium are recognized inthe year in which they occur.
(22) Allocation of Investment Income
Investment income on Investments backing the policyholders liability has been allocated to Revenue Account and balance toProfit & Loss Account.
(23) Fair Value Change Account
‘Fair Value Change Account’ represents unrealized gains or losses due to change in fair value of traded securities and mutualfund units outstanding at the close of the year. The balance in the account is considered as a component of shareholder’sfunds and not available for distribution as dividend. Unrealized loss on listed and actively traded investments held for longterm are not considered to be of a permanent nature and hence not considered as impaired. However the company, at eachbalance sheet date, assesses investments for any impairment and necessary provisions are made for the same where required.
(24) Acquisition Cost of Insurance Contracts
Costs relating to acquisition of new and renewal of insurance contracts viz commission, policy issue expenses are expensedin the year in which they are incurred.
Schedules annexed to and forming part of the consolidated accounts
MAX INDIA LIMITEDCONSOLIDATED STATEMENT OF ACCOUNTS
Max
Indi
a Li
mit
ed.
Annu
al R
epor
t 201
0-11
.
177
IN T
HE B
USIN
ESS O
F LI
FE
(25) Advance Premium
Advance premium represents premium received in respect of those policies issued during the year where the risk commencessubsequent to the balance sheet date.
(26) Claims Incurred
Claims are recognized as and when reported. Claims are recorded in the revenue account, net of claims recoverable fromreinsurers / co-insurers to the extent there is a reasonable certainty of realization. These estimates are progressively re-valued on availability of further information.
Estimated liability in respect of claims is provided for the intimations received upto the year end, information/estimatesprovided by the insured/ surveyors and judgment based on the past experience and other applicable laws and practices.
(27) Appropriation/Expropriation
In accordance with the Unit Linked guidelines issued by the IRDA effective October 1, 2009, the Company has followed theAppropriation/Expropriation method for calculating the Net Asset Value (‘NAV’). This method provides for adjusting theNAV on account of the ‘Dealing Costs’. The accounting for dealing costs is disclosed in the Revenue Account as anadjustment with corresponding changes to the Change in Valuation of Policy Liability Account. Corresponding adjustmentsare also made in the Assets Held to cover Policy Liabilities and the Provisions for Linked Liabilities in the Balance Sheet.
(28) Funds for future appropriations
The balance in the funds for future appropriations account represents funds, the allocation of which, either to participatingpolicyholders or to shareholders, has not been determined at the balance sheet date. Transfers to and from the fund reflectthe excess or deficit of income over expenses and appropriations in each accounting period arising in the Company’spolicyholder fund.
(29) Reserve for unexpired risk
Reserve for unexpired risk represents net premium (i.e Premium, net of reinsurance ceded) which is attributable to, and setaside for subsequent risks to be borne by the company under contractual obligations on contract period basis or risk periodbasis, whichever is appropriate subject to minimum reserve to be created on Miscellaneous – “Health” business under Section64V (1) (ii) (b) of the Insurance Act, 1938.
(30) Provision and Contingencies
A provision is recognized when there is a present obligation as a result of past event and it is probable that an outflow ofa resource will be required to settle the obligation, in respect of which a reliable estimate can be made. These are reviewedat each Balance Sheet date and adjusted to reflect the current estimates.
Contingent liabilities are disclosed after an evaluation of the facts and legal aspects of the matter involved.
(31) Earnings Per Share
Basic earnings per share are calculated by dividing the net profit or loss for the period attributable to equity shareholdersby the weighted average number of equity shares outstanding during the period. For the purpose of calculating dilutedearnings per share, the net profit or loss for the period attributable to equity shareholders and the weighted average numberof shares outstanding during the period are adjusted for the effects of all dilutive potential equity shares.
(32) Cash and Cash equivalents
Cash and cash equivalents for the purposes of cash flow statement comprise cash at bank and in hand and short terminvestments with an original maturity of three months or less.
Schedules annexed to and forming part of the consolidated accounts
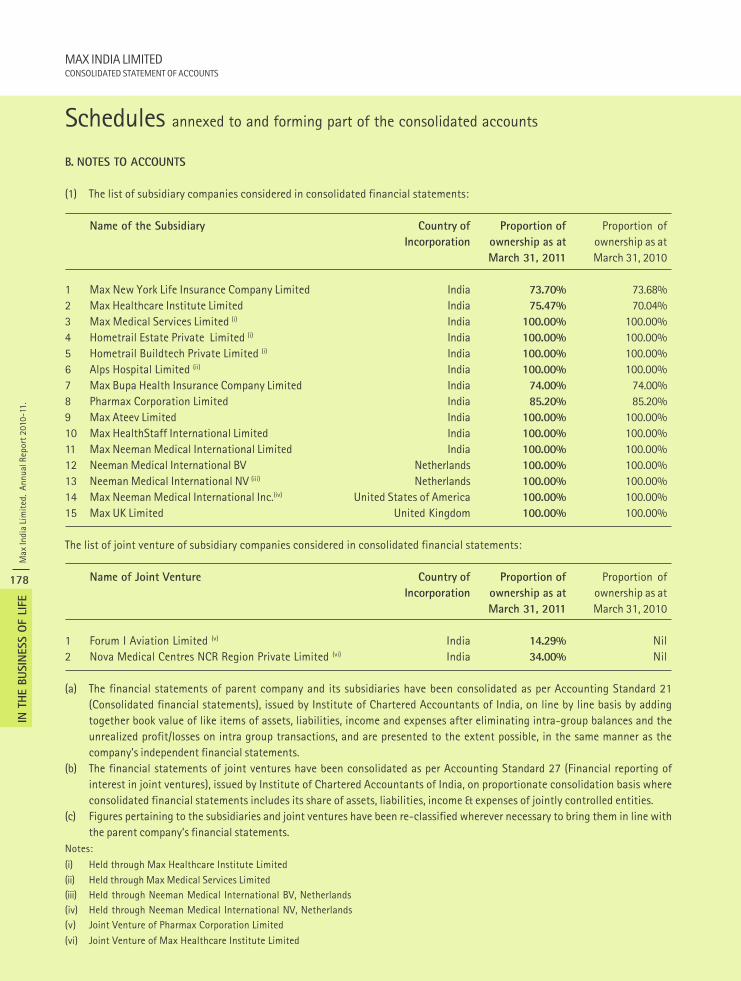
Max
Indi
a Li
mit
ed.
Annu
al R
epor
t 201
0-11
.
178
IN T
HE B
USIN
ESS O
F LI
FE
MAX INDIA LIMITEDCONSOLIDATED STATEMENT OF ACCOUNTS
Schedules annexed to and forming part of the consolidated accounts
B. NOTES TO ACCOUNTS
(1) The list of subsidiary companies considered in consolidated financial statements:
Name of the Subsidiary Country of Proportion of Proportion ofIncorporation ownership as at ownership as at
March 31, 2011 March 31, 2010
1 Max New York Life Insurance Company Limited India 73.70% 73.68%2 Max Healthcare Institute Limited India 75.47% 70.04%3 Max Medical Services Limited (i) India 100.00% 100.00%4 Hometrail Estate Private Limited (i) India 100.00% 100.00%5 Hometrail Buildtech Private Limited (i) India 100.00% 100.00%6 Alps Hospital Limited (ii) India 100.00% 100.00%7 Max Bupa Health Insurance Company Limited India 74.00% 74.00%8 Pharmax Corporation Limited India 85.20% 85.20%9 Max Ateev Limited India 100.00% 100.00%10 Max HealthStaff International Limited India 100.00% 100.00%11 Max Neeman Medical International Limited India 100.00% 100.00%12 Neeman Medical International BV Netherlands 100.00% 100.00%13 Neeman Medical International NV (iii) Netherlands 100.00% 100.00%14 Max Neeman Medical International Inc.(iv) United States of America 100.00% 100.00%15 Max UK Limited United Kingdom 100.00% 100.00%
The list of joint venture of subsidiary companies considered in consolidated financial statements:
Name of Joint Venture Country of Proportion of Proportion ofIncorporation ownership as at ownership as at
March 31, 2011 March 31, 2010
1 Forum I Aviation Limited (v) India 14.29% Nil2 Nova Medical Centres NCR Region Private Limited (vi) India 34.00% Nil
(a) The financial statements of parent company and its subsidiaries have been consolidated as per Accounting Standard 21(Consolidated financial statements), issued by Institute of Chartered Accountants of India, on line by line basis by addingtogether book value of like items of assets, liabilities, income and expenses after eliminating intra-group balances and theunrealized profit/losses on intra group transactions, and are presented to the extent possible, in the same manner as thecompany’s independent financial statements.
(b) The financial statements of joint ventures have been consolidated as per Accounting Standard 27 (Financial reporting ofinterest in joint ventures), issued by Institute of Chartered Accountants of India, on proportionate consolidation basis whereconsolidated financial statements includes its share of assets, liabilities, income & expenses of jointly controlled entities.
(c) Figures pertaining to the subsidiaries and joint ventures have been re-classified wherever necessary to bring them in line withthe parent company’s financial statements.
Notes:
(i) Held through Max Healthcare Institute Limited(ii) Held through Max Medical Services Limited(iii) Held through Neeman Medical International BV, Netherlands(iv) Held through Neeman Medical International NV, Netherlands(v) Joint Venture of Pharmax Corporation Limited
(vi) Joint Venture of Max Healthcare Institute Limited
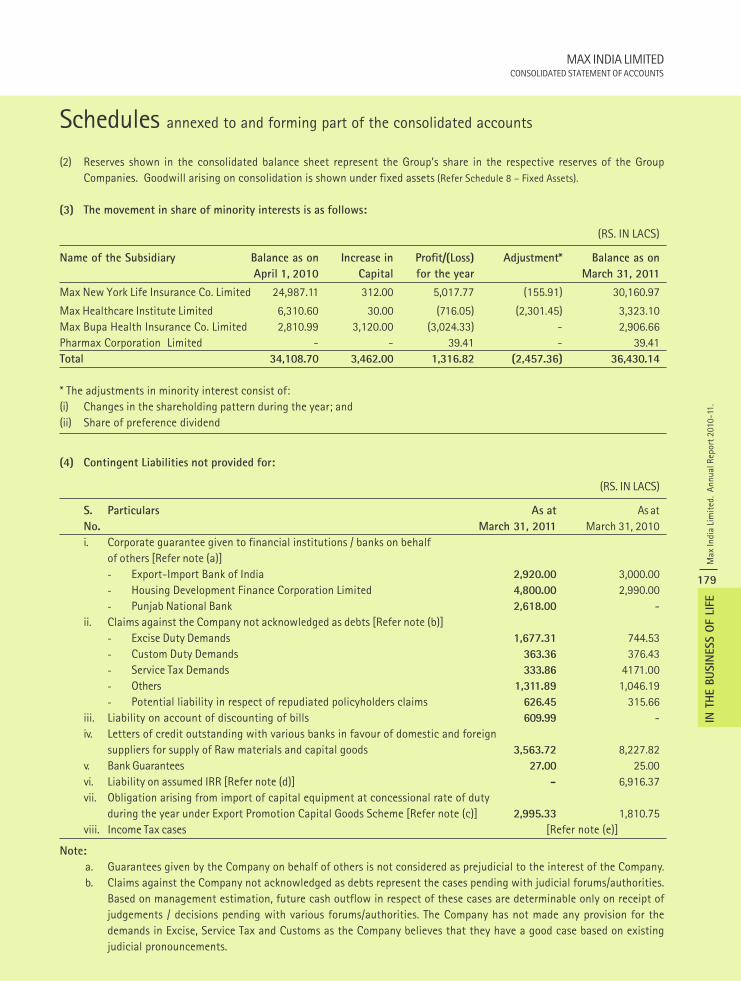
MAX INDIA LIMITEDCONSOLIDATED STATEMENT OF ACCOUNTS
Max
Indi
a Li
mit
ed.
Annu
al R
epor
t 201
0-11
.
179
IN T
HE B
USIN
ESS O
F LI
FE
Schedules annexed to and forming part of the consolidated accounts
(2) Reserves shown in the consolidated balance sheet represent the Group’s share in the respective reserves of the GroupCompanies. Goodwill arising on consolidation is shown under fixed assets (Refer Schedule 8 – Fixed Assets).
(3) The movement in share of minority interests is as follows:
(RS. IN LACS)
Name of the Subsidiary Balance as on Increase in Profit/(Loss) Adjustment* Balance as on
April 1, 2010 Capital for the year March 31, 2011
Max New York Life Insurance Co. Limited 24,987.11 312.00 5,017.77 (155.91) 30,160.97
Max Healthcare Institute Limited 6,310.60 30.00 (716.05) (2,301.45) 3,323.10Max Bupa Health Insurance Co. Limited 2,810.99 3,120.00 (3,024.33) - 2,906.66Pharmax Corporation Limited - - 39.41 - 39.41Total 34,108.70 3,462.00 1,316.82 (2,457.36) 36,430.14
* The adjustments in minority interest consist of:(i) Changes in the shareholding pattern during the year; and(ii) Share of preference dividend
(4) Contingent Liabilities not provided for:
(RS. IN LACS)
S. Particulars As at As atNo. March 31, 2011 March 31, 2010i. Corporate guarantee given to financial institutions / banks on behalf
of others [Refer note (a)]- Export-Import Bank of India 2,920.00 3,000.00- Housing Development Finance Corporation Limited 4,800.00 2,990.00- Punjab National Bank 2,618.00 -
ii. Claims against the Company not acknowledged as debts [Refer note (b)]- Excise Duty Demands 1,677.31 744.53- Custom Duty Demands 363.36 376.43- Service Tax Demands 333.86 4171.00- Others 1,311.89 1,046.19- Potential liability in respect of repudiated policyholders claims 626.45 315.66
iii. Liability on account of discounting of bills 609.99 -iv. Letters of credit outstanding with various banks in favour of domestic and foreign
suppliers for supply of Raw materials and capital goods 3,563.72 8,227.82v. Bank Guarantees 27.00 25.00vi. Liability on assumed IRR [Refer note (d)] - 6,916.37vii. Obligation arising from import of capital equipment at concessional rate of duty
during the year under Export Promotion Capital Goods Scheme [Refer note (c)] 2,995.33 1,810.75viii. Income Tax cases [Refer note (e)]
Note:
a. Guarantees given by the Company on behalf of others is not considered as prejudicial to the interest of the Company.b. Claims against the Company not acknowledged as debts represent the cases pending with judicial forums/authorities.
Based on management estimation, future cash outflow in respect of these cases are determinable only on receipt ofjudgements / decisions pending with various forums/authorities. The Company has not made any provision for thedemands in Excise, Service Tax and Customs as the Company believes that they have a good case based on existingjudicial pronouncements.
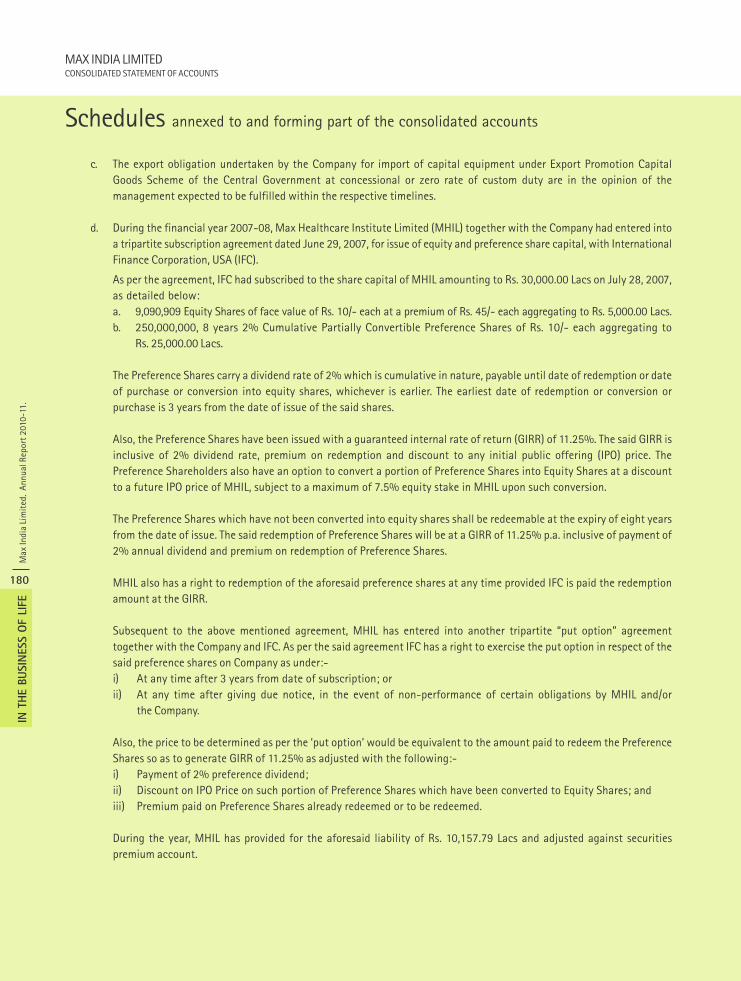
Max
Indi
a Li
mit
ed.
Annu
al R
epor
t 201
0-11
.
180
IN T
HE B
USIN
ESS O
F LI
FE
MAX INDIA LIMITEDCONSOLIDATED STATEMENT OF ACCOUNTS
Schedules annexed to and forming part of the consolidated accounts
c. The export obligation undertaken by the Company for import of capital equipment under Export Promotion CapitalGoods Scheme of the Central Government at concessional or zero rate of custom duty are in the opinion of themanagement expected to be fulfilled within the respective timelines.
d. During the financial year 2007-08, Max Healthcare Institute Limited (MHIL) together with the Company had entered intoa tripartite subscription agreement dated June 29, 2007, for issue of equity and preference share capital, with InternationalFinance Corporation, USA (IFC).
As per the agreement, IFC had subscribed to the share capital of MHIL amounting to Rs. 30,000.00 Lacs on July 28, 2007,as detailed below:a. 9,090,909 Equity Shares of face value of Rs. 10/- each at a premium of Rs. 45/- each aggregating to Rs. 5,000.00 Lacs.b. 250,000,000, 8 years 2% Cumulative Partially Convertible Preference Shares of Rs. 10/- each aggregating to
Rs. 25,000.00 Lacs.
The Preference Shares carry a dividend rate of 2% which is cumulative in nature, payable until date of redemption or dateof purchase or conversion into equity shares, whichever is earlier. The earliest date of redemption or conversion orpurchase is 3 years from the date of issue of the said shares.
Also, the Preference Shares have been issued with a guaranteed internal rate of return (GIRR) of 11.25%. The said GIRR isinclusive of 2% dividend rate, premium on redemption and discount to any initial public offering (IPO) price. ThePreference Shareholders also have an option to convert a portion of Preference Shares into Equity Shares at a discountto a future IPO price of MHIL, subject to a maximum of 7.5% equity stake in MHIL upon such conversion.
The Preference Shares which have not been converted into equity shares shall be redeemable at the expiry of eight yearsfrom the date of issue. The said redemption of Preference Shares will be at a GIRR of 11.25% p.a. inclusive of payment of2% annual dividend and premium on redemption of Preference Shares.
MHIL also has a right to redemption of the aforesaid preference shares at any time provided IFC is paid the redemptionamount at the GIRR.
Subsequent to the above mentioned agreement, MHIL has entered into another tripartite “put option” agreementtogether with the Company and IFC. As per the said agreement IFC has a right to exercise the put option in respect of thesaid preference shares on Company as under:-i) At any time after 3 years from date of subscription; orii) At any time after giving due notice, in the event of non-performance of certain obligations by MHIL and/or
the Company.
Also, the price to be determined as per the ‘put option’ would be equivalent to the amount paid to redeem the PreferenceShares so as to generate GIRR of 11.25% as adjusted with the following:-i) Payment of 2% preference dividend;ii) Discount on IPO Price on such portion of Preference Shares which have been converted to Equity Shares; andiii) Premium paid on Preference Shares already redeemed or to be redeemed.
During the year, MHIL has provided for the aforesaid liability of Rs. 10,157.79 Lacs and adjusted against securitiespremium account.
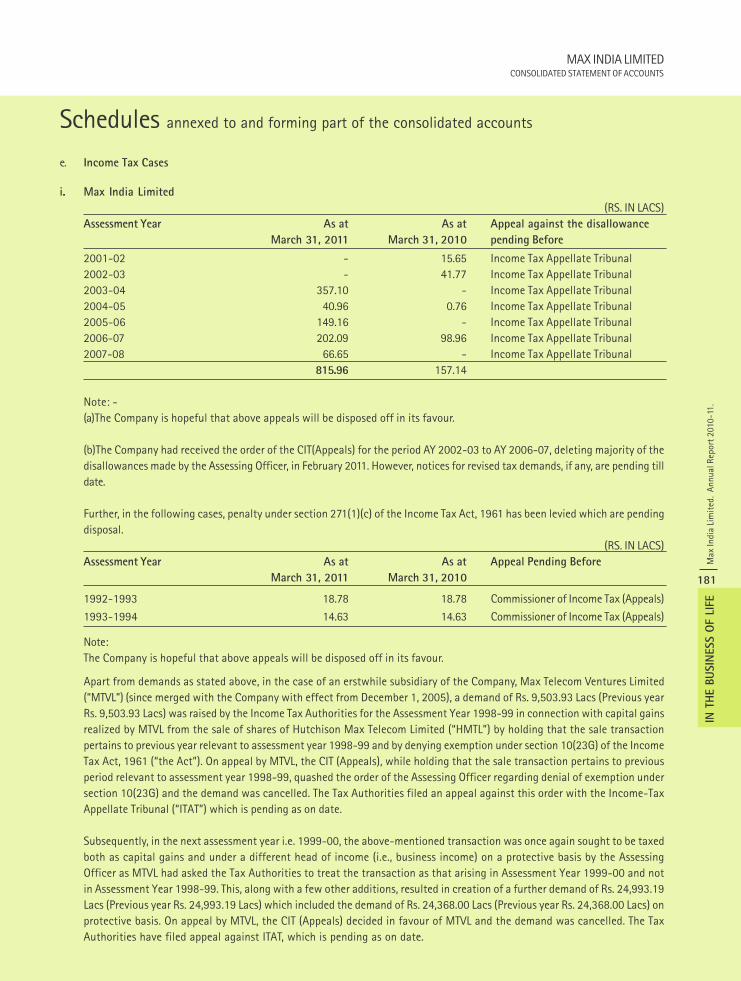
MAX INDIA LIMITEDCONSOLIDATED STATEMENT OF ACCOUNTS
Max
Indi
a Li
mit
ed.
Annu
al R
epor
t 201
0-11
.
181
IN T
HE B
USIN
ESS O
F LI
FE
Schedules annexed to and forming part of the consolidated accounts
e. Income Tax Cases
i. Max India Limited
(RS. IN LACS)Assessment Year As at As at Appeal against the disallowance
March 31, 2011 March 31, 2010 pending Before
2001-02 - 15.65 Income Tax Appellate Tribunal2002-03 - 41.77 Income Tax Appellate Tribunal2003-04 357.10 - Income Tax Appellate Tribunal2004-05 40.96 0.76 Income Tax Appellate Tribunal2005-06 149.16 - Income Tax Appellate Tribunal2006-07 202.09 98.96 Income Tax Appellate Tribunal2007-08 66.65 - Income Tax Appellate Tribunal
815.96 157.14
Note: -(a)The Company is hopeful that above appeals will be disposed off in its favour.
(b)The Company had received the order of the CIT(Appeals) for the period AY 2002-03 to AY 2006-07, deleting majority of thedisallowances made by the Assessing Officer, in February 2011. However, notices for revised tax demands, if any, are pending tilldate.
Further, in the following cases, penalty under section 271(1)(c) of the Income Tax Act, 1961 has been levied which are pendingdisposal.
(RS. IN LACS)Assessment Year As at As at Appeal Pending Before
March 31, 2011 March 31, 2010
1992-1993 18.78 18.78 Commissioner of Income Tax (Appeals)
1993-1994 14.63 14.63 Commissioner of Income Tax (Appeals)
Note:The Company is hopeful that above appeals will be disposed off in its favour.
Apart from demands as stated above, in the case of an erstwhile subsidiary of the Company, Max Telecom Ventures Limited(“MTVL”) (since merged with the Company with effect from December 1, 2005), a demand of Rs. 9,503.93 Lacs (Previous yearRs. 9,503.93 Lacs) was raised by the Income Tax Authorities for the Assessment Year 1998-99 in connection with capital gainsrealized by MTVL from the sale of shares of Hutchison Max Telecom Limited (“HMTL”) by holding that the sale transactionpertains to previous year relevant to assessment year 1998-99 and by denying exemption under section 10(23G) of the IncomeTax Act, 1961 (“the Act”). On appeal by MTVL, the CIT (Appeals), while holding that the sale transaction pertains to previousperiod relevant to assessment year 1998-99, quashed the order of the Assessing Officer regarding denial of exemption undersection 10(23G) and the demand was cancelled. The Tax Authorities filed an appeal against this order with the Income-TaxAppellate Tribunal (“ITAT”) which is pending as on date.
Subsequently, in the next assessment year i.e. 1999-00, the above-mentioned transaction was once again sought to be taxedboth as capital gains and under a different head of income (i.e., business income) on a protective basis by the AssessingOfficer as MTVL had asked the Tax Authorities to treat the transaction as that arising in Assessment Year 1999-00 and notin Assessment Year 1998-99. This, along with a few other additions, resulted in creation of a further demand of Rs. 24,993.19Lacs (Previous year Rs. 24,993.19 Lacs) which included the demand of Rs. 24,368.00 Lacs (Previous year Rs. 24,368.00 Lacs) onprotective basis. On appeal by MTVL, the CIT (Appeals) decided in favour of MTVL and the demand was cancelled. The TaxAuthorities have filed appeal against ITAT, which is pending as on date.
Max
Indi
a Li
mit
ed.
Annu
al R
epor
t 201
0-11
.
182
IN T
HE B
USIN
ESS O
F LI
FE
MAX INDIA LIMITEDCONSOLIDATED STATEMENT OF ACCOUNTS
MTVL had also filed an appeal before ITAT for assessment year 1998-99 contending that the aforesaid sale transactionpertains to previous period relevant to assessment year 1999-2000. This appeal had been disposed off by ITAT by applying acircular of Tax Department applicable only to capital gains and holding, as a result, that the transaction of sale of sharespertains to previous period relevant to assessment year 1998-99. However, the Tax Authorities filed a petition before the ITATrequesting a review of the said order of the ITAT on the ground that all the three appeals pertaining to the aforesaid saletransaction should have been clubbed and heard together. The said petition of the Department was accepted by the ITATwhich recalled its earlier order in the Company’s appeal for Assessment year 1998-99. Aggrieved, the Company filed a writpetition to the Hon’ble High Court of Punjab and Haryana challenging the above action of ITAT on the ground that the samewas beyond jurisdiction. The Hon’ble High Court of Punjab and Haryana has admitted the writ petition and stayed theoperations of the order of ITAT accepting the petition filed by the Department. The ITAT has in the meanwhile adjourned sine-die all the three appeals pending operation of the stay imposed by the Hon’ble High Court (HC). The Department in turn hadmoved in Special Leave Petition (SLP) to Hon’ble Supreme Court against the stay granted by Hon’ble HC. The said SLP has nowbeen dismissed by the Hon’ble Supreme Court. However, the Hon’ble Supreme Court has instructed the Hon’ble HC toexpeditiously dispose the writ petition filed by MTVL.
Again, in the case of the erstwhile subsidiary of the Company, Max Telecom Ventures Limited (“MTVL”) (since merged with theCompany with effect from December 1, 2005), a demand of Rs. 15,585.17 Lacs (Previous year Rs. 15,585.17 Lacs), had beenraised by the Income Tax Authorities for the Assessment Year 2006-07 in connection with capital gains realized by MTVL fromthe sale of remaining shares of Hutchison Max Telecom Limited (“HMTL”) by holding the gains from sale transaction to be inthe nature of business income and not capital gains and as a consequence denying exemption under Section 10(23G) of the Act.MTVL had filed an appeal before CIT (Appeals) against the said order. Further, on application by MTVL, the outstanding demandof Rs 14885.17 lacs had been stayed by the Tax Authorities till the disposal of first appeal by CIT(Appeals) [The Company hadpaid Rs. 700 Lacs during the year for stay of balance demand]. The CIT(Appeals) has, now, vide order dated March 22, 2011,quashed the assessment order framed by the Assessing Officer, holding that the assessment was nullity in law and cannotsurvive in view of the fact that the order was framed in the name of MTVL, an entity which had ceased to exist w.e.f. December1, 2005. As a consequence, the previously raised demand of Rs. 15585.17 Lacs stands deleted. The Department has now soughtto reinitiate proceedings u/s 147 read with section 148 of the Income Tax Act, 1961, on Max India Limited as Successor ofMTVL, vide notice dated April 26, 2011.
The Company is hopeful that above appeals will be disposed off in its favour.
ii. Max Ateev Limited (“Max Ateev”)
There are certain income-tax proceedings pending against the Company at various stages of appeal, as per the detailed givenbelow:
(RS. IN LACS)Assessment year Demand Demand
As at March 31, 2011 As at March 31, 2010 Appeal Pending Before
2001-2002 5.73 Nil Commissioner of IncomeTax(Appeals)
The Company is hopeful that the above appeals will be disposed off in its favor.
Schedules annexed to and forming part of the consolidated accounts
MAX INDIA LIMITEDCONSOLIDATED STATEMENT OF ACCOUNTS
Max
Indi
a Li
mit
ed.
Annu
al R
epor
t 201
0-11
.
183
IN T
HE B
USIN
ESS O
F LI
FE
(iii) Max Healthcare Institute Limited
Certain income-tax proceedings are pending against the Company as detailed below:-(RS. IN LACS)
Assessment Disallowances Disallowance Appeal against the disallowance Demand
Year made by the made by the pending Before (if any)
Assessing Officer Assessing Officer
(2010-11) (2009-10)
2003-04 1,157.72 1,157.72 Commissioner of Income Tax(Appeals) Nil2004-05 641.01 641.01 Commissioner of Income Tax(Appeals) Nil2005-06 649.14 649.14 Commissioner of Income Tax(Appeals) Nil2006-07 462.42 462.42 Commissioner of Income Tax(Appeals) Nil2007-08 917.31 917.31 Commissioner of Income Tax(Appeals) Nil2008-09 241.84 Not Applicable Commissioner of Income Tax(Appeals) Nil
Note:Based on the management assessment of cases, it believes that the above appeals would be disposed off in its favour.
(iv) Max New York Life Insurance Company Limited (“MNYL”)
For the assessment year 2002-2003, the Assessing Officer has reduced the returned loss of Rs. 6,684.09 Lacs (Previous year Rs.6,684.09 Lacs) to Rs. 6,482.08 Lacs (Previous year Rs. 6,482.08 Lacs) by making disallowance of Rs. 202.01 Lacs (Previous yearRs. 202.01 Lacs) u/s 92CA(3) of the Income-tax Act, 1961 relating to Transfer Pricing. Similarly, for the assessment years2003-04 & 2004-05, the returned losses have been reduced from Rs. 7,408.37 Lacs (Previous year Rs. 7,408.37 Lacs) to Rs.7,331.92 Lacs (Previous year Rs. 7,331.92 Lacs) and from Rs. 7,563.42 Lacs (Previous year Rs. 7,563.42 Lacs) to Rs. 7,285.17Lacs (Previous year Rs. 7,285.17 Lacs) respectively by the Assessing Officer by making similar disallowances appeals againstthe above orders have been filed to the CIT (Appeals), which are pending for disposal. Further, for the assessment year 2005-06, the returned loss has been reduced from Rs. 9,427.20 Lacs (Previous year Rs. 9,427.20 Lacs) to Rs. 9,199.80 Lacs (Previousyear Rs. 9,199.80 Lacs) by making disallowance of Rs. 121.70 Lacs u/s 92CA(3) of the Income Tax Act, 1961 relating toTransfer Pricing and Rs. 105.70 Lacs due to disallowance of loss on sale of investment. Appeal against the order has been filedto CIT(Appeals). For the assessment year 2006-07, the returned loss has been reduced from Rs. 5,805.44 Lacs (Previous year Rs.5,805.44 Lacs) to Rs. 5414.09 Lacs (Previous year Rs. 5,414.09 Lacs) by making disallowance of Rs. 11.83 Lacs u/s 92CA(3) of theIncome Tax Act, 1961 relating to Transfer Pricing, Rs. 90.48 Lacs due to disallowance of loss on sale of investment, Rs.255.75 Lacs on provision for FBT and Rs. 33.28 Lacs on provision for bad & doubtful debts. Appeal against the order has beenfiled with Income tax appellate tribunal.
For the assessment year 2007-08, the returned loss has been reduced from Rs. 5,671.22 Lacs to Rs. 5,023.02 Lacs by makingdisallowance of Rs. 270.19 Lacs on account of loss on sale of investment, Rs. 311.43 Lacs on provision for FBT and Rs. 58.08 Lacson provision for bad & doubtful debts & Rs. 8.50 Lacs on donation paid. Appeal against the order has been filed with CIT(Appeals).
For the assessment year 2008-09, the Assessing officer has recomputed the value of fringe benefits from Rs. 1,421.15 Lacs toRs. 1,460.05 Lacs & has raised demand of Rs. 17.76 Lacs. Appeal against the order has been filed with CIT (Appeals).
Schedules annexed to and forming part of the consolidated accounts
Max
Indi
a Li
mit
ed.
Annu
al R
epor
t 201
0-11
.
184
IN T
HE B
USIN
ESS O
F LI
FE
MAX INDIA LIMITEDCONSOLIDATED STATEMENT OF ACCOUNTS
(5) Capital Commitments
(RS. IN LACS)Particulars As at March 31, 2011 As at March 31, 2010
Estimated amount of contracts remaining to be executed oncapital account and not provided for 23,859.42 18,245.44Less: Capital Advances 3,418.71 2,017.04Net capital commitment for acquisition of capital assets 20,440.71 16,228.40
(6) Loans
(i) Max India Limited
a) Term loan from Kotak Mahindra Bank Ltd amounting to Rs. 2,470.00 Lacs (Previous year Nil) is secured by a first pari passucharge on all existing and future movables (excluding vehicles) and immovable fixed assets of the company and secondpari passu charge on all existing and future current assets of the Company.
b) Term loan from IndusInd Bank Ltd amounting to Rs. 5,267.36 Lacs (Previous year Nil) is secured by a first pari passu chargeon the all movable fixed assets (excluding vehicles) of the company and first pari passu charge on immovable propertiesof the Company. Further the loan is secured by a second pari passu charge on the current assets of the Company, bothpresent and future.
c) Term loan from Yes Bank Ltd amounting to Rs. 2,340.47 Lacs (Previous year Nil) is secured by a first pari passu charge onall existing and future movables (excluding vehicles) and immovable fixed assets and second pari passu charge on thecurrent assets of the Company, both present and future.
d) Term Loan from Punjab National Bank amounting to Rs. Nil (Previous year Rs. 2,600 Lacs) was secured by a first pari pasucharge on the fixed assets of the Company and second pari pasu charge on the current assets of the company, both presentand future.
e) Term Loan from Oriental Bank of Commerce amounting to Rs Nil (Previous year Rs. 2,600 Lacs) was secured by a first paripasu charge on the fixed assets of the Company and second pari pasu charge on the current assets of the company, bothpresent and future.
f) Vehicle Loans Rs. 138.57 Lacs (Previous year Rs. 99.00 Lacs) are secured by way of hypothecation of respective vehicles.
(ii) Max Healthcare Institute Limited (“MHIL”)
a) For the Phase I expansion MHIL has availed term loans from financial institutions to finance its hospital projects. Thedetails of loans outstanding till date are as follows:Rs. 12,063.60 Lacs (Previous year Rs. 13,870.80 Lacs) from Housing Development Finance Corporation Limited and Rs6,375.00 Lacs (Previous year Rs. 6,937.50 Lacs) Export Import Bank of India secured by way of charge (s) created/ to becreated as below:-
i. Equitable mortgage of the immovable properties of the Company and a Societyii. First charge on the whole of movable fixed assets including medical equipments, movable plant and machinery, spares etc
(excluding vehicles) of the Company and its subsidiaries namely Max Medical Services Limited and Alps Hospital Limitediii. First charge on all book debts, operating cash flows, receivables, revenue of what-so-ever nature and wherever arising of
the Company and its subsidiaries namely Max Medical Services Limited and Alps Hospital Limited, present and future(subject to a prior charge in favour of working capital bankers restricted to working capital limits of Rs. 5,000.00 Lacs inaggregate).
b) For the Phase II expansion MHIL has availed the term loan from financial institution as follows:Rs. 7,500.00 Lacs (Previous year Rs. 7,500.00 Lacs) from Housing Development Finance Corporation Limited secured byway of:
i. Equitable mortgage of the immovable properties of the Companyii. First charge on the whole of movable fixed assets including medical equipments, movable plant and machinery, spares etc
(excluding vehicles) of the Company and its subsidiaries namely Max Medical Services Limited and Alps Hospital Limited
Schedules annexed to and forming part of the consolidated accounts
MAX INDIA LIMITEDCONSOLIDATED STATEMENT OF ACCOUNTS
Max
Indi
a Li
mit
ed.
Annu
al R
epor
t 201
0-11
.
185
IN T
HE B
USIN
ESS O
F LI
FE
iii. First charge on all book debts, operating cash flows, receivables, revenue of what-so-ever nature and wherever arisingof the Company and its subsidiaries namely Max Medical Services Limited and Alps Hospital Limited, present and future(subject to a prior charge in favour of working capital bankers restricted to working capital limits of Rs. 5,000.00 Lacsin aggregate).
(iii) Pharmax Corporation Limited (“Pharmax”)
Term loan from Canara Bank amounting to Rs. 413.07 Lacs (Previous year Rs. 642.83 Lacs) is secured against a charge onmonthly lease rentals receivable from various lessees and equitable mortgage of freehold property at Okhla, New Delhi.
(iv) Forum I Aviation Limited
Term loan from HDFC Bank Ltd amounting to Rs. 467.03 Lacs (Previous year Nil) is secured by way of first and specific chargeon the aircraft purchased out of the proceed of loan.
(v) Hometrail Buildtech Private Limited
Term loan of Rs. 2,400.00 Lacs (Previous year Rs. Nil) from L&T Infrastructure Finance Company Limited to finance its hospitalsprojects secured by way of:a. Assignment by way of security on all rights, titles, interests, benefits, claims and demands under the concession
agreement, project documents and other contracts which can be legally assigned.b. First charge on all movable fixed assets, including movable plant & machinery, machinery spares, tools and accessories,
furniture, fixtures and all other movable assets excluding vehicles.c. First pari passu charge on all the current assets.d. First charge on all intangibles.
(vi) Hometrail Estate Private Limited
Term loan of Rs. 2,700.00 Lacs (Previous year Rs. Nil) from L&T Infrastructure Finance Company Limited to financeits hospitals projects secured by way of:a. Assignment by way of security on all rights, titles, interests, benefits, claims and demands under the concession
agreement, project documents and other contracts which can be legally assigned.b. First charge on all movable fixed assets, including movable plant & machinery, machinery spares, tools and accessories,
furniture, fixtures and all other movable assets excluding vehicles.c. First pari passu charge on all the current assets.d. First charge on all intangibles.
(7) During previous year, the Company has allotted 20,00,000 warrants of the face value of Rs. 867/- each to Dynavest India PrivateLimited, one of the promoter group companies. Each warrant entitles the holder thereof to subscribe to four equity shares ofRs. 2/- each in the Share Capital of the Company at a premium of Rs. 214.75 per equity share. Each warrant is convertible intofour Equity Share as per prevalent Securities & Exchange Board of India (SEBI) guidelines at any time before expiry of 18months from the date of allotment i.e. February 6, 2010. In consideration of the warrants, the Company had received a depositof Rs. 8,670.00 Lacs (Previous year Rs. 8,670.00 Lacs) (being 50% of the consideration for the issue of shares arising uponconversion of the warrants).
(8) During previous year, the Company has allotted 6,019,925 Compulsorily Convertible Debentures (‘CCDs’) of the face value ofRs. 867/- each for an aggregate consideration of Rs. 52,192.75 Lacs to Xenok Limited, a wholly owned indirect subsidiary ofGS Capital Partners VI Fund, L.P. and certain affiliated funds which are controlled by The Goldman Sachs Group Inc., on apreferential basis in the Extra Ordinary General meeting held on January 22, 2010. The aforesaid CCDs bearing a coupon of 12%per annum will have to be compulsorily converted into four equity shares of face value of Rs. 2/- each at a premium of Rs.214.75 per equity share on or before 15 months from the date of issue of CCDs.
Schedules annexed to and forming part of the consolidated accounts
Max
Indi
a Li
mit
ed.
Annu
al R
epor
t 201
0-11
.
186
IN T
HE B
USIN
ESS O
F LI
FE
MAX INDIA LIMITEDCONSOLIDATED STATEMENT OF ACCOUNTS
(9) Actuarial Assumptions – Life Insurance Business
MNYL’s Appointed Actuary has determined valuation assumptions that conform with Regulations issued by the IRDAand professional guidance notes issued by the Institute of Actuaries of India. Details of assumptions are given below:
(a) Interest: The assumptions take into account the current and projected yields on the fund and the current and projectedyields on Government Securities. A rate of 7.75% (Previous year - 7.75%) for participating business, non-participating,health business and riders has been used. The rate was reduced by margins for adverse deviations of 0.80% (Previous year- 0.80%) for participating business and 1.80% (Previous year - 1.80%) for non-participating business. A gross unit growthrate of 7.75% pa (Previous year - 7.75% pa) has been used which was reduced by a margin of adverse deviation of 1.30%(Previous year - 1.30%) per annum. For Unit Linked products where there is a guaranteed premium benefit payable, themargin for adverse deviation (MAD) for the unit linked fund growth rate was 2.5 % (Previous year -1.30%).
(b) Mortality: The starting point assumption is the Indian Assured Lives Mortality 94-96 as prescribed by the IRDA which isthen adjusted to take into account observed experience. For participating Life products, the assumption in year 1 andbeyond are 95% (Previous year – 90%) and 70% (Previous year – 70%) of the base table respectively. The mortalityassumption for the unit-linked products is 80% (Previous year – 80%) of the base table is year 1 and 70% (Previous year– 70%) of the base table thereafter. In general, the assumptions in the initial years have been increased to reflect anti-selection but those in the later years have been retained in line with experience. The assumptions have been increased bya margin for adverse deviation of 10% (Previous year - 10%) for participating business and 25% (Previous year - 25%) fornon-participating, unit linked and health business.
(c) Morbidity: Given the lack of published experience in India, the Institute of Actuaries has recommended the use of the UKCIBT93 study for morbidity incidence rates. Proportions of 95% to 300% (Previous year - 95% to 300%) of these tableshave been used which were further increased by a margin for adverse deviation of 25% (Previous year – 25%).
(d) Expenses: The maintenance expense assumptions are based on the current expense levels of the company. For prudence,future expected savings in expenses are not anticipated. The assumptions were increased by margins for adverse deviationof 10% (Previous year - 10%) for participating policies and 10% (Previous year - 10%) for non-participating and healthpolicies.
(e) Inflation: An assumption of 6.5 % pa (Previous year - 6.25% pa) for expense inflation has been used and the increasecompared to previous year reflects the indications that relatively high levels of inflation appear to be coming entrenched.
(f) Commission: Commission is allowed for at the rates an agent would be entitled to with no recognition of the fact thatin practice commission might not be paid as a result of the termination of an agency. This prudent approach is consistentwith the Regulations.
(g) Lapses: Lapse assumptions are based on assessments of expected structural experience taking into account experienceobserved. The rates were adjusted by margins for adverse deviation of 20% (Previous year - 20%) for participatingpolicies, 50% (Previous year - 50%) for non-participating policies and 20% (Previous year - 20%) for health plans.
(h) Future bonuses: For participating business allowance is made with the reserves for future bonuses based on the levels thatwould be expected to be paid if future experience was in line with the valuation assumptions and after consideringPolicyholders’ Reasonable Expectations.
(i) Linked Liabilities: Liabilities under linked policies comprise of a unit liability representing the fund value of policies andnon unit liability for meeting future claims and expenses in excess of future charges. In respect of the fund valuecomponent the question of assumptions does not arise and in respect of the non unit liability the assumptions used areconsistent with the comments above.
Schedules annexed to and forming part of the consolidated accounts
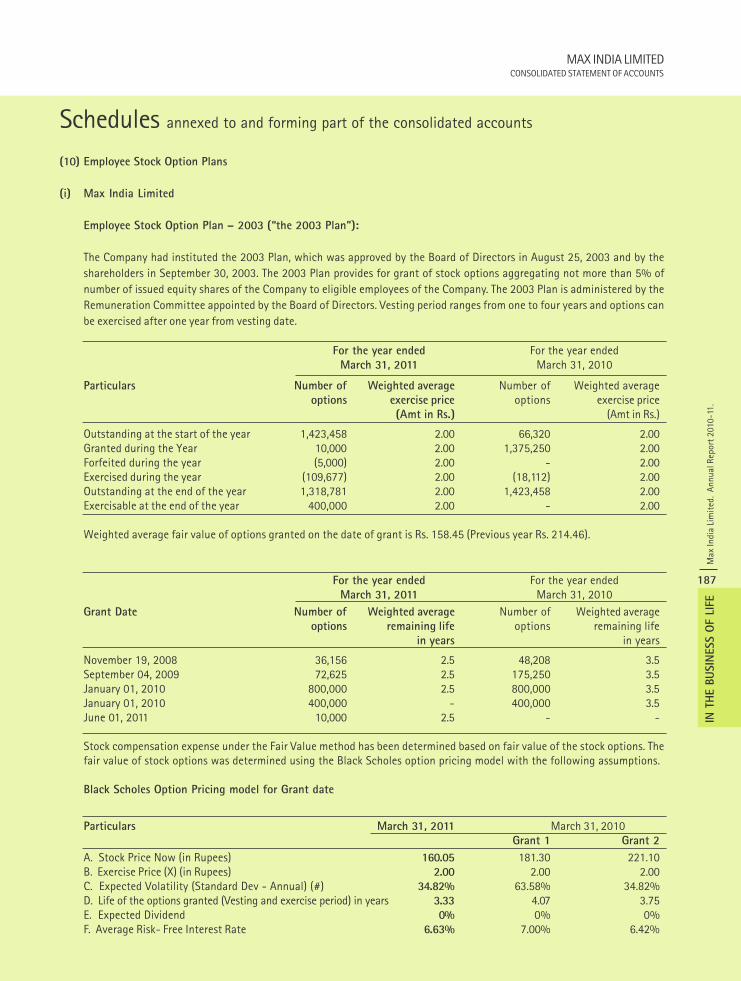
MAX INDIA LIMITEDCONSOLIDATED STATEMENT OF ACCOUNTS
Max
Indi
a Li
mit
ed.
Annu
al R
epor
t 201
0-11
.
187
IN T
HE B
USIN
ESS O
F LI
FE
(10) Employee Stock Option Plans
(i) Max India Limited
Employee Stock Option Plan – 2003 (“the 2003 Plan”):
The Company had instituted the 2003 Plan, which was approved by the Board of Directors in August 25, 2003 and by theshareholders in September 30, 2003. The 2003 Plan provides for grant of stock options aggregating not more than 5% ofnumber of issued equity shares of the Company to eligible employees of the Company. The 2003 Plan is administered by theRemuneration Committee appointed by the Board of Directors. Vesting period ranges from one to four years and options canbe exercised after one year from vesting date.
For the year ended For the year endedMarch 31, 2011 March 31, 2010
Particulars Number of Weighted average Number of Weighted averageoptions exercise price options exercise price
(Amt in Rs.) (Amt in Rs.)
Outstanding at the start of the year 1,423,458 2.00 66,320 2.00Granted during the Year 10,000 2.00 1,375,250 2.00Forfeited during the year (5,000) 2.00 - 2.00Exercised during the year (109,677) 2.00 (18,112) 2.00Outstanding at the end of the year 1,318,781 2.00 1,423,458 2.00Exercisable at the end of the year 400,000 2.00 - 2.00
Weighted average fair value of options granted on the date of grant is Rs. 158.45 (Previous year Rs. 214.46).
For the year ended For the year endedMarch 31, 2011 March 31, 2010
Grant Date Number of Weighted average Number of Weighted averageoptions remaining life options remaining life
in years in years
November 19, 2008 36,156 2.5 48,208 3.5September 04, 2009 72,625 2.5 175,250 3.5January 01, 2010 800,000 2.5 800,000 3.5January 01, 2010 400,000 - 400,000 3.5June 01, 2011 10,000 2.5 - -
Stock compensation expense under the Fair Value method has been determined based on fair value of the stock options. Thefair value of stock options was determined using the Black Scholes option pricing model with the following assumptions.
Black Scholes Option Pricing model for Grant date
Particulars March 31, 2011 March 31, 2010Grant 1 Grant 2
A. Stock Price Now (in Rupees) 160.05 181.30 221.10B. Exercise Price (X) (in Rupees) 2.00 2.00 2.00C. Expected Volatility (Standard Dev - Annual) (#) 34.82% 63.58% 34.82%D. Life of the options granted (Vesting and exercise period) in years 3.33 4.07 3.75E. Expected Dividend 0% 0% 0%F. Average Risk- Free Interest Rate 6.63% 7.00% 6.42%
Schedules annexed to and forming part of the consolidated accounts
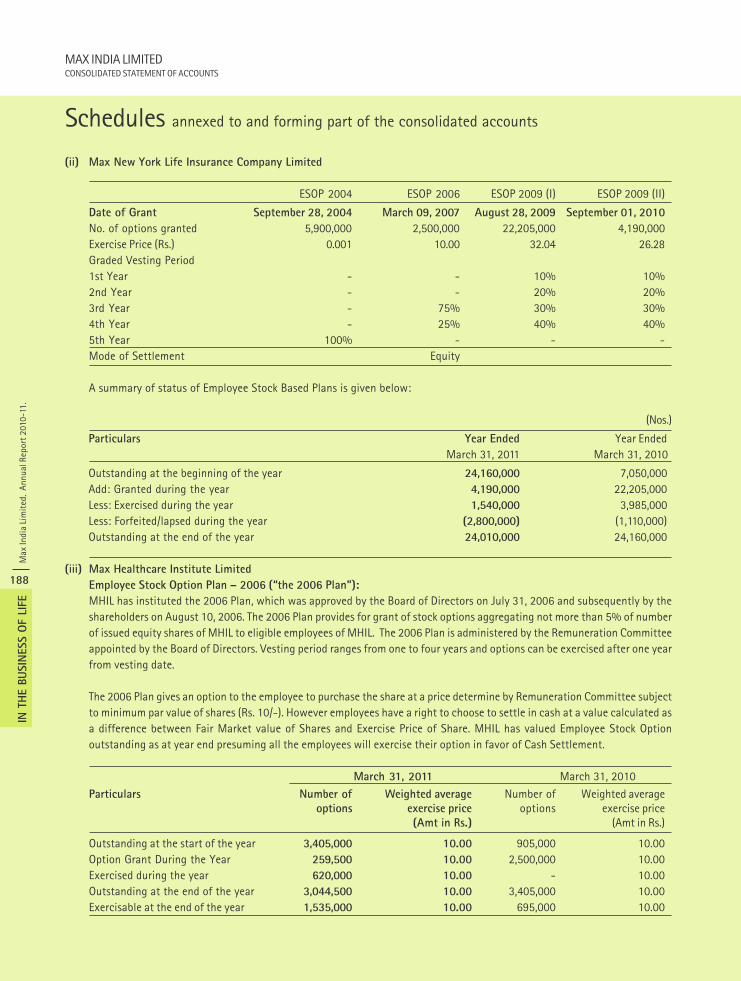
Max
Indi
a Li
mit
ed.
Annu
al R
epor
t 201
0-11
.
188
IN T
HE B
USIN
ESS O
F LI
FE
MAX INDIA LIMITEDCONSOLIDATED STATEMENT OF ACCOUNTS
(ii) Max New York Life Insurance Company Limited
ESOP 2004 ESOP 2006 ESOP 2009 (I) ESOP 2009 (II)
Date of Grant September 28, 2004 March 09, 2007 August 28, 2009 September 01, 2010
No. of options granted 5,900,000 2,500,000 22,205,000 4,190,000Exercise Price (Rs.) 0.001 10.00 32.04 26.28Graded Vesting Period1st Year - - 10% 10%2nd Year - - 20% 20%3rd Year - 75% 30% 30%4th Year - 25% 40% 40%5th Year 100% - - -Mode of Settlement Equity
A summary of status of Employee Stock Based Plans is given below:
(Nos.)
Particulars Year Ended Year Ended March 31, 2011 March 31, 2010
Outstanding at the beginning of the year 24,160,000 7,050,000Add: Granted during the year 4,190,000 22,205,000Less: Exercised during the year 1,540,000 3,985,000Less: Forfeited/lapsed during the year (2,800,000) (1,110,000)Outstanding at the end of the year 24,010,000 24,160,000
(iii) Max Healthcare Institute Limited
Employee Stock Option Plan – 2006 (“the 2006 Plan”):
MHIL has instituted the 2006 Plan, which was approved by the Board of Directors on July 31, 2006 and subsequently by theshareholders on August 10, 2006. The 2006 Plan provides for grant of stock options aggregating not more than 5% of numberof issued equity shares of MHIL to eligible employees of MHIL. The 2006 Plan is administered by the Remuneration Committeeappointed by the Board of Directors. Vesting period ranges from one to four years and options can be exercised after one yearfrom vesting date.
The 2006 Plan gives an option to the employee to purchase the share at a price determine by Remuneration Committee subjectto minimum par value of shares (Rs. 10/-). However employees have a right to choose to settle in cash at a value calculated asa difference between Fair Market value of Shares and Exercise Price of Share. MHIL has valued Employee Stock Optionoutstanding as at year end presuming all the employees will exercise their option in favor of Cash Settlement.
March 31, 2011 March 31, 2010
Particulars Number of Weighted average Number of Weighted averageoptions exercise price options exercise price
(Amt in Rs.) (Amt in Rs.)
Outstanding at the start of the year 3,405,000 10.00 905,000 10.00Option Grant During the Year 259,500 10.00 2,500,000 10.00Exercised during the year 620,000 10.00 - 10.00Outstanding at the end of the year 3,044,500 10.00 3,405,000 10.00Exercisable at the end of the year 1,535,000 10.00 695,000 10.00
Schedules annexed to and forming part of the consolidated accounts
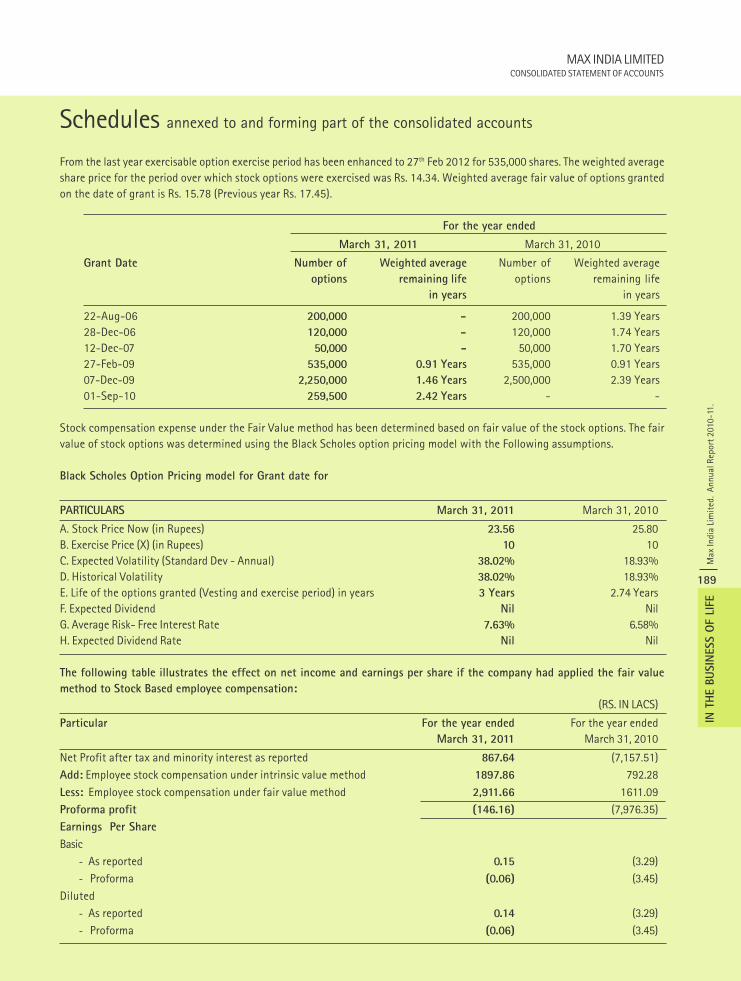
MAX INDIA LIMITEDCONSOLIDATED STATEMENT OF ACCOUNTS
Max
Indi
a Li
mit
ed.
Annu
al R
epor
t 201
0-11
.
189
IN T
HE B
USIN
ESS O
F LI
FE
From the last year exercisable option exercise period has been enhanced to 27th Feb 2012 for 535,000 shares. The weighted averageshare price for the period over which stock options were exercised was Rs. 14.34. Weighted average fair value of options grantedon the date of grant is Rs. 15.78 (Previous year Rs. 17.45).
For the year ended
March 31, 2011 March 31, 2010
Grant Date Number of Weighted average Number of Weighted averageoptions remaining life options remaining life
in years in years
22-Aug-06 200,000 - 200,000 1.39 Years28-Dec-06 120,000 - 120,000 1.74 Years12-Dec-07 50,000 - 50,000 1.70 Years27-Feb-09 535,000 0.91 Years 535,000 0.91 Years07-Dec-09 2,250,000 1.46 Years 2,500,000 2.39 Years01-Sep-10 259,500 2.42 Years - -
Stock compensation expense under the Fair Value method has been determined based on fair value of the stock options. The fairvalue of stock options was determined using the Black Scholes option pricing model with the Following assumptions.
Black Scholes Option Pricing model for Grant date for
PARTICULARS March 31, 2011 March 31, 2010
A. Stock Price Now (in Rupees) 23.56 25.80B. Exercise Price (X) (in Rupees) 10 10C. Expected Volatility (Standard Dev - Annual) 38.02% 18.93%D. Historical Volatility 38.02% 18.93%E. Life of the options granted (Vesting and exercise period) in years 3 Years 2.74 YearsF. Expected Dividend Nil NilG. Average Risk- Free Interest Rate 7.63% 6.58%H. Expected Dividend Rate Nil Nil
The following table illustrates the effect on net income and earnings per share if the company had applied the fair value
method to Stock Based employee compensation:
(RS. IN LACS)
Particular For the year ended For the year endedMarch 31, 2011 March 31, 2010
Net Profit after tax and minority interest as reported 867.64 (7,157.51)Add: Employee stock compensation under intrinsic value method 1897.86 792.28Less: Employee stock compensation under fair value method 2,911.66 1611.09Proforma profit (146.16) (7,976.35)Earnings Per Share
Basic- As reported 0.15 (3.29)- Proforma (0.06) (3.45)
Diluted- As reported 0.14 (3.29)- Proforma (0.06) (3.45)
Schedules annexed to and forming part of the consolidated accounts
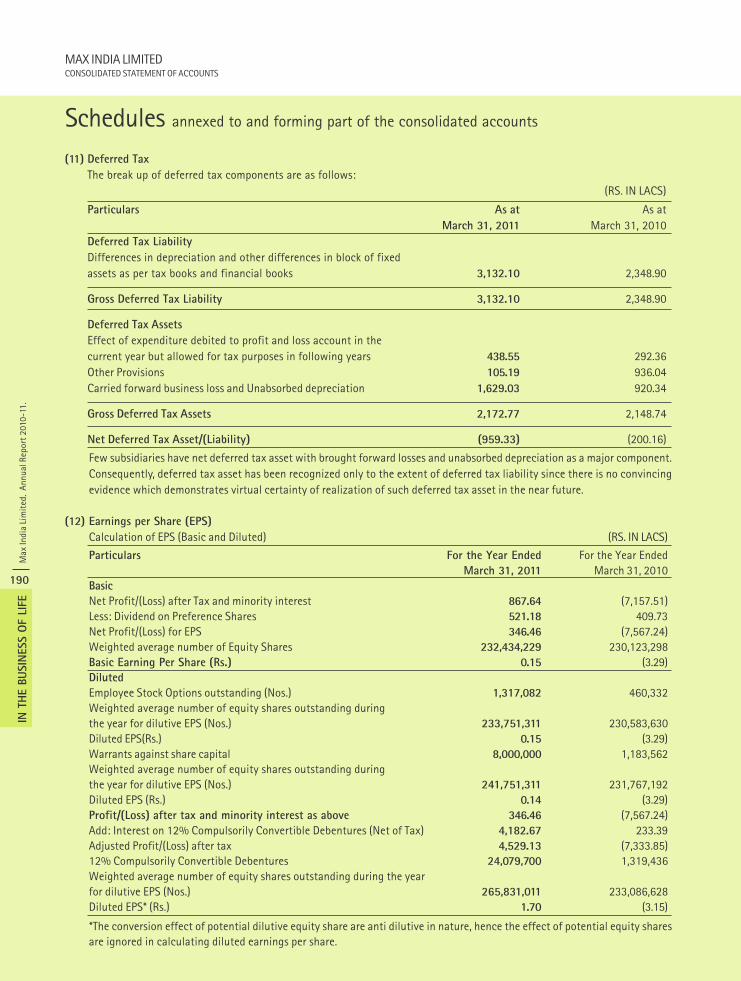
Max
Indi
a Li
mit
ed.
Annu
al R
epor
t 201
0-11
.
190
IN T
HE B
USIN
ESS O
F LI
FE
MAX INDIA LIMITEDCONSOLIDATED STATEMENT OF ACCOUNTS
(11) Deferred Tax
The break up of deferred tax components are as follows:(RS. IN LACS)
Particulars As at As atMarch 31, 2011 March 31, 2010
Deferred Tax Liability
Differences in depreciation and other differences in block of fixedassets as per tax books and financial books 3,132.10 2,348.90
Gross Deferred Tax Liability 3,132.10 2,348.90
Deferred Tax Assets
Effect of expenditure debited to profit and loss account in thecurrent year but allowed for tax purposes in following years 438.55 292.36Other Provisions 105.19 936.04Carried forward business loss and Unabsorbed depreciation 1,629.03 920.34
Gross Deferred Tax Assets 2,172.77 2,148.74
Net Deferred Tax Asset/(Liability) (959.33) (200.16)
Few subsidiaries have net deferred tax asset with brought forward losses and unabsorbed depreciation as a major component.Consequently, deferred tax asset has been recognized only to the extent of deferred tax liability since there is no convincingevidence which demonstrates virtual certainty of realization of such deferred tax asset in the near future.
(12) Earnings per Share (EPS)
Calculation of EPS (Basic and Diluted) (RS. IN LACS)
Particulars For the Year Ended For the Year EndedMarch 31, 2011 March 31, 2010
Basic
Net Profit/(Loss) after Tax and minority interest 867.64 (7,157.51)Less: Dividend on Preference Shares 521.18 409.73Net Profit/(Loss) for EPS 346.46 (7,567.24)Weighted average number of Equity Shares 232,434,229 230,123,298Basic Earning Per Share (Rs.) 0.15 (3.29)Diluted
Employee Stock Options outstanding (Nos.) 1,317,082 460,332Weighted average number of equity shares outstanding duringthe year for dilutive EPS (Nos.) 233,751,311 230,583,630Diluted EPS(Rs.) 0.15 (3.29)Warrants against share capital 8,000,000 1,183,562Weighted average number of equity shares outstanding duringthe year for dilutive EPS (Nos.) 241,751,311 231,767,192Diluted EPS (Rs.) 0.14 (3.29)Profit/(Loss) after tax and minority interest as above 346.46 (7,567.24)Add: Interest on 12% Compulsorily Convertible Debentures (Net of Tax) 4,182.67 233.39Adjusted Profit/(Loss) after tax 4,529.13 (7,333.85)12% Compulsorily Convertible Debentures 24,079,700 1,319,436Weighted average number of equity shares outstanding during the yearfor dilutive EPS (Nos.) 265,831,011 233,086,628Diluted EPS* (Rs.) 1.70 (3.15)
*The conversion effect of potential dilutive equity share are anti dilutive in nature, hence the effect of potential equity sharesare ignored in calculating diluted earnings per share.
Schedules annexed to and forming part of the consolidated accounts
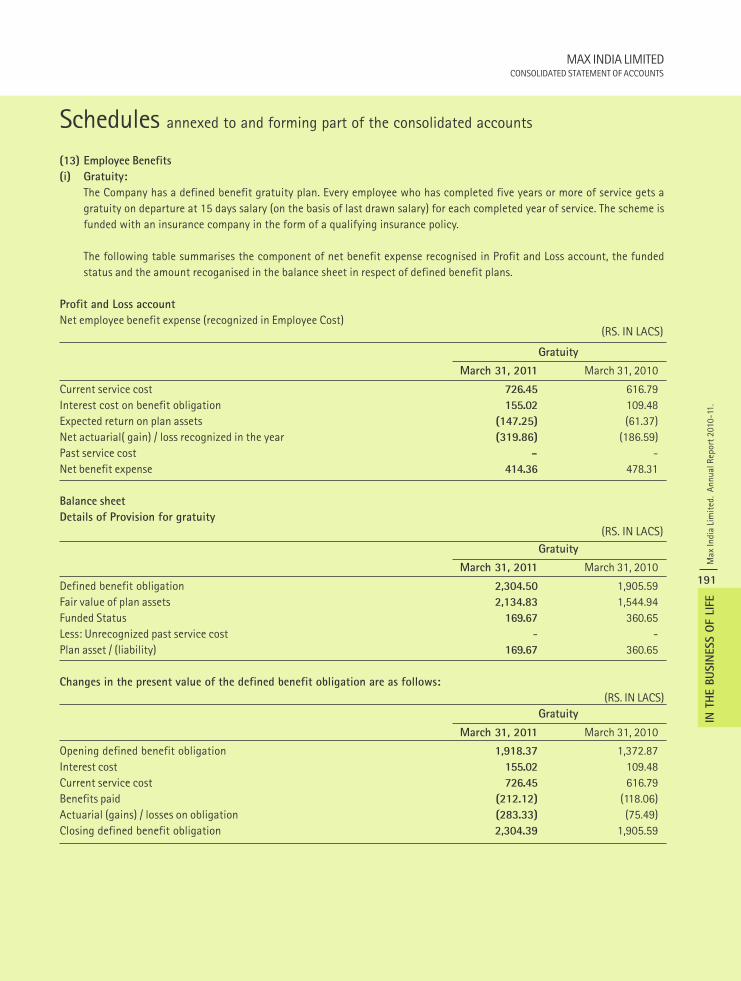
MAX INDIA LIMITEDCONSOLIDATED STATEMENT OF ACCOUNTS
Max
Indi
a Li
mit
ed.
Annu
al R
epor
t 201
0-11
.
191
IN T
HE B
USIN
ESS O
F LI
FE
Schedules annexed to and forming part of the consolidated accounts
(13) Employee Benefits
(i) Gratuity:
The Company has a defined benefit gratuity plan. Every employee who has completed five years or more of service gets agratuity on departure at 15 days salary (on the basis of last drawn salary) for each completed year of service. The scheme isfunded with an insurance company in the form of a qualifying insurance policy.
The following table summarises the component of net benefit expense recognised in Profit and Loss account, the fundedstatus and the amount recoganised in the balance sheet in respect of defined benefit plans.
Profit and Loss account
Net employee benefit expense (recognized in Employee Cost)
Gratuity
March 31, 2011 March 31, 2010
Current service cost 726.45 616.79Interest cost on benefit obligation 155.02 109.48Expected return on plan assets (147.25) (61.37)Net actuarial( gain) / loss recognized in the year (319.86) (186.59)Past service cost - -Net benefit expense 414.36 478.31
Balance sheet
Details of Provision for gratuity
Gratuity
March 31, 2011 March 31, 2010
Defined benefit obligation 2,304.50 1,905.59Fair value of plan assets 2,134.83 1,544.94Funded Status 169.67 360.65Less: Unrecognized past service cost - -Plan asset / (liability) 169.67 360.65
Changes in the present value of the defined benefit obligation are as follows:
(RS. IN LACS)Gratuity
March 31, 2011 March 31, 2010
Opening defined benefit obligation 1,918.37 1,372.87Interest cost 155.02 109.48Current service cost 726.45 616.79Benefits paid (212.12) (118.06)Actuarial (gains) / losses on obligation (283.33) (75.49)Closing defined benefit obligation 2,304.39 1,905.59
(RS. IN LACS)
(RS. IN LACS)
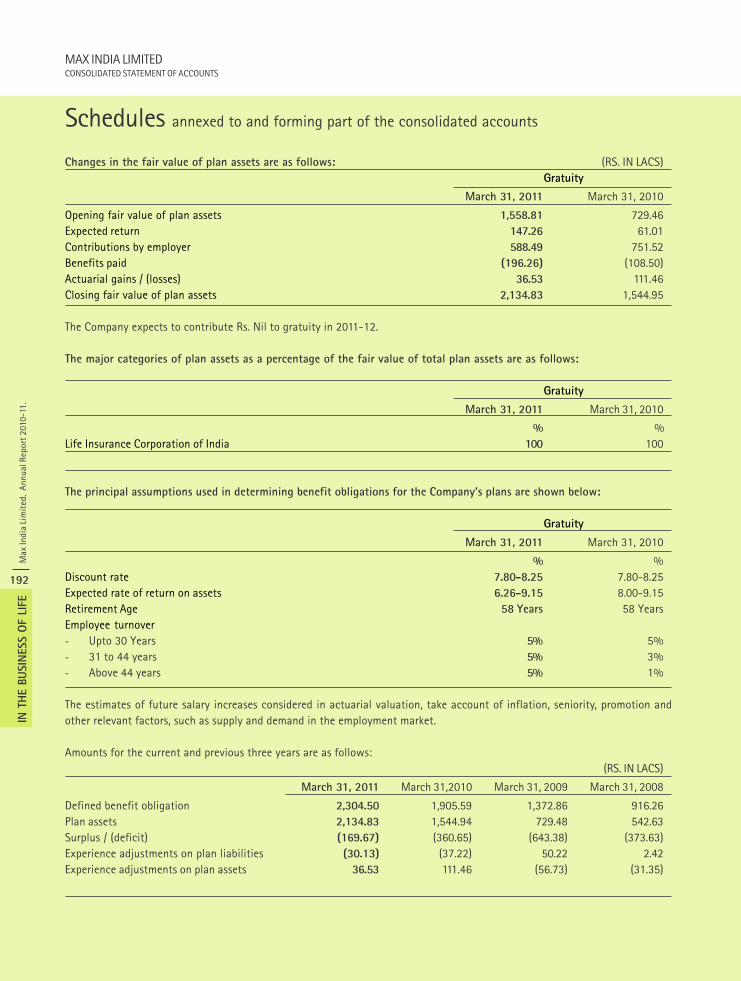
Max
Indi
a Li
mit
ed.
Annu
al R
epor
t 201
0-11
.
192
IN T
HE B
USIN
ESS O
F LI
FE
MAX INDIA LIMITEDCONSOLIDATED STATEMENT OF ACCOUNTS
Schedules annexed to and forming part of the consolidated accounts
Changes in the fair value of plan assets are as follows: (RS. IN LACS)Gratuity
March 31, 2011 March 31, 2010
Opening fair value of plan assets 1,558.81 729.46Expected return 147.26 61.01Contributions by employer 588.49 751.52Benefits paid (196.26) (108.50)Actuarial gains / (losses) 36.53 111.46Closing fair value of plan assets 2,134.83 1,544.95
The Company expects to contribute Rs. Nil to gratuity in 2011-12.
The major categories of plan assets as a percentage of the fair value of total plan assets are as follows:
Gratuity
March 31, 2011 March 31, 2010
% %Life Insurance Corporation of India 100 100
The principal assumptions used in determining benefit obligations for the Company’s plans are shown below:
Gratuity
March 31, 2011 March 31, 2010
% %Discount rate 7.80-8.25 7.80-8.25Expected rate of return on assets 6.26-9.15 8.00-9.15Retirement Age 58 Years 58 YearsEmployee turnover- Upto 30 Years 5% 5%- 31 to 44 years 5% 3%- Above 44 years 5% 1%
The estimates of future salary increases considered in actuarial valuation, take account of inflation, seniority, promotion andother relevant factors, such as supply and demand in the employment market.
Amounts for the current and previous three years are as follows:(RS. IN LACS)
March 31, 2011 March 31,2010 March 31, 2009 March 31, 2008
Defined benefit obligation 2,304.50 1,905.59 1,372.86 916.26Plan assets 2,134.83 1,544.94 729.48 542.63Surplus / (deficit) (169.67) (360.65) (643.38) (373.63)Experience adjustments on plan liabilities (30.13) (37.22) 50.22 2.42Experience adjustments on plan assets 36.53 111.46 (56.73) (31.35)
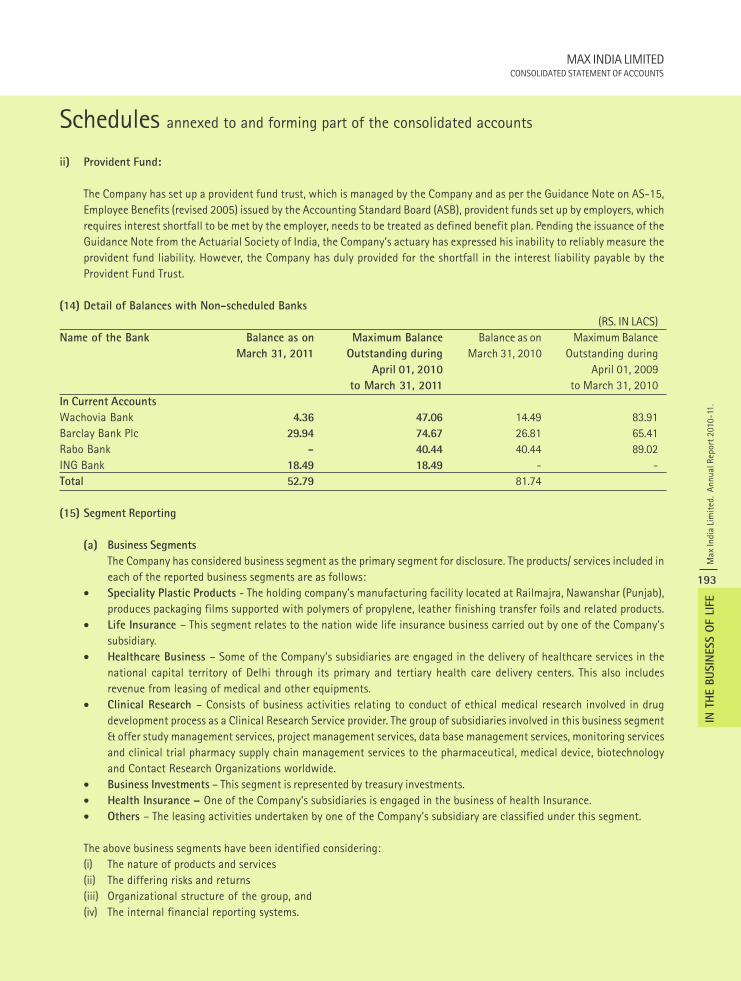
MAX INDIA LIMITEDCONSOLIDATED STATEMENT OF ACCOUNTS
Max
Indi
a Li
mit
ed.
Annu
al R
epor
t 201
0-11
.
193
IN T
HE B
USIN
ESS O
F LI
FE
Schedules annexed to and forming part of the consolidated accounts
ii) Provident Fund:
The Company has set up a provident fund trust, which is managed by the Company and as per the Guidance Note on AS-15,Employee Benefits (revised 2005) issued by the Accounting Standard Board (ASB), provident funds set up by employers, whichrequires interest shortfall to be met by the employer, needs to be treated as defined benefit plan. Pending the issuance of theGuidance Note from the Actuarial Society of India, the Company’s actuary has expressed his inability to reliably measure theprovident fund liability. However, the Company has duly provided for the shortfall in the interest liability payable by theProvident Fund Trust.
(14) Detail of Balances with Non-scheduled Banks
(RS. IN LACS)Name of the Bank Balance as on Maximum Balance Balance as on Maximum Balance
March 31, 2011 Outstanding during March 31, 2010 Outstanding duringApril 01, 2010 April 01, 2009
to March 31, 2011 to March 31, 2010In Current Accounts
Wachovia Bank 4.36 47.06 14.49 83.91Barclay Bank Plc 29.94 74.67 26.81 65.41Rabo Bank - 40.44 40.44 89.02ING Bank 18.49 18.49 - -Total 52.79 81.74
(15) Segment Reporting
(a) Business Segments
The Company has considered business segment as the primary segment for disclosure. The products/ services included ineach of the reported business segments are as follows:
• Speciality Plastic Products - The holding company’s manufacturing facility located at Railmajra, Nawanshar (Punjab),produces packaging films supported with polymers of propylene, leather finishing transfer foils and related products.
• Life Insurance – This segment relates to the nation wide life insurance business carried out by one of the Company’ssubsidiary.
• Healthcare Business – Some of the Company’s subsidiaries are engaged in the delivery of healthcare services in thenational capital territory of Delhi through its primary and tertiary health care delivery centers. This also includesrevenue from leasing of medical and other equipments.
• Clinical Research – Consists of business activities relating to conduct of ethical medical research involved in drugdevelopment process as a Clinical Research Service provider. The group of subsidiaries involved in this business segment& offer study management services, project management services, data base management services, monitoring servicesand clinical trial pharmacy supply chain management services to the pharmaceutical, medical device, biotechnologyand Contact Research Organizations worldwide.
• Business Investments – This segment is represented by treasury investments.• Health Insurance – One of the Company’s subsidiaries is engaged in the business of health Insurance.• Others – The leasing activities undertaken by one of the Company’s subsidiary are classified under this segment.
The above business segments have been identified considering:(i) The nature of products and services(ii) The differing risks and returns(iii) Organizational structure of the group, and(iv) The internal financial reporting systems.
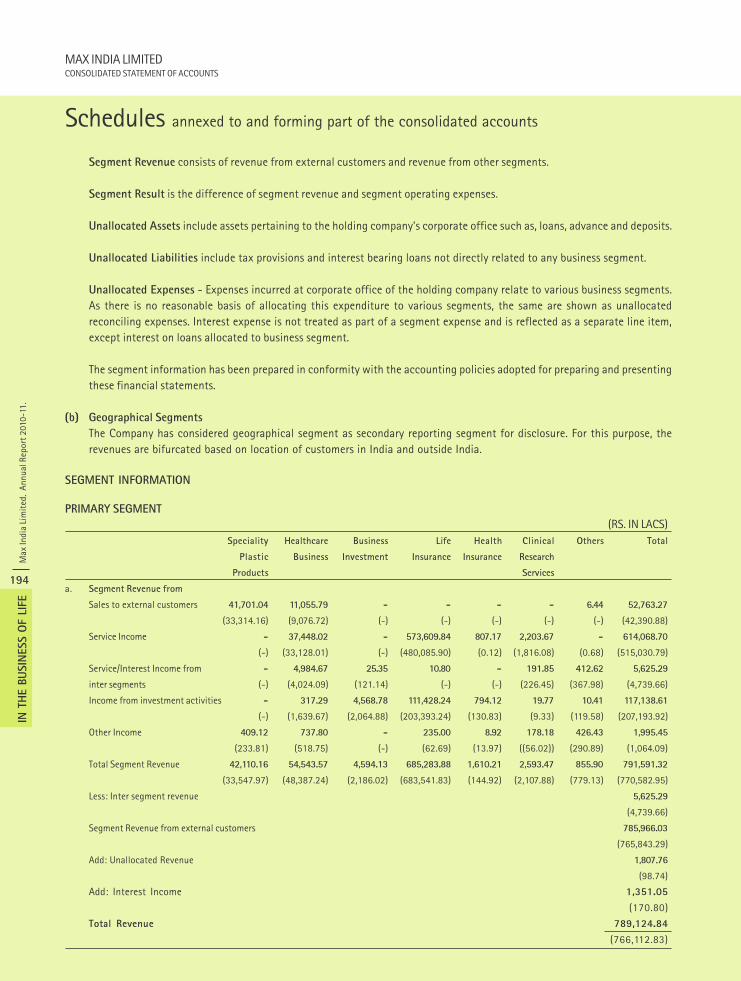
Max
Indi
a Li
mit
ed.
Annu
al R
epor
t 201
0-11
.
194
IN T
HE B
USIN
ESS O
F LI
FE
MAX INDIA LIMITEDCONSOLIDATED STATEMENT OF ACCOUNTS
Segment Revenue consists of revenue from external customers and revenue from other segments.
Segment Result is the difference of segment revenue and segment operating expenses.
Unallocated Assets include assets pertaining to the holding company’s corporate office such as, loans, advance and deposits.
Unallocated Liabilities include tax provisions and interest bearing loans not directly related to any business segment.
Unallocated Expenses - Expenses incurred at corporate office of the holding company relate to various business segments.As there is no reasonable basis of allocating this expenditure to various segments, the same are shown as unallocatedreconciling expenses. Interest expense is not treated as part of a segment expense and is reflected as a separate line item,except interest on loans allocated to business segment.
The segment information has been prepared in conformity with the accounting policies adopted for preparing and presentingthese financial statements.
(b) Geographical Segments
The Company has considered geographical segment as secondary reporting segment for disclosure. For this purpose, therevenues are bifurcated based on location of customers in India and outside India.
SEGMENT INFORMATION
PRIMARY SEGMENT
(RS. IN LACS)Speciality Healthcare Business Life Health Clinical Others Total
Plastic Business Investment Insurance Insurance Research
Products Services
a. Segment Revenue from
Sales to external customers 41,701.04 11,055.79 - - - - 6.44 52,763.27
(33,314.16) (9,076.72) (-) (-) (-) (-) (-) (42,390.88)
Service Income - 37,448.02 - 573,609.84 807.17 2,203.67 - 614,068.70
(-) (33,128.01) (-) (480,085.90) (0.12) (1,816.08) (0.68) (515,030.79)
Service/Interest Income from - 4,984.67 25.35 10.80 - 191.85 412.62 5,625.29
inter segments (-) (4,024.09) (121.14) (-) (-) (226.45) (367.98) (4,739.66)
Income from investment activities - 317.29 4,568.78 111,428.24 794.12 19.77 10.41 117,138.61
(-) (1,639.67) (2,064.88) (203,393.24) (130.83) (9.33) (119.58) (207,193.92)
Other Income 409.12 737.80 - 235.00 8.92 178.18 426.43 1,995.45
(233.81) (518.75) (-) (62.69) (13.97) ((56.02)) (290.89) (1,064.09)
Total Segment Revenue 42,110.16 54,543.57 4,594.13 685,283.88 1,610.21 2,593.47 855.90 791,591.32
(33,547.97) (48,387.24) (2,186.02) (683,541.83) (144.92) (2,107.88) (779.13) (770,582.95)
Less: Inter segment revenue 5,625.29
(4,739.66)
Segment Revenue from external customers 785,966.03
(765,843.29)
Add: Unallocated Revenue 1,807.76
(98.74)
Add: Interest Income 1,351.05
(170.80)
Total Revenue 789,124.84
(766,112.83)
Schedules annexed to and forming part of the consolidated accounts
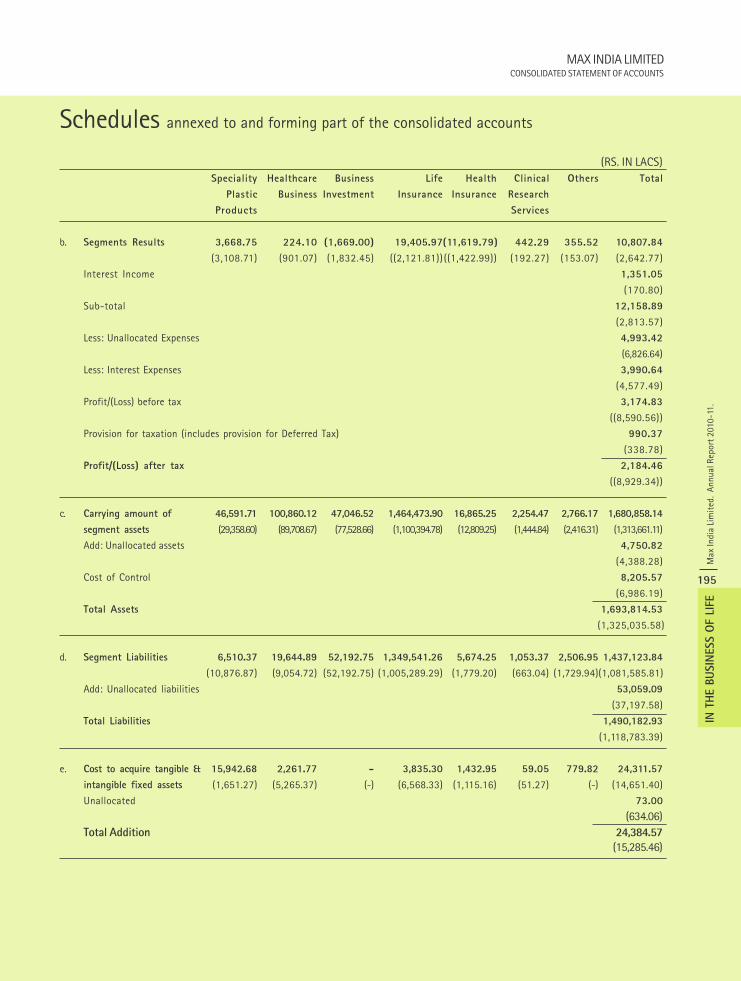
MAX INDIA LIMITEDCONSOLIDATED STATEMENT OF ACCOUNTS
Max
Indi
a Li
mit
ed.
Annu
al R
epor
t 201
0-11
.
195
IN T
HE B
USIN
ESS O
F LI
FE
Schedules annexed to and forming part of the consolidated accounts
(RS. IN LACS)Speciality Healthcare Business Life Health Clinical Others Total
Plastic Business Investment Insurance Insurance Research
Products Services
b. Segments Results 3,668.75 224.10 (1,669.00) 19,405.97(11,619.79) 442.29 355.52 10,807.84
(3,108.71) (901.07) (1,832.45) ((2,121.81)) ((1,422.99)) (192.27) (153.07) (2,642.77)
Interest Income 1,351.05
(170.80)
Sub-total 12,158.89
(2,813.57)
Less: Unallocated Expenses 4,993.42
(6,826.64)
Less: Interest Expenses 3,990.64
(4,577.49)
Profit/(Loss) before tax 3,174.83
((8,590.56))
Provision for taxation (includes provision for Deferred Tax) 990.37
(338.78)
Profit/(Loss) after tax 2,184.46
((8,929.34))
c. Carrying amount of 46,591.71 100,860.12 47,046.52 1,464,473.90 16,865.25 2,254.47 2,766.17 1,680,858.14
segment assets (29,358.60) (89,708.67) (77,528.66) (1,100,394.78) (12,809.25) (1,444.84) (2,416.31) (1,313,661.11)
Add: Unallocated assets 4,750.82
(4,388.28)
Cost of Control 8,205.57
(6,986.19)
Total Assets 1,693,814.53
(1,325,035.58)
d. Segment Liabilities 6,510.37 19,644.89 52,192.75 1,349,541.26 5,674.25 1,053.37 2,506.95 1,437,123.84
(10,876.87) (9,054.72) (52,192.75) (1,005,289.29) (1,779.20) (663.04) (1,729.94)(1,081,585.81)
Add: Unallocated liabilities 53,059.09
(37,197.58)
Total Liabilities 1,490,182.93
(1,118,783.39)
e. Cost to acquire tangible & 15,942.68 2,261.77 - 3,835.30 1,432.95 59.05 779.82 24,311.57
intangible fixed assets (1,651.27) (5,265.37) (-) (6,568.33) (1,115.16) (51.27) (-) (14,651.40)
Unallocated 73.00
(634.06) Total Addition 24,384.57
(15,285.46)
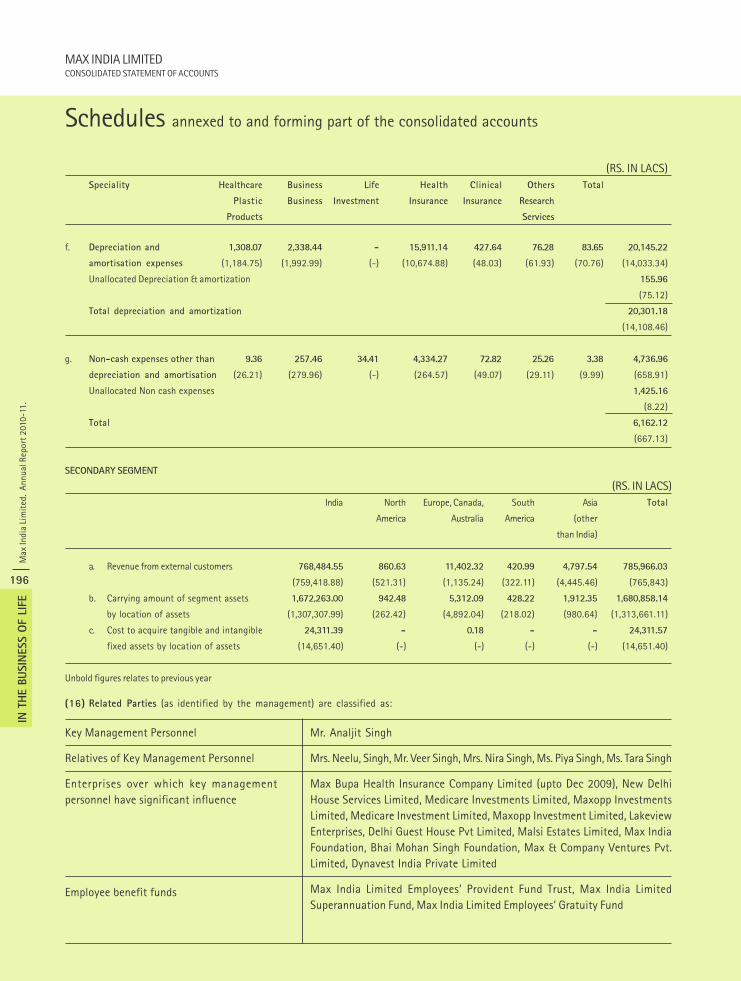
Max
Indi
a Li
mit
ed.
Annu
al R
epor
t 201
0-11
.
196
IN T
HE B
USIN
ESS O
F LI
FE
MAX INDIA LIMITEDCONSOLIDATED STATEMENT OF ACCOUNTS
Schedules annexed to and forming part of the consolidated accounts
(RS. IN LACS)Speciality Healthcare Business Life Health Clinical Others Total
Plastic Business Investment Insurance Insurance Research
Products Services
f. Depreciation and 1,308.07 2,338.44 - 15,911.14 427.64 76.28 83.65 20,145.22
amortisation expenses (1,184.75) (1,992.99) (-) (10,674.88) (48.03) (61.93) (70.76) (14,033.34)
Unallocated Depreciation & amortization 155.96
(75.12)
Total depreciation and amortization 20,301.18
(14,108.46)
g. Non-cash expenses other than 9.36 257.46 34.41 4,334.27 72.82 25.26 3.38 4,736.96
depreciation and amortisation (26.21) (279.96) (-) (264.57) (49.07) (29.11) (9.99) (658.91)
Unallocated Non cash expenses 1,425.16
(8.22)
Total 6,162.12
(667.13)
SECONDARY SEGMENT
(RS. IN LACS)India North Europe, Canada, South Asia Total
America Australia America (other
than India)
a. Revenue from external customers 768,484.55 860.63 11,402.32 420.99 4,797.54 785,966.03
(759,418.88) (521.31) (1,135.24) (322.11) (4,445.46) (765,843)
b. Carrying amount of segment assets 1,672,263.00 942.48 5,312.09 428.22 1,912.35 1,680,858.14
by location of assets (1,307,307.99) (262.42) (4,892.04) (218.02) (980.64) (1,313,661.11)
c. Cost to acquire tangible and intangible 24,311.39 - 0.18 - - 24,311.57
fixed assets by location of assets (14,651.40) (-) (-) (-) (-) (14,651.40)
Unbold figures relates to previous year
(16) Related Parties (as identified by the management) are classified as:
Mr. Analjit Singh
Mrs. Neelu, Singh, Mr. Veer Singh, Mrs. Nira Singh, Ms. Piya Singh, Ms. Tara Singh
Max Bupa Health Insurance Company Limited (upto Dec 2009), New DelhiHouse Services Limited, Medicare Investments Limited, Maxopp InvestmentsLimited, Medicare Investment Limited, Maxopp Investment Limited, LakeviewEnterprises, Delhi Guest House Pvt Limited, Malsi Estates Limited, Max IndiaFoundation, Bhai Mohan Singh Foundation, Max & Company Ventures Pvt.Limited, Dynavest India Private Limited
Max India Limited Employees’ Provident Fund Trust, Max India LimitedSuperannuation Fund, Max India Limited Employees’ Gratuity Fund
Key Management Personnel
Relatives of Key Management Personnel
Enterprises over which key managementpersonnel have significant influence
Employee benefit funds
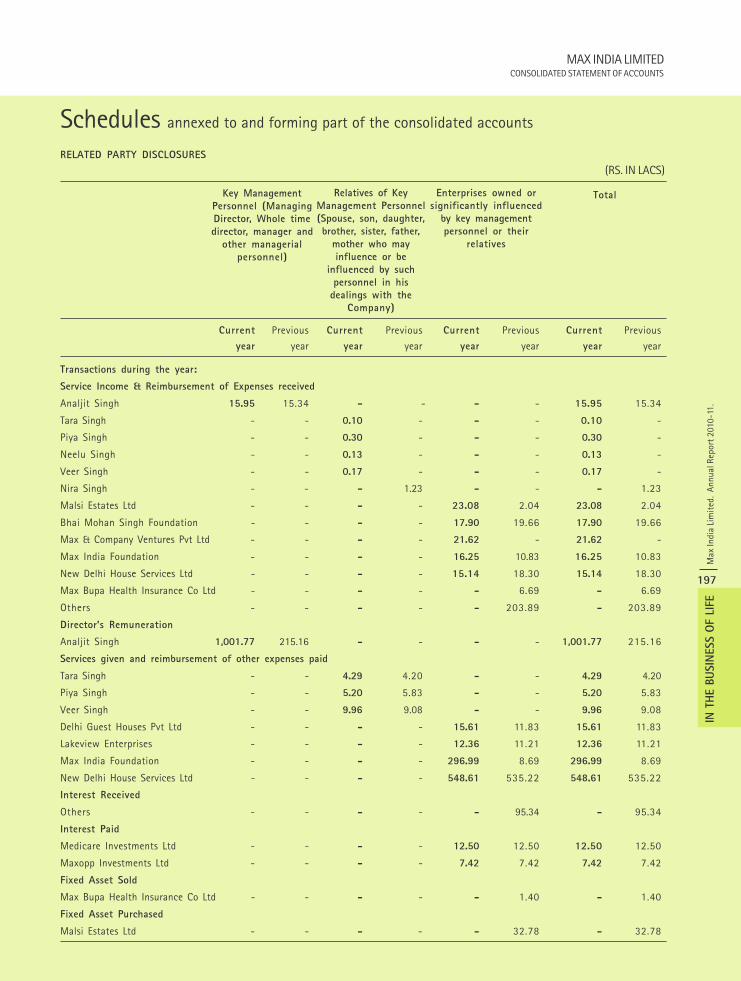
MAX INDIA LIMITEDCONSOLIDATED STATEMENT OF ACCOUNTS
Max
Indi
a Li
mit
ed.
Annu
al R
epor
t 201
0-11
.
197
IN T
HE B
USIN
ESS O
F LI
FE
Schedules annexed to and forming part of the consolidated accounts
RELATED PARTY DISCLOSURES
(RS. IN LACS)
Current Previous Current Previous Current Previous Current Previous
year year year year year year year year
Transactions during the year:
Service Income & Reimbursement of Expenses received
Analjit Singh 15.95 15.34 - - - - 15.95 15.34
Tara Singh - - 0.10 - - - 0.10 -
Piya Singh - - 0.30 - - - 0.30 -
Neelu Singh - - 0.13 - - - 0.13 -
Veer Singh - - 0.17 - - - 0.17 -
Nira Singh - - - 1.23 - - - 1.23
Malsi Estates Ltd - - - - 23.08 2.04 23.08 2.04
Bhai Mohan Singh Foundation - - - - 17.90 19.66 17.90 19.66
Max & Company Ventures Pvt Ltd - - - - 21.62 - 21.62 -
Max India Foundation - - - - 16.25 10.83 16.25 10.83
New Delhi House Services Ltd - - - - 15.14 18.30 15.14 18.30
Max Bupa Health Insurance Co Ltd - - - - - 6.69 - 6.69
Others - - - - - 203.89 - 203.89
Director’s Remuneration
Analjit Singh 1,001.77 215.16 - - - - 1,001.77 215.16
Services given and reimbursement of other expenses paid
Tara Singh - - 4.29 4.20 - - 4.29 4.20
Piya Singh - - 5.20 5.83 - - 5.20 5.83
Veer Singh - - 9.96 9.08 - - 9.96 9.08
Delhi Guest Houses Pvt Ltd - - - - 15.61 11.83 15.61 11.83
Lakeview Enterprises - - - - 12.36 11.21 12.36 11.21
Max India Foundation - - - - 296.99 8.69 296.99 8.69
New Delhi House Services Ltd - - - - 548.61 535.22 548.61 535.22
Interest Received
Others - - - - - 95.34 - 95.34
Interest Paid
Medicare Investments Ltd - - - - 12.50 12.50 12.50 12.50
Maxopp Investments Ltd - - - - 7.42 7.42 7.42 7.42
Fixed Asset Sold
Max Bupa Health Insurance Co Ltd - - - - - 1.40 - 1.40
Fixed Asset Purchased
Malsi Estates Ltd - - - - - 32.78 - 32.78
Key ManagementPersonnel (ManagingDirector, Whole timedirector, manager and
other managerialpersonnel)
Relatives of KeyManagement Personnel(Spouse, son, daughter,brother, sister, father,
mother who mayinfluence or be
influenced by suchpersonnel in his
dealings with theCompany)
Enterprises owned orsignificantly influenced
by key managementpersonnel or their
relatives
Total
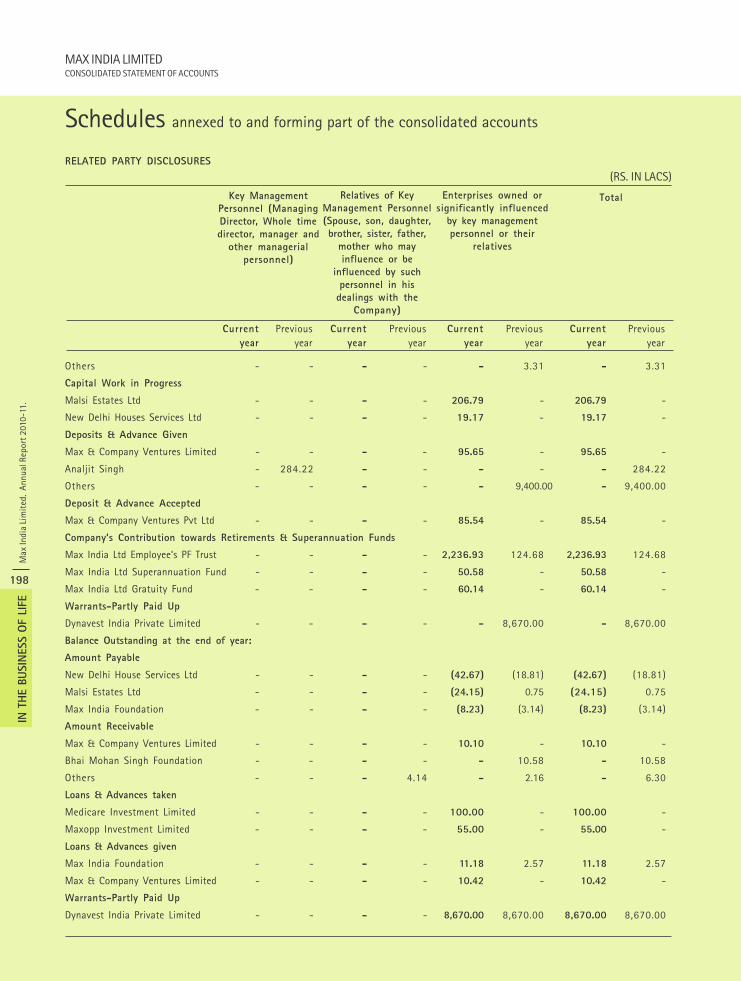
Max
Indi
a Li
mit
ed.
Annu
al R
epor
t 201
0-11
.
198
IN T
HE B
USIN
ESS O
F LI
FE
MAX INDIA LIMITEDCONSOLIDATED STATEMENT OF ACCOUNTS
Schedules annexed to and forming part of the consolidated accounts
RELATED PARTY DISCLOSURES
(RS. IN LACS)
Others - - - - - 3.31 - 3.31
Capital Work in Progress
Malsi Estates Ltd - - - - 206.79 - 206.79 -
New Delhi Houses Services Ltd - - - - 19.17 - 19.17 -
Deposits & Advance Given
Max & Company Ventures Limited - - - - 95.65 - 95.65 -
Analjit Singh - 284.22 - - - - - 284.22
Others - - - - - 9,400.00 - 9,400.00
Deposit & Advance Accepted
Max & Company Ventures Pvt Ltd - - - - 85.54 - 85.54 -
Company’s Contribution towards Retirements & Superannuation Funds
Max India Ltd Employee’s PF Trust - - - - 2,236.93 124.68 2,236.93 124.68
Max India Ltd Superannuation Fund - - - - 50.58 - 50.58 -
Max India Ltd Gratuity Fund - - - - 60.14 - 60.14 -
Warrants-Partly Paid Up
Dynavest India Private Limited - - - - - 8,670.00 - 8,670.00
Balance Outstanding at the end of year:
Amount Payable
New Delhi House Services Ltd - - - - (42.67) (18.81) (42.67) (18.81)
Malsi Estates Ltd - - - - (24.15) 0.75 (24.15) 0.75
Max India Foundation - - - - (8.23) (3.14) (8.23) (3.14)
Amount Receivable
Max & Company Ventures Limited - - - - 10.10 - 10.10 -
Bhai Mohan Singh Foundation - - - - - 10.58 - 10.58
Others - - - 4.14 - 2.16 - 6.30
Loans & Advances taken
Medicare Investment Limited - - - - 100.00 - 100.00 -
Maxopp Investment Limited - - - - 55.00 - 55.00 -
Loans & Advances given
Max India Foundation - - - - 11.18 2.57 11.18 2.57
Max & Company Ventures Limited - - - - 10.42 - 10.42 -
Warrants-Partly Paid Up
Dynavest India Private Limited - - - - 8,670.00 8,670.00 8,670.00 8,670.00
TotalKey ManagementPersonnel (ManagingDirector, Whole timedirector, manager and
other managerialpersonnel)
Relatives of KeyManagement Personnel(Spouse, son, daughter,brother, sister, father,
mother who mayinfluence or be
influenced by suchpersonnel in his
dealings with theCompany)
Enterprises owned orsignificantly influenced
by key managementpersonnel or their
relatives
Current Previous Current Previous Current Previous Current Previousyear year year year year year year year

MAX INDIA LIMITEDCONSOLIDATED STATEMENT OF ACCOUNTS
Max
Indi
a Li
mit
ed.
Annu
al R
epor
t 201
0-11
.
199
IN T
HE B
USIN
ESS O
F LI
FE
Schedules annexed to and forming part of the consolidated accounts
(17) Leases
Accounting for leases has been done in accordance with Accounting Standard-19, issued by the Institute of CharteredAccountants of India. Following are the details of lease transactions for the year:
(a) Operating Lease
(i) Lease rentals recognized in the profit and loss account for the year is Rs. 12,842.80 Lacs (Previous year Rs. 11,272.36 Lacs).(ii) The Company has entered into operating leases for its office and for employees’ residence, vehicles for transportation,
furniture that are renewable on a periodic basis. The total of future minimum lease payments under non-cancellableleases are as follows:
(RS. IN LACS)
Particulars As at March 31, 2011 As at March 31, 2010
Not later than one year 756.00 2442.84Later than one year and not later than five year 374.06 12.00Later than five year 43.18 21.05
Total 1,173.24 2,475.89
(18) Movement in Policyholders’ Liability
(RS. IN LACS)
Particulars As at March 31, 2011 As at March 31, 2010
Opening Balance 917,108.48 498,538.50Add: Change in valuation of liability against life policies in force, Net 292,849.72 404,241.36Add: Policyholder’s bonus provided 17,350.43 14,328.62Closing Balance 1,227,308.63 917,108.48
(19) Max Medical Services Limited
(a) As at December 10, 2001 the Company had entered into an agreement with a healthcare service provider to construct ahospital building. The phase I of the construction was completed and handed over in financial year 2004-05 for aconsideration of Rs. 2,431.00 Lacs. The said consideration is repayable in equal installments over 26.5 years from thehandover date. Further, during the year, the Company has completed phase II of the construction and handed over thepossession for a consideration of Rs. 3,520.01 Lacs. The said consideration is repayable in equal installments over 20.5years from the handover date.Since the receipt of the consideration is spread over 26.5 years and 20.5 years respectively for phase I and phase II, anincome amounting to Rs. 433.49 Lacs (Previous year Rs. 317.35 Lacs), has been recognized based on a fixed percentage ofthe turnover of the healthcare service provider and disclosed under “Other Income” as income from deferred credit.
(b) The company had entered into a lease with a healthcare service provider on December 10, 2001 for supply of medical,other equipments and fixtures for an initial term of 30 years. Under the terms of the lease, the company is responsible for:(i) Acquisition of equipment including its repair and servicing;(ii) Ensuring adequate insurance coverage for the assets; and(iii) Replacement of any existing equipment with suitable equipment in lieu thereof.
As per terms, lease rentals based on a fixed percentage of the turnover of the healthcare service provider are due to thecompany on a monthly basis. Accordingly, as at March 31, 2011 an amount of Rs. 959.08 Lacs (Previous year Rs. 626.50Lacs) has been accrued as lease rentals. The lease rent being contingent on turnover and therefore cannot be quantifiedfor any future periods.
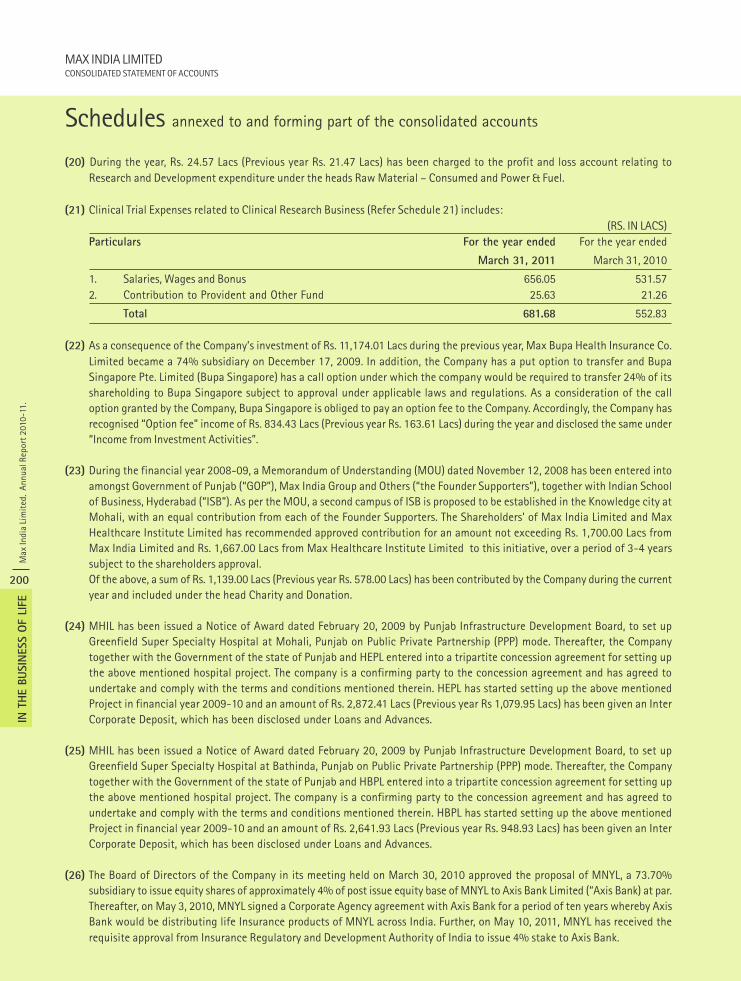
Max
Indi
a Li
mit
ed.
Annu
al R
epor
t 201
0-11
.
200
IN T
HE B
USIN
ESS O
F LI
FE
MAX INDIA LIMITEDCONSOLIDATED STATEMENT OF ACCOUNTS
(20) During the year, Rs. 24.57 Lacs (Previous year Rs. 21.47 Lacs) has been charged to the profit and loss account relating toResearch and Development expenditure under the heads Raw Material – Consumed and Power & Fuel.
(21) Clinical Trial Expenses related to Clinical Research Business (Refer Schedule 21) includes:(RS. IN LACS)
Particulars For the year ended For the year ended
March 31, 2011 March 31, 2010
1. Salaries, Wages and Bonus 656.05 531.572. Contribution to Provident and Other Fund 25.63 21.26
Total 681.68 552.83
(22) As a consequence of the Company’s investment of Rs. 11,174.01 Lacs during the previous year, Max Bupa Health Insurance Co.Limited became a 74% subsidiary on December 17, 2009. In addition, the Company has a put option to transfer and BupaSingapore Pte. Limited (Bupa Singapore) has a call option under which the company would be required to transfer 24% of itsshareholding to Bupa Singapore subject to approval under applicable laws and regulations. As a consideration of the calloption granted by the Company, Bupa Singapore is obliged to pay an option fee to the Company. Accordingly, the Company hasrecognised “Option fee” income of Rs. 834.43 Lacs (Previous year Rs. 163.61 Lacs) during the year and disclosed the same under“Income from Investment Activities”.
(23) During the financial year 2008-09, a Memorandum of Understanding (MOU) dated November 12, 2008 has been entered intoamongst Government of Punjab (“GOP”), Max India Group and Others (“the Founder Supporters”), together with Indian Schoolof Business, Hyderabad (“ISB”). As per the MOU, a second campus of ISB is proposed to be established in the Knowledge city atMohali, with an equal contribution from each of the Founder Supporters. The Shareholders’ of Max India Limited and MaxHealthcare Institute Limited has recommended approved contribution for an amount not exceeding Rs. 1,700.00 Lacs fromMax India Limited and Rs. 1,667.00 Lacs from Max Healthcare Institute Limited to this initiative, over a period of 3-4 yearssubject to the shareholders approval.Of the above, a sum of Rs. 1,139.00 Lacs (Previous year Rs. 578.00 Lacs) has been contributed by the Company during the currentyear and included under the head Charity and Donation.
(24) MHIL has been issued a Notice of Award dated February 20, 2009 by Punjab Infrastructure Development Board, to set upGreenfield Super Specialty Hospital at Mohali, Punjab on Public Private Partnership (PPP) mode. Thereafter, the Companytogether with the Government of the state of Punjab and HEPL entered into a tripartite concession agreement for setting upthe above mentioned hospital project. The company is a confirming party to the concession agreement and has agreed toundertake and comply with the terms and conditions mentioned therein. HEPL has started setting up the above mentionedProject in financial year 2009-10 and an amount of Rs. 2,872.41 Lacs (Previous year Rs 1,079.95 Lacs) has been given an InterCorporate Deposit, which has been disclosed under Loans and Advances.
(25) MHIL has been issued a Notice of Award dated February 20, 2009 by Punjab Infrastructure Development Board, to set upGreenfield Super Specialty Hospital at Bathinda, Punjab on Public Private Partnership (PPP) mode. Thereafter, the Companytogether with the Government of the state of Punjab and HBPL entered into a tripartite concession agreement for setting upthe above mentioned hospital project. The company is a confirming party to the concession agreement and has agreed toundertake and comply with the terms and conditions mentioned therein. HBPL has started setting up the above mentionedProject in financial year 2009-10 and an amount of Rs. 2,641.93 Lacs (Previous year Rs. 948.93 Lacs) has been given an InterCorporate Deposit, which has been disclosed under Loans and Advances.
(26) The Board of Directors of the Company in its meeting held on March 30, 2010 approved the proposal of MNYL, a 73.70%subsidiary to issue equity shares of approximately 4% of post issue equity base of MNYL to Axis Bank Limited (“Axis Bank) at par.Thereafter, on May 3, 2010, MNYL signed a Corporate Agency agreement with Axis Bank for a period of ten years whereby AxisBank would be distributing life Insurance products of MNYL across India. Further, on May 10, 2011, MNYL has received therequisite approval from Insurance Regulatory and Development Authority of India to issue 4% stake to Axis Bank.
Schedules annexed to and forming part of the consolidated accounts
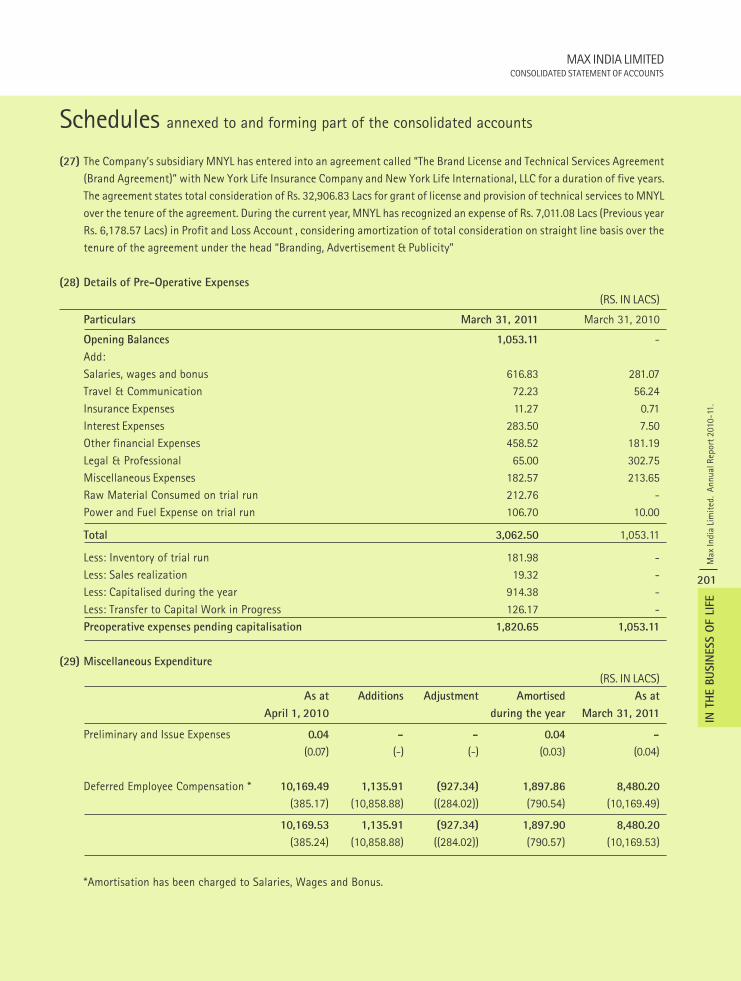
MAX INDIA LIMITEDCONSOLIDATED STATEMENT OF ACCOUNTS
Max
Indi
a Li
mit
ed.
Annu
al R
epor
t 201
0-11
.
201
IN T
HE B
USIN
ESS O
F LI
FE
(27) The Company’s subsidiary MNYL has entered into an agreement called “The Brand License and Technical Services Agreement(Brand Agreement)” with New York Life Insurance Company and New York Life International, LLC for a duration of five years.The agreement states total consideration of Rs. 32,906.83 Lacs for grant of license and provision of technical services to MNYLover the tenure of the agreement. During the current year, MNYL has recognized an expense of Rs. 7,011.08 Lacs (Previous yearRs. 6,178.57 Lacs) in Profit and Loss Account , considering amortization of total consideration on straight line basis over thetenure of the agreement under the head “Branding, Advertisement & Publicity”
(28) Details of Pre-Operative Expenses
(RS. IN LACS)
Particulars March 31, 2011 March 31, 2010
Opening Balances 1,053.11 -Add:Salaries, wages and bonus 616.83 281.07Travel & Communication 72.23 56.24Insurance Expenses 11.27 0.71Interest Expenses 283.50 7.50Other financial Expenses 458.52 181.19Legal & Professional 65.00 302.75Miscellaneous Expenses 182.57 213.65Raw Material Consumed on trial run 212.76 -Power and Fuel Expense on trial run 106.70 10.00
Total 3,062.50 1,053.11
Less: Inventory of trial run 181.98 -Less: Sales realization 19.32 -Less: Capitalised during the year 914.38 -Less: Transfer to Capital Work in Progress 126.17 -Preoperative expenses pending capitalisation 1,820.65 1,053.11
(29) Miscellaneous Expenditure
(RS. IN LACS)As at Additions Adjustment Amortised As at
April 1, 2010 during the year March 31, 2011
Preliminary and Issue Expenses 0.04 - - 0.04 -
(0.07) (-) (-) (0.03) (0.04)
Deferred Employee Compensation * 10,169.49 1,135.91 (927.34) 1,897.86 8,480.20
(385.17) (10,858.88) ((284.02)) (790.54) (10,169.49)
10,169.53 1,135.91 (927.34) 1,897.90 8,480.20
(385.24) (10,858.88) ((284.02)) (790.57) (10,169.53)
*Amortisation has been charged to Salaries, Wages and Bonus.
Schedules annexed to and forming part of the consolidated accounts
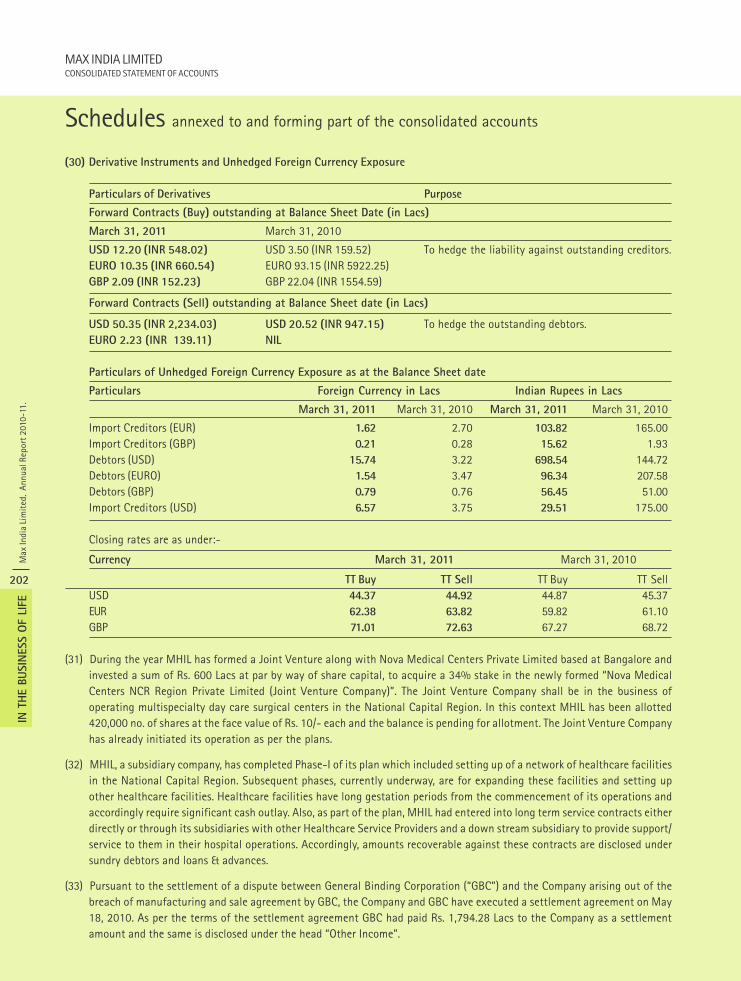
Max
Indi
a Li
mit
ed.
Annu
al R
epor
t 201
0-11
.
202
IN T
HE B
USIN
ESS O
F LI
FE
MAX INDIA LIMITEDCONSOLIDATED STATEMENT OF ACCOUNTS
(30) Derivative Instruments and Unhedged Foreign Currency Exposure
Particulars of Derivatives Purpose
Forward Contracts (Buy) outstanding at Balance Sheet Date (in Lacs)
March 31, 2011 March 31, 2010
USD 12.20 (INR 548.02) USD 3.50 (INR 159.52) To hedge the liability against outstanding creditors.EURO 10.35 (INR 660.54) EURO 93.15 (INR 5922.25)GBP 2.09 (INR 152.23) GBP 22.04 (INR 1554.59)
Forward Contracts (Sell) outstanding at Balance Sheet date (in Lacs)
USD 50.35 (INR 2,234.03) USD 20.52 (INR 947.15) To hedge the outstanding debtors.EURO 2.23 (INR 139.11) NIL
Particulars of Unhedged Foreign Currency Exposure as at the Balance Sheet date
Particulars Foreign Currency in Lacs Indian Rupees in Lacs
March 31, 2011 March 31, 2010 March 31, 2011 March 31, 2010
Import Creditors (EUR) 1.62 2.70 103.82 165.00Import Creditors (GBP) 0.21 0.28 15.62 1.93Debtors (USD) 15.74 3.22 698.54 144.72Debtors (EURO) 1.54 3.47 96.34 207.58Debtors (GBP) 0.79 0.76 56.45 51.00Import Creditors (USD) 6.57 3.75 29.51 175.00
Closing rates are as under:-
Currency March 31, 2011 March 31, 2010
TT Buy TT Sell TT Buy TT SellUSD 44.37 44.92 44.87 45.37EUR 62.38 63.82 59.82 61.10GBP 71.01 72.63 67.27 68.72
(31) During the year MHIL has formed a Joint Venture along with Nova Medical Centers Private Limited based at Bangalore andinvested a sum of Rs. 600 Lacs at par by way of share capital, to acquire a 34% stake in the newly formed “Nova MedicalCenters NCR Region Private Limited (Joint Venture Company)”. The Joint Venture Company shall be in the business ofoperating multispecialty day care surgical centers in the National Capital Region. In this context MHIL has been allotted420,000 no. of shares at the face value of Rs. 10/- each and the balance is pending for allotment. The Joint Venture Companyhas already initiated its operation as per the plans.
(32) MHIL, a subsidiary company, has completed Phase-I of its plan which included setting up of a network of healthcare facilitiesin the National Capital Region. Subsequent phases, currently underway, are for expanding these facilities and setting upother healthcare facilities. Healthcare facilities have long gestation periods from the commencement of its operations andaccordingly require significant cash outlay. Also, as part of the plan, MHIL had entered into long term service contracts eitherdirectly or through its subsidiaries with other Healthcare Service Providers and a down stream subsidiary to provide support/service to them in their hospital operations. Accordingly, amounts recoverable against these contracts are disclosed undersundry debtors and loans & advances.
(33) Pursuant to the settlement of a dispute between General Binding Corporation (“GBC”) and the Company arising out of thebreach of manufacturing and sale agreement by GBC, the Company and GBC have executed a settlement agreement on May18, 2010. As per the terms of the settlement agreement GBC had paid Rs. 1,794.28 Lacs to the Company as a settlementamount and the same is disclosed under the head “Other Income”.
Schedules annexed to and forming part of the consolidated accounts
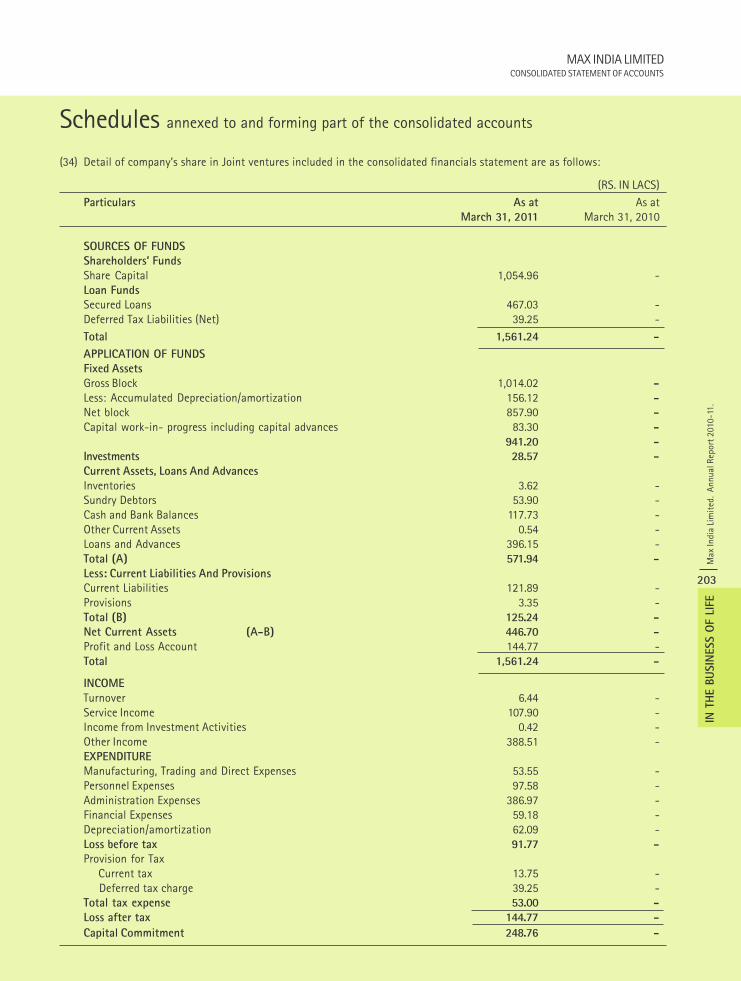
MAX INDIA LIMITEDCONSOLIDATED STATEMENT OF ACCOUNTS
Max
Indi
a Li
mit
ed.
Annu
al R
epor
t 201
0-11
.
203
IN T
HE B
USIN
ESS O
F LI
FE
(34) Detail of company’s share in Joint ventures included in the consolidated financials statement are as follows:
(RS. IN LACS)Particulars As at As at
March 31, 2011 March 31, 2010
SOURCES OF FUNDS
Shareholders’ Funds
Share Capital 1,054.96 -Loan Funds
Secured Loans 467.03 -Deferred Tax Liabilities (Net) 39.25 -Total 1,561.24 -
APPLICATION OF FUNDS
Fixed Assets
Gross Block 1,014.02 -
Less: Accumulated Depreciation/amortization 156.12 -
Net block 857.90 -
Capital work-in- progress including capital advances 83.30 -
941.20 -
Investments 28.57 -
Current Assets, Loans And Advances
Inventories 3.62 -Sundry Debtors 53.90 -Cash and Bank Balances 117.73 -Other Current Assets 0.54 -Loans and Advances 396.15 -Total (A) 571.94 -
Less: Current Liabilities And Provisions
Current Liabilities 121.89 -Provisions 3.35 -Total (B) 125.24 -
Net Current Assets (A-B) 446.70 -
Profit and Loss Account 144.77 -Total 1,561.24 -
INCOME
Turnover 6.44 -Service Income 107.90 -Income from Investment Activities 0.42 -Other Income 388.51 -EXPENDITURE
Manufacturing, Trading and Direct Expenses 53.55 -Personnel Expenses 97.58 -Administration Expenses 386.97 -Financial Expenses 59.18 -Depreciation/amortization 62.09 -Loss before tax 91.77 -
Provision for Tax Current tax 13.75 - Deferred tax charge 39.25 -Total tax expense 53.00 -
Loss after tax 144.77 -
Capital Commitment 248.76 -
Schedules annexed to and forming part of the consolidated accounts
Max
Indi
a Li
mit
ed.
Annu
al R
epor
t 201
0-11
.
204
IN T
HE B
USIN
ESS O
F LI
FE
MAX INDIA LIMITEDCONSOLIDATED STATEMENT OF ACCOUNTS
(35) Previous Year Comparatives
The figures of previous year were audited by a firm of chartered accountants other than S.R. Batliboi & Co.
Previous Year’s figures have been regrouped where necessary to conform to this year’s classification.
As per our report of even date
For S.R. BATLIBOI & Co. For and on behalf of the Board of Directors ofFirm Registration Number: 301003E Max India LimitedChartered Accountants
per MANOJ GUPTA ANALJIT SINGH N. C. SINGHAL DirectorPartner Chairman & Managing Director ASHWANI WINDLASS DirectorMembership Number: 83906 SUJATHA RATNAM Chief Financial Controller
V. KRISHNAN Company Secretary
GURGAON LONDON NEW DELHIMAY 26, 2011 MAY 26, 2011 MAY 26, 2011
Schedules annexed to and forming part of the consolidated accounts
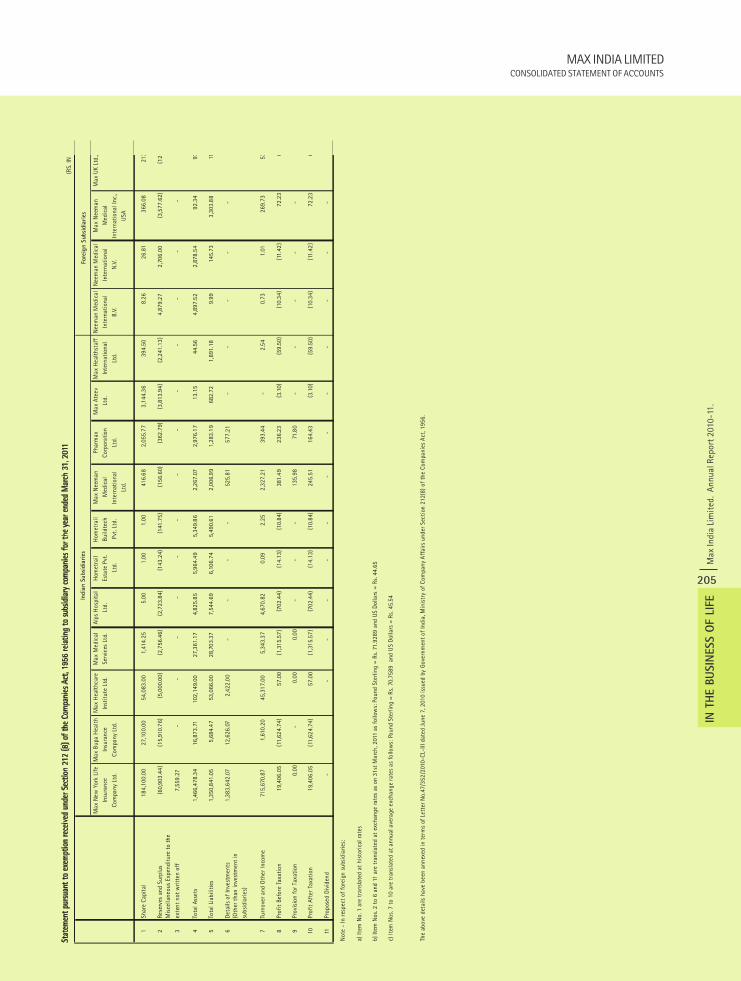
MAX INDIA LIMITEDCONSOLIDATED STATEMENT OF ACCOUNTS
Max
Indi
a Li
mit
ed.
Annu
al R
epor
t 201
0-11
.
205
IN T
HE B
USIN
ESS O
F LI
FE
(RS.
IN
Max
New
Yor
k Li
fe
Insu
ranc
e
Com
pany
Ltd
.
Max
Bup
a H
ealth
In
sura
nce
Com
pany
Ltd
.
Max
Hea
lthc
are
Inst
itut
e Lt
d.
Max
Med
ical
Se
rvic
es L
td.
Alps
Hos
pita
l Lt
d.H
omet
rail
Esta
te P
vt.
Ltd.
Hom
etra
il Bu
ildte
ch
Pvt.
Ltd.
Max
Nee
man
M
edic
al
Inte
rnat
iona
l Lt
d.
Phar
max
Co
rpor
atio
n
Ltd.
Max
Ate
ev
Ltd.
Max
Hea
lthst
aff
Inte
rnat
iona
l
Ltd.
Nee
man
Med
ical
In
tern
atio
nal
B.V.
Nee
man
Med
ical
In
tern
atio
nal
N.V
.
Max
Nee
man
M
edic
al
Inte
rnat
iona
l Inc
., U
SA
Max
UK
Ltd.
,
1Sh
are
Capi
tal
184,
100.
00
27,1
00.0
0
54,0
83.0
0
1,41
4.25
5.
00
1.
00
1.00
416.
68
2,05
5.77
3,
144.
36
39
4.50
8.
26
26
.81
366.
08
213
2Re
serv
es a
nd S
urpl
us(6
0,90
3.44
)(1
5,91
0.76
)(5
,000
.00)
(2,7
56.4
6)(2
,723
.84)
(143
.24)
(141
.75)
(156
.60)
(362
.79)
(3,8
13.9
4)(2
,241
.13)
4,87
9.27
2,70
6.00
(3,5
77.6
2)(1
26
3M
isce
llane
ous
Expe
nditu
re t
o th
e ex
tent
not
writ
ten
off
7,5
59.2
7
-
-
-
-
-
-
-
-
-
-
-
-
-
4To
tal A
sset
s1,
466,
478.
34
16,8
73.7
1
102,
149.
00
27
,361
.17
4,82
5.85
5,96
4.49
5,34
9.86
2,26
7.07
2,97
6.17
13
.15
44.5
6
4,89
7.52
2,87
8.54
92.3
4
97
5To
tal L
iabi
litie
s1,
350,
841.
05
5,68
4.47
53,0
66.0
0
28,7
03.3
7
7,
544.
69
6,
106.
74
5,
490.
61
2,
006.
99
1,
283.
19
682.
72
1,89
1.18
9.99
145.
73
3,30
3.88
11
6De
tails
of I
nves
tmen
ts1,
383,
642.
07
12,6
26.0
7
2,42
2.00
-
-
-
-
52
5.81
57
7.21
-
-
-
-
-
(O
ther
tha
n in
vest
men
t in
subs
idia
ries)
7Tu
rnov
er a
nd O
ther
Inco
me
715,
670.
87
1,61
0.20
45
,317
.00
5,
343.
37
4,67
0.82
0.09
2.
25
2,
327.
21
39
3.44
-
2.54
0.73
1.01
269.
73
5 3
8Pr
ofit
Befo
re T
axat
ion
19,4
06.0
5(1
1,62
4.74
)57
.00
(1,3
15.5
7)(7
02.4
4)(1
4.13
)(1
0.84
)38
1.49
23
6.23
(3.1
0)(5
9.50
)(1
0.34
)(1
1.42
)72
.23
0
9Pr
ovis
ion
for T
axat
ion
0.00
-
0.00
0.00
-
-
-
13
5.98
71
.80
-
-
-
-
-
10Pr
ofit
Afte
r Ta
xati
on19
,406
.05
(11,
624.
74)
57.0
0(1
,315
.57)
(702
.44)
(14.
13)
(10.
84)
245.
51
164.
43
(3
.10)
(59.
50)
(10.
34)
(11.
42)
72.2
30
11Pr
opos
ed D
ivid
end
-
-
-
-
-
-
-
-
-
-
-
-
-
Not
e -
In r
espe
ct o
f fo
reig
n su
bsid
iarie
s:
a) It
em N
o. 1
are
tran
slat
ed a
t hi
stor
ical
rate
s
b) It
em N
os. 2
to
6 an
d 11
are
tran
slat
ed a
t ex
chan
ge ra
tes
as o
n 31
st M
arch
, 201
1 as
follo
ws:
Pou
nd S
terli
ng =
Rs.
71.
9289
and
US
Dolla
rs =
Rs.
44.6
5
c) It
em N
os. 7
to 1
0 ar
e tr
ansl
ated
at a
nnua
l ave
rage
exc
hang
e ra
tes
as fo
llow
s: P
ound
Ste
rling
= R
s. 70
.758
9 a
nd U
S Do
llars
= R
s. 45
.54
The
abov
e de
tails
hav
e be
en a
nnex
ed in
term
s of
Let
ter N
o.47
/352
/201
0-CL
-III
date
d Ju
ne 7
, 201
0 is
sued
by
Gove
rnm
ent o
f In
dia,
Min
istr
y of
Com
pany
Aff
airs
und
er S
ecti
on 2
12(8
) of t
he C
ompa
nies
Act
, 195
6.
Indi
an S
ubsi
diar
ies
Fore
ign
Subs
idia
ries
Related Documents